Article

Slope Construction on Croplands in Reclaimed Tidal Flats of Korea Improved Surface Drainage but Not Soybean Growth Due to Weather Variability

1
Department of Rural Construction Engineering, Jeonbuk National University, Jeonju 54896, Republic of Korea
2
Reclaimed Land Agricultural Research Center, National Institute of Crop and Food Science, RDA, Wanju-gun 55365, Republic of Korea
3
Department of Rural and Bio-Systems Engineering (Brain Korea 21), Chonnam National University, Gwangju 61186, Republic of Korea
4
AgriBio Institute of Climate Change Management, Chonnam National University, Gwangju 61186, Republic of Korea
*
Authors to whom correspondence should be addressed.
Agronomy 2025, 15(9), 2177; https://doi.org/10.3390/agronomy15092177
Submission received: 2 August 2025 / Revised: 9 September 2025 / Accepted: 10 September 2025 / Published: 12 September 2025
(This article belongs to the Special Issue The Future of Climate-Neutral and Resilient Agriculture Systems)

Abstract

In South Korea, reclaimed coastal tidelands (RTLs) are generally used for rice cultivation rather than upland cultivation; however, there is growing social pressure to change the use of RTLs to upland crop production to increase the self-sufficiency rate regarding grain. However, RTLs are not suitable for cultivating upland crops due to their high salinity, poor drainage, and shallow groundwater levels. Therefore, it is necessary to develop a cost-effective drainage method, such as surface drainage. This study investigated the effects of slope construction on surface drainage and on the growth and yield of soybean (Glycine max (L.) Merr.) in poorly drained fields at the Saemangeum RTL, which is the largest RTL district in South Korea. Slopes were constructed at angles of 0°, 3°, and 5°; soybean was sown in June 2023 (wet season) and May 2024 (dry season); and growth of soybean was monitored at the flowering, pod-filling, and harvest stages. Soil pH, electrical conductivity (EC), and mineral nitrogen (NH4+ and NO3) were measured monthly, while daily changes in soil water content were measured using soil sensors. As expected, slope construction enhanced surface runoff from the upper to lower slope areas under heavy rainfall, but soil erosion was also increased. Soybean growth and yield were higher in the upper sites for the wet-season conditions mainly due to lowered moisture stress. For the dry-season, there was no significant differences in soybean growth and yield across the slopes due to drought and high temperatures during flowering and pod-filling stages. Soybean growth and yield parameters were negatively correlated with both soil water content and pH. Slope construction improves surface drainage but does not consistently translate into higher soybean yields, highlighting its limited agronomic and economic value when used alone. Instead, integrated management practices combining drainage improvement, supplemental irrigation, and soil erosion reduction need to be implemented to support sustainable upland cropping in coastal RTLs.

1. Introduction

South Korea has been experiencing a continuous decline in agricultural land, with a reduction of approximately 581,000 hectares recorded between 1990 and 2022. This issue is compounded by the country’s relatively low food self-sufficiency rate, with cereal self-sufficiency remaining at approximately 26% [1,2]. In this context, reclaimed coastal tidelands (RTLs), which make up a significant share of agricultural territory, approximately 135,000 hectares or 9% of national cultivated land, are becoming increasingly important in ensuring national food security [2,3,4]. Traditionally, these RTLs have primarily been used for rice cultivation, as desalinization can be effectively achieved by repeated irrigation and forced drainage to remove excessive salts during rice cultivation under waterlogged conditions [4,5]. However, with the oversupply of rice due to declining rice consumption, there are increasing social demands to convert these paddy fields in RTLs to upland fields to produce food crops for which self-sufficiency rates are low, such as soybean (Glycine max (L.) Merr.), to improve national food security [6]. In particular, the Seamangeum RTL district, which is the largest RTL district in South Korea, has an area of approximately 8570 ha earmarked for upland cropping by the Korean government [2,4,5].
Unlike other coastal RTLs, the Seamangeum RTL has a relatively low salinity due to its coarse-textured soils, which enhance salt leaching, although there are still concerns about salt accumulation under high-evaporation conditions in the dry season [2,5]. However, cultivating upland crops in the Seamangeum RTL still presents substantial challenges, particularly due to poor drainage associated with the shallow groundwater table [7]. The RTLs are typically located in low-lying coastal zones, characterized by shallow groundwater tables and poor vertical drainage, making them vulnerable to salinity buildup and waterlogging [2,4,5,8]. About 96% of RTLs in South Korea have “poor” or “slightly poor” drainage [9]. Even after initial desalinization, shallow groundwater and high evaporation during dry periods can lead to rapid reaccumulation of salts in the topsoil via capillary rise [10,11]. To successfully cultivate upland crops in these conditions, the development of effective drainage systems is essential to alleviate waterlogging and resalinization. For instance, subsurface drainage is known to lower the water table and facilitate salt leaching, thereby curbing resalinization [4,12,13]. However, due to the high costs of installing subsurface drainage systems, cost-effective measures, such as field-level alternatives, including surface slope construction, need to be tested.
Open-ditch drainage is considered an economical method that farmers can easily adopt. In the Seamangeum RTL, however, field drainage networks are already well established in a system of compartments, and thus, efforts to improve drainage through open ditches are unlikely to have substantial effects. Alternatively, slope construction at the field level can rapidly remove surface water and can be implemented by farmers without large-scale civil engineering works. However, although some farmers have adopted slope construction, there has been no scientific verification of its effectiveness in improving drainage, altering soil physicochemical properties, or enhancing crop growth. Thus, the critical knowledge gap lies in whether slope construction can serve as a cost-effective alternative to subsurface drainage by demonstrably improving surface drainage and reducing resalinization in RTLs. This study specifically addresses this question by evaluating the effects of slope construction on soil properties, desalinization, and soybean performance in the Saemangeum RTL. We hypothesized that sloped fields will result in better surface drainage compared to flat fields, resulting in enhanced desalinization and thus improved soybean growth and yield.

2. Materials and Methods

2.1. Study Site and Experimental Design

The field trials were conducted at an experimental station of the Saemangeum RTL (35°50′ N, 126°42′ E) for two growing seasons (2023 and 2024). The soil texture of the field is sandy loam (sand: 65.8%; silt: 28.4%; clay: 5.8%) with a high proportion of very fine sand (0.005–0.1 mm, 60.7% of total weight), and it is characterized by poor natural drainage and shallow groundwater levels regardless of the degree and position of the slope. The site has had a mean annual temperature of 13.2 °C and mean annual precipitation of 1273.2 mm for the last three decades (1995–2024) [14]. During the study period, the mean, maximum, and minimum temperatures were 23.0, 27.7, and 19.5 °C, respectively, for the first growing season (20 June–3 November 2023), and were 23.4, 28.3, and 19.6 °C, respectively, for the second one (24 May–8 November 2024). The cumulative precipitation differed dramatically between growing seasons, at 1344 mm and 651 mm for the first and second seasons, respectively (Figure 1).
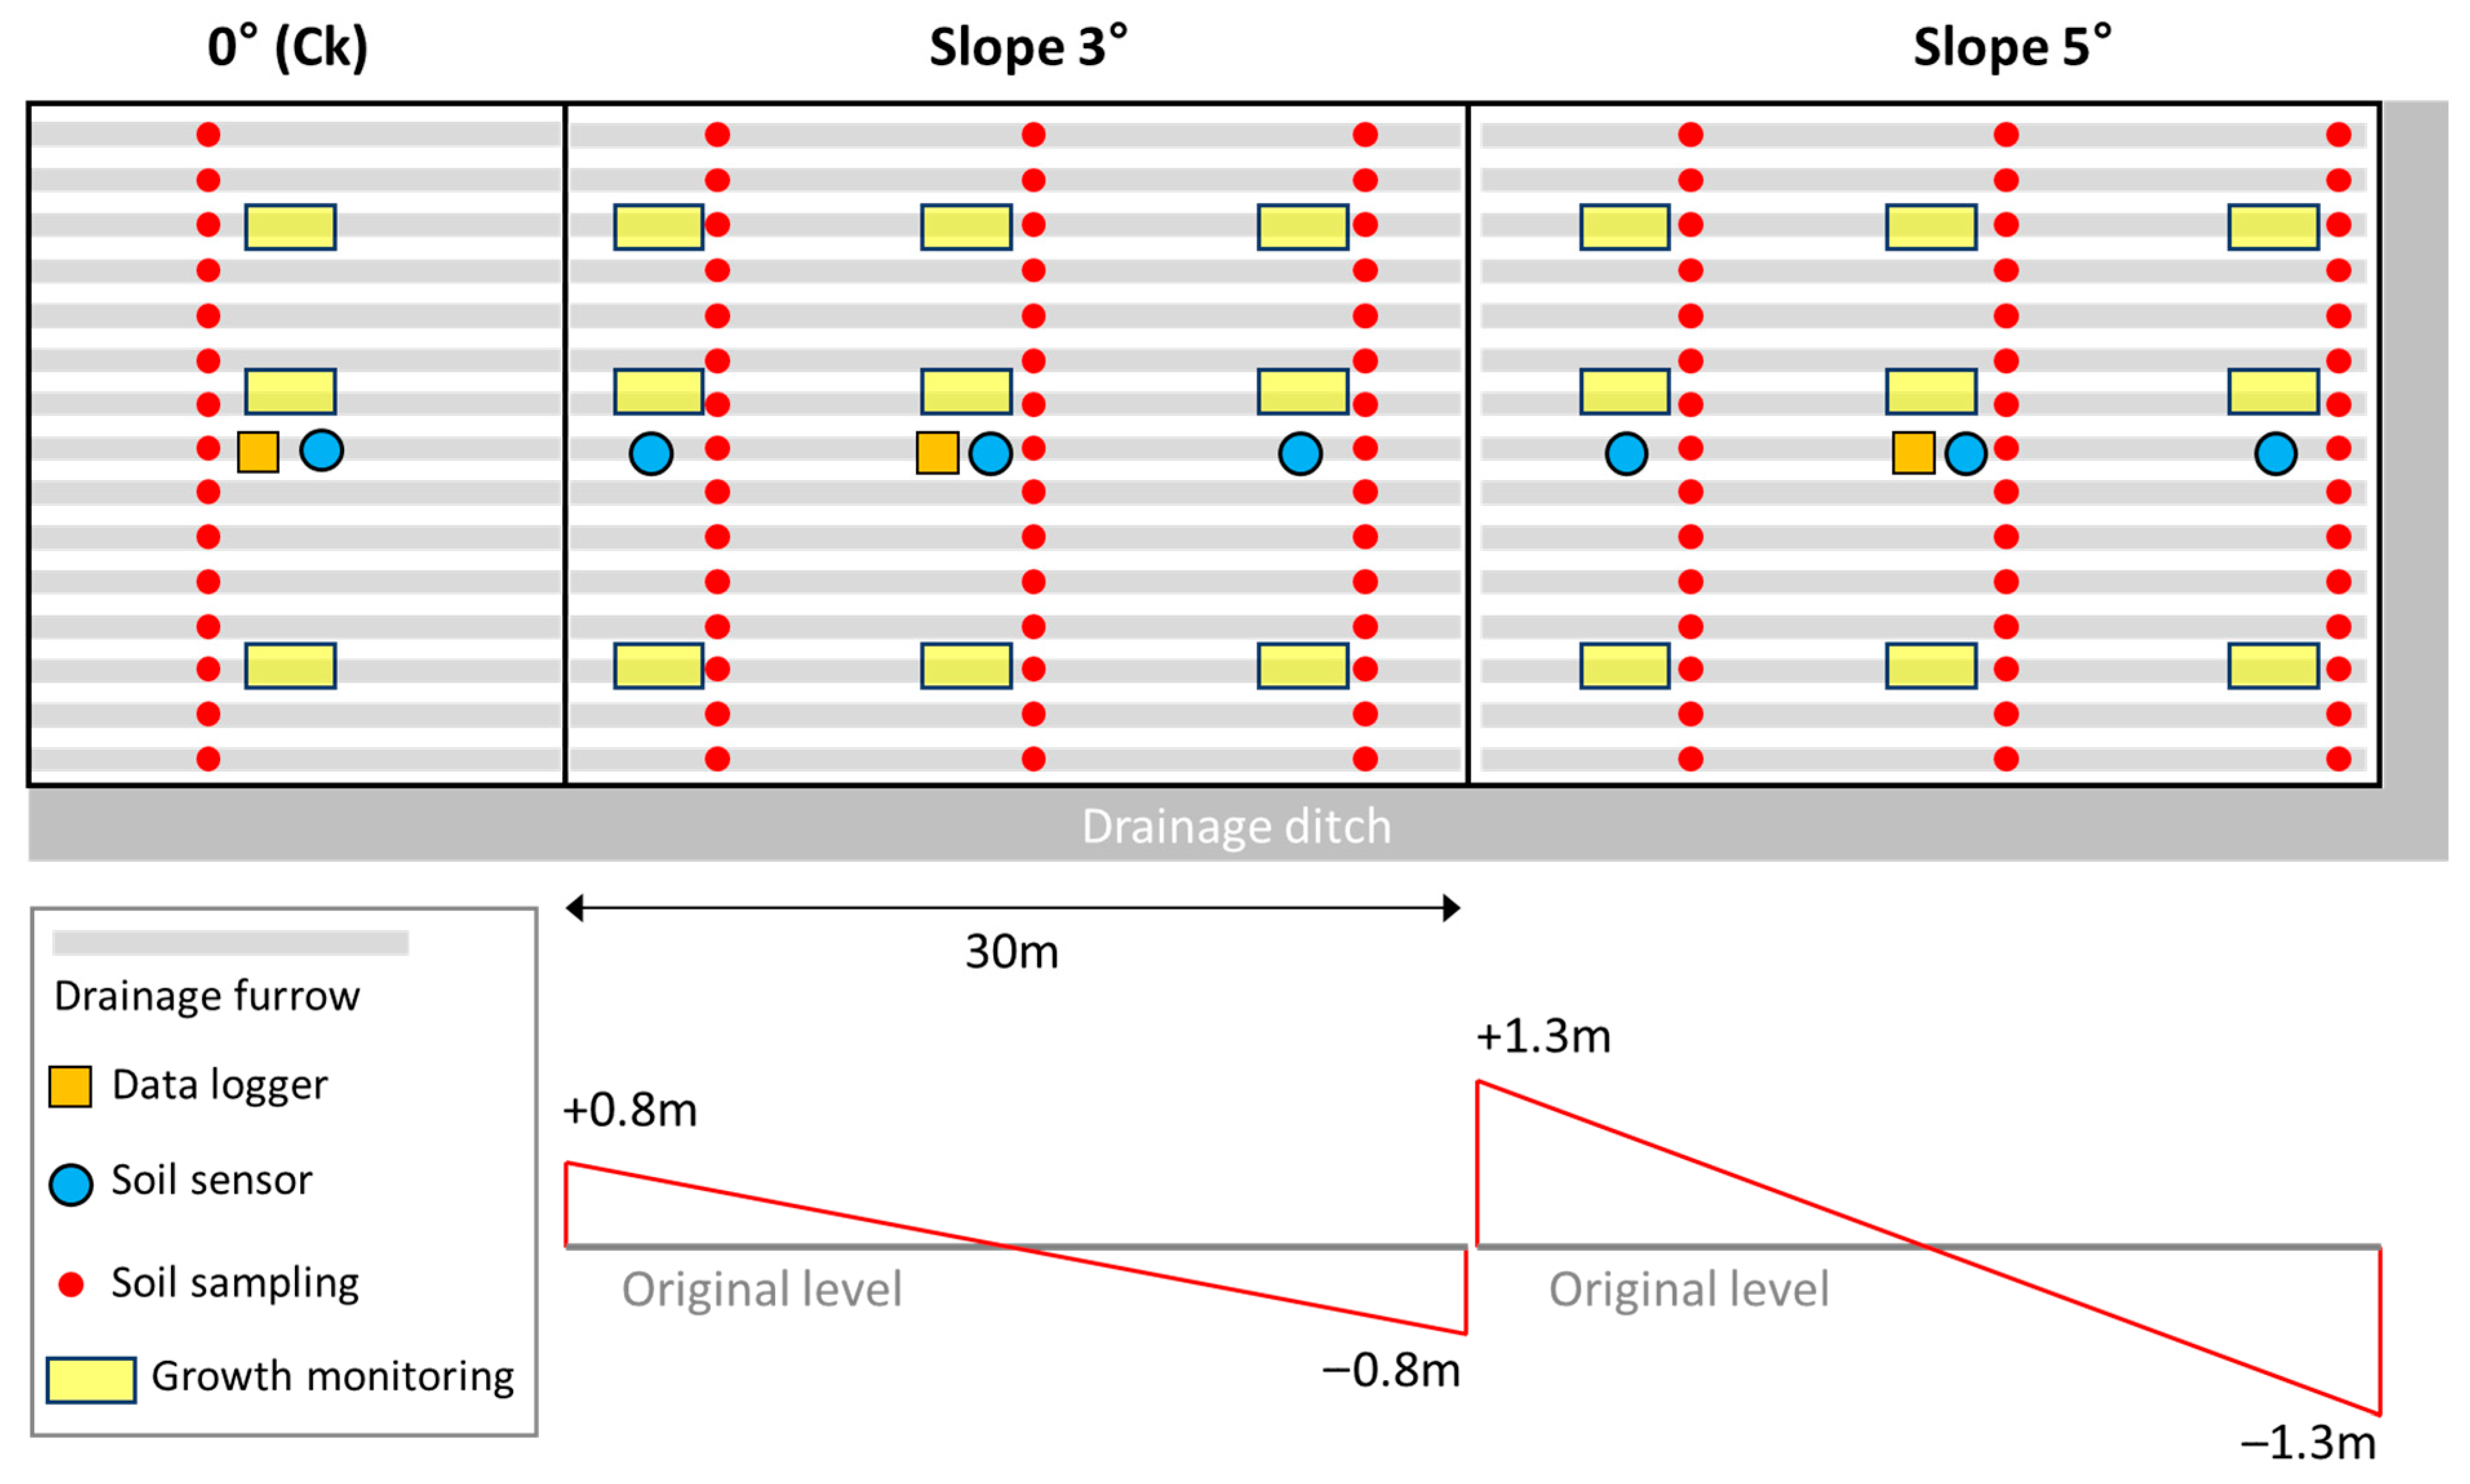
To assess the effects of surface slope on drainage and soybean performance, three slope treatments (0°, 3°, and 5°) were established in June 2023. Each treatment plot measured 30 m in length and 20 m in width (Figure 2). To create the slopes, soil at the lower end was excavated and transported to the upper end using a bulldozer and excavator, with excavation depths of approximately 0.8 m for the 3° treatment and 1.3 m for the 5° treatment. The depth of excavation was set based on the local drainage channel depth, and the fields were compacted using a bulldozer to complete the construction of the slopes.
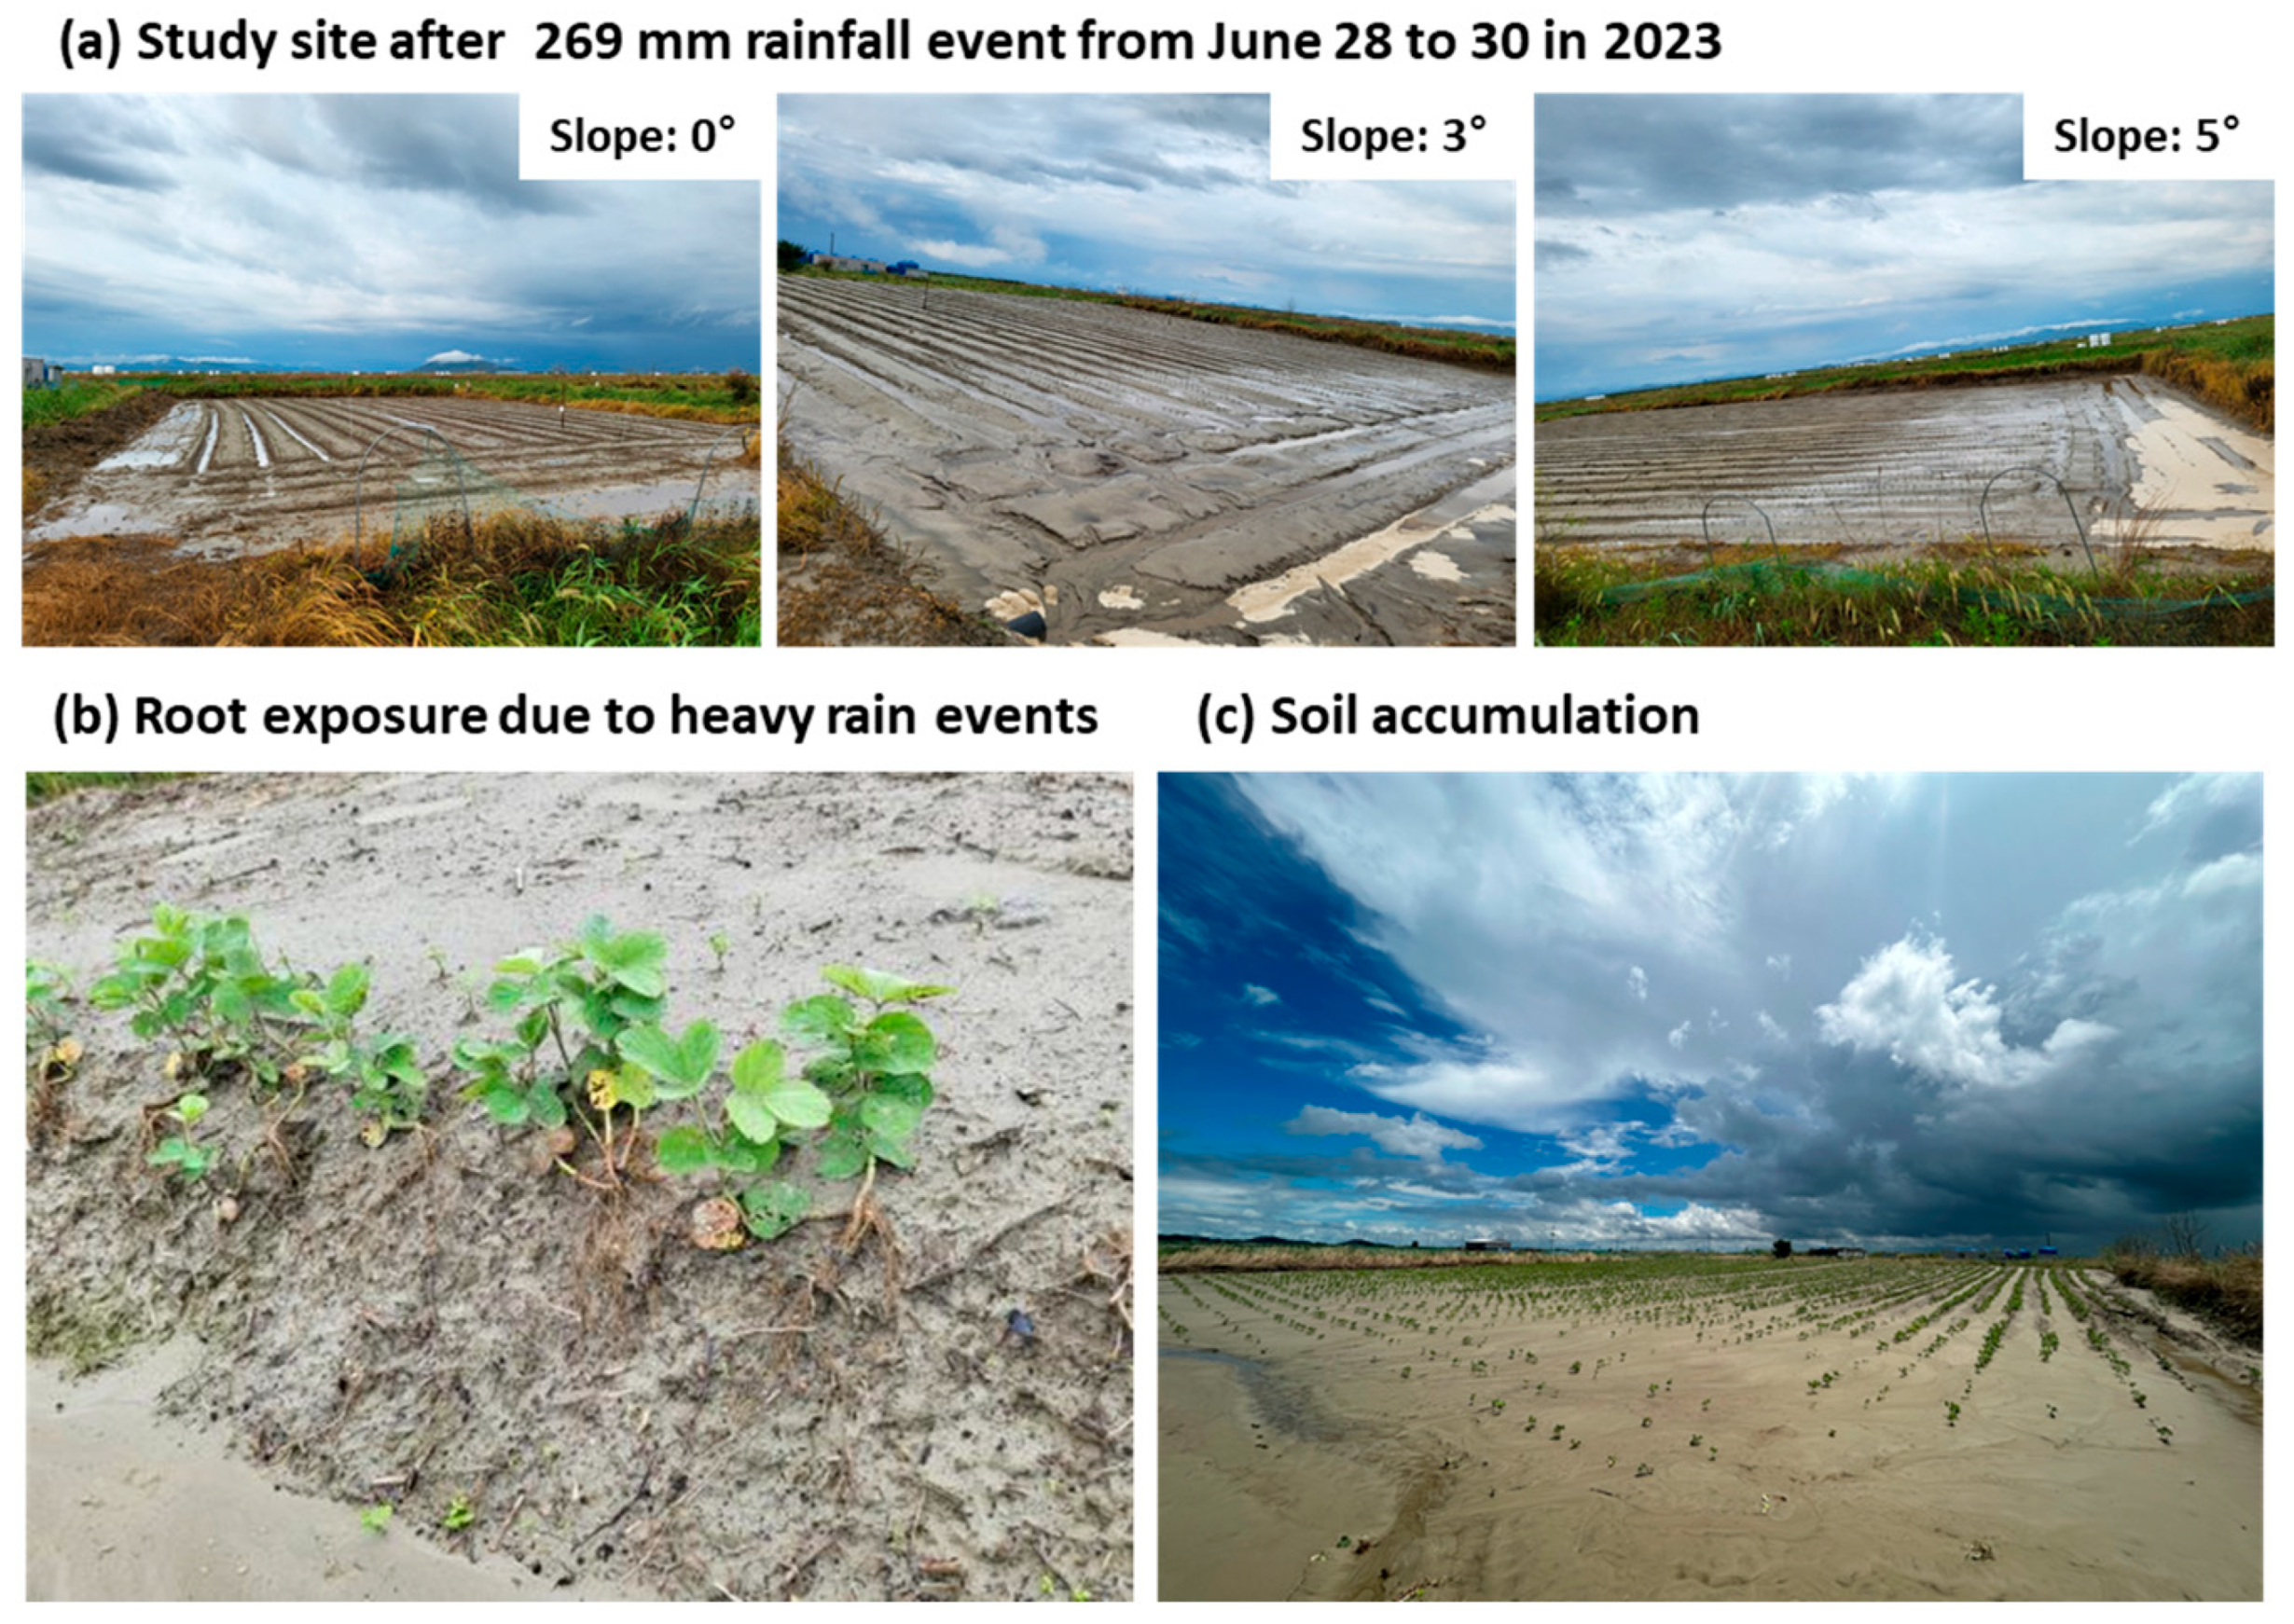
Soybeans of the cultivar ‘Baektae Daechan’ were sown using a tractor-mounted paddy seeder on 20 June 2023, and 24 May 2024. In the first growing season (2023), soybeans were sown following the conventional practices of the local farmers, but the fields were damaged and seedling growth hindered by heavy rainfall that occurred immediately after sowing (Figure 3a). Therefore, in the second season (2024), soybeans were sown in May to avoid such damage by heavy rainfall and obtain the required data. We employed a standard row spacing of 70 cm with 15 cm between plants, and fifteen drainage furrows were constructed parallel to the slope in each plot. Prior to sowing, a basal fertilizer dose of 60–30–30 kg N–P–K ha−1 was applied uniformly across all treatments, and no additional fertilization was conducted. Except for the slope treatments, all plots were managed uniformly according to local farmer practices, including weed control, pest management, and fertilizer application. No supplemental irrigation was provided during the trials, so the soybean crop depended solely on rainfall, which allowed us to evaluate the interaction between slope construction and natural climatic variability.

2.2. Soil and Plant Monitoring

Soil sensors (TEROS-12, Meter Group, Pullman, WA, USA) were installed to monitor changes in soil temperature, volumetric water content, and electrical conductivity (EC). Sensors were installed at the top, middle, and bottom of the slope in the longitudinal direction toward the end of each treatment plot; they were placed at a 20 cm depth in 2023 and at 20 and 40 cm depths in 2024 (Figure 2). Each sensor recorded hourly data throughout the growing season. Precipitation, temperature, and the groundwater table were monitored using ECRN-100, VP4, and HYDROS21 sensors, respectively (Meter Group, Pullman, WA, USA). Precipitation and temperature sensors were installed 2 m above ground on a steel pole. To install the groundwater table sensor, a hole was drilled to a 3 m depth using an auger, and a perforated pipe was installed in the hole, followed by the installation of a sensor.
Growth of soybean was monitored at three critical growth stages: flowering, pod-filling, and harvest. Monitoring was conducted on the same days (17 August, 15 September, and 3 November in 2023, and 2 August, 28 August, and 8 November in 2024) regardless of slope degrees and positions. The monitoring parameters were plant height, number of branches, and number of leaves during the flowering and pod-filling stages, and the number of pods per plant, 100-seed weight, and total grain yield (kg ha−1) at harvest. The aboveground part of the plants was cut using scissors, washed with running water, and dried in an oven at 60 °C until a constant weight was reached, and then the dry weight was measured.

2.3. Soil Sampling and Chemical Analyses

Soil samples were collected immediately after sowing on the same dates as the soybean growth monitoring. Soil samples were collected at the top, middle, and bottom of the slope, as well as from all five drainage furrows, and those collected from the furrows were composited into a single sample, resulting in three composite samples for each treatment. Soil was collected from a depth of 0–20 cm using an auger. The samples were air-dried and sieved through a 2 mm sieve and used for chemical analyses to assess soil pH, EC, and inorganic nitrogen (ammonium (NH4+) and nitrate (NO3)). For total carbon (TC) and total nitrogen (TN) analyses, the soil samples were finely ground using a ceramic mortar and pestle. Soil organic matter (SOM) content was obtained using the calculation TC × 1.724.
Soil pH and EC were measured using a pH meter and an EC meter (Orion, Beverly, MA, USA) in a 1:5 (w:v) ratio of soil to deionized water. Ammonium and nitrate concentrations were determined using the steam distillation method [15]. For this, soil samples were extracted with 2 M KCl at a 1:5 (w:v) soil-to-solution ratio. The extracts were then distilled sequentially with MgO for NH4+ analysis and with Devarda’s alloy for NO3 analysis. The TC and TN concentrations were measured using an elemental analyzer (Flash EA 1112, Thermo Fisher Scientific Inc., Breda, The Netherlands).

2.4. Statistical Analyses

Two-way ANOVA was conducted to test the effects of the degree of slope (0, 3, and 5°) and the position (top, middle, and bottom) along the slope on soil chemistry, soybean growth parameters, and yield parameters using the SPSS Statistics 23.0 software package (SPSS INC., Chicago, IL, USA), with a significance level of 0.05. All measured soil and plant datasets were tested for homogeneity of variance using a Kolmogorov–Smirnov test, and distribution normality was assessed using Levene’s test. No heterogeneity was detected, and the distribution was normal. If the ANOVA results were significant, the mean values of the variables were separated by Tukey’s test. Redundancy analysis (RDA) [16] was used to identify correlations between variables and to assess variation in soybean growth and yield (Table A2 and Table A3) among different slope degrees and positions according to soil chemistry (Figure 4). RDA is a multivariate analysis based on multiple linear regression that creates ordinations of response variables (i.e., soybean growth and yield) constrained by explanatory variables (i.e., soil chemistry) [16]. RDA was performed using the ‘vegan’ package [17] in R version 4.5.1 (R Development Core Team, 2016).

3. Results

3.1. Initial Soil Properties Changed by Slope Construction

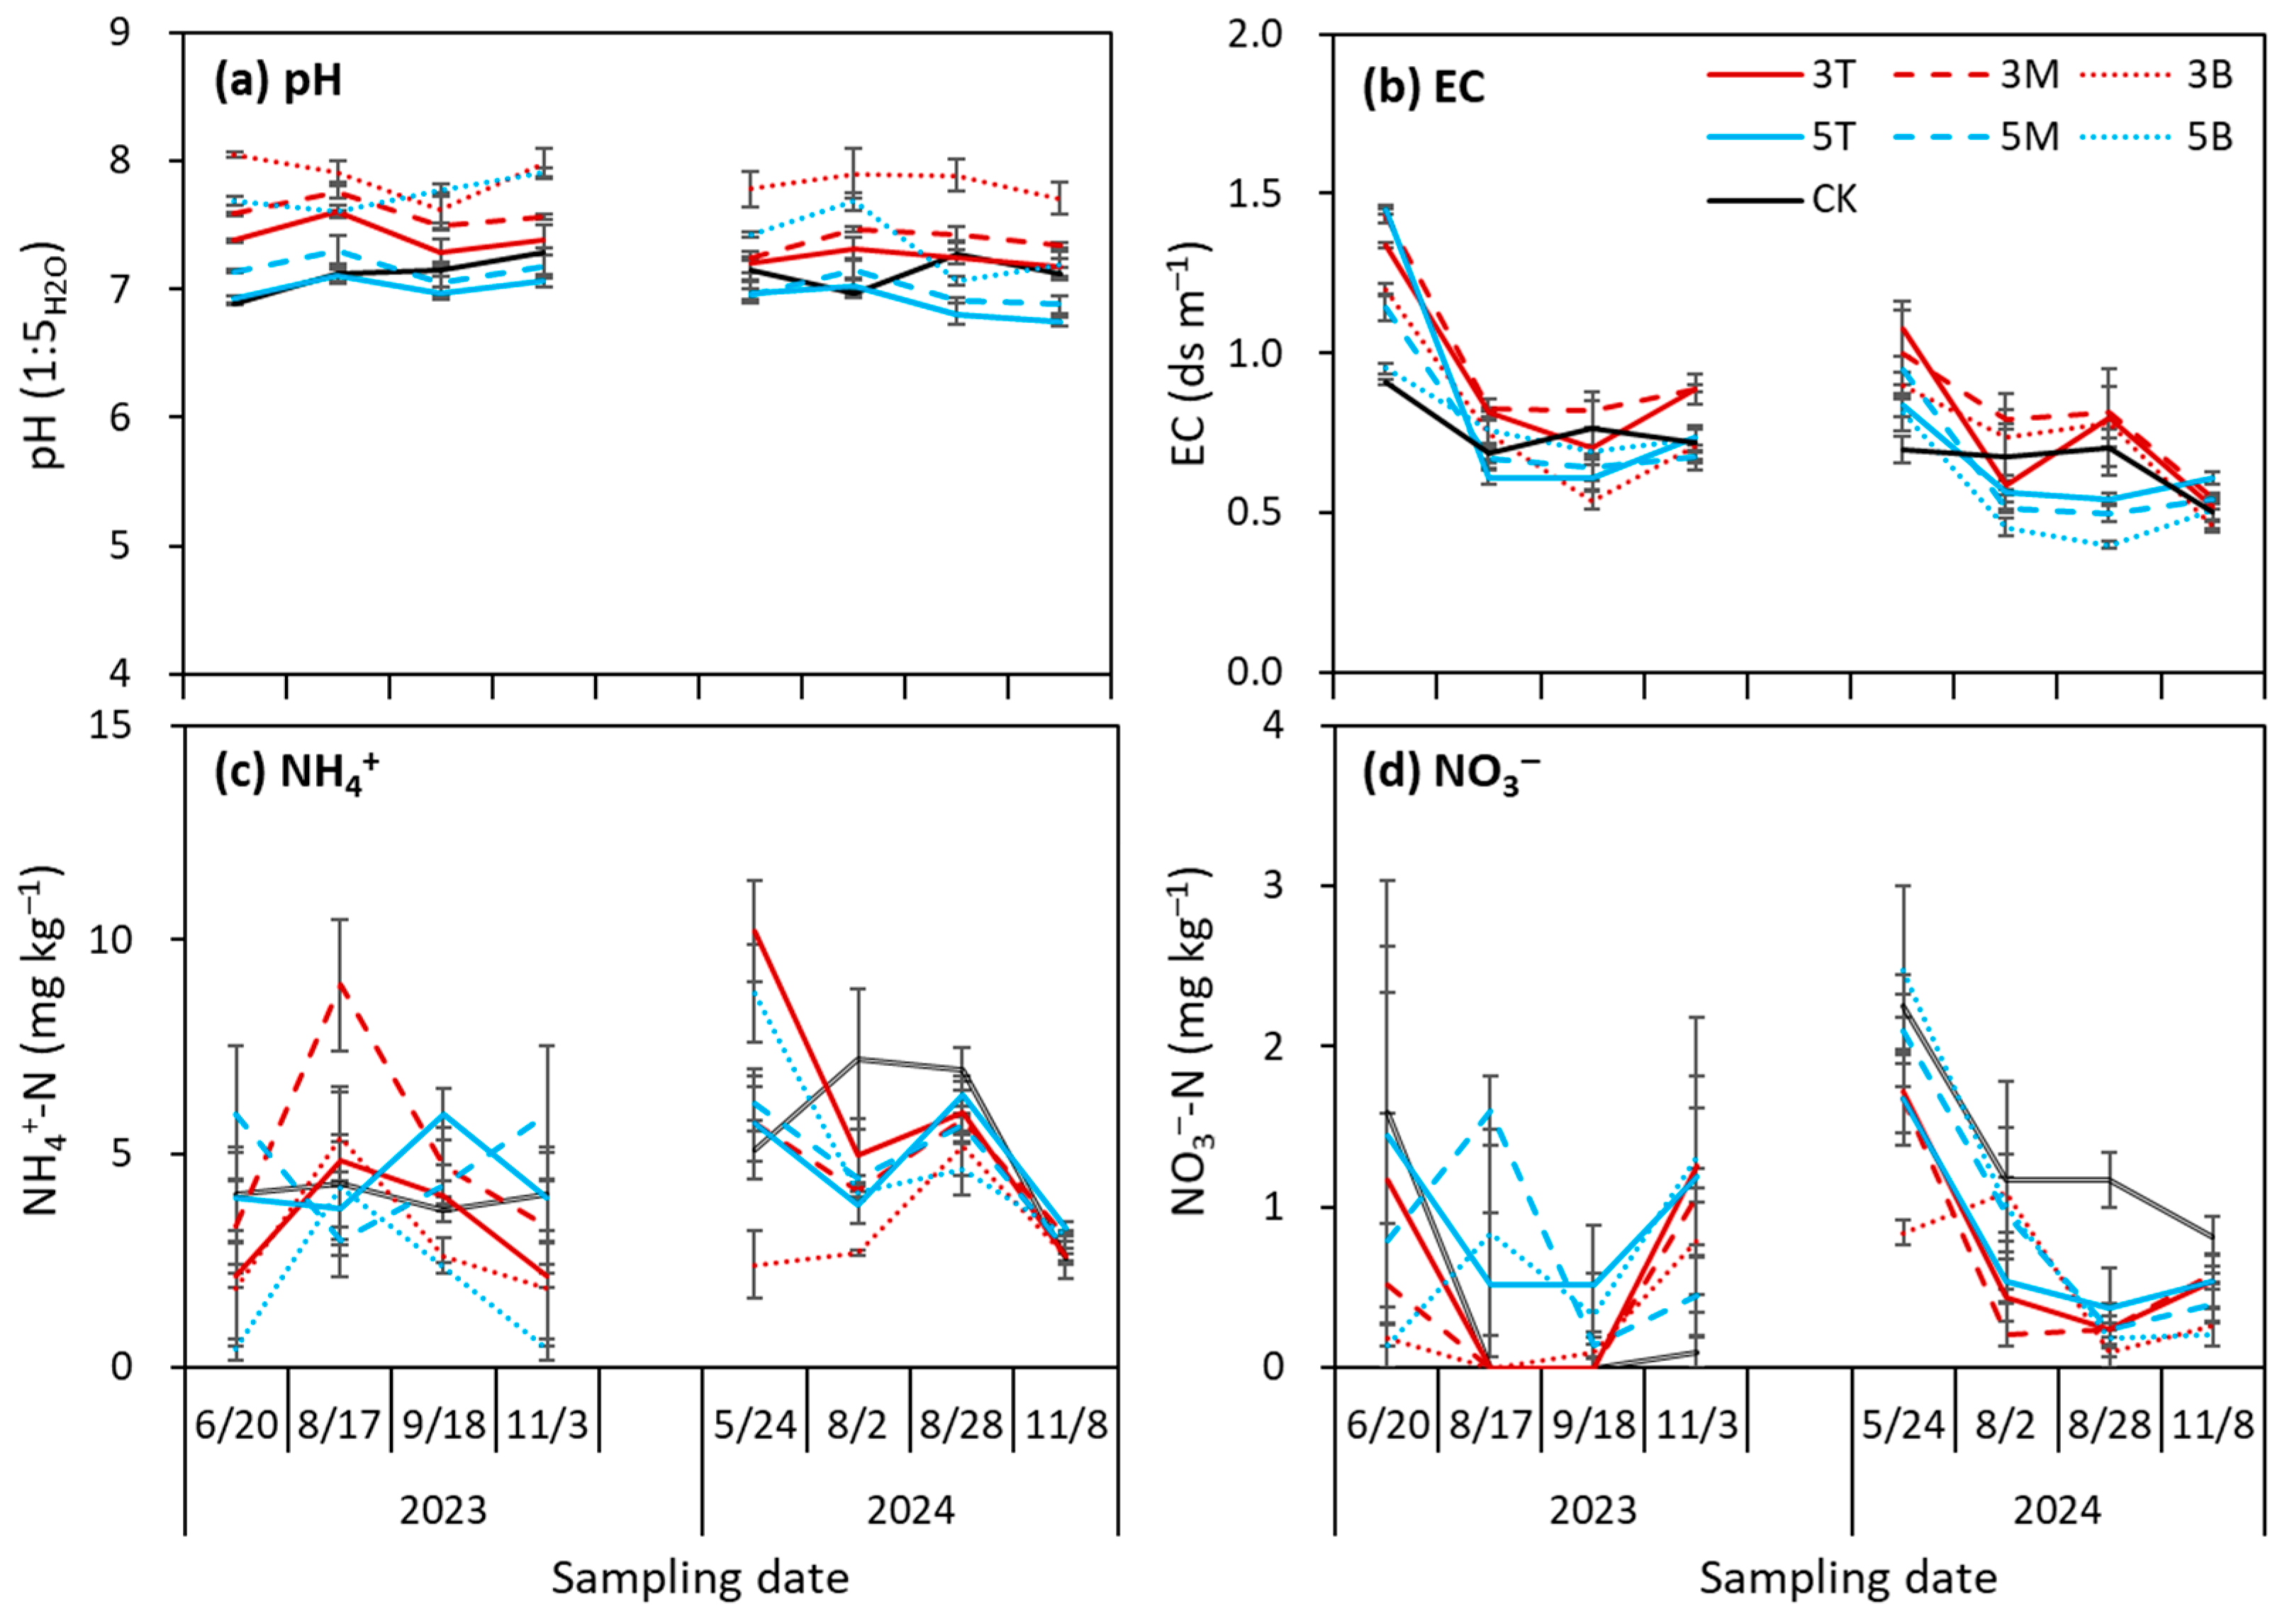
All soil properties were affected slope construction and were different depending on the position (i.e., top, middle, or bottom), except for mineral N (Table 1). In the sloped fields, soil pH was higher (p < 0.001) at the top position than middle and bottom positions at both 3° and 5°, ranging from 7.38 at the top to 8.05 at the bottom for 3°, and from 6.92 at the top to 7.69 at the bottom for 5°. Soil EC was highest at the top position and tended to decrease (p < 0.001) along the slope, from 1.34 dS m−1 at the top to 1.20 dS m−1 at the bottom for 3°, and from 1.45 dS m−1 at the top to 0.95 dS m−1 at the bottom for 5°.
Organic matter content tended to be higher on the sloped field compared to the CK, increasing from 11.8 g kg−1 for the CK to 3.0–9.0 g kg−1 for 3° and to 3.8–9.2 g kg−1 for 5°, depending on the position along the slope. Meanwhile, in the sloped fields, organic matter content consistently decreased (p < 0.001) toward the downslope for both the 3° and 5° slopes. The concentrations of total N also showed a similar pattern to those of organic matter, but mineral N concentrations did not show any pattern.

3.2. Changes in Soil Properties During Soybean Growing Experiments

Soil pH fluctuated between 6.89 and 8.05 in 2023 and slightly decreased to 6.75–7.90 at the end of the soybean growing experiment in 2024 (Figure 4). Throughout the soybean growing periods, soil pH was highest at 3°, followed by 5° and 0°, and highest at the top of the slope, followed by the middle and bottom (Figure 4; Table A1). EC gradually decreased from 0.91 to 1.45 ds m−1 at the beginning of the growing season to 0.71–0.89 ds m−1 at the end of the growing season in 2023, and from 0.70 to 1.08 ds m−1 to 0.46–0.55 ds m−1, respectively, in 2024, without consistent statistical differences (Table A1). Concentrations of NH4+ and NO3 fluctuated throughout 2023 and gradually decreased over time in 2024.
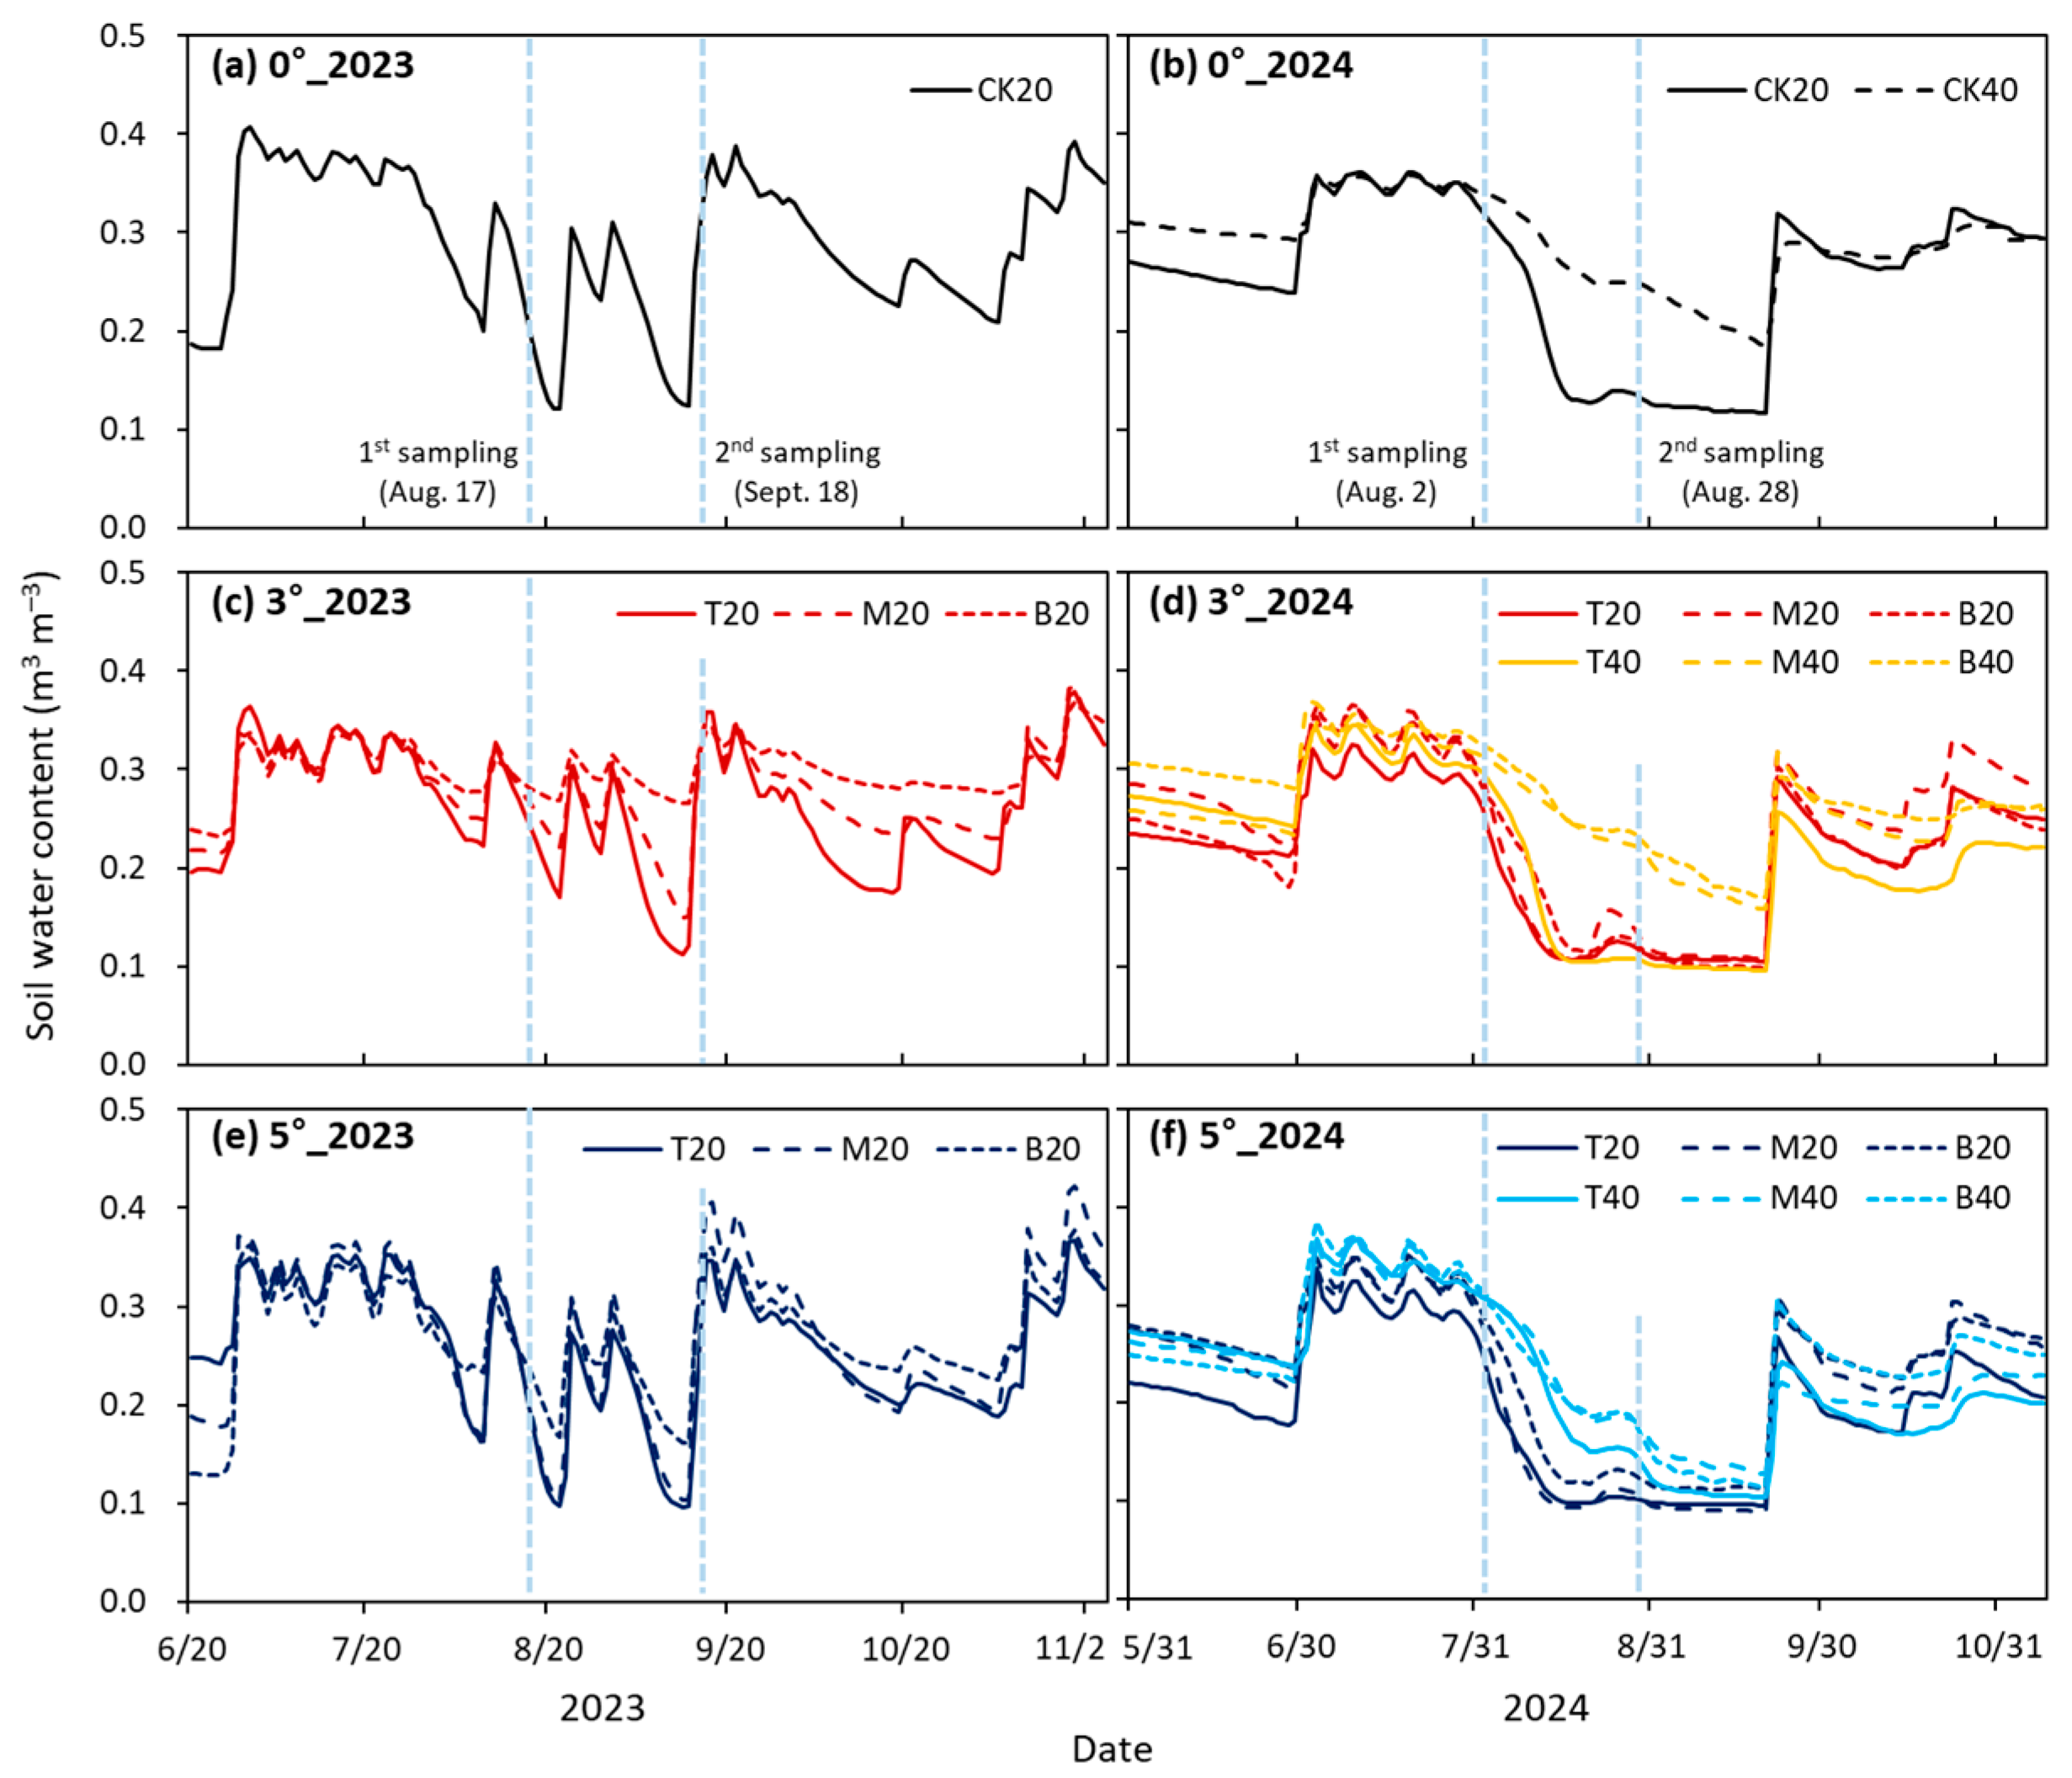
Soil water content fluctuated according to rainfall events (Figure 5). Immediately after rainfall, soil water content rapidly increased to about 0.35 m3 m−3 regardless of the treatment. After the rainfall event ended, the soil water content gradually decreased, with a higher water content maintained in slope positions in the following order: bottom > middle > top at depths of 40 cm > 20 cm. The average soil water content was higher at top of the slope than the bottom and was higher at a depth of 40 cm than 20 cm (Figure 6).

3.3. Soybean Growth

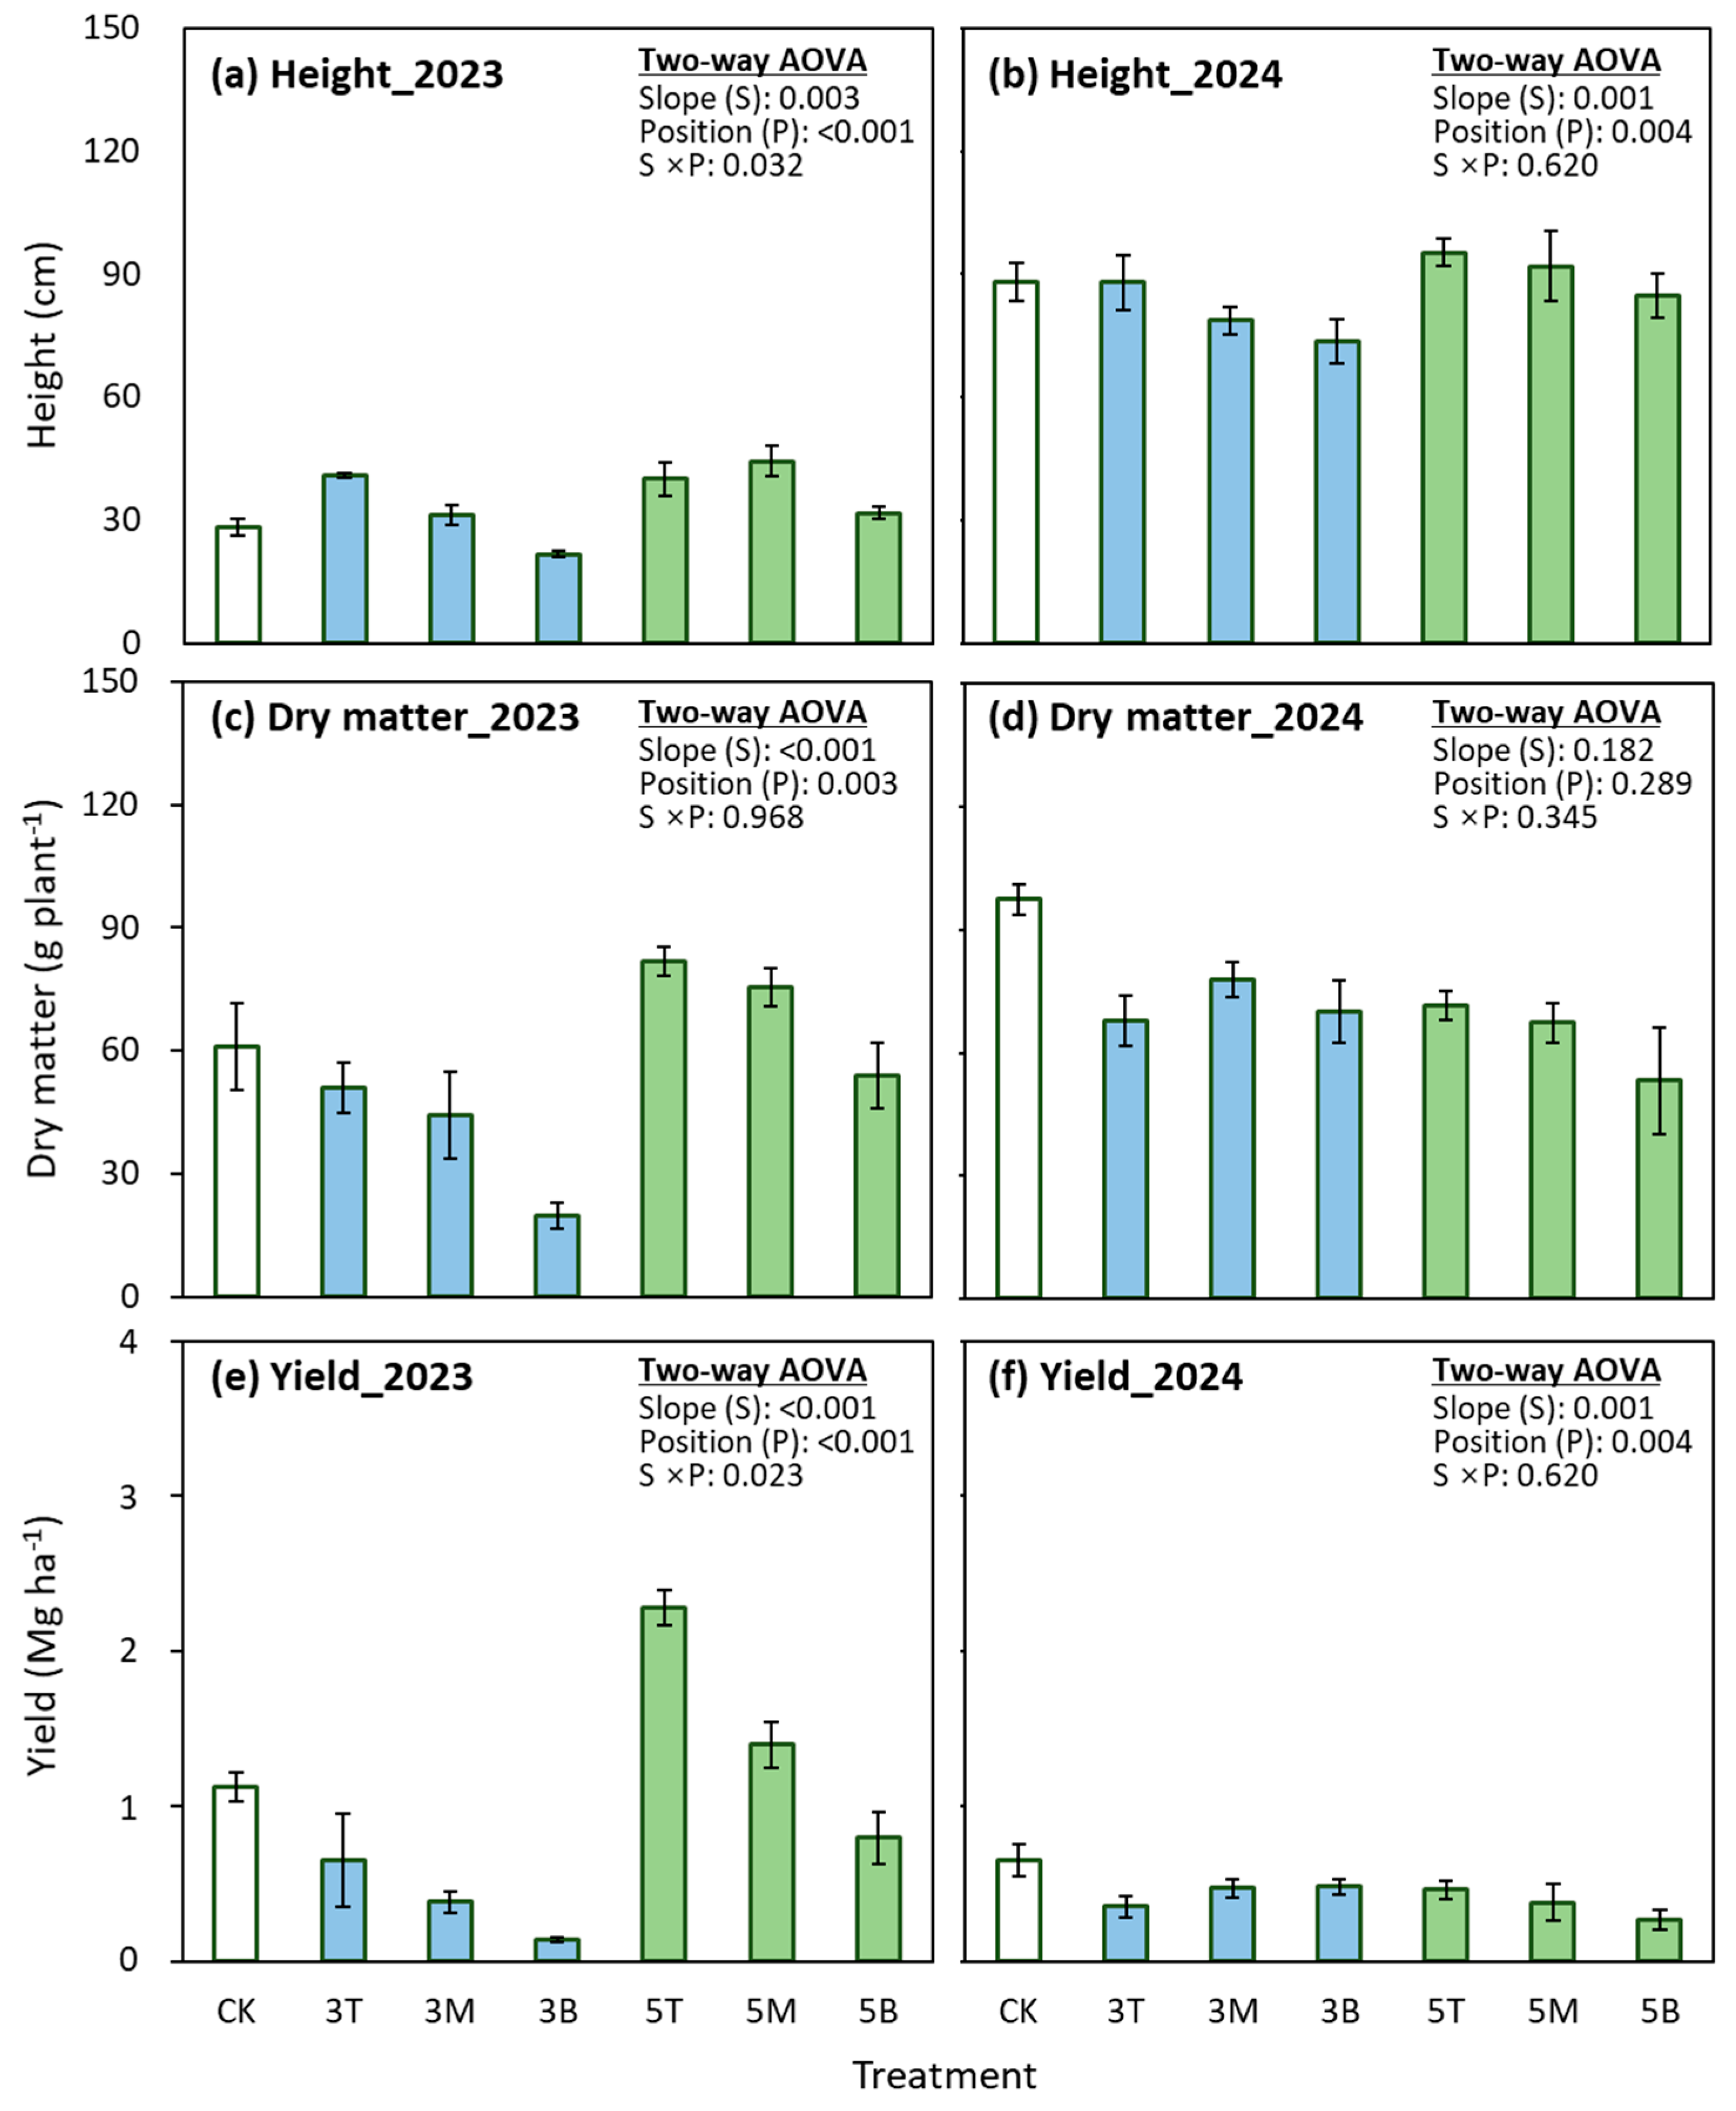
The effects of slope degree and sampling position on soybean growth and yield were different in 2023 and 2024 (Table A2 and Table A3). In 2023, plant height was not affected by slope degree, but the lowest plant height was found at the bottom of the slope for both 3° and 5° (Figure 7a). Dry matter and yield were significantly greater at 5° than 3° and consistently decreased from the top to the bottom of both slopes (Figure 7c,e). In particular, in 2023, the soybean yield averaged across the three positions was the highest at 5° (1493 ± 144 kg ha−1), followed by 0° (1129 ± 95 kg ha−1) and 3° (393 ± 126 kg ha−1). In 2024, the plant heights were 2–3 times higher than those in 2023, and there were indications of decreased plant height (for both 3° and 5°) and dry matter (for 5°) from the top to the bottom of the slope (Figure 7b,d). Despite the increased plant height in 2024 compared to 2023, the overall yield in 2024 (442 ± 75 kg ha−1) was lower than that in 2023 (970 ± 129 kg ha−1) (Figure 7f). In addition, there were no significant differences in yield between 3° and 5° and among slope positions (Figure 7f), and dry matter and yield were lower in the sloped plots than in the CK plot.
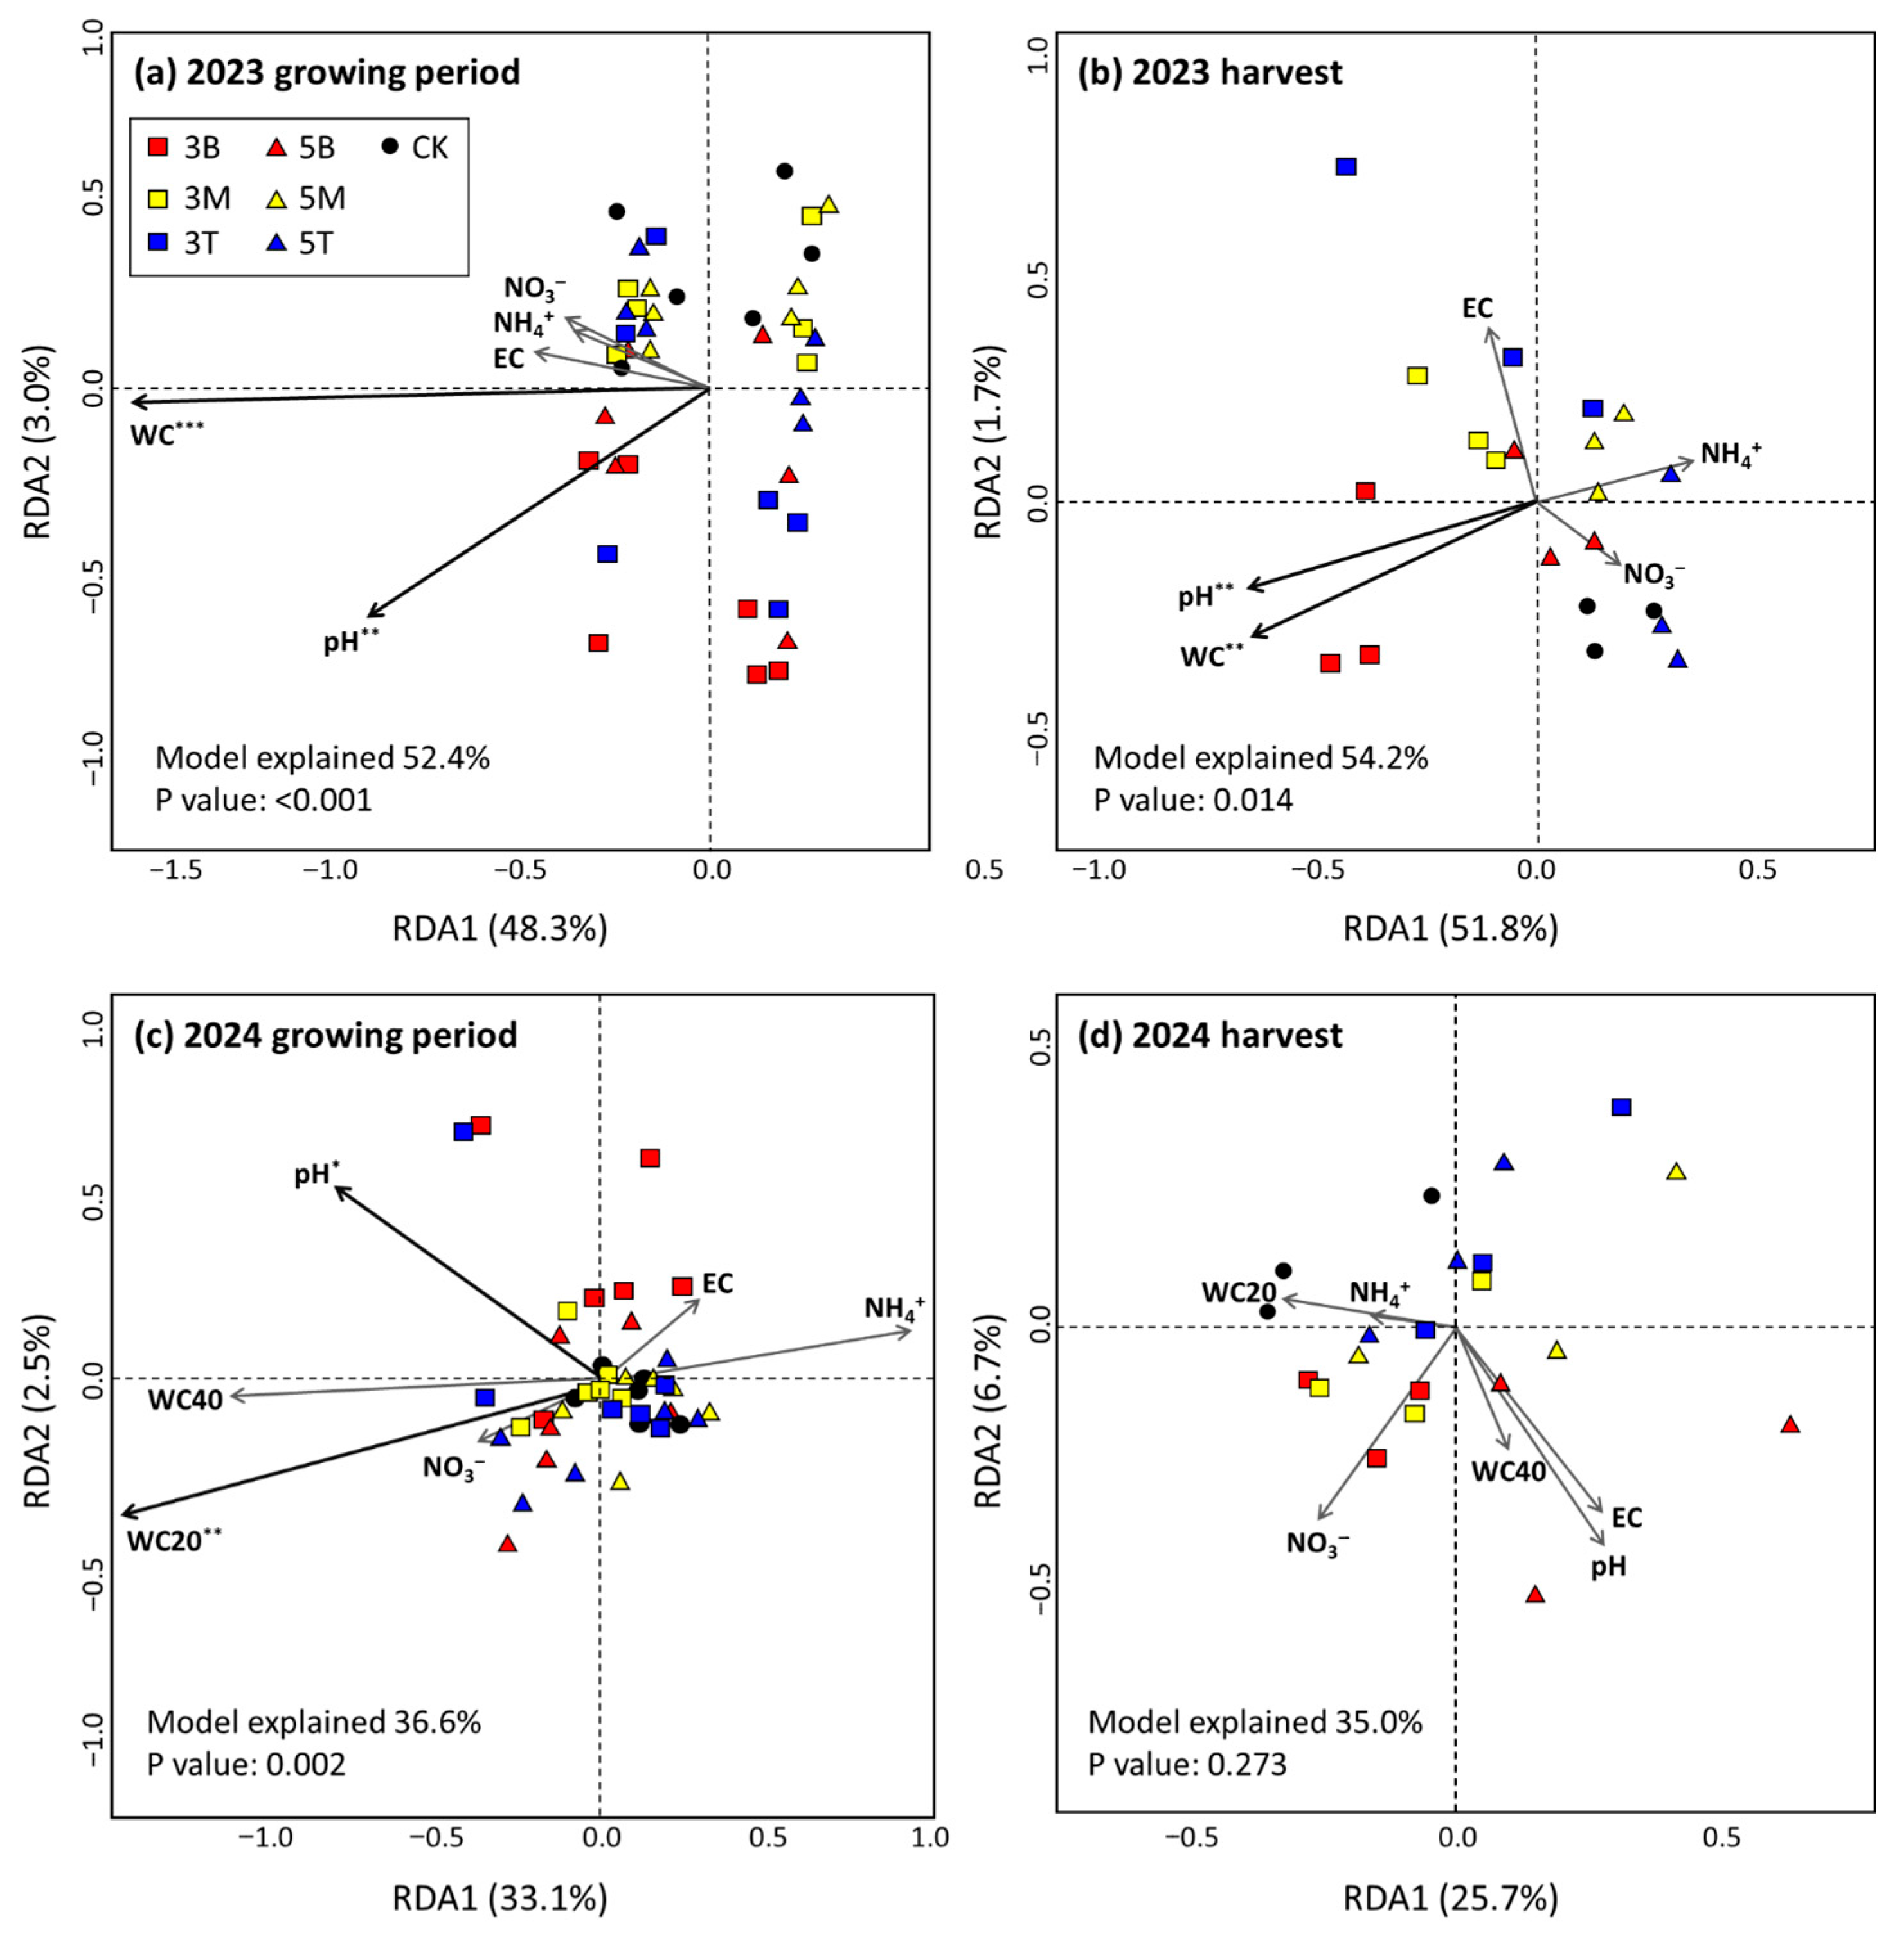
The RDA model explained 52.4% and 54.2% of the total variance in soybean growth and yield, respectively, in 2023, and 36.6% and 35.0%, respectively, in 2024; overall, the models were statistically significant, except for yield parameter in 2024 (Figure 8). Among soil variables, soil water content had the strongest influence (p < 0.01), followed by soil pH (p < 0.01) for growing parameters in 2023 and 2024 and yield parameters in 2023; however, none of soil properties had significant influence on yield parameters in 2024.

4. Discussion

4.1. Slope Construction Increased Surface Drainage and Changed Soil Properties

This study found that constructing sloped fields improved surface water drainage, as evidenced by the gradient of decreasing soil water content from the bottom to the top of the slope (Figure 5 and Figure 6). This led to a relatively drier root zone in the upper and middle slope positions, supporting better soybean growth and yield than in the lower slope position [18,19], especially in the rainy season of 2023 (Figure 7; Table A2). However, when compared to flat plots, sloped plots did not show a consistent or significant advantage in terms of overall soybean productivity, mainly due to changes in the soil properties caused by slope construction and variable climate conditions.
Climate variables, including precipitation and temperature, play vital roles in soybean productivity. Excess precipitation can cause waterlogging and water stress in soybeans [20,21], and prolonged precipitation decreases daylight, thus decreasing photosynthesis. Water stress during growth reduces shoot biomass and total dry matter while increasing the root-to-shoot ratio and water use efficiency [22]. Significantly increased surface drainage due to slope construction (Figure 5 and Figure 6) resulted in better growth performance and yield in the upper part of the slope (Figure 7). However, in 2023, above-average rainfall occurred in the early growth stage (Figure 1), which led to rapid surface runoff and soil erosion in the upper slope zones (Figure 3b). This erosion exposed the soybean roots and reduced topsoil retention, both of which negatively affected the crops’ early development. Simultaneously, in the lower slope areas, accumulation of eroded soil particles partially buried seedlings (Figure 3c), and high moisture levels resulted in waterlogging stress, suppressing overall plant performance along the slope. Surface drainage may increase as a result of slope construction; however, in sandy soils, there is a risk of erosion damage. Therefore, slope design should be carefully adjusted based on soil texture. In particular, sandy soils with low organic matter content have poor structural stability, making them highly susceptible to erosion. Incorporating organic amendments such as crop residues or compost can enhance soil aggregation and increase resistance to detachment. In addition, re-orienting field operations so that furrows, ridges, and traffic rows follow contours (perpendicular to slope direction) can shorten slope length, reduce overland flow velocity, and effectively interrupt sediment transport.
Soil water content did not differ dramatically between the 3° and 5° slopes (Figure 5 and Figure 6); however, soybean growth significantly differed between the 3° and 5° slopes, with better performance observed on the 5° slope (Figure 7). This suggests that beyond moisture dynamics, other soil physicochemical properties likely contributed to yield variability. Soybean shows varying degrees of tolerance to salinity depending on the cultivar. Studies have found that a saturated paste EC (ECe) of 2.0 dS m−1 is the threshold at which yields are suppressed, and levels exceeding 5.0 dS m−1 can lead to yield losses of about 20% per dS m−1 increase [23]. However, contrary to our concerns, the EC of the soil used in this study was not high enough to significantly affect soybean growth. The optimal groundwater depth for soybean cultivation is generally between 1 and 2 m [18], as shallow groundwater can increase the risk of high-moisture stress and salt accumulation at the surface soil layer due to capillary rise in salty groundwater [18,19]. However, during the entire study period, except for the period of heavy rainfall in June 2023, the groundwater table remained below 1.5 m, and the soil EC did not increase during the dry months, suggesting that groundwater level is unlikely to limit soybean growth in the Saemangeum RTL, particularly with respect to soil salinity.
Soil pH, however, emerged as a critical factor. While soybean generally performs well in a pH range of 5.7 to 6.5, values exceeding 7.0 can hinder its growth [24]. High soil pH in RTLs, similar to calcareous soils, is primarily attributed to the presence of sodium and carbonates like calcium and magnesium carbonates, the latter of which creates a strong buffering effect, and soil pH can reach up to 8.5 [25]. Furthermore, soil pH tended to increase with increasing depth, driven by long-term processes of carbonate leaching and accumulation [25], and slope construction exposed the subsoil, resulting in higher soil pH at the bottom of the slope. The observed pH values ranged from 6.89 to 8.05, with a trend of increasing pH from the top to the bottom of the slope (Table 1; Figure 4), likely due to the exposure of subsoil layers for slope construction. In addition, soybean growth and yield were the lowest at the bottom of the slopes (Table A2 and Table A3; Figure 7). Notably, the 3° slope exhibited higher pH levels (7.38–8.05) compared to 0° (6.89) and 5° (6.92–7.69), corresponding to the poorest soybean growth performance. The results of the RDA confirmed significant negative relationships between pH and crop productivity during the soybean growing periods (Figure 8a,c) and between pH and yield in 2023 (Figure 8b).
In addition to pH, SOM content played a significant role in soybean growth. SOM is essential for nutrient supply, soil aggregation, and overall soil health. However, newly reclaimed soils such as those in the Saemangeum region typically exhibit low SOM levels due to a limited cultivation history. Although SOM tends to increase with continued cultivation [26], the study site had only been managed for experimental purposes, resulting in minimal organic-matter input (Table 1). This deficiency in SOM hindered aggregate formation, thereby restricting aeration and drainage, creating suboptimal conditions for crop development. Furthermore, nutrient input was limited, as fertilizer application in Saemangeum is more strictly regulated by the Korean government than on general farmland to prevent non-point-source pollution. These limitations, including low SOM, poor structure, inadequate drainage, and insufficient nutrients, highlight the need for targeted soil amendments and organic inputs to improve crop performance in reclaimed tidelands.

4.2. Slope Construction Did Not Consistently Improve Soybean Growth Due to Weather Variability

Although slope construction increased surface drainage and supported better soybean performance in the upper slope positions, as observed in 2023, the overall yield remained low due to early-stage flooding, soil erosion, and sediment deposition in lower slope areas (Figure 3b,c and Figure 7). Furthermore, excessive rainfall during early growth stages raised groundwater levels to within 30 cm of the soil surface (Figure 1a), maintaining high soil moisture for nearly a month, which caused several kinds of stress and growth inhibition [20,21,27]. The RDA results confirmed that excessive soil moisture negatively affected both growth and yield, reaffirming the importance of moisture control in these environments.
In contrast, the 2024 growing season was marked by significantly lower rainfall, particularly during the flowering and pod-filling stages (Figure 1). Drought stress during this critical period can reduce both pod number and seed size, ultimately limiting yield [28,29]. In line with this, the 100-seed weight and total yield in 2024 were substantially lower than both the 2023 values and the average levels in upland fields (Table A2 and Table A3). Interestingly, despite reduced yield, plant height and dry matter accumulation were greater in 2024, indicating that vegetative growth was not constrained by water availability. When precipitation was markedly lower than normal, especially in 2024 (Figure 1c), surface drainage differences due to slope construction were minimal, and no clear trends were observed in soybean growth across slope positions. These findings suggest that slope construction did not consistently improve soybean growth and yield under low-rainfall conditions.
Although increases in temperature generally increase crop growth and yield, temperatures above the optimum cause grain sterility and may increase the overall biomass [19,30,31]. For example, the optimal range for peak soybean yields is reported to be around 20.7 °C in the Northern Hemisphere [32], and exposure to temperatures exceeding 37 °C from flowering to maturity can severely impair yields [21,30,31].
The difference in yield outcomes between years can also be attributed to differences in sowing dates. In 2023, sowing was conducted prior to the onset of the monsoon season, which increased the risk of early-stage flooding and erosion. In response, the sowing date was advanced to May in 2024 to ensure root establishment before peak rainfall periods. As a result, in 2024, soybean growth, including height, dry matter, and number of branches, was better until the pod-filling stage compared to 2023 (Table A2 and Table A3). While this sowing date adjustment mitigated early-season water stress and supported vigorous vegetative growth, it shifted the flowering and maturation periods to late July and August, when temperatures were unusually high. During this period, the average daytime temperatures reached 28.6 °C, and night-time lows remained above 25.2 °C. Prolonged exposure to temperatures above 37 °C during reproductive stages is known to impair pod development and increase sterility [21,30,31]. Elevated night-time temperatures can also reduce yield potential by disrupting carbon balance and accelerating respiration rates [33]. The results of the RDA confirmed that while changes in soil water content and soil properties significantly affected soybean growth in 2023 and 2024, and soybean yield in 2023, they did not affect soybean yield in 2024 (Figure 8), when the combination of low precipitation and high temperatures caused sterility during the pod-filling period.
Therefore, although early sowing helped reduce vulnerability to heavy rainfall, it inadvertently exposed soybean plants to high-temperature stress during flowering and seed filling, ultimately leading to increased flower and pod abortion and reduced yields. These findings underscore the importance of optimizing sowing dates to balance the risks of early-season flooding and late-season heat stress, especially under changing climatic conditions. As global warming continues to alter precipitation patterns and increase the frequency of extreme temperatures, adaptive management strategies will be essential for maintaining stable crop production in reclaimed tidal farmlands. Furthermore, the observed effects of slope construction were strongly influenced by interannual weather variability, particularly excessive rainfall in 2023 and high temperatures in 2024. This indicates that the benefits of slope construction alone cannot be generalized across years with different climatic conditions, underscoring the need for multi-year trials under diverse weather scenarios.

5. Conclusions

This study highlights the complex interactions between soil conditions, topographical modifications, and climatic variability in RTLs used for upland crop cultivation. While slope construction can improve surface drainage, its benefits are limited without concurrent improvements in soil quality and adaptive crop management. Climate extremes, such as excessive rainfall in the first year or high temperatures in the second year, pose significant challenges for soybean productivity, particularly in the absence of irrigation infrastructure. Future research should focus on long-term monitoring of sloped fields, evaluate the effectiveness of combining slope construction with soil amendments and crop diversification, and developing predictive models linking climate variability with drainage effectiveness. Furthermore, from a practical perspective, we recommend providing farmers with guidelines on optimal slope design, improving soil fertility and structure through organic amendments, and adjusting sowing dates to avoid periods of excessive rainfall or heat stress. Strengthening field-level drainage maintenance and developing low-cost supplemental measures during extreme events will also be essential. Adopting these integrative strategies will enhance the resilience and sustainability of RTLs for upland crop production under increasing climate variability.

Author Contributions

Experiments and writing—initial draft, S.-B.L.; data curation and experiments, E.-S.S. and K.-S.L.; conceptualization, writing—review and editing, and supervision, W.-J.C. and J.-H.K. All authors have read and agreed to the published version of the manuscript.

Funding

This work was supported by the Cooperative Research Program of the National Institute of Crop Science (RS-2023-00224283), Rural Development Administration, Republic of Korea.

Data Availability Statement

All datasets that support the findings of this study are available in the tables and figures. Further inquiries should be directed to the corresponding author.

Conflicts of Interest

The authors declare no conflicts of interest.

Abbreviations

The following abbreviations are used in this manuscript:
RTLReclaimed coastal tidelands
ECElectrical conductivity
NH4+Ammonium
NO3Nitrate
TCTotal carbon
TNTotal nitrogen
SOMSoil organic matter
RDARedundancy analysis

Appendix A

Table A1. Effects (two-way ANOVA) of slope degree and sampling position on soil properties for each sampling period.

Effects
20 June 202317 August 202318 September 20233 November 202324 May 20242 August 202428 August 20248 November 2024
pH
Slope (S)<0.001<0.0010.0140.001<0.001<0.001<0.001<0.001
Position (P)<0.001<0.001<0.001<0.001<0.001<0.001<0.001<0.001
S × P0.0440.3930.0100.1200.7530.2990.050.818
EC
S<0.0010.0060.3230.0060.0550.005<0.0010.058
P<0.0010.6210.0940.1150.2530.5270.6000.015
S × P<0.0010.0730.0150.0330.410.1570.7190.218
NH4+-N
S0.2720.0170.3650.2720.9410.7770.8590.211
P0.0190.4120.0010.0190.0470.3460.0840.958
S × P0.1670.1180.0630.1670.0010.2410.6780.225
NO3-N
S0.1050.0060.0620.1050.0270.4130.5110.402
P0.8150.1470.5650.8150.7610.2840.5250.033
S × P0.6770.1470.5650.6770.0610.4930.8810.685
Table A2. Growth performance of soybean in 2023.
TreatmentFlowering StagePod-Filling StageHarvest
Plant Height (cm)No. Branches Dry Weight (g)Plant Height (cm)No. Branches Dry Weight (g)Plant Height (cm)No. Branches Dry Weight (g)No. of Pod100-Seed Weight (g)Yield (kg ha−1)
CK46.5
(4.4)
3.3
(0.3)
5.5
(0.9)
46.7
(3.3)
2.3
(0.3)
20.8
(2.5)
28.3
(2.0)
7.3
(1.2)
61.0
(10.5)
33.7
(4.1)
20.0
(1.6)
1128.5
(95.4)
3T43.0
(1.5)
3.0
(0.6)
4.0
(1.6)
54.7
(1.2)
2.7
(0.3)
11.3
(1.6)
41.0
(0.6)
3.3
(0.3)
50.8
(6.1)
26.0
(5.6)
19.1
(1.3)
654.5
(296.7)
3M39.8
(0.8)
0.7
(0.3)
4.5
(0.2)
40.0
(4.8)
1.7
(0.3)
19.6
(4.1)
31.3
(2.4)
2.7
(0.3)
44.3
(10.6)
17.3
(1.7)
18.1
(1.0)
385.6
(68.6)
3B50.0
(4.2)
4.3
(0.7)
1.3
(0.4)
53.0
(2.3)
1.7
(0.3)
6.5
(0.5)
21.7
(0.7)
2.7
(0.3)
19.7
(3.3)
9.0
(1.7)
18.6
(0.8)
140.0
(12.8)
5T58.3
(2.7)
3.0
(0.1)
6.9
(0.7)
56.3
(3.7)
3.7
(0.3)
22.1
(3.2)
40.0
(4.0)
5.3
(0.7)
81.7
(3.4)
38.0
(2.6)
25.4
(0.8)
2277.6
(114.5)
5M60.7
(4.9)
3.7
(0.3)
7.6
(1.1)
56.0
(4.0)
3.0
(0.6)
28.5
(4.1)
44.3
(3.7)
7.0
(1.0)
75.5
(4.5)
41.0
(4.0)
21.0
(0.5)
1401.9
(148.7)
5B35.3
(0.3)
0.3
(0.3)
2.8
(0.3)
37.2
(2.4)
1.3
(0.3)
9.3
(1.8)
31.7
(1.5)
5.3
(0.9)
53.9 (8.1)32.0
(5.3)
19.4
(0.5)
799.7
(169.4)
Treatment code: CK, flat (0°) plot; 3T, top position of 3° slope; 3M, middle position of 3° slope; 3B, bottom position of 3° slope; 5T, top position of 5° slope; 5M, middle position of 5° slope; and 5B, bottom position of 5° slope.
Table A3. Growth performance of soybean in 2024.
TreatmentFlowering StagePod-Filling StageHarvest
Plant Height (cm)No. Branches Dry Weight (g)Plant Height (cm)No. Branches Dry Weight (g)Plant Height (cm)No. Branches Dry Weight (g)No. of Pod100-Seed Weight (g)Yield (kg ha−1)
CK83.7
(1.5)
2.7
(0.3)
33.0
(2.7)
93.7
(2.9)
2.3
(0.9)
42.4
(4.7)
88.0
(4.0)
3.0
(2.0)
97.4
(3.7)
69.9
(4.9)
17.6
(1.7)
658.5
(103.9)
3T83.0
(5.3)
1.3
(0.7)
20.9
(8.6)
103.3
(5.9)
2.7
(0.3)
50.5
(6.6)
88.0
(1.7)
3.7
(1.2)
67.8
(6.2)
45.4
(5.8)
13.6
(1.1)
357.8
(70.2)
3M77.0
(3.8)
2.0
(0.6)
20.6
(3.2)
91.3
(2.4)
2.0
(0.1)
34.8
(3.3)
78.7
(3.2)
4.0
(1.0)
77.9
(4.3)
53.4
(3.0)
21.6
(0.5)
476.0
(60.2)
3B74.7
(5.4)
1.0
(0.6)
17.5
(3.1)
74.3
(2.8)
1.7
(0.3)
29.2
(5.3)
73.7
(2.0)
2.3
(0.3)
70.0
(7.7)
36.9
(0.8)
20.0
(1.2)
483.6
(47.1)
5T91.7
(2.0)
2.7
(0.3)
23.5
(3.4)
108.0
(4.2)
3.0
(0.6)
61.6
(3.4)
95.3
(2.8)
6.0
(1.5)
71.4
(3.6)
80.1
(5.6)
13.5
(2.0)
466.0
(58.9)
5M84.3
(1.8)
3.3
(0.9)
30.5
(3.2)
102.3
(2.0)
2.7
(0.7)
57.2
(8.4)
92.0
(3.6)
5.3
(1.2)
67.3
(4.8)
67.3
(5.9)
16.5
(1.1)
381.5
(118.6)
5B82.3
(3.2)
2.7
(0.7)
20.8
(1.9)
88.0
(3.1)
1.7
(0.7)
36.4
(5.3)
84.7
(3.2)
2.7
(0.7)
53.2
(12.9)
33.7
(3.5)
20.9
(1.5)
268.3
(64.3)
Treatment code: CK, flat (0°) plot; 3T, top position of 3° slope; 3M, middle position of 3° slope; 3B, bottom position of 3° slope; 5T, top position of 5° slope; 5M, middle position of 5° slope; and 5B, bottom position of 5° slope.

References

  1. Lim, S.S.; Yang, H.I.; Park, H.J.; Park, S.I.; Seo, B.S.; Lee, K.S.; Lee, S.H.; Lee, S.M.; Kim, H.Y.; Ryu, J.H.; et al. Land-use management for sustainable rice production and carbon sequestration in reclaimed coastal tideland soils of South Korea: A review. Soil Sci. Plant Nutr. 2020, 66, 60–75. [Google Scholar] [CrossRef]
  2. Seo, B.S.; Jung, J.; Jung, K.; Kang, B.H. Soil physico-chemical properties and groundwater levels at the “Agricultural Life Science Sites” in Saemangeum reclaimed land. Korean J. Soil Sci. Fertil. 2023, 56, 169–177. [Google Scholar] [CrossRef]
  3. Ministry of Agriculture, Food and Rural Affairs (MOAF). Agriculture, Food and Rural Affairs Statistics Yearbook; MOAF: Sejong, Republic of Korea, 2019. [Google Scholar]
  4. Lee, S.; Bae, H.S.; Lee, S.H.; Oh, Y.Y.; Ryu, J.H.; Ko, J.C.; Hong, H.C.; Kim, Y.D.; Kim, S.L. Effect of subsurface drainage systems on soil salinity at Saemangeum reclaimed tidal land. Korean J. Soil Sci. Fertil. 2015, 48, 618–627. [Google Scholar] [CrossRef][Green Version]
  5. Bae, H.S.; Jang, H.; Hwang, J.B.; Park, T.S.; Lee, K.S.; Lee, D.S.; Chung, D.Y. Managing soil organic matter and salinity by crop cultivation in Saemangeum reclaimed tidal land. Korean J. Soil Sci. Fertil. 2018, 51, 50–60. [Google Scholar] [CrossRef]
  6. Ministry of Agriculture, Food and Rural Affairs (MAFRA). Medium and Long Term Development Plan of Upland Food Crop; MAFRA: Sejong, Republic of Korea, 2016; Available online: http://www.mafra.go.kr (accessed on 1 May 2025).
  7. Chung, D.Y.; Kim, H.; Park, M.; Lee, S.E. Characteristics of a reclaimed tidal soil for effective resalization at Saemangum and Youngsan-River. Korean J. Soil Sci. Fertil. 2012, 45, 1222–1229. [Google Scholar] [CrossRef]
  8. Lee, S.H.; Oh, Y.Y.; Ryu, J.H.; Lee, H.S.; Kang, B.H.; Ock, H.K.; Jung, K.H. Changes in soil salinity and upland crop productivity in reclaimed land as affected by groundwater table. Korean J. Soil Sci. Fertil. 2020, 53, 415–430. [Google Scholar] [CrossRef]
  9. National Institute of Crop Science (NICS). Look in the Reclaimed Tidal Land; NICS: Wanju, Republic of Korea, 2013; p. 102. [Google Scholar]
  10. Uni, N. Cropland soil salinization and associated hydrology: Trends, processes and examples. Water 2018, 10, 1030. [Google Scholar] [CrossRef]
  11. Lee, S.; Bae, H.S.; Kim, H.K.; Noh, T.H.; Lee, G.H. Temporal variations on soil salinity and cation displacement at Saemangeum and Yeongsangang reclaimed tidal lands. J. Agric. Chem. Environ. 2014, 3, 121–129. [Google Scholar] [CrossRef][Green Version]
  12. Bae, H.S.; Lee, S.H.; Hwang, J.B.; Park, H.K.; Lee, G.H.; Lee, G.B.; Lee, K.S.; Lee, D.S.; Hong, B.D.; Lee, J.H.; et al. Drainage effect on desalinization and crop growth on a poorly drained soil in the reclaimed tidal flat land. J. Korean Soc. Int. Agric. 2016, 28, 512–519. [Google Scholar] [CrossRef]
  13. Shao, X.H.; Chang, T.T.; Cai, F.; Wang, Z.Y.; Huang, M.Y. Effects of subsurface drainage design on soil desalinization in coastal resort of China. J. Food Agric. Environ. 2012, 10, 935–938. [Google Scholar]
  14. Korea Meteorological Administration (KMA). KMA Weather Data Service, Open MET Data Portal; KMA: Seoul, Republic of Korea, 2025; Available online: https://data.kma.go.kr/cmmn/main.do (accessed on 15 May 2025).
  15. Keeney, D.R.; Nelson, D.W. Nitrogen-inorganic forms. In Methods of Soil Analysis; Agronomy Monograph 9, Part 2, 2nd ed.; Page, A.L., Ed.; ASA: San Antonio, TX, USA; SSSA: Salt Lake City, UT, USA, 1982; pp. 643–698. [Google Scholar]
  16. Legendre, P.; Legendre, L. Numerical Ecology, 3rd ed.; Elsevier: Amsterdam, The Netherlands, 2012. [Google Scholar]
  17. Oksanen, J.; Blanchet, F.G.; Kindt, R.; Legendre, P.; Minchin, P.R.; O’Hara, B.; Simpson, G.L.; Solymos, P.; Stevens, M.H.H.; Wagner, H. VEGAN: Community Ecology Package, R package Version 2.0-9. 2012. Available online: https://researchportal.helsinki.fi/en/publications/vegan-community-ecology-package (accessed on 5 May 2025).
  18. Nosetto, M.D.; Jobbágy, E.G.; Jackson, R.B.; Sznaider, G.A. Reciprocal influence of crops and shallow groundwater in sandy landscapes of the inland Pampas. Field Crops Res. 2009, 113, 138–148. [Google Scholar] [CrossRef]
  19. Ayar, J.E.; Christen, E.W.; Soppe, R.W.; Meyer, W.S. The resource potential of in-situ shallow ground water use in irrigated agriculture: A review. Irrig. Sci. 2006, 24, 147–160. [Google Scholar] [CrossRef]
  20. Williamson, R.E.; Kriz, G.J. Response of agricultural crops to flooding, depth-of-water table and soil gaseous composition. Trans. ASABE 1970, 13, 216–220. [Google Scholar] [CrossRef]
  21. Chae, S.; Shin, P.; Youn, J.; Sung, J.; Jeon, S. The effect of sowing date on soybean growth and yield under changing climate in the southern coastal region of Korea. Agriculture 2025, 15, 1174. [Google Scholar] [CrossRef]
  22. Gebre, M.G.; Earl, H.J. Effects of growth medium and water stress on soybean [Glycine max (L.) Merr.] growth, soil water extraction and rooting profiles by depth in 1-m rooting columns. Front. Plant Sci. 2020, 11, 487. [Google Scholar] [CrossRef] [PubMed]
  23. Katerji, N.; van Hoorn, J.W.; Hamdy, A.; Mastrorilli, M. Salt tolerance classification of crops according to soil salinity and to water stress day index. In Mediterranean Crop Responses to Water and Soil Salinity; International Centre for Advanced Mediterranean Agronomic Studies: Bari, Italy, 2002. [Google Scholar]
  24. Sun, M.; Chen, S.; Kurle, J.E. Interactive effects of soybean cyst nematode, arbuscular-mycorrhizal fungi, and soil pH on chlorophyll content and plant growth of soybean. Phytobiomes J. 2022, 6, 95–105. [Google Scholar] [CrossRef]
  25. Rogovska, N.P.; Blackmer, A.M.; Mallarino, A.P. Relationships between soybean yield, soil pH, and soil carbonate concentration. Soil Sci. Soc. Am. J. 2007, 38, 971–983. [Google Scholar] [CrossRef]
  26. Park, H.J.; Seo, B.S.; Jeong, Y.J.; Yang, H.I.; Park, S.I.; Baek, N.; Kwak, J.H.; Choi, W.J. Soil salinity, fertility and carbon content, and rice yield of salt-affected paddy with different cultivation period in southwestern coastal area of South Korea. Soil Sci. Plant Nutr. 2022, 68, 53–63. [Google Scholar] [CrossRef]
  27. Seo, J.H.; Park, J.S.; Choi, M.S.; Jung, K.Y.; Chun, H.C.; Lee, S.H.; Gong, D.H.; Chae, S.E.; Jeon, S.H.; Yoon, D.K. Growth and yield response of soybean (Glycine max L.) in relation to sowing date in the southern region of South Korea. Agronomy 2024, 14, 2624. [Google Scholar] [CrossRef]
  28. Chathurika, W.; Reddy, K.R.; Nacer, B. Soybean seed physiology, quality, and chemical composition under soil moisture stress. Food Chem. 2019, 278, 92–100. [Google Scholar] [CrossRef]
  29. Desouza, P.I.; Egli, D.B.; Bruening, W.P. Water stress during seed filling and leaf senescence in soybean. Agronomy 1997, 89, 807–812. [Google Scholar] [CrossRef]
  30. Sang, W.G.; Baek, J.K.; Kwon, D.W.; Cho, J.I. Impact of climate change on yield and canopy photosynthesis of soybean. Korean J. Agric. For. Meteorol. 2022, 24, 275–284. [Google Scholar]
  31. Hatfield, J.L.; Boote, K.J.; Kimball, B.A.; Ziska, L.H.; Izaurralde, R.C.; Ort, D.; Thomson, A.M.; Wolfe, D. Climate impacts on agriculture: Implications for crop production. Agron. J. 2011, 103, 351–370. [Google Scholar] [CrossRef]
  32. Sakurai, G.; Iizumi, T.; Yokozawa, M. Varying temporal and spatial effects of climate on maize and soybean affect yield prediction. Clim. Res. 2011, 49, 143–154. [Google Scholar] [CrossRef]
  33. Eck, M.A.; Murray, A.R.; Ward, A.R.; Konrad, C.E. Influence of growing season temperature and precipitation anomalies on crop yield in the southeastern United States. Agric. For. Meteorol. 2020, 291, 108053. [Google Scholar] [CrossRef]
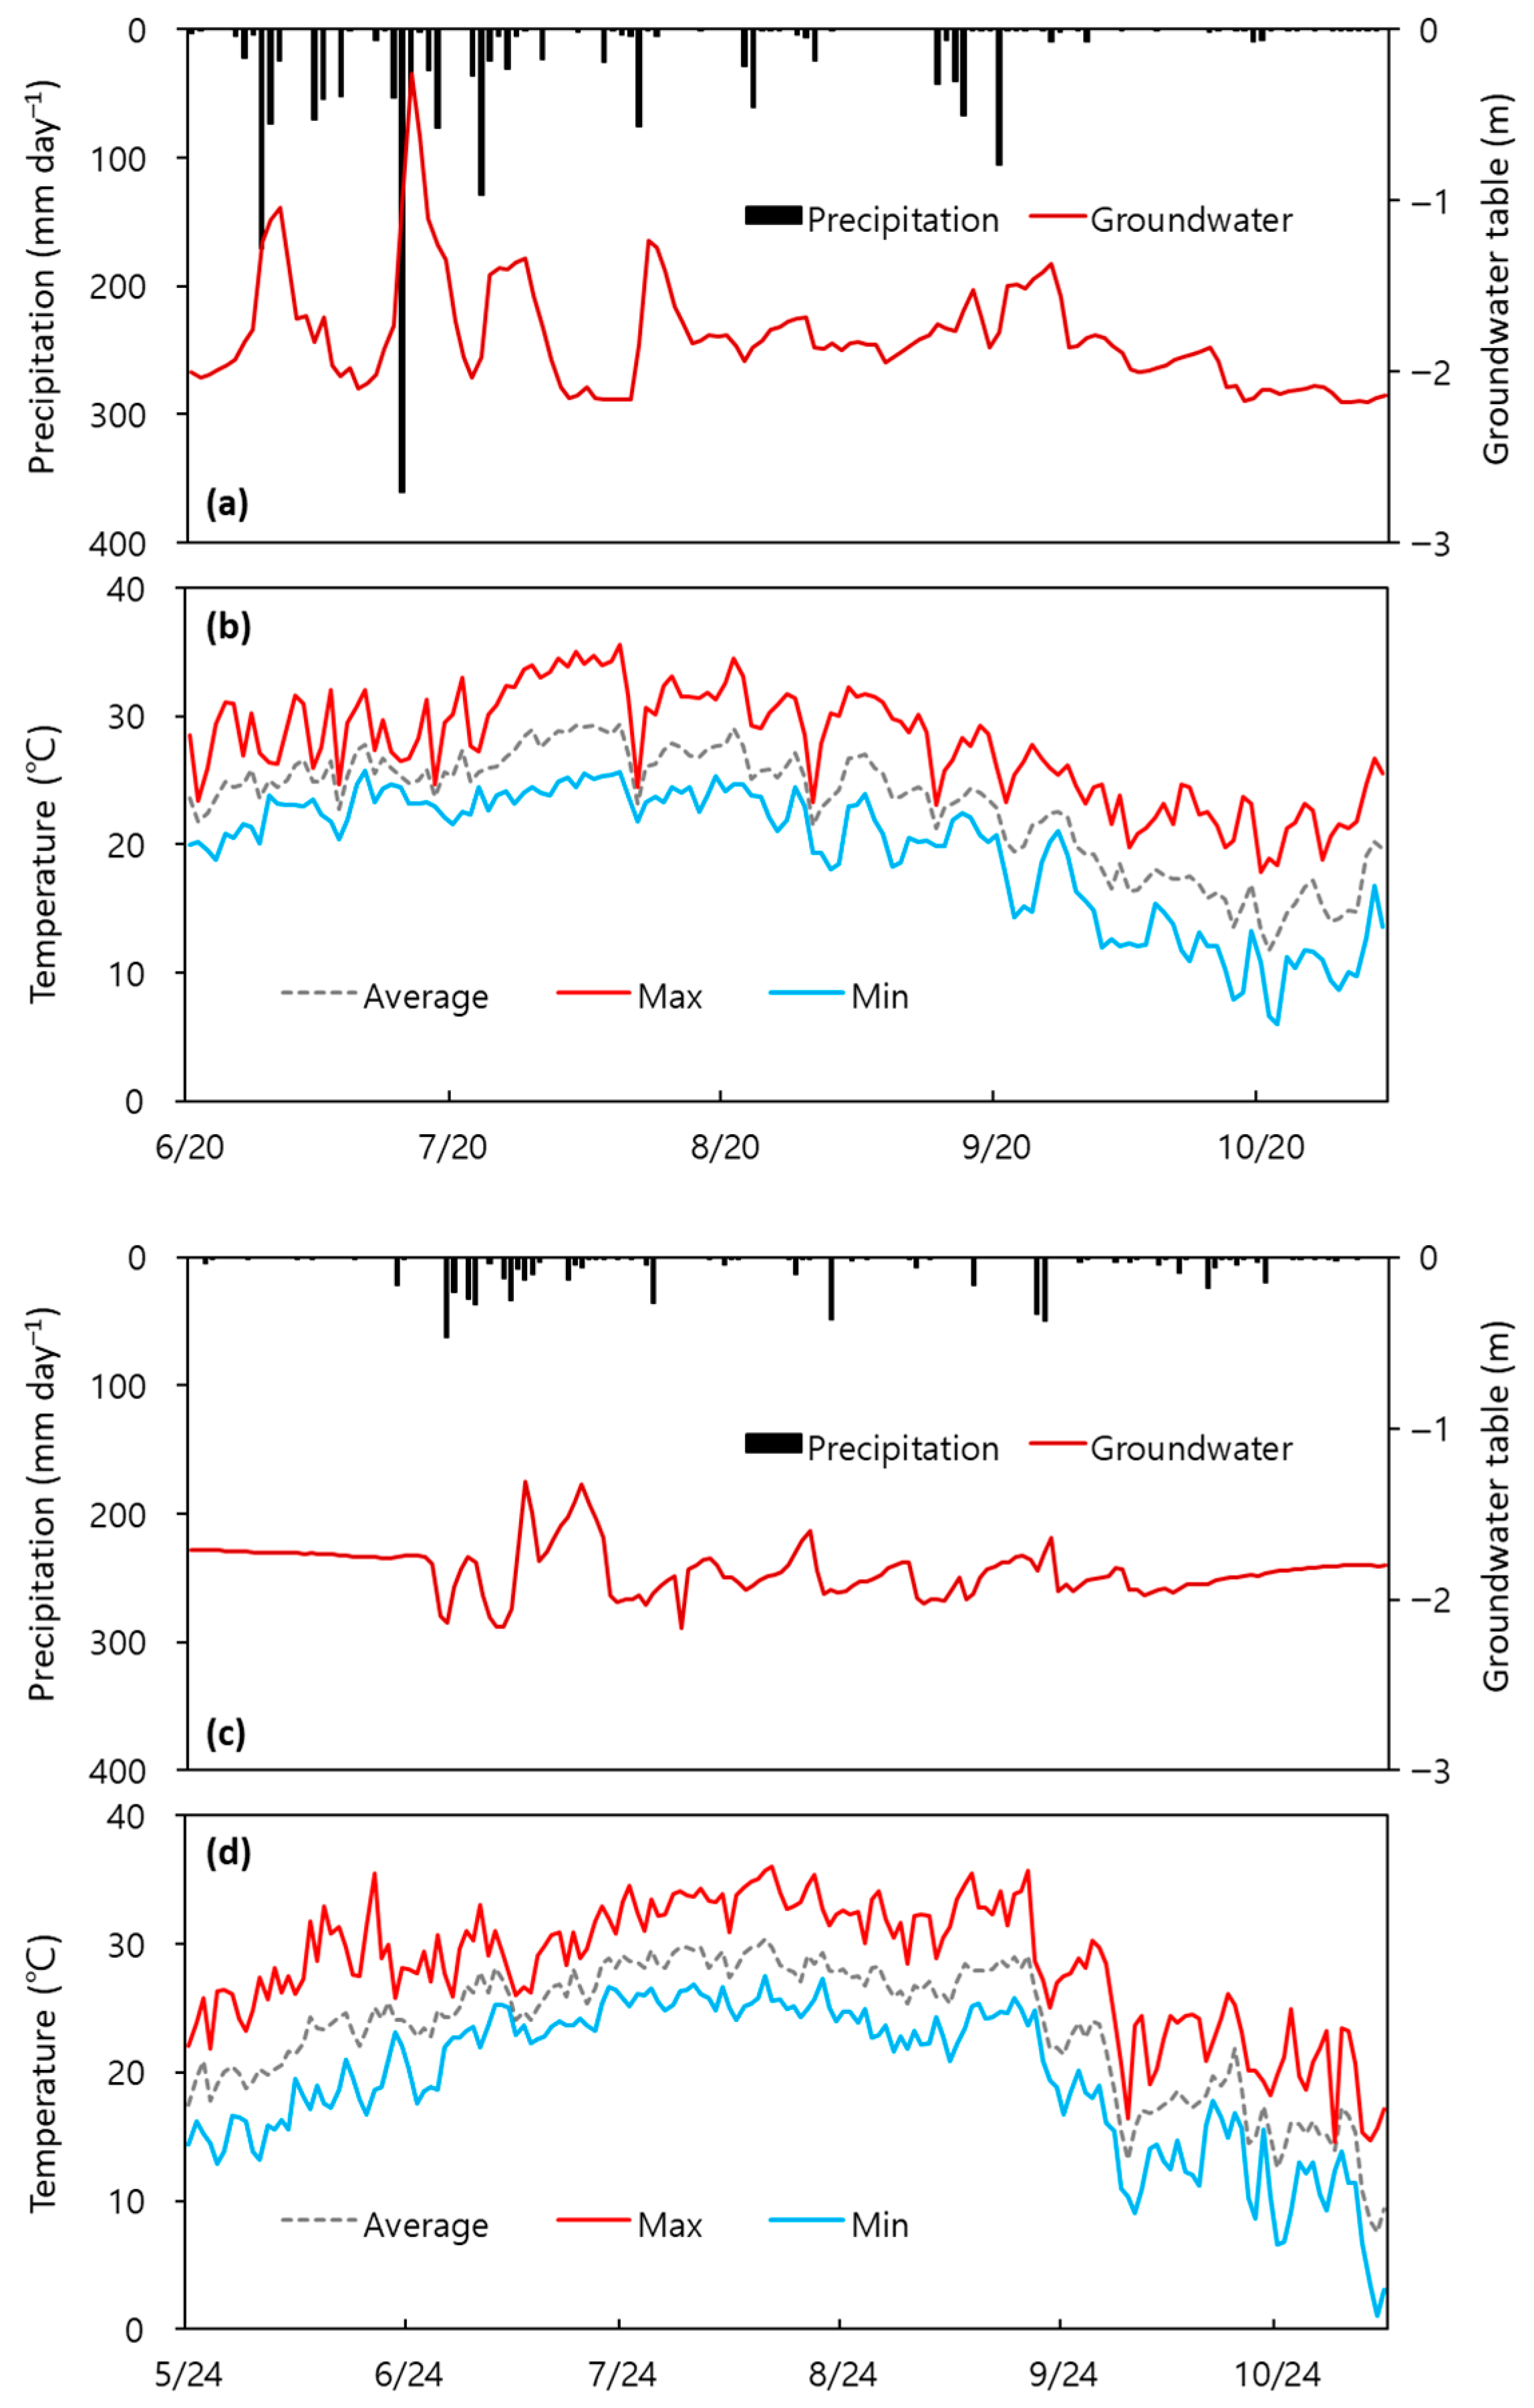
Figure 1. Changes in precipitation and groundwater table in (a) 2023 and (c) 2024, and in temperature in (b) 2023 and (d) 2024.
Agronomy 15 02177 g001
Figure 2. Experimental plot design, locations of soil sensor installation, soil sampling and soybean growth-monitoring subplots, and slope construction and drainage furrow arrangement.
Agronomy 15 02177 g002
Figure 3. Images of (a) study site after heavy rainfall event in 2023, (b) soybean root exposure by soil erosion, (c) soil accumulation and growth damage at the bottom of the slope.
Agronomy 15 02177 g003
Figure 4. Changes in (a) pH, (b) EC, (c) NH4+, and (d) NO3 during study period. Abbreviations: CK, flat (0°) plot; 3T, top position of 3° slope; 3M, middle position of 3° slope; 3B, bottom position of 3° slope; 5T, top position of 5° slope; 5M, middle position of 5° slope; and 5B, bottom position of 5° slope. ANOVA results are provided in Table A1.
Agronomy 15 02177 g004
Figure 5. Changes in soil water content in flat (0°) plot in (a) 2023 and (b) 2024; at 3° in (c) 2023 and (d) 2024; and at 5° in (e) 2023 and (f) 2024. T, M, and B represent top, middle, and bottom of slope, respectively, and 20 and 40 represent soil water content at 20 and 40 cm depths, respectively.
Agronomy 15 02177 g005
Figure 6. Changes in soil water content in (a) 2023 at soil depth of 20 cm, (b) 2024 at soil depth of 20 cm, and (c) 2024 at soil depth of 40 cm. The central line and cross (×) inside a box represent the median and average of the dataset. A box spans from the first quartile (Q1) to the third quartile (Q3), covering the interquartile range (IQR), which contains the middle 50% of the data. The whiskers extend from the box to the smallest and largest values within 1.5 × IQR from Q1 and Q3, respectively. Data points beyond the whiskers are considered outliers and are plotted individually. Abbreviations: CK, flat (0°) plot; 3T, top position of 3° slope; 3M, middle position of 3° slope; 3B, bottom position of 3° slope; 5T, top position of 5° slope; 5M, middle position of 5° slope; and 5B, bottom position of 5° slope.
Agronomy 15 02177 g006
Figure 7. Plant growth parameters: plant height in (a) 2023 and (b) 2024, dry matter in (c) 2023 and (d) 2024, and yield in (e) 2023 and (f) 2024.
Agronomy 15 02177 g007
Figure 8. Redundancy analysis (RDA) of soybean growth and soil properties in (a) 2023 and (c) 2024, and soybean yield and soil properties in (b) 2023 and (d) 2024. Significant soil properties (i.e., pH and water content) are indicated with bold arrows, and significance levels are indicated with asterisks (* p < 0.05; ** p < 0.01; and *** p < 0.001).
Agronomy 15 02177 g008
Table 1. Initial properties of the soil used in this study.
Slope DegreePositionpH1:5EC1:5 (dS m−1)NH4+-N
(mg kg−1)
NO3-N
(mg kg−1)
Organic Matter
(g kg−1)
Total-N
(g kg−1)
C/N
0NA a6.89 (0.01)0.91 (0.01)4.06 (1.09)0.09 (0.09)11.8 (1.28)0.65 (0.07)10.6 (0.30)
3Top7.38 (0.01)1.34 (0.01)2.15 (0.23)1.26 (0.56)9.0 (0.62)0.47 (0.07)11.2 (0.47)
Middle7.59 (0.02)1.43 (0.02)3.31 (1.10)1.07 (0.05)7.4 (0.62)0.37 (0.02)11.6 (0.40)
Bottom8.05 (0.02)1.20 (0.02)1.87 (1.35)0.79 (0.45)3.0 (0.22)0.20 (0.01)8.9 (0.31)
5Top6.92 (0.03)1.45 (0.01)3.97 (1.05)2.43 (0.94)9.2 (0.18)0.50 (0.02)10.8 (0.21)
Middle7.14 (0.01)1.14 (0.04)5.93 (1.58)1.63 (1.24)7.5 (1.24)0.39 (0.05)11.2 (0.25)
Bottom7.69 (0.04)0.95 (0.02)0.42 (0.24)2.99 (1.74)3.8 (0.26)0.23 (0.01)9.7 (0.29)
EffectsProbability > F
Slope (S)<0.001<0.0010.2720.3650.5680.4530.977
Position (P)<0.001<0.0010.0190.471<0.001<0.001<0.001
S × P0.044<0.0010.1670.6070.9040.9880.128
a not applicable. The values are the means of triplicate measurements, with the standard errors shown in parentheses.
Disclaimer/Publisher’s Note: The statements, opinions and data contained in all publications are solely those of the individual author(s) and contributor(s) and not of MDPI and/or the editor(s). MDPI and/or the editor(s) disclaim responsibility for any injury to people or property resulting from any ideas, methods, instructions or products referred to in the content.