Article

rolB Promotes Adventitious Root Development in Pyrus betulaefolia by Modulating Endogenous Hormones and Gene Expression

1
College of Horticulture, Hebei Agricultural University, Baoding 071001, China
2
Pear Technology and Innovation Center of Hebei Province, Baoding 071001, China
3
Pear Industry and Technology Engineering Research Center of the Ministry of Education, Baoding 071001, China
*
Author to whom correspondence should be addressed.
Agronomy 2025, 15(9), 2165; https://doi.org/10.3390/agronomy15092165
Submission received: 24 August 2025 / Revised: 7 September 2025 / Accepted: 9 September 2025 / Published: 11 September 2025

Abstract

We investigated the effect of Agrobacterium rhizogenes-mediated transformation mof rolB on adventitious root development and endogenous hormones in ‘duli’ (Pyrus betulaefolia) via transcriptomic analysis of wild-type (WT) and rolB-transformed plants. The formation of root primordia occurred earlier in transgenic ‘duli’ than in the WT plants. At seven days, 57% of the transgenic seedlings had formed root primordia, whereas root primordia first appeared at seven days in WT ‘duli’. The rooting rate of transgenic ‘duli’ and WT plants was 90% and 77.14%, respectively. rolB significantly promoted the formation of secondary roots. Within 20 days, auxin (IAA), gibberellic acid (GA3), and zeatin riboside (ZR) were higher and abscisic acid (ABA) was lower in transgenic ‘duli’ than in WT plants. Gene Ontology analysis revealed high enrichment in signaling pathways and ADP binding, and Kyoto Encyclopedia of Genes and Genomes pathway analysis indicated that several differentially expressed genes were enriched in flavonoid and carotenoid-related pathways and plant hormone signal transduction. rolB induced changes in the expression patterns of several genes involved in hormone biosynthesis, metabolism, and signal transduction pathways in ‘duli’. Weighted gene co-expression network analysis identified the DEGs associated with endogenous hormone levels and indicated that the central genes of modules most strongly correlated with ABA, ZR, IAA, and GA3 regulate protein synthesis, signaling, and root tissue meristem activity. Protein–protein interaction analysis yielded a co-expression network of physiological and transcriptomic data during rooting and identified key genes at the network core. These findings provide valuable insights into the regulatory mechanisms of rolB and its influence on root development in ‘duli’.

1. Introduction

The rolB gene is one of four rol genes located within the T-DNA region of the Agrobacterium rhizogenes root-inducing (Ri) plasmid. It plays a central role in the development of root-induction (Ri) syndrome, which occurs when a fragment of bacterial DNA from the Ri plasmid is integrated into the plant genome, inducing excessive root formation at the infection site, particularly along the stem [1]. This phenomenon has been documented in multiple plant species, highlighting the important role of rolB in root formation. Importantly, many woody plants, such as pear (Pyrus spp.), are notoriously difficult to propagate using conventional vegetative methods (e.g., cuttings and layering), which underscores the practical importance of studying rolB-mediated root induction. However, there is still a gap in understanding the specific molecular mechanisms of rolB in pear root formation, especially regarding hormone regulation. The expression of rolB in transgenic plants has been extensively documented and is associated with enlarged root systems, altered leaf and flower morphology, increased adventitious root formation, and reduced internode length. These phenotypic alterations have been consistently observed across various species transformed with rolB [2]. Although these results have been observed across species, the specific role of rolB in pear trees, particularly in regulating endogenous hormone pathways, remains unclear. This study will focus on exploring how the rolB gene affects endogenous hormone changes during adventitious root formation in pear, particularly its effect on IAA, GA3, ZR, ABA, and how these hormones interact. Tobacco, one of the earliest species in which the effects of rolB transformation were studied, exhibits numerous morphological changes, including enhanced adventitious root growth, delayed vegetative and reproductive development, modifications in leaf structure, and reduced fruit size [3]. Similarly, transgenic apple and pear plants expressing rolB show increased numbers of roots and rooting rates, along with shorter stems and internodes [4]. These findings highlight the significant role of rolB in regulating plant growth and morphology [5,6,7], particularly in promoting root induction [8].
Transformation of plant cells with rolB disrupts hormonal signaling pathways and homeostasis [9], which potentially affects multiple signaling protein modules, notably those involved in auxin (IAA) and cytokinin transduction [10]. While the effects of rolB on IAA signaling have been widely explored, and transgenic plants have been shown to display increased IAA sensitivity [11], its influence on other plant hormones remains unclear and requires further investigation. Thus, this study aims to specifically explore how rolB regulates hormone synthesis, metabolism, and signaling pathways during root initiation, filling a critical gap in current research.
Pear (Pyrus spp.), a member of the Rosaceae family, is an economically significant fruit, and China is the world’s leading pear producer. ‘Duli’, a commonly used pear rootstock, is widely recognized for its adaptability and vigor, yet it is notoriously difficult to propagate using traditional vegetative methods, such as cuttings and layering [12]. Here, we assessed the effects of A. rhizogenes-mediated rolB transformation on the morphogenesis, development, and endogenous hormone content of adventitious roots in ‘duli’. Transcriptomic analyses were conducted to evaluate changes across stages of adventitious root development between wild-type and rolB-transformed ‘duli’ plants. Our findings shed new light on the role of rolB in regulating hormone pathways during root induction and identify key genes involved in this developmental process. These findings provide a scientific foundation for improving the rooting efficiency of ‘duli’ and advancing propagation techniques for high-quality pear rootstocks.

2. Materials and Methods

2.1. Plant Materials

The experimental materials used in this study were ‘duli’ transgenic plants expressing the rolB gene (DB) and wild-type ‘duli’ (D), both of which were derived from the tissue culture collection maintained by the Pear Research Team at Hebei Agricultural University. Plantlets approximately 1.5 cm in length and exhibiting healthy growth were used in the experiment. These plantlets were cultured on 1/2 MS medium (2.2 g/L MS powder, 25 g/L sucrose, 6 g/L agar) with a pH of 5.8–6.0 for root induction. Root samples were collected at 0, 1, 5, 10, 20, and 30 days for paraffin sectioning, growth index measurements, and endogenous hormone content analysis.

2.2. Adventitious Root Morphology and Growth Index Measurement

The number of adventitious roots (per plant) was calculated as follows:
Adventitious root number (per plant) = Total number of adventitious roots (number of roots ≥ 1 cm in length per plant)/number of rooted plants.
The number of secondary roots (per plant) was calculated as follows:
Secondary root number (per plant) = Total number of secondary roots visible per plant/number of rooted plants.
Rooting rate = (number of rooted plants/total number of plants) × 100%.
The length of each adventitious root was measured with a ruler.
Average root length = Sum of the measured root lengths/number of adventitious roots per plant.
Root length, projection area, surface area, average diameter, and total volume were analyzed using a SNAPSCAN 310 scanner (Agfa-Gevaert N.V., Mortsel, Belgium) and WinRHIZO image analysis software (2025a).

2.3. Determination of the Endogenous Hormone Content and Production of Paraffin Sections

The endogenous hormone content was determined following the method described by Yuan Shuai et al. (2024) [13].
The paraffin sectioning procedure was as follows: root samples were placed in small vials containing FAA fixative solution and subjected to vacuum infiltration using a syringe. After 24 h of fixation, the samples were rinsed with 70% ethanol and then dehydrated through a graded ethanol series (83%, 95%, and 100%) for 30 min each. Subsequently, the samples were cleared in a 1:1 and then 2:1 xylene:ethanol solution for 60 min each, followed by immersion in pure xylene for an additional 60 min.
The samples were then infiltrated with paraffin wax in stages: first at 37 °C with wax chips for approximately 24 h (until the wax no longer melted), then at 45 °C for another 12 h (until the wax no longer melted), and finally in pure molten paraffin at 60 °C. Once fully infiltrated, the samples were embedded in paraffin.
After the wax blocks had solidified, they were trimmed, and 12 μm-thick sections were prepared using a Leica RM2235 rotary microtome (Leica Biosystems, Nussloch, Germany). The paraffin ribbons were floated in a 40 °C water bath, mounted on glass slides, dried, rehydrated, and subjected to the following staining protocol:
Xylene (20 min) → Xylene (20 min) → 1:1 Xylene:ethanol (5 min) → 100% Ethanol (5 min) → 95% Ethanol (5 min) → 83% Ethanol (5 min) → 70% Ethanol (5 min) → 1% Safranin (overnight) → 70% Ethanol (2 min) → 83% Ethanol (2 min) → 95% Ethanol (2 min) → 0.5% Fast Green (10 s) → 100% Ethanol (3 min) → 100% Ethanol (3 min) → 1:1 Xylene:ethanol (3 min) → Xylene (3 min) → Xylene (3 min).
Finally, the stained sections were mounted in neutral balsam, dried, and examined under a NIKON TI2-U microscope.

2.4. Transcriptome Analysis

Transcriptome sequencing was performed by Beijing Novogene Technology Co., Ltd. (Beijing, China). Total RNA was extracted from root samples collected at 0, 1, 5, 10, and 20 days for cDNA library construction and sequencing. Three biological replicates were used for each time point; thus, a total of 15 libraries were constructed. Gene expression levels were quantified using the featureCounts tool from the Subread software package (2.1.1). Raw read count data were normalized, and statistical models were applied to perform hypothesis testing. Genes with an adjusted p-value (padj) < 0.05 and |log2FC| ≥ 0 were defined as differentially expressed genes (DEGs). Gene Ontology (GO) and Kyoto Encyclopedia of Genes and Genomes (KEGG) pathway enrichment analyses were conducted using the clusterProfiler package in R (4.4.0).
For co-expression network analysis, a soft threshold of 10 was selected. Hierarchical clustering based on gene dissimilarity was followed by dynamic tree cutting to identify gene modules. Modules with a correlation coefficient > 0.75 were merged, and hub genes were identified based on appropriate weight and kWithin values. Cytoscape software was used to visualize gene co-expression networks.

2.5. qRT-PCR Validation

Eight DEGs identified from the transcriptome data were selected for validation by quantitative real-time PCR (qRT-PCR). Gene-specific primers were designed using NCBI Primer-BLAST. Total RNA was extracted using the FastPure® Plant Total RNA Isolation Kit (RC411-C1, Vazyme, Nanjing, China). First-strand cDNA was synthesized with the HiScript® II Reverse Transcription Kit (R212, Vazyme, Nanjing, China). qRT-PCR was performed on a CFX96 Real-Time PCR Detection System (Bio-Rad, Hercules, CA, USA) using GhUBQ7 as the internal reference gene. Reactions were carried out with the HiScript® II Q RT SuperMix for qPCR (+gDNA wiper) (R223, Vazyme, Nanjing, China). Procedures for the qRT-PCR program settings, reaction system, and data analysis followed those described by Yuan Shuai et al. (2025) [14,15].

2.6. Data Analysis

All data were processed and statistically analyzed using Excel 2015 and SPSS 26. Graphs were generated using Excel 2015, GraphPad Prism 9.5, and Cytoscape 3.10.2.

3. Results and Analysis

3.1. Cytological Changes and Developmental Progression of Adventitious Root Formation in rolB-Transformed ‘Duli’

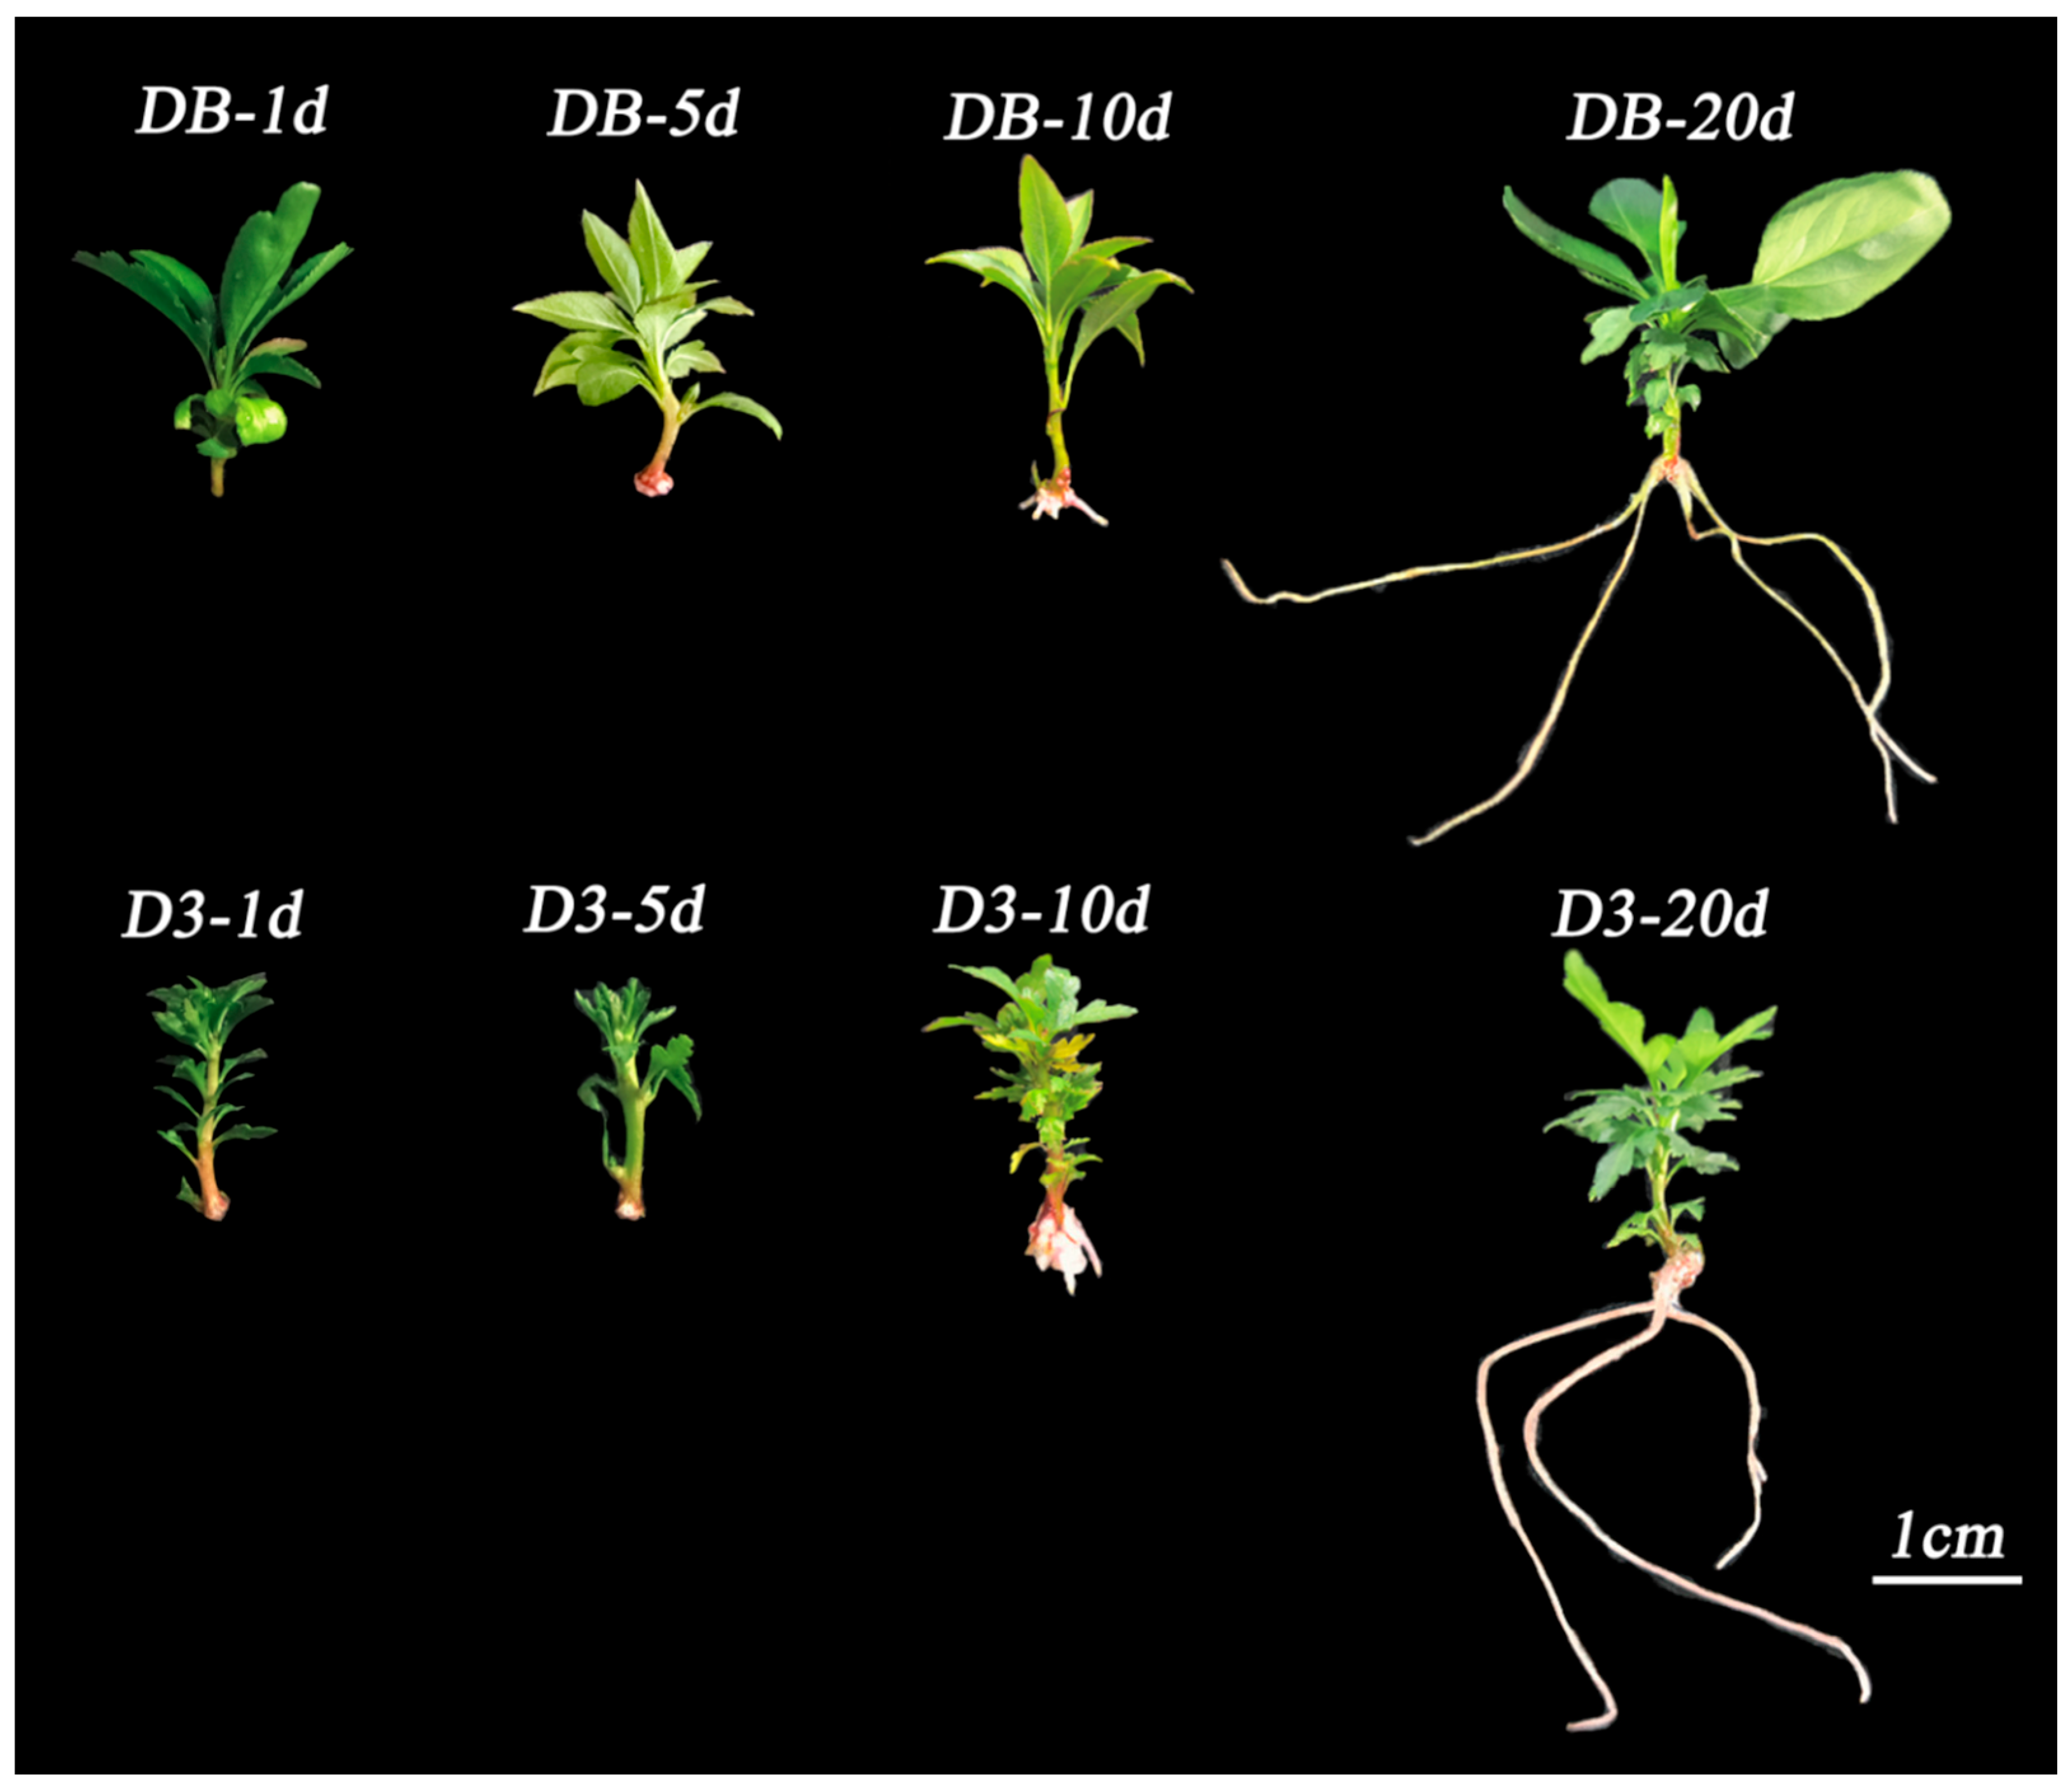
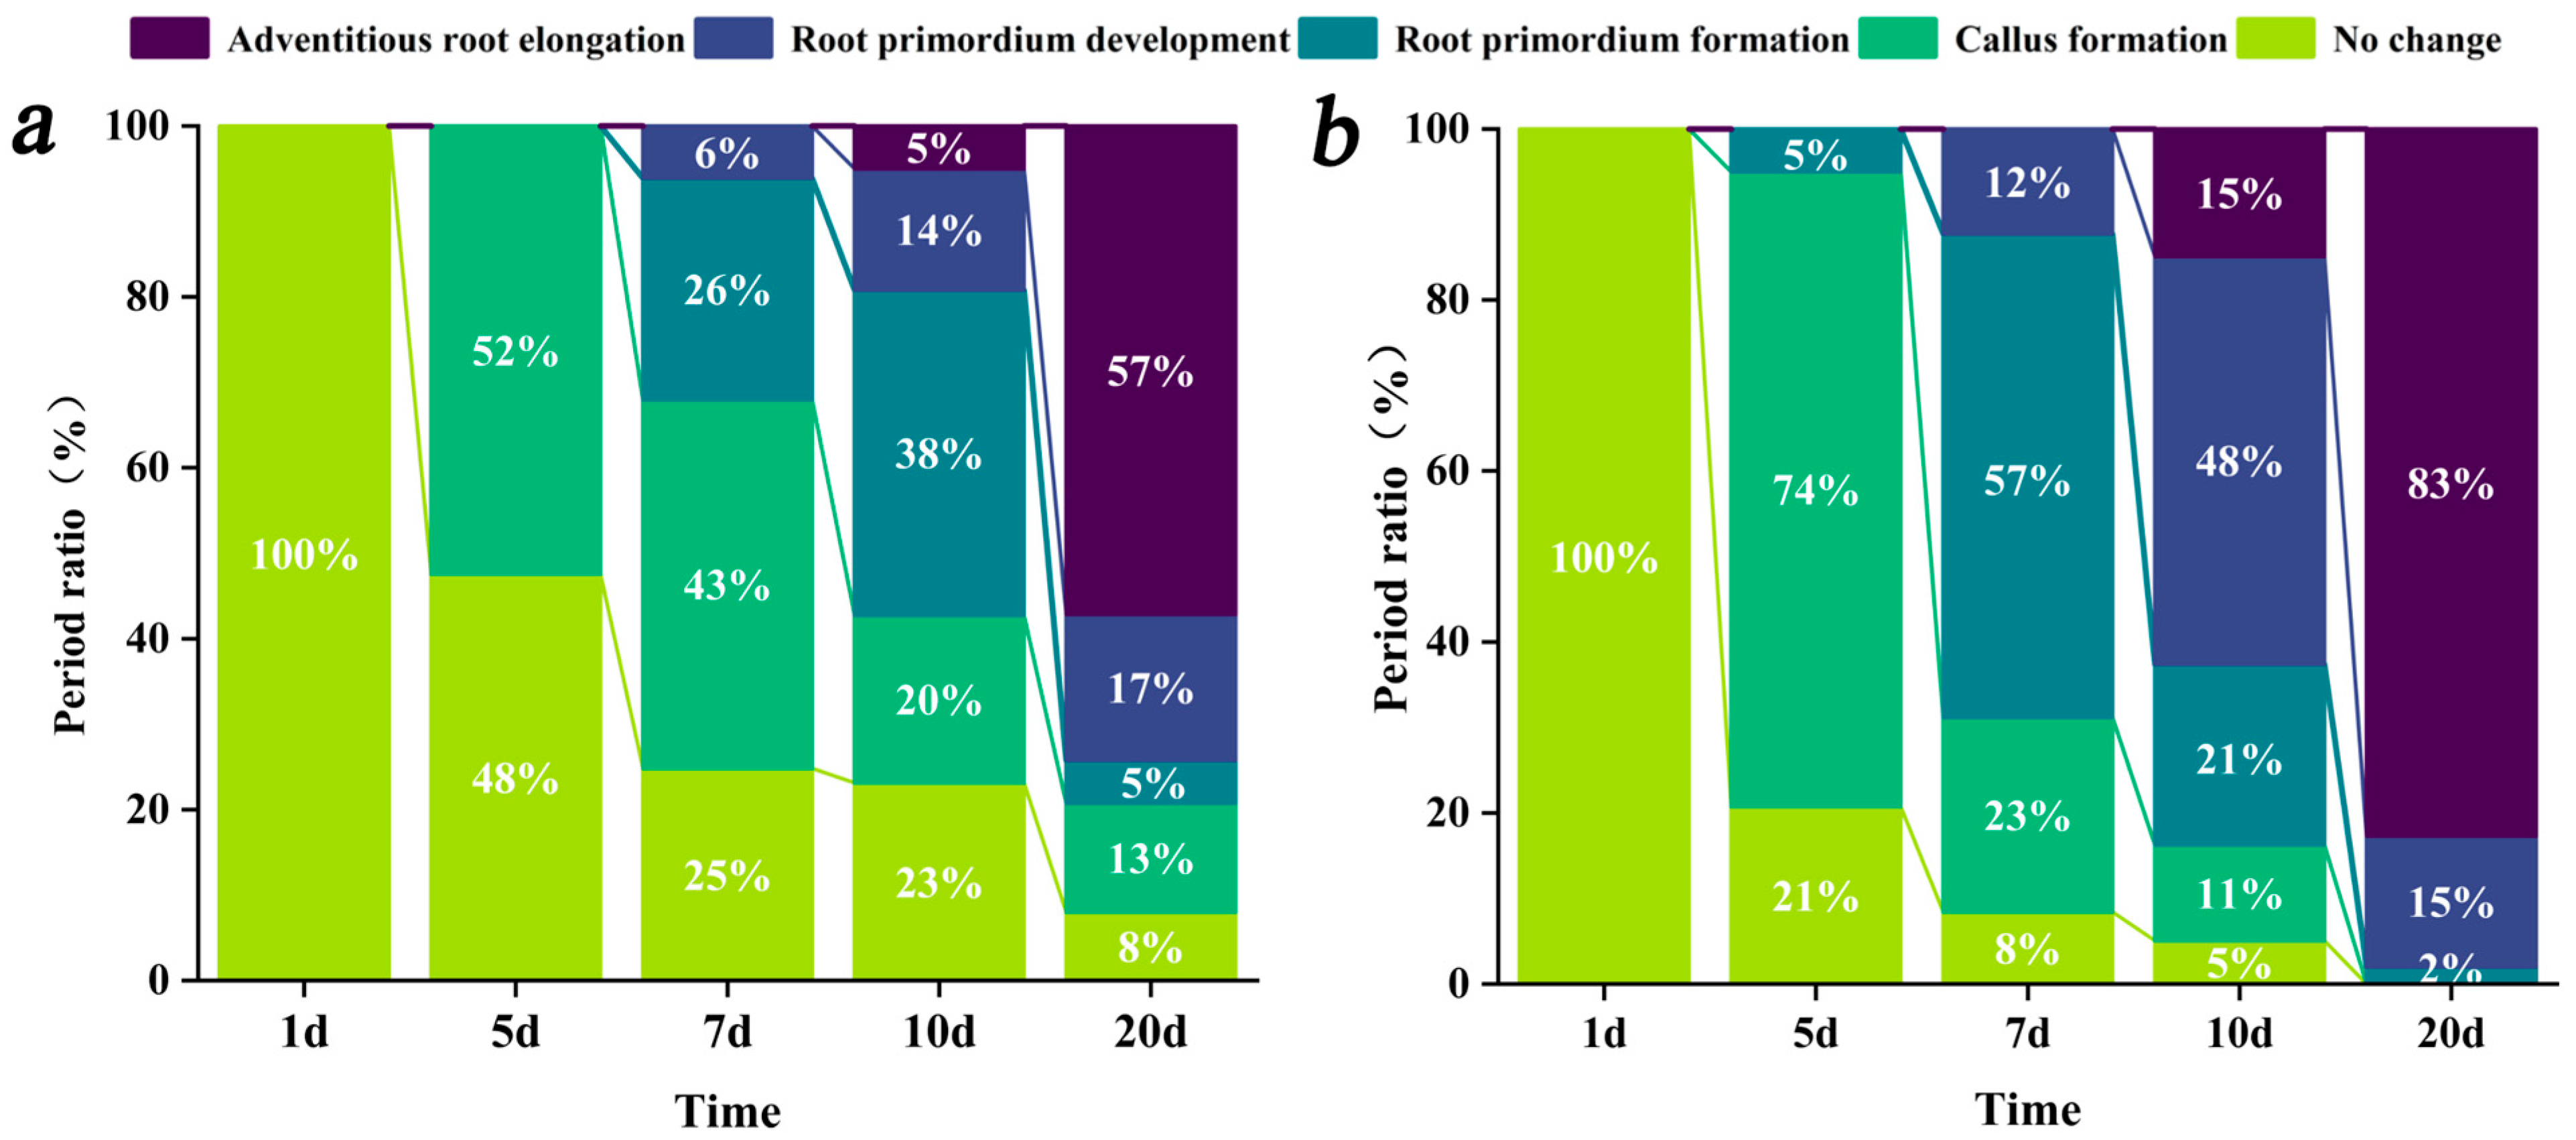
As shown in Figure 1 and Figure 2, no callus formation was observed in either transgenic or WT ‘duli’ on day 1 after rooting induction. By day 5, callus formation was detected at the base of the transgenic plants in 74.2% of the samples, whereas only 52.2% of the WT plants exhibited callus formation (Figure 2a). Cellular anatomical analysis revealed that by day 5, 5.0% of the transgenic plants had formed root primordia, while no root primordia were observed in the WT plants. On day 7, 57.0% of the transgenic plants displayed differentiated root primordia, which was significantly higher than the percentage of WT plants with differentiated root primordia (26.0%). By day 10, 47.1% of the transgenic ‘duli’ microshoots had adventitious roots emerging through the epidermis (Figure 2b); In contrast, adventitious roots were only observed in 14.0% of the microshoots of WT plants. On day 20, 83.1% of the transgenic plants had developed adventitious roots, whereas adventitious roots were only observed for 57.3% of the WT plants.

3.2. Morphological Analysis of Root System Development During Adventitious Root Formation in rolB-Transformed ‘Duli’

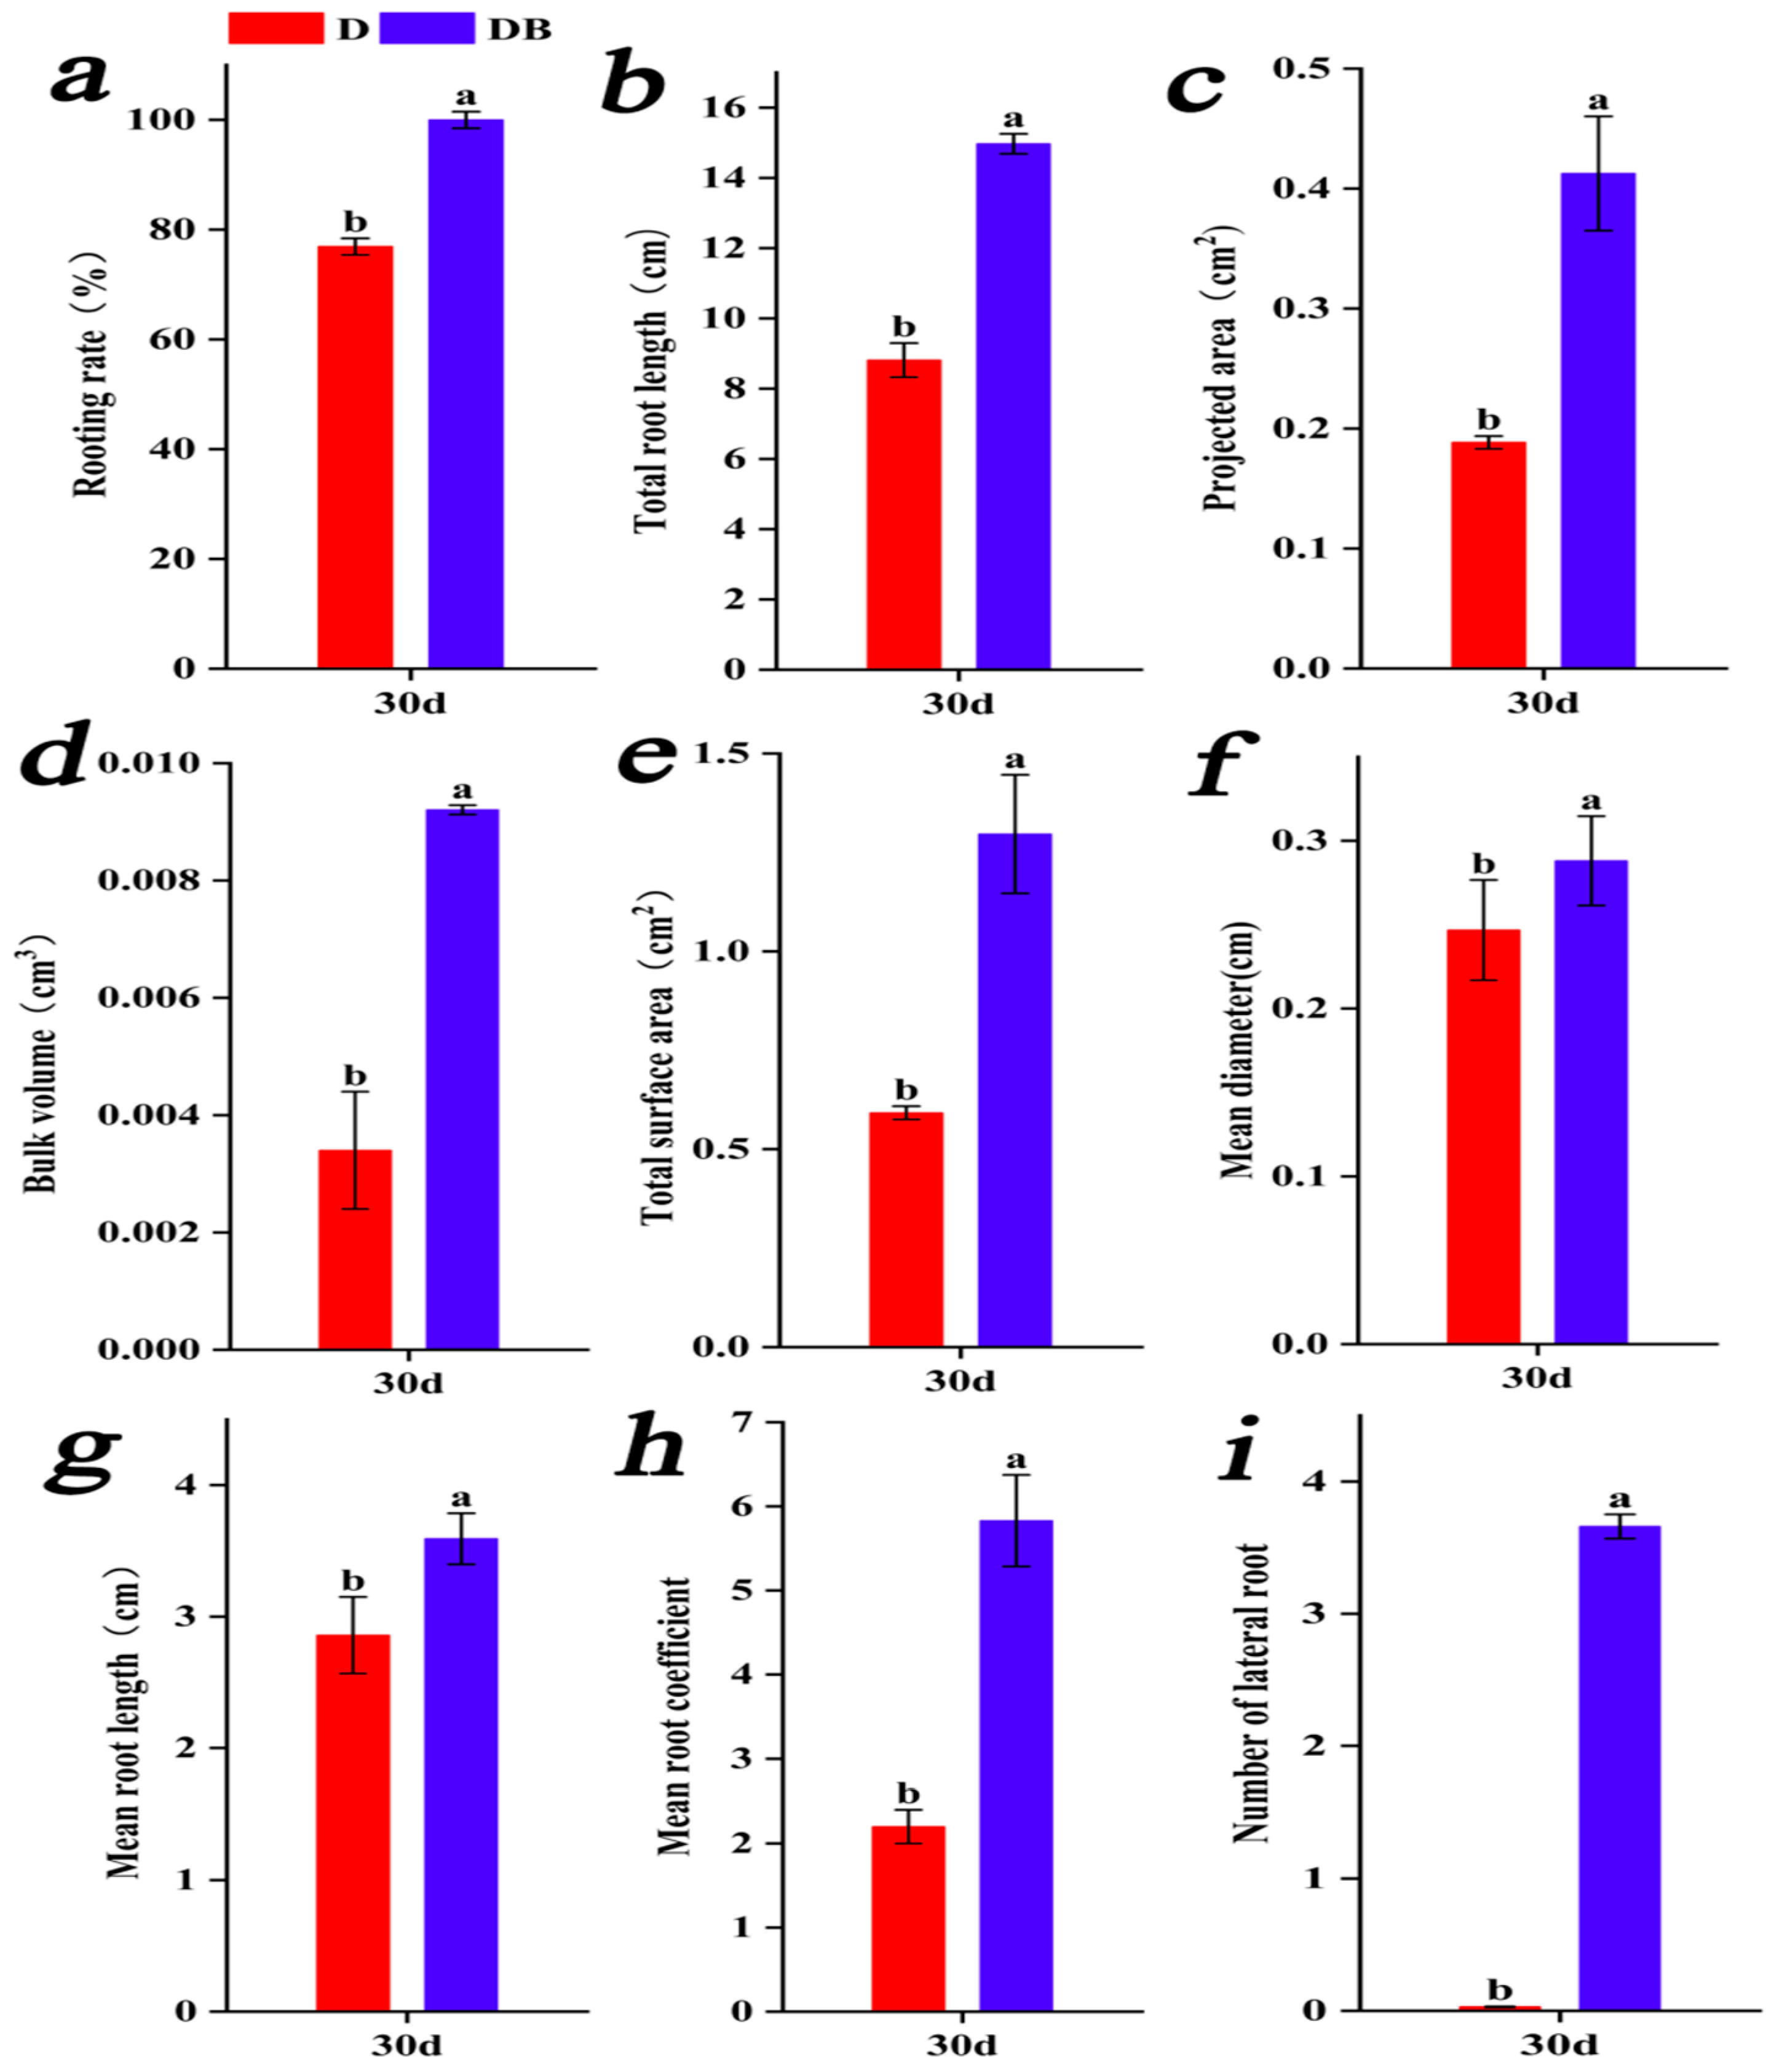
After 30 days of rooting treatment, the rooting rate was 98.01% for rolB-transformed ‘duli’ (D) and 79.14% for WT plants (DB) (Figure 3), indicating that the rolB gene substantially promotes adventitious root formation. The expression of rolB also enhanced the development of secondary roots: transgenic plants produced an average of 3.66 secondary roots per plant, while almost no secondary roots were observed in WT plants. The mean root length, total root length, surface area, projection area, average diameter, and root volume were higher in transgenic ‘duli’ than in WT ‘duli’.

3.3. Analysis of the Endogenous Hormone Content of rolB-Transformed ‘Duli’

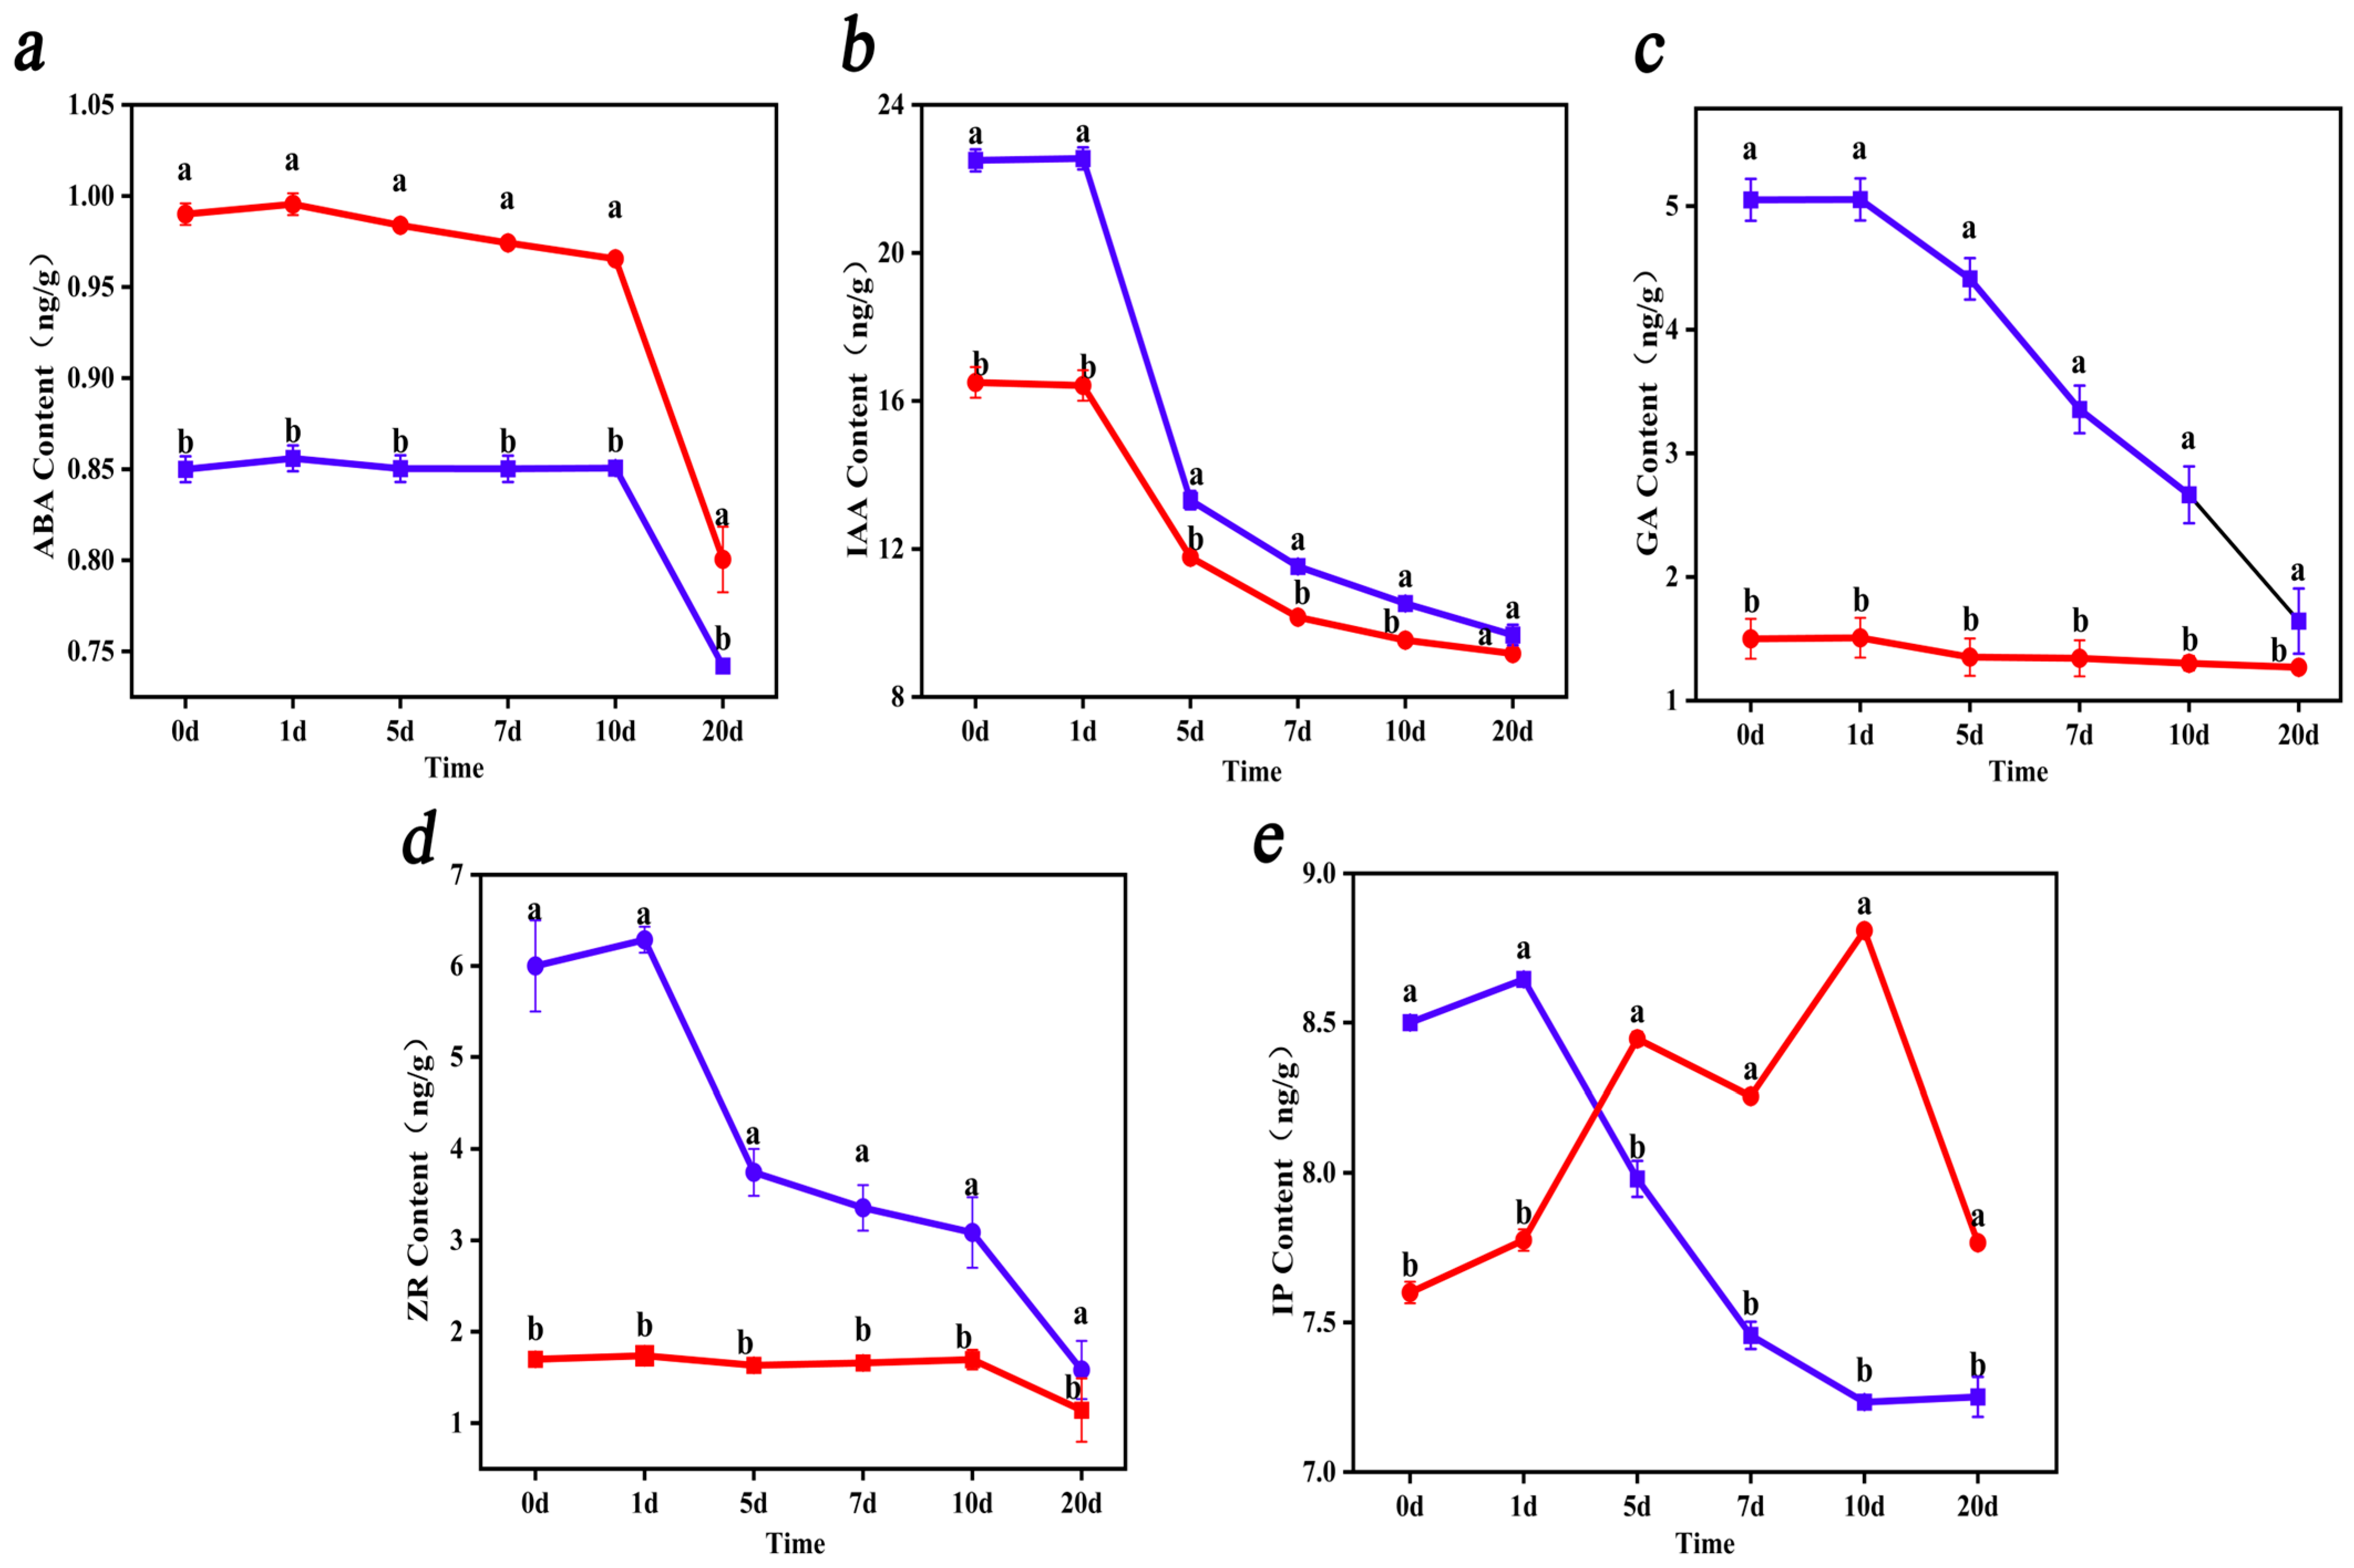
The rolB gene significantly increased the content of endogenous IAA, GA3, and ZR during the formation of adventitious roots and decreased the content of endogenous ABA (Figure 4a). The endogenous IAA content of transgenic (DB) and WT ‘duli’ (D) did not significantly differ, and the endogenous IAA content of transgenic ‘duli’ and WT ‘duli’ was 56.89% and 44.42% lower at 20 days of rooting treatment (Figure 4b), respectively, than at 0 days. No significant changes in the endogenous GA3 and ZR content of WT ‘duli’ within 20 days of rooting were observed (Figure 4c,d); no significant changes were observed in the endogenous GA3 and ZR of transgenic ‘duli’ within 10 days of rooting, but a rapid decrease in the content of GA3 and ZR was observed after 10 days. The endogenous ABA content in transgenic ‘duli’ and WT ‘duli’ did not change significantly within 10 days of rooting, but decreased significantly after 10 days. Differences in the endogenous IP (Isoamyl alkenyl adenine) content of transgenic and WT ‘duli’ were observed (Figure 4e).

3.4. Transcriptomic Analysis During Adventitious Root Formation in rolB-Transformed ‘Duli’

3.4.1. Differentially Expressed Genes (DEGs) During Adventitious Root Development in rolB-Transformed ‘Duli’

Venn diagram analysis of the DEGs at each rooting time point (0 d, 1 d, 5 d, 10 d, 10 d, 20 d) of the five comparison groups (DB0vsD0, DB1vsD1, DB5vsD5, DB10vsD10, DB20vsD20) revealed 1474 DEGs involved in the adventitious root development of transgenic ‘duli’ and WT ‘duli’ at different stages, of which 726 were jointly up-regulated and 748 were jointly down-regulated (Figure 5).

3.4.2. GO Enrichment Analysis of DEGs

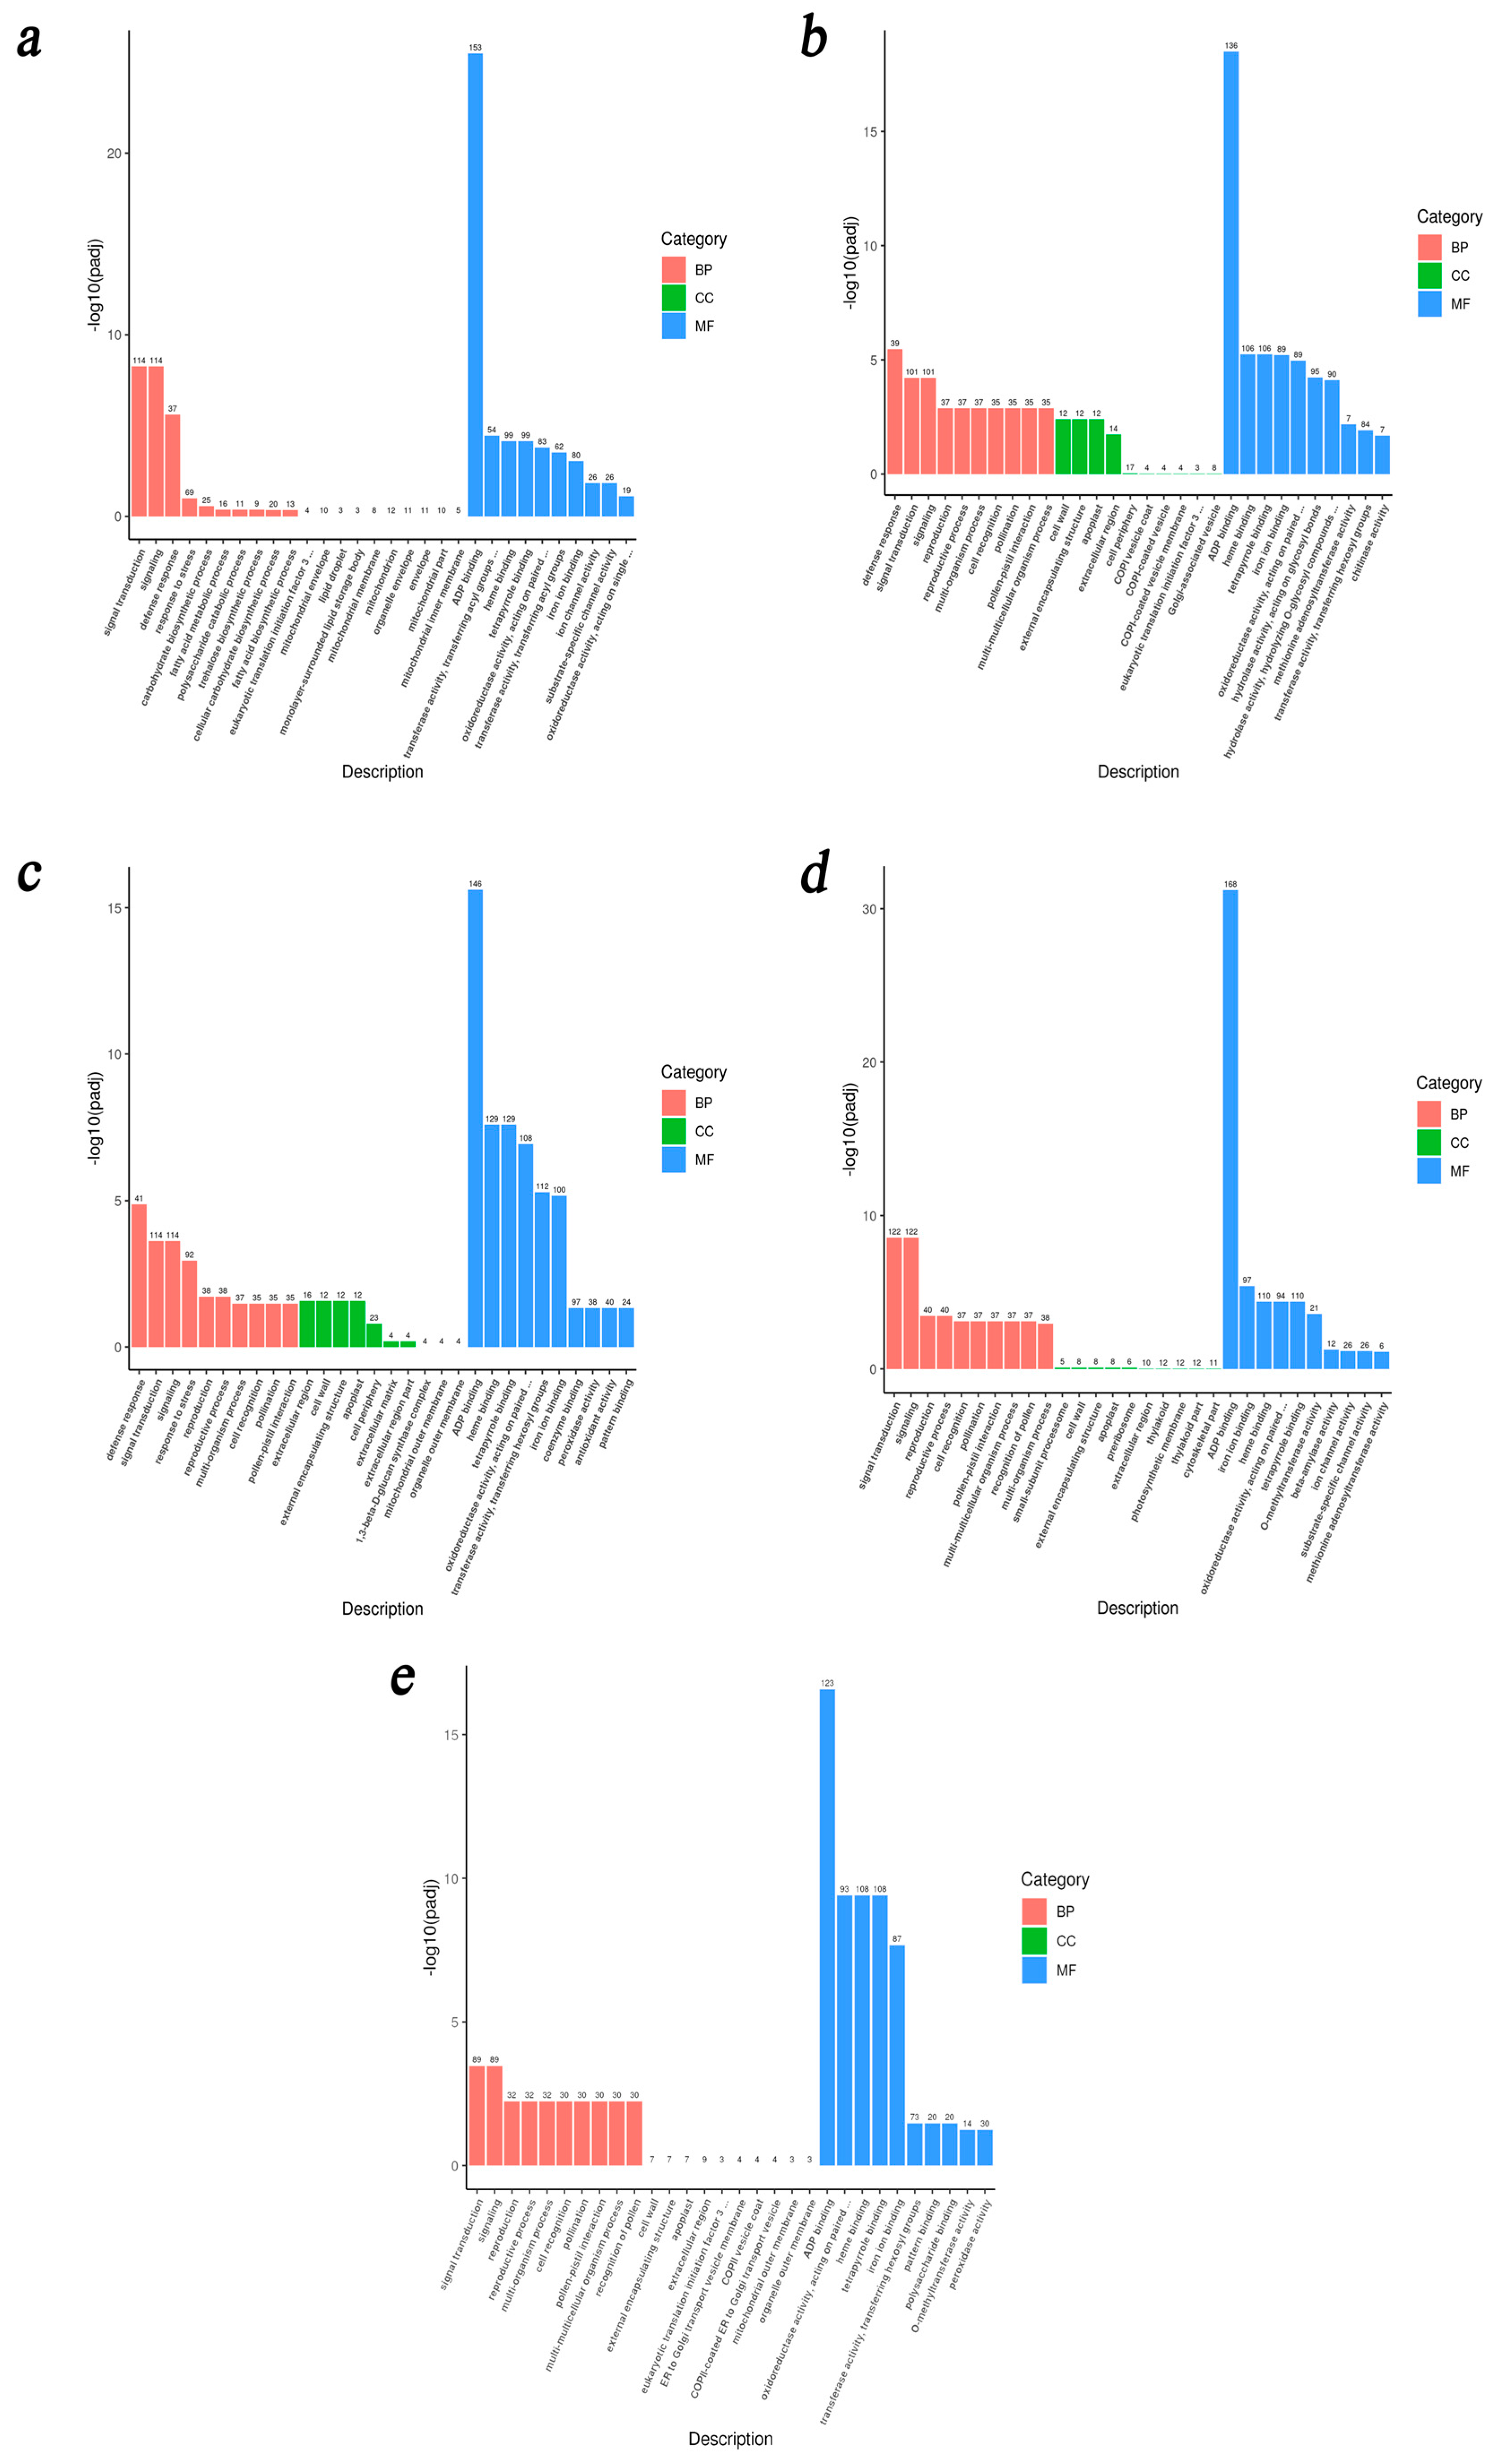
GO functional annotations were divided into three categories: Biological Process (BP), Cellular Component (CC), and Molecular Function (MF) (Table 1). GO functional analysis revealed significant associations between DEGs and different developmental stages of adventitious root formation in both rolB-transformed and WT ‘duli’ plants. Among the DEGs identified, MF annotations encompassed the largest number of genes, particularly those involved in signal transduction and reproductive processes (Figure 6). This was followed by BP, which included DEGs related to ADP binding, heme binding, tetrapyrrole binding, oxidoreductase activity, transferase activity, and iron ion binding, and CC, which included DEGs that were enriched in cell wall, external encapsulating structure, and apoplast, especially between day 1 and day 5.

3.4.3. KEGG Pathway Enrichment Analysis of DEGs

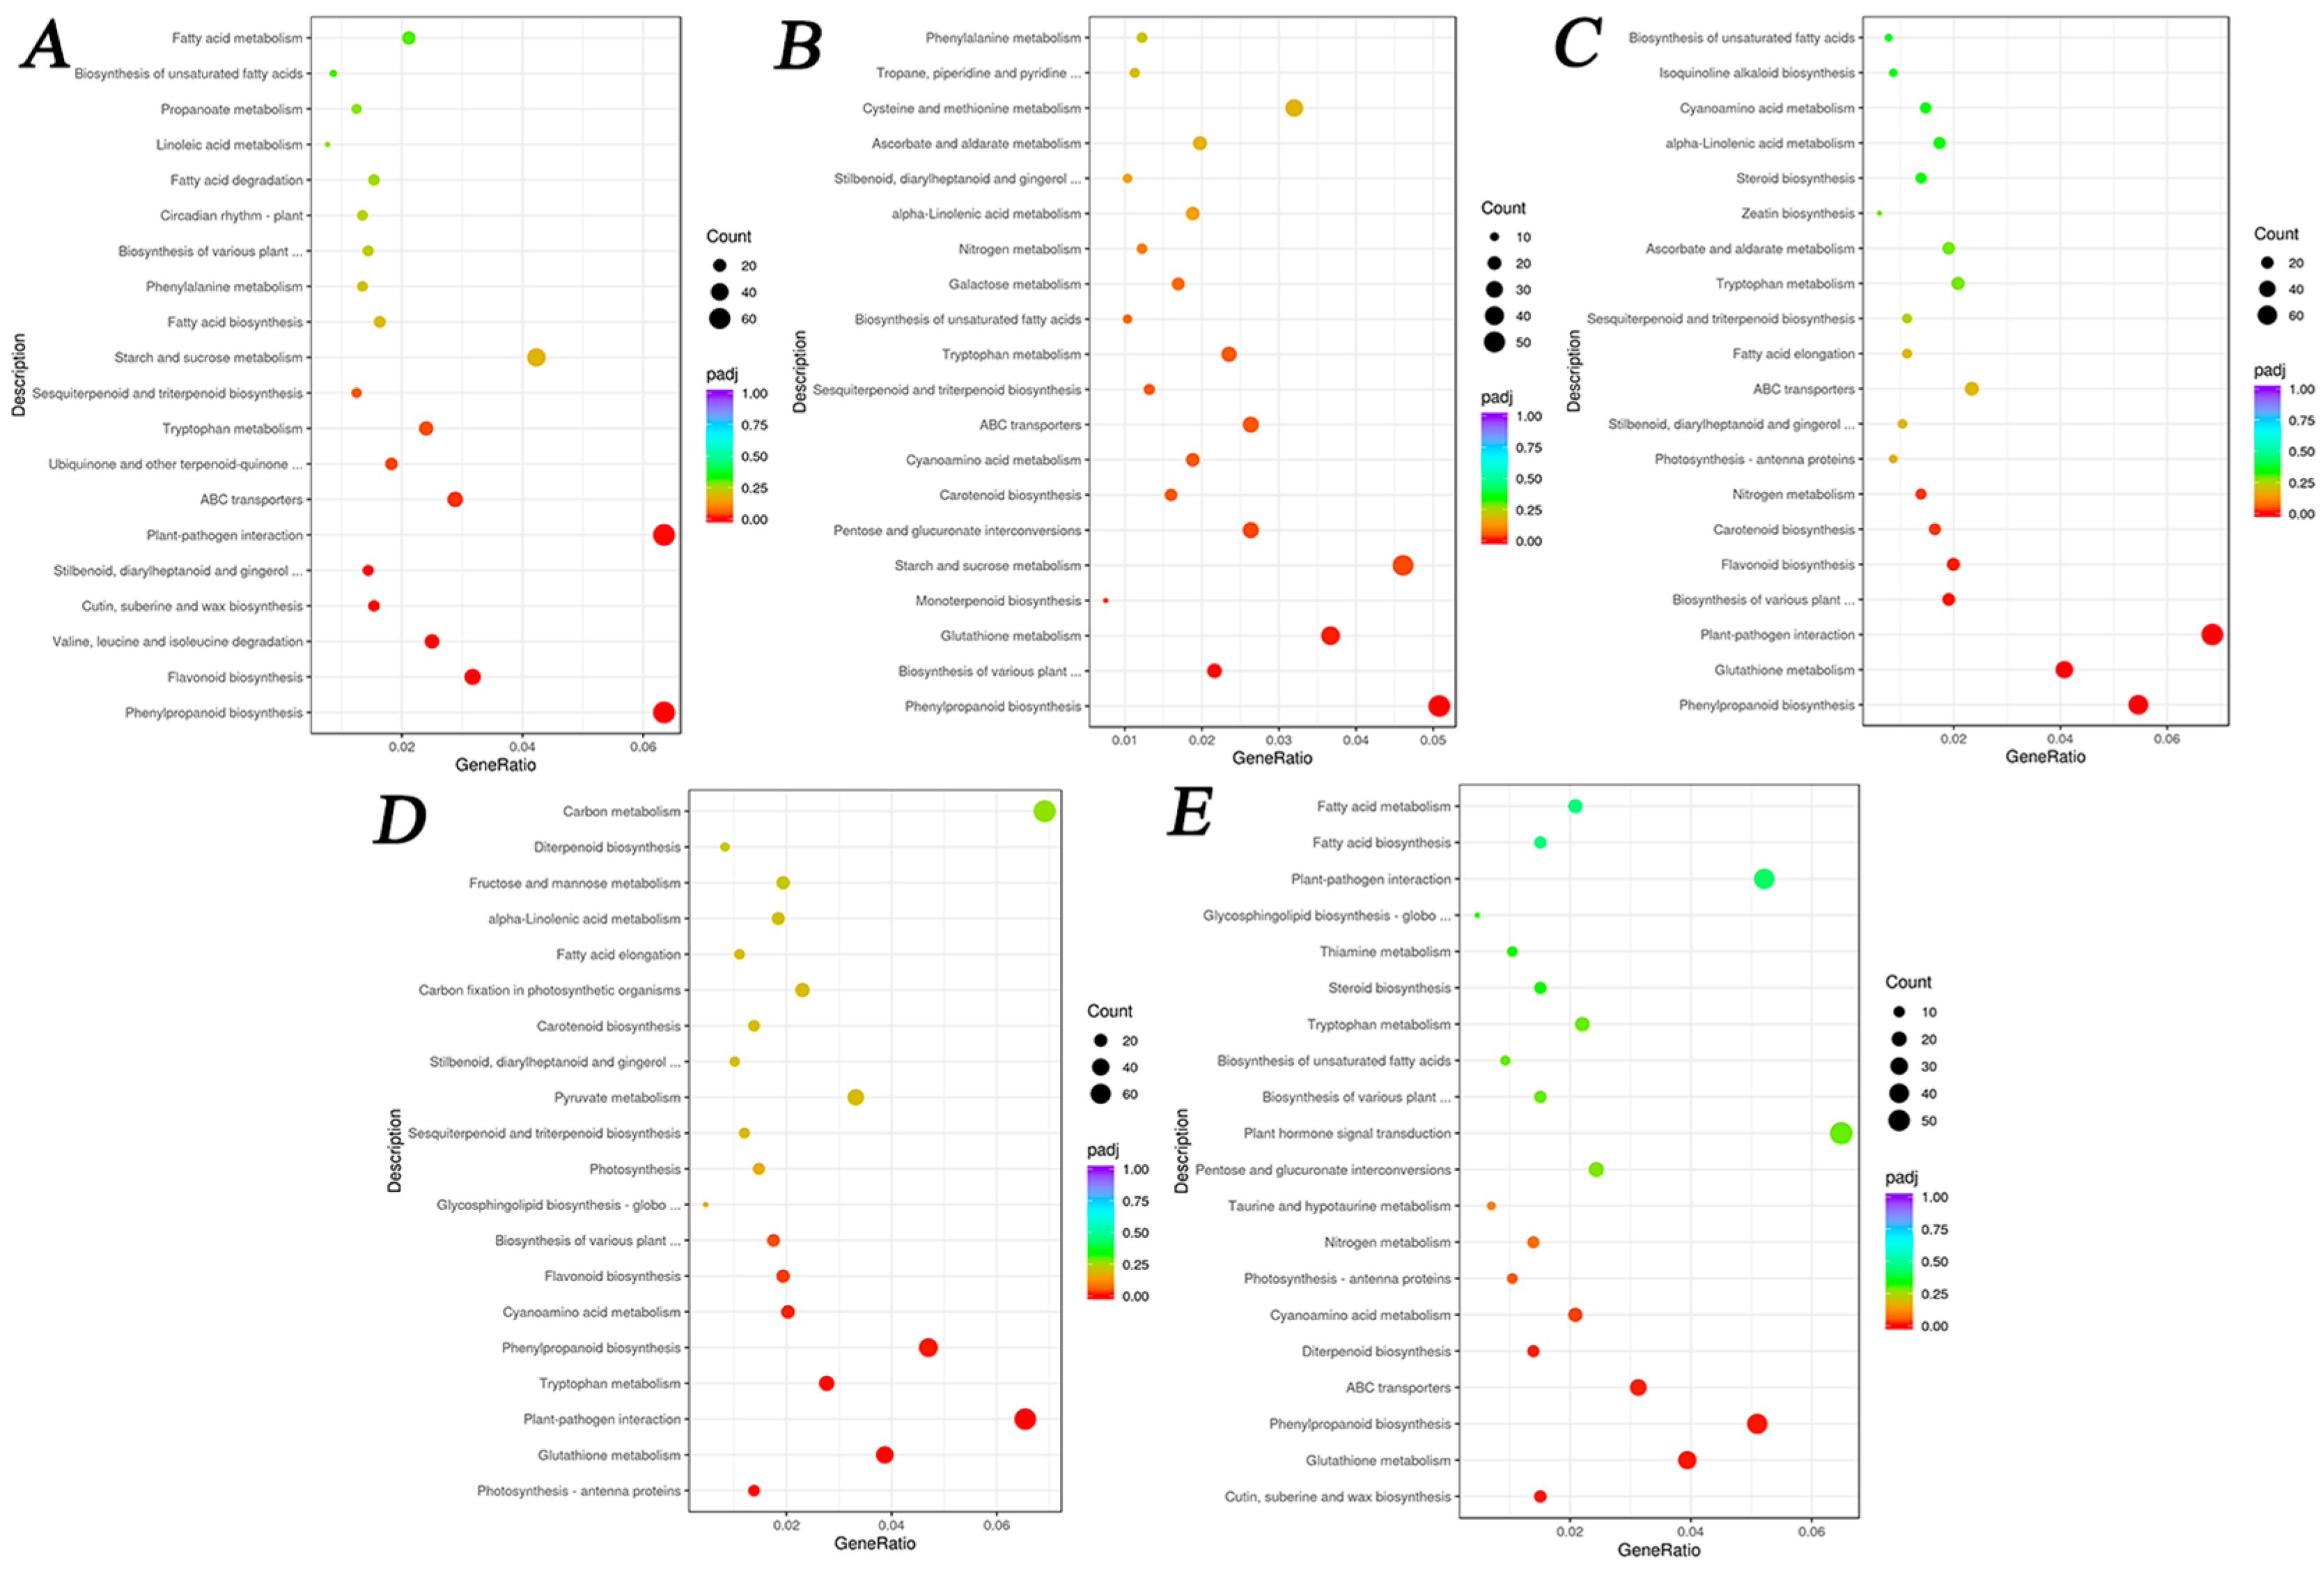
KEGG pathway enrichment analysis was conducted for both rolB-transformed and WT ‘duli’ (Figure 7). The enriched pathways were primarily associated with phenylpropanoid biosynthesis, glutathione metabolism, ABC transporters, tryptophan metabolism, and sesquiterpenoid and triterpenoid biosynthesis. Temporal variation in pathway enrichment was also observed. From day 1 to day 10, enrichment progressively shifted toward glutathione metabolism and other plant secondary metabolic pathways, and significant increases were observed in the biosynthesis of compounds such as flavonoids and carotenoids, as well as metabolic processes involving galactose and nitrogen.

3.5. WGCNA

3.5.1. Identification of DEG Co-Expression Modules

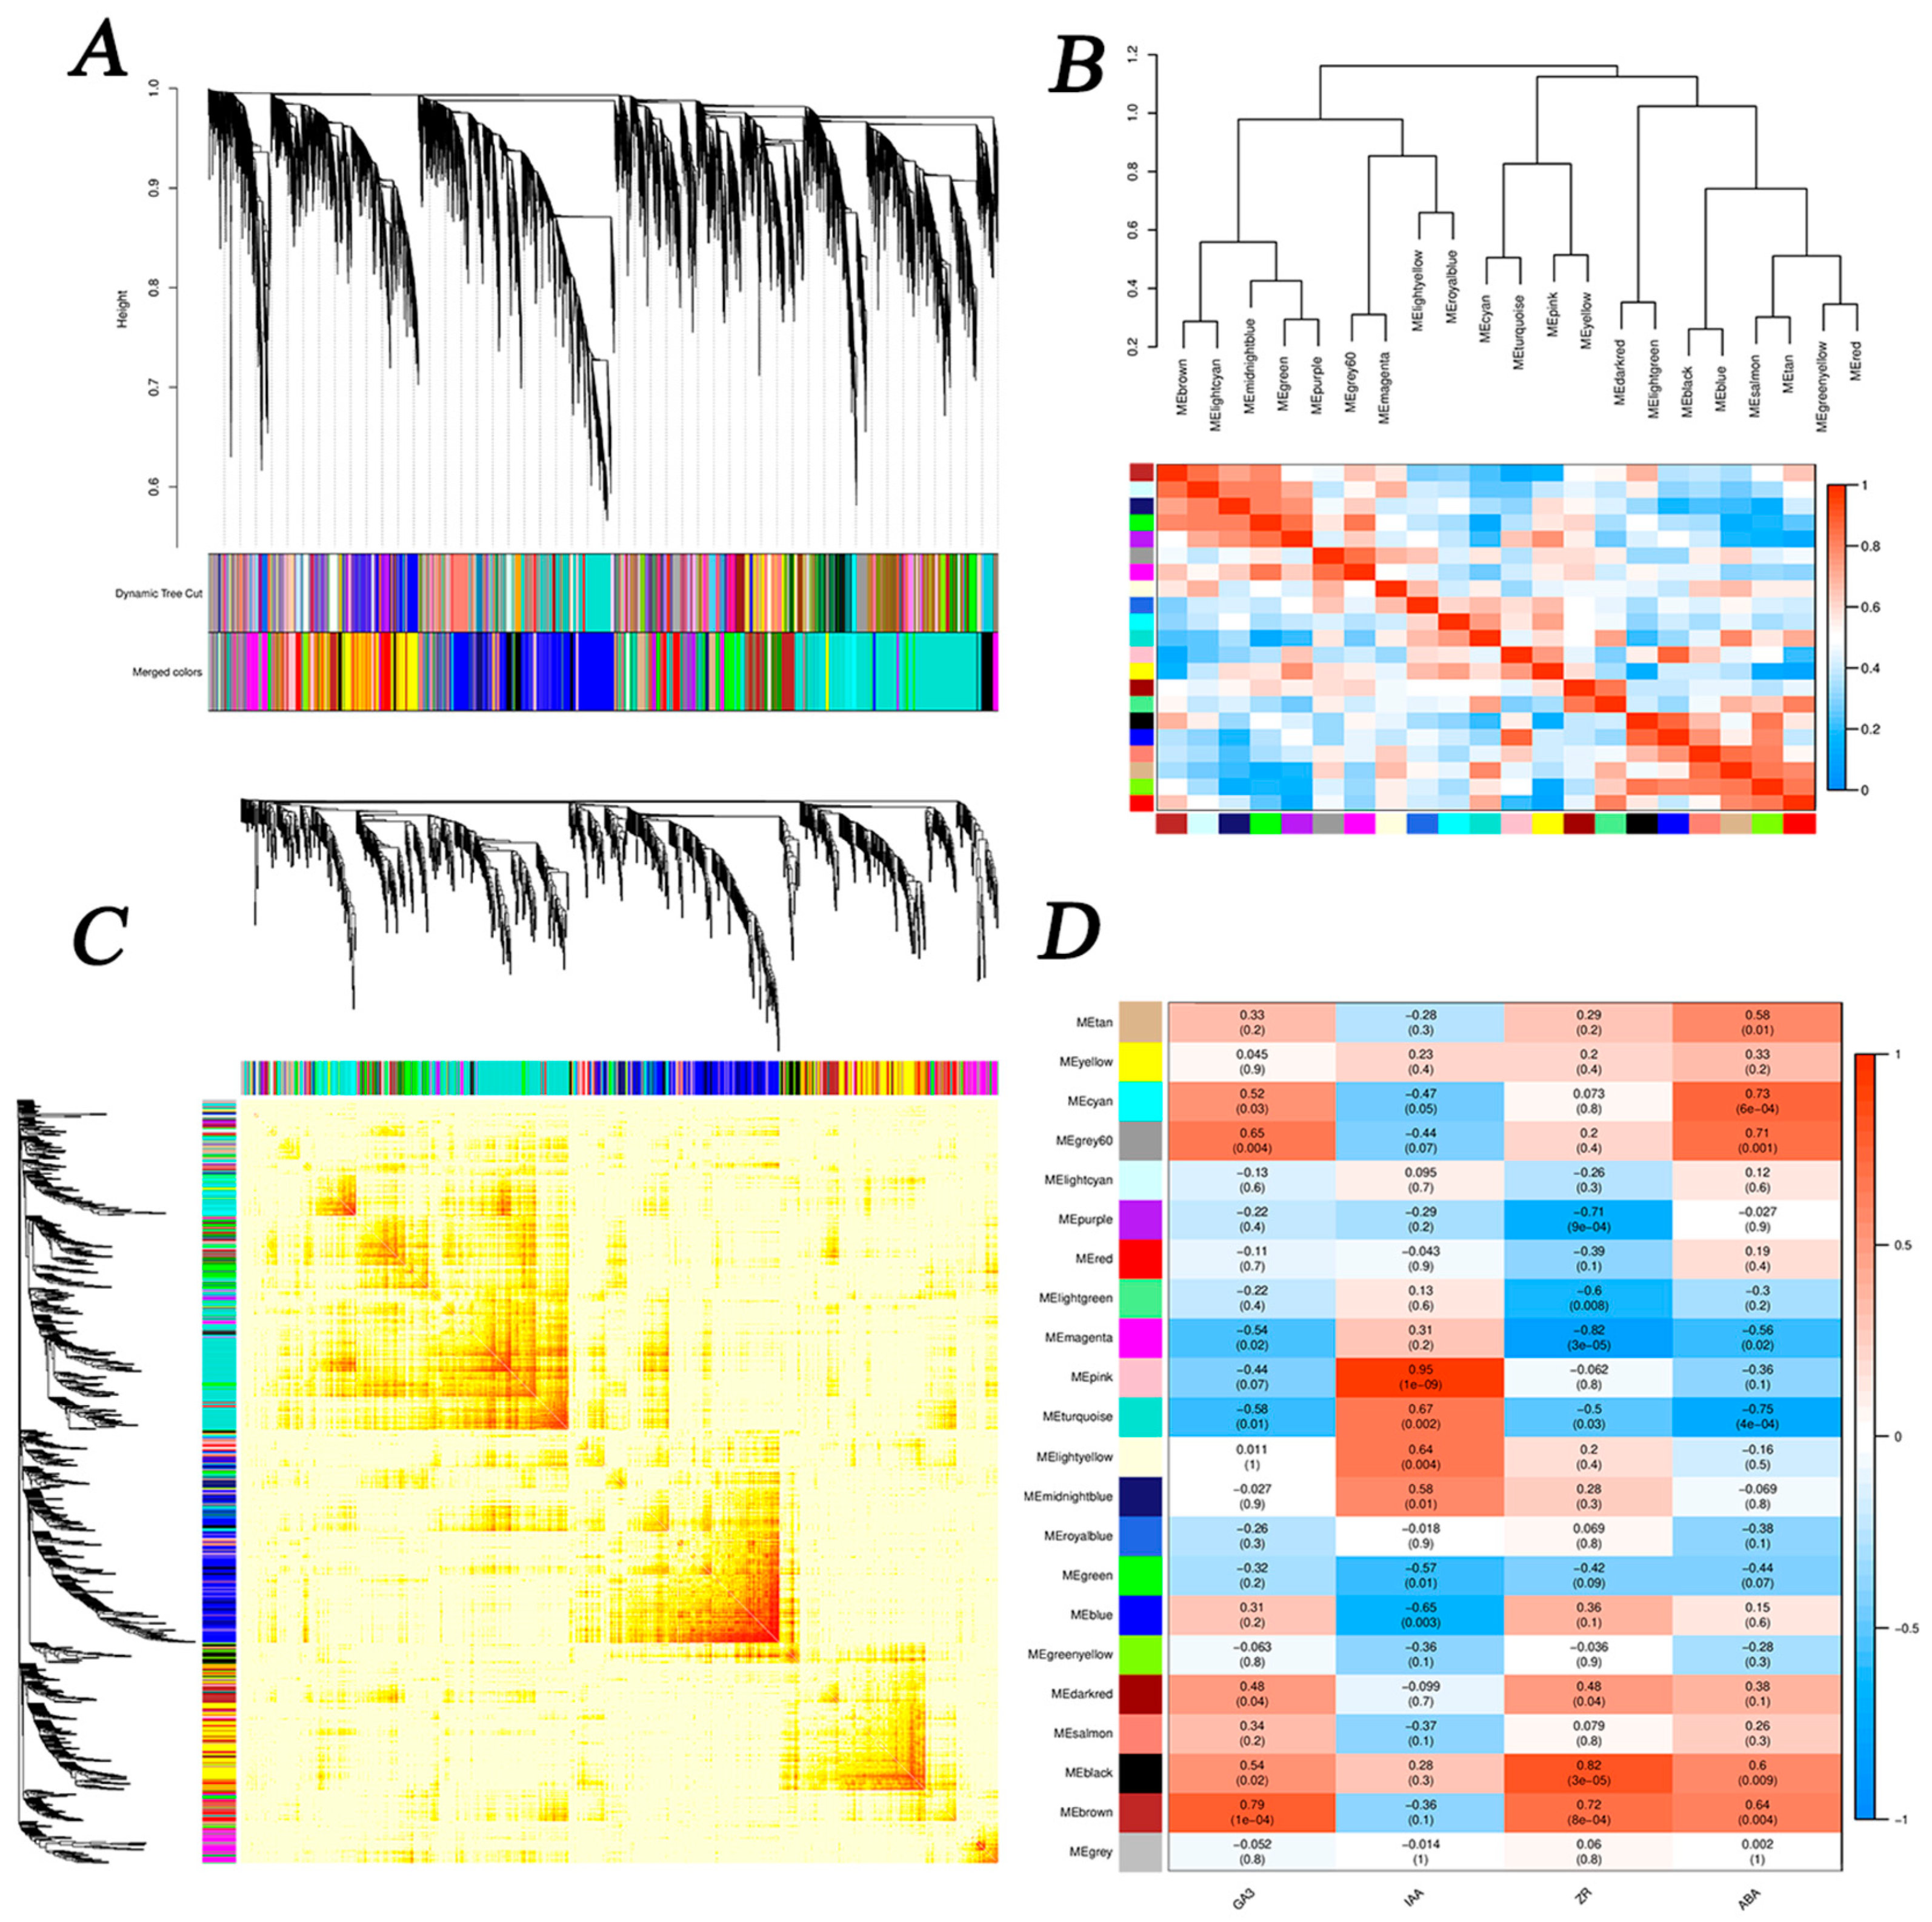
A total of 22 co-expression modules were identified. As shown in the Figure, indicating that our gene co-expression module clustering was robust and suitable for further analysis (Figure 8). We then examined the differential expression patterns of genes during different stages of adventitious root development in both rolB-transformed and WT ‘duli’ lines. Previous studies have suggested that adventitious root growth in ‘duli’ is primarily regulated by hormones. Therefore, we selected four modules, pink, brown, cyan, and black, that were strongly positively correlated with various hormones for further analysis.

3.5.2. IAA-Related Modules and DEG Enrichment Analysis

In the pink module, which was strongly positively correlated with the IAA content, a total of 1454 DEGs were identified (Figure 9a). These DEGs showed increased expression levels in rolB-transformed ‘duli’ at day 1 and 5 of rooting, and in WT plants at day 1 of rooting. GO enrichment analysis revealed that these DEGs were significantly enriched in BPs such as ncRNA and tRNA metabolic processes, transport and localization of intracellular macromolecules, and cellular amino acid metabolic processes (Figure 9b). KEGG pathway enrichment analysis indicated that the DEGs were significantly associated with pathways such as Ribosome, Proteasome, Nucleocytoplasmic transport, and Biosynthesis of amino acids and cofactors (Figure 9c). PPI network analysis identified several highly connected genes, including GUAA, EF1G2, PPR29, RL40, RRP3, and RL4 (Figure 9d). Several genes involved in IAA biosynthesis pathways were significantly up-regulated in rolB-transformed ‘duli’ from day 5 to 20, including ALDO1 genes, and these genes were down-regulated in WT plants. Additionally, genes involved in IAA biosynthesis, such as YUC4, YUC6, YUC3, and YUC10, were up-regulated in transgenic plants at day 0 and 1 of rooting but showed low or no expression in WT plants (Figure 9e). For auxin polar transport, which is mainly facilitated by the auxin influx carriers AUX1 and LAX, the efflux carrier PIN, and ABCB proteins, the expression of GSTX4 and GSTX1 was significantly up-regulated in rolB-transformed plants compared with WT plants at day 1; these genes were down-regulated or not expressed in WT plants. From 5 to 20 days, additional genes such as GSTF, GSTX1, GSTL3, and GSTF9 were significantly up-regulated in transgenic plants, and these genes were down-regulated or not expressed in WT plants. ARF1, AUXI2, and IAA1 in the IAA signaling pathway were significantly down-regulated at 20 days in rolB-transformed plants, and these genes were significantly up-regulated in WT plants. Conversely, genes such as AUX28, IAA16, AUXI2, and IAA8 were significantly up-regulated at 20 days in rolB-transformed plants but significantly down-regulated in WT plants.

3.5.3. DEG Enrichment Analysis of GA3-Related Modules

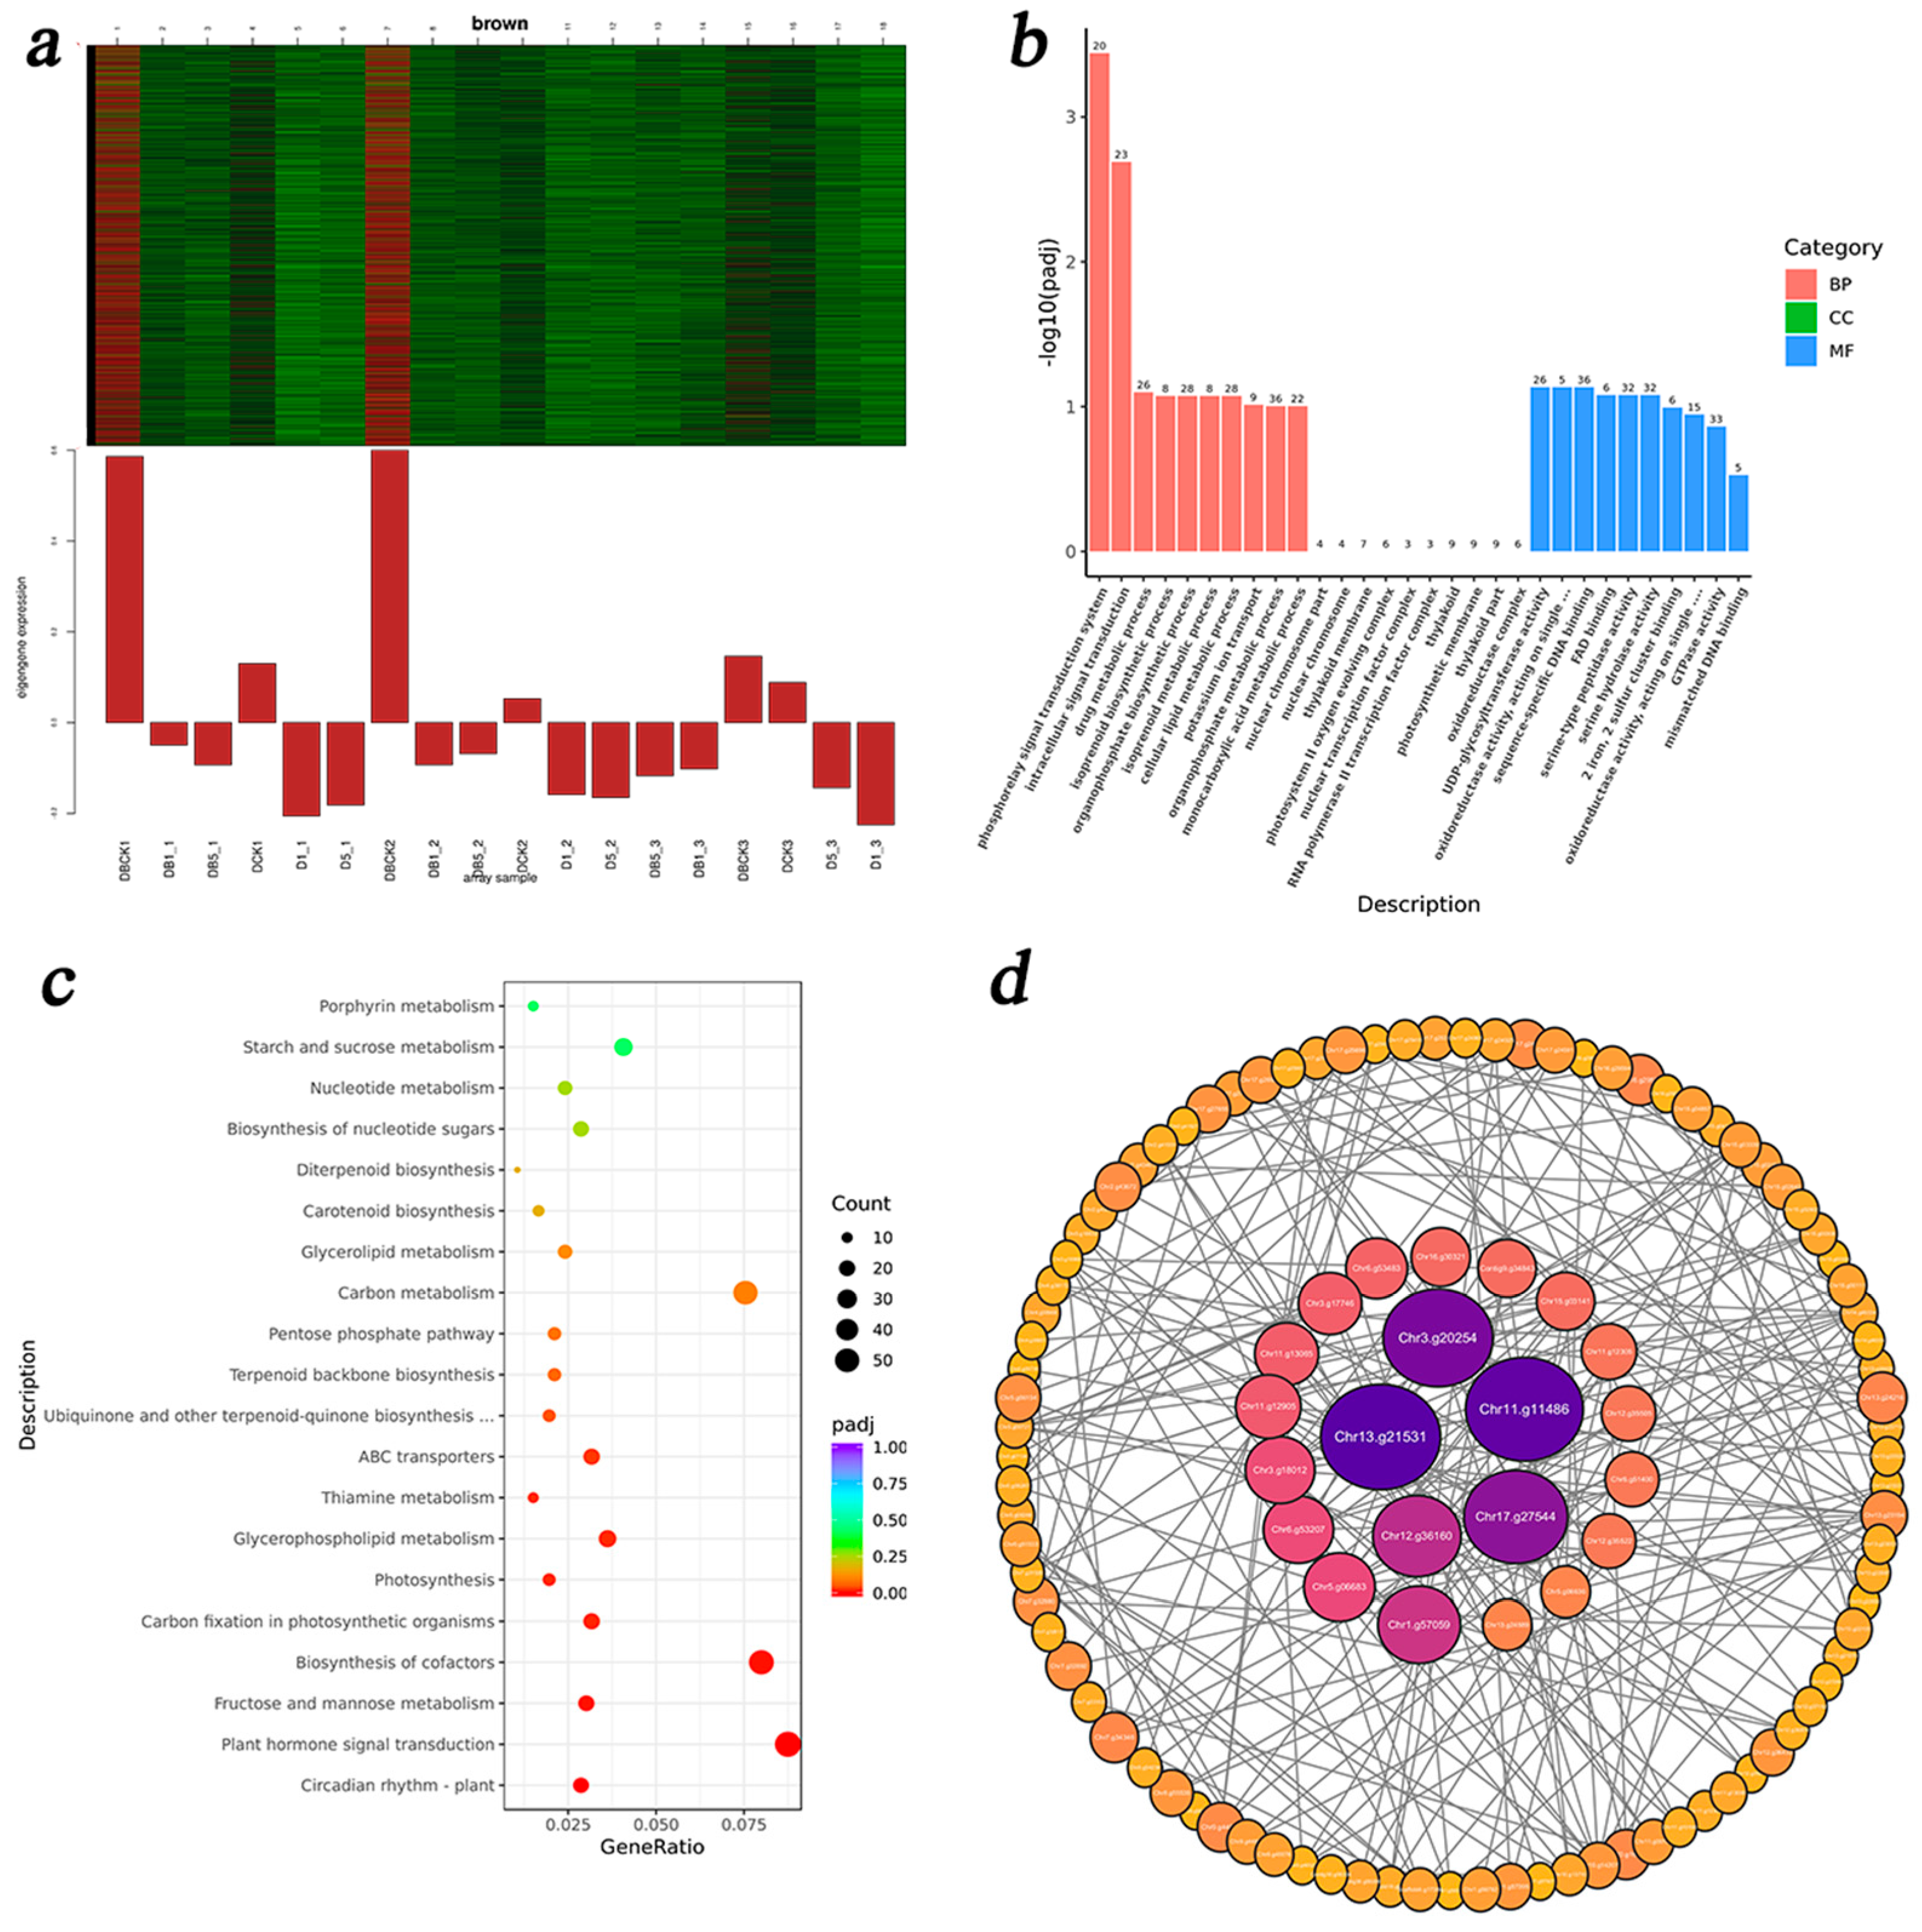
In the brown module, which was strongly positively correlated with the GA3 content, a total of 3623 DEGs were identified (Figure 10a). These DEGs showed increased expression levels in both rolB-transformed ‘duli’ and WT ‘duli’ at day 0 of rooting. GO enrichment analysis indicated that these DEGs were significantly enriched in BPs related to phosphorelay signal transduction and intracellular signal transduction (Figure 10b). KEGG pathway enrichment analysis revealed significant associations with pathways such as Circadian rhythm-plant, Plant hormone signal transduction, and Fructose and mannose metabolism (Figure 10c). PPI network analysis identified several highly connected genes, including TO401, RK4, RIN1, P4KB1, P5CS, and LSF2 (Figure 10d).
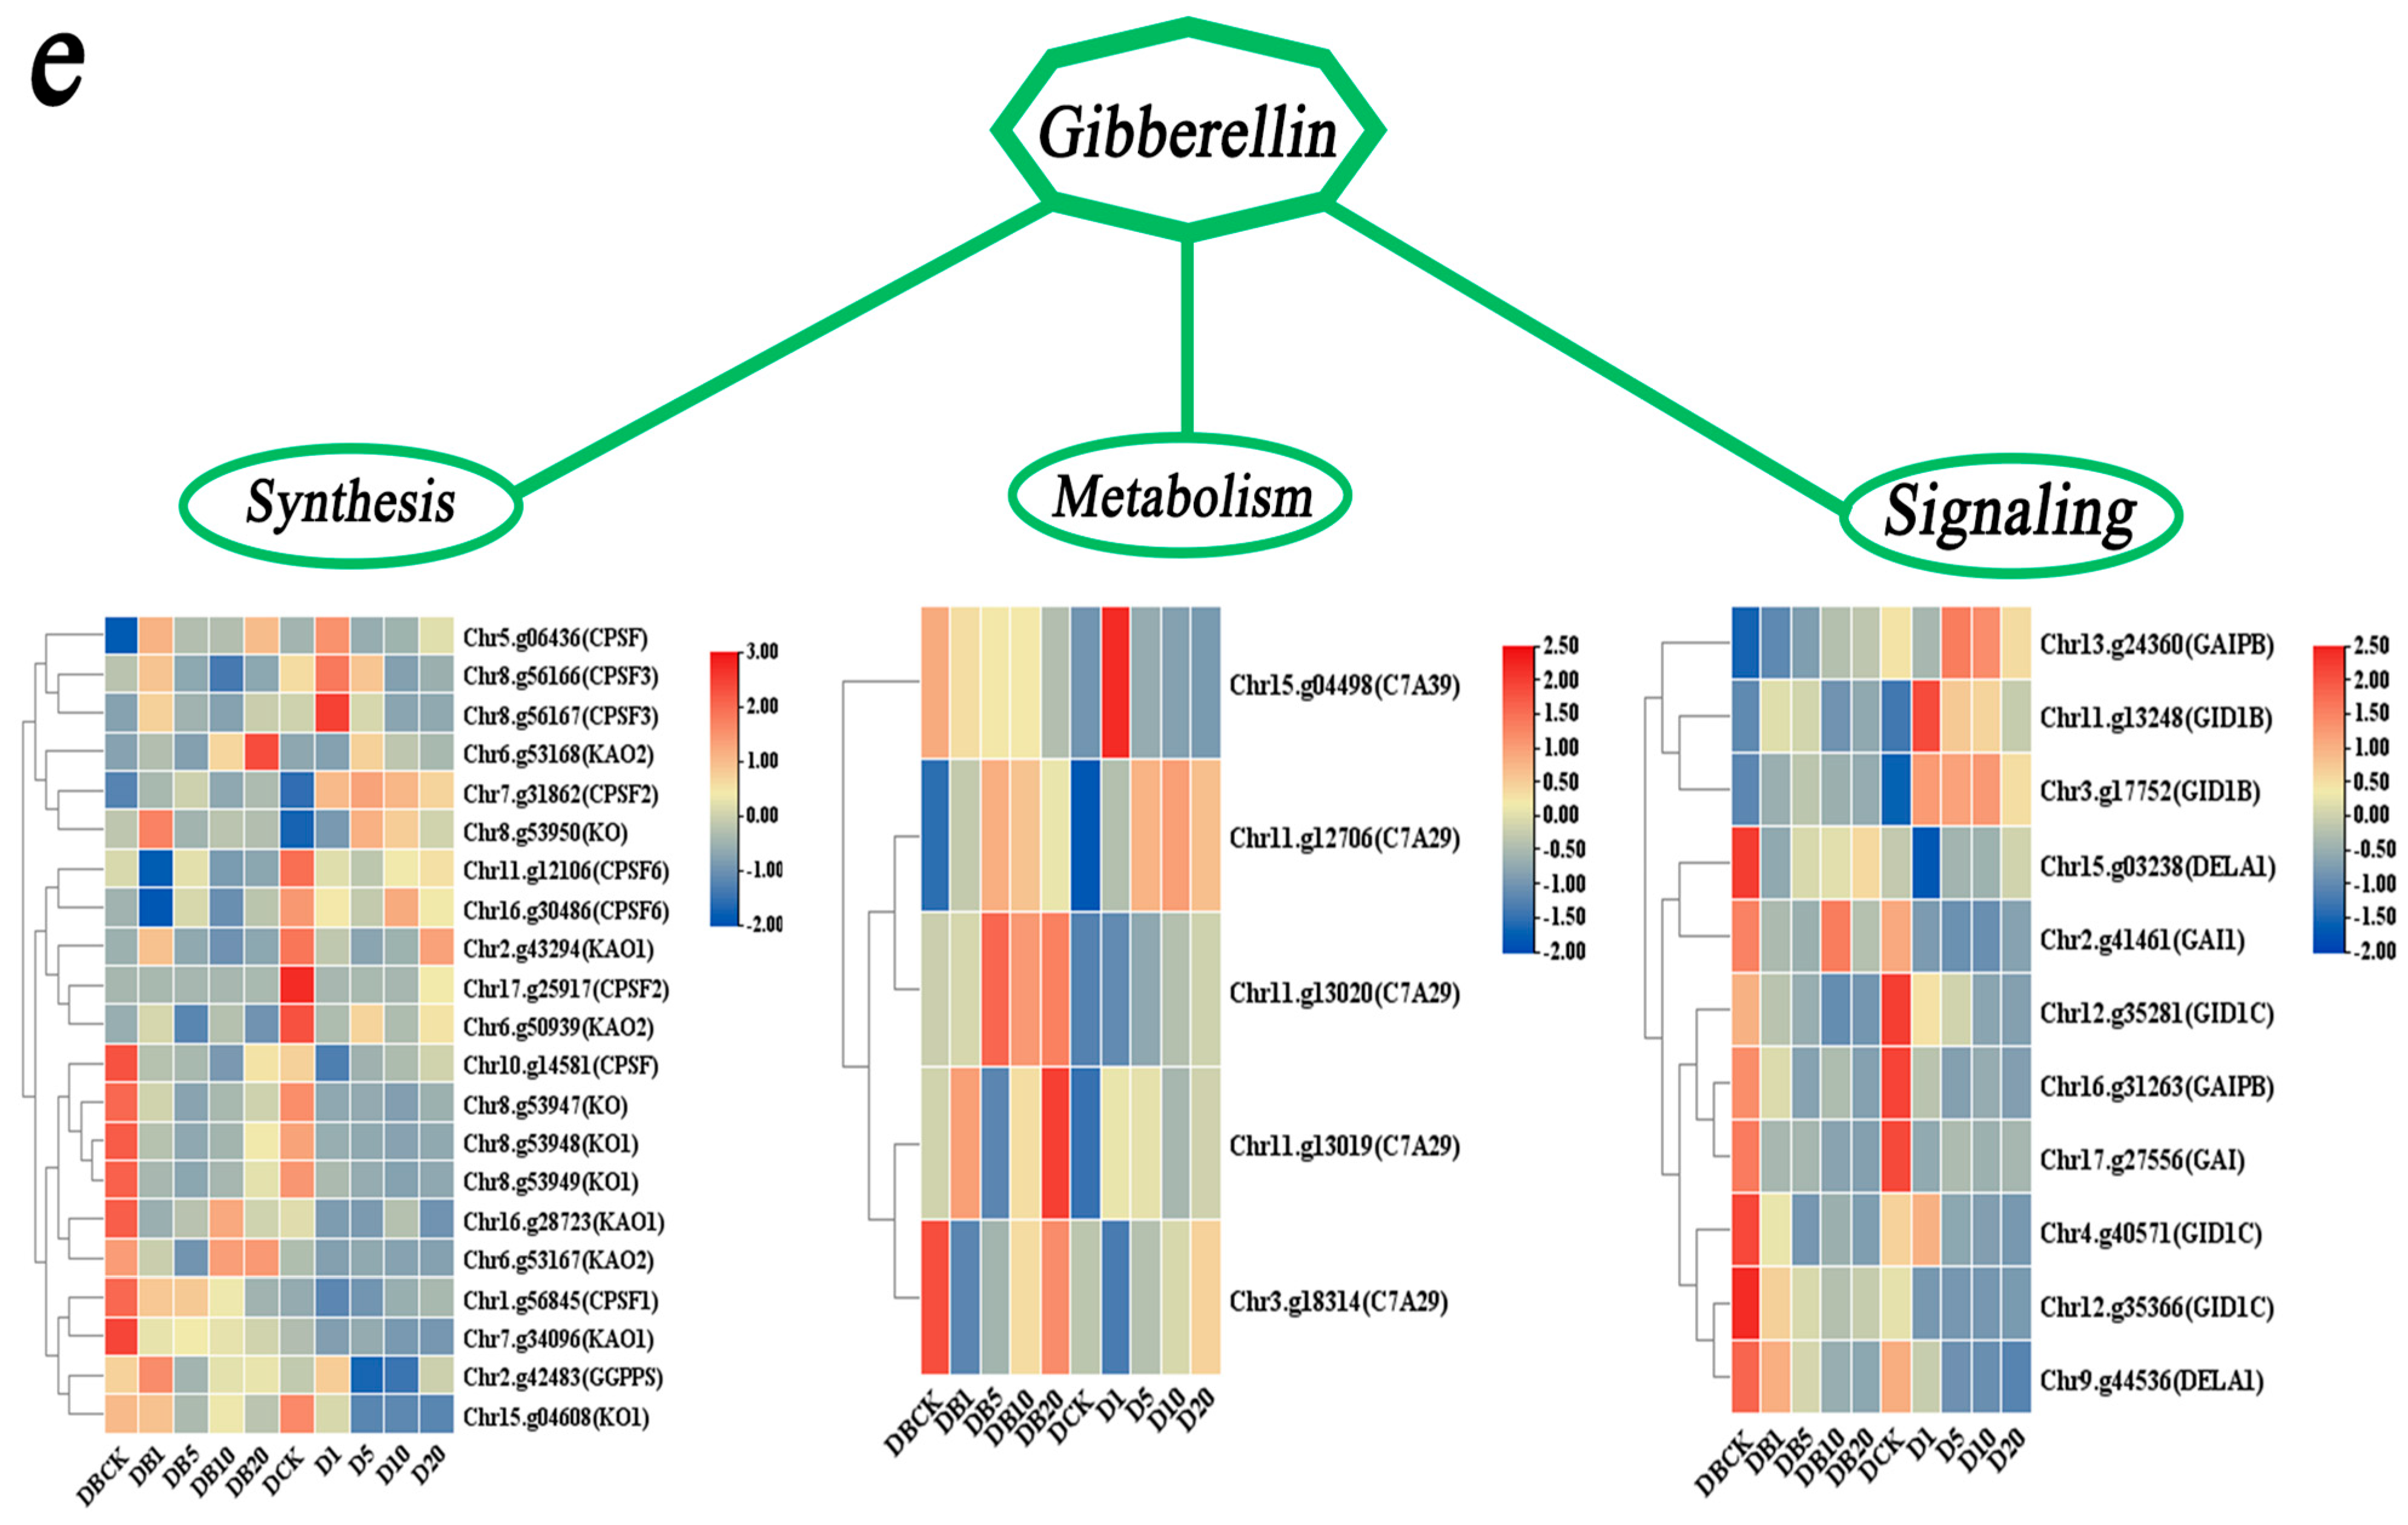
In the GA biosynthesis pathway, genes such as CPSF, KO1, KAO1, and KAO2 were significantly up-regulated in rolB-transformed plants at 0 days (Figure 10e), and these genes were down-regulated or weakly expressed in WT plants. At 20 days, KAO1 and CPSF1 were significantly up-regulated in transgenic plants; these genes were significantly down-regulated in WT plants.
In the GA signaling pathway, genes such as GAI1, DELA1, and GID1C were significantly up-regulated in rolB-transformed plants at 0 days, and these genes were down-regulated or weakly expressed in WT plants. At 20 days, GAIPB and GID1B were significantly down-regulated or not expressed in rolB-transformed plants, but these genes were significantly up-regulated in WT plants.

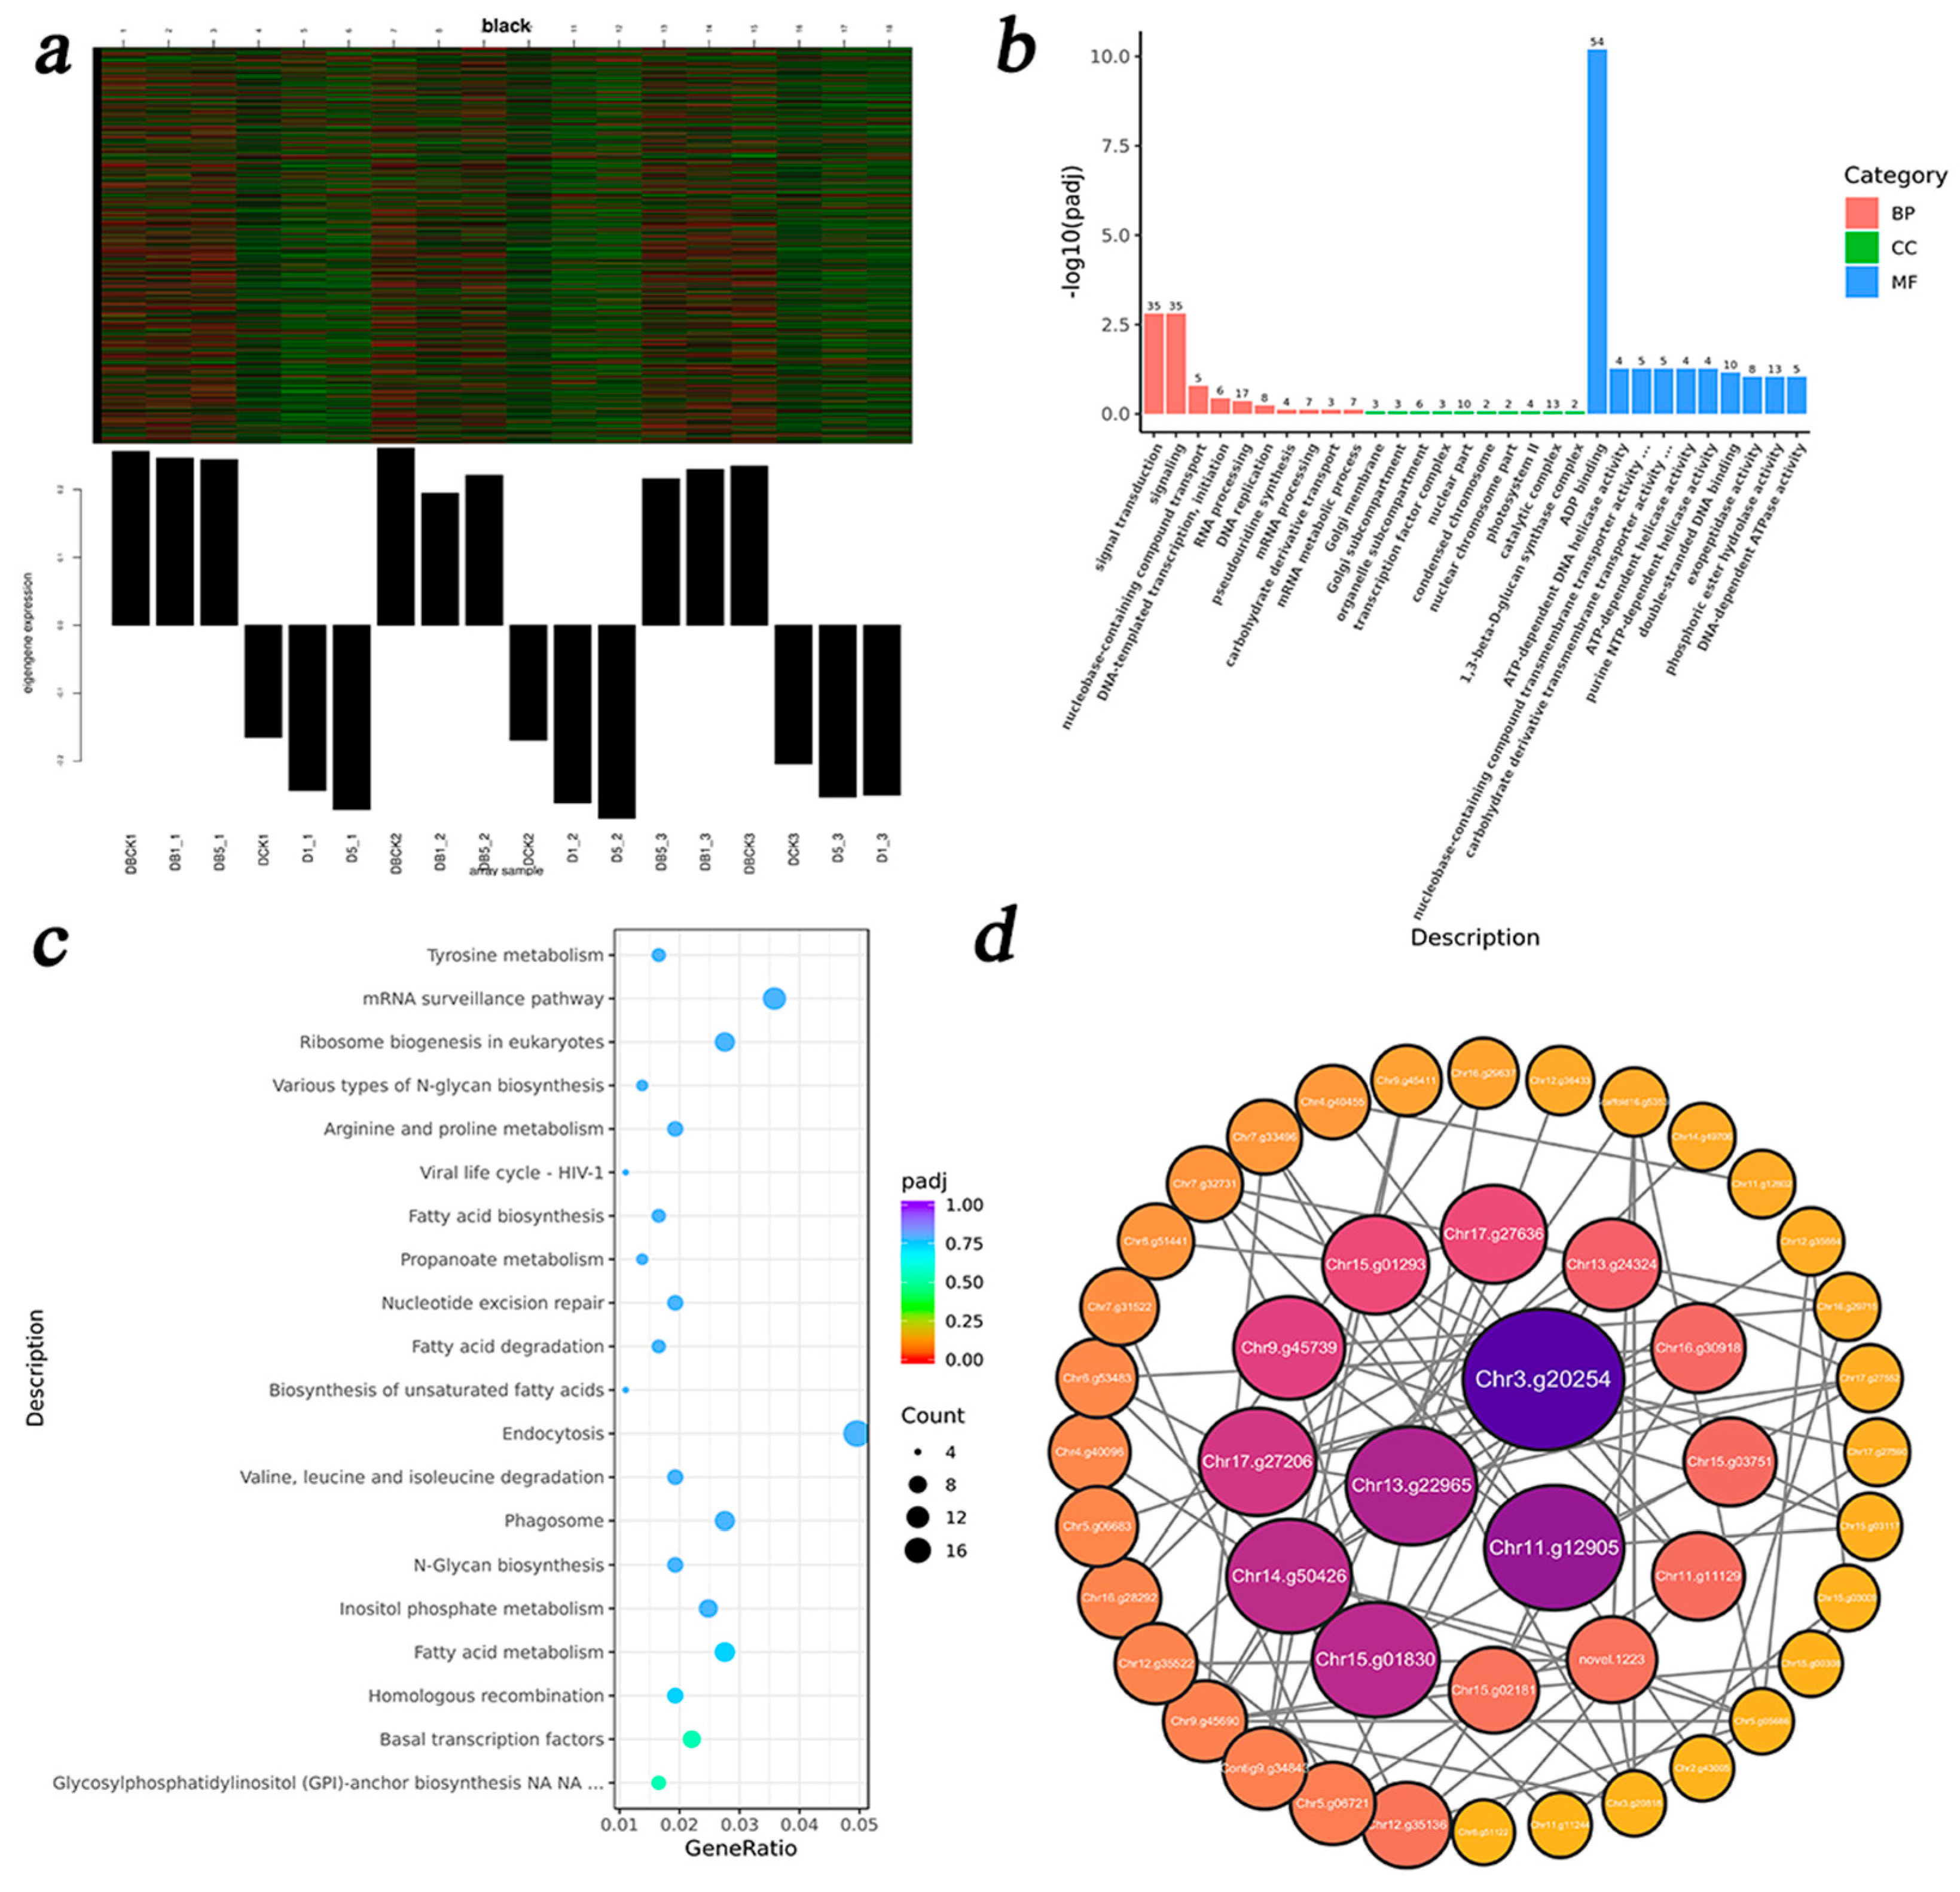
3.5.4. DEG Enrichment Analysis of ZR-Related Modules

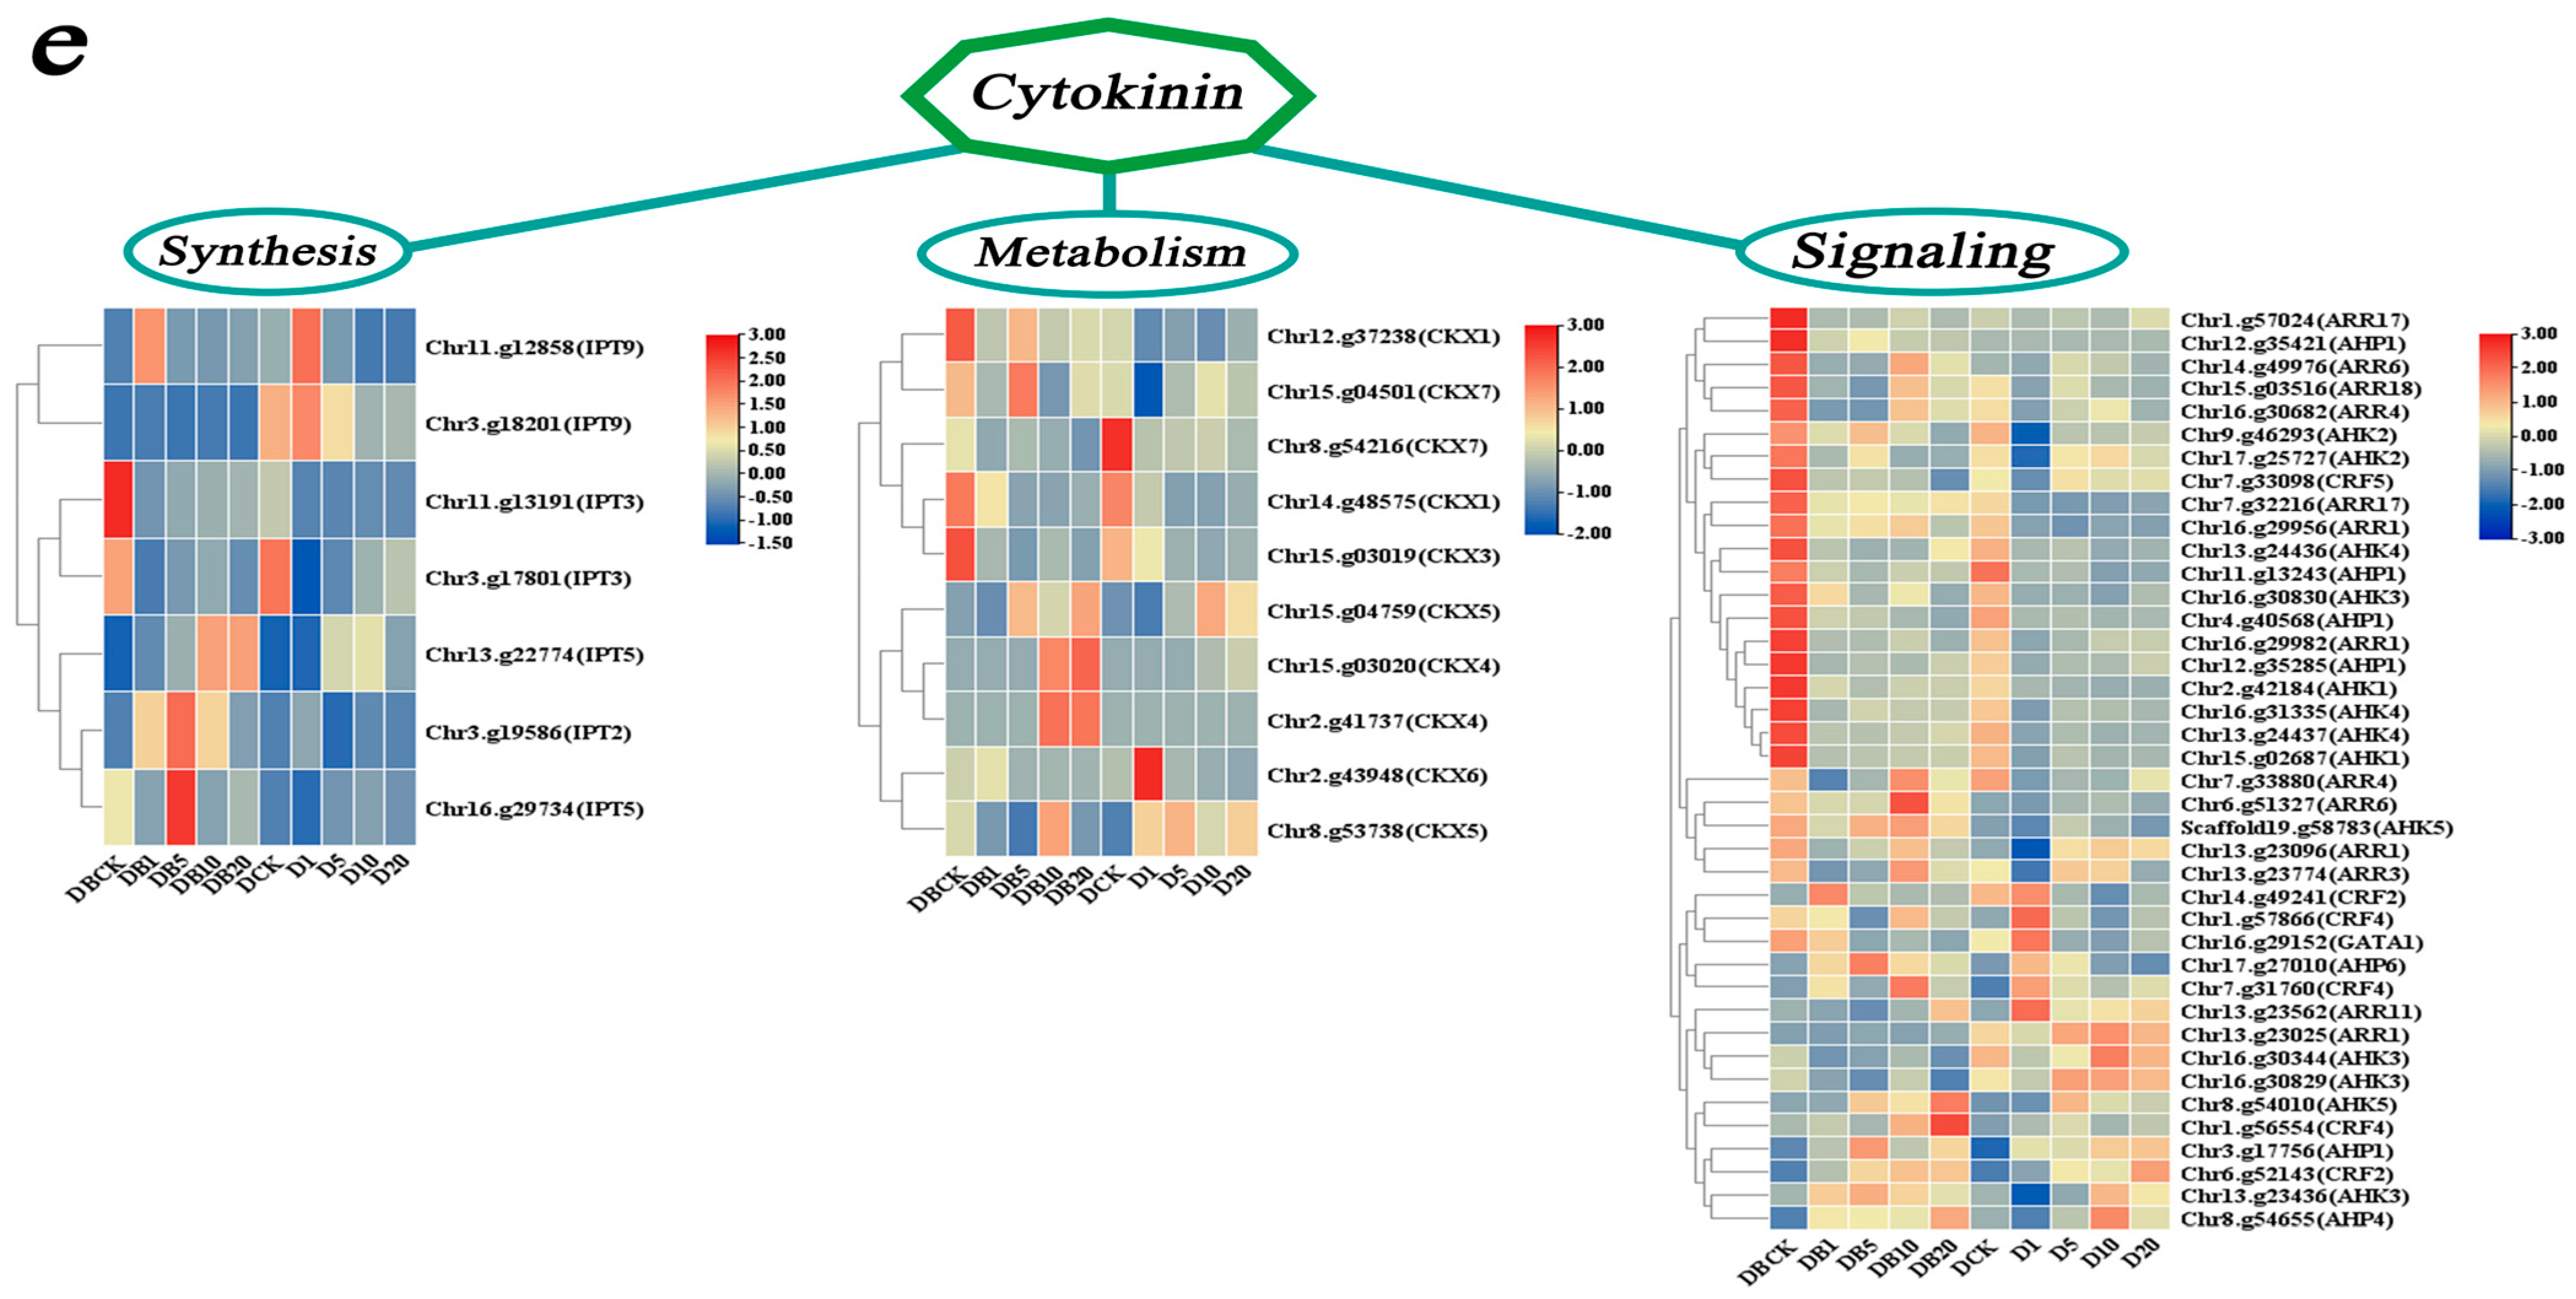
In the black module, which was strongly positively correlated with the ZR content, a total of 1518 DEGs were identified (Figure 11a). In the black module, key genes in rolB-transformed ‘duli’ were significantly up-regulated from 0 to 5 days, and these genes were significantly down-regulated in WT plants during the same period. GO enrichment analysis revealed that these DEGs were significantly enriched in BPs such as signal transduction and MFs, including ADP binding, double-stranded DNA binding, and phosphoric ester hydrolase activity (Figure 11b). KEGG pathway enrichment analysis revealed significant associations with pathways such as GPI-anchor biosynthesis, Basal transcription factors, Homologous recombination, Fatty acid metabolism, and Inositol phosphate metabolism (Figure 11c). PPI network analysis identified several highly connected genes, including RK4, UTP7, CDC16, RIO2, and CDKD1. CKX4 genes involved in CTK metabolism were significantly up-regulated in rolB-transformed ‘duli’ at 10 and 20 days, and these genes were not significantly expressed at any time point in WT plants (Figure 11d). Additionally, CKX6 was significantly up-regulated in WT plants at day 1, and CKX7 was significantly down-regulated at day 1 (Figure 11e); CKX7 was significantly up-regulated at day 0, but no significant expression was observed in rolB-transformed plants. Genes involved in CTK synthesis, such as IPT3, IPT5, and IPT2, were up-regulated in rolB-transformed plants at 0 days, 5 days, and 1, 5, and 10 days, respectively, however, these genes were either not expressed or down-regulated in WT plants. The expression of IPT3 was significantly down-regulated at day 1 in WT plants, and IPT5 was down-regulated at all time points. In the CTK signaling pathway, most components of the signaling system were up-regulated at 0 and 10 days in rolB-transformed plants, including AHP1, ARR17, CRF5, AHK1, and ARR1. In contrast, various ARR1 genes were significantly down-regulated at day 1 in WT plants, including AHK2, AHK3, AHP4, ARR1, and ARR3.

3.5.5. DEG Enrichment Analysis of ABA-Related Modules

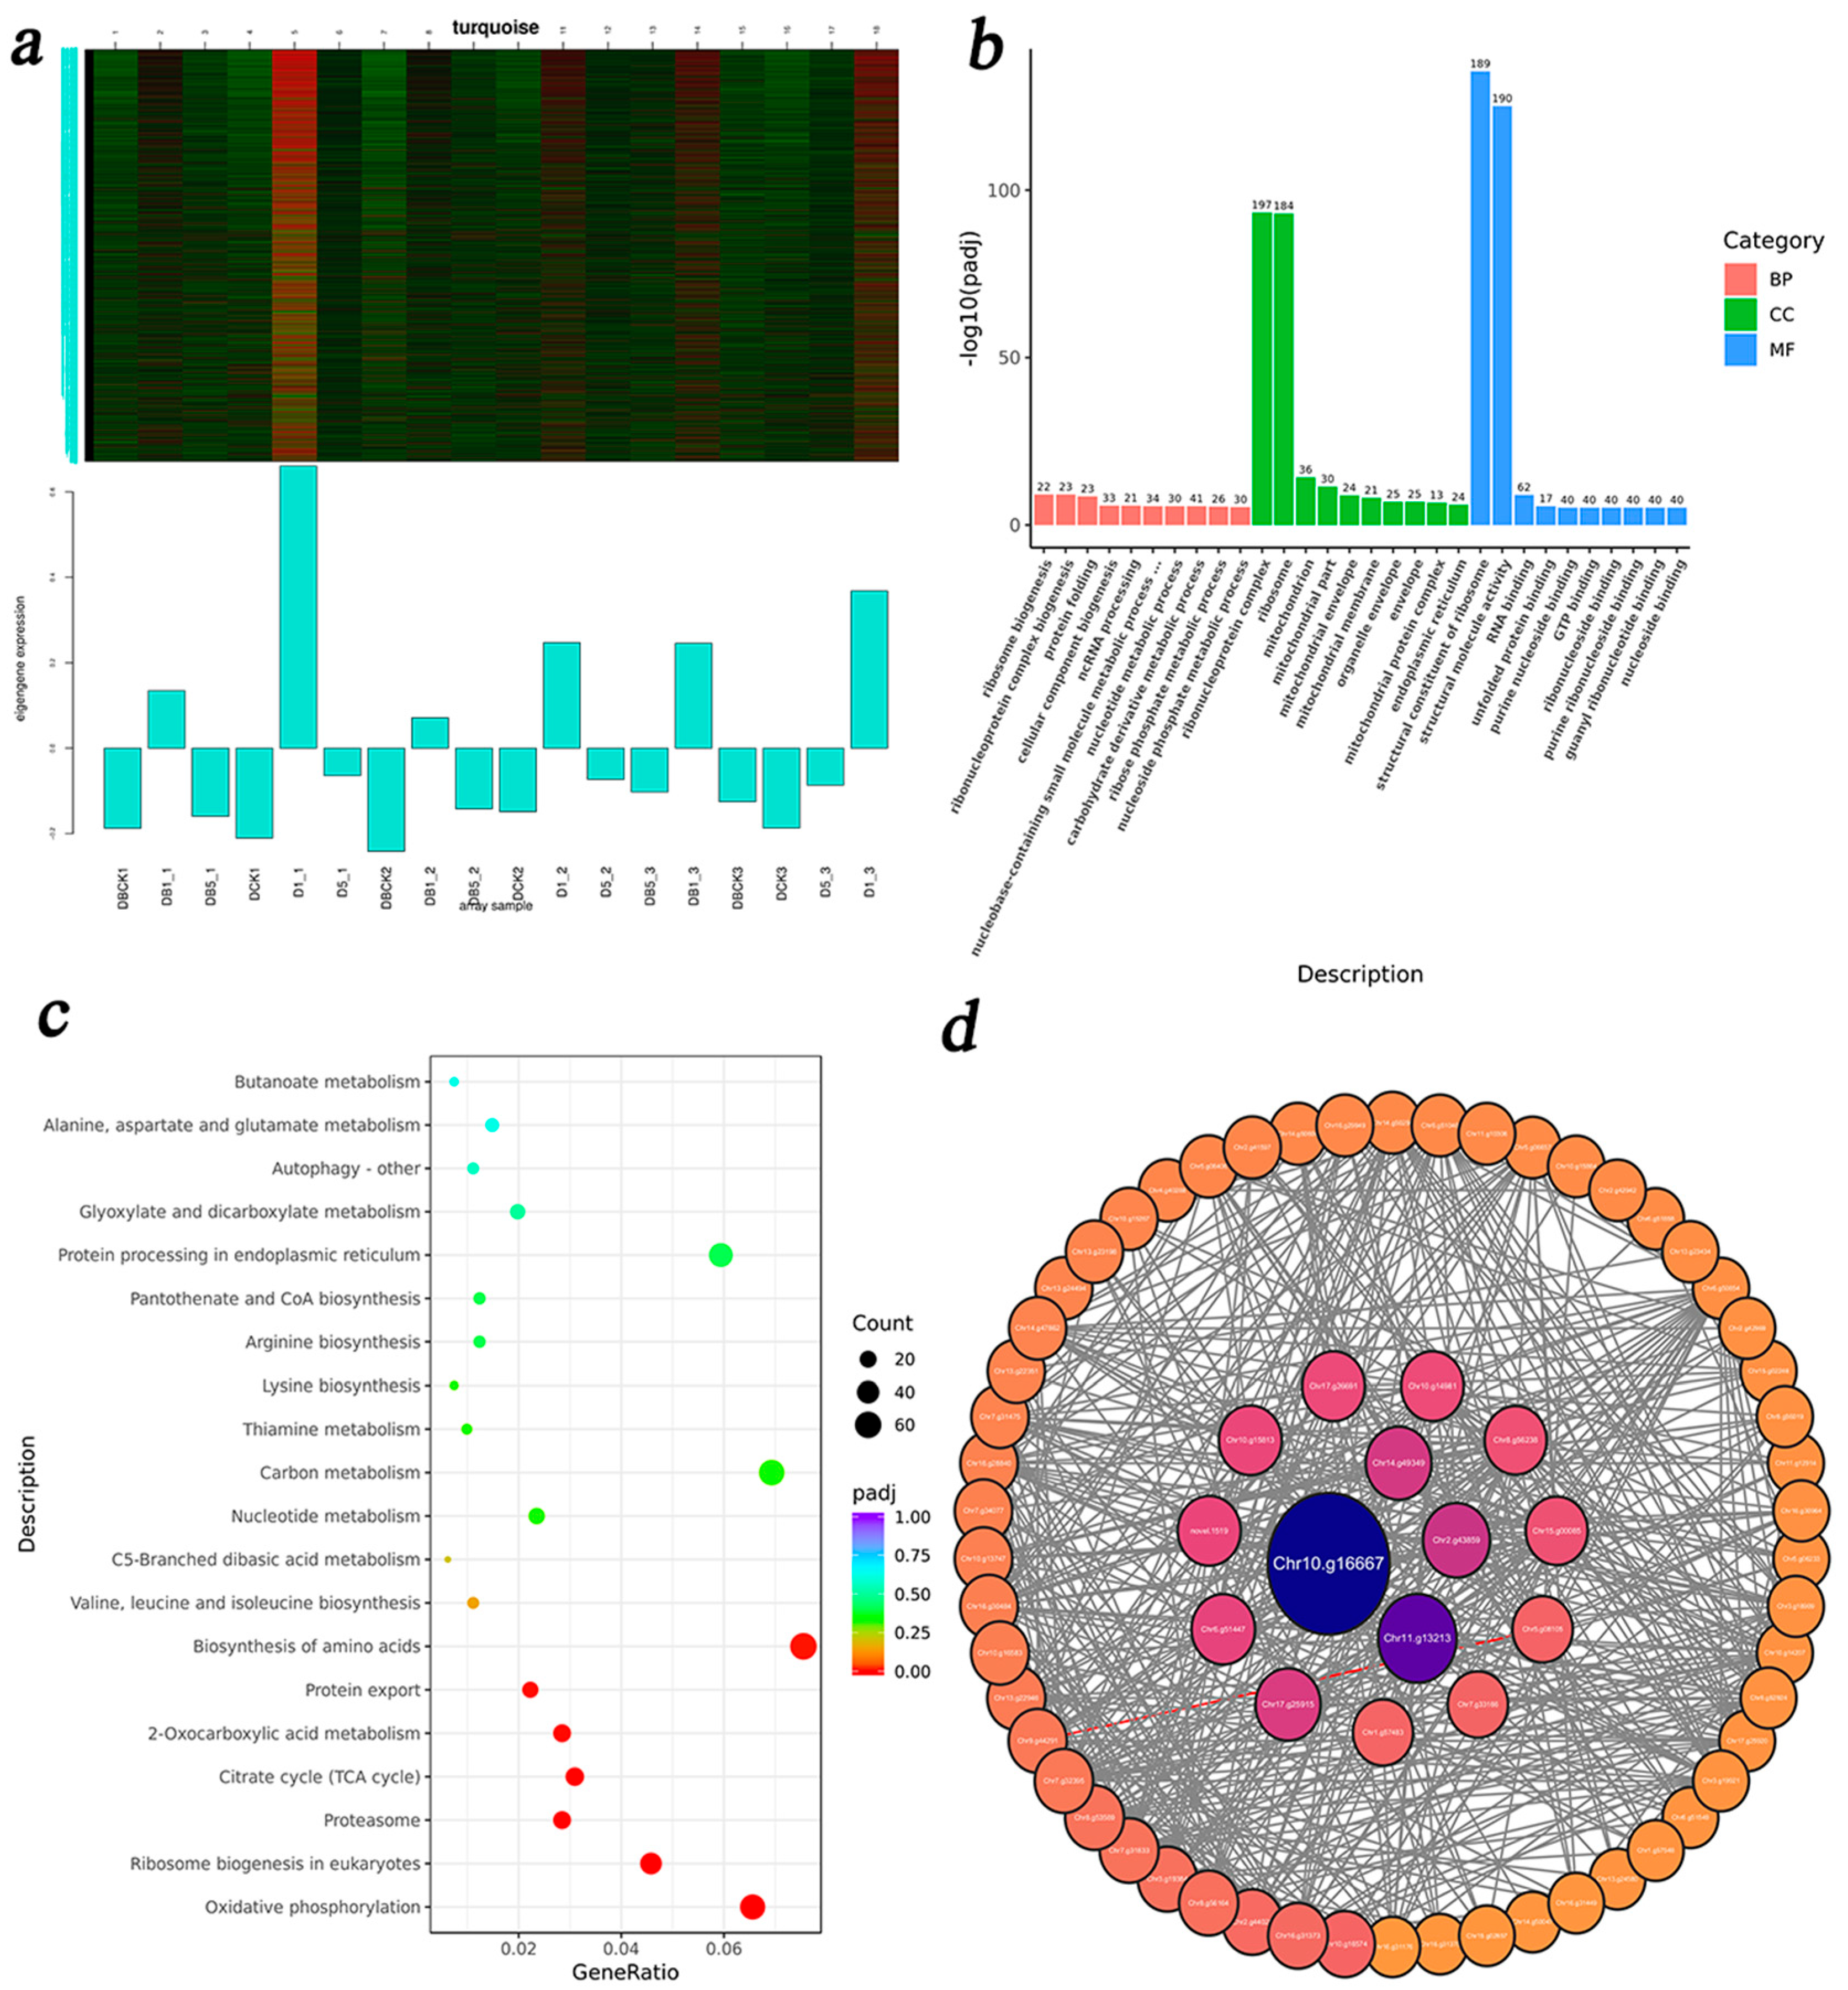
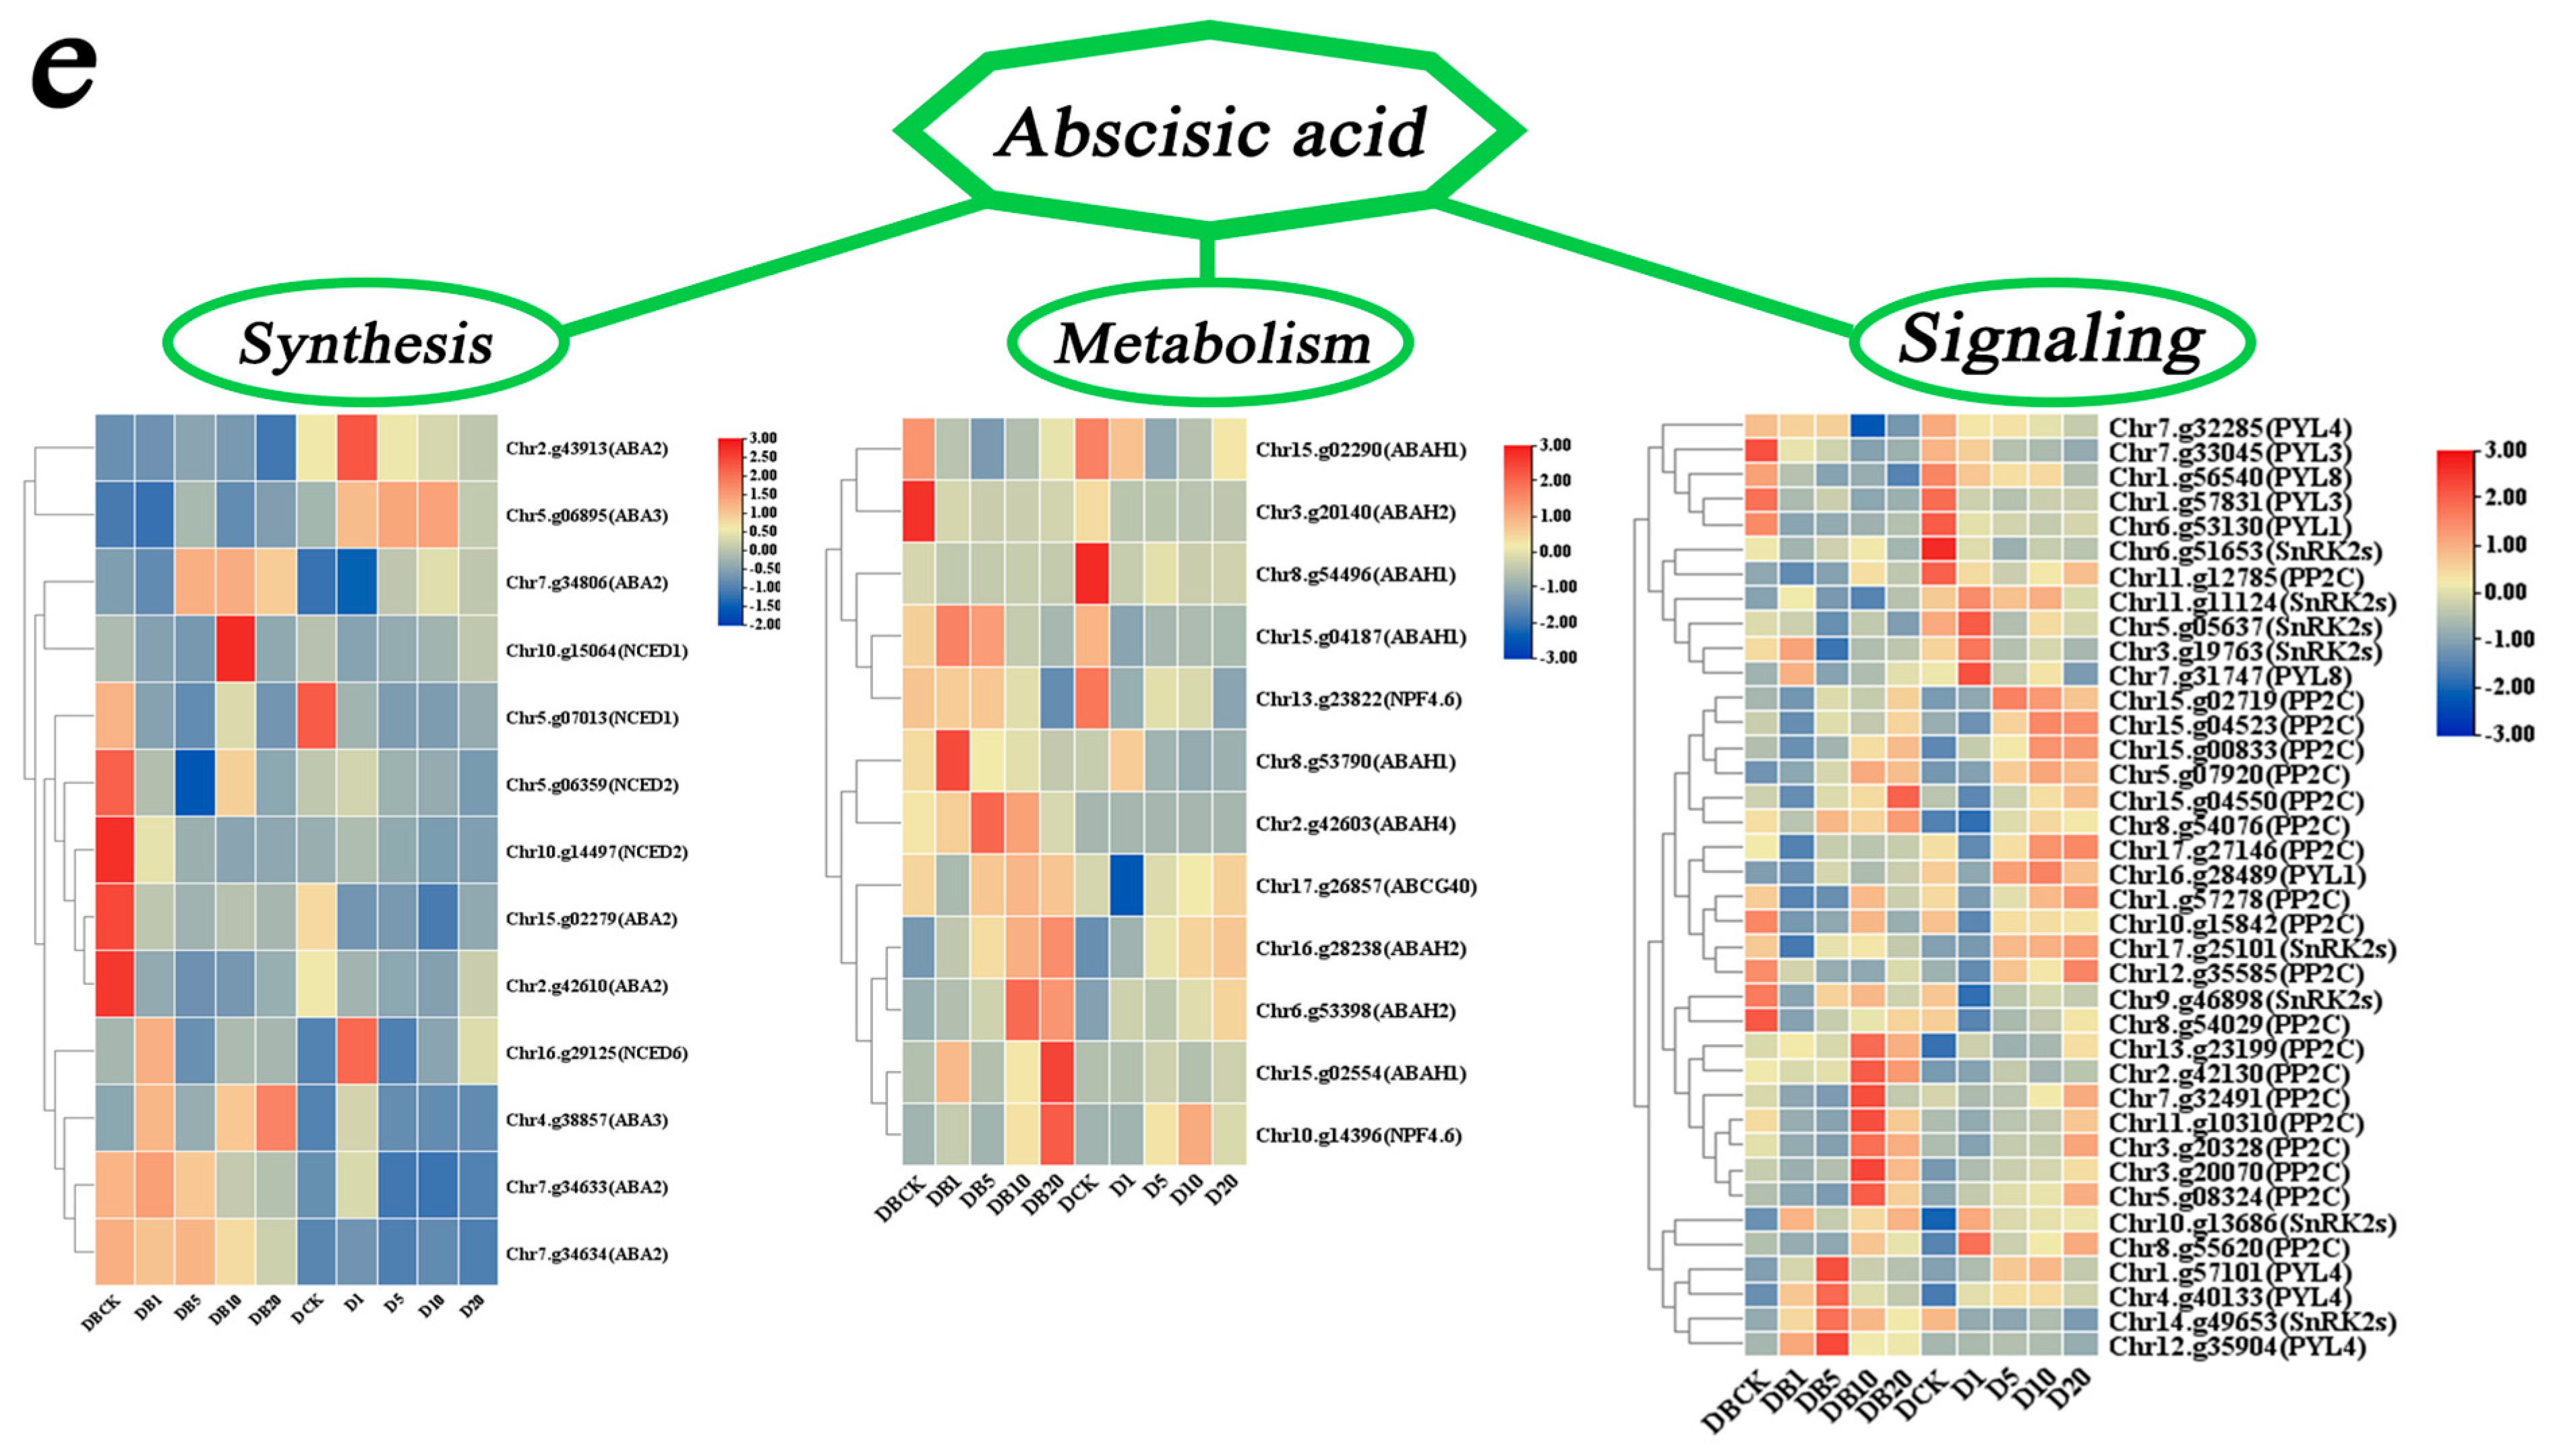
In the cyan module, which was strongly positively correlated with the ABA content, a total of 505 DEGs were identified (Figure 12a). In the cyan module, key genes in rolB-transformed ‘duli’ were up-regulated at 0 and 5 days, but these genes were down-regulated at day 1. In contrast, key genes in WT plants exhibited more complex expression patterns. GO enrichment analysis revealed that these DEGs were significantly enriched in BPs such as movement of cell or subcellular components and microtubule-based movement and process and MFs including microtubule binding, tubulin binding, microtubule motor activity, and cytoskeletal protein binding (Figure 12b). KEGG pathway enrichment analysis revealed significant associations with pathways such as Other glycan degradation, DNA replication, Pyrimidine metabolism, Sphingolipid metabolism, and Cysteine and methionine metabolism (Figure 12c). PPI network analysis identified several highly connected genes, including SIGE, CAO, SPA1, and AB5F (Figure 12d). In the ABA biosynthesis pathway, ABA2 genes were up-regulated in rolB-transformed plants from 1 to 5 days, and ABA2 and NCED2 were up-regulated in these plants at 0 days (Figure 12e), however, these genes were down-regulated or weakly expressed in WT plants across all time points. In WT plants, ABA3 and ABA2 were up-regulated at all time points, and the corresponding genes in rolB-transformed plants were down-regulated throughout the experimental period. In the ABA metabolism pathway, genes such as ABAH2 at 0 days, ABAH1 from 0 to 5 days, and ABAH4 from 0 to 10 days were significantly up-regulated in rolB-transformed plants compared with WT plants. Additionally, NPF4.6 was significantly up-regulated in rolB-transformed plants from 0 to 10 days, and ABCG40 was significantly down-regulated in WT plants at day 1. In the ABA signaling pathway, the rolB gene suppressed certain PP2C and SnRK genes, causing them to be weakly or not expressed. Genes related to PYR/PYL/RCARs were significantly down-regulated in rolB-transformed plants. In WT plants, genes such as PP2C and SnRK2s were down-regulated from 0 to 5 days but up-regulated from 5 to 20 days. In rolB-transformed plants, the down-regulation was more pronounced from 0 to 5 days, and expression of these genes was either absent or very low from 5 to 20 days.

3.6. Transcriptome Validation

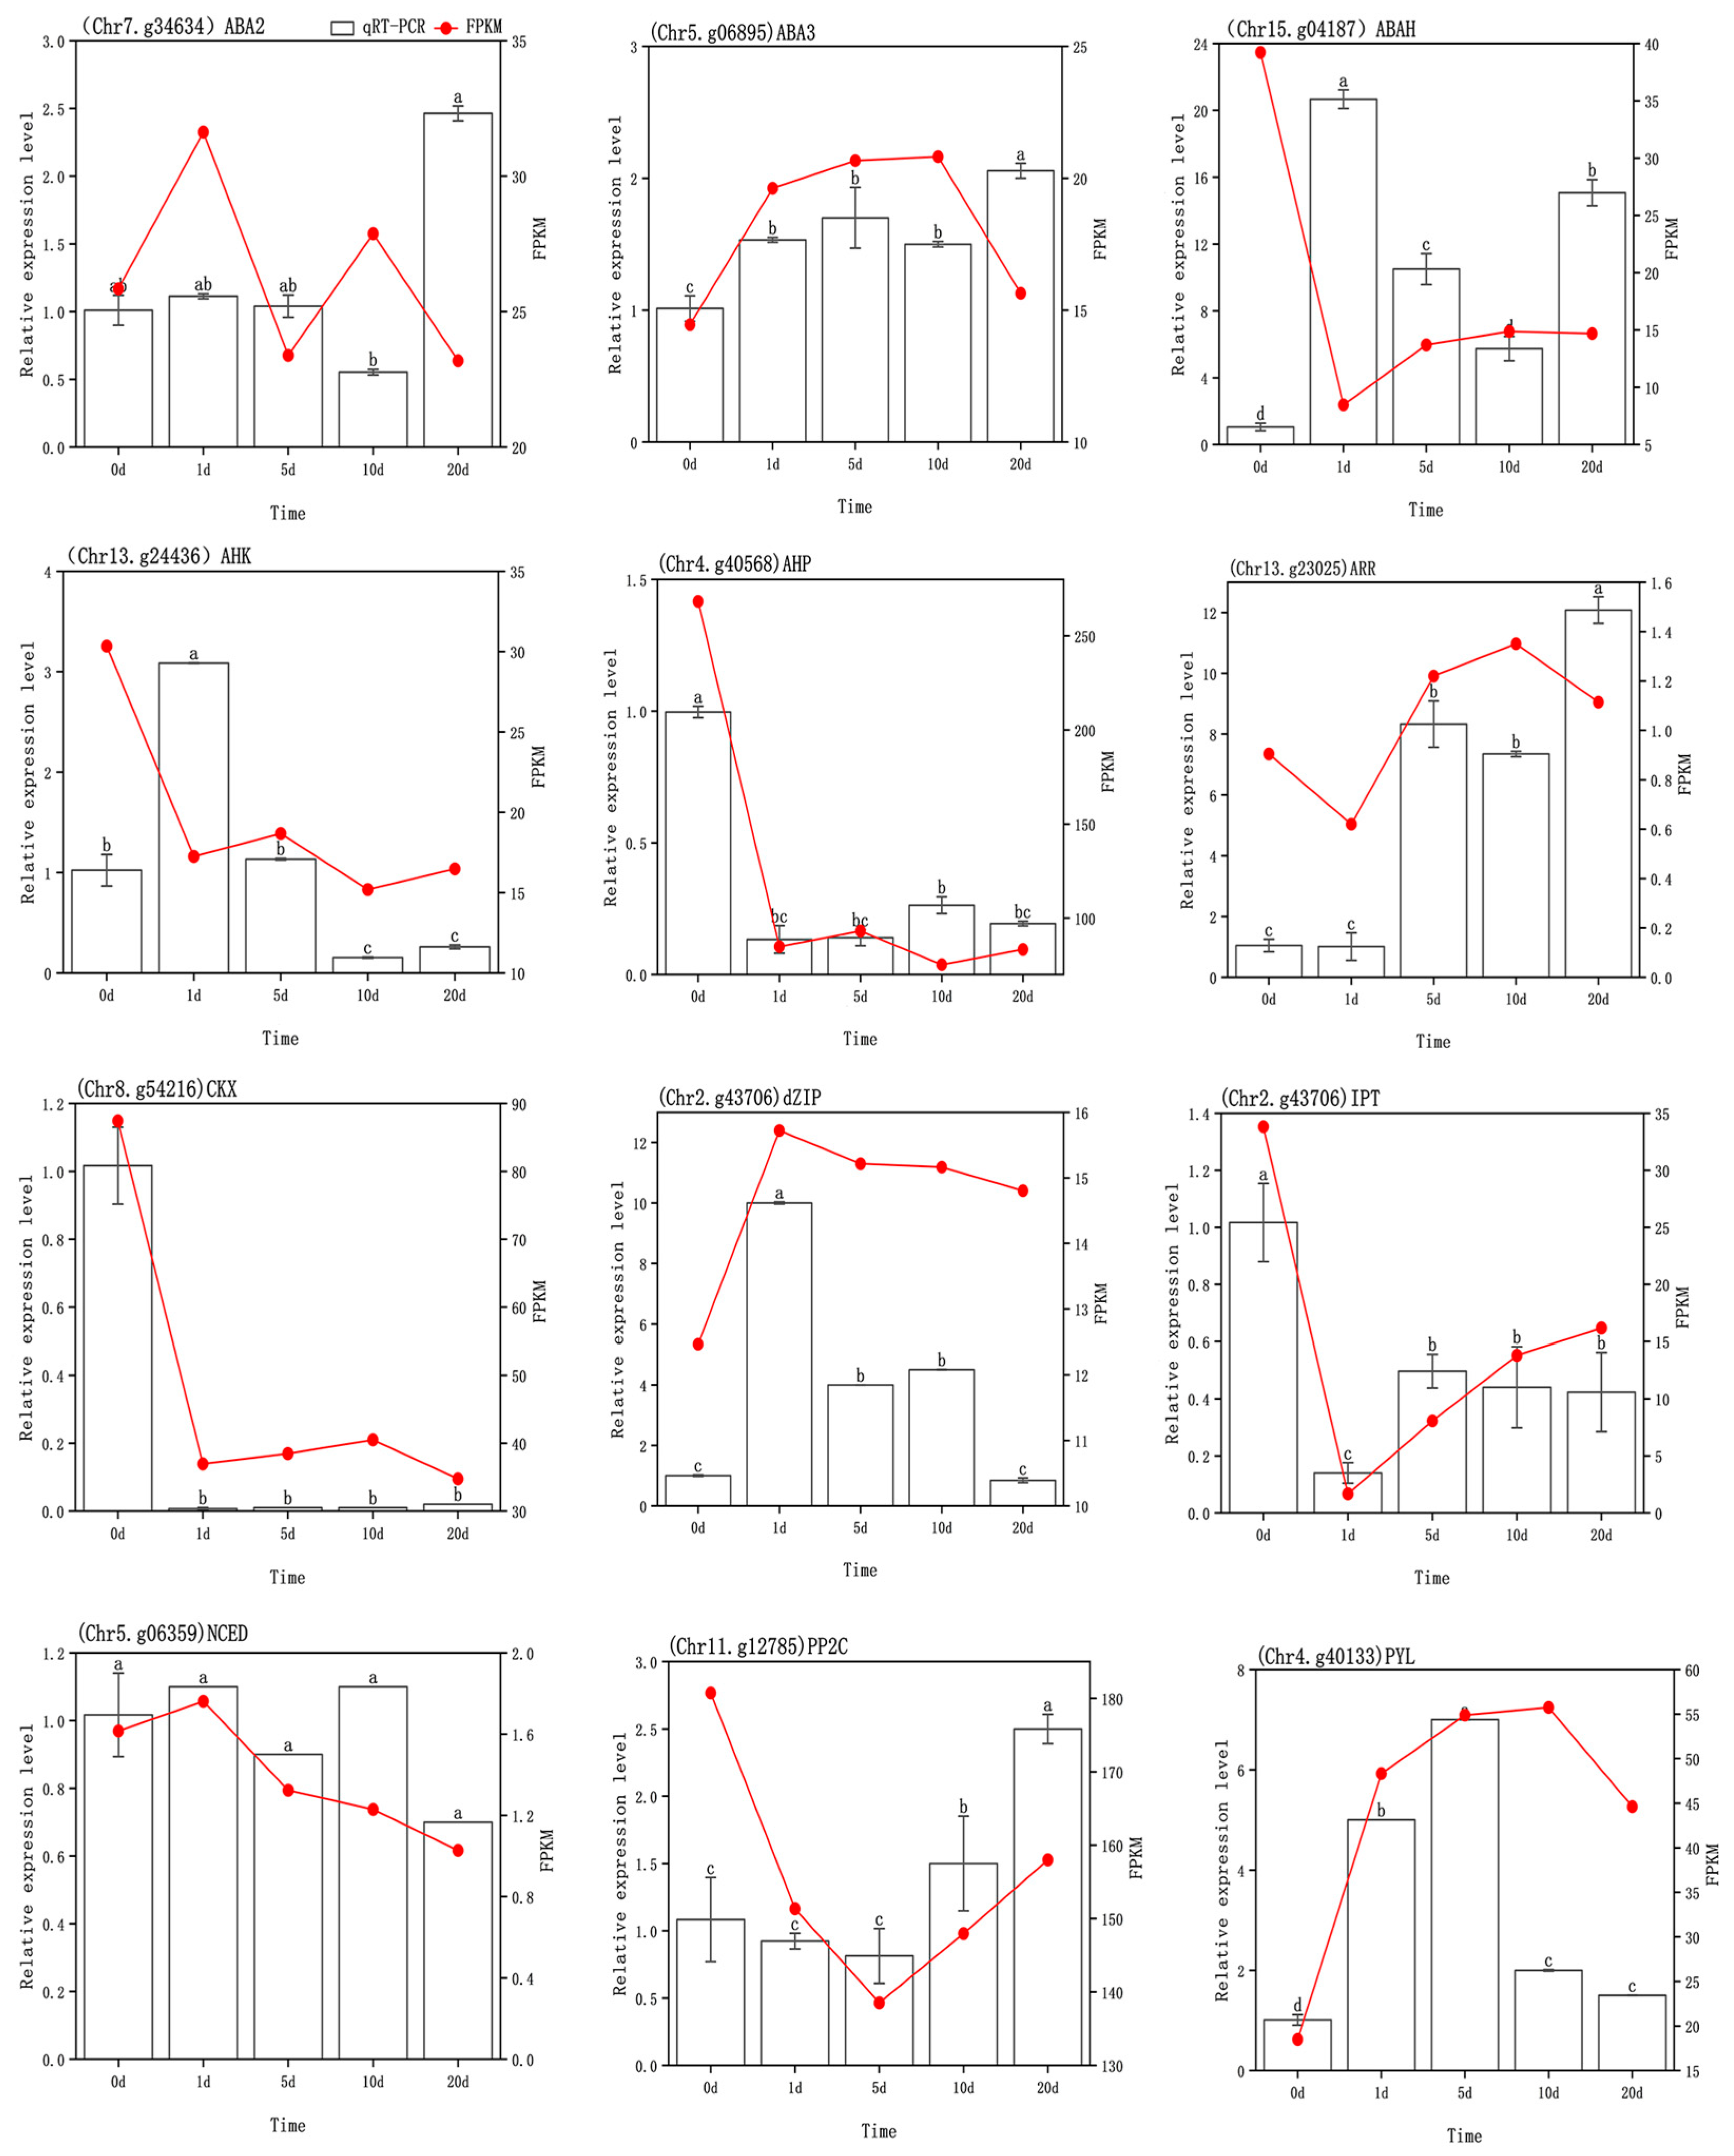
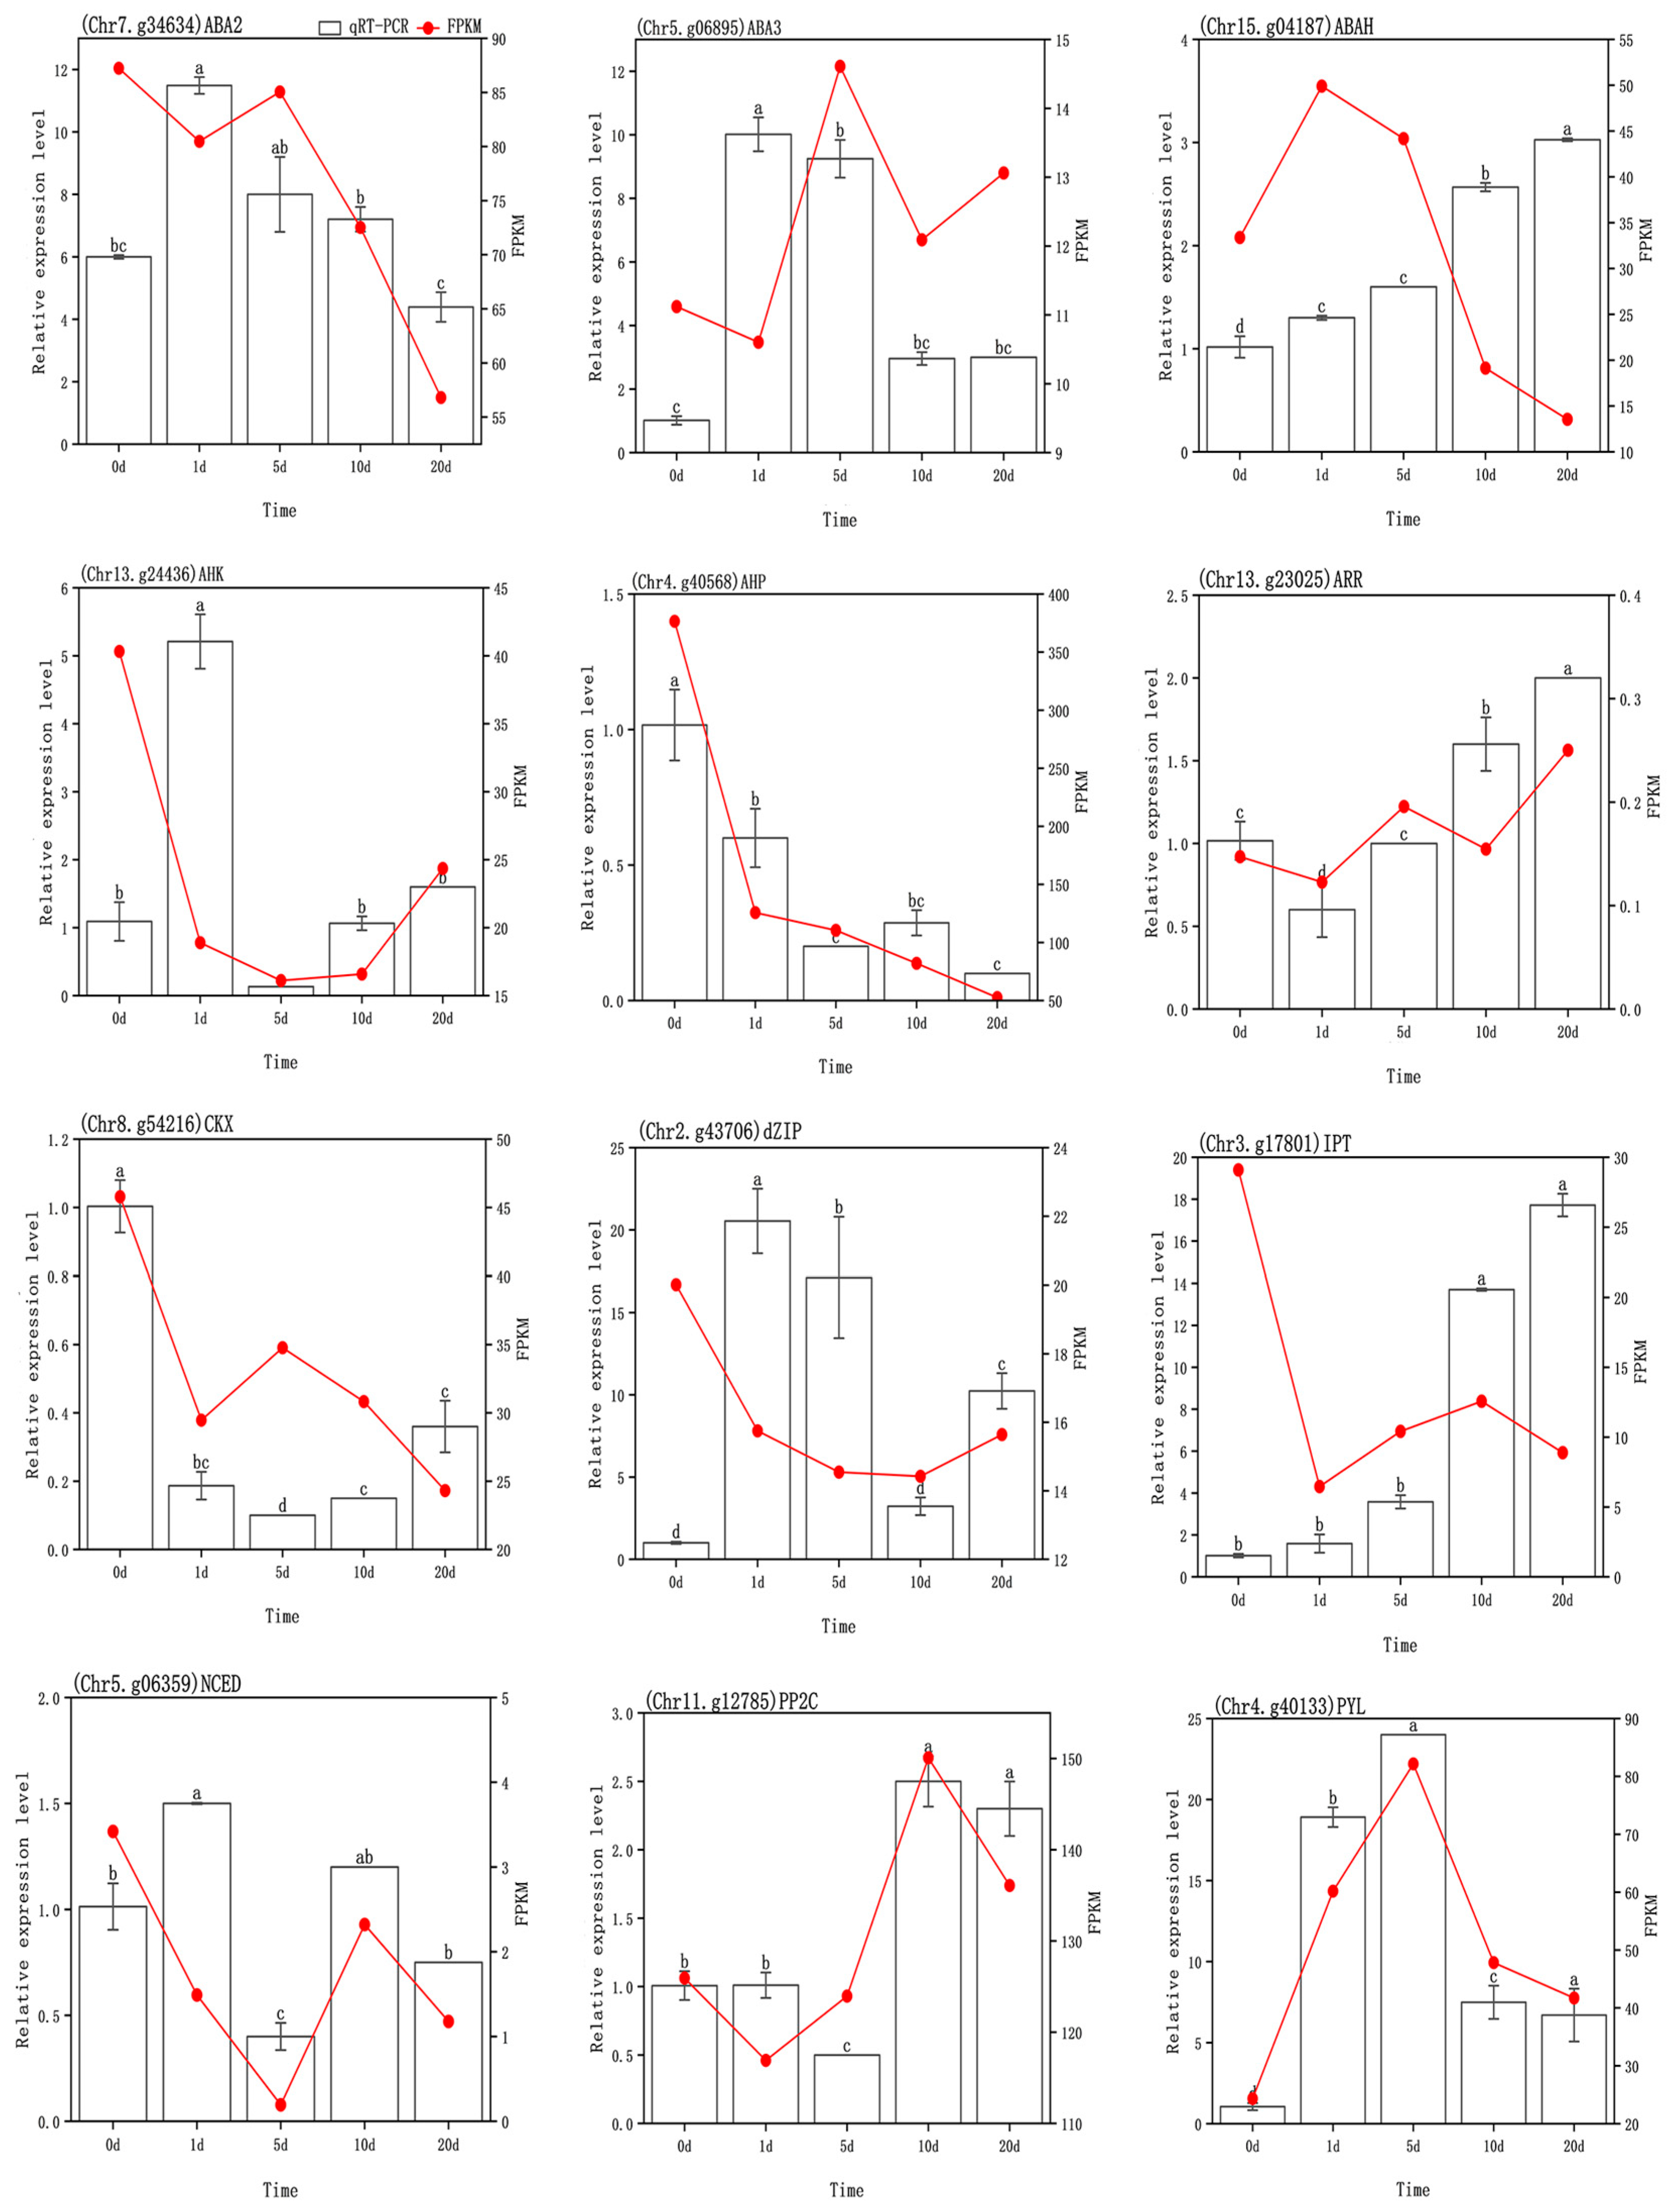
To validate the accuracy of the transcriptomic data, 12 genes associated with the biosynthesis or signaling pathways of CTK and ABA were selected for qRT-PCR verification (Figure 13 and Figure 14). The gene-specific primers are listed in Table 2. The qRT-PCR results for these 12 genes were highly consistent with the expression trends observed in the transcriptome sequencing data.

3.7. Analysis of the Molecular Mechanism by Which the rolB Gene Regulates Adventitious Root Growth Through Hormonal Control

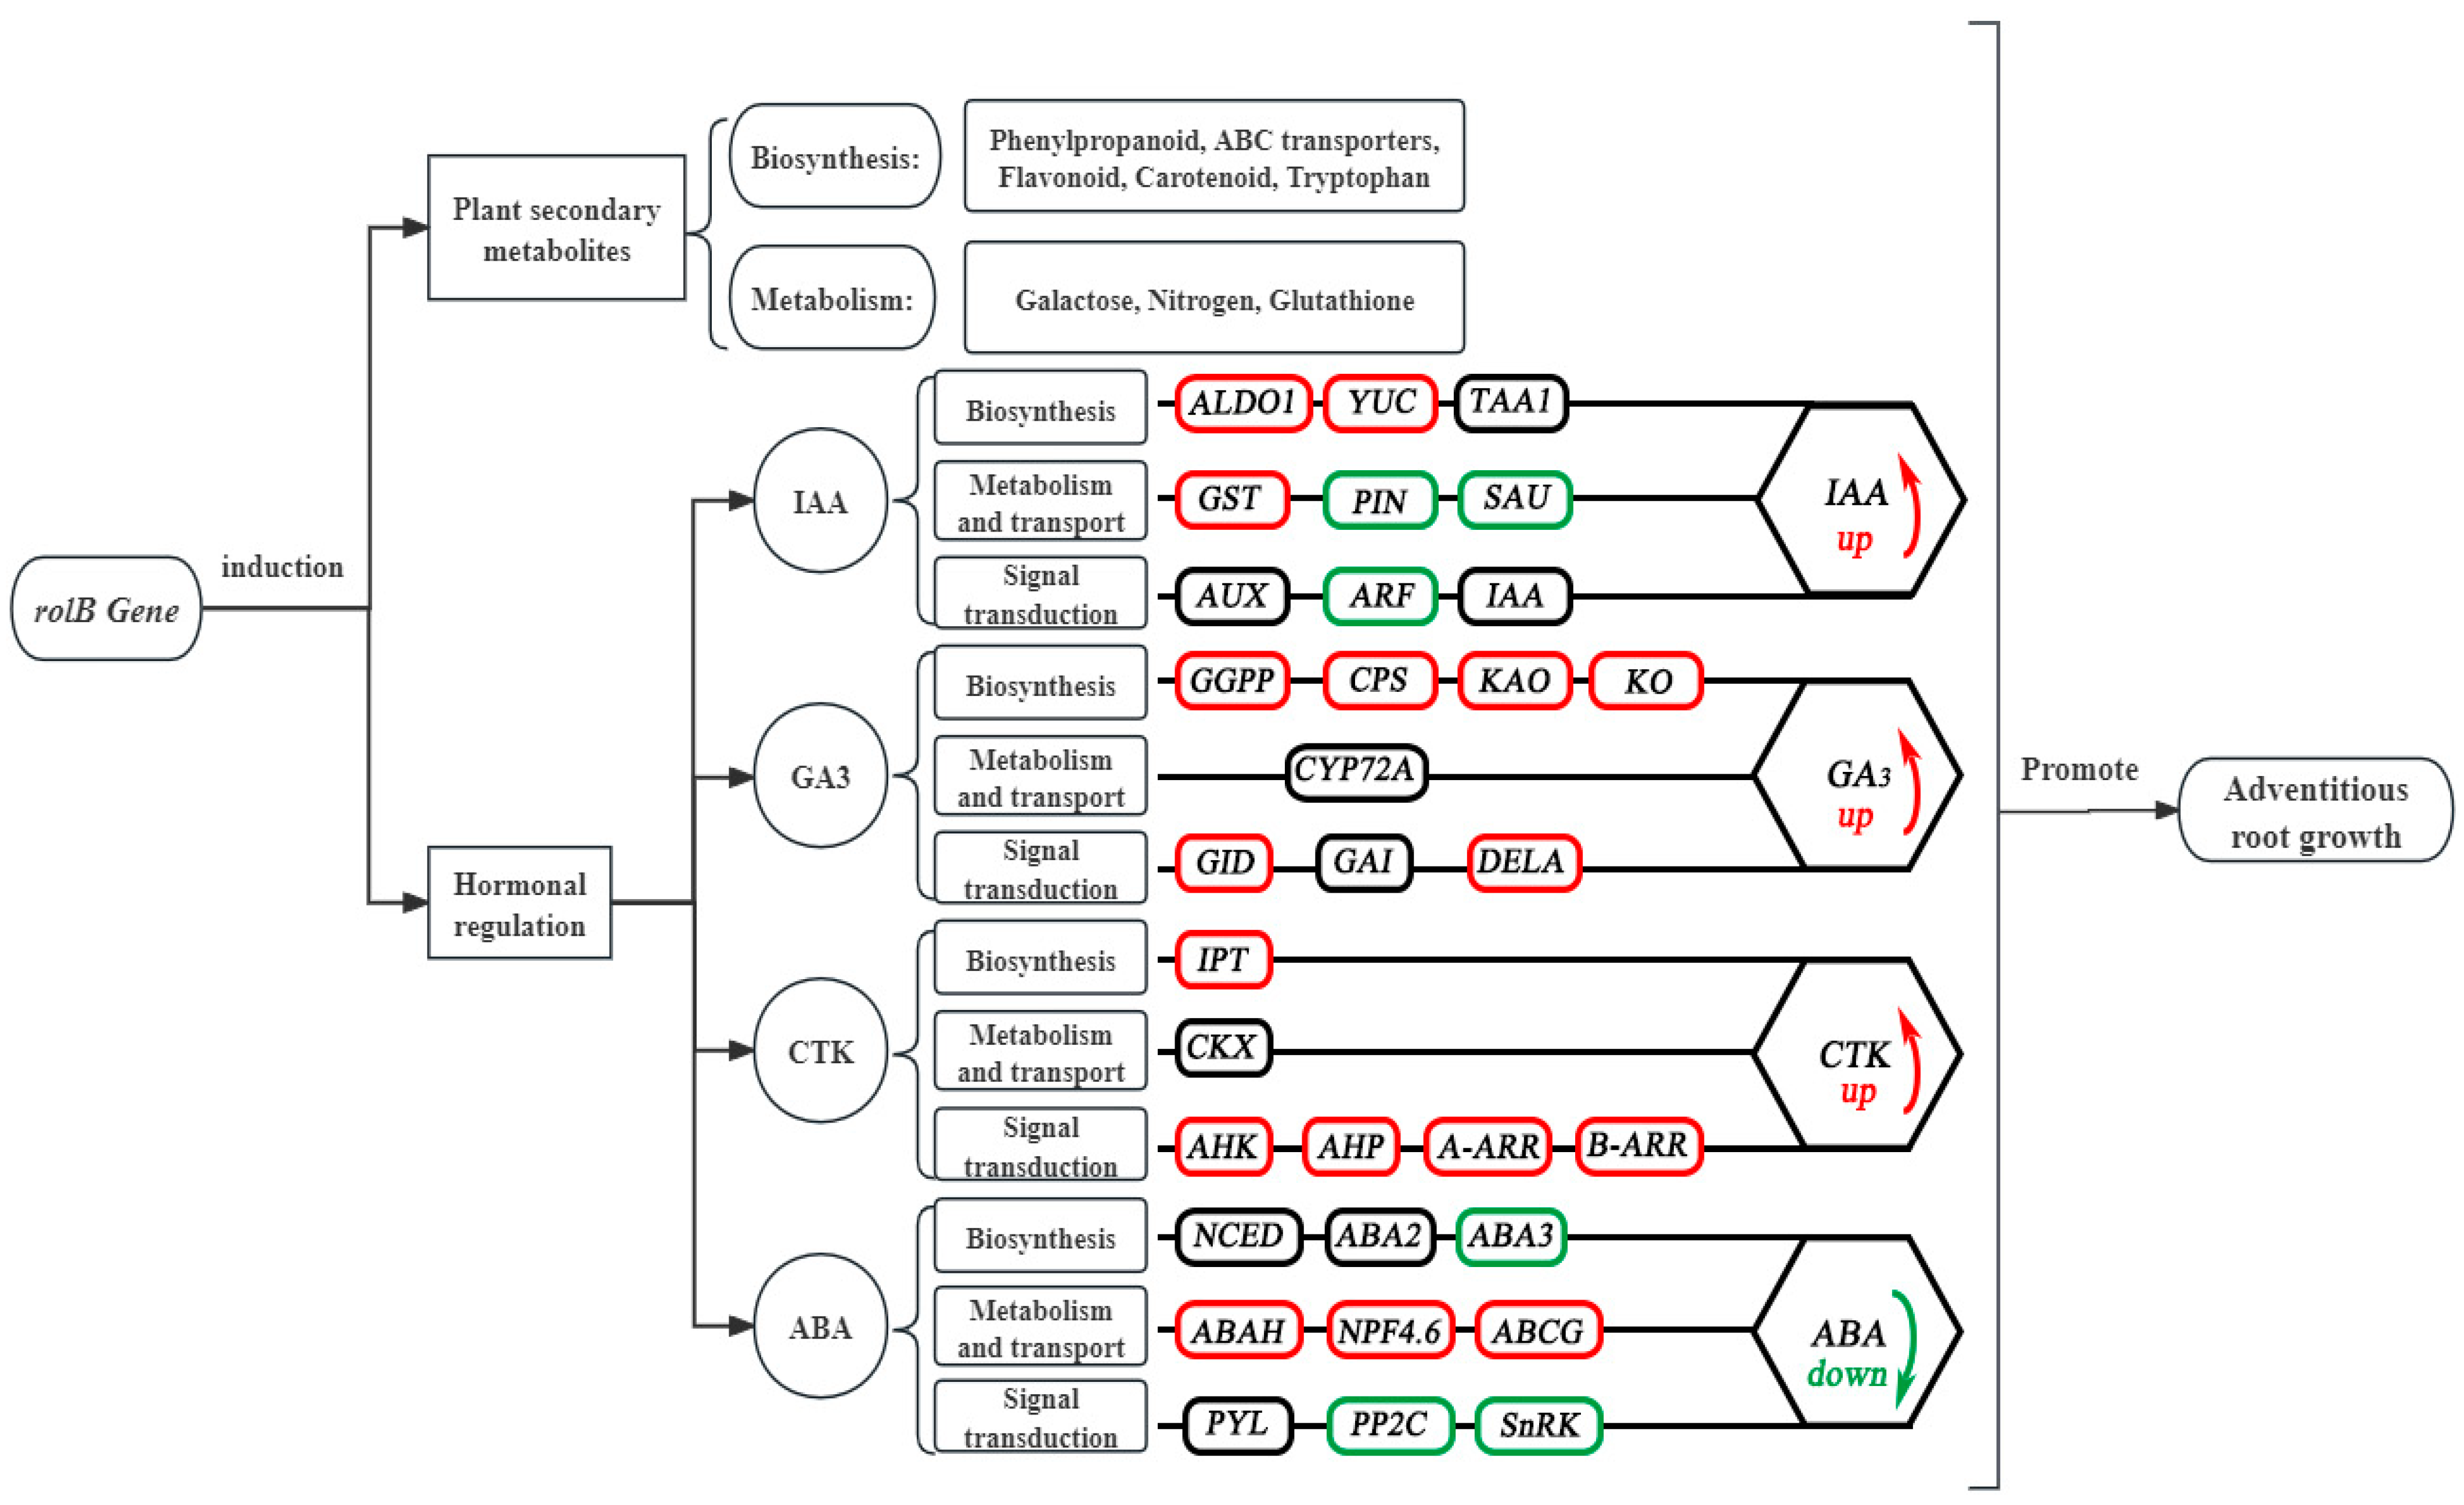
Based on the experimental results, we established the following model to explain the hormonal regulatory mechanisms by which the rolB gene affects the process of adventitious root development in ‘duli’ (Figure 15). In the IAA biosynthesis and signaling pathway, genes such as ALDO1 and YUC are significantly up-regulated in rolB-transformed plants, promoting IAA production and signaling, which is critical for adventitious root formation. Similarly, in the GA3 pathway, genes such as GID1, GAI, and DELA are up-regulated in response to the rolB gene, enhancing gibberellin signaling and contributing to root growth. In the CTK signaling pathway, genes such as CKX, AHP, and ARR are up-regulated in rolB-transformed plants, indicating that the rolB gene positively influences cytokinin metabolism and signaling and further promotes root development. In contrast, genes involved in the ABA pathway, such as PYL and PP2C, were down-regulated in rolB-transformed plants, suggesting that the rolB gene may inhibit the negative effect of ABA on root growth.

4. Discussion

4.1. Phenotypic Analysis of Adventitious Root Development in rolB-Transformed ‘Duli’

The rolB gene significantly promotes root growth in plants. Related studies on tobacco have shown that the branching ability of tobacco hairy roots is reduced when they lack rolB, and a prolonged subculture time eventually leads to the loss of the root growth capacity [16]. In Taraxacum platycarpum, adventitious roots show active elongation and extensive branching in the absence of growth regulators, and transgenic plants exhibit a stronger regeneration capacity and root more easily compared with non-transformed plants [17]. The rolB gene advanced the formation of root primordia by approximately three days and increased the proportion of seedlings forming adventitious roots by 57%. Furthermore, the rooting rate of ‘duli’ tissue culture plants increased by 16.67% within 30 days, and the occurrence of secondary lateral roots was induced. Key root morphological parameters, including average root length, total root length, surface area, projected area, average diameter, and root volume, were all significantly enhanced in transgenic ‘duli’. These findings suggest that the introduction of the rolB gene can effectively accelerate adventitious root formation and growth, while altering the root morphology of ‘duli’.
Adventitious root growth is regulated by multiple hormones, with auxins playing a central role. Low and high concentrations of auxins promote and inhibit adventitious root growth, respectively [18]. Cytokinins appear to have a similar regulatory mechanism. Klerk [19] demonstrated that the degree of inhibition of rooting in apple rootstock microcuttings varies among cytokinin types, but low concentrations of isopentenyl adenine and isopentenyl adenosine promote rooting (2001). Exogenous ABA has been shown to inhibit adventitious root development in peanuts by increasing endogenous ABA levels, reducing lateral root formation, and delaying development [20]. In our study, the rolB gene increased the endogenous levels of IAA, GA3, and ZR during adventitious root formation and decreased the endogenous ABA content. The rolB gene influences adventitious root growth by modulating the content and balance of endogenous hormones in ‘duli’; further studies are needed to validate this hypothesis.

4.2. Analysis of Key DEGs in the Adventitious Root Development of rolB-Transformed ‘Duli’

In this study, RNA-seq technology was used to analyze the transcriptomes of stem base samples from WT and rolB-transformed ‘duli’ plants at different rooting stages. A total of 5496, 5411, 6343, 5733, and 4510 DEGs were identified in the 0, 1, 5, 10, and 20-day comparisons, respectively. KEGG enrichment analysis revealed significant enrichment in pathways associated with the synthesis and metabolism of plant secondary metabolites, such as carotenoids, flavonoids, glutathione, and terpenoids. Carotenoids are precursors of hormones such as zeatin, ABA, and brassinolide, and they also participate in hormone signal transduction [21]. Flavonoids can strongly influence the signaling of plant hormones, including auxins and ABA [22]. Most terpenoids are secondary metabolites that play active roles in plant growth, development, physiological functions, and interactions with environmental factors. Plant hormones such as gibberellins (GA), abscisic acid (ABA), brassinolide (BR), and strigolactones (SLs) are also derived from terpenoids [23]. Glutathione, a key antioxidant, stabilizes the cellular redox balance and serves as an interface between signaling pathways and metabolic reactions that promote growth and development [24]. The synthesis of these secondary metabolites likely plays an important role in rolB-induced adventitious root growth, which also highlights their strong association with plant hormones.

4.3. Hormonal Gene Analysis

4.3.1. IAA-Related Gene Analysis

In the IAA signal transduction pathway, the rolB gene up-regulated the expression of AUX28, IAA16, AUXI2, and IAA8. When IAA levels are low, the Aux/IAA proteins interact with TOPLESS proteins to inhibit the activity of specific ARFs (auxin respond factors) [25]. As IAA concentrations increase, IAA can directly bind to the TIR1/AFB complex, leading to the ubiquitination and degradation of the Aux/IAA proteins via the 26S proteasome. This process allows ARF proteins to activate the expression of downstream genes, regulating adventitious root development [26]. This is consistent with the results of previous studies showing that auxin levels were higher in rolB-transformed Pyrus betulaefolia compared with WT plants. Overall, the rolB gene increases auxin levels by up-regulating the expression of genes in the YUC biosynthesis pathway (YUC3,4,6,10) and regulating genes in the IAA signal transduction pathway (AUX12,28, IAA8,16), which, in turn, promotes adventitious root growth [27].

4.3.2. Analysis of GA-Related Genes

In the GA biosynthesis pathway, the rolB gene up-regulated the expression of CPSF, KO1, KAO1, and KAO2. The GA synthesis pathway in higher plants can be divided into three main stages. The first stage occurs in plastids, where the GA precursor GGPP (Geranylgeranyl pyrophosphate) is cyclized into ent-kaurene by the enzymes CPS (Copalyl pyrophosphate synthase) and KS (Endogen-shell synthase). The second stage occurs in the endoplasmic reticulum, where KO (Endogen-kauri oxidase) and KAO (Endogen-kauri acid oxidase) catalyze the oxidation of ent-kaurene, forming the initial GA product GA12-aldehyde, which is further converted into GA12 and GA53. The third stage occurs in the cytoplasm, where GA12 and GA53 are converted into other forms of GAs through oxidation by enzymes such as GA20ox (GA20-oxidase), GA3ox (GA30-oxidase), and GA2ox [28,29,30]. Thus, the rolB gene influences GA biosynthesis in the endoplasmic reticulum.
PPI (Protein-Protein Interaction) analysis Interaction of genes related to gibberellins revealed core genes involved in metabolic processes and ribosomal functions. The RK4 gene encodes a 50S ribosomal protein, and it is hypothesized to be a central node. P5CS is involved in proline synthesis and glutamine metabolism [31], which are key metabolites required for cell growth and proliferation [32]. RIN1 triggers the biosynthesis of ethylene and carotenoids, as well as the accumulation of sugars and modification of the cell wall [33]. LSF2 is a glucan phosphatase that plays a key role in starch metabolism [34].

4.3.3. Analysis of CTK-Related Genes

In the CTK biosynthesis pathway, CKX (cytokinin oxidase/dehydrogenase) catalyzes the breakdown of cytokinins in plants [35]. It exhibits strong substrate specificity for cytokinins with unsaturated N6 side chains, such as trans-zeatin and isopentenyl adenine [36,37]. CKX4 is predominantly expressed in the root tips. The rolB gene likely regulates the expression of CKX4, influencing endogenous CTK levels. This regulatory effect is consistent with previous experimental data on ZR and 6-BA endogenous hormones showing that cytokinin oxidase activity increased from days 10 to 20, which is consistent with experimental observations. In tobacco plants deficient in cytokinins, overexpression of the cytokinin degradation enzyme CKX leads to the development of abundant adventitious roots [38]. Overexpression of CKX genes in Arabidopsis increases lateral root formation and promotes root meristem activity, leading to faster root growth [39].
In the CTK biosynthesis pathway, some IPT genes directly or indirectly influence cytokinin biosynthesis and auxin homeostasis, promoting adventitious root growth [40]. In our study, the rolB gene altered the expression patterns of cytokinin synthesis and transport-related genes; for example, IPT2, IPT3, and IPT5 were up-regulated in rolB-transformed ‘duli’, which would affect endogenous cytokinin synthesis. In contrast, genes involved in cytokinin synthesis and transport were significantly down-regulated in WT ‘duli’. The measured levels of endogenous cytokinins, such as 6-BA, were higher at days 0, 1, and 5 in the transgenic plants compared with WT plants.
In the CTK signaling pathway, the rolB gene up-regulated certain AHK and ARR genes at days 0 and 10, suggesting that rolB may enhance cytokinin signaling and make transgenic plants more responsive to exogenous CTK. Type-A ARRs negatively regulate cytokinin signaling, and type-B ARRs act as positive regulators and regulate the expression of downstream genes [41]. AHK genes are responsible for receiving CTK signaling stimuli [42]. In previous studies, transgenic plants with lower cytokinin levels were shown to exhibit enhanced root growth and branching. Research on Arabidopsis and tobacco has established a strong link between CTK signaling and adventitious root formation. Arabidopsis mutants lacking the cytokinin receptors AHK2, AHK3, and AHK4 show increased adventitious root growth, and the elongation of primary and lateral roots is nearly abolished [43]. In triple mutants of ARR1, ARR10, and ARR12, which lack the functions of three type-B ARRs, adventitious root formation is enhanced, and the plants become less sensitive to exogenous cytokinins [44].
In conclusion, the rolB gene enhances cytokinin levels by up-regulating cytokinin biosynthesis genes such as IPT2, IPT3, and IPT5, while also modulating signaling pathways by regulating BARR and AHK genes, thus promoting adventitious root growth and development in ‘duli’.
PPI analysis of genes related to cytokinins identified core genes associated with ribosome functions and the cell cycle. The CDC16 gene is a key component of the APC/C and serves as an E3 ubiquitin ligase in the ubiquitin-mediated proteolysis pathway, which controls several critical steps in the cell cycle [45,46]. RK4, UTP7, and RIO2 are ribosomal-related genes involved in ribosome assembly and metabolic processes [47,48,49].

4.3.4. ABA-Related Gene Analysis

In the ABA biosynthesis pathway, NPF4.6 and ABCG40 are responsible for the transport of ABA [50,51]. In WT ‘duli’, ABA transport is restricted, which limits ABA metabolism. The rolB gene increased the expression of ABAH, promoting ABA metabolism and reducing the plant’s reliance on endogenous ABA. In the ABA biosynthesis pathway, the rolB gene significantly regulates ABA2 and NCED2, initially up-regulating them and then down-regulating them in later stages. This is consistent with the observed changes in endogenous ABA levels in rolB-transformed ‘duli’ across the entire experimental period, and with the gradual increase in the maize carotenoid epoxycyclase enzyme activity from days 0 to 5. Other biosynthesis-related genes were either not expressed or expressed at very low levels in rolB-transformed plants.
In this study, the rolB gene down-regulated most ABA signaling genes in ‘duli’. Previous studies on Arabidopsis have shown that PYR/PYL-dependent ABA signaling temporarily inhibits lateral root growth [52]. Additionally, in PYR/PYL1,2,4, ABI1, and SnRK2.2/3/6 mutant lines, the sensitivity of adventitious root growth to ABA inhibition is reduced [53]. Other studies have also found that ABA suppresses adventitious root formation in Arabidopsis hypocotyls, with some control exerted by the ABA receptors PYL1 and PYL2 [54]. ABA can also reduce the expression of the transport inhibitor RESPONSE1/auxin signaling F-box through the induction of microRNA and related transcription factors such as ABA INSENSITIVE4, ultimately influencing root growth [55]. Furthermore, ABA interacts with the ABA receptor PYL8 and transcription factor MYB77, which increases the expression of genes known to promote lateral root formation and elongation, such as LBD16 and LBD29, via interaction with ARF7 [13].
In conclusion, the rolB gene reduces the ABA content in ‘duli’ by down-regulating genes involved in ABA biosynthesis (ABA2, NCED2), up-regulating genes related to ABA metabolism (ABAH), and modulating the ABA signaling pathway to decrease endogenous ABA levels and promote adventitious root growth.

5. Conclusions

We found that the rolB gene significantly promotes the formation of adventitious roots in ‘duli’. Transgenic ‘duli’ plants exhibited higher rooting rates and a more developed root system than WT plants. In addition, levels of IAA, gibberellin, and cytokinin were higher and the ABA content was lower in transgenic ‘duli’ compared with WT plants. Transcriptome analysis revealed that DEGs were primarily enriched in pathways related to hormone biosynthesis, signal transduction, secondary metabolism, and the synthesis of flavonoids and carotenoids. Key genes associated with the IAA, cytokinin, gibberellin, and ABA pathways were identified, and distinct expression patterns were observed for these genes in transgenic and WT ‘duli’. These findings provide new insights into the molecular mechanisms underlying rolB-mediated root induction and provide a foundation for improving the rooting efficiency of ‘duli’ rootstocks and optimizing propagation techniques for high-quality pear cultivars.

Author Contributions

T.X.: Visualization, Writing—original draft. W.W.: Validation, Formal analysis. K.N.: Investigation. Z.H.: Data curation. J.H.: Software. Y.L.: Conceptualization, Project administration. Y.Z.: Supervision. N.L.: Writing—review & editing. All authors have read and agreed to the published version of the manuscript.

Funding

This research was funded by the Mechanism of Adventitious Root Formation Induced by the rolB Gene (C2021204063).

Institutional Review Board Statement

Not applicable.

Informed Consent Statement

Not applicable.

Data Availability Statement

Data are contained within the article.

Conflicts of Interest

The authors declare that there are no conflicts of interest.

References

  1. Bettini, P.P.; Marvasi, M.; Fani, F.; Lazzara, L.; Cosi, E.; Melani, L.; Mauro, M.L. Agrobacterium rhizogenes rolB gene affects photosynthesis and chlorophyll content in transgenic tomato (Solanum lycopersicum L.) plants. J. Plant Physiol. 2016, 204, 27–35. [Google Scholar] [CrossRef] [PubMed]
  2. Casanova, E.; Trillas, M.I.; Moysset, L.; Vainstein, A. Influence of rol genes in floriculture. Biotechnol. Adv. 2005, 23, 3–39. [Google Scholar] [CrossRef]
  3. Altamura, M.M. Agrobacterium Rhizogenes rolB and rolD genes: Regulation and involvement in plant development. Plant Cell Rep. 2004, 77, 89–101. [Google Scholar] [CrossRef]
  4. Zhu, L.H.; Li, X.Y.; Ahlman, A.; Welander, M. The rooting ability of the dwarfing pear rootstock BP10030 (Pyrus communis) was significantly increased by introduction of the rolB gene. Plant Sci. 2003, 165, 829–835. [Google Scholar] [CrossRef]
  5. Kiyokawa, S.; Kobayashi, K.; Kikuchi, Y.; Kamada, H.; Harada, H. Root-inducing region of mikimopine type Ri plasmid pRi1724. Plant Physiol. 1994, 104, 801–808. [Google Scholar] [CrossRef]
  6. Mauro, M.L.; Bettini, P.P. Agrobacterium rhizogenes rolB oncogene: An intriguing player for many roles. Plant Physiol. Bioch. 2021, 165, 10–18. [Google Scholar] [CrossRef] [PubMed]
  7. Anwar, A.; Zafar, I.; Muzaffar, M.; Mirza, B.; Murtaza, I. Epigenetic modulation: An unexplored aspect of rolB gene in transgenic plants. Russ. J. Plant Physiol. 2023, 70, 28. [Google Scholar] [CrossRef]
  8. Kodahl, N.; Müller, R.; Lütken, H. The Agrobacterium rhizogenes oncogenes rolB and ORF13 increase formation of generative shoots and induce dwarfism in Arabidopsis thaliana (L.) Heynh. Plant Sci. 2016, 252, 22–29. [Google Scholar] [CrossRef]
  9. Delbarre, A.; Muller, P.; Imhoff, V.; Barbier-Brygoo, H.; Maurel, C.; Leblanc, N.; Perrot-Rechenmann, C.; Guern, J. The rolB gene of Agrobacterium rhizogenes does not increase the auxin sensitivity of tobacco protoplasts by modifying the intracellular auxin concentration. Plant Physiol. 1994, 105, 563–569. [Google Scholar] [CrossRef]
  10. Bulgakov, V.P.; Vereshchagina, Y.V.; Bulgakov, D.V.; Veremeichik, G.N.; Shkryl, Y.N. The rolB plant oncogene affects multiple signaling protein modules related to hormone signaling and plant defense. Sci. Rep. 2018, 8, 2285. [Google Scholar] [CrossRef]
  11. Maurel, C.; Barbier-Brygoo, H.; Spena, A.; Tempé, J.; Guern, J. Single rol genes from the Agrobacterium rhizogenes TL-DNA alter some of the cellular responses to auxin in Nicotiana tabacum. Plant Physi. 1991, 97, 212–216. [Google Scholar] [CrossRef]
  12. Zhao, J.; Li, G.; Yi, G.X.; Wang, B.M.; Deng, A.X.; Nan, T.G.; Li, Z.H.; Li, Q.X. Comparison between conventional indirect competitive enzyme-linked immunosorbent assay (icELISA) and simplified icELISA for small molecules. Anal. Chim. Acat. 2006, 571, 79–85. [Google Scholar] [CrossRef]
  13. Yuan, S.; Zhang, W.L.; Zhang, Y.X. Characterization of SUPPRESSOR of MAX2 1-LIKE (SMXL) genes in ‘duli’ (Pyrus betulifolia L.) and expression analysis of PbSMXLs in response to plant growth regulators and salt stress. Agronomy 2024, 14, 2778. [Google Scholar] [CrossRef]
  14. Yuan, S.; Zhang, W.L.; Zhang, Y.X. Characterization of PHT genes in ‘duli’ (Pyrus betulifolia Bunge) and expression analysis of PbPHTs in response to plant growth regulators, P, and salt stress. Agriculture 2025, 15, 199. [Google Scholar] [CrossRef]
  15. Livak, K.J.; Schmittgen, T.D. Analysis of relative gene expression data using real-time quantitative PCR and the 2−ΔΔCT method. Methods 2001, 25, 402–408. [Google Scholar] [CrossRef] [PubMed]
  16. Wang, J.H.; Lin, H.H.; Liu, C.T.; Lin, T.C.; Liu, L.Y.D.; Lee, K.T. Transcriptomic analysis reveals that reactive oxygen species and genes encoding lipid transfer protein are associated with tobacco hairy root growth and branch development. Mol. Plant-Microbe Interact. 2014, 27, 678–687. [Google Scholar] [CrossRef] [PubMed]
  17. Lee, M.H.; Yoon, E.S.; Jeong, J.H.; Choi, Y.E. Agrobacterium rhizogenes-mediated transformation of Taraxacum platycarpum and changes of morphological characters. Plant Cell Rep. 2004, 22, 822–827. [Google Scholar] [CrossRef] [PubMed]
  18. Grigolon, S.; Bravi, B.; Martin, O.C. Plant responses to auxin signals: An operating principle for dynamical sensitivity yet high resilience. PLoS Comput. Biol. 2017, 13, e1005543. [Google Scholar]
  19. De Klerk, G.J.; Hanecakova, J.; Jasik, J. The role of cytokinins in rooting of stem slices cut from apple microcuttings. Plant Biosyst. 2001, 135, 79–84. [Google Scholar] [CrossRef]
  20. Guo, D.; Liang, J.; Li, L. Abscisic acid (ABA) inhibition of lateral root formation involves endogenous ABA biosynthesis in Arachis hypogaea L. Plant Growth Regul. 2009, 58, 173–179. [Google Scholar] [CrossRef]
  21. Sun, T.; Rao, S.; Zhou, X.; Li, L. Plant carotenoids: Recent advances and future perspectives. Mol. Hortic. 2002, 2, 3. [Google Scholar]
  22. Brunetti, C.; Fini, A.; Sebastiani, F.; Gori, A.; Tattini, M. Modulation of phytohormone signaling: A primary function of flavonoids in plant-environment interactions. Front. Plant Sci. 2018, 9, 1042. [Google Scholar] [CrossRef]
  23. Yoda, H.; Yamaguchi, Y.; Sano, H. Induction of hypersensitive cell death by hydrogen peroxide produced through polyamine degradation in tobacco plants. Plant Physiol. 2003, 132, 1973–1981. [Google Scholar] [CrossRef]
  24. Noctor, G.; Cohen, M.; Trémulot, L.; Châtel-Innocenti, G.; Van Breusegem, F.; Mhamdi, A. Glutathione: A key modulator of plant defence and metabolism through multiple mechanisms. J. Exp. Bot. 2024, 75, 4549–4572. [Google Scholar] [CrossRef] [PubMed]
  25. Luo, J.; Zhou, J.J.; Zhang, J.Z. Aux/IAA gene family in plants: Molecular structure, regulation, and function. Int. J. Mol. Sci. 2018, 19, 259. [Google Scholar] [CrossRef]
  26. Cheng, W.; Zhang, M.; Cheng, T.; Wang, J.; Zhang, Q. Genome-wide identification of Aux/IAA gene family and their expression analysis in Prunus mume. Front. Genet. 2022, 13, 1013822. [Google Scholar] [CrossRef] [PubMed]
  27. Lee, M.; Jung, J.H.; Han, D.Y.; Seo, P.J.; Park, W.J.; Park, C.M. Activation of a flavin monooxygenase gene YUCCA7 enhances drought resistance in Arabidopsis. Planta 2012, 235, 923–938. [Google Scholar] [PubMed]
  28. Lange, T. Molecular biology of gibberellin synthesis. Planta 1998, 204, 409–419. [Google Scholar] [CrossRef]
  29. Hedden, P.; Thomas, S.G. Gibberellin biosynthesis and its regulation. Biochem. J. 2012, 444, 11–25. [Google Scholar] [CrossRef]
  30. Huang, Y.; Yang, W.; Pei, Z.; Guo, X.; Liu, D.; Sun, J.; Zhang, A. The genes for gibberellin biosynthesis in wheat. Funct. Integr. Genom. 2012, 12, 199–206. [Google Scholar]
  31. Linder, S.J.; Bernasocchi, T.; Martínez-Pastor, B.; Sullivan, K.D.; Galbraith, M.D.; Lewis, C.A.; Ferrer, C.M.; Boon, R.; Silveira, G.G.; Cho, H.M.; et al. Inhibition of the proline metabolism rate-limiting enzyme P5CS allows proliferation of glutamine-restricted cancer cells. Nat. Metab. 2023, 5, 2131–2147. [Google Scholar] [CrossRef]
  32. Rai, A.N.; Penna, S. Molecular evolution of plant P5CS gene involved in proline biosynthesis. Mol. Biol. Rep. 2013, 40, 6429–6435. [Google Scholar] [CrossRef] [PubMed]
  33. Slugina, M.A.; Efremov, G.I.; Shchennikova, A.V.; Kochieva, E.Z. Characterization of RIN isoforms and their expression in tomato fruit ripening. Cells 2021, 10, 1739. [Google Scholar] [CrossRef] [PubMed]
  34. Meekins, D.A.; Vander Kooi, C.W.; Gentry, M.S. Structural mechanisms of plant glucan phosphatases in starch metabolism. FEBS J. 2016, 283, 2427–2447. [Google Scholar] [CrossRef] [PubMed]
  35. Wang, H.M.; Sun, H.; Xia, H.F.; Wu, T.T.; Li, P.C.; Xu, C.W.; Yang, Z.F. Natural variation and domestication selection of ZmCKX5 with root morphological traits at the seedling stage in maize. Plants 2020, 10, 1. [Google Scholar] [CrossRef]
  36. Galuszka, P.; Frébort, I.; Šebela, M.; Peč, P. Degradation of cytokinins by cytokinin oxidases in plants. Plant Growth Regul. 2000, 32, 315–327. [Google Scholar] [CrossRef]
  37. McGaw, B.A.; Horgan, R. Cytokinin catabolism and cytokinin oxidase. Phytochemistry 1983, 22, 1103–1105. [Google Scholar] [CrossRef]
  38. Werner, T.; Motyka, V.; Laucou, V.; Smets, R.; Van Onckelen, H.; Schmülling, T. Cytokinin-deficient transgenic Arabidopsis plants show multiple developmental alterations indicating opposite functions of cytokinins in the regulation of shoot and root meristem activity. Plant Cell 2003, 15, 2532–2550. [Google Scholar] [CrossRef]
  39. Werner, T.; Motyka, V.; Strnad, M.; Schmülling, T. Regulation of plant growth by cytokinin. Proc. Natl. Acad. Sci. USA 2001, 98, 10487–10492. [Google Scholar] [CrossRef]
  40. Antoniadi, I.; Mateo-Bonmatí, E.; Pernisová, M.; Brunoni, F.; Antoniadi, M.; Villalonga, M.G.; Ament, A.; Karády, M.; Turnbull, C.; Doležal, K.; et al. IPT9, a cis-zeatin cytokinin biosynthesis gene, promotes root growth. Front. Plant Sci. 2002, 13, 932008. [Google Scholar] [CrossRef]
  41. Schmülling, T.; Werner, T.; Riefler, M.; Krupková, E.; Manns, I.B. Structure and function of cytokinin oxidase/dehydrogenase genes of maize, rice, Arabidopsis and other species. J. Plant Res. 2003, 116, 241–252. [Google Scholar] [CrossRef] [PubMed]
  42. Müller, B.; Sheen, J. Arabidopsis cytokinin signaling pathway. Sci. Signal 2007, 2007, cm5. [Google Scholar]
  43. Higuchi, M.; Pischke, M.S.; Mähönen, A.P.; Miyawaki, K.; Hashimoto, Y.; Seki, M.; Kobayashi, M.; Shinozaki, K.; Kato, T.; Tabata, S.; et al. In planta functions of the Arabidopsis cytokinin receptor family. Proc. Natl. Acad. Sci. USA 2004, 101, 8821–8826. [Google Scholar] [CrossRef] [PubMed]
  44. Argyros, R.D.; Mathews, D.E.; Chiang, Y.H.; Palmer, C.M.; Thibault, D.M.; Etheridge, N.; Argyros, D.A.; Mason, M.G.; Kieber, J.J.; Schaller, G.E. Type B response regulators of Arabidopsis play key roles in cytokinin signaling and plant development. Plant Cell 2008, 20, 2102–2116. [Google Scholar] [CrossRef]
  45. Willems, A.; De Veylder, L. The plant anaphase-promoting complex/cyclosome. Annu. Rev. Cell Dev. Biol. 2022, 38, 25–48. [Google Scholar] [CrossRef]
  46. Kwee, H.S.; Sundaresan, V. The NOMEGA gene required for female gametophyte development encodes the putative APC6/CDC16 component of the anaphase promoting complex in Arabidopsis. Plant J. 2003, 36, 853–866. [Google Scholar] [CrossRef]
  47. Zhao, M.; Ma, L.; Song, N.; Cheng, J.; Zhao, Z.; Wu, J. The regulation of Alternaria alternata resistance by LRR-RK4 through ERF109, defensin19, and phytoalexin scopoletin in Nicotiana attenuata. Plant Sci. 2022, 323, 111414. [Google Scholar] [CrossRef]
  48. Jwa, M.; Kim, J.H.; Chan, C.S. Regulation of Sli15/INCENP, kinetochore, and Cdc14 phosphatase functions by the ribosome biogenesis protein Utp7. J. Cell Biol. 2008, 182, 1099–1111. [Google Scholar] [CrossRef]
  49. Gao, Q.; Xu, S.; Zhu, X.; Wang, L.; Yang, Z.; Zhao, X. Genome-wide identification and characterization of the RIO atypical kinase family in plants. Genes Genom. 2018, 40, 669–683. [Google Scholar] [CrossRef]
  50. Shimizu, T.; Kanno, Y.; Suzuki, H.; Watanabe, S.; Seo, M. Arabidopsis NPF4.6 and NPF5.1 control leaf stomatal aperture by regulating abscisic acid transport. Genes 2021, 12, 885. [Google Scholar] [CrossRef]
  51. Borghi, L.; Kang, J.; Ko, D.; Lee, Y.; Martinoia, E. The role of ABCG-type ABC transporters in phytohormone transport. Biochem. Soc. Trans. 2015, 43, 924–930. [Google Scholar] [CrossRef]
  52. Orman-Ligeza, B.; Morris, E.C.; Parizot, B.; Lavigne, T.; Babé, A.; Ligeza, A.; Klein, S.; Sturrock, C.; Xuan, W.; Novák, O.; et al. The xerobranching response represses lateral root formation when roots are not in contact with water. Curr. Biol. 2018, 28, 3165–3173. [Google Scholar] [CrossRef]
  53. Zhao, Y.; Xing, L.; Wang, X.; Hou, Y.J.; Gao, J.; Wang, P.; Duan, C.G.; Zhu, X.; Zhu, J.K. The ABA receptor PYL8 promotes lateral root growth by enhancing MYB77-dependent transcription of auxin-responsive genes. Sci. Signal. 2014, 7, ra53. [Google Scholar] [CrossRef]
  54. Zeng, Y.; Verstraeten, I.; Trinh, H.K.; Heugebaert, T.; Stevens, C.V.; Garcia-Maquilon, I.; Rodriguez, P.L.; Vanneste, S.; Geelen, D. Arabidopsis hypocotyl adventitious root formation is suppressed by ABA signaling. Genes 2021, 12, 1141. [Google Scholar] [CrossRef]
  55. Chen, H.; Li, Z.; Xiong, L. A plant microRNA regulates the adaptation of roots to drought stress. FEBS Lett. 2012, 586, 1742–1747. [Google Scholar] [CrossRef]
Figure 1. Anatomical structure of two strains during rooting process. Note: Xy. Xylem; Ph. Phloem; Co. Cortex; Ep. Epidermis; Pi. Pith; Rp. Root primordium; Ca. Callus; Ar. Adventitious root; Rc. Root cap; DB. rolB-transformed ‘duli’; WT ‘duli’.
Agronomy 15 02165 g001
Figure 2. Developmental progression of adventitious root formation and growth in WT and rolB-transformed ‘duli’ under normal rooting conditions (a) WT ‘duli’; (b) rolB-transformed ‘duli’.
Agronomy 15 02165 g002aAgronomy 15 02165 g002b
Figure 3. Root morphological parameters of ‘duli’ under rooting treatment. (a) Rooting rate; (b) Total root length; (c) Projected area; (d) Total root volume; (e) Total surface area; (f) Average root diameter; (g) Average root length; (h) Number of adventitious roots; (i) Number of lateral roots. Different lowercase letters mean significant differences.
Agronomy 15 02165 g003
Figure 4. Analysis of endogenous hormone content of rolB-Transformed ‘duli’. (a) The content of ABA; (b) The content of IAA; (c) The content of GA3; (d) The content of ZR; (e) The content of IP. Different lowercase letters mean significant differences.
Agronomy 15 02165 g004
Figure 5. Analysis of differentially expressed genes (DEGs). (A) Distribution of DEG counts in each comparison group. (B) Venn diagram showing shared and unique DEGs during adventitious root development between rolB-transformed and wild-type Pyrus betulaefolia at different time points. Comparison groups include DBCK vs. DCK, DB1 vs. D1, DB5 vs. D5, DB10 vs. D10, and DB20 vs. D20.
Agronomy 15 02165 g005
Figure 6. GO enrichment analysis of DEGs between rolB-transformed and WT ‘duli’ during adventitious root development. (a) GO enrichment at 0 days (DB0 vs. D0); (b) GO enrichment at 1 day (DB1 vs. D1); (c) GO enrichment at 5 days (DB5 vs. D5); (d) GO enrichment at 10 days (DB10 vs. D10); (e) GO enrichment at 20 days (DB20 vs. D20).
Agronomy 15 02165 g006
Figure 7. KEGG enrichment analysis of DEGs between rolB-transformed and WT ‘duli’ during adventitious root development. (A) KEGG enrichment at 0 days (DB0 vs. D0); (B) KEGG enrichment at 1 day (DB1 vs. D1); (C) KEGG enrichment at 5 days (DB5 vs. D5); (D) KEGG enrichment at 10 days (DB10 vs. D10); (E) KEGG enrichment at 20 days (DB20 vs. D20).
Agronomy 15 02165 g007
Figure 8. Clustering and correlation analysis of hormone and modular genes. (A) Hierarchical clustering analysis of co-expression genes. Different colors represent all modules, with gray indicating genes that cannot be classified into any module by default. (B) Correlated heat maps between modules. A color block in the picture represents a numerical value. The redder the color, the higher the expression level, and the bluer the color, the lower the expression level. (C) Correlations between gene modules and phenotypes. Each tree diagram in the figure represents a module, each branch represents a gene, and the darker the color of each point (white → yellow → red), the stronger the connectivity between the two genes corresponding to the row and column. (D) Heat map of correlations between gene modules and hormone. The leftmost color block represents the module, and the rightmost color bar represents the correlation range. In the heatmap of the middle part, the darker the color, the higher the correlation, with red indicating positive correlation and blue indicating negative correlation. The numbers in each cell represent correlation and significance.
Agronomy 15 02165 g008
Figure 9. (a) DEGs expression pattern in pink module. Above is the expression calorimetric map of DEGs in different samples, and the abscissa is the sample name. In the figure below, the horizontal coordinate is the sample name, and the vertical coordinate is the expression quantity. (b) GO enrichment analysis of hub genes in pink module; (c) KEGG enrichment analysis of key genes in pink module; (d) Co-expression network of hub genes in pink module. the text inside the node was the gene name, and the node size and color depth were the kWithin value of the gene, which represented the connectivity of the gene within the module. (e) Heatmap illustrating the expression patterns of genes associated with auxin biosynthesis, metabolism, and signaling pathways. Red indicates upregulation, while blue indicates downregulation of gene expression.
Agronomy 15 02165 g009
Figure 10. (a) DEGs expression pattern in brown module. Above is the expression calorimetric map of DEGs in different samples, and the abscissa is the sample name. In the figure below, the horizontal coordinate is the sample name, and the vertical coordinate is the expression quantity. (b) GO enrichment analysis of hub genes in brown module; (c) KEGG enrichment analysis of key genes in brown module; (d) Co-expression network of hub genes in brown module. the text inside the node was the gene name, and the node size and color depth were the kWithin value of the gene, which represented the connectivity of the gene within the module; (e) Heatmap illustrating the expression patterns of genes associated with gibberellin biosynthesis, metabolism, and signaling pathways. Red indicates upregulation, while blue indicates downregulation of gene expression.
Agronomy 15 02165 g010aAgronomy 15 02165 g010b
Figure 11. (a) DEGs expression pattern in black module. Above is the expression calorimetric map of DEGs in different samples, and the abscissa is the sample name. In the figure below, the horizontal coordinate is the sample name, and the vertical coordinate is the expression quantity; (b) GO enrichment analysis of hub genes in black module; (c) KEGG enrichment analysis of key genes in black module; (d) co-expression network of hub genes in black module. the text inside the node was the gene name, and the node size and color depth were the kWithin value of the gene, which represented the connectivity of the gene within the module; (e) Heatmap illustrating the expression patterns of genes associated with cytokinin biosynthesis, metabolism, and signaling pathways. Red indicates upregulation, while blue indicates downregulation of gene expression.
Agronomy 15 02165 g011aAgronomy 15 02165 g011b
Figure 12. (a) DEGs expression pattern in cyan module. Above is the expression calorimetric map of DEGs in different samples, and the abscissa is the sample name. In the figure below, the horizontal coordinate is the sample name, and the vertical coordinate is the expression quantity. (b) GO enrichment analysis of hub genes in cyan module; (c) KEGG enrichment analysis of key genes in cyan module; (d) co-expression network of hub genes in cyan module. the text inside the node was the gene name, and the node size and color depth were the kWithin value of the gene, which represented the connectivity of the gene within the module; (e) heatmap illustrating the expression patterns of genes associated with abscisic acid biosynthesis, metabolism, and signaling pathways. Red indicates upregulation, while blue indicates downregulation of gene expression.
Agronomy 15 02165 g012aAgronomy 15 02165 g012b
Figure 13. qRT-PCR analysis results of WT ‘duli’. Different lowercase letters mean significant differences.
Agronomy 15 02165 g013
Figure 14. qRT-PCR analysis results of transgenic ‘duli’. Different lowercase letters mean significant differences.
Agronomy 15 02165 g014
Figure 15. Hormonal regulation pathways involved in adventitious root growth in Pyrus betulaefolia induced by the rolB gene. Red indicates upregulation, and green indicates downregulation.
Agronomy 15 02165 g015
Table 1. Functional Annotation of GO-Enriched Genes.
ComparisonBiological Process (BP)Cellular Component (CC)Molecular Function (MF)
DB0vsD015334092323
DB1vsD115873942288
DB5vsD518534782721
DB10vsD1016744312467
DB20vsD2013533452007
Table 2. qRT-PCR primer design.
Gene IDGene NameForward Primer 5′−3′Reverse Primer 5′−3′
Chr7.g34634ABA2AGGACAACCTCGGCTTACTACCGTGACATCACAATGGA
Chr5.g06895ABA3TTGGCTACTCTAGCATCGGGCTCTACATCTTGTCCC
Chr5.g06359NCEDAAAATGTACGGCGGTGAGAGTTCTTCTCGTCGTGAACGAACGT
Chr15.g04187ABA8′-HCCTGGGATGTCCAAGTGTTGACGGACCAATCAAACG
Chr4.g40133PYLCCGCCCAAATCATCAATCACTGTGGCCCGCTTCTTA
Chr11.g12785PP2CTTTAATTGACTGCCAGAAGTTTGATACGAAACCACCT
Chr2.g43706dZIPGGTTGATGCGAATGTGGTTGGCGGTGGTAAAGG
Chr8.g54216CKXCGTTGGCGGAGCATTTACGCACCGTTTCAGCAC
Chr3.g17801IPTACTCGTGCTCGGTTACTACAGATTCCACCCTTTGATA
Chr13.g23025ARRATGTTCCTGGGCTTACTATCAAATTATTCTGGTGCTG
Chr13.g24436AHKCTATGACGGCGGATGTCGAAGGGCTTTGAGAC
Chr4.g40568AHPTGCGATGAGCAGAACGACCTTGGAAGCGAACC
Disclaimer/Publisher’s Note: The statements, opinions and data contained in all publications are solely those of the individual author(s) and contributor(s) and not of MDPI and/or the editor(s). MDPI and/or the editor(s) disclaim responsibility for any injury to people or property resulting from any ideas, methods, instructions or products referred to in the content.