Article

The Effect of Head Lettuce (Lactuca sativa var. capitata L.) Cultivation Under Glass with a Light Spectrum-Modifying Luminophore on Crop Traits

by
Barbara Tokarz
1,*,
Zbigniew Gajewski
1,
Wojciech Makowski
1,
Stanisław Mazur
1,
Agnieszka Kiełkowska
2,
Edward Kunicki
3,
Olgierd Jeremiasz
4,
Waldemar Szendera
5,
Wojciech Wesołowski
2 and
Krzysztof M. Tokarz
1,*
1
Department of Botany, Physiology and Plant Protection, Faculty of Biotechnology and Horticulture, University of Agriculture in Krakow, al. Mickiewicza 21, 31-120 Krakow, Poland
2
Department of Plant Biology and Biotechnology, Faculty of Biotechnology and Horticulture, University of Agriculture in Krakow, al. Mickiewicza 21, 31-120 Krakow, Poland
3
Department of Horticulture, Faculty of Biotechnology and Horticulture, University of Agriculture in Krakow, al. Mickiewicza 21, 31-120 Krakow, Poland
4
Helioenergia Sp. z o.o., ul. Rybnicka 68, 44-238 Czerwionka-Leszczyny, Poland
5
The Karol Godula Upper Silesian Academy of Entrepreneurship in Chorzow, ul. Raclawicka 23, 41-506 Chorzow, Poland
*
Authors to whom correspondence should be addressed.
Agronomy 2025, 15(9), 2090; https://doi.org/10.3390/agronomy15092090
Submission received: 10 June 2025 / Revised: 17 August 2025 / Accepted: 26 August 2025 / Published: 30 August 2025
(This article belongs to the Section Horticultural and Floricultural Crops)

Abstract

The present study aimed to evaluate crop characteristics, including morpho-anatomical features and nutritional and health-promoting composition, of head lettuce cultivated in greenhouses covered with transparent glass (control) and glass containing a red luminophore (red). The plant material comprised two lettuce types: butterhead and iceberg. Alterations were observed in head dimensions, morphology, and leaf mesophyll structure of plants from the red greenhouse. Butterhead lettuce plants exhibited unaltered head area under tested conditions but displayed a reduction in accumulated sugars and amino acids, resulting in a decline in dry matter content. Conversely, an increase in soluble and insoluble sugars and amino acid content, along with no change in nitrate content, was observed in iceberg lettuce. However, the growth intensity of iceberg lettuce decreased, while its dry matter content increased. Moreover, phenols and vitamin C concentration were lower in iceberg lettuce than in the butterhead one. In the red greenhouse, the phenolic content declined in both lettuce types, but vitamin C levels were reduced in butterhead lettuce and remained unchanged in iceberg lettuce. The data clearly demonstrate that the extent of variation in crop characteristics observed in lettuce cultivated in the red greenhouse depended on the tested lettuce type, with notable alterations occurring in iceberg lettuce.

1. Introduction

Lettuce (Lactuca sativa L.) is one of the most consumed vegetables in the world [1,2]. The annual global production of lettuce (including endive (Cichorium endivia)) is 27.2 million tons, with China, the United States of America, India, Spain, and Italy representing the largest producers [1]. Lettuce is a low-calorie, low-fat, and low-sodium food. It is a good source of vitamin C, folic acid, dietary fiber, iron, and a variety of other beneficial bioactive compounds, including carotenoids and phenolic compounds [2,3,4]. Given that it is usually eaten raw, it retains more nutrients compared to other vegetables, especially heat-processed ones. It also offers the advantage of being commercially available throughout the year [2]. Lettuce exhibits considerable morphological diversity, presenting a variety of shapes, sizes, and colors. There is a plethora of its types and cultivated varieties. Despite attempts to classify lettuce due to its notable genetic and morphological diversity, a unified system for its categorization has not been established [4,5,6].
Lettuce plants can be cultivated both in open fields and in greenhouses [2]. In recent years, it has become increasingly common to grow it in controlled environments with artificial lighting (CEALs) [2,7]. Light, along with temperature, is one of the most significant determinants of lettuce growth and development [8,9]. Recently, LED systems have become the most common light source for controlled plant cultivation, enabling the use of light with different spectra. Studies investigating the impact of various types of radiation emitted by LED lamps on lettuce cultivation have revealed that a combination of red (660 nm) and blue (450 nm) radiation is essential for the optimal growth of lettuce plants [10]. Red light promotes vegetative growth but has an adverse effect on secondary metabolites. Blue light, on the other hand, stimulates the production of various phytochemicals, such as polyphenols, anthocyanins, vitamin C, and carotenoids [11]. However, it negatively impacts leaf size and plant height [12]. Exposing plants to far-red (FR) radiation before harvesting increases their growth rate and antioxidant content. Meanwhile, enriching light with a spectrum that includes green light enhances photosynthetic efficiency [13]. However, the right combination of red, blue, green, and far-red radiation is key to achieving the most favorable morphological traits, such as maximum height and weight of plants [13].
Following the growing trends of energy generation from renewable sources, efforts to introduce new cultivation technologies are desirable. Such technologies include greenhouse ventilation and heating or irrigation systems powered by a wind turbine or photovoltaic panels [14,15]. Energy consumption can also be reduced by using pulse-LED lighting [16]. Our concept, aligning with innovative technologies using renewable energy sources, is a greenhouse covered with glass sheets containing a photoluminescent pigment that, through the tunnel effect, would transfer absorbed energy to integrated photovoltaic panels (PL patent no 240248 B1) [17]. Nevertheless, the incorporation of a luminophore into the glass modifies the spectral composition of the light reaching the plants and may also influence the growth parameters inside the greenhouse, such as temperature and humidity. Our previous studies demonstrated that the use of red luminophore glass, due to changes in the ratio of blue to red and red to far-red light, affects the chlorophyll content and photosynthetic performance of lettuce [18]. Apart from our research, there are no studies on plants under luminophores with similar effects. Only Loh et al. [19], using simulated greenhouses covered with glass containing different luminophores, showed that the one with the highest light transmission in the red range increased the fresh weight of lettuce. Our research hypothesis assumed that the cultivation of the plants under such light conditions would modify the nutritional and health-promoting properties of lettuce without affecting its morphology excessively. The aim of the present study was to examine the morpho-anatomical features and biochemical composition of head lettuce growing under glass containing a red luminophore.
To ascertain whether the response to the applied conditions is universal among closely related plants, two varieties of lettuce, representing two distinct types, were selected for this study. This study included plants of butterhead lettuce, which is mainly cultivated in Western and Central European countries, and iceberg (=crisphead) lettuce, which is cultivated in Europe, the USA, Japan, China, and Australia [5,6]. The results of this study could provide an important theoretical support for the development and application of modern covers used in greenhouse construction for growing high-quality and healthy vegetables.

2. Materials and Methods

2.1. Plant Materials

The experimental material comprised two types of head lettuce (Lactuca sativa var. capitata): butterhead (Lactuca sativa var. capitata L. nidus tenerrima Helm) cultivar Melodion (seeds obtained from Enza Zaden Ltd., Warsaw, Poland) and iceberg (Lactuca sativa var. capitata L. nidus jäggeri Helm) cultivar Elenas (seeds obtained from Rijk Zwaan Ltd., Blonie, Poland).

2.2. Cultivation Conditions

The experiment was conducted in 2020 at the University of Agriculture in Kraków (Poland). Lettuce seeds were germinated in a peat substrate, Florabalt Seed (Floragard Vertriebs GmbH, Oldenburg, Germany) (pH 5.6; N 140, P2O5 80, and K2O 190 mg·L−1), in 96 cell multi-pots (60 × 40 cm) and kept in a high-tech greenhouse (transplant production) of the Faculty of Biotechnology and Horticulture, University of Agriculture in Krakow (N 50°03′, E 19°57′) for 5 weeks. Before transplanting, plants were fertilized with fertilizer, YaraMila Complex (5% N-NO3, 7% N-NH4); P—11% P2O5; K—18% K2O; Mg—2.7% MgO; S—20% SO3; B—0.015%; Fe—0.20%, Mn—0.02%; Zn 0.02%) (Yara Poland Ltd., Szczecin, Poland), at a dose of 45 g·m−2 (450 kg·ha−1). Subsequently, the experiment was conducted at the vegetable experimental station in Kraków-Mydlniki district (N 50°08′, E 19°85′). The experiment was arranged in a random block design, with four replicates and 10 plants per treatment, at a spacing of 40 × 30 cm. Five-week-old seedlings were transplanted to soil, classified as Fluvic Cambisol (Humic) [20], with pH 6.8, in two small temporary greenhouses: control, white greenhouse—covered with transparent glass, and red greenhouse—covered with glass containing a red luminophore (Helioenergia Ltd., Czerwionka-Leszczyny, Poland) (PL patent No. 240248 B1). During 6 weeks of cultivation, plants were topdressed with ammonium sulphate (34% N) at a dose of 5 g·m−2 (50 kg·ha−1) (2 weeks after transplantation), irrigated in 2-week intervals (20 mm each time), and mechanically weeded (3 times). Spectral characteristics of sunlight reaching the plants were measured using a SpectraPen mini (Photon Systems Instruments, Drásov, Czech Republic) after dark calibration. The average light intensity at midday on a clear and sunny day was 1230 photosynthetic photon flux density (PPFD) (µmol m−2·s−1) in the control greenhouse and 233 PPFD (µmol m−2·s−1) in the red greenhouse. The data concerning air temperatures and relative humidity in experimental greenhouses were collected using ONSET HOBO U23-001A Pro v2 temp/RH Data Loggers (Onset Computer Corporation, Bourne, MA, USA) (see Supplementary Materials: Figures S1, S3, and S4). Daily average irradiance during the experiment was obtained from the PHOTOVOLTAIC GEOGRAPHICAL INFORMATION SYSTEM website [21] (Figure S2).

2.3. Estimation of Morpho-Anatomical Parameters of Lettuce Plants

2.3.1. Lettuce Head Morphology

Three randomly selected heads of lettuce from each combination were photographed in the laboratory using an Olympus SP-500 UZ Digital Camera (Olympus Imaging Corp., Tokyo, Japan) in vertical projection. The size of lettuce heads, assessed as the total surface area covered by each head, was measured using Levenhuk Lite (Levenhuk, Inc., Tampa, FL, USA), an image processing software.

2.3.2. Lettuce Leaf Anatomy and Thickness

Samples for microscopic examination were taken from lettuce wrapper leaves. Sections of 5  mm × 10  mm from the central part of the blade (intervein space in the proximity of the midrib) were excised, fixed in a solution containing 100% ethanol and acetic acid (3:1), and stored at 4 °C. The samples were washed thrice in 100% ethanol. Dehydrated samples were then infiltrated with a mixture of 3:1, 1:1, and 1:3 ethanol and Technovit 7100 resin (Heraeus Kulzer GmbH., Hanau, Germany) for 1 h at room temperature. Subsequently, the samples were incubated in a 100% infiltration solution overnight at room temperature. After that, the infiltration solution was removed, and an embedding solution was applied. The embedding solution consisted of the initial infiltration solution mixed with the supplied hardener. Polymerization was conducted in an incubator at 37 °C for 1 h [22]. Semi-thin sections (4 µm) were prepared using a rotary microtome Leica RM2145 (Leica Camera, Wetzlar, Germany) with a disposable carbide TC-65 blade (Leica Microsystems GmbH., Wetzlar, Germany). Sections were affixed to slides at 70 °C and stained with a 1% (w/v) solution of Toluidine blue O in water (Sigma-Aldrich). Analyses of the preparations, as well as measurements of leaf thickness (5 points of measurements from 3 leaves of each combination), were obtained using a Zeiss Axio Imager M2 microscope (Carl Zeiss Imaging Solutions GmbH., Oberkochen, Germany) and Axio Vision Rel. 4.8 (Carl Zeiss Imaging Solutions GmbH., Oberkochen, Germany) as the image processing software. Photographs were captured using a digital camera, namely, Canon PowerShot G10 (Canon Inc., Tokyo, Japan).

2.3.3. Lettuce Leaf Dry Weight Content

Single lettuce leaves were collected from three heads of each combination directly after harvest and weighed. The collected material was freeze-dried for 72 h and reweighed. The percentage content of dry weight (DW) in the plant tissue was calculated according to the following formula: DW [%] = DW × 100/FW, where: DW is the weight after freeze-drying and FW is the weight before freeze-drying.

2.4. Biochemical Analysis

2.4.1. Phenolic Compound Content Determination

The extraction of the samples was performed according to Makowski et al. [23]. Plant tissue (20 mg of homogenized dry weight) from each sample was placed in an Eppendorf tube and extracted in 2 mL of 80% methanol by sonication in an ultrasonic bath (2 × 30 min, 22 ± 3 °C). The samples were centrifuged for 15 min (15,000× g, 4 °C), and supernatants were filtered through sterilizing syringe filters (0.22 μm, Millex®GP, Merck Millipore, Burlington, MA, USA). Each examined experimental combination of lettuce type and cultivation conditions was represented by five biological repetitions. The extracts were stored at −20 °C for up to one week and used for spectrophotometric estimation of the total phenolic content, phenylpropanoids, flavonoids, anthocyanins, estimation of cupric-ion-reducing antioxidant capacity, and accumulation of free amino acids.
The total phenol content was estimated using the spectrophotometric method with Folin–Ciocalteu reagent [24], with modifications [25]. Methanolic extracts were diluted 10 times with distilled water. Briefly, 1.0 mL of diluted extract was mixed with 0.2 mL of Folin’s reagent (Sigma-Aldrich Chemie, GmBH, Steinheim, Germany) and 1.6 mL of 5% Na2CO3 and then incubated for 20 min at 40 °C. The absorbance of mixtures was measured at 740 nm wavelength. Chlorogenic acid (Sigma-Aldrich Chemie, GmBH, Steinheim, Germany) was used as a reference standard. The results were expressed as milligrams of chlorogenic acid equivalent per 1 g of DW.
To determine the accumulation of phenylpropanoids, flavonoids, and anthocyanins in plant tissue, the method by Fukumoto and Mazza [26] was used, with modifications [27]. The supernatant (0.25 mL) was mixed with 0.25 mL of 0.1% HCl in 96% EtOH and 4.55 mL of 2% HCl in H2O, and the mixtures were incubated for 20 min in the dark at room temperature (21 ± 1 °C). The absorbance of samples was measured at wavelengths of 320, 360, and 520 nm. The contents of phenylpropanoids, flavonoids, and anthocyanins were calculated using calibration curves made for caffeic acid, quercetin, and cyanidin (Sigma-Aldrich Chemie, GmBH, Steinheim, Germany), respectively. The results were expressed as milligrams of standard equivalent per 1 g of DW.
All analyses were performed in five replicates.

2.4.2. Cupric-Ion-Reducing Antioxidant Capacity Assay

The CUPRAC (cupric-ion-reducing antioxidant capacity) assay was performed according to Apak et al. [28], with modifications [29]. Briefly, 1 mL of 10 mM CuCl2, 1 mL of 7.5 mM neocuproine (Sigma-Aldrich) in 96% ethanol, and 1 mL of 1 M NH4Ac buffer (pH 7.0) were mixed with 0.3 mL of the methanolic extract and 0.8 mL of water. The absorbance was measured at 450 nm after 5 min. The results were expressed as mmol Trolox (Sigma-Aldrich) per 1 g of DW. Analyses were performed in five replicates.

2.4.3. L-Ascorbic Acid Content Determination

The L-ascorbic acid level (LAA) was determined by Tillman’s titration method [30]. Plant material (12.5 g FW) was homogenized with 50 mL of 1% acetic acid as an acidity regulator, and after 30 min, the extract was titrated with Tillman’s reagent (2,6-dichlorophenolindophenol). Excessive dye in an acidic environment gives a pink color and marks the end point of the titration. The content of LAA in the sample was calculated based on the amount of Tillman’s reagent used for titration and was expressed as mg of LAA per 1 g of FW. Analyses were performed in four replicates.

2.4.4. Sugar Content Determination

Soluble and insoluble sugar contents were determined using the spectrophotometric method with anthrone reagent [31] according to Miernicka et al., with modifications [32]. Ten mg of DW tissue was extracted overnight in 1 mL Milli-Q-ultrapure water (Millipore Direct system Q3). The samples were centrifuged for 10 min (15,000× g, room temperature), and the supernatants were collected. The aqueous supernatant was used for the determination of soluble sugars. The pellet was resuspended in 0.1 M H2SO4 (0.5 mL) and heated at 80 °C for 60 min. The acid supernatant was used for the determination of insoluble sugars. Briefly, 0.2 mL of extracts (aqueous or acid) was mixed with anthrone reagent solution (1 g anthrone in 500 mL 72% H2SO4) and incubated at 95 °C for 15 min. The reaction was terminated on ice. The absorbance (630 nm) of the samples was measured on a Genesys 10 VIS spectrophotometer (Thermo-Fischer Scientific, Waltham, MA, USA) at room temperature. The standard curve was prepared using glucose. The content of sugars (separate soluble and insoluble) was expressed as milligrams of glucose in 1 g of DW tissue. Analyses were performed in five replicates.

2.4.5. Free Amino Acid Content Determination

The content of free amino acids in lettuce tissue was determined according to Kamińska et al. [33], with some modifications. Briefly, 0.2 mL of the methanolic extract was mixed with 0.5 mL of 0.2% ninhydrin in isopropanol and 0.3 mL of isopropanol. Test tubes with mixtures were vortexed and incubated at 85 °C for 15 min. Absorbance was recorded at 570 nm. Glycine was used for the standard curve. The results were expressed as micrograms of glycine per 1 g of DW. Analyses were performed in five replicates.

2.4.6. Determination of Nitrate Concentration (NO3)

Nitrate concentration was measured according to the method described by Wojciechowska et al. [34]. NO3 was extracted from the plant tissue (0.2 g DW) with 30 mL of 0.02 M aluminum sulphate (Al2(SO4)3 × 18H2O) every 1 h under shaking. The extract was filtered through qualitative medium filters. To determine the concentration of nitrates in the filtrate, an ion-selective electrode (Orion Products) connected to an ORION 920+ ionometer (Thermo-Fischer Scientific, Waltham, MA, USA) was used. The results were expressed as mg of NO3 per 1000 g DW [ppm]. Analyses were performed in five replicates.

2.5. Statistical Analyses

A two-way analysis of variance (ANOVA) was performed to determine significant differences between means during the statistical elaboration of the examined parameters (Tukey’s test at p < 0.05 level). STATISTICA 12.0 (Stat Soft Inc., Tulsa, OK, USA) was used to conduct statistical analyses. The data were subjected to principal component analysis (PCA). PCA was performed for all analyzed traits for butterhead and iceberg lettuce separately in R v 4.4.1 [35] with the prcomp() function. The results were visualized for the first and second principal components with the fviz_pca_var() function from factoextra v. 1.0.7.

3. Results

3.1. Cultivation Conditions

During the experiment, the cultivation conditions (light spectrum, ambient temperature, and relative air humidity) were monitored and recorded in both greenhouses (control and red greenhouses). The spectral characteristics of light in every object are presented in Figure 1. Measurements conducted within the 300–870 nm range revealed considerable discrepancies in the spectral composition of radiation within the PAR range (400–700 nm) that reached the plant surface in the case of greenhouses covered with glass with a red luminophore. In comparison to the white greenhouse, a notable increase in the proportion of red light (625–700 nm) relative to blue light (400–450 nm) was observed in this facility. Additionally, the presence of far-red radiation (700–800 nm) was observed in the spectra of both greenhouses. Nevertheless, there was less far-red radiation (0.6) relative to red radiation (1) in the red greenhouse compared to the control greenhouse, where the ratio of far-red to red radiation was 0.8:1.
The altered light spectrum can modify other growing conditions, such as temperature and humidity. The average daily air temperature for the entire experimental period in the red greenhouse (19.8 °C) was comparable to that of the control greenhouse (20.5 °C) (Figure S2). The mean minimum temperature was identical for both greenhouses, with a value of 11.6 °C. In contrast, the mean maximum temperature exhibited variation, with 30.2 °C observed in the red greenhouse and 32.4 °C in the control one (Figure S1). Regarding air temperature on successive days of the experiment, the recorded values (minimum, maximum, and average) in the red greenhouse (Figures S1 and S2) were comparable or aligned with those observed in the control greenhouse. The discrepancies between the mean air temperatures on consecutive days of the experiment in various greenhouses did not exceed 2.5 °C (with an average of 0.7 °C).
The use of red luminophore glass had a negligible impact on the relative air humidity within the greenhouse. The average air humidity remained at a comparable level of approximately 80%, irrespective of the cultivation method employed (Supplementary Materials, Figure S4). While the average minimum humidity was 25.2% and 27.8% in the control and red greenhouses, respectively, the average maximum humidity in both greenhouses was 99.4%.

3.2. Morpho-Anatomical Traits

3.2.1. Morphology of Lettuce Plants

The morphological characteristics of the lettuce heads were evaluated, and significant differences were observed in plants grown in a greenhouse covered with red luminophore glass. These differences were particularly evident in lettuce belonging to the iceberg type (Figure 2A and Figure S5). The morphology of the heads was found to be similar across all lettuce types cultivated in the control transparent greenhouse. The growth of butterhead-type lettuce under glass with a red luminophore resulted in a slight deformation in shape. The heads exhibited less well-knotted structures with spreading leaves and elongated petioles. The impact of the luminophore on the iceberg lettuce was particularly pronounced. The heads were notably diminutive and markedly deformed, and the leaves were elongated and contorted (Figure 2A and Figure S5).
The cultivation method had no effect on the size of the butterhead lettuce heads, which were found to be of similar sizes (927.6–1191.9 cm2). This was also the case when comparing it to iceberg lettuce grown in the control transparent greenhouse (1011.6 cm2) (Figure 2B). In contrast, the head area of iceberg lettuce cultivated in the red greenhouse was over two times smaller (389.7 cm2) than in the control greenhouse (Figure 2B).

3.2.2. Anatomy of Lettuce Plants

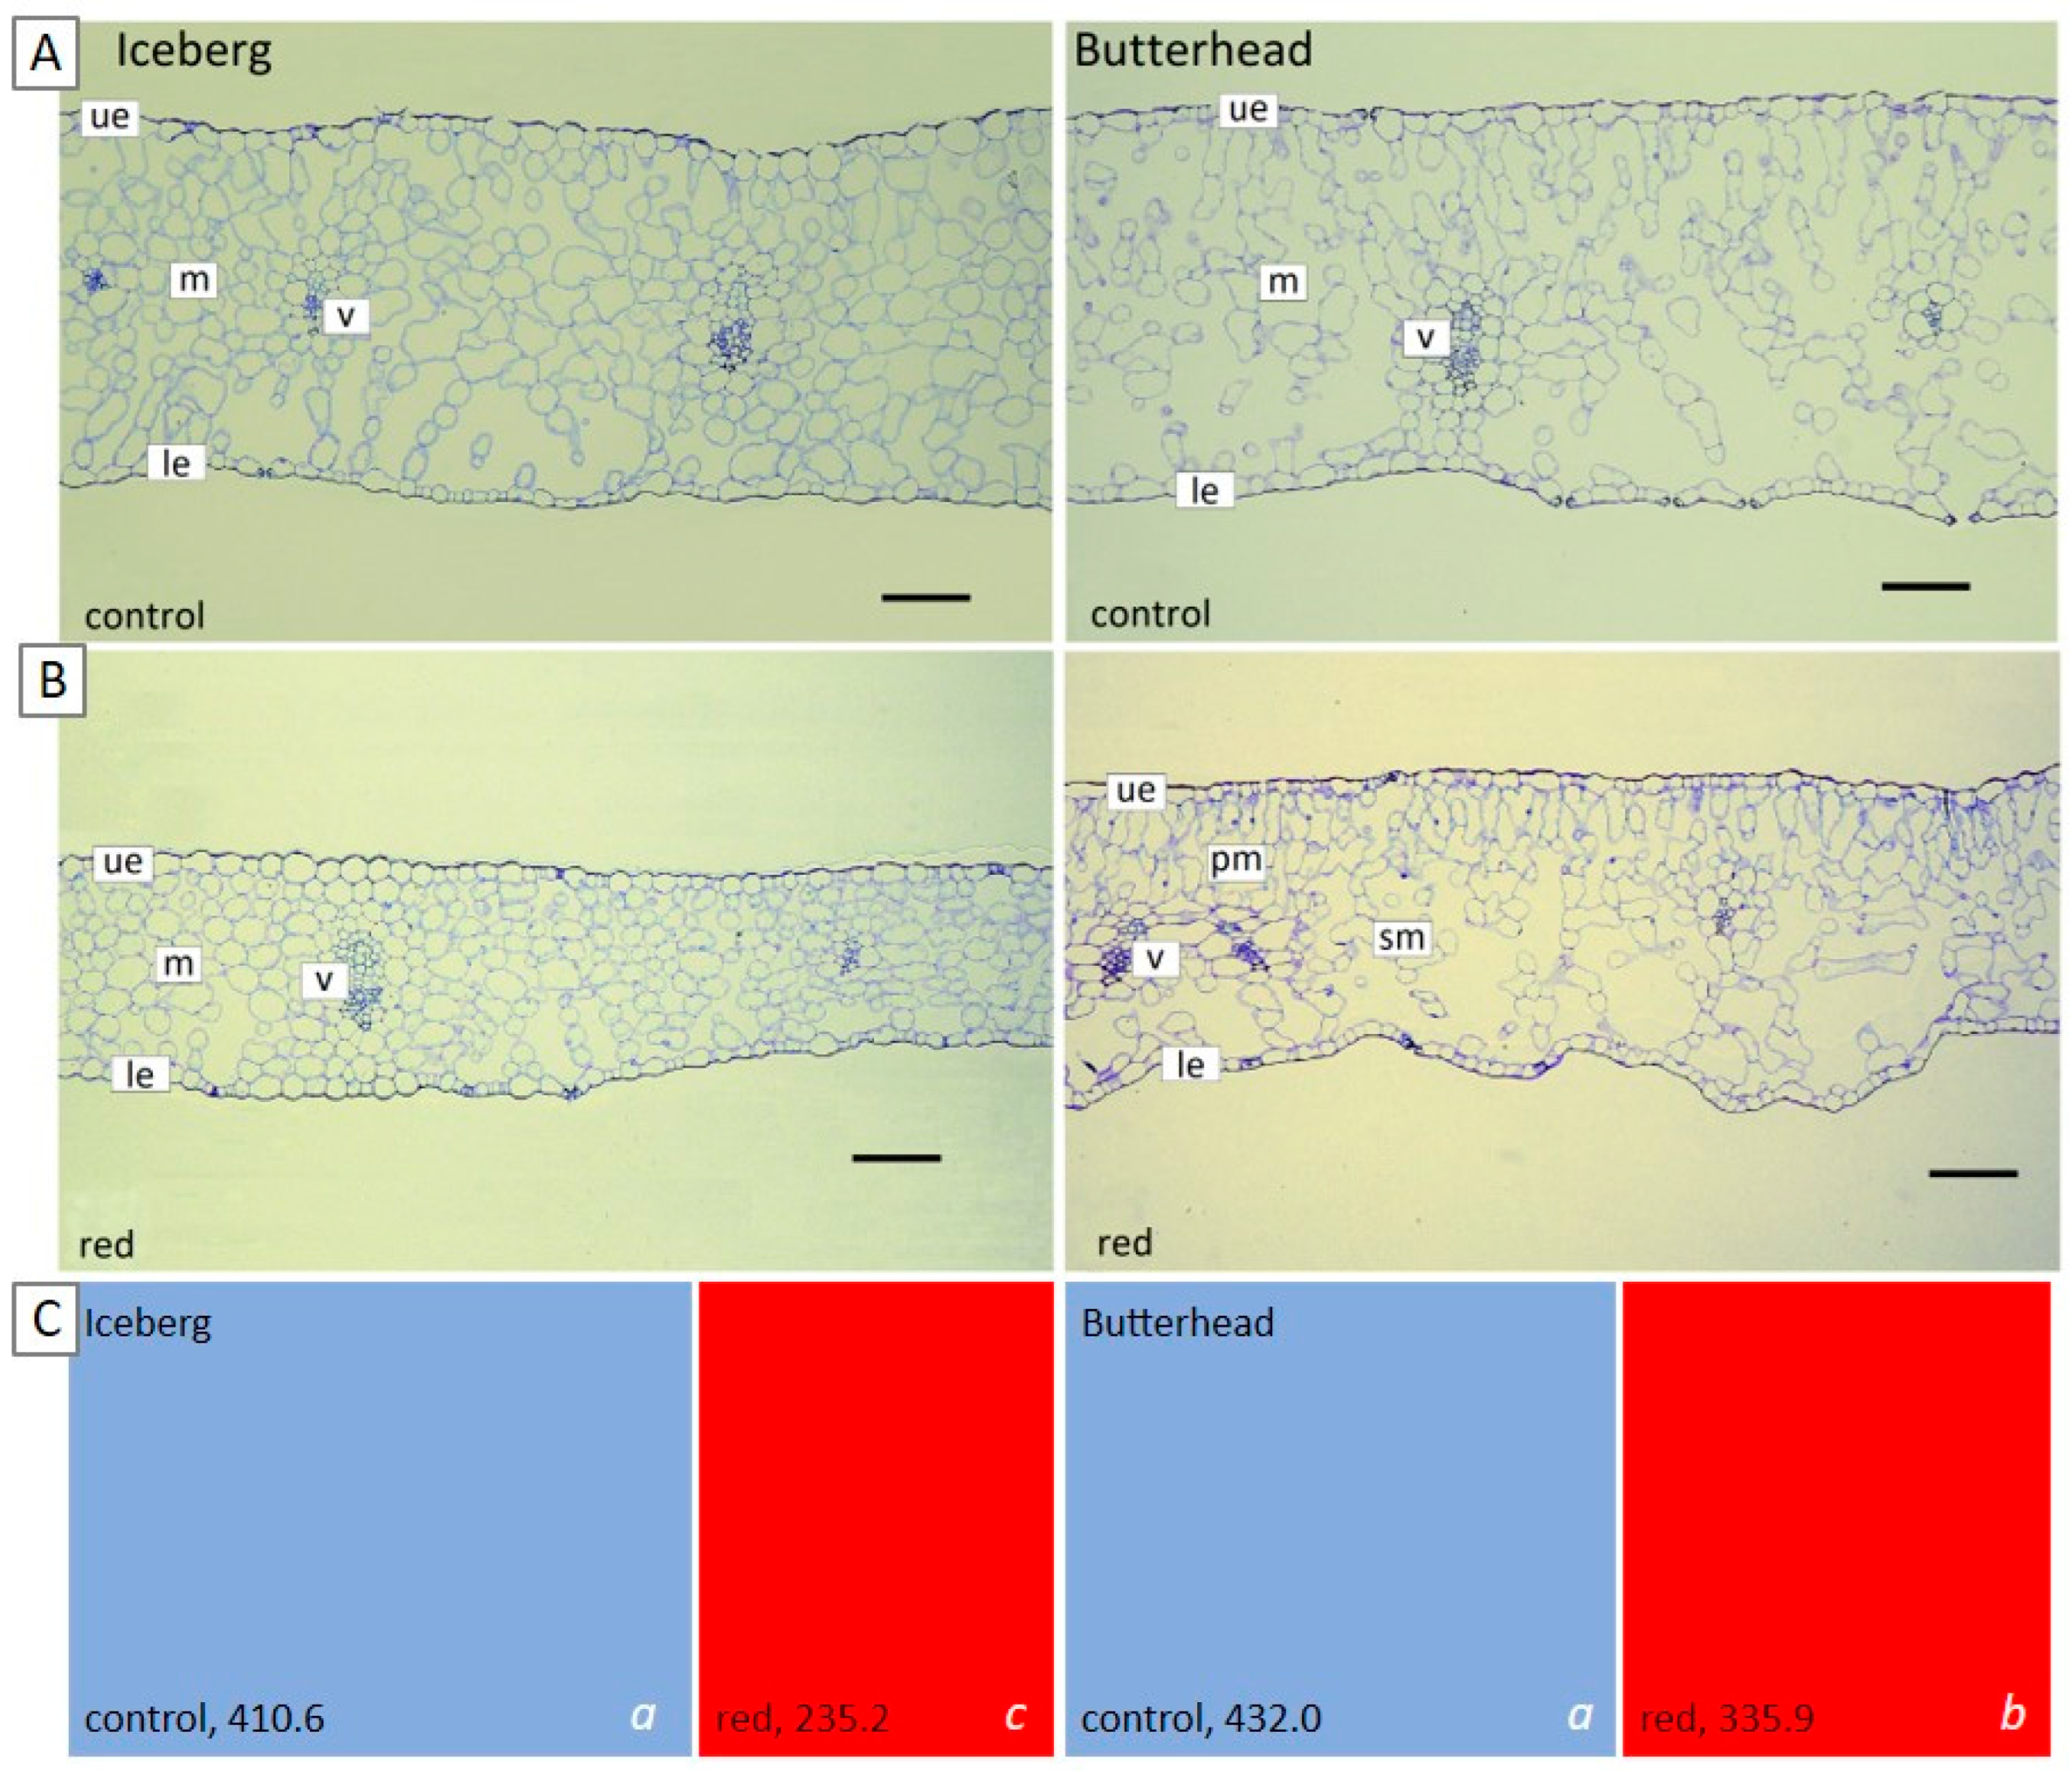
Anatomical analyses of leaf samples of iceberg and butterhead lettuce grown in the white greenhouse (control) revealed only minor differences in the structure (Figure 3A). In both cases, no differentiation between palisade and spongy parenchyma was observed. However, compared to iceberg-type lettuce, the mesophyll cells in the leaves of butterhead lettuce exhibited a looser layout with a strongly developed intercellular space. Furthermore, the leaves of iceberg lettuce grown under red luminophore glass exhibited no differentiation between palisade and spongy mesophyll (Figure 3B). In these samples, the mesophyll appeared more compact with a reduction in intercellular space. The slight differentiation of the palisade and spongy parenchyma was observed only in the leaves of butterhead-type lettuce cultivated under red light.
The thickness of the leaf blades in both types of lettuce grown in the white greenhouse was found to be very similar (410.6 and 432.0 µm) (Figure 3C). Significantly thinner leaf blades were observed when lettuce was grown in the red greenhouse. In the case of butterhead lettuce, the leaf thickness was 335.9 µm, and in the case of iceberg lettuce, it was only 235.2 µm, which was almost twice as thin compared to the leaves of plants grown in the control greenhouse.

3.2.3. Dry Weight Content

The percentage of dry matter content exhibited significant variation in the leaves of both lettuce types, depending on the specific cultivation conditions (Table 1). However, notable differences in the response of the different lettuce types were observed. Dry matter content increased in iceberg lettuce leaves and decreased in butterhead lettuce leaves cultivated in the red greenhouse (Table 1).

3.3. Antioxidant Properties of Lettuce Leaves

The content of phenolic compounds and antioxidant capacity (CUPRAC) were statistically significantly different both between lettuce types and cultivation conditions (Figure 4). The total phenol (TP) content was statistically significantly higher in butterhead lettuce than in iceberg lettuce (Figure 4A). The lower TP contents in both types of lettuce were recorded in plants growing in the greenhouse covered with red luminophore glass. Regarding phenylpropanoid and flavonoid contents, the differences between lettuce types were the same as in the TP content (Figure 4A). Cultivation in the greenhouse covered with red luminophore glass reduced the accumulation of these compounds in the plants. In contrast, the anthocyanin content was higher in iceberg lettuce than in butterhead lettuce grown under transparent glass. However, the cultivation of iceberg lettuce in the red greenhouse reduced anthocyanin content. In turn, there were no significant differences in anthocyanin content between butterhead lettuce plants growing in different greenhouses (Figure 4A). The differences in antioxidant capacity were similar to the TP content (Figure 4B). In contrast, the ascorbic acid content was higher in butterhead lettuce than in iceberg lettuce (Figure 4C). The cultivation of lettuce in the greenhouse covered with red luminophore glass reduced the content of LAA in butterhead lettuce but did not change that in iceberg lettuce (Figure 4C).

3.4. Amino Acids, NO3−, and Sugar Concentration in Lettuce Leaves

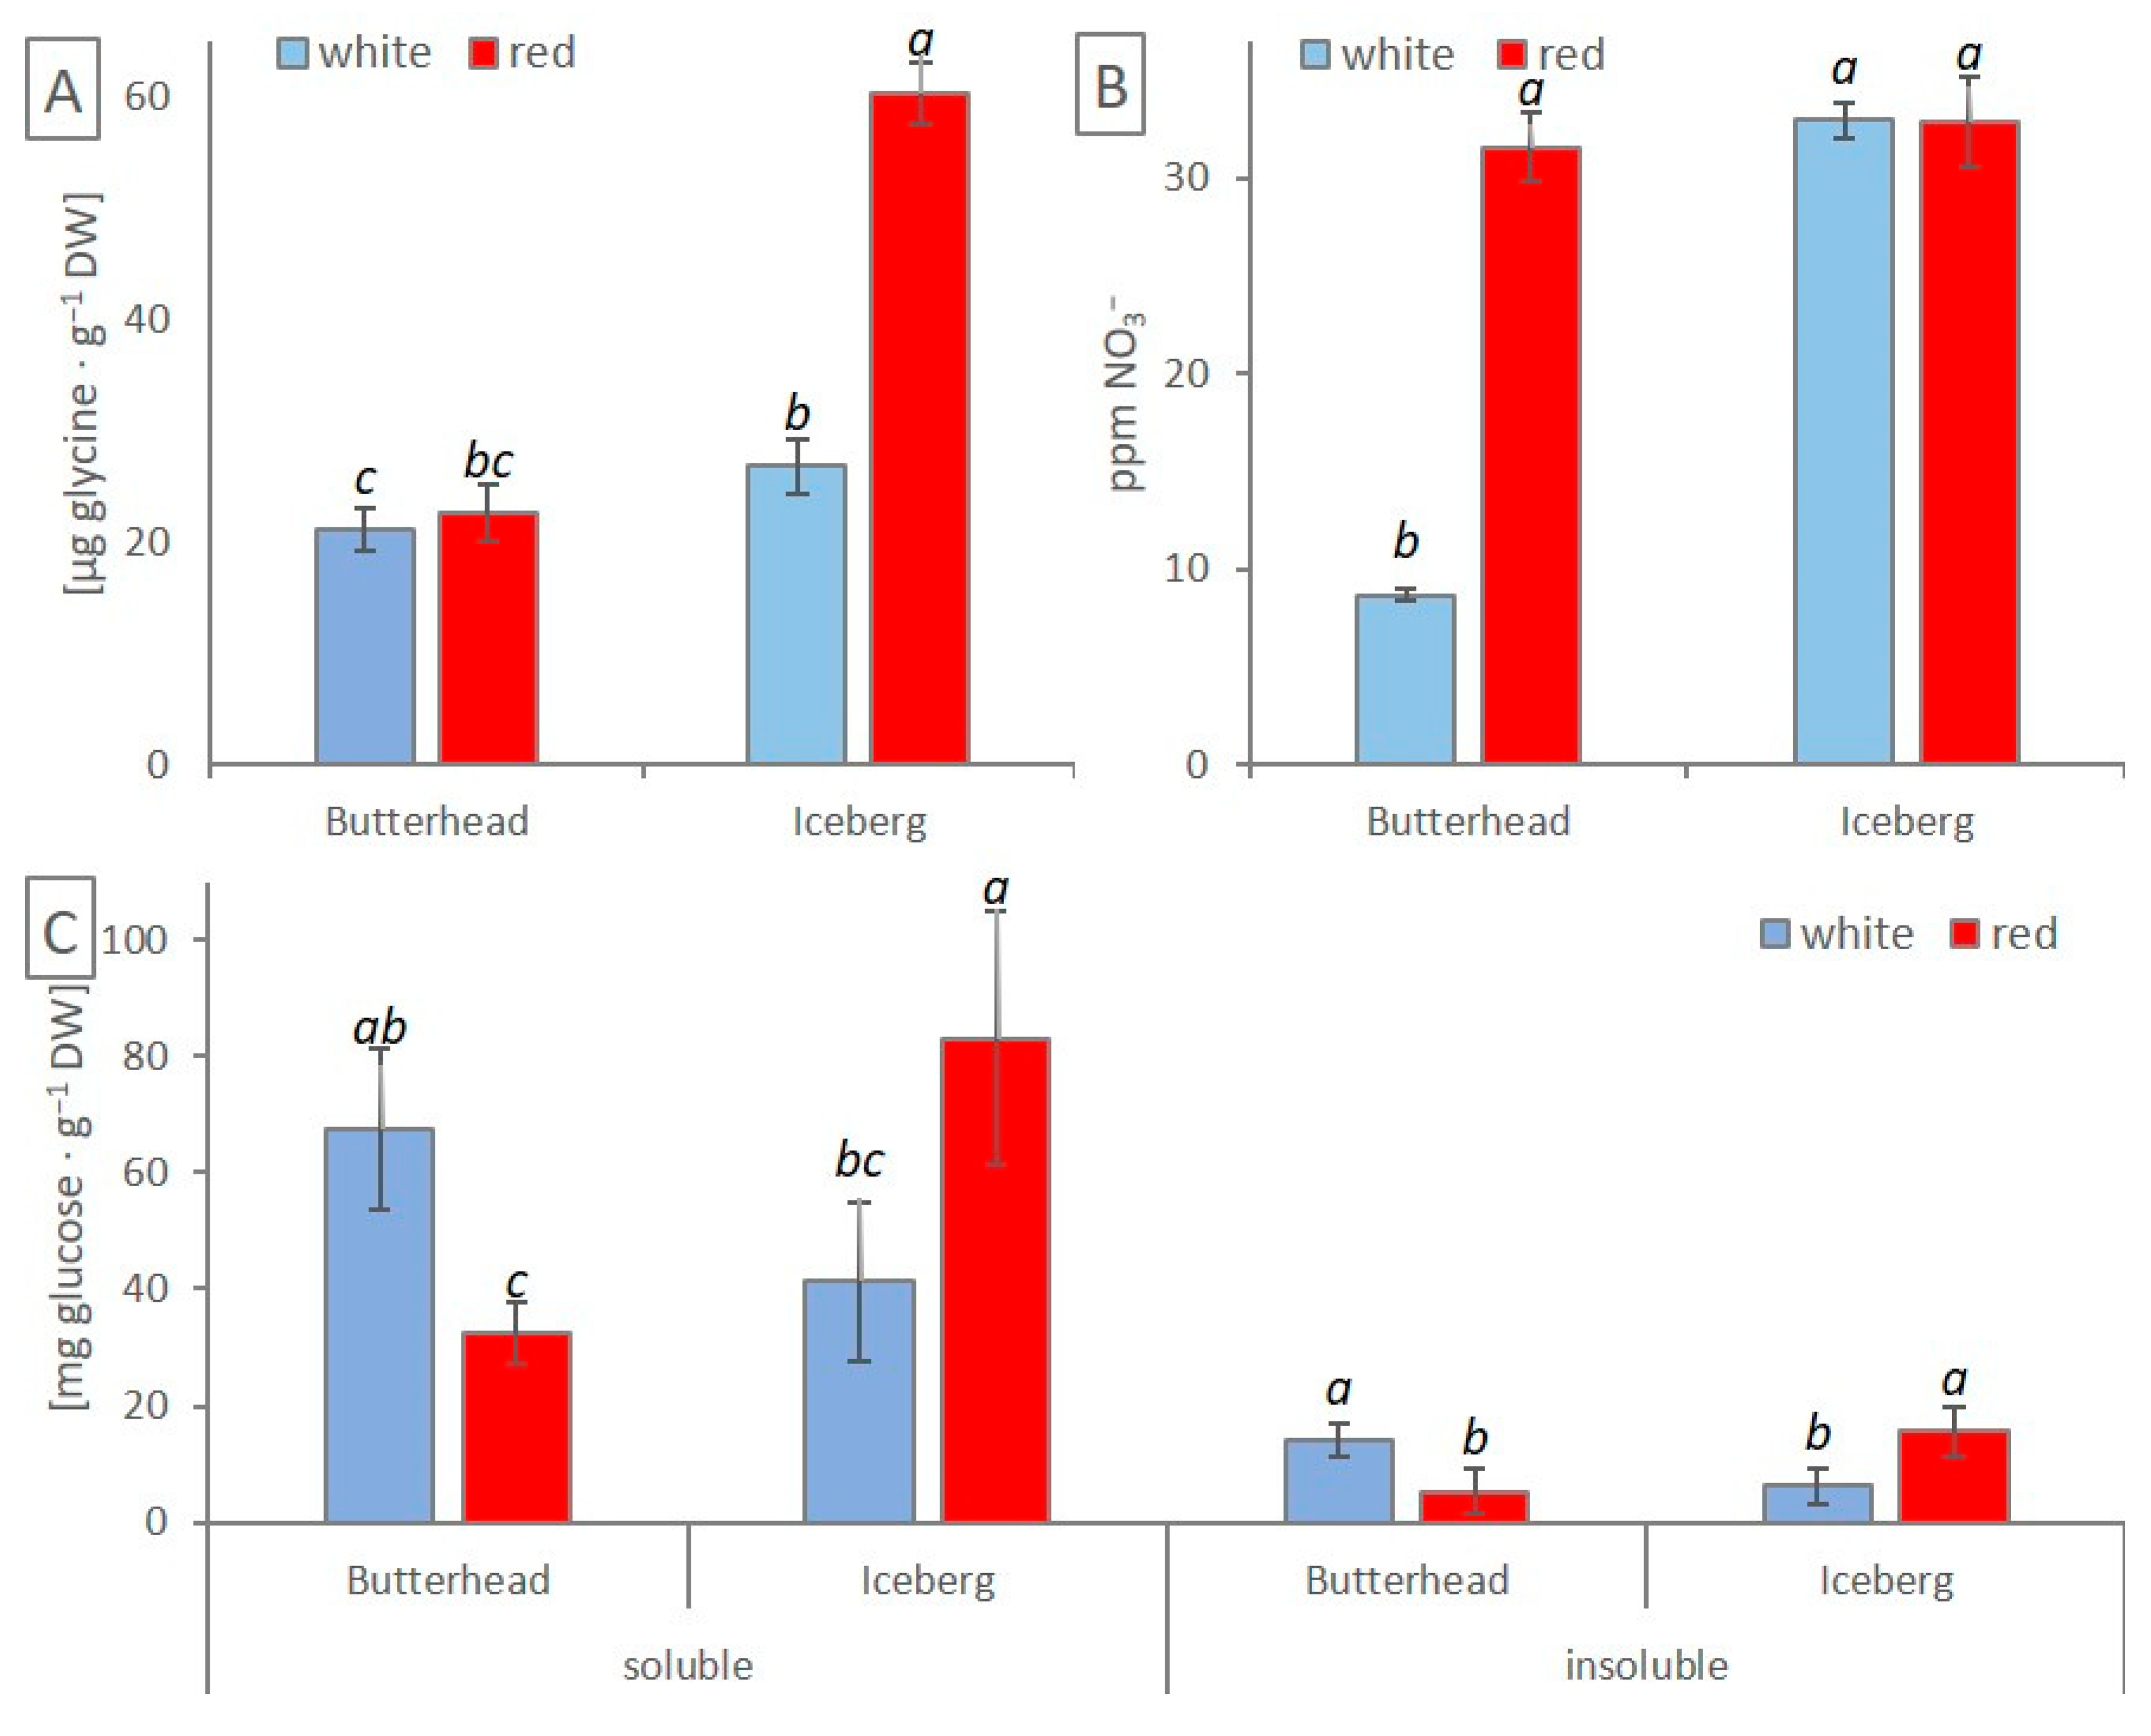
Growing lettuce in a greenhouse covered with red luminophore glass led to an increased accumulation of free amino acids in iceberg lettuce and no changes in butterhead lettuce (Figure 5A). In turn, the accumulation of nitrate increased in butterhead lettuce and did not change in iceberg lettuce cultivated in the red greenhouse (Figure 5B).
The content of soluble and insoluble sugars was significantly different, depending on the lettuce type and cultivation conditions. A higher content of soluble sugars was found in butterhead lettuce cultivated in the transparent greenhouse, while cultivation in the ‘red’ greenhouse enhanced the soluble sugar content in iceberg lettuce (Figure 5C). Similarly, the content of insoluble sugars was higher in butterhead lettuce grown in a transparent greenhouse and in iceberg lettuce grown in a greenhouse covered with red luminophore glass (Figure 5C).

3.5. Principal Component Analysis Biplots

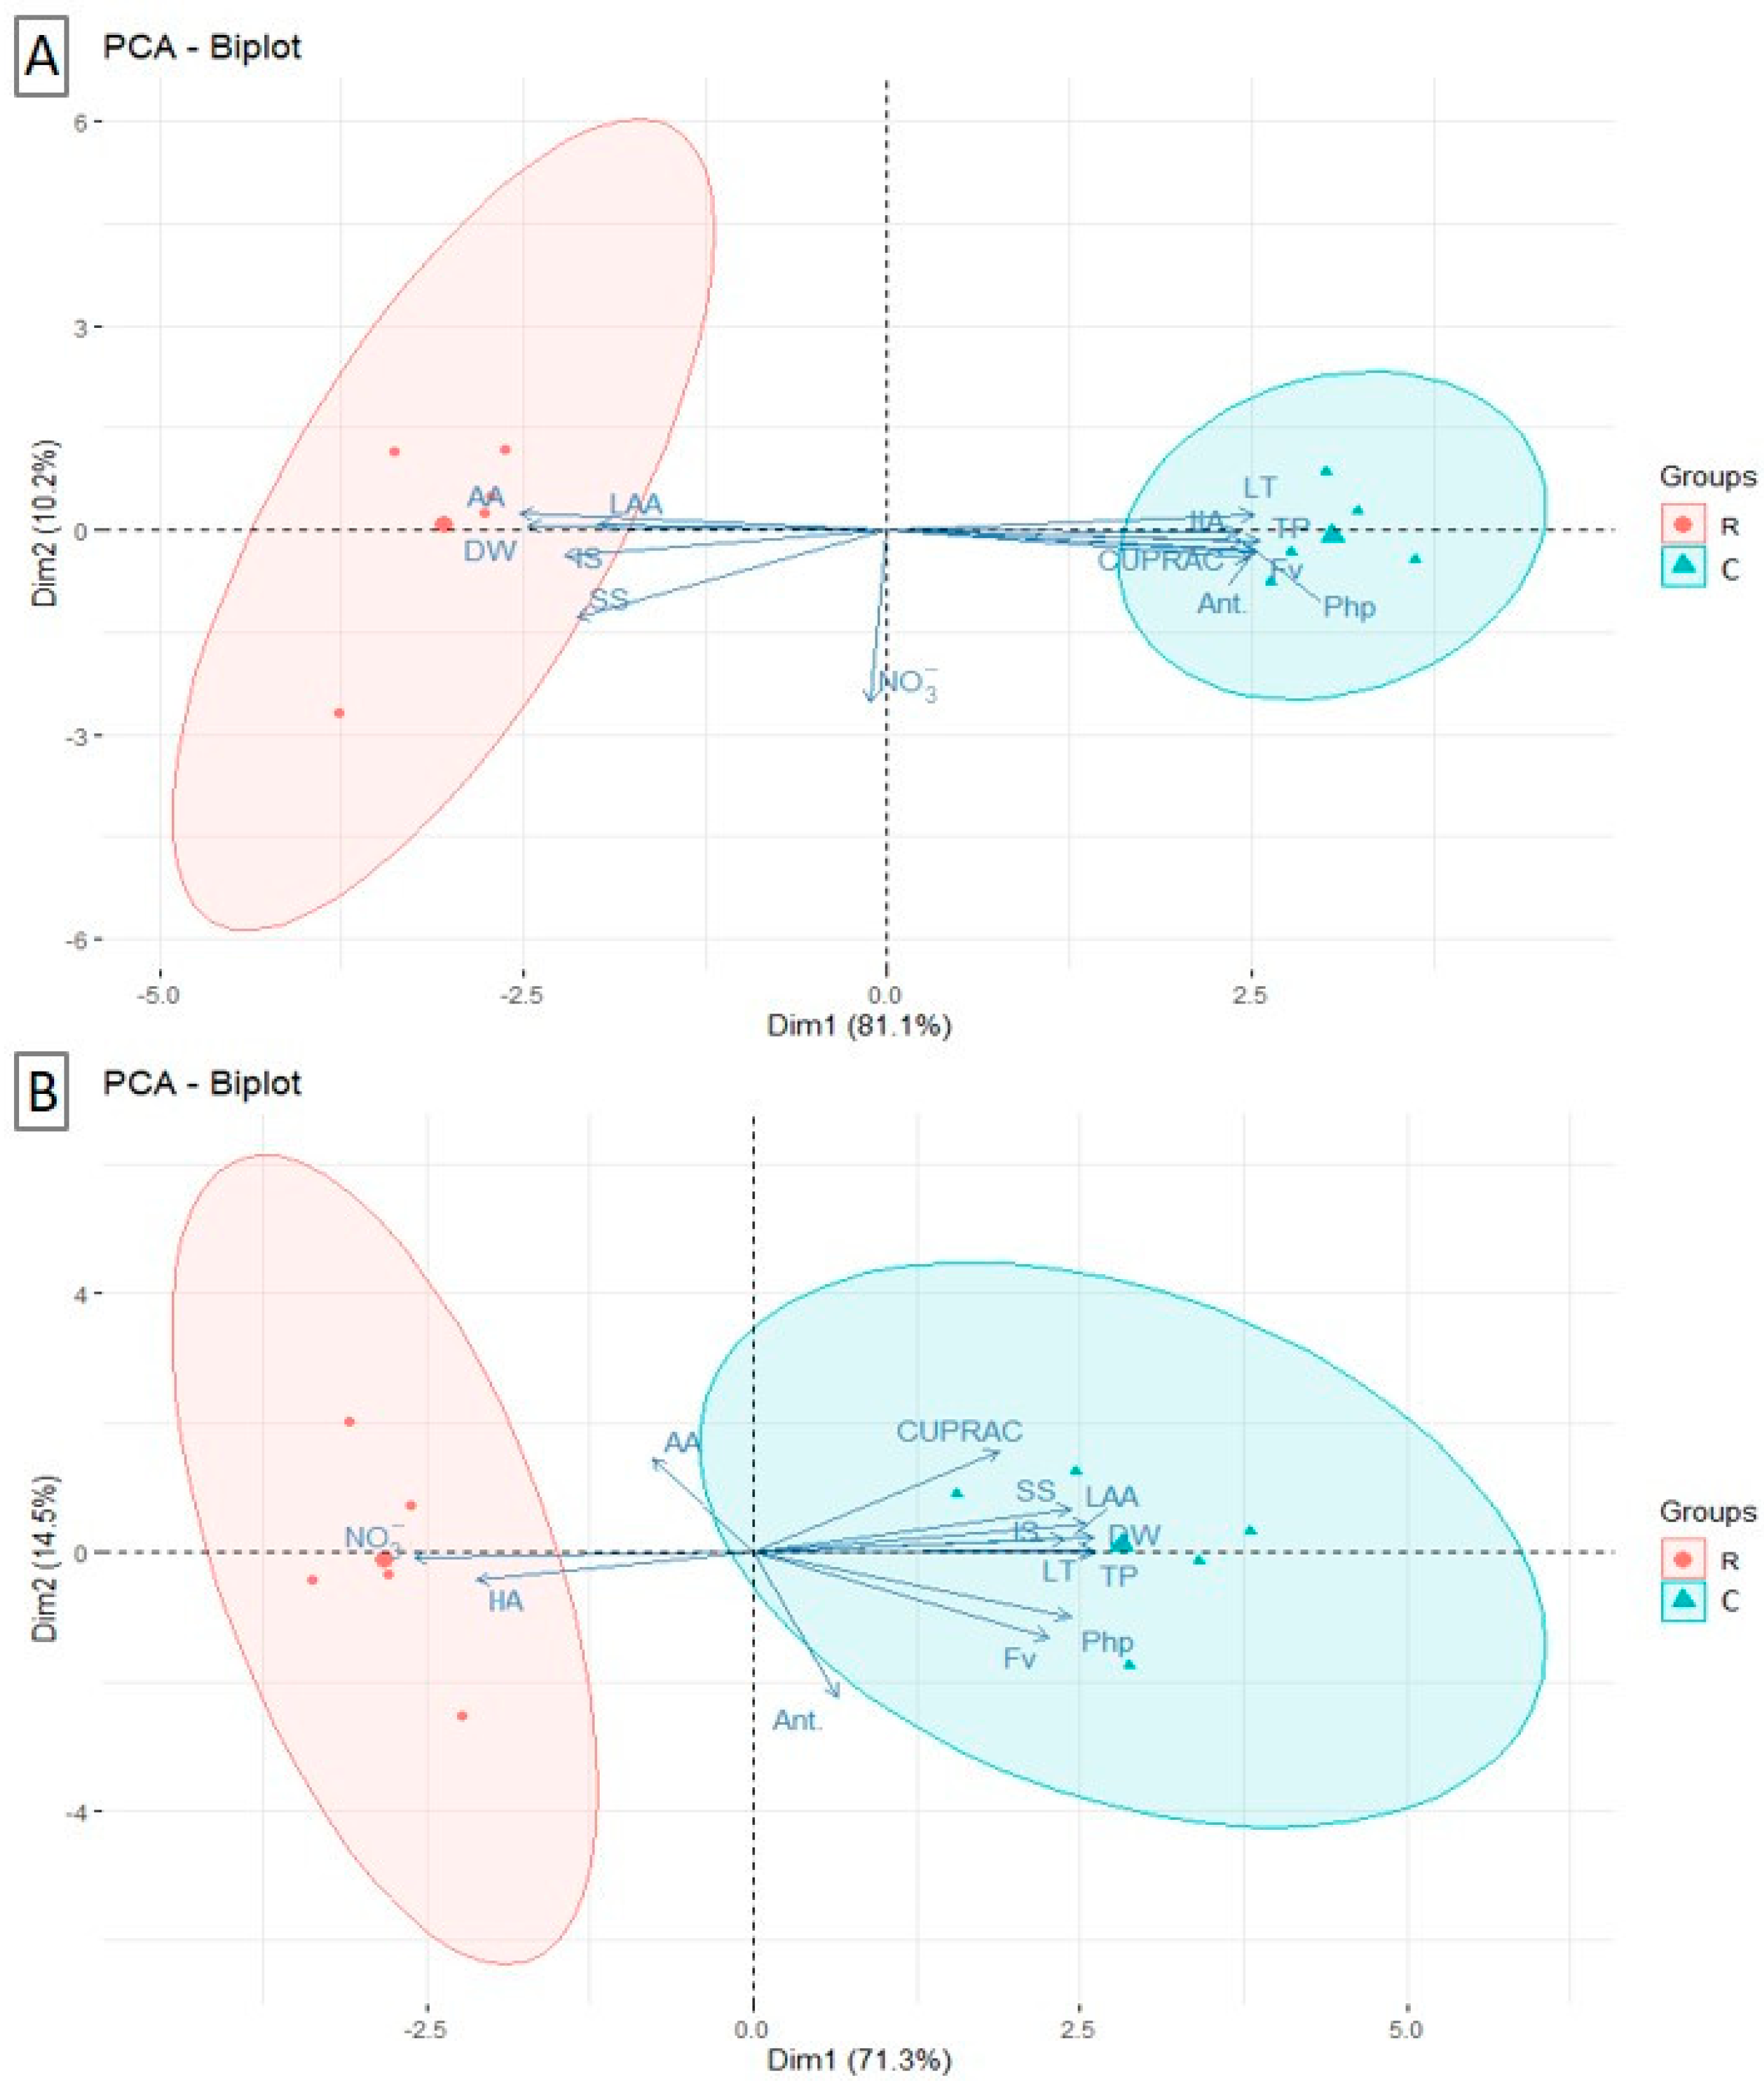
PCA biplots were generated for iceberg and butterhead lettuce separately (Figure 6). The biplots indicate that for iceberg lettuce, both principal components explained more than 90% of the total variance, with the first principal component (Dim1) explaining 81.1% and the second one (Dim2) explaining 10.2% (Figure 6A). The analysis revealed clear differences in iceberg lettuce responses, depending on the greenhouse used, as distinguished by Dim1. The PCA biplots also explained almost 86% (Dim1: 71.3%, Dim2: 14.5%) of the total variance in butterhead lettuce (Figure 6B). As with iceberg lettuce, butterhead lettuce exhibited differential reactivity to cultivation in different greenhouses, as discriminated by Dim1.
Furthermore, the analysis revealed that iceberg lettuce reacted to cultivation in the red greenhouse with an increase in the content of dry weight, amino acids, ascorbic acid, and soluble and insoluble sugars (Figure 6A), while the cultivation of butterhead lettuce in the red greenhouse resulted in increased nitrate content and head area (Figure 6B).
For both lettuce types, PCA biplots revealed a positive correlation between different groups of phenols (total phenols, phenylopropanoids, and flavonoids) and antioxidant activity (CUPRAC) (Figure 6A,B). These parameters were also positively correlated with sugars, ascorbic acid, and dry weight content in butterhead lettuce (Figure 6B). In contrast, the correlation between these parameters was negative in iceberg lettuce (Figure 6A). The next section provides a concise and precise description of the experimental results, their interpretation, as well as the experimental conclusions that can be drawn from this study.

4. Discussion

The analysis of temperature and humidity in the greenhouses revealed that the observed differences in the morphological, anatomical, and physiological responses of the tested lettuce types are primarily attributable to the altered spectral composition of light, rather than thermo-humidity differences.
Plant growth and physiology are markedly influenced by blue and red light [36]. Recently, green light has also been recognized as an important factor regulating plant metabolism by, for example, increasing the activity of certain enzymes [37]. It appears that an increase in red light radiation is most beneficial to plants as it most efficiently increases the efficiency of photosynthesis [10]. However, an excess of red light with a concomitant deficiency of blue light leads to developmental disorders. In extreme cases, these manifest as the ‘red light syndrome’, which impairs plant growth and development, especially of leaves [10,38]. Lettuce is particularly susceptible to blue light [13,38], and the impact of the blue-to-red light ratio on its growth has been extensively investigated [14,39,40,41]. The available literature indicates that the optimal balanced ratio of blue to red light falls between 1:1 and 1:7 [42]. Consequently, the ratio of blue to red light applied in this study, which was 1:1 under control conditions and 1:2 under the glass with the red luminophore (Figure 1), can be considered optimal. However, the findings of this study demonstrate that the ratio of blue to red light in the red greenhouse significantly influenced the morphology and physiology of lettuce plants.
The alterations to the lettuce heads’ architecture can be attributed to fluctuations in the quality of light reaching the plants. Azad et al. [40] described alterations in the morphology of lettuce plants exposed to a markedly elevated ratio of red to blue light. The plants exhibited a greater degree of leaf spreading with elongated petioles. Such alterations were observed in the case of the butterhead-type lettuce in our experiment. The rapid response of lettuce to low blue light fractions, manifested by minimal leaf expansion, has also been previously documented by Dougher and Bugbee [38]. In contrast, Son and Oh [43] reported elongated leaves in some lettuce cultivars deprived of blue light. Furthermore, the growth of lettuce was also affected by radiation in the far-red (FR) range. This range of radiation is also of great significance with regard to morphogenesis, exerting a pronounced influence on plant architecture. The study conducted by Meng and Runkle [44] revealed that the growth and morphology of lettuce are markedly influenced by the simultaneous presence of far-red radiation and the ratio of blue to red light. In general, the addition of far-red radiation has a beneficial effect on plant growth. However, this effect is significantly diminished when the ratio of blue to red light is reduced, as observed in the red greenhouse in our experiment. In contrast, Chen et al. [45] reported that lettuce plants display a twisted morphology when subjected to an increased proportion of far-red light in the spectrum. We also noted a disturbed and twisted leaf morphology of iceberg lettuce plants growing in the red greenhouse. Moreover, plant morphology also strongly depends on the ratio of red to far-red radiation. Elongated petioles in both types of lettuce growing in a red greenhouse may indicate the occurrence of shade avoidance syndrome (SAS). At low r/fr ratio conditions, a response mediated by phytochrome A (phyA) is triggered in plants, leading to enhanced elongation growth of organs [46]. Furthermore, variations in the spectral composition of the light reaching the plants were also responsible for differences in head size (Figure 2) and leaf blade thickness (Figure 3).
As with the alterations in head morphology, the anatomical changes were also dependent on the lettuce type. Apart from the changes in leaf blade thickness observed in both lettuce types cultivated in the red greenhouse (Figure 3), the direction of the changes in leaf tissue structure remains unclear. In their descriptions of the structure of typical lettuce leaves, different authors have identified both differentiated [47] and undifferentiated [48] parenchyma. In our experiment, the leaf parenchyma in plants of both lettuce types grown in a transparent greenhouse was found to be undifferentiated. A similar representation of the anatomical structure of the leaf was presented by Lee et al. [49] for other lettuce cultivars. The differences in leaf structure observed in plants from the red greenhouse were evident in both the mesophyll organization (where a slight variation was noted in the mesophyll of butterhead lettuce) and the volume of the intercellular spaces (which exhibited a decreased volume in the iceberg lettuce and an increased volume in the butterhead lettuce). An increased proportion of intercellular spaces in lettuce leaves, as well as a decrease in blade thickness, has been previously described in other lettuce cultivars [39] as a consequence of an increased proportion of red to blue light.
Several studies have demonstrated that alterations in the spectral composition of the light reaching the plants, particularly in the red and blue ranges and in the red and far-red ranges, in addition to morphological changes, result in modifications in photosynthetic efficiency and, consequently, in changes in dry matter content and yield [50,51,52]. In the present study, an increase in dry matter content was observed in iceberg lettuce leaves cultivated in a red greenhouse, where the ratio of red to blue light and far-red to red light was higher than in the control greenhouse. Chen et al. [51] reported a significant increase in dry matter, even in the presence of monochromatic red light. Moreover, Zou et al. [50] observed an almost 40% increase in dry matter content in lettuce when far-red light was added to blue and red light. Interestingly, in butterhead lettuce, the same conditions led to a reduction in the dry matter content, which means that these conditions constituted a serious stress factor that resulted in a notable disruption in metabolism, especially in sugar synthesis.
The modified spectral composition of light results in alterations within the structure of the photosynthetic apparatus, efficiency of photosynthesis, and, thus, production of sugars [18,53]. This study revealed an increase in the content of sugars (both soluble and insoluble) in iceberg lettuce growing in the red greenhouse. Similarly, Chen et al. [51] reported that a proportion of red light exceeding 50% in mixed red–blue light contributed to an increase in soluble sugars in lettuce. Furthermore, increased far-red radiation may also contribute to the elevated sugar content of lettuce leaves [54]. It is noteworthy that our results also revealed a decrease in the sugar content in butterhead lettuce under the growing conditions of the red greenhouse. The exposure of lettuce plants to monochromatic red light enhances the activity of sucrose-degrading enzymes, such as acid invertase (AI) and neutral invertase (NI), while significantly reducing the activity of the sucrose-synthesizing enzyme (SPS), which might reduce the accumulation of soluble sugars [55].
Modifications in light intensity and spectral composition impact the plant redox system and photoreceptor-controlled transcription factors, most notably ELONGATED HYPOCOTYL5 (HY5), which regulate carbon, nitrate, and sulphate assimilation [56]. The present study revealed that distinct nitrogen metabolic profiles were observed in the different types of lettuce grown in the red greenhouse. In iceberg lettuce, an increase in amino acid content was observed, while the nitrate content remained unaltered. Interestingly, an increase in amino acid content was reported in green and red lettuce when additional green light was applied [57]. In our study, the proportion of green light in the red greenhouse was reduced compared to the control greenhouse. On the contrary, in butterhead lettuce, the amino acid content did not change, while the nitrate content increased more than threefold. An elevated nitrate content in lettuce was observed in response to increased far-red radiation [54]. This suggests that the altered spectral composition of light in the red greenhouse disrupted nitrogen metabolism in butterhead lettuce. Conversely, efficient nitrate reduction and amino acid production mechanisms were activated in iceberg lettuce. Nitrate reduction depends on the availability of NAD(P)H; so, it is affected by light-dependent redox processes [56]. Miyagi et al. [58] reported that red light increases the levels of NADPH and decreases the levels of NADP, which subsequently activates NADP-dependent dehydrogenases. Red light, which is effectively adsorbed by phytochrome, has been demonstrated to stimulate nitrate reductase activity [59]. The reduced form of nitrate plays a direct role in amino acid synthesis and transformation [56,57].
Varying environmental conditions, including changes in light intensity and spectral composition, generate external stress that induces and enhances the antioxidant response in plants [60]. The principal secondary metabolites that afford plants protection from emerging oxidative stress are phenolic compounds, including phenylpropanoids, flavonols, and anthocyanins, among others [56]. Our study revealed a notable decline in the levels of total phenols, phenylpropanoids, flavonols, and anthocyanins in both lettuce varieties cultivated in a red greenhouse with a higher red-to-blue light ratio. The recorded changes are in accordance with the findings of previous studies. A number of studies have identified that UV-A radiation and blue light exert the most pronounced influence on phenolic metabolism [2,56,60,61]. The results of these studies indicate that blue light has a particular effect on the activation of phenylalanine ammonia lyase (PAL), an enzyme that catalyzes one of the earliest steps in flavonoid biosynthesis. This effect is mediated by cryptochromes, which stimulate the expression of genes belonging to the phenylpropanoid pathway through signal transduction [52,60,61]. It is noteworthy that, despite the many studies indicating that red light does not stimulate phenol biosynthesis, several studies have demonstrated a positive effect of this light. In these studies, the accumulation of phenols depended on the plant species and cultivar or leaf age, although an increase in phenols was observed when the duration of illumination was longer and more intense during the day [60]. Nevertheless, in the present study, no such increase was observed.
This study also revealed a clear distinction in phenolic content between the lettuce types that were tested. The concentration of phenolic compounds in iceberg lettuce was found to be significantly lower than that observed in butterhead lettuce. As reported by Yang et al. [2], the total phenol content and the profile of specific phenolic compounds vary between different lettuce genotypes. The loose-leaf types of lettuce contain higher levels of phenols than compact-head types. This is likely due to the increased exposure of the leaves in loose-leaf lettuce to light and UV radiation, which facilitates greater phenol production [2]. However, the loosening of iceberg lettuce heads observed in the red greenhouse did not contribute to the inhibition or reduction of the decline in phenolic content. In lettuce, antioxidant activity positively correlates with the content of phenolic compounds [2]. Similarly, in the present study, a reduction in antioxidant activity, as determined by the CUPRAC method, was observed in both types of lettuce cultivated in the red greenhouse. Similar to the phenolic content, antioxidant activity was lower in iceberg lettuce, in agreement with the data presented by Yang et al. [2]. Regarding the phenolic content, antioxidant activity was lower in iceberg lettuce, aligning with the findings of Yang et al. [2].
One of the most prevalent antioxidants in plants is ascorbic acid (vitamin C), which plays a pivotal role in safeguarding plants and regulating their growth and development [2,11]. This study revealed a decline in vitamin C levels in butterhead lettuce, while no change was observed in iceberg lettuce cultivated in a red greenhouse, where red light predominated in the light spectrum. The observed decrease in the content of this compound is consistent with the findings of previous studies. Many studies that have evaluated the effect of different light spectra on ascorbic acid content have demonstrated that blue light and UV-A radiation promote its accumulation [2,11,56]. Conversely, Chen et al. [51] observed that illuminating plants with monochromatic red light led to a significant increase in vitamin C content compared to other monochromatic lights. However, the same study demonstrated that the supplementation of blue light (30–60%) to red light resulted in a further enhancement of vitamin C content. This indicates that the degree of accumulation of this compound is contingent upon the ratio of red to blue light. Moreover, the inconsistent results suggest that vitamin C synthesis and accumulation are dependent on the interaction of numerous factors, including light quality and intensity, plant species, and other environmental variables [11].
A multitude of compounds involved in primary and secondary metabolism are vital for enabling plants to withstand unfavorable conditions. Additionally, these compounds impart specific properties, such as taste, smell, or color, to the edible parts of plants. The nutritional and health-promoting quality of plants is dependent upon several key components, including sugars, amino acids, nitrates, and phenolic compounds. A higher sugar content is associated with a more desirable flavor in lettuce [62,63]. Ascorbic acid and phenolic compounds are potent antioxidants that safeguard the body from the detrimental effects of excess free radicals. Conversely, elevated nitrate levels are deleterious to human health [54]. It is of particular importance to note that, in the context of consumer use of lettuce, fresh lettuce, due to the minimal processing procedures involved, retains its nutritional and bioactive value [2].
The different responses observed in the various tested morphotypes of lettuce may result from differences in their light receptors’ perception. Plants detect and respond to specific wavelengths of light using photoreceptors [64]. Light always activates several photoreceptors at the same time, and the signals they transmit depend on each other and can be disturbed by external environmental factors and plant physiological processes. Receptors of red and far-red radiation are phytochromes (PhyA-PhyE), while blue and ultraviolet radiation are cryptochromes (cry1, cry2, and cry3), phototropins (phot1 and phot2), and zeitlupes (ztl, fkf1, and lkp2). For example, phyB and cryptochrome cry1 act synergistically during short periods of simultaneous red and blue light exposure but antagonistically under continuous exposure [55]. It is evident that the signaling pathways of far-red, red, or blue radiation photoreceptors possess the capacity to function either independently or in a manner that facilitates interaction. This phenomenon results in the elicitation of divergent physiological responses in plants.

5. Conclusions

The cultivation of the two lettuce types under red greenhouse conditions demonstrated the disparate physiological responses to the modified spectral composition of light. In the case of butterhead lettuce, these conditions resulted in disturbances to primary and secondary metabolism. The butterhead lettuce plants were observed to maintain growth under the conditions tested (unchanged head area) but at the expense of accumulated sugars and amino acids, resulting in a decrease in the dry matter content, as well as leaf thickness. In iceberg lettuce, on the other hand, there was an increase in soluble and insoluble sugars and effective nitrogen management, i.e., effective amino acid synthesis (increase in amino acid content), using accumulated nitrate (effective nitrate reduction—no change in nitrate content). The growth intensity of iceberg lettuce plants decreased, while their dry matter content increased. The alterations can be attributed to modifications in the functionality of the photosynthetic apparatus, as previously reported [18]. The modified light conditions resulted in a limitation to the acceptor side of photosystem I (PSI), which was caused by the impaired function of Rubisco activase [18]. The resulting excess electrons could be employed in the reduction of nitrite to ammonium ions. The synthesis of amino acids utilizes ammonium ions, thus preventing the accumulation of nitrate [65,66]. A diminished electron supply, in conjunction with a reduction in carboxylation, would lead to an elevated rate of photorespiration, consequently resulting in an increased synthesis of free amino acids (predominantly serine and glycine), which serve as substrates in the photorespiration cycle [65].
The incorporation of a novel glass composition, which contains a red luminophore, into greenhouse construction (to enhance the photovoltaic effect of the panels integrated into the greenhouse in the future) results in a modification of the conditions prevailing within such facilities. In the solar radiation range, which is crucial for plant growth, the proportion of red to blue light and far-red to red radiation is markedly elevated. Lettuce, which is particularly susceptible to fluctuations in light conditions, exhibited morpho-anatomical alterations in response to these changes. The intensity of these effects was dependent on the cultivar (type) examined and was particularly pronounced in iceberg lettuce. It appears that the morphologically altered plants from the greenhouse with the red luminophore are less appealing to individual consumers. Nevertheless, due to the alterations in biochemical composition, it may have potential applications in the processing industry. The lettuce produced in this manner could be employed, for instance, in the production of salad mixes/mixtures, which have become increasingly popular in recent years.

Supplementary Materials

The following supporting information can be downloaded at: https://www.mdpi.com/article/10.3390/agronomy15092090/s1, Figure S1: Day/night air temperature values during the experimental period in the white and red greenhouses; Figure S2: Average daily global irradiance during the experimental period (July to August 2020); Figure S3: Air temperature values (T average, min, and max) during the experimental period in the white and red greenhouses; Figure S4: Relative air humidity values (RH average, min, and max) during the experimental period in the white and red greenhouses; Figure S5: Morphology of butterhead (A,C) and iceberg (B,D) lettuce types cultivated in control (A,B) and red (C,D) greenhouses.

Author Contributions

B.T.: Formal Analysis, Visualization, Writing—original draft, and Writing—review and editing. Z.G.: Investigation, Methodology, Visualization, and Writing—original draft. W.M.: Formal Analysis, Investigation, and Writing—original draft. S.M.: Conceptualization, Funding acquisition, and Resources. A.K.: Investigation and Methodology. E.K.: Conceptualization, Funding acquisition, and Resources. O.J.: Conceptualization, Methodology, and Resources. W.S.: Conceptualization. W.W.: Formal Analysis. K.M.T.: Conceptualization, Investigation, Supervision, and Writing—review and editing. All authors have read and agreed to the published version of the manuscript.

Funding

This research was funded by a subsidy (SUB/2020-050012-D017) from the Ministry of Science and Higher Education of the Republic of Poland aimed at the maintenance and development of the research potential of the Department of Botany, Physiology and Plant Protection.

Data Availability Statement

The raw data supporting the conclusions of this article will be made available by the authors upon request.

Acknowledgments

We are indebted to Joanna Gil for technical support.

Conflicts of Interest

The authors declare no conflicts of interest.

References

  1. United Nations Food and Agriculture Organization. Production Quantities of Lettuce and Chicory. Available online: http://www.fao.org/faostat/en/#data/QC/visualize (accessed on 2 September 2022).
  2. Yang, X.; Gil, M.I.; Yang, Q.; Tomás-Barberán, F.A. Bioactive compounds in lettuce: Highlighting the benefits to human health and impacts of preharvest and postharvest practices. Compr. Rev. Food Sci. Food Saf. 2022, 21, 4–45. [Google Scholar] [CrossRef] [PubMed]
  3. Aksakal, O.; Tabay, D.; Esringu, A.; Icoglu Aksakal, F.; Esim, N. Effect of proline on biochemical and molecular mechanisms in lettuce (Lactuca sativa L.) exposed to UV-B radiation. Photochem. Photobiol. Sci. 2017, 16, 246–254. [Google Scholar] [CrossRef]
  4. Kim, M.J.; Moon, Y.; Tou, J.C.; Mou, B.; Waterland, N.L. Nutritional value, bioactive compounds and health benefits of lettuce (Lactuca sativa L.). J. Food Compos. Anal. 2016, 49, 19–34. [Google Scholar] [CrossRef]
  5. Křístková, E.; Doležalová, I.; Lebeda, A.; Vinter, V.; Novotná, A. Description of morphological characters of lettuce (Lactuca sativa L.) genetic resources. Hort. Sci. 2008, 35, 113–129. [Google Scholar] [CrossRef]
  6. Lebeda, A.; Ryder, E.; Grube, R.; Doležalová, I.; Křístková, E. Lettuce (Asteraceae; Lactuca spp.). In Genetic Resources, Chromosome Engineering, and Crop Improvement; Singh, R.J., Ed.; CRC Press: Boca Raton, FL, USA; Tailor and Francis Group: Boca Raton, FL, USA, 2007; Volume 3, pp. 377–472. [Google Scholar]
  7. Ahmed, H.A.; Tong, Y.-X.; Yang, Q.-C. Optimal control of environmental conditions affecting lettuce plant growth in a controlled environment with artificial lighting: A review. S. Afr. J. Bot. 2020, 130, 75–89. [Google Scholar] [CrossRef]
  8. Zhou, J.; Li, P.; Wang, J.; Fu, W. Growth, photosynthesis, and nutrient uptake at different light intensities and temperatures in lettuce. HortScience 2019, 54, 1925–1933. [Google Scholar] [CrossRef]
  9. Zhou, J.; Li, P.; Wang, J. Effects of Light Intensity and Temperature on the Photosynthesis Characteristics and Yield of Lettuce. Horticulturae 2022, 8, 178. [Google Scholar] [CrossRef]
  10. Boros, I.F.; Székely, G.; Balázs, L.; Csambalik, L.; Sipos, L. Effects of LED lighting environments on lettuce (Lactuca sativa L.) in PFAL systems—A review. Sci. Hortic. 2023, 321, 112351. [Google Scholar] [CrossRef]
  11. Zha, L.; Liu, W.; Yang, Q.; Zhang, Y.; Zhou, C.; Shao, M. Regulation of ascorbate accumulation and metabolism in lettuce by the red: Blue ratio of continuous light using LEDs. Front. Plant Sci. 2020, 11, 704. [Google Scholar] [CrossRef]
  12. Wong, C.E.; Teo, Z.W.N.; Shen, L.; Yu, H. Seeing the lights for leafy greens in indoor vertical farming. Trends Food Sci. Technol. 2020, 106, 48–63. [Google Scholar] [CrossRef]
  13. Nozue, H.; Gomi, M. Usefulness of broad-spectrum white LEDs to envision future plant factory. In Smart Plant Factory: The Next Generation Indoor Vertical Farms; Kozai, T., Ed.; Springer: Singapore, 2018; pp. 197–210. [Google Scholar]
  14. Riahi, J.; Vergura, S.; Mezghani, D.; Mami, A. Smart and renewable energy system to power a temperature-controlled greenhouse. Energies 2021, 14, 5499. [Google Scholar] [CrossRef]
  15. Majeed, Y.; Khan, M.U.; Waseem, M.; Zahid, U.; Mahmood, F.; Majeed, F.; Sultan, M.; Raza, A. Renewable energy as an alternative source for energy management in agriculture. Energy Rep. 2023, 10, 344–359. [Google Scholar] [CrossRef]
  16. Olvera-Gonzalez, E.; Escalante-Garcia, N.; Myers, D.; Ampim, P.; Obeng, E.; Alaniz-Lumbreras, D.; Castaño, V. Pulsed LED-Lighting as an Alternative Energy Savings Technique for Vertical Farms and Plant Factories. Energies 2021, 14, 1603. [Google Scholar] [CrossRef]
  17. Jeremiasz, O.; Sobik, P.; Sala, A.; Pluta, A.; Szendera, F. Photoluminescent Dye, in Particular for Photovoltaic Modules and Method of Producing a Photoluminescent Dye, in Particular for Photovoltaic Module. PL Patent 240248 B1, 29 July 2019. [Google Scholar]
  18. Tokarz, K.M.; Makowski, W.; Tokarz, B.; Muszyńska, E.; Gajewski, Z.; Mazur, S.; Kunicki, E.; Jeremiasz, O.; Sobik, P.; Nowak, P.; et al. Performance of the Photosynthetic Apparatus under Glass with a Luminophore Modifying Red-To-Far-Red-Light Ratio—A Case Study. Cells 2023, 12, 1552. [Google Scholar] [CrossRef] [PubMed]
  19. Loh, K.Q.; Harbick, K.; Eylands, N.J.; Kortshagen, U.R.; Ferry, V.E. Design guidelines for luminescent solar concentrator greenhouses in the United States. Adv. Sust. Sys. 2025, 9, 2400749. [Google Scholar] [CrossRef]
  20. IUSS Working Group WRB. World Reference Base for Soil Resources 2006, First Update 2007; World Soil Resources Reports No. 103; FAO: Rome, Italy, 2006. [Google Scholar]
  21. The Joint Research Centre: EU Science Hub. Photovoltaic Geographical Information System (PVGIS). Available online: https://joint-research-centre.ec.europa.eu/photovoltaic-geographical-information-system-pvgis_en (accessed on 11 August 2025).
  22. Kiełkowska, A.; Dziurka, M. Changes in polyamine pattern mediates sex differentiation and unisexual flower development in monoecious cucumber (Cucumis sativus L.). Physiol. Plant. 2021, 171, 48–65. [Google Scholar] [CrossRef]
  23. Makowski, W.; Tokarz, K.M.; Tokarz, B.; Banasiuk, R.; Witek, K.; Królicka, A. Elicitation-Based Method for Increasing the Production of Antioxidant and Bactericidal Phenolic Compounds in Dionaea muscipula J. Ellis Tissue. Molecules 2020, 25, 1794. [Google Scholar] [CrossRef] [PubMed]
  24. Swain, T.; Hillis, W.E. Phenolic constituents of Prunus domestica. I. Quantitative analysis of phenolic constituents. J. Sci. Food Agric. 1959, 10, 63–68. [Google Scholar] [CrossRef]
  25. Tokarz, K.; Makowski, W.; Banasiuk, R.; Królicka, A.; Piwowarczyk, B. Response of Dionaea muscipula J. Ellis to light stress in in vitro: Physiological study. Plant Cell Tiss. Organ Cult. 2018, 134, 65–77. [Google Scholar] [CrossRef]
  26. Fukumoto, L.R.; Mazza, G. Assessing antioxidant and prooxidant activities of phenolic compounds. J. Agric. Food Chem. 2000, 48, 3597–3604. [Google Scholar] [CrossRef]
  27. Makowski, W.; Królicka, A.; Nowicka, A.; Zwyrtková, J.; Tokarz, B.; Pecinka, A.; Banasiuk, R.; Tokarz, K.M. Transformed tissue of Dionaea muscipula J. Ellis as a source of biologically active phenolic compounds with bactericidal properties. Appl. Microbiol. Biotechnol. 2021, 105, 1215–1226. [Google Scholar] [CrossRef]
  28. Apak, R.; Güçlü, K.; Demirata, B.; Özyürek, M.; Çelik, S.E.; Bektaşoğlu, B.; Berker, K.I.; Özyurt, D. Comparative Evaluation of Various Total Antioxidant Capacity Assays Applied to Phenolic Compounds with the CUPRAC Assay. Molecules 2007, 12, 1496–1547. [Google Scholar] [CrossRef]
  29. Makowski, W.; Królicka, A.; Tokarz, B.; Szopa, A.; Ekiert, H.; Tokarz, K.M. Temporary immersion bioreactors as a useful tool for obtaining high productivity of phenolic compounds with strong antioxidant properties from Pontechium maculatum. Plant Cell Tiss. Organ Cult. 2023, 153, 525–537. [Google Scholar] [CrossRef]
  30. Krełowska-Kułas, M. Badanie Jakości Produktów Spożywczych (Food Quality Testing); PWE: Warsaw, Poland, 1993. (In Polish) [Google Scholar]
  31. Yemm, E.W.; Willis, A.J. The estimation of carbohydrates in plant extracts by anthrone. Biochem. J. 1954, 57, 508–514. [Google Scholar] [CrossRef]
  32. Miernicka, K.; Tokarz, B.; Makowski, W.; Mazur, S.; Banasiuk, R.; Tokarz, K.M. The Adjustment Strategy of Venus Flytrap Photosynthetic Apparatus to UV-A Radiation. Cells 2022, 11, 3030. [Google Scholar] [CrossRef]
  33. Kamińska, I.; Lukasiewicz, A.; Klimek-Chodacka, M.; Długosz-Grochowska, O.; Rutkowska, J.; Szymonik, K.; Baranski, R. Antioxidative and osmoprotecting mechanisms in carrot plants tolerant to soil salinity. Sci. Rep. 2022, 12, 7266. [Google Scholar] [CrossRef]
  34. Wojciechowska, R.; Kolton, A.; Dlugosz-Grochowska, O.; Knop, E. Nitrate content in Valerianella locusta L. plants is affected by supplemental LED lighting. Sci. Hortic. 2016, 211, 179–186. [Google Scholar] [CrossRef]
  35. R Core Team. R: A Language and Environment for Statistical Computing; R Foundation for Statistical Computing: Vienna, Austria, 2022; Available online: https://www.R-project.org (accessed on 5 September 2024).
  36. Azizi, S.; Aliniaeifard, S.; Zarbakhsh, S.; Esmaeili, S.; Baghalian, K.; Gruda, N.S. Photobiology, photosynthesis, and plant responses under artificial lighting in controlled environment agriculture. Sci. Hortic. 2025, 349, 114248. [Google Scholar] [CrossRef]
  37. Trouwborst, G.; Hogewoning, S.W.; van Kooten, O.; Harbinson, J.; van Ieperen, W. Plasticity of photosynthesis after the ‘red light syndrome’ in cucumber. Environ. Exp. Bot. 2016, 121, 75–82. [Google Scholar] [CrossRef]
  38. Dougher, T.A.; Bugbee, B. Differences in the Response of Wheat, Soybean and Lettuce to Reduced Blue Radiation. Photochem. Photobiol. 2001, 73, 199–207. [Google Scholar] [CrossRef] [PubMed]
  39. Izzo, L.G.; Mickens, M.A.; Aronne, G.; Gómez, C. Spectral effects of blue and red light on growth, anatomy, and physiology of lettuce. Physiol. Plant. 2021, 172, 2191–2202. [Google Scholar] [CrossRef]
  40. Azad, M.O.K.; Kjaer, K.H.; Adnan, M.; Naznin, M.T.; Lim, J.D.; Sung, I.J.; Park, C.H.; Lim, Y.S. The Evaluation of Growth Performance, Photosynthetic Capacity, and Primary and Secondary Metabolite Content of Leaf Lettuce Grown under Limited Irradiation of Blue and Red LED Light in an Urban Plant Factory. Agriculture 2020, 10, 28. [Google Scholar] [CrossRef]
  41. Ohtake, N.; Ishikura, M.; Suzuki, H.; Yamori, W.; Goto, E. Continuous irradiation with alternating red and blue light enhances plant growth while keeping nutritional quality in lettuce. HortScience 2018, 53, 1804–1809. [Google Scholar] [CrossRef]
  42. Hogewoning, S.W.; Trouwborst, G.; Maljaars, H.; Poorter, H.; van Ieperen, W.; Harbinson, J. Blue light dose–responses of leaf photosynthesis, morphology, and chemical composition of Cucumis sativus grown under different combinations of red and blue light. J. Exp. Bot. 2010, 61, 3107–3117. [Google Scholar] [CrossRef]
  43. Son, K.H.; Oh, M.M. Leaf shape, growth, and antioxidant phenolic compounds of two lettuce cultivars grown under various combinations of blue and red light-emitting diodes. HortScience 2013, 48, 988–995. [Google Scholar] [CrossRef]
  44. Meng, Q.; Runkle, E.S. Far-red radiation interacts with relative and absolute blue and red photon flux densities to regulate growth, morphology, and pigmentation of lettuce and basil seedlings. Sci. Hortic. 2019, 255, 269–280. [Google Scholar] [CrossRef]
  45. Chen, X.L.; Xue, X.Z.; Guo, W.Z.; Wang, L.C.; Qiao, X.J. Growth and nutritional properties of lettuce affected by mixed irradiation of white and supplemental light provided by light-emitting diode. Sci. Hortic. 2016, 200, 111–118. [Google Scholar] [CrossRef]
  46. Possart, A.; Fleck, C.; Hiltbrunner, A. Shedding (far-red) light on phytochrome mechanisms and responses in land plants. Plant Sci. 2014, 217, 36–46. [Google Scholar] [CrossRef]
  47. Amitrano, C.; Junker, A.; D’Agostino, N.; De Pascale, S.; De Micco, V. Integration of high-throughput phenotyping with anatomical traits of leaves to help understanding lettuce acclimation to a changing environment. Planta 2022, 256, 68. [Google Scholar] [CrossRef] [PubMed]
  48. Almeida, P.H.; Mógor, Á.F.; Ribeiro, A.Z.; Heinrichs, J.; Amano, E. Increase in lettuce (Lactuca sativa L.) production by foliar calcium application. Aust. J. Basic Appl. Sci. 2016, 10, 161–167. [Google Scholar]
  49. Lee, J.-S.; Chandra, D.; Son, J. Growth, Physicochemical, Nutritional, and Postharvest Qualities of Leaf Lettuce (Lactuca sativa L.) as Affected by Cultivar and Amount of Applied Nutrient Solution. Horticulturae 2022, 8, 436. [Google Scholar] [CrossRef]
  50. Zou, J.; Zhang, Y.; Zhang, Y.; Bian, Z.; Fanourakis, D.; Yang, Q.; Li, T. Morphological and physiological properties of indoor cultivated lettuce in response to additional far-red light. Sci. Hortic. 2019, 257, 108725. [Google Scholar] [CrossRef]
  51. Chen, X.L.; Li, Y.L.; Wang, L.C.; Guo, W.Z. Red and blue wavelengths affect the morphology, energy use efficiency and nutritional content of lettuce (Lactuca sativa L.). Sci. Rep. 2021, 11, 8374. [Google Scholar] [CrossRef]
  52. Samuolienė, G.; Viršilė, A.; Miliauskienė, J.; Haimi, P.J.; Laužikė, K.; Brazaitytė, A.; Duchovskis, P. The physiological response of lettuce to red and blue light dynamics over different photoperiods. Front. Plant Sci. 2021, 11, 610174. [Google Scholar] [CrossRef]
  53. Tokarz, K.; Piwowarczyk, B.; Wysocka, A.; Wójtowicz, T.; Makowski, W.; Golemiec, E. Response of grass pea (Lathyrus sativus L.) photosynthetic apparatus to short-term intensive UV-A: Red radiation. Acta Physiol. Plant. 2019, 41, 1–7. [Google Scholar] [CrossRef]
  54. Li, L.; Tong, Y.X.; Lu, J.L.; Li, Y.M.; Yang, Q.C. Lettuce growth, nutritional quality, and energy use efficiency as affected by red–blue light combined with different monochromatic wavelengths. HortScience 2020, 55, 613–620. [Google Scholar] [CrossRef]
  55. Chen, X.L.; Wang, L.C.; Li, T.; Yang, Q.C.; Guo, W.Z. Sugar accumulation and growth of let-tuce exposed to different lighting modes of red and blue LED light. Sci. Rep. 2019, 9, 6926. [Google Scholar]
  56. Borbély, P.; Gasperl, A.; Pálmai, T.; Ahres, M.; Asghar, M.A.; Galiba, G.; Müller, M.; Kocsy, G. Light Intensity- and Spectrum-Dependent Redox Regulation of Plant Metabolism. Antioxidants 2022, 11, 1311. [Google Scholar] [CrossRef] [PubMed]
  57. Viršilė, A.; Brazaitytė, A.; Vaštakaitė-Kairienė, V.; Miliauskienė, J.; Jankauskienė, J.; Novičkovas, A.; Laužikė, K.; Samuolienė, G. The distinct impact of multi-color LED light on nitrate, amino acid, soluble sugar and organic acid contents in red and green leaf lettuce cultivated in controlled environment. Food Chem. 2020, 310, 125799. [Google Scholar] [CrossRef]
  58. Miyagi, A.; Uchimiya, H.; Kawai-Yamada, M. Synergistic effects of light quality, carbon dioxide and nutrients on metabolite compositions of head lettuce under artificial growth conditions mimicking a plant factory. Food Chem. 2017, 218, 561–568. [Google Scholar] [CrossRef]
  59. Signore, A.; Bell, L.; Santamaria, P.; Wagstaff, C.; Van Labeke, M.C. Red light is effective in reducing nitrate concentration in rocket by increasing nitrate reductase activity, and contributes to increased total glucosinolates content. Front. Plant Sci. 2020, 11, 604. [Google Scholar] [CrossRef] [PubMed]
  60. Brazaitytė, A.; Vaštakaitė-Kairienė, V.; Sutulienė, R.; Rasiukevičiūtė, N.; Viršilė, A.; Miliauskienė, J.; Laužikė, K.; Valiuškaitė, A.; Dėnė, L.; Chrapačienė, S.; et al. Phenolic Compounds Content Evaluation of Lettuce Grown under Short-Term Preharvest Daytime or Nighttime Supplemental LEDs. Plants 2022, 11, 1123. [Google Scholar] [CrossRef] [PubMed]
  61. Mohamed, S.J.; Rihan, H.Z.; Aljafer, N.; Fuller, M.P. The Impact of Light Spectrum and Intensity on the Growth, Physiology, and Antioxidant Activity of Lettuce (Lactuca sativa L.). Plants 2021, 10, 2162. [Google Scholar] [CrossRef]
  62. Chadwick, M.; Gawthrop, F.; Michelmore, R.W.; Wagstaff, C.; Methven, L. Perception of bitterness, sweetness and liking of different genotypes of lettuce. Food Chem. 2016, 197, 66–74. [Google Scholar] [CrossRef]
  63. Chadwick, M.; Swann, J.R.; Gawthrop, F.; Michelmore, R.; Scaglione, D.; Jose-Truco, M.; Wagstaff, C. Mapping taste and flavour traits to genetic markers in lettuce Lactuca sativa. Food Chem. Mol. Sci. 2024, 9, 100215. [Google Scholar] [CrossRef] [PubMed]
  64. Galvão, V.C.; Fankhauser, C. Sensing the light environment in plants: Photoreceptors and early signaling steps. Curr. Opin. Neurobiol. 2015, 34, 46–53. [Google Scholar] [CrossRef]
  65. Hildebrandt, T.M.; Nesi, A.N.; Araújo, W.L.; Braun, H.P. Amino acid catabolism in plants. Mol. Plant 2015, 8, 1563–1579. [Google Scholar] [CrossRef]
  66. Trovato, M.; Funck, D.; Forlani, G.; Okumoto, S.; Amir, R. Amino acids in plants: Regulation and functions in development and stress defense. Front. Plant Sci. 2021, 12, 772810. [Google Scholar] [CrossRef]
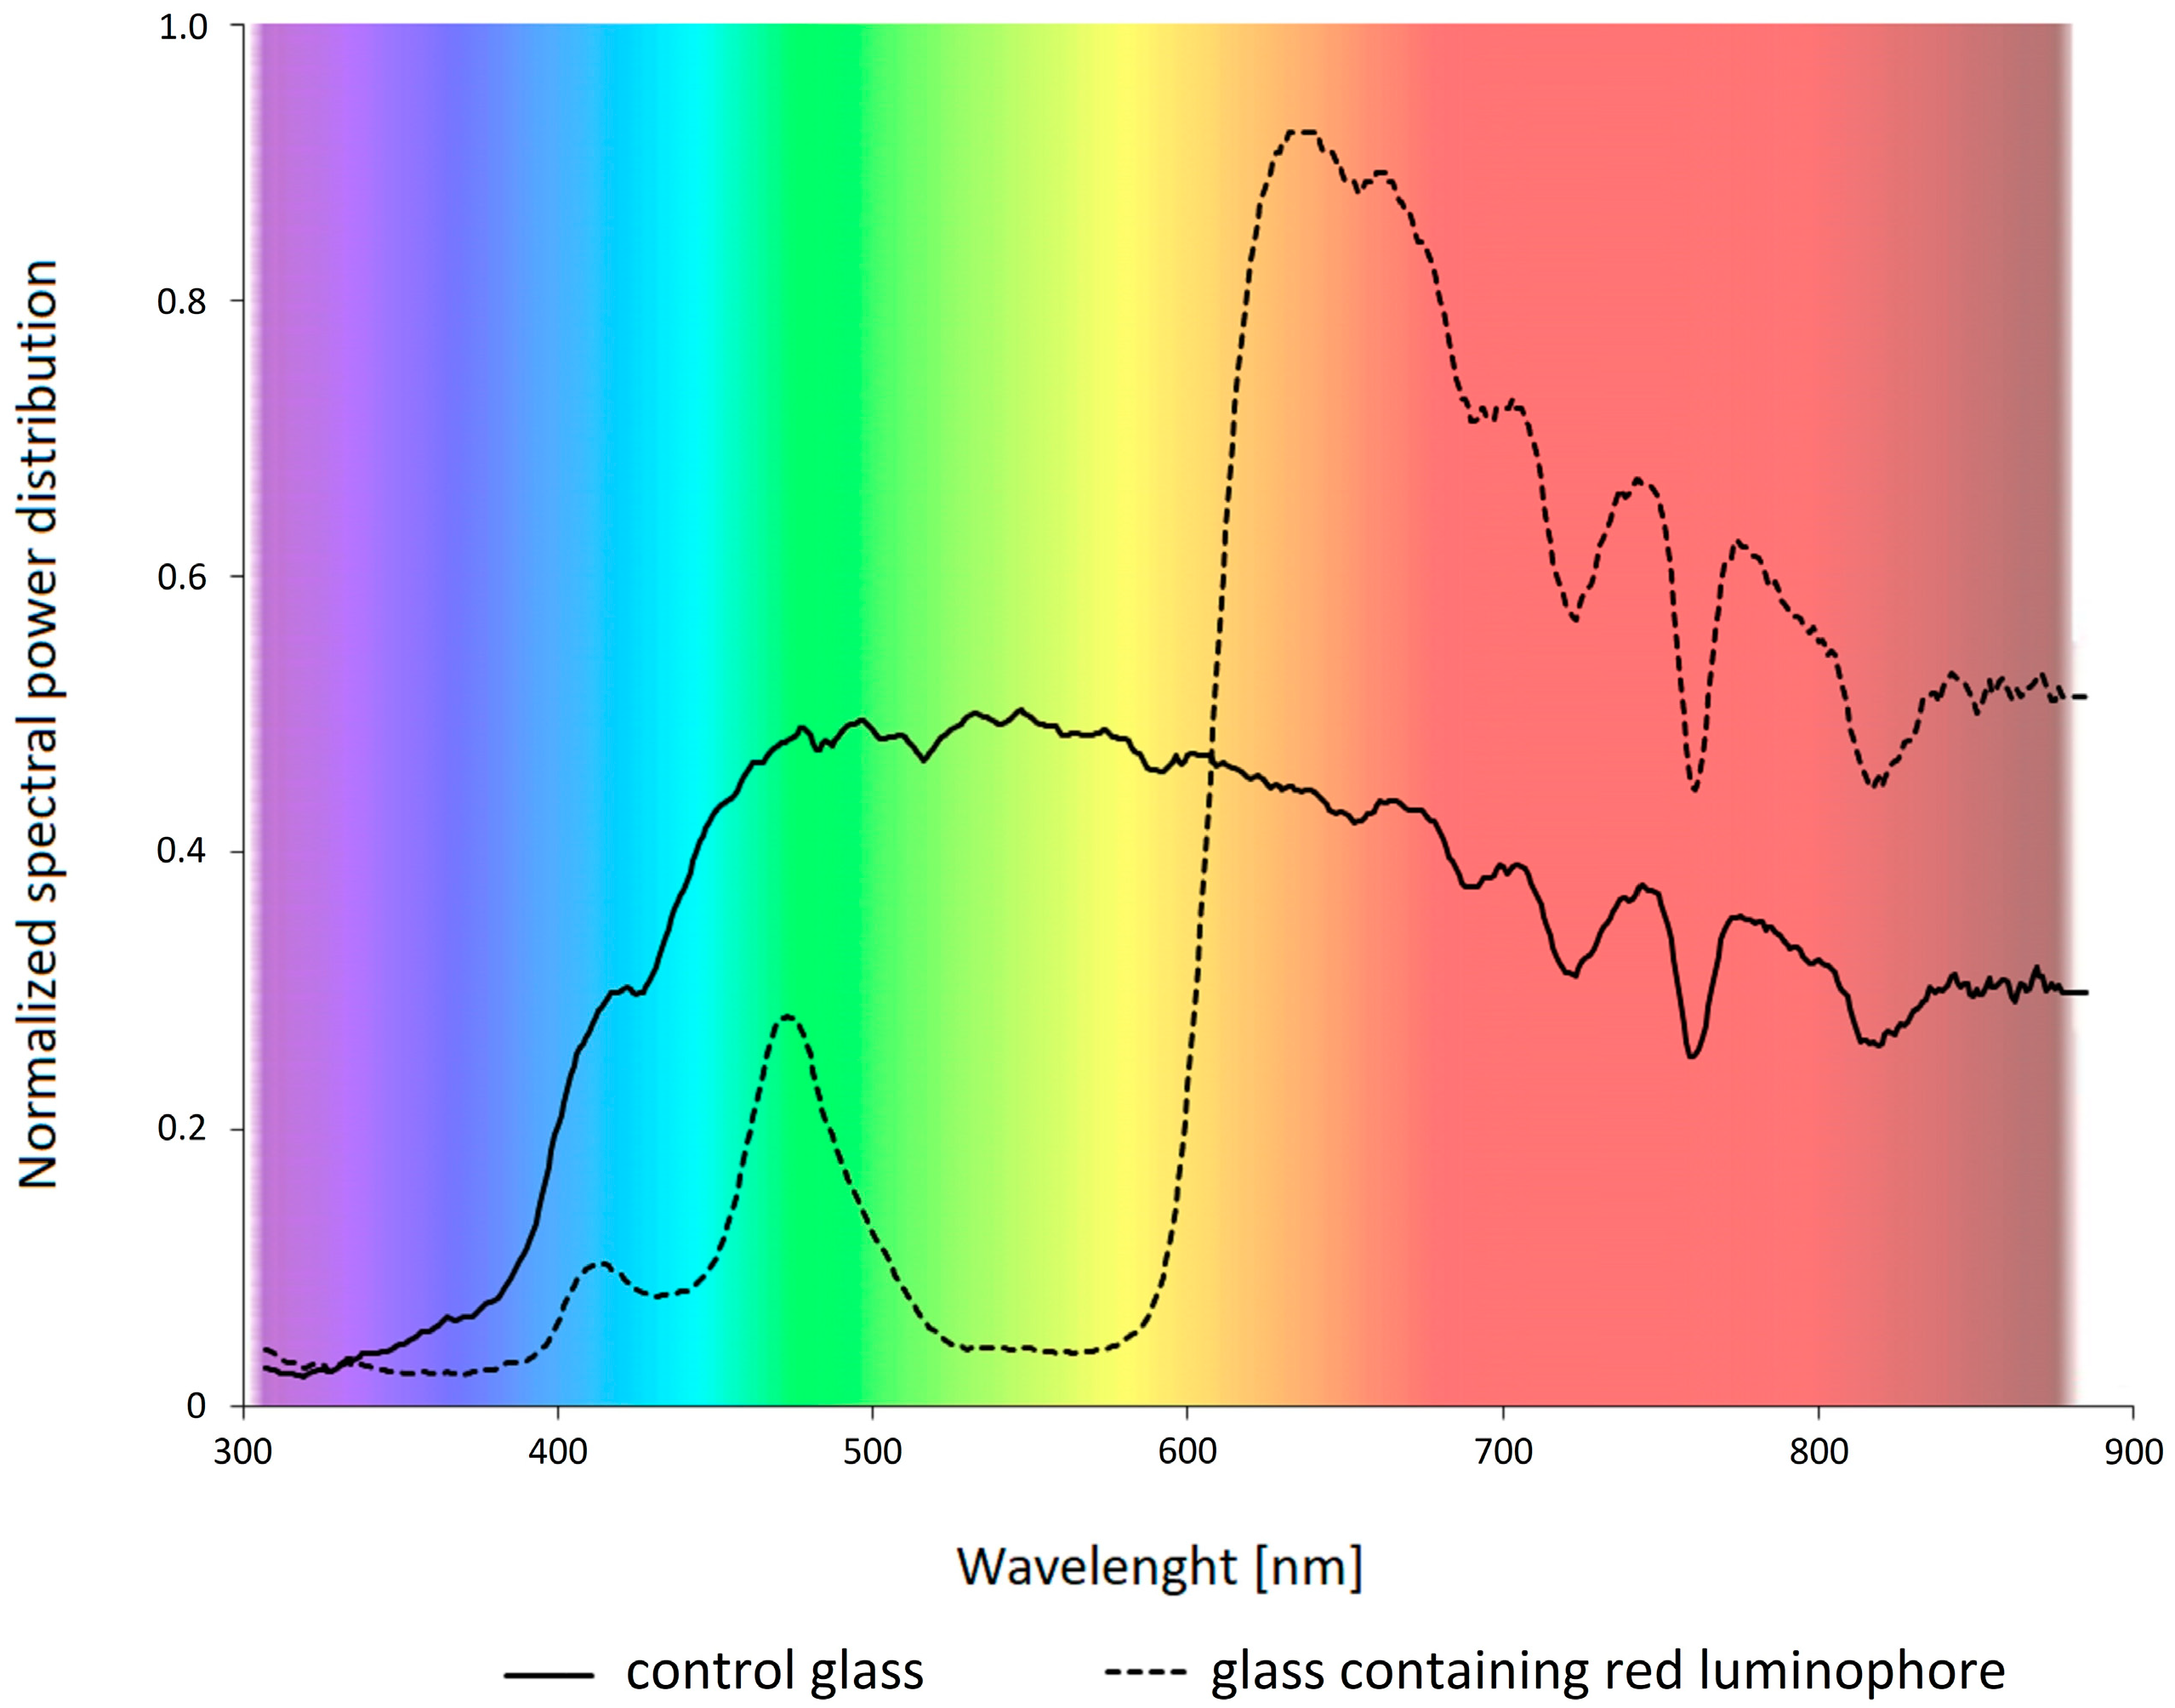
Figure 1. Spectral characteristics of the sunlight reaching the plants through control (transparent) glass and glass containing a red luminophore.
Agronomy 15 02090 g001
Figure 2. Morphology of two lettuce types cultivated in control and red greenhouses: (A) head morphology and (B) head area [cm2]. (A)—bar = 10 cm. (B) Different letters indicate statistically significant differences between lettuce types and culture conditions.
Agronomy 15 02090 g002
Figure 3. Leaf anatomy of two lettuce types cultivated in control and red greenhouses: (A) cross-sections of lettuce leaves from the control greenhouse; (B) cross-sections of lettuce leaves from the red greenhouse; and (C) leaf thickness [µm]. (A,B)—abbreviation: m—mesophyll (not differentiated), pm—palisade mesophyll, sm—spongy mesophyll, ue—upper epidermis, le—lower epidermis, and v—vascular tissue. Bars = 100 µm. (C)—different letters indicate statistically significant differences between lettuce types and culture conditions.
Agronomy 15 02090 g003
Figure 4. Antioxidant properties of two lettuce types cultivated in control and red greenhouses: (A) phenolic compound content; (B) antioxidant capacity (CUPRAC); and (C) L-ascorbic acid content. Abbreviation: TP—total phenols, Php—phenylpropanoids, Fv—flavonoids, Ant—anthocyanins. (AC) Different letters indicate statistically significant differences between lettuce types and culture conditions, and bars represent the standard deviation, with n = 4 (A), 5 (B,C).
Agronomy 15 02090 g004
Figure 5. Nutritional value of leaves of two lettuce types cultivated in control and red greenhouses: (A) amino acids, (B) NO3, and (C) soluble and insoluble sugar content. (AC) Different letters indicate statistically significant differences between lettuce types and culture conditions, and bars represent the standard deviation, with n = 5.
Agronomy 15 02090 g005
Figure 6. Principal component analysis biplots showing relationships between culture conditions and crop characters of iceberg (A) and butterhead (B) lettuce types. Abbreviation: C—control, R—red, AA—amino acid, Ant—anthocyanins, DW—dry weight, Fv—flavonoids, HA—head area, IS—insoluble sugars, LAA—L-ascorbic acid, LT—leaf thickness, NO3—nitrates, Php—phenylpropanoids, SS—soluble sugars, and TP—total phenols.
Agronomy 15 02090 g006
Table 1. Dry weight content of two lettuce types cultivated in control and red greenhouses. Different letters indicate statistically significant differences between lettuce types and culture conditions, SD—standard deviation.
Lettuce TypeGreenhouseDry Weight Content
[% ±SD]
IcebergControl4.1 ± 0.02 d
Red4.4 ± 0.02 c
ButterheadControl5.7 ± 0.05 a
Red4.7 ± 0.03 b
Disclaimer/Publisher’s Note: The statements, opinions and data contained in all publications are solely those of the individual author(s) and contributor(s) and not of MDPI and/or the editor(s). MDPI and/or the editor(s) disclaim responsibility for any injury to people or property resulting from any ideas, methods, instructions or products referred to in the content.