Article

Comprehensive Responses of Root System Architecture and Anatomy to Nitrogen Stress in Maize (Zea mays L.) Genotypes with Contrasting Nitrogen Efficiency

1
Collage of Resources and Environment, Jilin Agricultural University, Changchun 130118, China
2
Institute of Agricultural Resource and Environment, Jilin Academy of Agricultural Sciences (Northeast Agricultural Research Center of China), Changchun 130033, China
*
Author to whom correspondence should be addressed.
These authors contributed equally to this work.
Agronomy 2025, 15(9), 2083; https://doi.org/10.3390/agronomy15092083
Submission received: 31 July 2025 / Revised: 27 August 2025 / Accepted: 28 August 2025 / Published: 29 August 2025

Abstract

Root architecture and anatomy critically regulate maize nitrogen (N) acquisition, but their coordinated low-N response in N-efficient hybrids remains poorly understood. Elucidating this mechanism is essential for advancing root system regulation and breeding strategies aimed at enhancing N-use efficiency. In this study, six root architectures, twelve root anatomies, and six N-efficiency traits were evaluated in six maize hybrids and nine parental inbreds under sufficient (SN, 180 kg ha−1) and low N (LN, 30 kg ha−1), with transcriptome analysis of inbreds applied to uncover mechanisms. Hybrids were categorized as follows: EE (N-efficient under both N levels), SNE (N-efficient only under SN), and NN (inefficient under both N). Compared with other hybrids, EE developed a 6.0–15.7% narrower root opening angle (ROA), a 11.9–12.4% larger root projected area (RPA), 16.3–22.6% deeper roots (D_Wmax), and 22.6–37.1% more cortical aerenchyma (AA) under LN; SNE showed 9.49–19.51% lower RPA and higher LN-induced reductions in D_Wmax (8.84–17.09%); NN exhibited the largest ROA (60.75–64.48°) and LN-induced reductions in RPA (16.43%), D_Wmax (14.76%), and total projected structure length (11.28%). Correlation, principal component, and structural equation modeling analyses revealed significant root architecture–anatomy integration, and they collectively influence yield through traits such as D_Wmax, AA, and xylem vessel area (XVA) (r = −0.48–0.62, path coefficients: 0.19–0.27). Additionally, the EE and NN hybrids inherited and integrated the superior N-efficient root phenotypes from their parental inbred lines. Transcriptomic analysis identified eight root development genes, including GRMZM5G878558, whose expression correlated with both D_Wmax and AA (r = 0.61–0.73). These findings clarified that N-efficient maize achieved higher yield through coordinated root architecture–anatomy optimization involving associated genes, providing a theoretical foundation for N-efficiency-targeted root regulation and varietal selection.

1. Introduction

Nitrogen (N) is essential for maize (Zea mays L.) growth, regulating photosynthesis, protein synthesis, and metabolic processes [1]. As a global staple crop, maize yield potential is frequently constrained by N deficiency, a major limitation across agricultural systems [2]. This deficiency worsens during maize critical growth stages due to N leaching and runoff [3]. Consequently, farmers frequently over-apply N fertilizers to secure yields, increasing costs and causing environmental degradation despite maize’s limited N-uptake capacity [4]. N-use efficiency (NUE) represents the grain production per unit of N available in the soil [5]; thus, improving maize NUE through strategies such as root architecture optimization and N-efficient breeding is imperative [6,7]. These approaches are fundamental to achieving sustainable agriculture, particularly in low-input systems and N-deficient soils [8].
Root systems serve as the primary organs for N uptake, leveraging architectural plasticity to optimize foraging under fluctuating N availability [9]. Under N deficiency, maize roots increase carbon allocation from shoots [10] and exhibit adaptive morphology changes, such as lateral root proliferation [11,12], which synergistically expand the soil exploration volume for N acquisition [13]. In high-input N fertilizer systems, nitrate, either applied directly or nitrified from ammonium, moves with soil water to deeper soil layers. N-efficient maize genotypes further maintain vigorous root activity under low N, prioritizing resource allocation toward vertical growth and deep soil exploration [14]. Such a steep, deep architecture reduces N leaching [15,16] and balances C-N construction costs through key traits such as root angle narrowing, root system width reduction, and suppressed shallow nodal roots, thus enhancing the efficiency of N absorption (N-uptake efficiency), which is one of the primary components of NUE [5,17,18]. However, the low-N responsiveness and yield contributions of key root architectural traits (e.g., root angle, width, depth distribution) and their genetic variation between N-efficient and inefficient varieties remain poorly characterized [12].
Root anatomical traits synchronously adapt with architectural modifications under low-N stress [19]. Roots are heterotrophic organs whose construction and maintenance incur high metabolic costs [15]. Under N deficiency, plants develop metabolically efficient “cheaper roots” characterized by increased cortical aerenchyma, enlarged cortical cells, and reduced cortical layers [20,21]. These adaptations minimize the root metabolic cost of soil exploration [22], thereby enhancing root elongation and increasing grain yield under low-N conditions [23,24]. Additionally, low N remodels root mechanical properties through modified stele-to-cortex ratios and metaxylem vessel formation [25]. These anatomical adjustments improve root penetration ability and nutrient transport efficiency, facilitating soil N exploration [26]. Significant genotypic variation exists in these anatomical traits [27]. Defining the characteristic anatomical features of N-efficient genotypes is, therefore, critical for improving crop NUE. Furthermore, the functional relationships between root anatomical adaptations, architectural plasticity, and ultimate yield performance remain to be fully elucidated [28].
Root system architecture and anatomy collectively determine N-uptake efficiency in maize, exhibiting coordinated responses to low-N conditions [29]. Root system architecture governs spatial root exploration [30,31], while root anatomy regulates physiological processes critical for nutrient absorption and carbon economy [32], with these components being interconnected through carbon trade-offs, hydraulic conductance, and rhizosphere interactions [33,34]. Notably, US maize root systems have evolved improved N-stress tolerance through coordinated architectural and anatomical adaptations [35]. Maize genotypes show significant NUE divergence based on contrasting root architecture [16,36] or anatomical traits [24,37], though most studies examine comparisons of single traits, such as rooting depth or aerenchyma area [17,27]. The following two key research questions still remain: (1) how N-efficient hybrids coordinate multiple root traits and establish a functional hierarchy among them and (2) whether elite root phenotypes result from superior parental combinations and share common genetic controls for architecture–anatomy optimization.
This study’s objectives were the following: (1) analyzing the integrated root architectural and anatomical responses to low-N stress in N-efficient hybrids and identifying the elite root characteristics for NUE, as well as (2) comparing root responses between N-efficient and N-inefficient genotypes at hybrid and inbred levels to examine elite trait inheritance while elucidating regulatory mechanisms of coordinated adaptations.

2. Materials and Methods

2.1. Plant Materials

In 2023, we evaluated root phenotypes and NUE traits in six commercial maize hybrids (Table S1). In 2024, root phenotypes were validated, and transcriptome analysis was conducted in nine parental inbred lines (comprising some ancestral lines from their pedigree that are not direct parents) of hybrids with contrasting NUE; this strategy mimics previous hybrid and inbred comparisons for phenotypic and mechanistic analysis [14]. The hybrids comprised four major Chinese cultivars (ND108, ZD958, LY99, and WK702) and two U.S. Pioneer varieties (XY335 and XY1483), which were widely cultivated across China (Table S1). The parental inbred lines comprised three sets corresponding to hybrids with contrasting NUE identified in 2023: (1) ND108 parents (P178 and Huang C), (2) WK702 parents (YE8001, Ji853, LX9801, and Chang7-2), and (3) ZD958 parents (U8112, Shen5003, and Dan340), which were identified as closely related ancestral lines of Zheng58—one of the parental lines of ZD958 [38,39].

2.2. Experimental Site

The field trials were conducted at Jilin Agricultural University Experimental Station (43°8′ N, 125°4′ E, Altitude: 199 m). The growing seasons spanned from 10 May to 2 October in 2023 and from 1 May to 30 September in 2024. The experimental field was maintained under rain-fed conditions with no prior history of fertilizer application experiments. The experimental site featured typical black soil (Mollisol) with the following properties (0–30 cm depth): alkaline-hydrolysis N (85.95 mg kg−1), available K (93.12 mg kg−1), available P (33.91 mg kg−1), organic matter content (19.37 g kg−1), and pH (6.76). Fertilizer (containing N of 30 kg ha−1, P of 21.8 kg ha−1, and K of 41 kg ha−1) was applied as basal fertilizer before sowing. All of the cultural practices were followed according to suitable local farmland management practices to obtain a favorable environment.

2.3. Field Experiment Design

This study employed a split-plot design with three replicates (blocks) in both 2023 and 2024. In each replicate, the N application treatments were the main plots, and hybrids were the split-plots. Two N supply treatments were implemented: (1) a sufficient-N (SN) treatment, receiving a total of 180 kg N ha−1, with 30 kg ha−1 basal fertilizer and 150 kg ha−1 top-dressed at the V6 stage (the vegetative growth period when the sixth leaf collar is fully visible, at the beginning of jointing stage); (2) a low-N (LN) treatment with only 30 kg ha−1 basal N to induce mild N deficiency conditions. Six hybrid cultivars and nine parental inbred lines were tested in 10-row plots. The inter-row spacing was 0.6 m, and the inter-plant spacing was 0.25 m. The row length was 5 m, there were 21 plants in each row, and there was a planting density of 70,000 plants per hectare across the years of evaluations.

2.4. Phenotypic Sampling

2.4.1. Sampling Period

Root phenotyping was conducted at the silking stage (R1; 17 August 2023 and 25 August 2024). The grain yield was determined at the physiological maturity stage (R4 stage; 2 October). Because of the difference in phenological periods among treatments, at least 20 consecutive plants in the central rows of each plot were tagged at the V5 stage (the vegetative period when the fifth leaf collar is fully visible) to monitor developmental progression. The silking date was recorded when 60% of the tagged plants reached R1 [40]. Physiological maturity was defined by the presence of a black layer at the grain base in 60% of the ears.

2.4.2. Root System Architecture Sampling and Measurement

Root system architecture characterization was conducted according to established protocols described in previous studies [41]. In brief, after cutting off the shoots at the silking stage, a soil volume centered around each plant root was dug up using shovels; the soil volume size was 25 cm (plant distance) × 60 cm (row distance) × 35 cm (deep). The large pieces of soil attached to the roots were gently shaken off, and the roots were washed in a basin filled with water.
A photography tent with supplementary light (DEEP, Shanghai Meinuo Photographic Equipment Co., Ltd. (Shanghai, China), 80 × 80 × 80 cm specification) and a twenty-four-megapixel digital camera (Sony ILCE-5100 L, Sony, Tokyo, Japan) were used to take photos of root systems. The root was placed on the imaging surface at the bottom of the tent, with a scale label for sample identification, and the dimensions of the picture were calculated. The camera was fixed on the shooting channel at the top of the photography tent, and the camera’s setting parameters were consistent with those in previous research [41]. Then, the root system images were recorded and stored as JPEG files for the next analysis.
Finally, the images were analyzed using the Root Estimator for Shovelomics Traits (REST, version 1.0.1) software (Swiss Federal Institute of Agricultural Sciences, ETH Zurich) running on MATLAB 7.12 (The Mathworks, Natick, MA, USA). Detailed instructions could be obtained from the user’s manual for REST, version 1.0.1 [42].
After analysis, we were able to obtain 6 root structural parameters (Figure 1A–C; Table S2), including the root opening angle (ROA), the maximum width of 90% ROI (Wmax, “90% ROI” in Figure 1B means 90% root system after correction for outstanding roots), the depth at which the “maximal width” is located (D_Wmax), the depth of 90% ROI (D_0.9), the root projected area (RPA), and the total projected structure length of 90% ROI (TRL).

2.4.3. Root Anatomy Sampling and Measurement

Following root system architecture measurements, five roots per replicate were randomly selected for anatomical analysis. Root segments were collected from the fourth whorl crown root, as described previously [43]. Three 2 cm segments (5–7 cm from the root base, uniform thickness, without pests or diseases) were excised per root and stored in FAA fixative (2 mL cryovials, 4 °C).
Root cross-sections were prepared manually using a Gillette double-edged razor blade under a stereomicroscope. For each segment, one intact section with uniform thickness and monolayer cells was selected. Images were captured with a Nikon light microscope (2× magnification), coupled with a Canon CCD camera and processed using NIS-Elements F 5.21.00 (Nikon, Tokyo, Japan). RootScan2.jar [44] was employed for image analysis.
Twelve anatomical traits were quantified (Figure 1D,E; Table S2). There were four cross-sectional traits (root cross-section area (RXSA), total cortex area (TCA), total stele area (TSA), and the ratio of TCA to TSA (CtoS)), four cortical traits (cortical aerenchyma area (AA), cortical cell file number (CFn), mean cortical cell size (CCm), and cortical cell number (CCn)), and four vascular traits (xylem vessel area (XVA), XVA-to-TSA ratio (XVAp), xylem vessel number (XVn), and mean xylem vessel size (XVm)). Detailed trait descriptions and calculations are provided in Table S2.

2.4.4. Grain-Yield-Related Traits

At physiological maturity, grain yield was determined by harvesting five central rows per plot. The ear was recorded, and the grain moisture content was measured by using a Grain Moisture Tester (PM-8188A, KETT, Tokyo, Japan); yields were determined and then adjusted to 14% moisture content, as in a previous study [45]. The grain yield was converted into kilograms per hectare (kg ha−1) as follows:
GY   =   GY P T P A ×   10000   ,
where GY is the grain yield converted to kilograms per hectare (kg ha−1), GYP was grain yield in the test plot, TPA was the test plot area (m2), and 10000 represented 10,000 m2 per hectare. Additionally, five representative ears were randomly selected to determine kernel number per ear (KNE) and 100-kernel weight (HKW). Ear density (EN, ears number per hectare) was calculated by scaling up the counted ears from the harvested area to a per-hectare basis.

2.4.5. N-Efficiency Parameters Estimation

The hybrids were divided into four types of nitrogen efficiency according to previous studies [45,46], using the ZD958 grain yield under sufficient-N and low-N conditions as the control. Briefly, (1) double-efficient (EE) hybrids showed higher yield than ZD958 at both N levels; (2) sufficient-N-efficient (SNE) hybrids exceeded ZD958’s yield only under the SN treatment; (3) low-N-efficient (LNE) hybrids exceeded ZD958’s yield only under the LN treatment; and (4) double inefficient (NN) hybrids yielded less than ZD958 at both N levels.
Nitrogen agronomic efficiency (NAE), nitrogen requirement reduction (RFR), and potential nitrogen fertilizer reduction (PNR) have been estimated in previous studies [45]. In the SN treatment, there is an additional 150 kg ha−1 of N in comparison with the LN treatment. The calculations are the following:
NAE   =   ( GY SN GY LN ) 150
RFR   of   the   target   hybrid   = 150 GY CKSN     GY TARLN NAE   of   target   hybrid  
PNR   of   the   target   hybrid   ( % ) = RFR   of   the   target   hybrid 150 ×   100 % .
In Formulas (2)–(4), GYSN is the grain yield per hectare under the SN condition (kg ha−1), GYLN is the grain yield per hectare under the LN condition (kg ha−1), 150 kg ha−1 is the increasing amount of N application under SN compared to LN conditions, GYCKSN is the grain yield of the check hybrid (ZD958) under a sufficient-nitrogen supply (kg ha−1), GYTARLN is the grain yield of the target hybrid under the LN condition, and the target hybrid refers to the hybrid which we wanted to use to calculated the RFR.

2.5. Transcriptome Analysis of Parental Inbred Lines

To further elucidate the mechanisms underlying root responses to low-N stress, we analyzed previously published transcriptomic data of parental inbred lines; the gene expression was in FPKM (fragments per kilobase of exon model per million mapped fragments) format [14]. Our approach comprised four key steps: (1) differentially expressed genes under LN (LN-DEGs) were identified by comparing gene expression under the LN and SN conditions. Firstly, the fold change (FC) in the FPKM value under LN was calculated and compared with that under the SN condition. Genes with absolute|log2FC| > 1.0 and a false discovery rate (FDR) of <0.01 were classified as LN-DEGs, genes with log2FC > 1.0 were defined as upregulated, and those with log2FC < −1.0 were defined as downregulated. A pseudo-count of +1 was added to the FPKM values prior to these calculations to avoid undefined values, as described previously [47]. (2) Cross-comparison of “LN-DEGs” among the nine inbred lines revealed unique gene sets (genotype-specific LN-DEGs) in the parental lines of ND108 (P178, Huang C), WK702 (YE8001, Ji853, LX9801, Chang7-2), and ZD958 (U8112, Shen5003, Dan340). (3) This was followed by Gene Ontology (GO) enrichment analysis of genotype-specific LN-DEGs. (4) The following step was functional annotation of enriched pathway genes using the maizeGDB website (https://m.maizegdb.org/, accessed on 29 May 2025) and TAIR (www.arabidopsis.org, accessed on 29 May 2025). Based on gene annotations, we identified candidate genes associated with contrasting root responses to low N among the hybrids with divergent NUE.

2.6. Statistical Analysis

Analysis of variance was conducted using the General Linear Model (GLM) in the SPSS Statistics 21 software (IBM, Armonk, NY, USA). For the two factors, N and genotypes, a two-way ANOVA was performed first. If the interaction between N and genotypes was not significant, multiple comparisons (using Duncan’s new multiple-range test) were used to compare the main effects of genotype (hybrid or inbred lines) and N treatments. If the interaction effect was significant, then a one-way ANOVA and multiple comparisons (Duncan’s test) were conducted on the six hybrids (2023) or nine inbred lines (2024) under the SN and LN conditions, respectively. This compared the simple effects of hybrid/inbred lines within each specific N treatment. Bar plot, box plot, Pearson correlation coefficients, principal component analysis (PCA), and clustering analyses were calculated and plotted using the “ggplot2” package in R 4.4.1 [48]. The figures were combined and colored in Adobe Illustrator CC 2018 (Adobe Systems Incorporated, San Jose, CA, USA).
The LN-induced responsiveness of root traits was also calculated in this study using the following calculation method:
LN   responsiveness   ( % )   =   value   in   LN value   in   SN value   in   SN     ×   100 % .
Random forest analysis was conducted using the “rfPermute” package in R 4.4.3 to analyze the importance of each trait in contributing to the GY. All data were used to build the final model based on the following parameters: importance = TRUE, ntree = 1000, and nrep = 299. Model significance and cross-validated R2 values were evaluated through 1000 permutations using the “rfPermute” package in R [49]. In the random forest analysis, variable importance was determined based on the percentage increase in mean squared error (%, MSE), where higher values indicate greater predictive influence [50,51].
Based on correlation analysis, PCA, and RF results, the hypothesized pathways of root and NUE traits were constructed. Then, structural equation modeling (SEM) was conducted to systematically analyze, validate, and optimize the direct and indirect relationships between treatments, root traits, and yield traits, and the “path” method was selected as the weighting scheme. Finally, path coefficients and their statistical significance (p-values) were calculated.

3. Results

3.1. The Effects of N Levels and Hybrids on N-Efficiency Traits

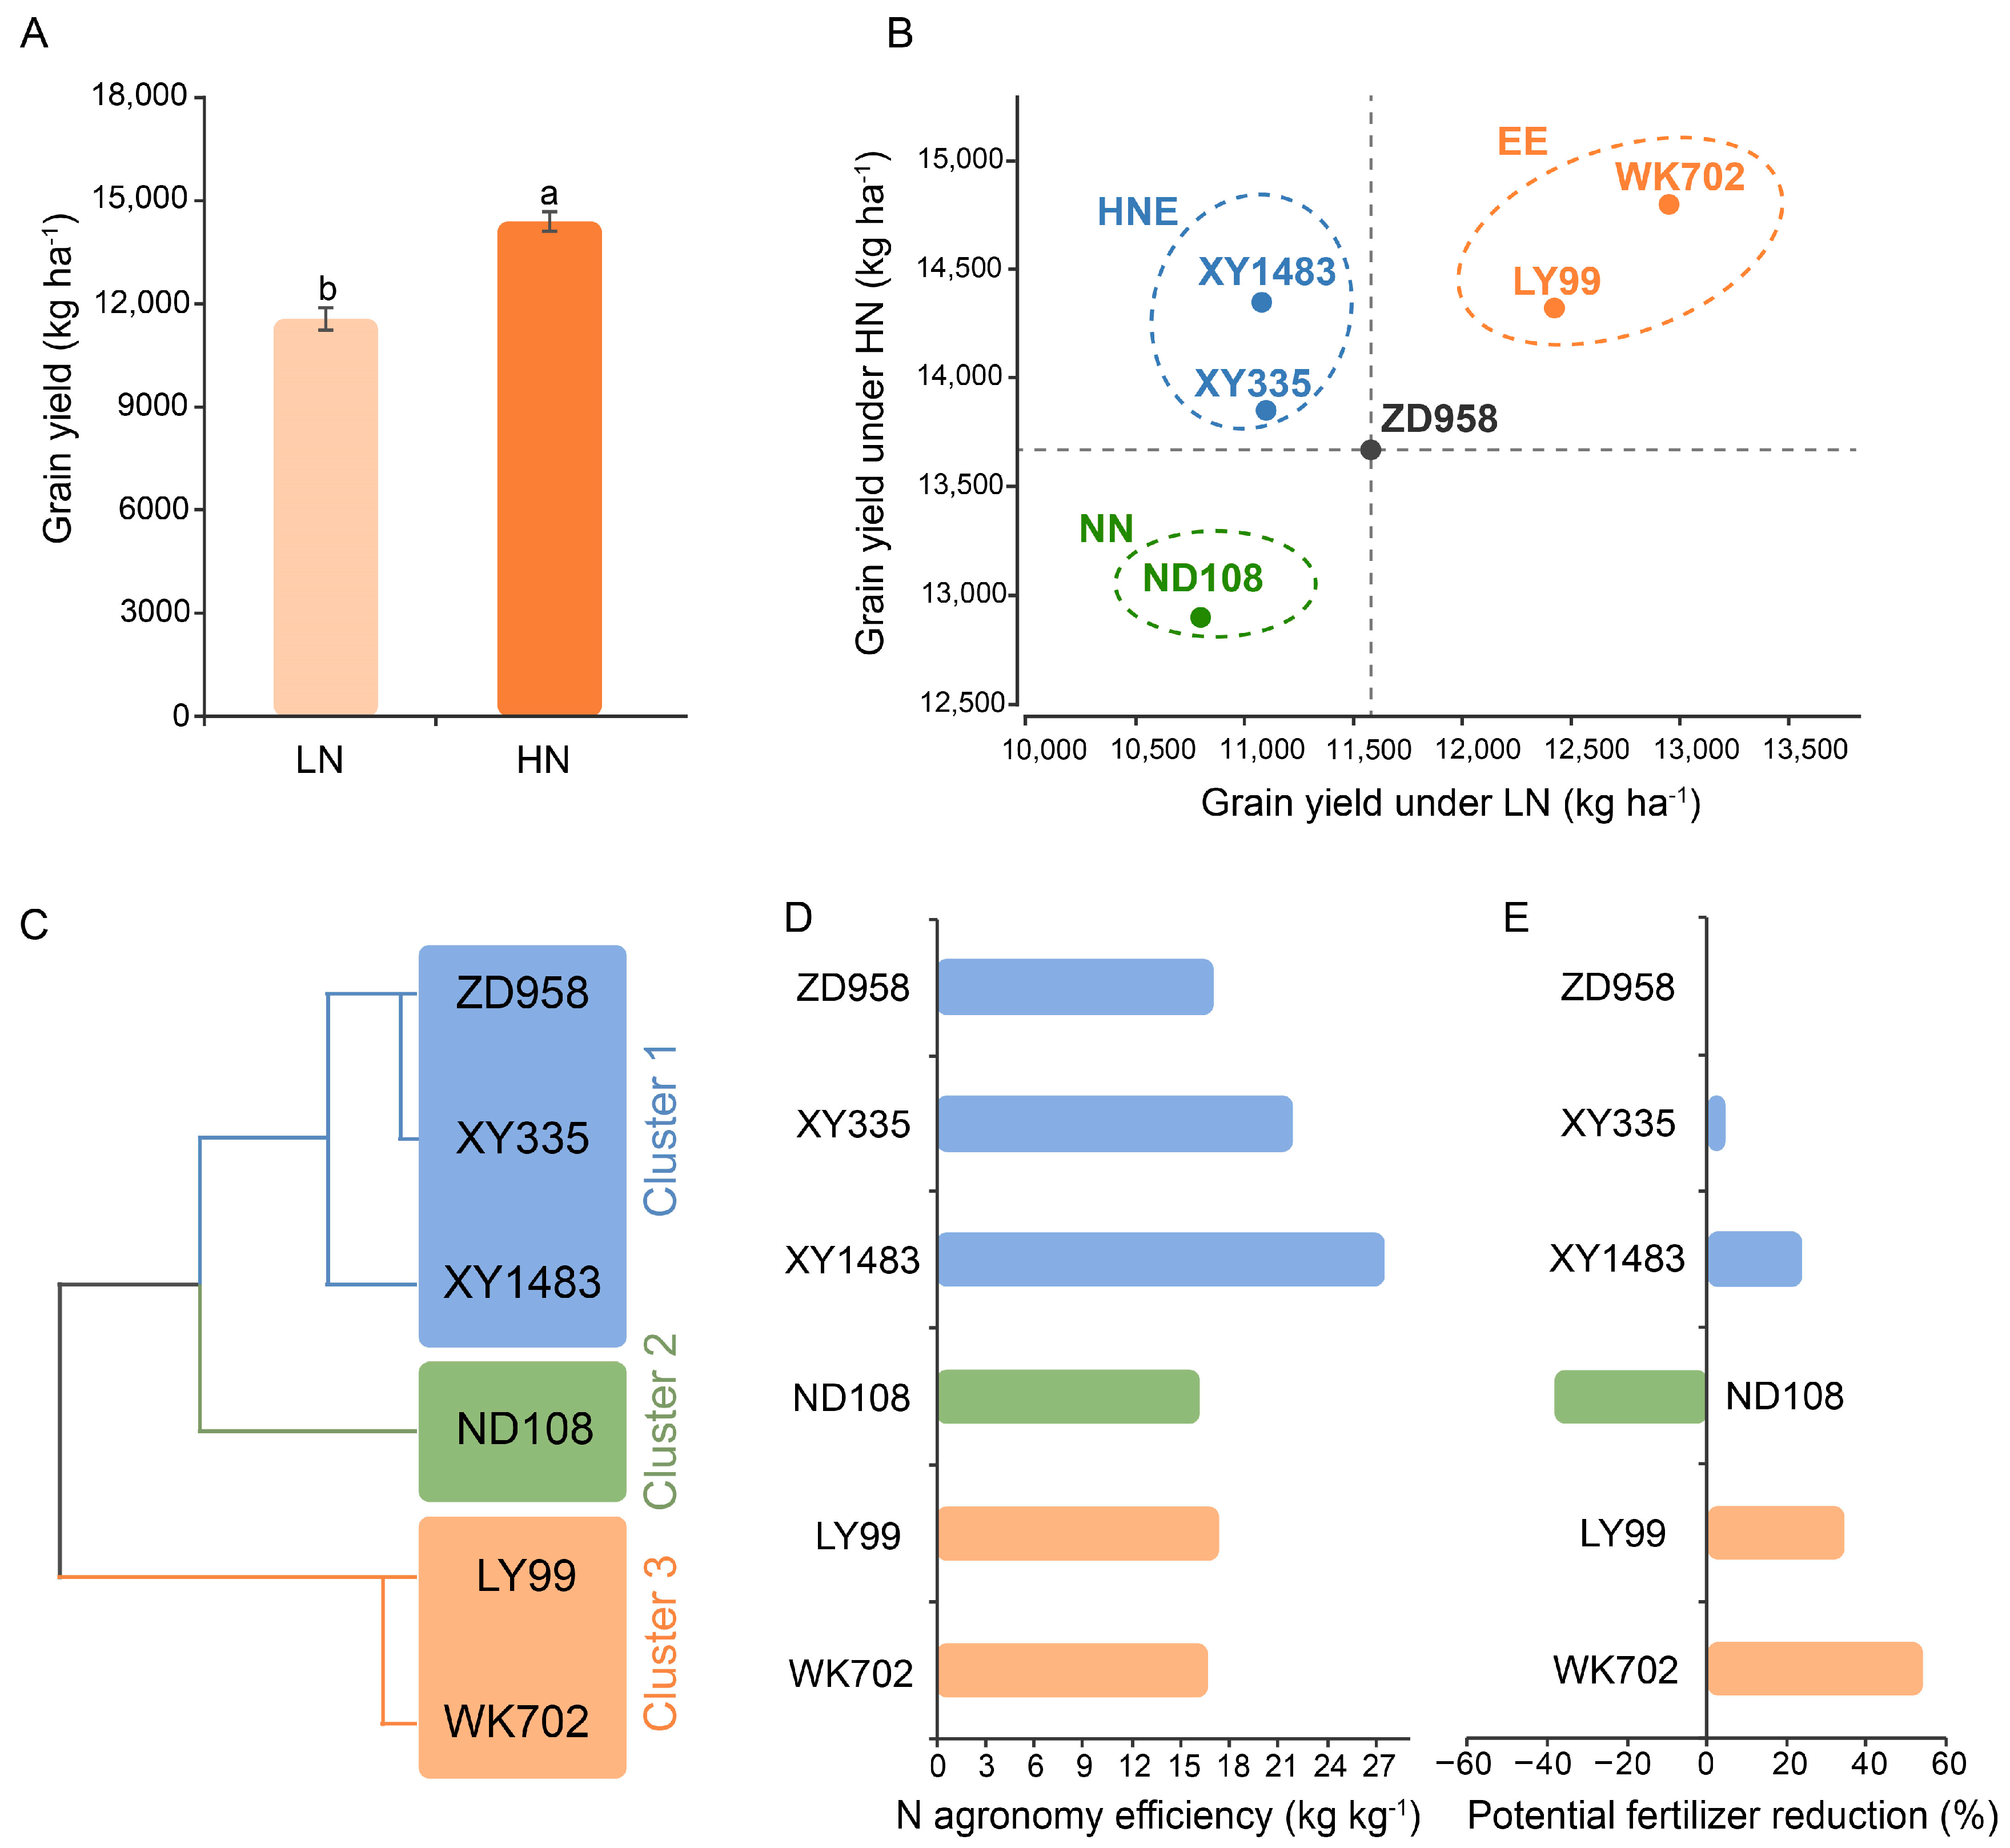
ANOVA indicated that N levels significantly impacted grain yield (GY), ear number (EN), and hundred-kernel weight (HKW), while hybrid (H) effects were significant for GY, EN, and kernel number per ear (KNE) (p < 0.05, Table S3; Figure S1). Under low-N (LN) conditions, average GY reduction reached 17% across all varieties (p < 0.05; Figure 2A), with genotype-specific reductions varying from 13.9% to 23.1% (Table 1). The yield components showed significant decreases, except for KNE, and particularly for HKW, which demonstrated the most substantial reduction (5.86% average across hybrids; p < 0.05; Table 1).
Significant hybrid × nitrogen (H×N) interactions were detected for GY (p < 0.05), revealing differential varietal responses to N availability (Table 1; Figure 2B). Based on the GY performance under the SN and LN treatments, the hybrids were categorized into three groups: WK702 and LY99 exhibited N efficiency under both N levels (EE group), showing superior GY (5.35–8.17% higher under SN and 6.29–10.30% higher under LN compared with ZD958) and greater LN tolerance (only 13.8–14.7% GY reductions). XY1483 and XY335 displayed higher N efficiency only under SN conditions (SNE group), matching or exceeding ZD958 by up to 5.88% under SN but showing a more marked LN sensitivity than the EE group (19.3–23.1% GY reductions). ND108 demonstrated N inefficiency under both conditions (NN group), consistently yielding 5.5–5.7% less than ZD958 (p < 0.05; Table 1).
Cluster analysis of the yield performance across N levels confirmed this classification, with all hybrids maintaining their respective EE, SNE, and NN groupings (Figure 2C). Comparative analysis revealed that EE hybrids achieved the highest potential nitrogen reduction (PNR: 34.4–54.5%), while SNE hybrids showed superior N agronomic efficiency (NAE: 22.2–27.9 kg kg−1) with high PNR (4.6–24.0%). In contrast, NN hybrids exhibited the poorest performance (NAE: 16.6 kg kg−1; PNR: −38.3%) (Figure 2D,E).

3.2. The Effects of N Levels and Hybrids on Root Architecture Traits

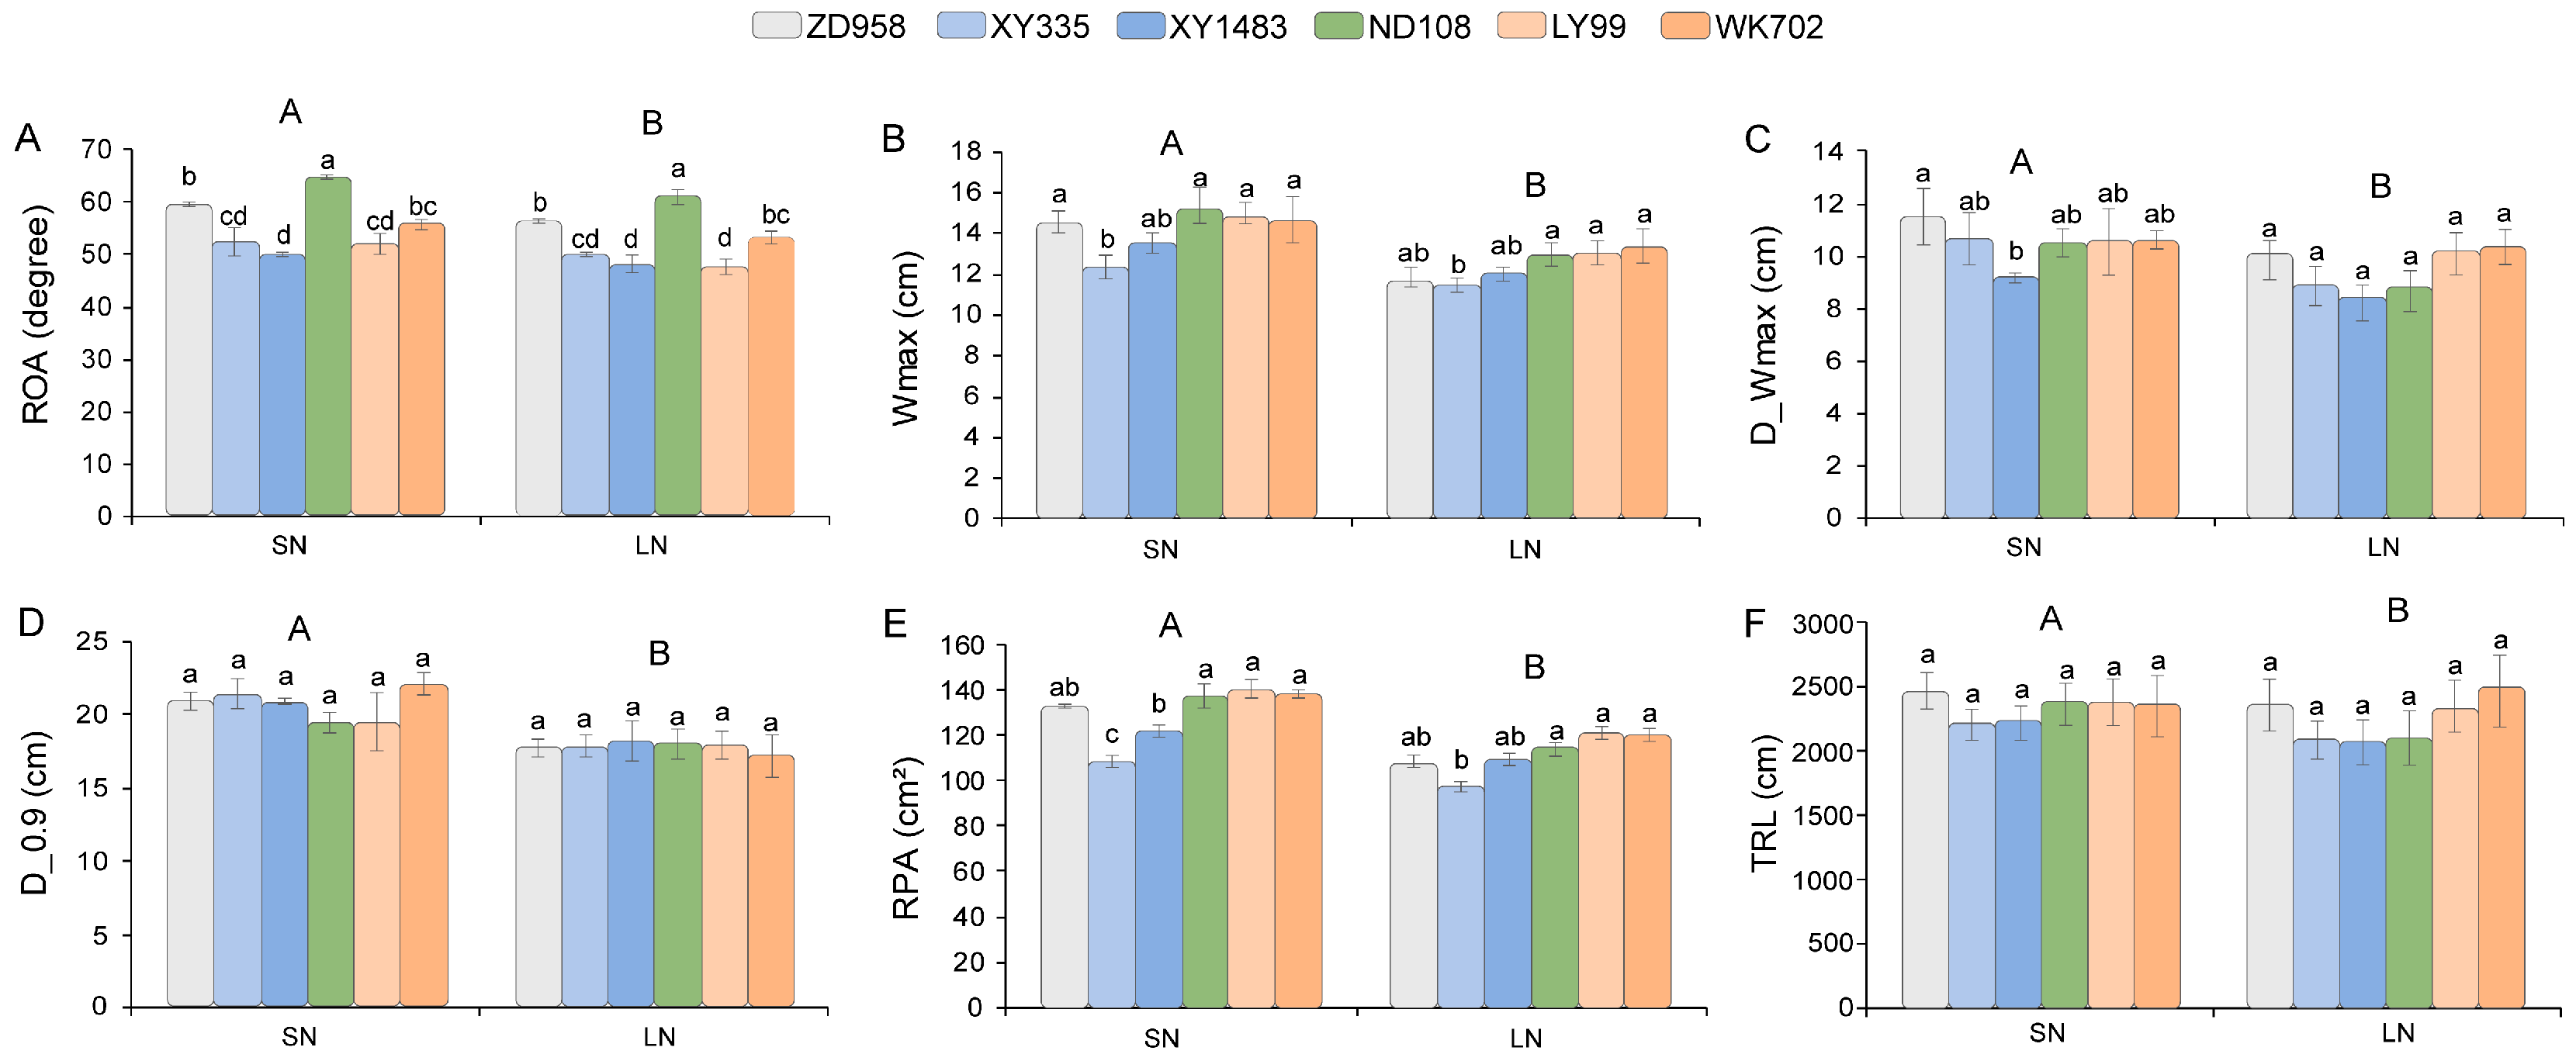
In 2023, ANOVA revealed that N treatments had significant effects on all RSA traits. Under LN conditions, the six hybrids exhibited average reductions of 5.56%, 12.59%, 10.13%, 13.74%, 14.16%, and 3.21% in ROA, Wmax, D_Wmax, D_0.9, RPA, and TRL, respectively (p < 0.05; Figure 3; Table S4). Significant H and N×H interaction effects were also detected on ROA, Wmax, and RPA (p < 0.05; Table S4). EE hybrids (LY99 and WK702) displayed a 6.00–15.66% (LN conditions) and 5.63–12.72% (SN) smaller ROA than ZD958, along with an 11.90–12.44% larger RPA and 16.3–22.6% deeper D_Wmax than the other hybrids under LN stress. Similarly, SNE hybrids (XY335 and XY1483) showed an 11.26–14.59% (LN) and 11.85–16.13% (SN) smaller ROA than ZD958, and they had a reduced Wmax compared with the EE and NN hybrids. However, the RPA of SNE was lower by up to 9.49–19.51% (LN) and 18.28–22.52% (SN) relative to the other hybrids (p < 0.05). In contrast with EE and SNE, the NN genotype (ND108) exhibited the largest ROA (60.75–64.48°) under both N treatments.
LN-induced responsiveness of the hybrids revealed significant genotypic variation in root architecture (Table S5). The NN hybrid displayed marked sensitivity to LN stress, exhibiting significantly greater reductions in RSA traits compared with EE and SNE hybrids (p < 0.05), including a 16.43% decrease in RPA, 13.95% in Wmax, 14.76% in D_Wmax, and 11.28% in TRL. Notably, SNE varieties showed a significant 8.84–17.09% reduction in D_Wmax under LN conditions. In contrast, EE hybrids demonstrated remarkable LN tolerance, maintaining D_Wmax stability with no significant difference from the SN treatment (p > 0.05). The EE variety WK702 exhibited superior performance under LN stress, achieving an 18% increase in TRL compared with that under SN conditions.
In 2024, parental inbred lines revealed patterns consistent with their hybrids (Table S6). EE-type parental lines exhibited the smallest ROA (35.68° on average) under SN conditions, and they showed the largest D_Wmax (6.82 cm) and RPA (37.89 cm2) under LN conditions. Under LN conditions, SNE-type parental lines displayed significantly reduced RPA and D_Wmax (by 10.5% and 23.8%, respectively) compared with those under SN conditions, with greater LN reductions than those of the EE and NN lines (p < 0.05). NN-type parental lines had the largest ROA (50.97°) under SN conditions, and they had the smallest Wmax (7.5–8.82 cm), D_Wmax (4.95–5.80 cm), RPA (20.68–20.89 cm2), and TRL (324.60–373.81 cm) under both N conditions. Within each category (EE, SNE, NN), genotypic variations were observed between inbred lines; for example, the EE parent Ji853 showed 35.6–44.1% higher D_Wmax than Chang7-2 and Ye8001, but the overall trends remained consistent with the hybrids.

3.3. The Effects of N Levels and Hybrids on Root Anatomical Traits

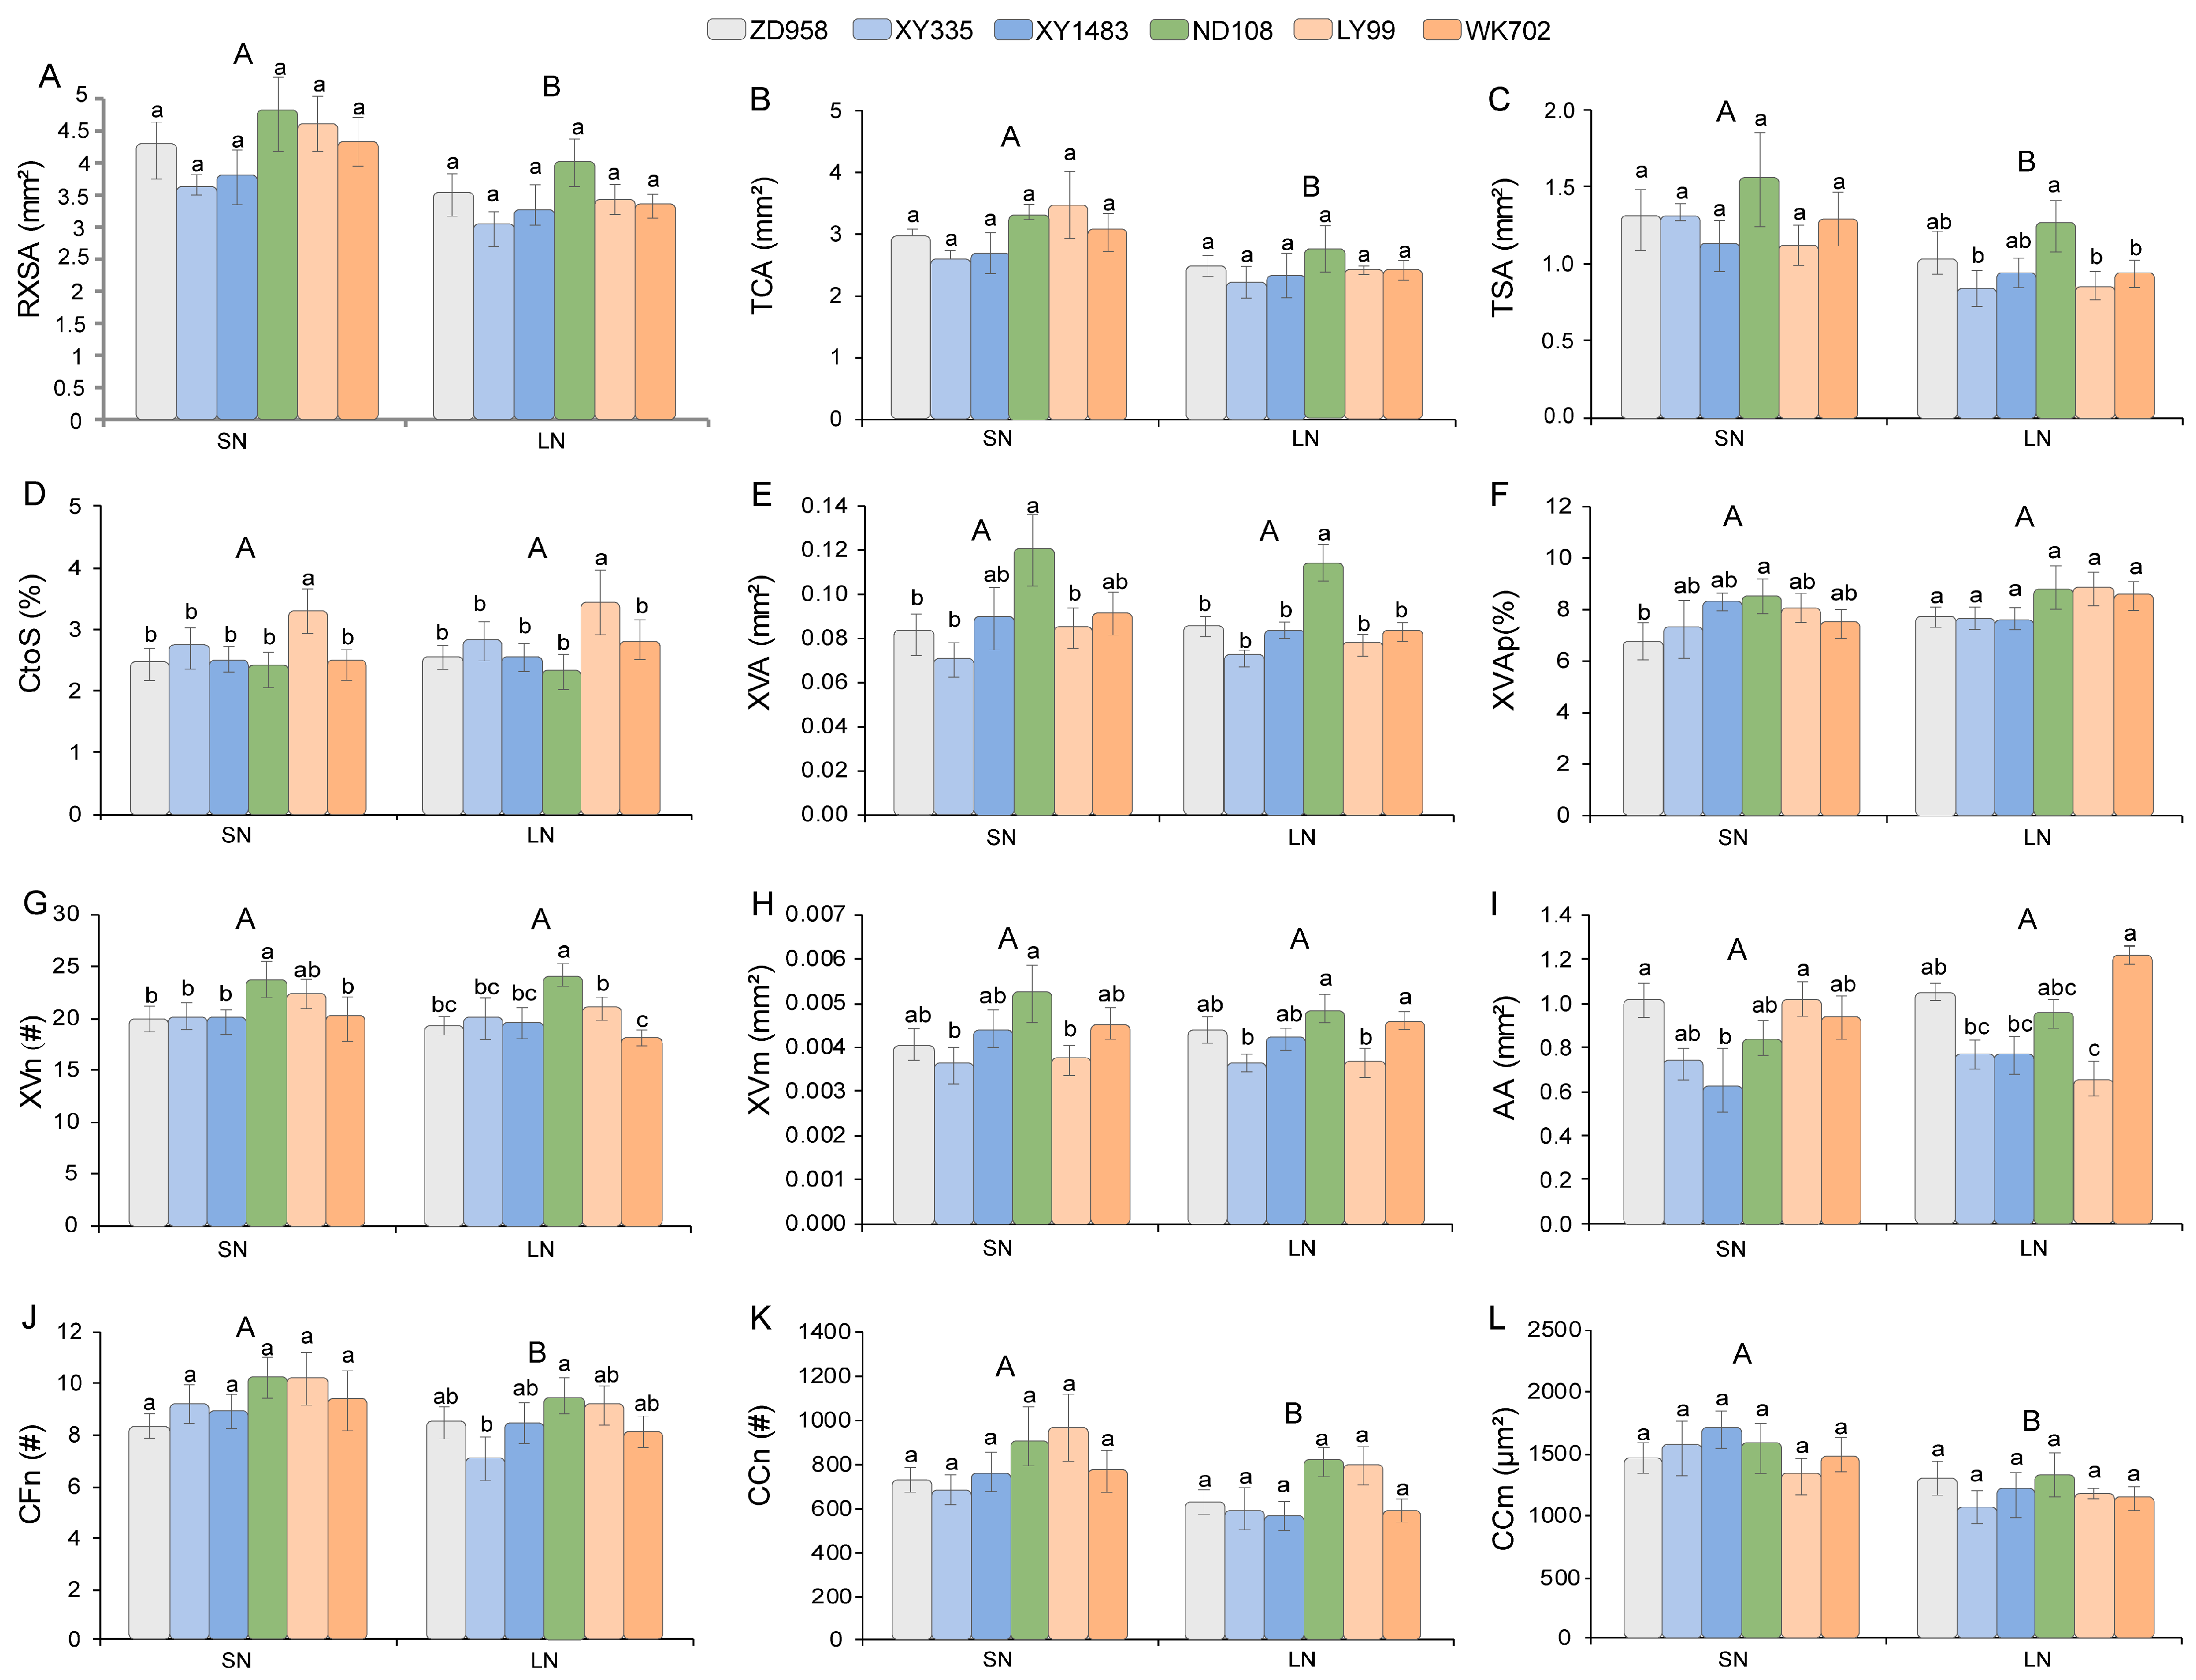
In 2023, ANOVA revealed that the LN treatment significantly reduced root cross-sectional traits (RXSA, TCA, TSA) and cortical traits (CFn, CCm, CCn) by 10.45–23.83% (p < 0.05) across six hybrids compared with SN conditions (Figure 4; Table S7). Although AA remained unchanged under LN conditions, its proportion in the total cortex (AA/TCA × 100%) increased from 28.66% to 37.05% (p < 0.05). Hybrids (Hs) also significantly influenced xylem traits (XVA, XVn, XVm), as well as CtoS, AA, RXSA, and TSA. The NN hybrid (ND108) exhibited distinct phenotypic characteristics, showing a 22.12–51.19% larger TSA (p < 0.05) compared with other varieties under LN conditions. NN also displayed enhanced metaxylem development under both SN and LN conditions, with the highest XVA (0.1142 mm2), XVn (24.06), and XVm (0.0048 mm2) (p < 0.05). In contrast to NN, EE and SNE varieties consistently showed reduced metaxylem traits (XVA, TSA; p < 0.05), though genotypic variation existed between the EE and SNE groups. Under LN conditions, WK702 (EE) showed the lowest XVn (18.17, p < 0.05) but the largest AA (1.22 mm2, p < 0.05), while LY99 (EE) had the smallest AA (0.65 mm2, p < 0.05), indicating AA instability in EE hybrids. Meanwhile, the SNE genotype, XY1483, showed a 22.99–33.66% lower AA compared with other genotypes under SN conditions (p < 0.05).
LN-induced responsiveness analysis also revealed genotypic variation in root anatomical traits (Table S5). AA exhibited the most pronounced variation in response to LN across six hybrids (−35.64% to 29.55% reduction), demonstrating strong varietal dependence. Traits related to cortical cells and cross-sectional area also exhibited significant varietal differences in response to LN. Notably, the EE hybrids showed the most dramatic reductions in root cross-sectional area traits (RXSA, TCA, and TSA), with declines of 20.72–30.95%, while CCn decreased by 17.35–24.13%. The XVn and XVA in EE hybrids decreased by 6–10%. The SNE hybrids were characterized by the greatest reductions in cortical cell traits (CCm, CCn, and CFn), declining by 16.67–31.96%, along with a significant decrease in TSA (20.61–35.88%). In contrast, the NN hybrids exhibited intermediate responses across traits, with XVm showing a relatively larger reduction of 7% under LN conditions.
In 2024, the root anatomical traits of parental inbred lines also had genotypic differences (Table S8). EE-type parental lines exhibited the largest AA (0.72 cm2 on average) under LN conditions, and this was 84.6–242.9% larger than that of NN-type and SNE-type inbred lines. EE and SNE both had a lower XVA of 0.09–0.10 cm2 and an XVm of 0.0050–0.0058 cm2. In contrast, NN-type inbred lines had the largest TSA (0.92–1.04 cm2) and XVA (0.13–0.15 cm2), and the smallest CtoS (2.14–2.24). The parental inbred lines exhibited genotypic variations within each category (EE, SNE, NN) while maintaining overall trends consistent with their respective hybrids.

3.4. The Correlation Between Root and N-Efficiency Traits

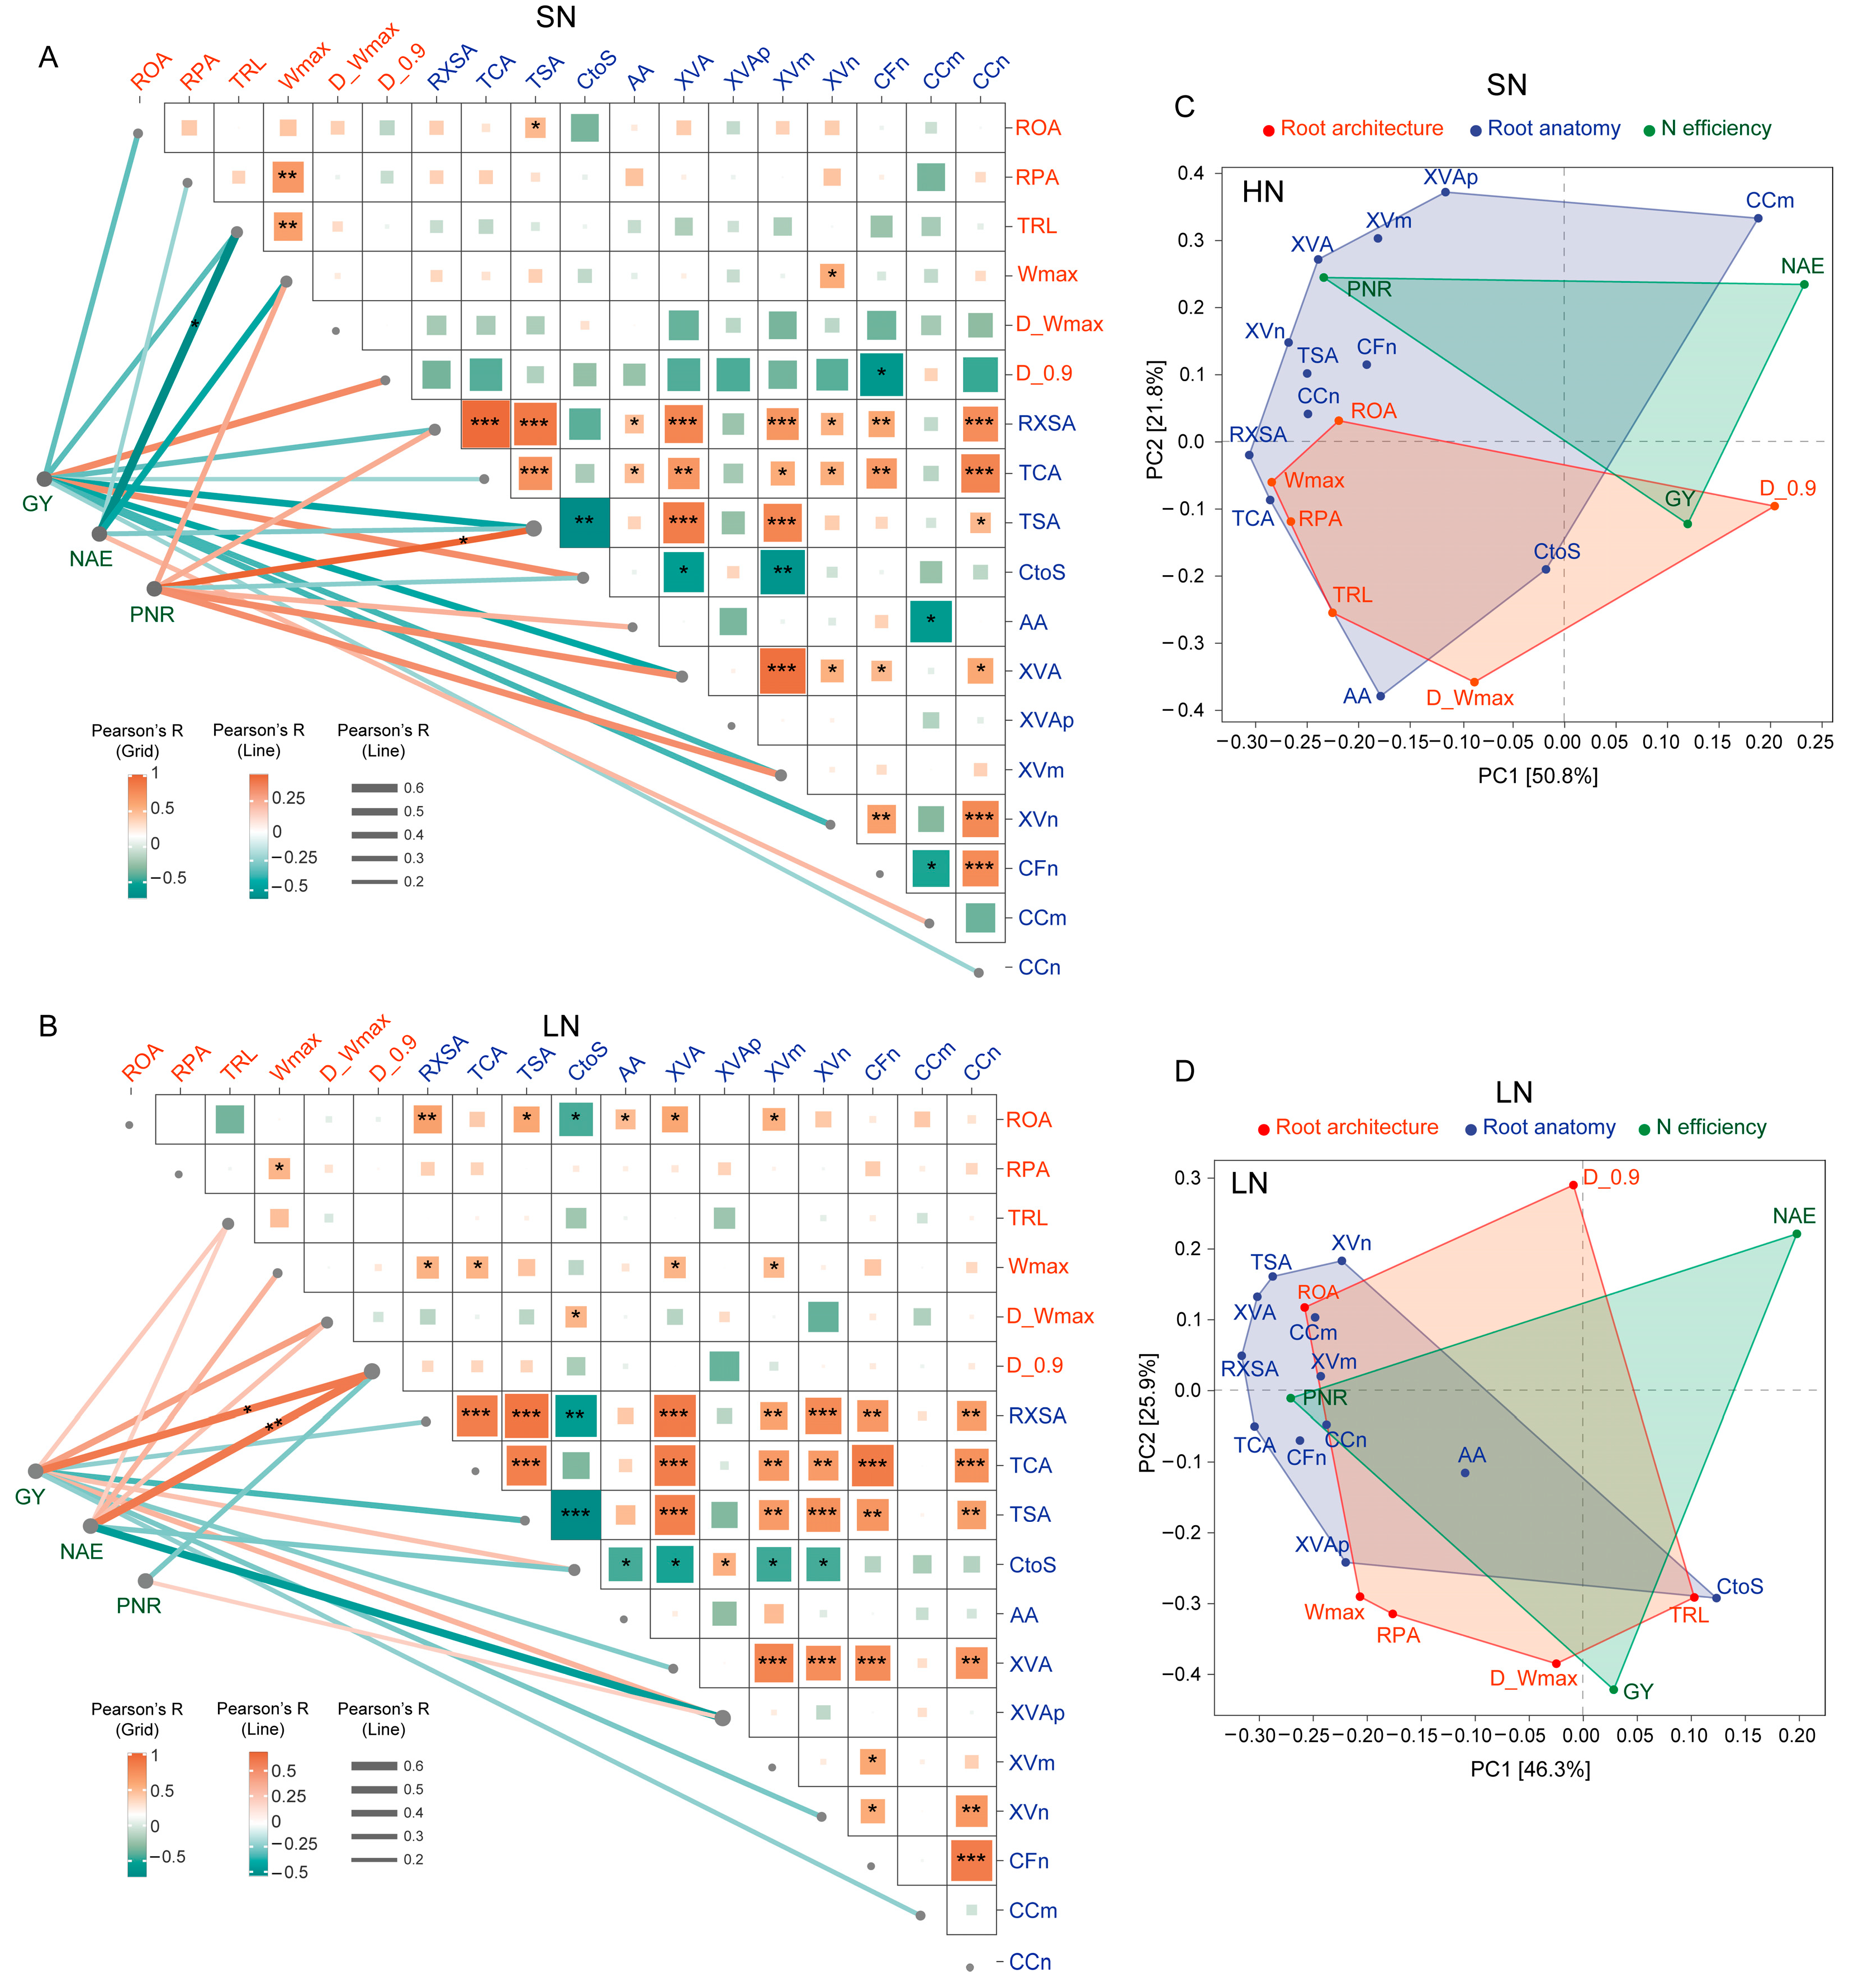
The correlation analyses demonstrated significant associations between root phenotypic traits and NUE (Figure 5A,B; Tables S9 and S10). Under SN conditions, significantly positive correlations were detected between RSA traits, including maximal root width (Wmax), exhibiting strong correlations with the total projected structure length (TRL; r = 0.683, p < 0.01) and root projected area (RPA; r = 0.601, p < 0.05). We also detected strong correlations among most of the anatomical traits measured, which were consistent with allometric growth in root anatomy development. The cross-sectional area traits, such as RXSA and TCA, displayed significant positive correlations with most measured anatomical traits (r = 0.469–0.963, p < 0.05), except for CCm and XVAp. The CtoS showed negative correlations with TSA, XVA, and XVm (r = −0.543 to −0.614, p < 0.05). AA only had a negative association with CCm.
Under SN conditions, significant correlations between the RSA traits and anatomical traits were detected (Table S9). TSA correlated positively with ROA (r = 0.499), and Wmax correlated with XVn (r = 0.565), while D_90 exhibited a negative correlation with CFn (r = −0.588). Notably, NUE-related correlations revealed that TRL negatively influenced NAE (r = −0.571), whereas TSA positively affected PNR (r = 0.483). Principal component analysis (PCA) also validated the correlation results; the proximity of TSA, ROA, and Wmax in the PCA biplot suggests their synergistic regulation under SN conditions. Negative loadings of TRL and positive loadings of NAE on both PC1 and PC2 imply a trade-off between these traits.
Under LN conditions, more significant correlations were observed between root anatomical and architectural traits compared with SN conditions (Table S10). A root architectural trait (ROA) showed significant positive correlations with anatomical traits RXSA, TSA, AA, XVA, and XVm (r = 0.469–0.618), and a negative correlation with the CtoS (r = −0.481). The architectural trait Wmax exhibited positive correlations with RXSA, TCA, XVA, and XVm (r = 0.483–0.513), while D_Wmax was positively correlated with CtoS (r = 0.498). These results imply a potentially greater role of anatomical traits in shaping root architecture under LN stress. For root anatomical traits, more significant correlations were established under LN stress. For instance, TSA showed positive correlations with XVn and XVm (r = 0.684–0.719). The root architecture trait D_0.9 displayed stronger associations with NUE-related traits, particularly with NAE (r = 0.615, p < 0.05). The PCA results (Figure 5C,D) demonstrated that under LN conditions, anatomical traits exhibited a more clustered distribution and were positioned closer to RSA traits (e.g., ROA, Wmax, RPA) in the biplot, further supporting the enhanced correlations observed between anatomical traits themselves and between anatomical and architectural traits under N limitation.

3.5. Random Forest and Structural Equation Modeling Analysis of the Root System and N Efficiency

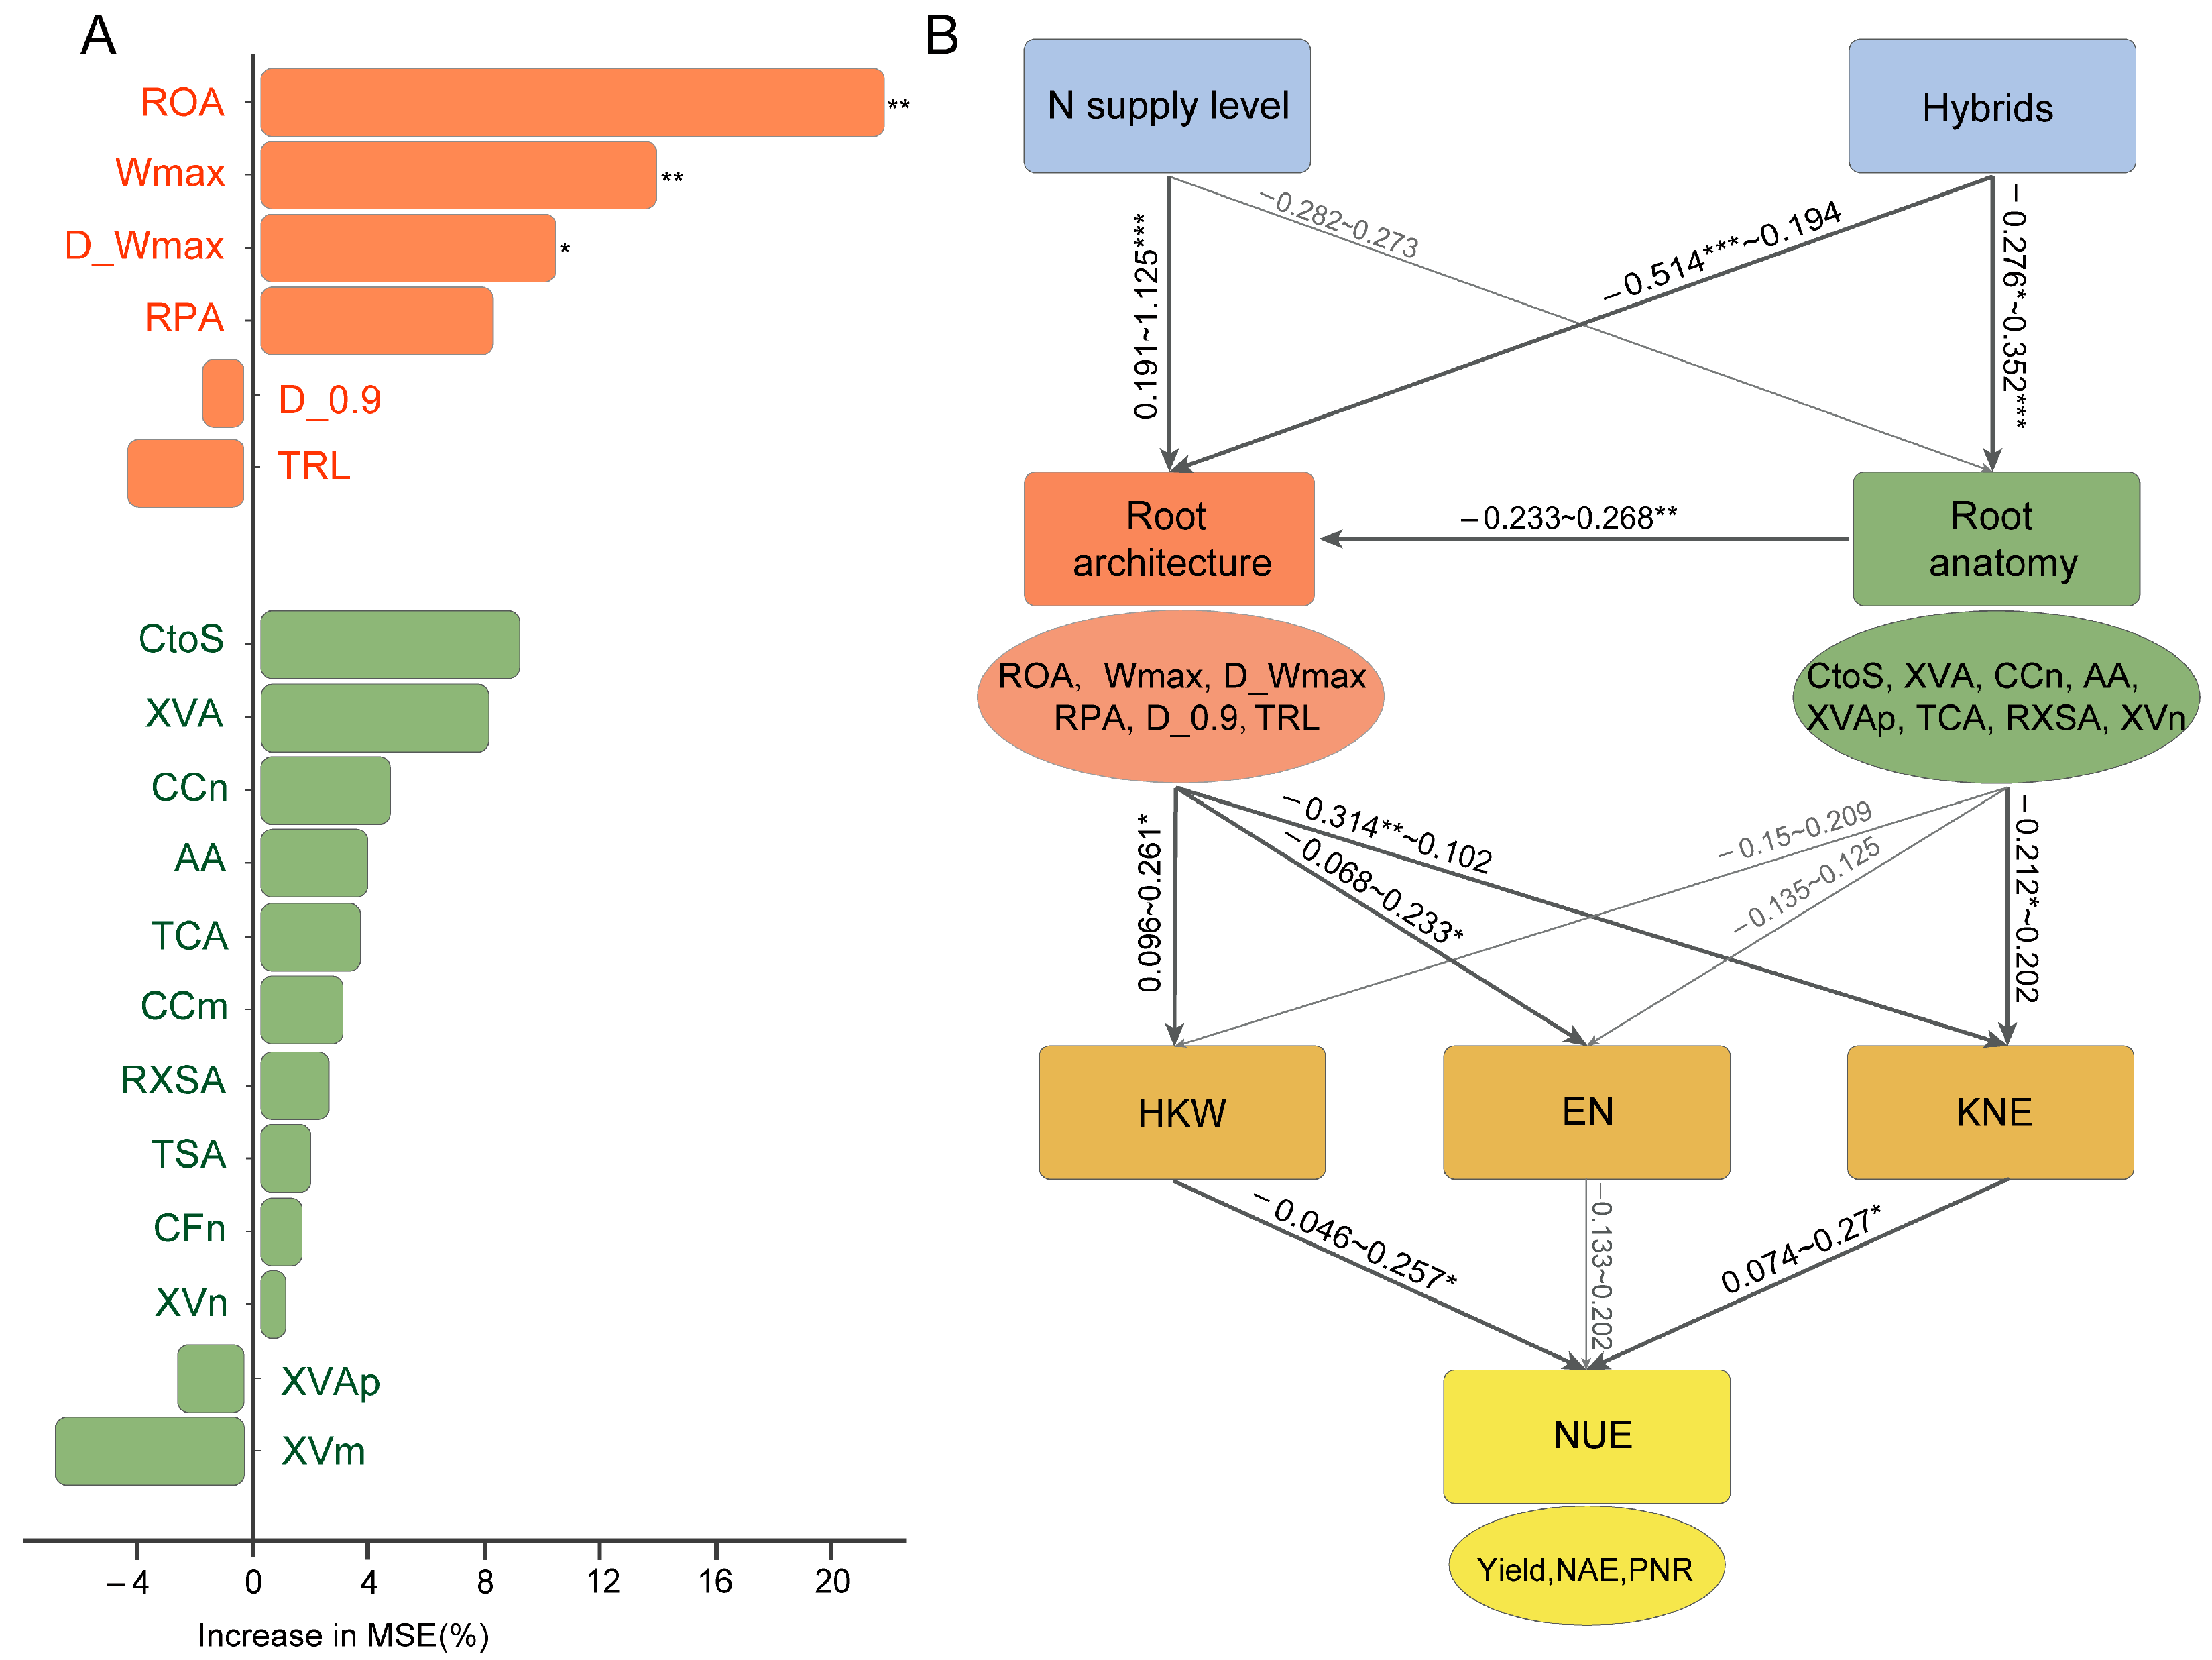
Random forest (RF) analysis of root traits revealed that ROA, Wmax, and D_Wmax significantly affected GY (MSE: 11.05–23.39, p < 0.05), while root anatomical traits showed no direct effects on GY (MSE: −6.47–6.56) but significantly influenced root architectural traits (MSE: 8.04–14.36; p < 0.05; Figure 6A and Figure S2). Based on the correlation, PCA, and RF results, we performed structural equation modeling (SEM). In the SEM analysis, N treatment significantly impacted all root architectural traits (path coefficients: 0.559–1.125, p < 0.01) except TRL (0.191). Hybrids exerted significant effects on both root architecture and anatomy, with path coefficients of 0.514 (p < 0.001) for ROA, 0.352 (p < 0.001) for CtoS, −0.276 (p < 0.05) for XVA, and −0.253 (p < 0.05) for XVn. Notably, root anatomical traits exhibited highly significant effects on root architectural traits, with XVAp showing a positive path coefficient with Wmax (0.268, p < 0.01).
SEM analysis revealed significant effects of root architecture traits on the yield components (Figure 6B; Table S11). The path coefficients ranged from 0.096 to 0.261 for HKW, −0.036 to 0.233 for EN, and −0.314 to 0.102 for KNE. Notably, ROA (path coefficients: 0.190), RPA (0.195), and D_Wmax (0.261) significantly influenced HKW (p < 0.05). D_0.9 showed significant positive effects on EN (0.233, p < 0.05), while ROA negatively affected KNE (−0.314, p < 0.01). Additionally, yield components affected N-efficiency traits; the path coefficients ranged from −0.046 to 0.257 for HKW, −0.133 to 0.202 for EN, and 0.074 to 0.270 for KNE. Notably, HKW significantly affected yield (p < 0.05), while GNE showed a significant influence on NAE (p < 0.05).

3.6. Transcriptome Analysis of Parental Inbred Lines for Root LN Response

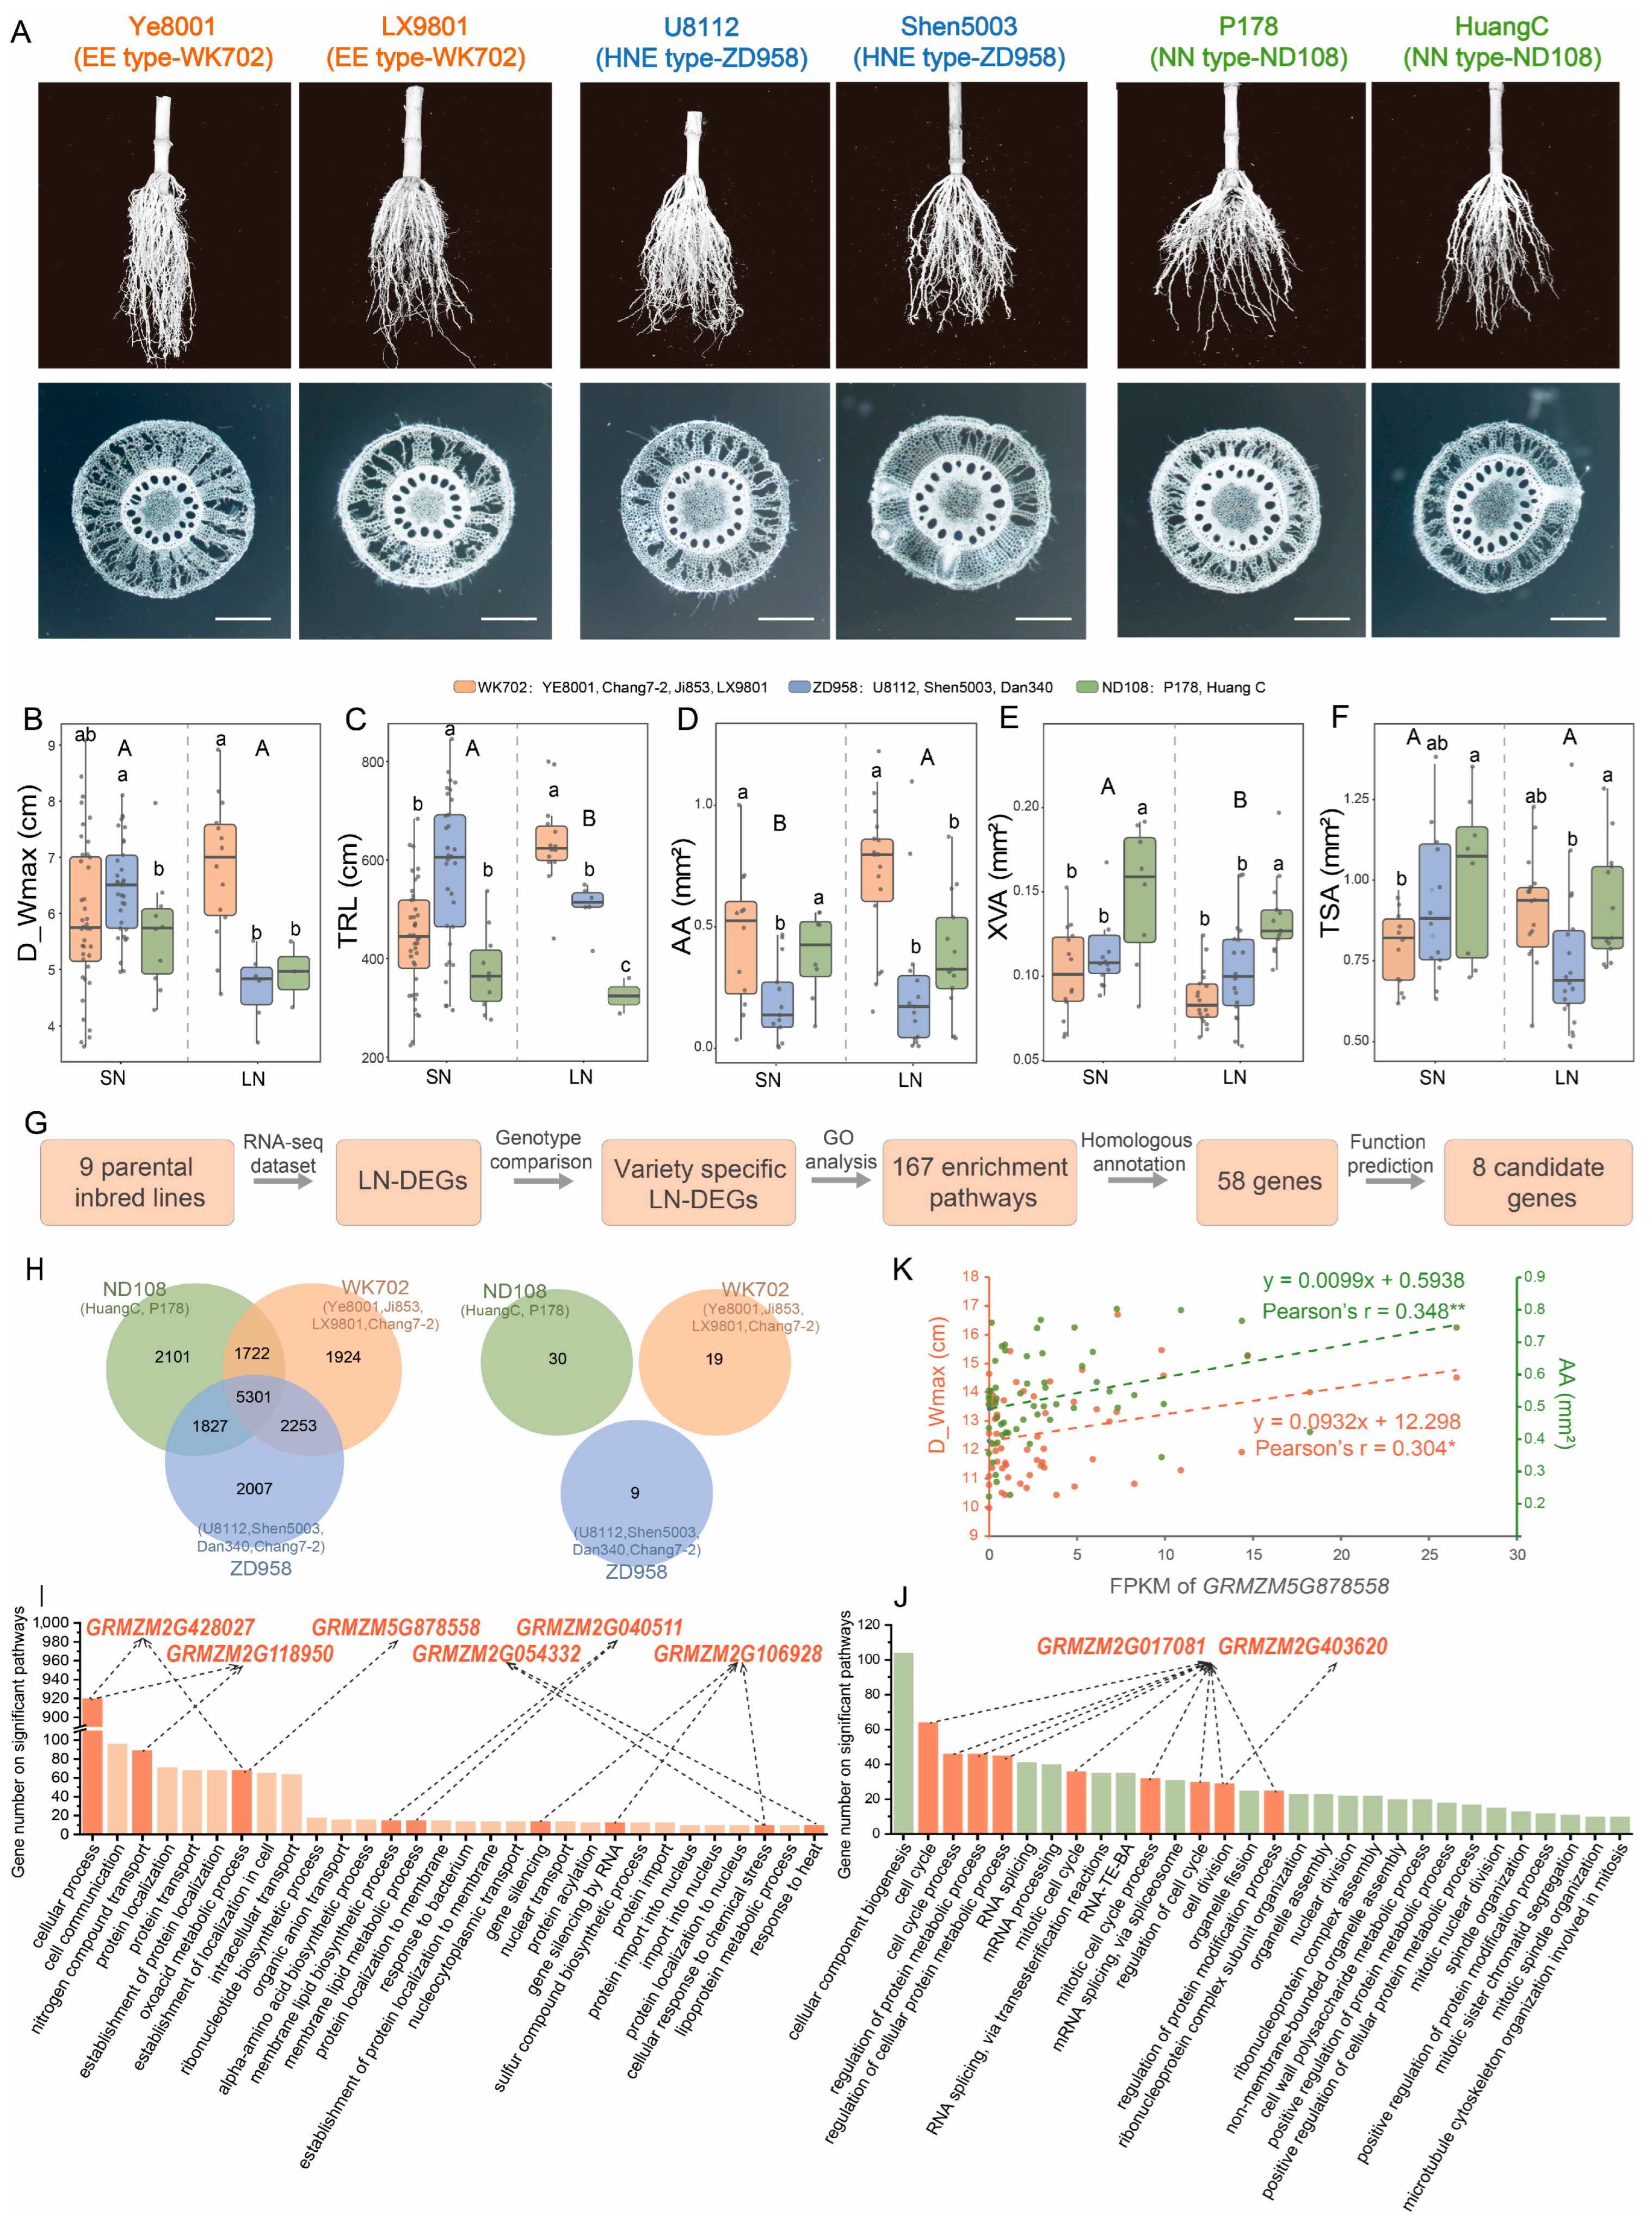
To investigate genotype-specific root responses to LN, we evaluated the phenotypic and transcriptome analysis of parental inbred lines of the EE-type hybrid WK702 (Ye8001, Ji853, LX9801, and Chang7-2), the NN-type hybrid ND108 (P178 and Huang C), and the SNE-type hybrid ZD958 (U8112, Shen5003, and Dan340) under SN and LN conditions in 2024. The parental lines generally maintained root architectural and anatomical characteristics consistent with their corresponding hybrids, as described above (Figure 7A–F; Tables S6 and S8).
Transcriptome analysis under LN and SN conditions identified LN-responsive differentially expressed genes (LN-DEGs) across the nine inbred lines (FDR < 0.05, |log2FC| > 1; Figure 7G). Comparative analysis further revealed genotype-specific LN-DEGs in the parental inbred lines, with 1924, 2007, and 2101 unique LN-DEGs exclusively detected in WK702, ZD958, and ND108, respectively (Figure 7H). GO enrichment analysis of these genotype-specific LN-DEGs (after filtering for pathways containing >5 genes) showed that the WK702, ZD958, and ND108 parental lines were enriched for 60, 59, and 48 significant biological pathways, encompassing 1036, 549, and 601 genotype-specific LN-DEGs, respectively (Figure 7I; Table S12). Further screening of GO annotations yielded 19, 9, and 30 high-confidence candidate genes in WK702, ZD958, and ND108, respectively (Figure 7H; Table S13).
Through comprehensive functional annotations of Zea mays and Arabidopsis orthologs, we identified six and two high-confidence LN-responsive DEGs in the WK702 and ND108 parental lines, respectively (Figure 7I,J; Table 2). Functional annotation revealed that four WK702-specific genes regulating root architecture and stress responses, in response to LN stress, GRMZM5G878558, GRMZM2G428027, and GRMZM2G118950, were upregulated exclusively in the parental lines of WK702 (Ji853 and Chang 7-2). Conversely, GRMZM5G878558 and GRMZM2G106928 were downregulated in the parental lines of WK702 and YE8001, while two others, GRMZM2G054332, GRMZM2G040511, are involved in nutrient uptake. The ND108-specific genes (GRMZM2G403620, GRMZM2G017081) were associated with brace root development, directly influencing the root system architecture (ROA). GRMZM2G017081 was downregulated in the parental lines of ND108 (P178 and Huang C), and GRMZM2G403620 was only downregulated in P178. Leveraging our root anatomical database of 60 maize inbred lines and published root architecture/transcriptome data, the expression level of GRMZM5G878558 was significantly correlated with both root architecture (D_Wmax) and anatomy (AA) traits (Figure 7K), demonstrating these genes’ pivotal role in coordinating root development under N limitation.

4. Discussion

4.1. Integrated Root System Architecture Anatomy Responses to Low N and Key Traits for N Efficiency

Nitrate is highly susceptible to deep leaching, making deep-root systems essential for efficient N acquisition under low-N conditions [61,62]. Reductions in shallow crown roots and steeper root growth angles have been demonstrated to promote deeper root distribution, thereby enhancing N uptake [17,18]. Our study revealed that N-efficient hybrids (EE: LY99, WK702) and their parental inbred lines developed steeper root opening angles (ROAs) and deeper rooting (D_Wmax) and maintained significantly greater root growth (higher TRL and RPA) under N limitation (Figure 3 and Figure 7). In addition, the advantages of steep, elongated deep roots were N-dependent, with D_90 and D_Wmax being positively correlated (r = 0.442–0.615, p < 0.05) with GY and NAE exclusively under low-N stress (Figure 5). Recent studies demonstrate that localized fertilization enhances N uptake and increases yield by promoting deeper root growth [16,63]. Our results validated that long, deep, and steep roots enhance N acquisition under N limitation, while excessive root growth under sufficient-N conditions incurs metabolic costs without yield benefits [34]. Crucially, such root economic efficiency appears to be mediated by root anatomical traits that optimize soil exploration costs versus benefits [64].
Root anatomy underpins physiological functionality and economic trade-offs [61]. N-efficient (EE) and N-inefficient (NN) hybrids exhibited distinct adaptive traits under low-N conditions in this study. The EE-type hybrid WK702 had the largest increasing amount of AA under LN stress; this strategy may reduce root metabolic costs, allowing greater carbon allocation to root elongation and N uptake [23,24]. Previous studies suggested that hybrids with more developed xylem vessels exhibit greater root penetration and enhanced nutrient and water transport capacity [22,65]. However, in this study, a negative correlation between xylem traits and N efficiency was detected. This discrepancy may stem from earlier studies using inbred lines or older varieties with underdeveloped xylem, whereas modern cultivars with sufficient xylem development rely more on root economic strategies for canopy–root coordination [46,66]. Structural equation modeling (SEM) and correlation analysis revealed that both root anatomy and architecture influence yield components. However, anatomy primarily directly drives root architectural modifications, as indicated by the high path coefficients in SEM and strong correlations (Figure 6). These results suggest that root architectural traits may play a more prominent role in nitrogen efficiency, whereas root anatomical traits largely function by shaping root architecture under low-nitrogen stress [20,27].
Notably, although N-efficient hybrids generally exhibit steeper and deeper root systems, root phenotypic differences were also observed among genotypes with similar N efficiency. For instance, under LN conditions, the EE-type hybrid WK702 increased the total root length (TRL) by 18% compared with the HN conditions, and it displayed the lowest XVn and the largest AA (AA), while another EE-type hybrid LY99 showed no significant change in TRL and had the smallest AA. The increase in root length and aerenchyma formation under LN facilitated N uptake and yield under stress conditions [13,21,67]. Consequently, WK702 achieved a higher yield under LN conditions compared with LY99. These findings suggest that although modern breeding has selected for root traits such as steep angle and deep rooting in N-efficient varieties [14], anatomical traits such as AA and XVn have not been consistently selected in some cultivated N-efficient cultivars. Therefore, these traits represent potential targets for further improving NUE in maize breeding programs [15,24,68]. Hybrids such as WK702 coordinately optimize both root anatomy and architecture, synergistically enhancing N foraging while lowering respiratory expenditure [20,35]. This integrated optimization of root structure and function underscores the superior N efficiency of elite hybrids.

4.2. Deciphering Root Anatomy–Architecture Coregulation Mechanisms in N-Efficient Varieties

Studies indicate that deep-rooting architecture and root system adaptation in maize were progressively selected during domestication and the modern breeding process [14,35,69]. Hybrids and their parental lines showed similar root responses to low-N stress in this study. In 2024, EE-type parental lines exhibited the smallest ROA under SN conditions, and they showed the largest D_Wmax, RPA, and AA under LN conditions. The same results were also detected in EE-type hybrids in 2023. However, there were also genotypic differences within the same N-efficiency-type inbred lines; for example, under LN conditions, the AA of Ji853 (WK702’s parent) was 0.92 mm2, but that of LX9801 (another WK702 parent) was only 0.23 mm2. These results hint that maize hybrids exhibit superior root traits compared with either parent, demonstrating heterosis in root characteristics and optimal recombination of N-efficient root traits during breeding. These findings suggest that key genes regulating root responses to N limitation were preferentially selected during breeding, with simultaneous improvements in root anatomy and architecture. Currently, identifying these genes that coordinately regulate root anatomy and architecture remains a significant research challenge [70].
Comparative transcriptome analysis of maize varieties with contrasting N efficiency revealed key genetic determinants underlying root adaptation to low N (Figure 7). In the NN genotype ND108, two candidate genes were identified; the first is GRMZM2G403620, which has been implicated in the regulation of the brace root number and root angle [52], and it may contribute to the shallower root architecture in NN varieties. Previous studies suggest that an increased brace root number promotes a shallower root system with wider angles, thereby reducing deep rooting and impairing N acquisition and yield under stress [17]. Another gene, GRMZM2G017081, is known to mediate root responses to various abiotic stresses such as cold, though its role under low N remains unclear [53].
In contrast, the EE variety WK702 harbored six functional genes, including the following: GRMZM2G428027, encoding a transcription factor that positively regulates N uptake in maize roots [54,55]; GRMZM5G878558, which promotes root biomass accumulation under N-limited conditions [10,58]; and GRMZM2G118950, which is involved in the crosstalk between auxin biosynthesis and N metabolism pathways [56]. Additionally, the other candidate genes, GRMZM2G040511, GRMZM2G106928, and GRMZM2G054332, were identified as regulators of root development, root–microbe interactions, and nutrient acquisition [57,59,60]. Notably, these genes were not differentially expressed in all parental inbred lines of WK702 and ND108, but only in a subset of them (Figures S3 and S4). Therefore, further functional validation of these candidate genes is warranted in future studies. To preliminarily assess their potential roles, we performed an expression–phenotype correlation analysis across 60 inbred maize lines. For instance, the expression level of GRMZM5G878558 was significantly correlated with both architectural and anatomical traits (Figure 7J), suggesting its coordinated regulation of root architecture and anatomy.
Furthermore, in the cluster analysis of nitrogen-use efficiency and yield, we observed that the hybrids ZD958 and XY335, despite possessing distinct genetic backgrounds, were grouped closely together and classified within the same category (Figure 2C). Previous studies have indicated that although one of the parents of ZD958, Zheng58, has been demonstrated to be genetically influenced by Shen5003, U8112, and Dan340 (the three inbred lines used in this study), its pedigree remains incomplete and even ambiguous [71]. Comparative analyses of SNP data have revealed that Zheng58 is associated with multiple inbred lines, including even both parents of XY335 [38]. This may explain why XY335 and ZD958 were clustered together in terms of nitrogen-use efficiency in our study. These findings suggest that comparative experiments involving hybrids may yield unreliable results due to uncertainties in their genetic backgrounds. These findings offer mechanistic insights and candidate gene targets for enhancing N-use efficiency via root system optimization.

5. Conclusions

This study demonstrates that maize roots adapt to low-N stress through coordinated architectural and anatomical changes, with N-efficient varieties (e.g., WK702) exhibiting steeper, deeper root architecture and longer roots, along with a larger aerenchyma, smaller cross-sectional area, and fewer xylem vessels under LN conditions. These adaptive traits collectively enhance N foraging ability while reducing root metabolic costs. Correlation and SEM analyses revealed that anatomical adaptations shape root architecture to facilitate N uptake. Transcriptomic profiling identified key regulatory genes involved in root architecture, anatomical development, and NUE. N-efficient hybrids integrate these superior traits through genetic selection, achieving higher N efficiency while maintaining yield stability. This study provides a theoretical foundation for root system regulation and molecular targets for breeding maize with improved NUE.

Supplementary Materials

The following supporting information can be downloaded at: https://www.mdpi.com/article/10.3390/agronomy15092083/s1, Figure S1: Genotypic differences of yield and yield components under different N treatments; Figure S2: Random forest analysis between root architecture and anatomical traits; Figure S3: Variation in candidate genes expression among the nine parental accessions; Figure S4: Variation in candidate genes’ expression log2-fold change (log2FC) between HN and LN among the nine parental accessions; Table S1: Genetic background of the six hybrids and nine parental lines used in this study; Table S2: Abbreviations of measured root traits and methodologies; Table S3: Analysis of variation of the grain yield components traits; Table S4: Genotypic differences in root architecture traits between six hybrids under LN and SN treatments; Table S5: The LN-induced responsiveness of root traits in six maize hybrids; Table S6: Genotypic differences in root architecture characteristics of nine parental inbred lines traits under LN and SN treatments; Table S7: Genotypic differences in 12 root anatomy between six hybrids under LN and SN treatments; Table S8: Genotypic differences in root anatomy of nine parental maize inbred lines under LN and SN treatments; Table S9: The correlation between root traits and N-efficiency traits in this study under SN conditions; Table S10: The correlation between root traits and N-efficiency traits in this study under LN conditions; Table S11: The path values in PLS-SEM modeling; Table S12: Abbreviations of significant pathways (p < 0.05) shown in Figure 7I,J; Table S13: Annotations analyzed by GO enrichment for significant pathways related to root development and nutrient stress.

Author Contributions

Conceptualization, methodology, formal analysis, investigation, software, validation, and writing—original draft preparation, Z.C. and Y.H.; data curation and visualization, J.Y. and S.C.; writing—review and editing, Y.W. and G.F.; supervision, project administration, and funding acquisition, H.C. All authors have read and agreed to the published version of the manuscript.

Funding

This research was funded by the National Key Research and Development Program of China (2023YFD1501100), Jilin Provincial Natural Science Foundation (YDZJ202501ZYTS471) and National Key Research and Development Program of China (2024YFD1501000).

Data Availability Statement

Data are available upon request.

Acknowledgments

We are grateful for the maize parental inbred lines provided by Fanjun Chen and Wei Ren from China Agricultural University, China.

Conflicts of Interest

The authors declare no conflicts of interest.

References

  1. Govindasamy, P.; Muthusamy, S.K.; Bagavathiannan, M.; Mowrer, J.; Jagannadham, P.T.K.; Maity, A.; Halli, H.M.; GK, S.; Vadivel, R.; TK, D.; et al. Nitrogen use efficiency—A key to enhance crop productivity under a changing climate. Front. Plant Sci. 2023, 14, 1121073. [Google Scholar] [CrossRef] [PubMed]
  2. Donovan, T.C.; Comas, L.H.; Schneekloth, J.; Schipanski, M. Nitrogen and water availability affect soil nitrogen mineralization and maize nitrogen uptake dynamics. Nutr. Cycl. Agroecosys. 2025, 130, 387–405. [Google Scholar] [CrossRef]
  3. Wang, C.; Shen, Y.; Fang, X.T.; Xiao, S.Q.; Liu, G.Y.; Wang, L.G.; Gu, B.J.; Zhou, F.; Chen, D.L.; Tian, H.Q.; et al. Reducing soil nitrogen losses from fertilizer use in global maize and wheat production. Nat. Geosci. 2024, 17, 1008. [Google Scholar] [CrossRef]
  4. Feyisa, D.S.; Jiao, X.Q.; Mojo, D. Wheat yield response to chemical nitrogen fertilizer application in Africa and China: A meta-analysis. J. Soil Sci. Plant Nutr. 2024, 24, 102–114. [Google Scholar] [CrossRef]
  5. Moll, R.H.; Kamprath, E.J.; Jackson, W.A. Analysis and Interpretation of Factors Which Contribute to Efficiency of Nitrogen. Agron. J. 1982, 74, 562–564. [Google Scholar] [CrossRef]
  6. Sapkota, T.B.; Singh, B.; Takele, R. Improving nitrogen use efficiency and reducing nitrogen surplus through best fertilizer nitrogen management in cereal production: The case of India and China. Adv. Agron. 2023, 178, 233–294. [Google Scholar]
  7. Huang, Y.C.; Wang, H.H.; Zhu, Y.D.; Huang, X.; Li, S.; Wu, X.G.; Zhao, Y.; Bao, Z.G.; Qin, L.; Jin, Y.B.; et al. THP9 enhances seed protein content and nitrogen-use efficiency in maize. Nature 2022, 612, 292–300. [Google Scholar] [CrossRef]
  8. MacLaren, C.; Mead, A.; van Balen, D.; Claessens, L.; Etana, A.; de Hana, J.; Haagsma, W.; Jäck, O.; Keller, T.; Labuschangne, J.; et al. Long-term evidence for ecological intensification as a pathway to sustainable agriculture. Nat. Sustain. 2022, 5, 770–779. [Google Scholar] [CrossRef]
  9. George, T.S.; Bulgarelli, D.; Carminati, A.; Chen, Y.; Jones, D.; Kuzyakov, Y.; Schnepf, A.; Wissuwa, M.; Roose, T. Bottom-up perspective-The role of roots and rhizosphere in climate change adaptation and mitigation in agroecosystems. Plant Soil 2024, 500, 297–323. [Google Scholar] [CrossRef]
  10. Wang, R.F.; Zhong, Y.T.; Han, J.N.; Huang, L.L.; Wang, Y.Q.; Shi, X.G.; Li, M.F.; Zhuang, Y.; Ren, W.; Liu, X.T.; et al. NIN-LIKE PROTEIN3.2 inhibits repressor Aux/IAA14 expression and enhances root biomass in maize seedlings under low nitrogen. Plant Cell 2024, 36, 4388–4403. [Google Scholar] [CrossRef] [PubMed]
  11. Shahzad, Z.; Amtmann, A. Food for thought: How nutrients regulate root system architecture. Curr. Opin. Plant Bio. 2017, 39, 80–87. [Google Scholar] [CrossRef]
  12. Liu, X.J.; Huang, K.; Chu, C.C. The genetic basis of nitrogen-dependent root system architecture in plants. Front. Agr. Sci. Eng. 2025, 12, 3–15. [Google Scholar]
  13. Morris, E.C.; Griffiths, M.; Golebiowska, A.; Mairhofer, S.; Burr-Hersy, J.; Goh, T.; von Wangenheim, D.; Atkinson, B.; Sturrock, C.J.; Lynch, J.P.; et al. Shaping 3D root system architecture. Curr. Biol. 2017, 27, 919–930. [Google Scholar] [CrossRef]
  14. Ren, W.; Zhao, L.F.; Liang, J.X.; Wang, L.F.; Chen, L.M.; Li, P.C.; Liu, Z.G.; Li, X.J.; Zhang, Z.H.; Li, J.P.; et al. Genome-wide dissection of changes in maize root system architecture during modern breeding. Nat. Plants 2022, 8, 1408–1422. [Google Scholar] [CrossRef]
  15. Lynch, J.P. Root phenotypes for improved nutrient capture: An underexploited opportunity for global agriculture. New Phytol. 2019, 223, 548–564. [Google Scholar] [CrossRef]
  16. Chen, Z.; Ren, W.; Yi, X.; Li, Q.; Cai, H.G.; Ali, F.; Yuan, L.X.; Mi, G.H.; Pan, Q.C.; Chen, F.J. Local nitrogen application increases maize post-silking nitrogen uptake of responsive genotypes via enhanced deep root growth. J. Integr. Agr. 2023, 22, 235–250. [Google Scholar] [CrossRef]
  17. Saengwilai, P.; Tian, X.L.; Lynch, J.P. Low crown root number enhances nitrogen acquisition from low-nitrogen soils in maize. Plant Physiol. 2024, 166, 581–589. [Google Scholar] [CrossRef] [PubMed]
  18. Lu, J.; Lankhost, J.A.; Stomph, T.J.; Schneider, H.M.; Chen, Y.; Mi, G.H.; Yuan, L.; Evers, J.B. Root plasticity improves maize nitrogen use when nitrogen is limiting: An analysis using 3D plant modelling. J. Exp. Bot. 2024, 75, 5989–6005. [Google Scholar] [CrossRef]
  19. Du, P.Z.; Lynch, J.P.; Sun, Z.; Sun, Z.L.; Li, F.M. Does root respiration and root anatomical traits affect crop yield under stress? A meta-analysis and experimental study. Plant Soil 2025, 509, 763–777. [Google Scholar] [CrossRef]
  20. Schneider, H.M.; Postma, J.A.; Wojciechowski, T.; Kuppe, C.; Lynch, J.P. Root cortical senescence improves growth under suboptimal availability of N, P, and K. Plant Physiol. 2017, 174, 2333–2347. [Google Scholar] [CrossRef] [PubMed]
  21. Jia, X.; Wu, G.; Strock, C.; Li, L.; Dong, S.; Zhang, J.; Zhao, B.; Lynch, J.P.; Liu, P. Root anatomical phenotypes related to growth under low nitrogen availability in maize (Zea mays L.) hybrids. Plant Soil 2022, 474, 265–276. [Google Scholar] [CrossRef]
  22. Lynch, J.P.; Strock, C.F.; Schneider, H.M.; Sidhu, J.S.; Ajmera, I.; Galindo-Castañedaet, T.; Klein, S.P.; Hanlon, M.T. Root anatomy and soil resource capture. Plant Soil 2021, 466, 21–63. [Google Scholar] [CrossRef]
  23. Postma, J.A.; Lynch, J.P. Root cortical aerenchyma enhances the growth of maize on soils with suboptimal availability of nitrogen, phosphorus, and potassium. Plant Physiol. 2011, 156, 1190–1201. [Google Scholar] [CrossRef]
  24. Saengwilai, P.; Nord, E.A.; Chimungu, J.G.; Brown, K.M.; Lynch, J.P. Root cortical aerenchyma enhances nitrogen acquisition from low-nitrogen soils in maize. Plant Physiol. 2014, 166, 726–735. [Google Scholar] [CrossRef]
  25. Gao, K.; Chen, F.J.; Yuan, L.X.; Zhang, F.S.; Mi, G.H. A comprehensive analysis of root morphological changes and nitrogen allocation in maize in response to low nitrogen stress. Plant Cell Environ. 2015, 38, 740–750. [Google Scholar] [CrossRef] [PubMed]
  26. Kumi, F.; Obour, P.B.; Arthur, E.; Moore, S.E.; Asare, P.A.; Asiedu, J.; Angnuureng, D.B.; Atiah, K.; Amoah, K.K.; Amponsah, S.K.; et al. Quantifying root-induced soil strength, measured as soil penetration resistance, from different crop plants and soil types. Soil Tillage Res. 2023, 233, 105811. [Google Scholar] [CrossRef]
  27. Yang, J.T.; Schneider, H.M.; Brown, K.M.; Lynch, J.P. Genotypic variation and nitrogen stress effects on root anatomy in maize are node specific. J. Exp. Bot. 2019, 70, 5311–5325. [Google Scholar] [CrossRef] [PubMed]
  28. Tian, T.; Lynch, J.P.; Brown, K.M. Responses of root architectural and anatomical traits to low nitrogen stress in rice. bioRxiv 2024. [Google Scholar] [CrossRef]
  29. Galindo-Castañeda, T.; Lynch, J.P.; Six, J.; Hartmann, M. Improving soil resource uptake by plants through capitalizing on synergies between root architecture and anatomy and root-associated microorganisms. Front. Plant Sci. 2022, 13, 827369. [Google Scholar] [CrossRef]
  30. Yang, Y.; Bao, W.K.; Hu, H.; Wu, N.; Li, F.L.; Wang, Z.L.; Hu, B.; Yang, T.H.; Li, X.J. Environmental factors drive latitudinal patterns of fine-root architectures of 96 xerophytic species in the dry valleys of Southwest China. Sci. Total Environ. 2024, 950, 175352. [Google Scholar] [CrossRef]
  31. Fujii, K. Plant strategy of root system architecture and exudates for acquiring soil nutrients. Ecol. Res. 2024, 39, 623–633. [Google Scholar] [CrossRef]
  32. Heymans, A.; Couvreur, V.; LaRue, T.; Paez-Garcia, A.; Lobet, G. GRANAR, a computational tool to better understand the functional importance of monocotyledon root anatomy. Plant Physiol. 2020, 182, 707–720. [Google Scholar] [CrossRef]
  33. Galindo-Castañeda, T.; Brown, K.M.; Kuldau, G.A.; Roth, G.W.; Wenner, N.G.; Ray, S.; Schneider, H.; Lynch, J.P. Root cortical anatomy is associated with differential pathogenic and symbiotic fungal colonization in maize. Plant Cell Environ. 2019, 42, 2999–3014. [Google Scholar] [CrossRef]
  34. Lynch, J.P.; Galindo-Castañeda, T.; Schneider, H.M.; Sidhu, J.S.; Rangarajan, H.; York, L.M. Root phenotypes for improved nitrogen capture. Plant Soil 2024, 502, 31–85. [Google Scholar] [CrossRef]
  35. York, L.M.; Galindo-Castaneda, T.; Schussler, J.R.; Lynch, J.P. Evolution of US maize (Zea mays L.) root architectural and anatomical phenes over the past 100 years corresponds to increased tolerance of nitrogen stress. J. Exp. Bot. 2015, 66, 2347–2358. [Google Scholar] [CrossRef]
  36. Zhang, P.; Wang, Y.Y.; Sheng, D.C.; Zhang, S.; Guo, S.C.; Yan, Y.; Zhao, F.C.; Wang, P.; Huang, S.B. Optimizing root system architecture to improve root anchorage strength and nitrogen absorption capacity under high plant density in maize. Field Crops Res. 2023, 303, 109109. [Google Scholar] [CrossRef]
  37. Lopez-Valdivia, I.; Yang, X.; Lynch, J.P. Large root cortical cells and reduced cortical cell files improve growth under suboptimal nitrogen regimes in silico. Plant Physiol. 2023, 192, 2261–2275. [Google Scholar] [CrossRef] [PubMed]
  38. Zhang, R.Y.; Xu, G.; Li, J.S.; Yan, J.B.; Li, H.H.; Yang, X.H. Patterns of genomic variation in Chinese maize inbred lines and implications for genetic improvement. Theor. Appl. Genet. 2018, 131, 1207–1221. [Google Scholar] [CrossRef] [PubMed]
  39. Jiao, Y.P.; Zhao, H.N.; Ren, L.H.; Song, W.B.; Zeng, B.; Guo, J.J.; Wang, B.B.; Liu, Z.P.; Chen, J.; Li, W.; et al. Genome-wide genetic changes during modern breeding of maize. Nat. Genet. 2012, 44, 812–815. [Google Scholar] [CrossRef]
  40. D’Andrea, K.; Otegui, M.E.; Cirilo, A.G. Kernel number determination differs among maize hybrids in response to nitrogen. Field Crop. Res. 2008, 105, 228–239. [Google Scholar] [CrossRef]
  41. Shao, H.; Shi, D.F.; Shi, W.J.; Ban, X.B.; Chen, Y.C.; Ren, W.; Chen, F.J.; Mi, G.H. Genotypic difference in the plasticity of root system architecture of field-grown maize in response to plant density. Plant Soil 2019, 439, 201–217. [Google Scholar] [CrossRef]
  42. Trachsel, S.; Kaeppler, S.M.; Brown, K.M.; Lynch, J.P. Shovelomics: High throughput phenotyping of maize (Zea mays L.) root architecture in the field. Plant Soil. 2011, 341, 75–87. [Google Scholar] [CrossRef]
  43. Chen, Z.; Sun, J.L.; Li, D.D.; Li, P.C.; He, K.H.; Ali, F.; Mi, G.H.; Chen, F.J.; Yuan, L.X.; Pan, Q.C. Plasticity of root anatomy during domestication of a maize-teosinte derived population. J. Exp. Bot. 2022, 73, 139–153. [Google Scholar] [CrossRef]
  44. Burton, A.L.; Williams, M.; Lynch, J.P.; Brown, K.M. RootScan: Software for high-throughput analysis of root anatomical traits. Plant Soil. 2012, 357, 189–203. [Google Scholar] [CrossRef]
  45. Liu, Z.G.; Zhao, Y.; Guo, S.; Cheng, S.; Guan, Y.J.; Cai, H.G.; Mi, G.H.; Yuan, L.X.; Chen, F.J. Enhanced crown root number and length confers potential for yield improvement and fertilizer reduction in nitrogen-efficient maize cultivars. Field Crop. Res. 2019, 241, 107562. [Google Scholar] [CrossRef]
  46. Chen, X.C.; Chen, F.J.; Chen, Y.; Gao, Q.; Yang, X.L.; Yuan, L.X.; Zhang, F.S.; Mi, G.H. Modern maize hybrids in Northeast China tolerate exhibit increased yield potential and resource use efficiency despite the adverse climate change. Global Change Biol. 2013, 19, 923–936. [Google Scholar] [CrossRef] [PubMed]
  47. Jevtic, S.; Drapek, C.; Gaillochet, C.; Brockman, A.; Cadman, J.; Flesh, T.; Kral, N. A scalable method for modulating plant gene expression using a multispecies genomic model and protoplast-based massively parallel reporter assay. bioRxiv 2024. [Google Scholar] [CrossRef]
  48. Wickham, H. ggplot2: Elegant Graphics for Data Analysis; Springer: Berlin/Heidelberg, Germany, 2016. [Google Scholar]
  49. Jiao, S.; Chen, W.; Wang, J.; Du, N.; Li, Q.; Wei, G. Soil microbiomes with distinct assemblies through vertical soil profiles drive the cycling of multiple nutrients in reforested ecosystems. Microbiome 2018, 6, 146. [Google Scholar] [CrossRef] [PubMed]
  50. Breiman, L. Random Forests. Mach. Learn. 2001, 45, 5–32. [Google Scholar] [CrossRef]
  51. Hair, J.F.; Hult, G.T.M.; Ringle, C.M.; Sarstedt, M. A Primer on Partial Least Squares Structural Equation Modeling (PLS-SEM), 2nd ed.; Sage: Thousand Oaks, CA, USA, 2017. [Google Scholar]
  52. Li, P.C.; Zhang, Z.H.; Xiao, G.; Zhao, Z.; He, K.H.; Yang, X.H.; Pan, Q.C.; Mi, G.H.; Jia, Z.T.; Yan, J.B.; et al. Genomic basis determining root system architecture in maize. Theor. Appl. Genet. 2024, 137, 102. [Google Scholar] [CrossRef]
  53. Friero, I.; Larriba, E.; Melgarejo, P.A.M.; Clemente, M.S.J.; Alarcon, M.V.; Albacete, A.; Salguero, J.; Pérez, J.M. Transcriptomic and hormonal analysis of the roots of maize seedlings grown hydroponically at low temperature. Plant Sci. 2022, 326, 111525. [Google Scholar] [CrossRef] [PubMed]
  54. Cao, H.R.; Liu, Z.; Guo, J.; Jia, Z.T.; Shi, Y.D.; Kang, K.; Peng, W.S.; Wang, Z.K.; Chen, L.M.; Neuhäuser, B.; et al. ZmNRT1.1B (ZmNPF6.6) determines nitrogen use efficiency via regulation of nitrate transport and signaling in maize. Plant Biotechnol. J. 2024, 22, 316–329. [Google Scholar] [CrossRef] [PubMed]
  55. Wu, Q.; Xu, J.Y.; Zhao, Y.D.; Wang, Y.C.; Ling, Z.; Ning, L.H.; Shabala, S.; Zhao, H. Transcription factor ZmEREB97 regulates nitrate uptake in maize (Zea mays) root. Plant Physiol. 2024, 196, 535–550. [Google Scholar] [CrossRef]
  56. Pal, G.; Saxena, S.; Kumar, K.; Verma, A.; Kumar, D.; Shukla, P.; Pandey, A.; White, J.; Verma, S.K. Seed endophytic bacterium Lysinibacillus sp. (ZM1) from maize (Zea mays L.) shapes its root architecture through modulation of auxin biosynthesis and nitrogen metabolism. Plant Physiol. Bioch. 2024, 212, 108731. [Google Scholar] [CrossRef]
  57. Martín-Roldán, M.; Würsig, H.; Tarkka, M.T.; Hartwig, R.P.; Wimmer, M.A.; Blagodatskaya, E. Maize roots modulate microbial functional traits in the rhizosphere to mitigate drought stress. Soil Biol. Biochem. 2025, 207, 109837. [Google Scholar] [CrossRef]
  58. Ma, N.N.; Dong, L.N.; Lv, W.; Lv, J.L.; Meng, Q.W.; Liu, P. Transcriptome analysis of maize seedling roots in response to nitrogen-, phosphorus-, and potassium deficiency. Plant Soil. 2020, 447, 637–658. [Google Scholar] [CrossRef]
  59. Zhou, Y.F.; Li, Y.Y.; Pan, L.Y.; Lambers, H.; Wang, X.R. Intercropping promotes maize growth by enhancing accumulation of specific metabolites in the rhizosphere and synergistic interaction between arbuscular mycorrhizal fungi and Bacillus. Plant Soil. 2025; published online. [Google Scholar] [CrossRef]
  60. Adhikari, A.; Roy, D.; Adhikari, S.; Saha, S.; Ghosh, P.K.; Shaw, A.K.; Hossain, Z. microRNAomic profiling of maize root reveals multifaceted mechanisms to cope with Cr (VI) stress. Plant Physiol. Biochem. 2023, 198, 107693. [Google Scholar] [CrossRef]
  61. Yu, P.; White, P.J.; Hochholdinger, F.; Li, C.J. Phenotypic plasticity of the maize root system in response to heterogeneous nitrogen availability. Planta 2014, 240, 667–678. [Google Scholar] [CrossRef]
  62. Ding, Y.; Huang, X.; Li, Y.; Liu, H.Y.; Zhang, Q.C.; Liu, X.M.; Xu, J.M.; Di, H.J. Nitrate leaching losses mitigated with intercropping of deep-rooted and shallow-rooted plants. J. Soil Sediments. 2021, 21, 364–375. [Google Scholar] [CrossRef]
  63. Hu, R.; Ding, Z.J.; Tian, Y.B.; Cao, Y.X.; Hou, J.; Wang, X.X. Localized nitrogen supply facilitates rice yield and nitrogen use efficiency by enabling root-zone nitrogen distribution and root growth. Front. Sustain. Food Syst. 2024, 8, 1326311. [Google Scholar] [CrossRef]
  64. Kong, D.L.; Wang, J.J.; Wu, H.F.; Valcerde-Barrantes, O.J.; Wang, R.L.; Zeng, H.; Kardol, P.; Zhang, H.Y.; Feng, Y.L. Nonlinearity of root trait relationships and the root economics spectrum. Nat. Commun. 2019, 10, 2203. [Google Scholar] [CrossRef]
  65. Voxeur, A.; Wang, Y.; Sibout, R. Lignification: Different mechanisms for a versatile polymer. Curr. Opin. Plant Biol. 2015, 23, 83–90. [Google Scholar] [CrossRef]
  66. Ertiro, B.T.; Das, B.; Kosgei, T.; Tesfaye, A.T.; Labuschagne, M.T.; Worku, M.; Olsen, M.S.; Chaikam, V.; Gowda, M. Relationship between grain yield and quality traits under optimum and low-nitrogen stress environments in tropical maize. Agronomy 2022, 12, 438. [Google Scholar] [CrossRef]
  67. Fry, E.L.; Evans, A.L.; Sturrock, C.J.; Bullock, J.M.; Bardgett, R.D. Root architecture governs plasticity in response to drought. Plant Soil. 2018, 433, 189–200. [Google Scholar] [CrossRef]
  68. Silva, J.R.; Yule, T.; Ribas, A.C.A.; Scremin-Dias, E. Do root secondary xylem functional traits differ between growth forms in Fabaceae species in a seasonally dry Neotropical environment? Ann. Bot. 2023, 132, 401–412. [Google Scholar] [CrossRef]
  69. Yu, P.; Li, C.H.; Li, M.; He, X.M.; Wang, D.N.; Li, H.J.; Marcon, C.; Li, Y.; Perez-Limón, S.; Chen, X.P.; et al. Seedling root system adaptation to water availability during maize domestication and global expansion. Nat. Genet. 2024, 56, 1245–1256. [Google Scholar] [CrossRef]
  70. Hochholdinger, F.; Marcon, C.; Baldauf, J.; Yu, P.; Frey, F.P. Proteomics of maize root development. Front. Plant Sci. 2018, 9, 143. [Google Scholar] [CrossRef]
  71. Smith, S.J.; Trevisan, W.; McCunn, A.; Huffman, W.E. Global dependence on corn belt dent maize germplasm: Challenges and opportunities. Crop Sci. 2022, 62, 2039–2066. [Google Scholar] [CrossRef]
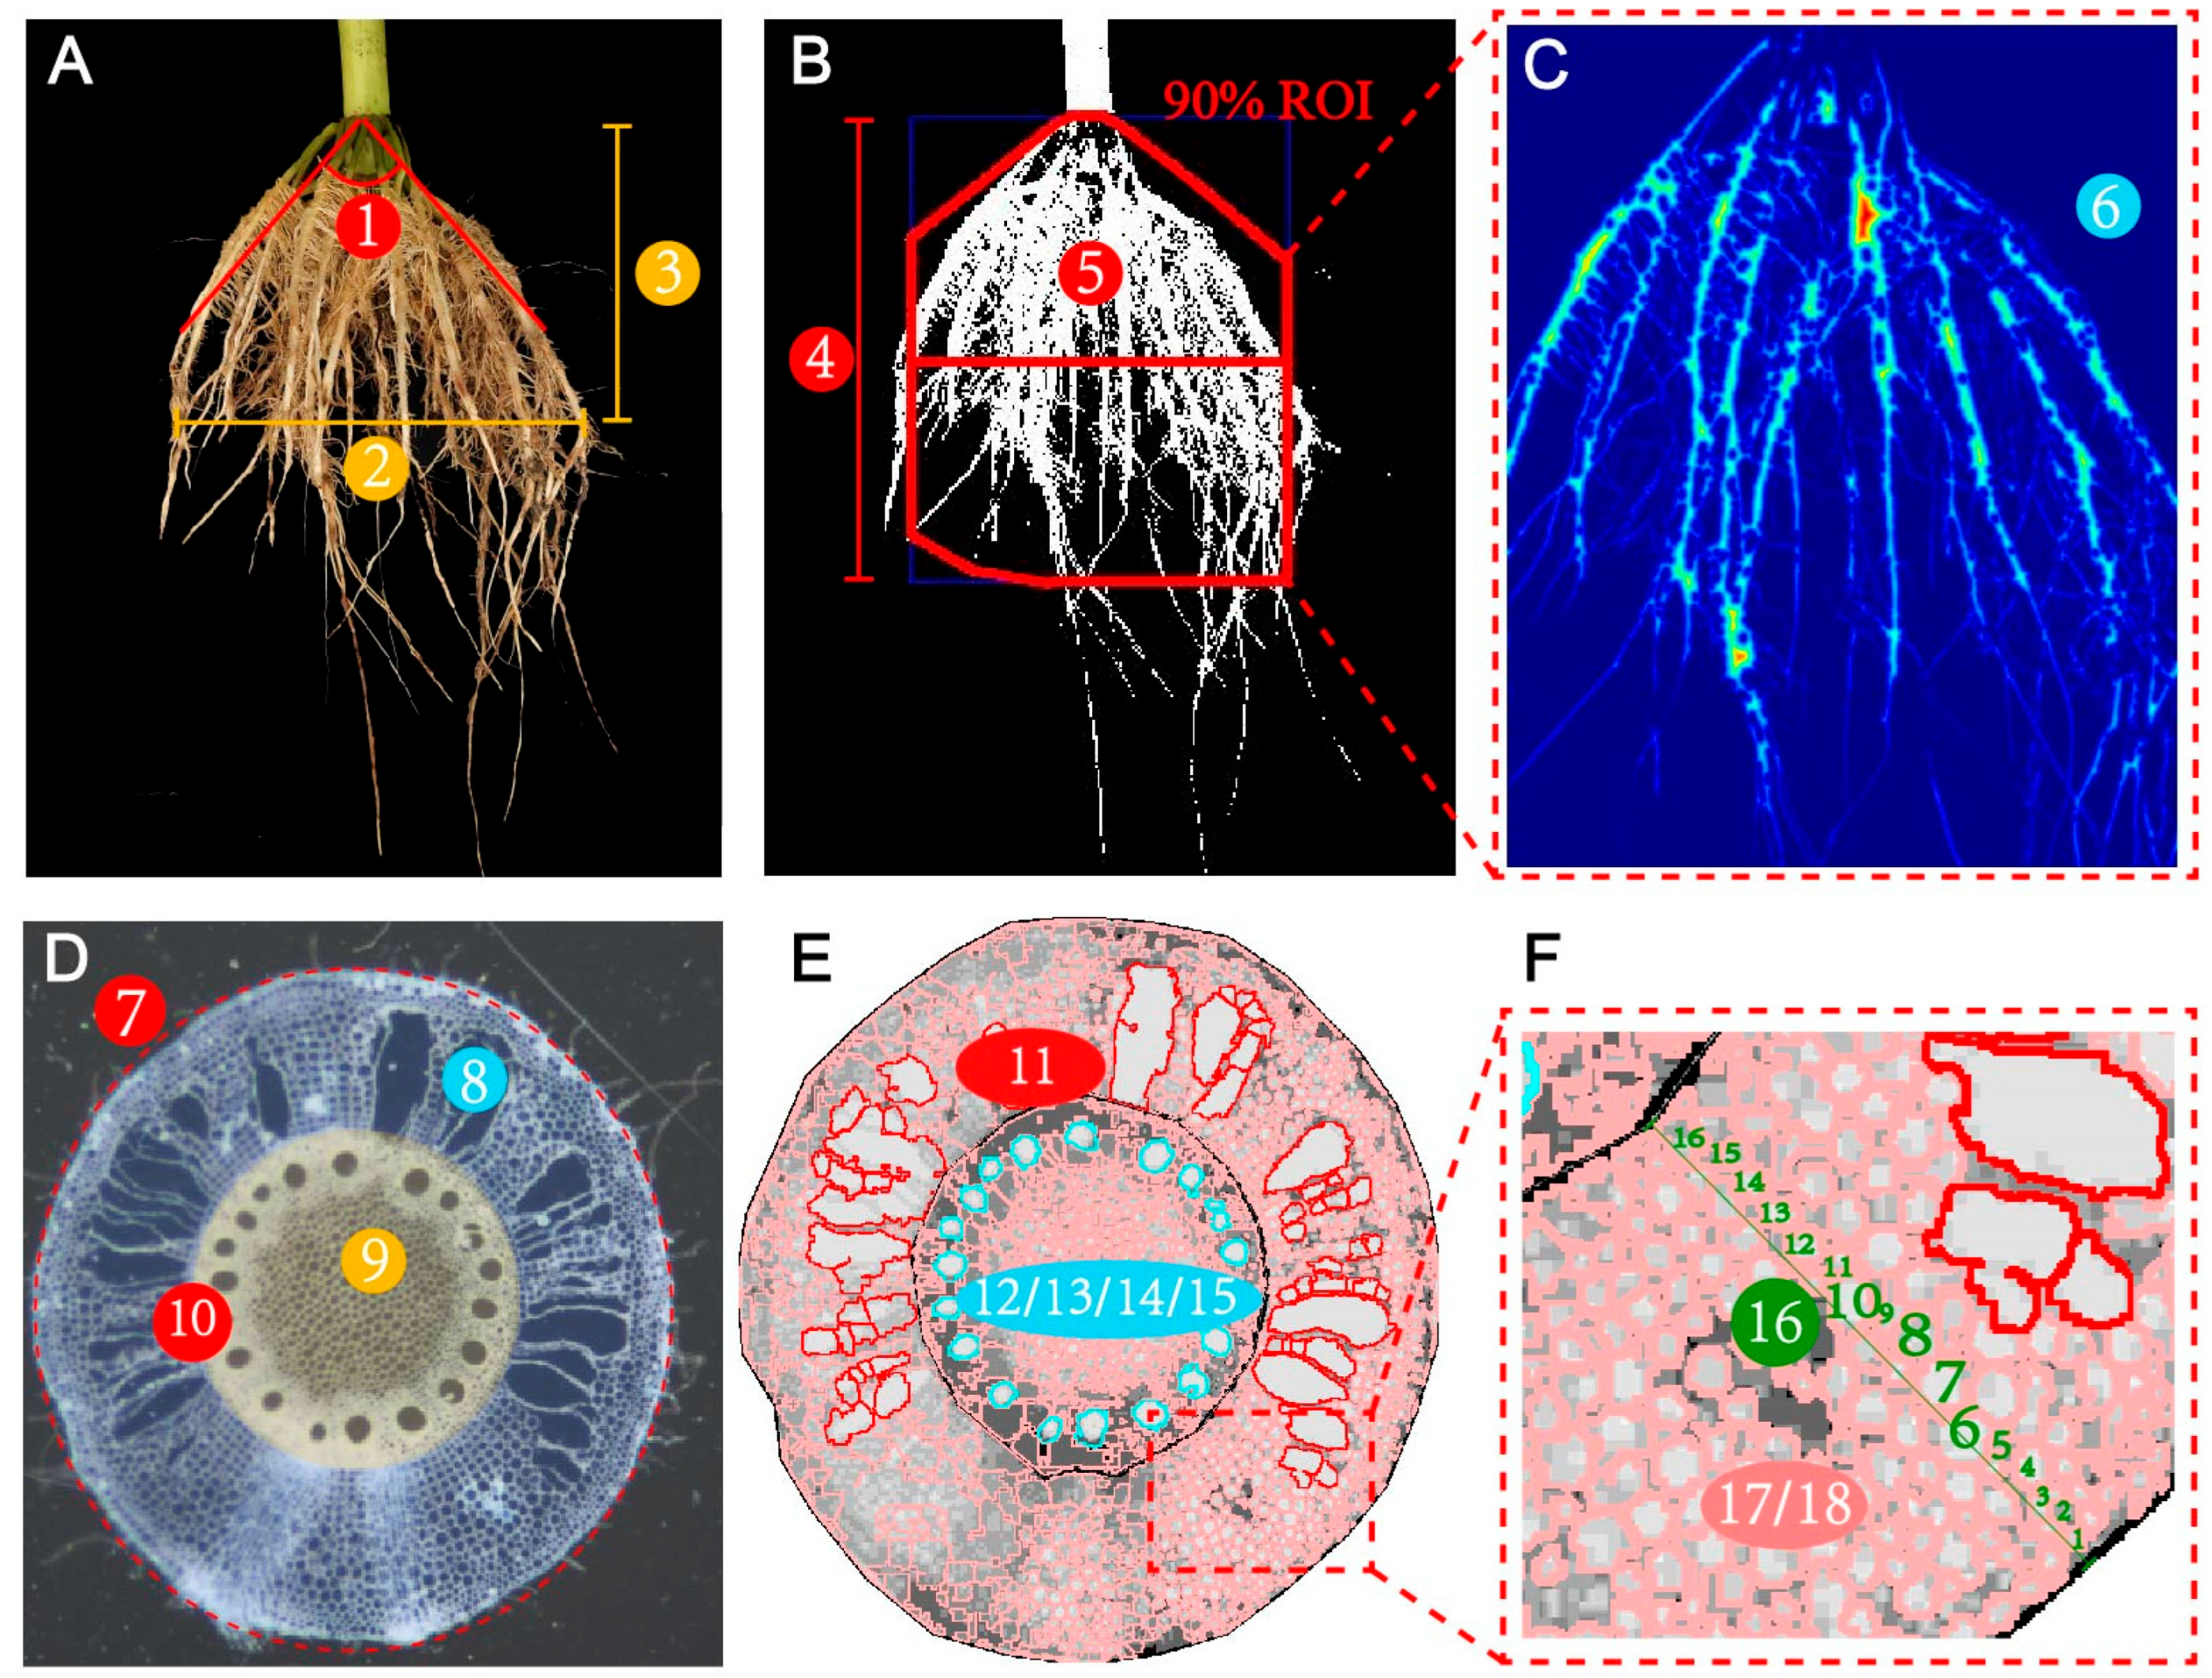
Figure 1. The root traits examined in this study. Figure (AC) depict the root system architecture as captured during the analytical process. The numbers 1–6 in subfigures (AC) represent root architecture traits: 1, root opening angle (ROA); 2, the maximum width of 90% ROI (Wmax); “90% ROI” means 90% root system after correction for outstanding roots, which are in the area enclosed by the red polygon; 3, depth, at which “Wmax” is located (D_Wmax); 4, depth of 90% ROI (D_0.9); 5, root projected area (RPA); 6, total projected structure length of 90% ROI (TRL); Figure (DF) present representative root anatomy images obtained during the analytical process. The numbers 7–18 in subfigures (DF) represent root anatomical traits: 7, root cross-section area (RXSA); 8, total cortex area (TCA); 9, total stele area (TSA); 10, the ratio of TCA to TSA (CtoS); 11, cortical aerenchyma area (AA); 12, xylem vessels area (XVA); 13, the ratio of XVA to TSA (XVAp); 14, xylem vessels number (XVn); 15, xylem vessels mean size (XVm); 16, cortical cell file number (CFn); 17, cortical cell mean size (CCm); 18, cortical cell number (CCn).
Agronomy 15 02083 g001
Figure 2. Grain yield and N efficiency of six hybrids under different N treatments. (A) The grain yield in the SN (180 kg ha−1) and LN (30 kg ha−1) treatments on average for all the hybrids. Bars denote the SE of the mean (n = 3). Different lowercase letters represent significant differences among LN and SN (p < 0.05). Grain yield was standardized to 14% moisture. (B) The grain yield of 6 hybrids under LN (horizontal axis) and SN (vertical axis). Compared with ZD958, they can be divided into four types: EE, N-efficient under both sufficient-N and low-N treatments; SNE, N-efficient only under sufficient-N treatment; and NN, inefficient under both sufficient-N and low-N treatments. (C) Cluster analysis of six hybrids based on grain yield under SN and LN treatments. (D) The N agronomy efficiency of six hybrids. (E) The potential fertilizer reduction of six hybrids.
Agronomy 15 02083 g002
Figure 3. Genotypic differences in root architecture traits under different N treatments. (A) Root opening angle (ROA); (B) the maximum width of 90% ROI (Wmax); “90% ROI” means 90% root system after correction for outstanding roots, which are in the area enclosed by the red polygon; (C) depth, at which “Wmax” is located (D_Wmax); (D) depth of 90% ROI (D_0.9); (E) root projected area (RPA); (F) total projected structure length of 90% ROI (TRL). Bars denote the SE of the mean (n = 3). Different lowercase letters represent significant differences between six hybrids under the same N treatment (p < 0.05). Different capital letters represent significant differences between N treatments (p < 0.05).
Agronomy 15 02083 g003
Figure 4. Genotypic differences in root anatomical traits under different N treatments. (A) Root cross-section area (RXSA); (B) total cortex area (TCA); (C) total stele area (TSA); (D) the ratio of TCA to TSA (CtoS); (E) xylem vessels area (XVA); (F) the ratio of XVA to TSA (XVAp); (G) xylem vessels number (XVn); (H) xylem vessels mean size (XVm); (I) cortical aerenchyma area (AA); (J) cortical cell file number (CFn); (K) cortical cell mean size (CCm); (L) cortical cell number (CCn). Bars denote the SE of the mean (n = 3). Different lowercase letters represent significant differences between six hybrids under the same N treatment (p < 0.05). Different capital letters represent significant differences between N treatments (p < 0.05).
Agronomy 15 02083 g004
Figure 5. The correlation analysis and PCA analysis of N-efficiency traits and root traits under different N treatments. (A,B) The upper-right heatmap in (A,B) display Pearson’s correlations between root architectural and anatomical traits in SN and LN treatments, with red/green indicating positive/negative relationships (darker hues = stronger correlations). *, **, and *** denote statistical significance at p < 0.05, p < 0.01, and p < 0.001 levels, respectively. The lower-left network depicts correlations between root traits and grain yield (GY), nitrogen agronomic efficiency (NAE), and physiological nitrogen response (PNR), where line thickness and color intensity scale with correlation strength. (C,D) Principal component analysis (PCA) of root traits and N-efficiency traits, with blue, red, and green representing root anatomical traits, architectural traits, and nitrogen-efficiency traits, respectively.
Agronomy 15 02083 g005
Figure 6. Random forest (RF) and structural equation modeling (SEM) analysis of root and N-efficiency traits. (A) RF analysis of root traits to GY. * and ** denote statistical significance at p < 0.05, p < 0.01, and p < 0.001 levels; (B) SEM analysis of root traits and N-efficiency traits, the numbers on the lines denote the path coefficient; *, **, and *** denote statistical significance at p < 0.05, p < 0.01, and p < 0.001 levels. The grey paths indicate the absence of statistical significance (p ≥ 0.05), whereas the black paths denote statistically significant associations (p < 0.05).
Agronomy 15 02083 g006
Figure 7. Phenotypic and transcriptomic analysis of parental lines with contrasting N efficiency. Note: (A) Root architectural and anatomical comparisons of parental inbred lines from contrasting N-efficiency hybrids: EE-type (WK702), SNE-type (ZD958), and NN-type (ND108), the root system images in the figure are under LN conditions; (BF) phenotypic differences in root traits under SN and LN conditions for D_Wmax (B), TRL (C), AA (D), XVA (E), and TSA (F); different uppercase letters indicate significant differences between SN and LN treatments, while different lowercase letters indicate significant differences between genotypes under the same N treatment. (G) Workflow for candidate gene screening from transcriptome analysis. (H) The left Venn diagram of LN-DEG numbers unique to each genotype (non-overlapping) or shared (overlapping); the right shows candidate gene numbers related to root development, through GO enrichment and homologous gene annotations. (I,J) Red bars represent the significant pathways that identify candidate genes. (K) Correlation between candidate gene expression (from 60 maize inbred lines) and root traits (D_Wmax, AA). * and ** denote statistical significance correlation at p < 0.05 and p < 0.01 levels.
Agronomy 15 02083 g007
Table 1. Genotypic differences in yield components under SN and LN treatments.
HybridsSNLN
GY
(kg ha−1)
EN
(104 ha−1)
KNE
(ear−1)
HKW
(g)
GY
(kg ha−1)
EN
(104 ha−1)
KNE
(ear−1)
HKW
(g)
ZD95813,650.0 ± 445.0 ab5.7 ± 0.2 ab556.8 ± 22.7 b24.9 ± 1.5 a11,529.6 ± 444.5 ab5.7 ± 0.1 a522.0 ± 33.7 b25.5 ± 1.2 a
XY33513,772.6 ± 199.3 ab5.8 ± 0.1 a561.7 ± 28.1 b26.56 ± 0.4 a11,111.5 ± 455.7 ab5.6 ± 0.1 ab560.5 ± 24.0 b23.7 ± 0.5 a
XY148314,453.8 ± 592.1 a5.5 ± 0.1 b617.7 ± 54.0 a25.4 ± 1.4 a11,110.5 ± 427.3 ab5.5 ± 0.1 abc553.8 ± 43.3 b23.0 ± 1.2 a
ND10812,886.4 ± 439.2 b5.6 ± 0.1 ab528.4 ± 31.8 b27.05 ± 1.6 a10,893.5 ± 528.1 b5.4 ± 0.1 c547.4 ± 26.3 b23.5 ± 0.9 a
LY9914,380.5 ± 499.8 a5.6 ± 0.1 ab574.4 ± 19.9 b23.91 ± 0.9 a12,255.9 ± 340.6 ab5.6 ± 0.1 ab563.3 ± 28.2 b24.2 ± 0.9 a
WK70214,766.4 ± 423.0 a5.8 ± 0.1 a545.1 ± 46.9 b27.41 ± 0.5 a12,717.7 ± 791.6 a5.5 ± 0.1 bc611.8 ± 35.7 a26.1 ± 1 a
Note: Different lowercase letters after the data indicate differences between different varieties at the same nitrogen application level (p ≤ 0.05).
Table 2. Annotations of root development genes identified in this study.
Gene IDGene NamesSourceGO Enrichment PathwaysReference
GRMZM2G403620rs2—rough sheath2ND108cell cycle process (CCP)[52]
GRMZM2G017081cyc9—cyclin9ND108mitotic cell cycle process (MCCP), cell cycle process, mitotic cell cycle, regulation of cell cycle, regulation of protein modification process, cell division[53]
GRMZM2G428027nnr5—nitrate reductase5WK702cellular process (CP)[54,55]
GRMZM2G118950amt3—ammonium transporter3WK702nitrogen compound transport (NCT), cellular process[56]
GRMZM2G054332abcg1—ABC transporter G family member 1WK702cellular process, response to heat (RH)[57]
GRMZM5G878558nnr2—nitrate reductase2WK702oxoacid metabolic process (OMP), cellular process[10,58]
GRMZM2G040511pco091925WK702membrane lipid biosynthetic process, membrane lipid metabolic process (MLMP)[59]
GRMZM2G106928sod14—superoxide dismutase14WK702gene silencing by RNA, gene silencing, cellular response to chemical stress (CRCS)[60]
Note: source refers to genes identified from LN-responsive DEGs, especially in these genotypes.
Disclaimer/Publisher’s Note: The statements, opinions and data contained in all publications are solely those of the individual author(s) and contributor(s) and not of MDPI and/or the editor(s). MDPI and/or the editor(s) disclaim responsibility for any injury to people or property resulting from any ideas, methods, instructions or products referred to in the content.