Abstract
The black soil region of Northeast China is crucial for agricultural productivity. Ammonia-oxidizing archaea (AOA) are key indicators of soil nitrification in this region, yet it remains unclear whether this process is driven by the entire community or by specific clusters. Here, we investigated the AOA community across a long-term fertilization Brown Soil Experimental Station and 15 sites in the Typical Black Soil Zone. Using Illumina MiSeq sequencing of the AOA amoA gene and cluster-specific primers, 14 OTUs were selected as core clusters based on relative abundance >0.1% and strong correlations (r > 0.7) with soil properties or PNR, and were further grouped into five distinct clusters according to phylogenetic analysis. Compared to the overall AOA community, core clusters responded more precisely to fertilization, straw addition, and spatial variation, with contrasting environmental responses reflected in their relationships with soil nitrification dynamics. Clusters G1 and G2 had positive correlations with soil PNR, while Clusters G4 and G5 had negative correlations. Moreover, AOA core clusters demonstrated stronger correlations with soil properties, including pH, C/N ratio, and NH4+/NO3− ratio. These findings demonstrate that AOA core clusters are reliable microbial indicators of soil nitrification, and monitoring their abundance changes under nitrogen input can provide early insights into potential inhibition, informing predictive models and guiding more precise nitrogen management to support sustainable agricultural practices.
1. Introduction
Black soils in Northeast China, known for their high fertility and organic matter content, play a vital role in supporting agriculture, maintaining ecological balance, and contributing significantly to the livelihoods of millions and the global economy [1,2,3]. The black soil region of Northeast China is acknowledged as one of the three dominant black soil regions worldwide, encompassing various soil types, including black soil, chernozem, dark brown soil, brown soil, etc. [4]. This region accounts for nearly a quarter of China’s total grain production, with the typical black soil zone serving as the primary grain-producing area [5]. However, decades of intensive farming and long-term fertilization have led to a decrease in organic matter, soil acidification, and changes in the microbial community, thereby threatening sustainable agricultural production in Northeast China [6,7,8].
Nitrification is a vital biochemical process in agricultural ecosystems, responsible for converting ammonium into nitrate, a more accessible form of nitrogen for crops [9]. The nitrification process plays a crucial role in soil fertility maintenance and sustainable crop production, and its efficiency directly influences the availability of soil nitrogen, thereby affecting crop yields and soil health [10]. However, excessive nitrate accumulation can lead to leaching and denitrification, resulting in nitrogen loss and environmental pollution [11]. Therefore, accurately and rapidly assessing soil nitrification is essential for maintaining nitrogen availability and improving fertilizer efficiency in agricultural soils.
Microorganisms, especially ammonia-oxidizing archaea (AOA), ammonia-oxidizing bacteria (AOB), and complete ammonia oxidizers (Comammox) are the dominant drivers in soil nitrification process [12,13]. Our previous research has demonstrated that, in the black soil region of Northeast China, AOA are the dominant contributors to soil nitrification, significantly outperforming AOB and Comammox in terms of nitrification potential [7,11]. However, due to their taxonomic and functional diversity, distinct AOA clusters may exhibit specific ecological preferences [14]. For example, some clusters thrive in acidic soils, while others prefer neutral or alkaline conditions [15,16,17]; some are adapted to moderate or high temperatures, while others are more active under low temperatures [18,19,20]. In agricultural ecosystems, nitrogen inputs can inhibit certain AOA clusters affiliated with Nitrososphaera while promoting others associated with uncultured Crenarchaeota lineages [21]. Such changes in the AOA community, affected by long-term fertilization, consequently influence soil nitrification and the nitrogen cycle [22].
Notably, core clusters, defined as phylogenetically coherent groups that are relatively abundant, environmentally responsive, and functionally important across diverse conditions [23], have rarely been explored for their functional differences. These clusters may interact additively, enhancing nitrification, or antagonistically, suppressing other clusters. Focusing on core clusters can reveal functional differences that are often overlooked in investigations based on the entire amoA gene, providing a more precise understanding of soil nitrification dynamics.
To evaluate the role of core clusters in soil nitrification, we hypothesize that specific phylogenetic clusters within the AOA community would have distinct environmental responses and functional contributions, and that their abundance changes more accurately reflect soil nitrification dynamics than those of the overall AOA community. This study investigated the role of AOA core clusters in soil nitrification in the black soil region of Northeast China, aiming to enhance understanding of community dynamics to inform strategies for sustainable nitrogen management and support long-term soil fertility.
2. Materials and Methods
2.1. Site Description and Soil Collection
The study field was located at the Brown Soil Experimental Station of Shenyang Agricultural University (41°49′ N, 123°34′ E) in Shenyang, Liaoning Province, China. This region has a continental monsoon climate, with a mean annual temperature and rainfall of 7.9 °C and 705 mm, respectively. The soil type was classified as Alfisol [24], and maize was sown in early May and harvested in early October each year. The soil texture was determined as silt loam (16.7% sand, 58.4% silt, and 24.9% clay). A long-term fertilization experiment started in 1987, involving three fertilization treatments: no fertilizer, low-urea fertilizer, and high-urea fertilizer. For each fertilization treatment, two experimental treatment conditions (three replicates each) were assessed: (1) no straw returning, and (2) straw incorporated at 1% of the air-dried soil weight to ensure detectable microbial responses. It was air-dried and crushed to <1 cm without composting. Briefly, soil from each fertilization treatment was mixed thoroughly with or without maize straw residues and placed into nylon bags (50 μm mesh size, allowing soil solution and microorganisms to pass while excluding larger debris). The nylon bags were then buried back in the original plot at 0–20 cm depth on 24 June 2021, and retrieved 30 days later to capture the critical stages of straw decomposition and soil microbial activity [25]. Consequently, six treatments were selected for this study: N0 (no fertilizer applied), N135 (135 kg N ha−1 as urea), N270 (270 kg N ha−1 as urea), N0S (N0 with straw), N135S (N135 with straw), and N270S (N270 with straw). Soil samples were collected from five cores (5 cm in diameter) at each plot’s corners and center, mixed, placed in plastic bags, and shipped on ice. After sieving through 2 mm, the samples were stored at 4 °C or −80 °C for further analysis.
Additional sampling plots were located within the “Typical Black Soil Zone” (124°27′–127°01′ E, 43°22′–47°12′ N), as described in our previous study [26]. The region extends from Nenjiang in Heilongjiang Province to Lishu in Jilin Province and has a mid-temperate continental monsoon climate, with a mean annual temperature and rainfall of 0–6.7 °C and 450–650 mm, respectively. The predominant soil type is Mollisol [24], and the soils have been under continuous maize monocropping for at least 10 years. The soil texture ranged from loam to clay loam (18.33% to 36.11% clay). Maize is sown in May and harvested in October each year. Before sowing, the stubble was incorporated into the surface layer through rotary tillage, and compound fertilizers (150–225 kg hm−2 N, 75–90 kg hm−2 P2O5, and 90–105 kg hm−2 K2O) were applied to the soil surface. For this study, soil samples were collected from the 0–20 cm surface layer across 15 counties (Nenjing, Wudalianchi, Beian, Kedong, Baiquan, Suileng, Suihua, Hulan, Daoli, Shuangcheng, Yushu, Fuyu, Dehui, Gongzhuling, Lishu) in October 2016. At each county, three sampling sites located approximately 10 km apart were selected, and the soil from these sites was mixed to form a composite sample.
2.2. Soil Properties and Potential Nitrification Rate Determination
Soil properties and potential nitrification rate (PNR) were assessed as described by our previous study [4]. Soil pH was determined using a 1:2.5 soil-to-water ratio with a pH meter (Metrohm 702, Herisau, Switzerland).
The contents of soil organic carbon (SOC) and total nitrogen (TN) were measured using a Vario EL III elemental analyzer (Elementar, Langenselbold, Germany). Ammonium (NH4+) and nitrate (NO3−) concentrations were extracted with 2 M KCl and quantified using a continuous flow analyzer (Auto-Analyzer III-HR, Norderstedt, Germany). PNR was determined by incubating 5.0 g of fresh soil with phosphate buffer and (NH4)2SO4, and quantifying NO3− production after 14 days. Soil properties and PNR for both the Brown Soil Experimental Station and Typical Black Soil Zone are detailed in Table S1.
2.3. DNA Extraction and High-Throughput Sequencing
Soil DNA was extracted as described by the manufacturer’s protocols of the E.Z.N.A.® Soil DNA Kit (Omega Bio-tek, Norcross, GA, USA).
The archaeal amoA gene was amplified by a commonly used primer set listed in Table S2 with adapters and barcodes. PCR was performed in triplicate for each sample in a 50 μL reaction under the following conditions: 35 cycles of 95 °C for 30 s, 53 °C for 30 s and 72 °C for 60 s with a final extension at 72 °C for 10 min. The PCR products for each sample were pooled for the ammonia-oxidizing archaea, purified with an AxyPrep DNAGel Extraction Kit (Axygen Biosciences, Union City, CA, USA), quantified using a Quantus™ Fluorometer (Promega, Madison, WI, USA), and mixed in equimolar ratios before sequencing on an Illumina Miseq PE300 platform (Majorbio Bio-pharm Technology Co., Ltd., Shanghai, China). The raw data were processed and analyzed using QIIME 1.9.1. A total of 259,506 sequences were obtained. OTUs were clustered using the USEARCH7-uparse algorithm [27] with a 0.97 sequence similarity threshold.
2.4. Network Analyses
Two-way correlation network analysis was conducted based on Pearson correlation coefficient using the Network under Python (version 3.10) [28] to explore the relationships among AOA, soil properties, and nitrification. Data used for the analysis included relative abundance of OTUs, potential nitrification rate, and soil chemical properties, including pH, SOC, TN, C/N, NH4+, NO3−, and NH4+/NO3−. Network reliability was ensured by retaining only correlations with Pearson’s r > 0.70. Network images were generated using Gephi 0.10.1 (http://gephi.github.io/, accessed on 23 July 2023). The properties of the network are shown in Tables S3 and S4.
2.5. Design Specific Primers
Fourteen core AOA OTUs were selected based on two-way correlation network analysis, excluding those with a relative abundance of less than 0.1% (Table S2). These 14 OTUs were further classified into 5 distinct clusters (G1 to G5) through phylogenetic analysis, which was conducted using multiple sequence alignment in MEGA-X (version 10.2.6) [29]. The clusters were defined by examining the phylogenetic relationships among the OTUs, ensuring that those within each cluster exhibited high sequence similarity. Consensus regions were identified as target-specific sites for primer design. Five sets of specific primers were then designed using Primer Premier 5.0 [30], with a minimum primer length of 15 bp to enhance amplification specificity.
To verify the accuracy of these primers, the sequences obtained from PCR amplification were analyzed using National Center for Biotechnology Information (NCBI) Primers-BLAST and Clustal Omega [31] to assess the overlap among the target sequences, supporting the specificity of the primers for AOA clusters. Additionally, the PCR products were cloned using the pMDTM19-T Vector Cloning Kit (TAKARA, Dalian, China). Randomly selected clones were sequenced, and the results confirmed that the majority of sequences corresponded to the intended AOA cluster, providing experimental evidence for primer specificity.
2.6. Quantitative PCR (qPCR)
The absolute abundances of the AOA amoA gene and AOA core clusters were quantified via qPCR. The qPCR reactions were performed on an ABI Step One Plus Real-time PCR System (Applied Biosystems, Waltham, MA, USA) by the corresponding specific primer set listed in Table S2. Each 20 μL reaction contained 10 μL of SYBR® Premix Ex Taq (2x) (CWBIO, Taizhou, China), 2 μL of template DNA, 0.5 μL of each 10 μM primers, and molecular biology-grade water (Cwbio, Shenyang, China). The qPCR was run with an initial denaturation at 95 °C for 1 min, followed by 40 cycles of 15 s at 95 °C, 45 s at 53 °C and 30 s at 72 °C, and all samples were conducted in triplicate. Amplification efficiency exceeded 90%, with R2 values > 0.99. Specificity was confirmed through melting curve analysis, which was conducted after each amplification to ensure no non-specific amplification.
2.7. Data Analysis
A two-way analysis of variance (ANOVA) was performed with nitrogen fertilizer and straw application rate as the main factors, followed by an LSD test. All statistical analyses were performed using IBM SPSS Software (USA, version 20.0) with a significance level of p < 0.05. Simple linear regression was used to analyze the correlation between AOA core clusters and soil PNR.
Mantel test analysis assessed correlations between soil properties and the absolute abundances of the AOA amoA gene and AOA core clusters using the linkET package in R software (version 4.1.1) [32], and false discovery rate (FDR) corrections were applied to the resulting p-values. A random forest analysis was used to evaluate the relative importance of key variables influencing soil PNR using the randomForest package. The importance of variables was indicated by higher percentage increases in the mean squared error (MSE), and the significance of the model and variables was assessed using the A3 and rfPermute packages of R, respectively.
3. Results
3.1. Characteristics of Changes in AOA Communities at the Brown Soil Experimental Station
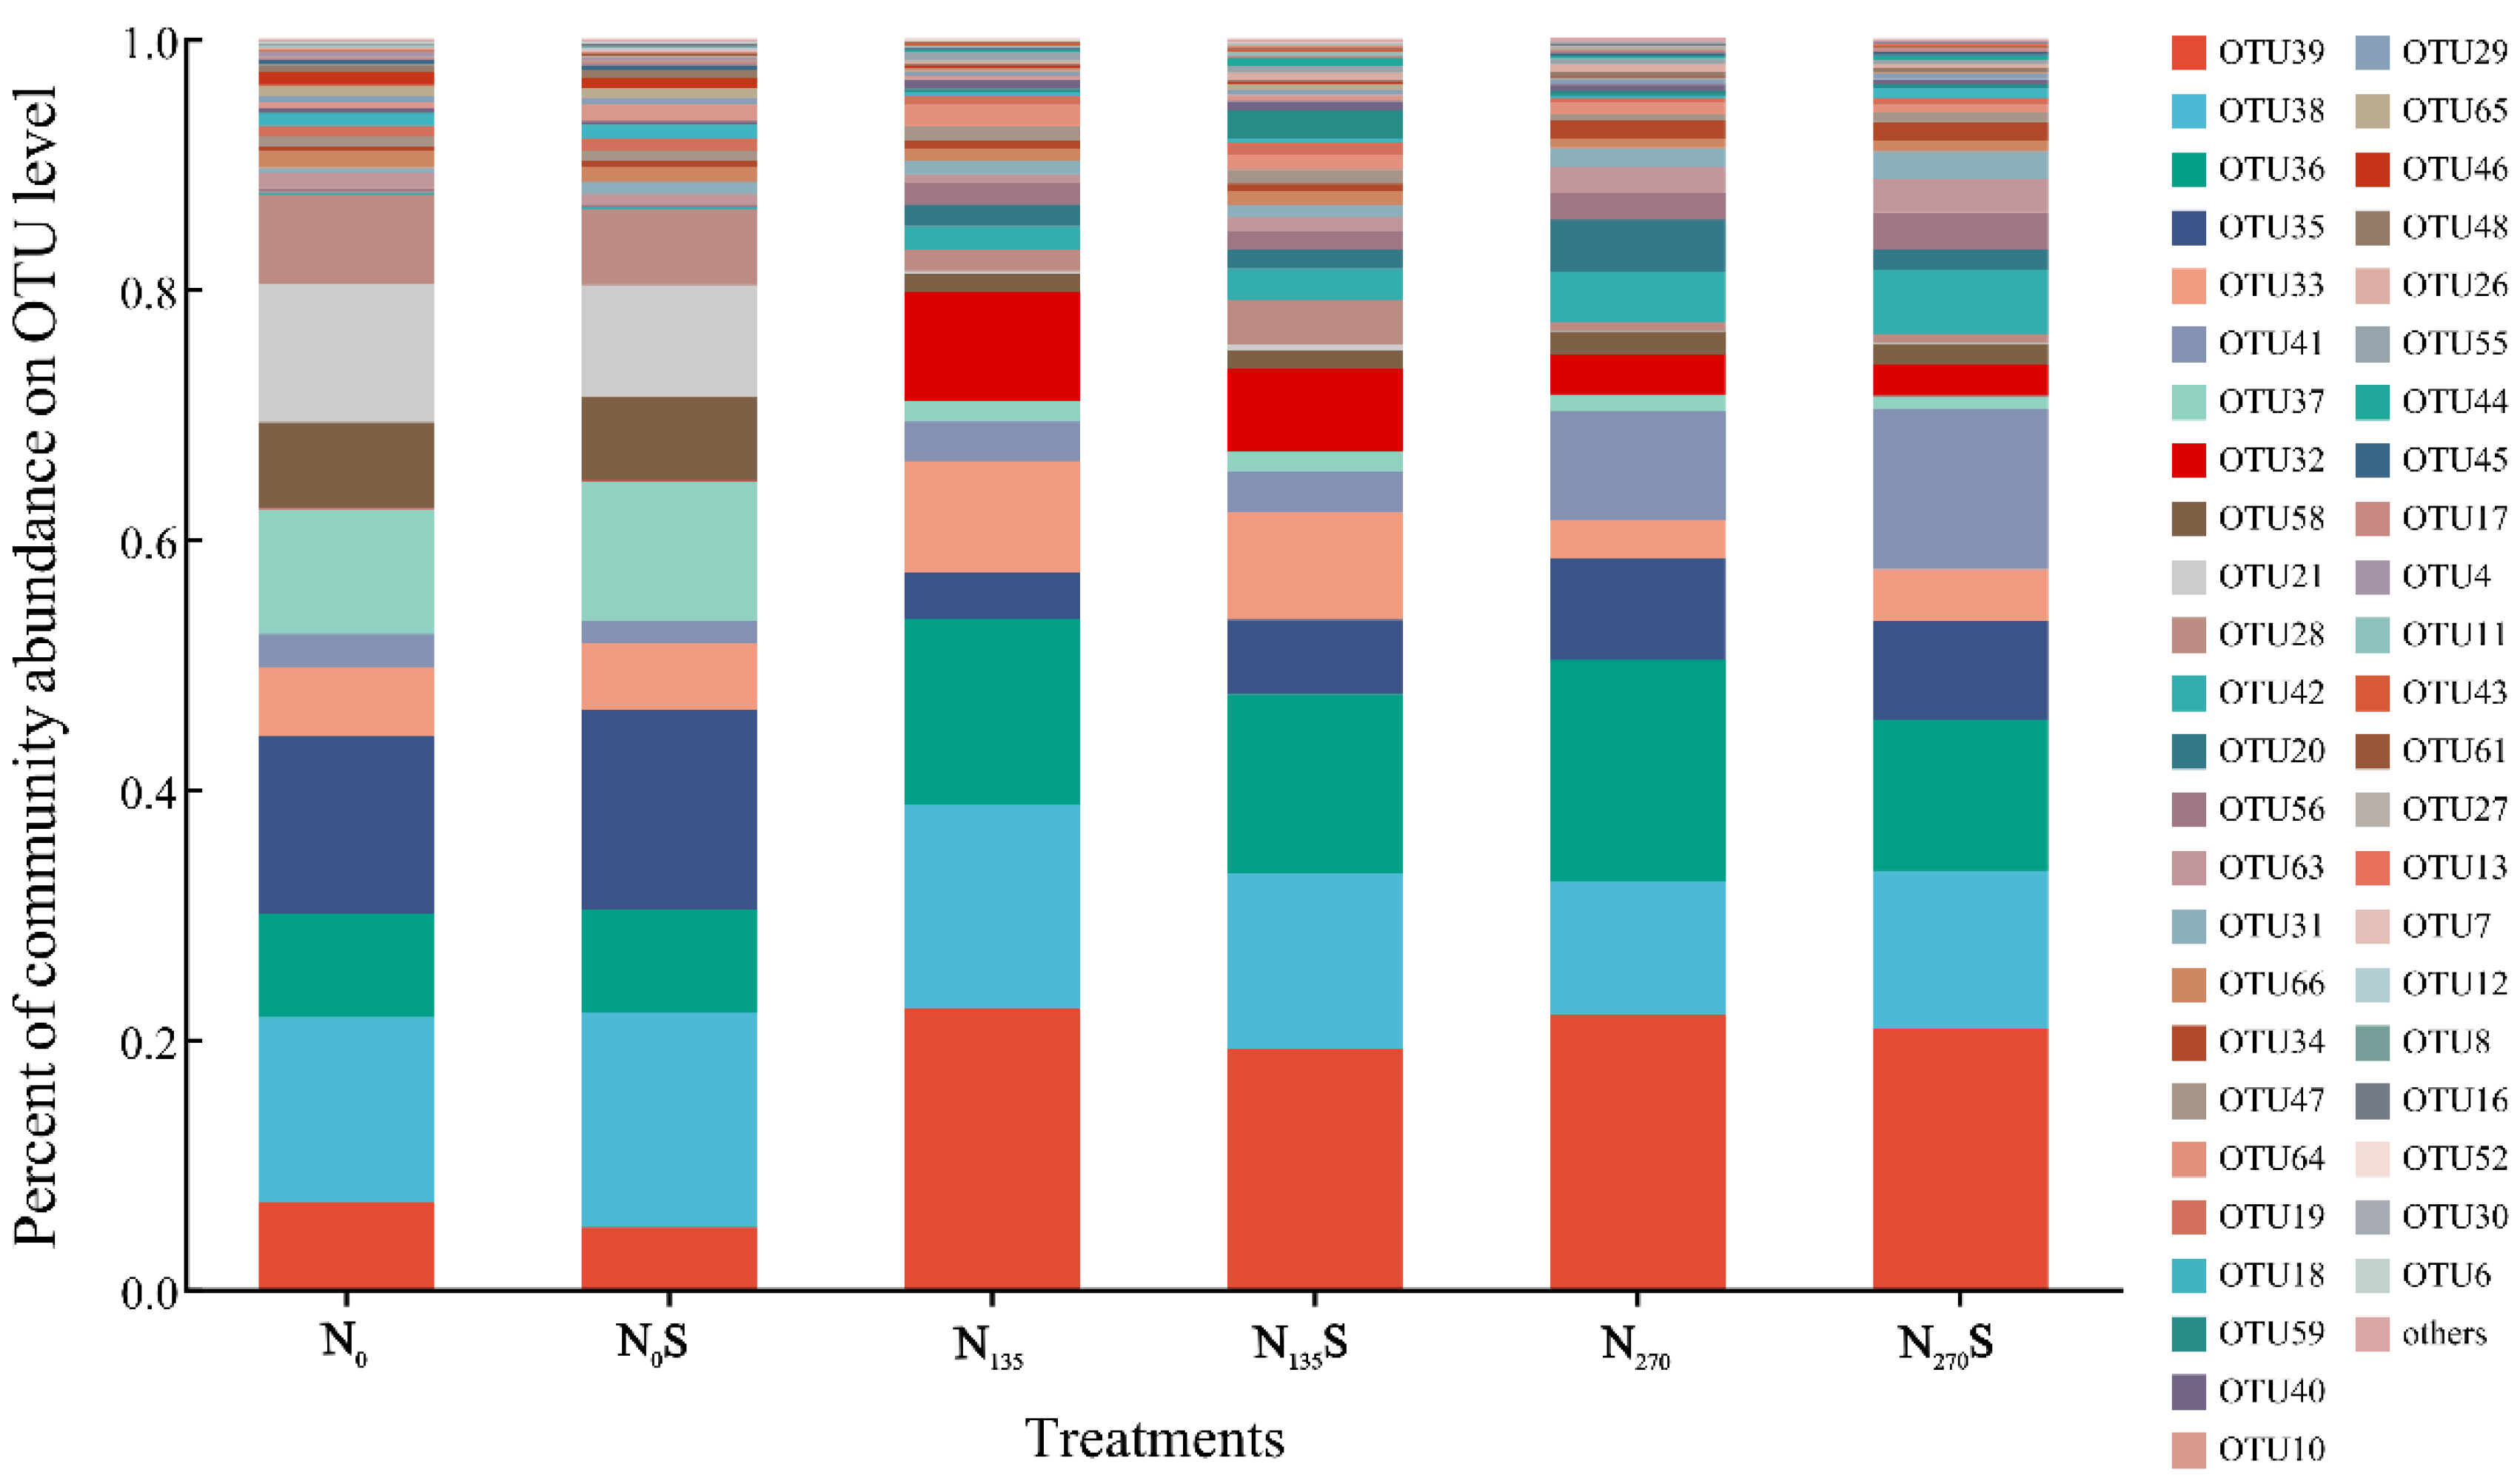
This investigation identified a total of 68 operational taxonomic units (OTUs) associated with ammonia-oxidizing archaea (AOA), with 47 OTUs consistently detected across all treatments (Figure S1). Only 3 OTUs were found exclusively in specific treatments, suggesting a limited variability within the AOA community across the experimental treatments. However, significant variations in relative abundance of AOA OTUs among treatments were observed clearly (Figure 1). The changes in the relative abundance exceeding 0.1% of AOA OTUs demonstrated a marked decline in the relative abundance of numerous OTUs, particularly OTU 35, 37, 58, 21, and 28, following fertilization regimes. Compared to the N0 and N0S treatments, their relative abundances decreased in the N135, N135S, N270, and N270S treatments. In contrast, OTU 39, identified as the most prevalent in fertilized soil samples, demonstrated a positive response to both low and high fertilization. Furthermore, OTU 41 had the highest relative abundance in the N270S treatment, whereas OTU 36 showed a significant increase in the N270 treatment. These results indicated that despite the overall similarity in composition in the composition of AOA community, differences in the key relative abundance of core AOA OTUs among different treatments may contribute to the observed fluctuations in soil nitrification.
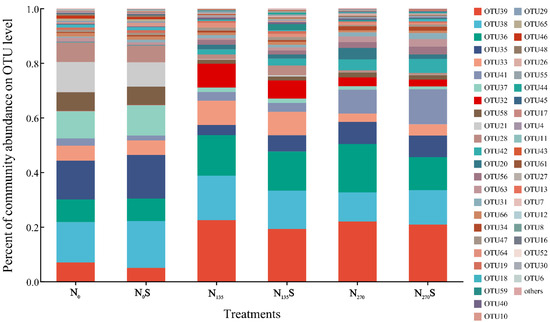
Figure 1.
Relative abundance of AOA OTUs. OTU: Operational Taxonomic Unit.
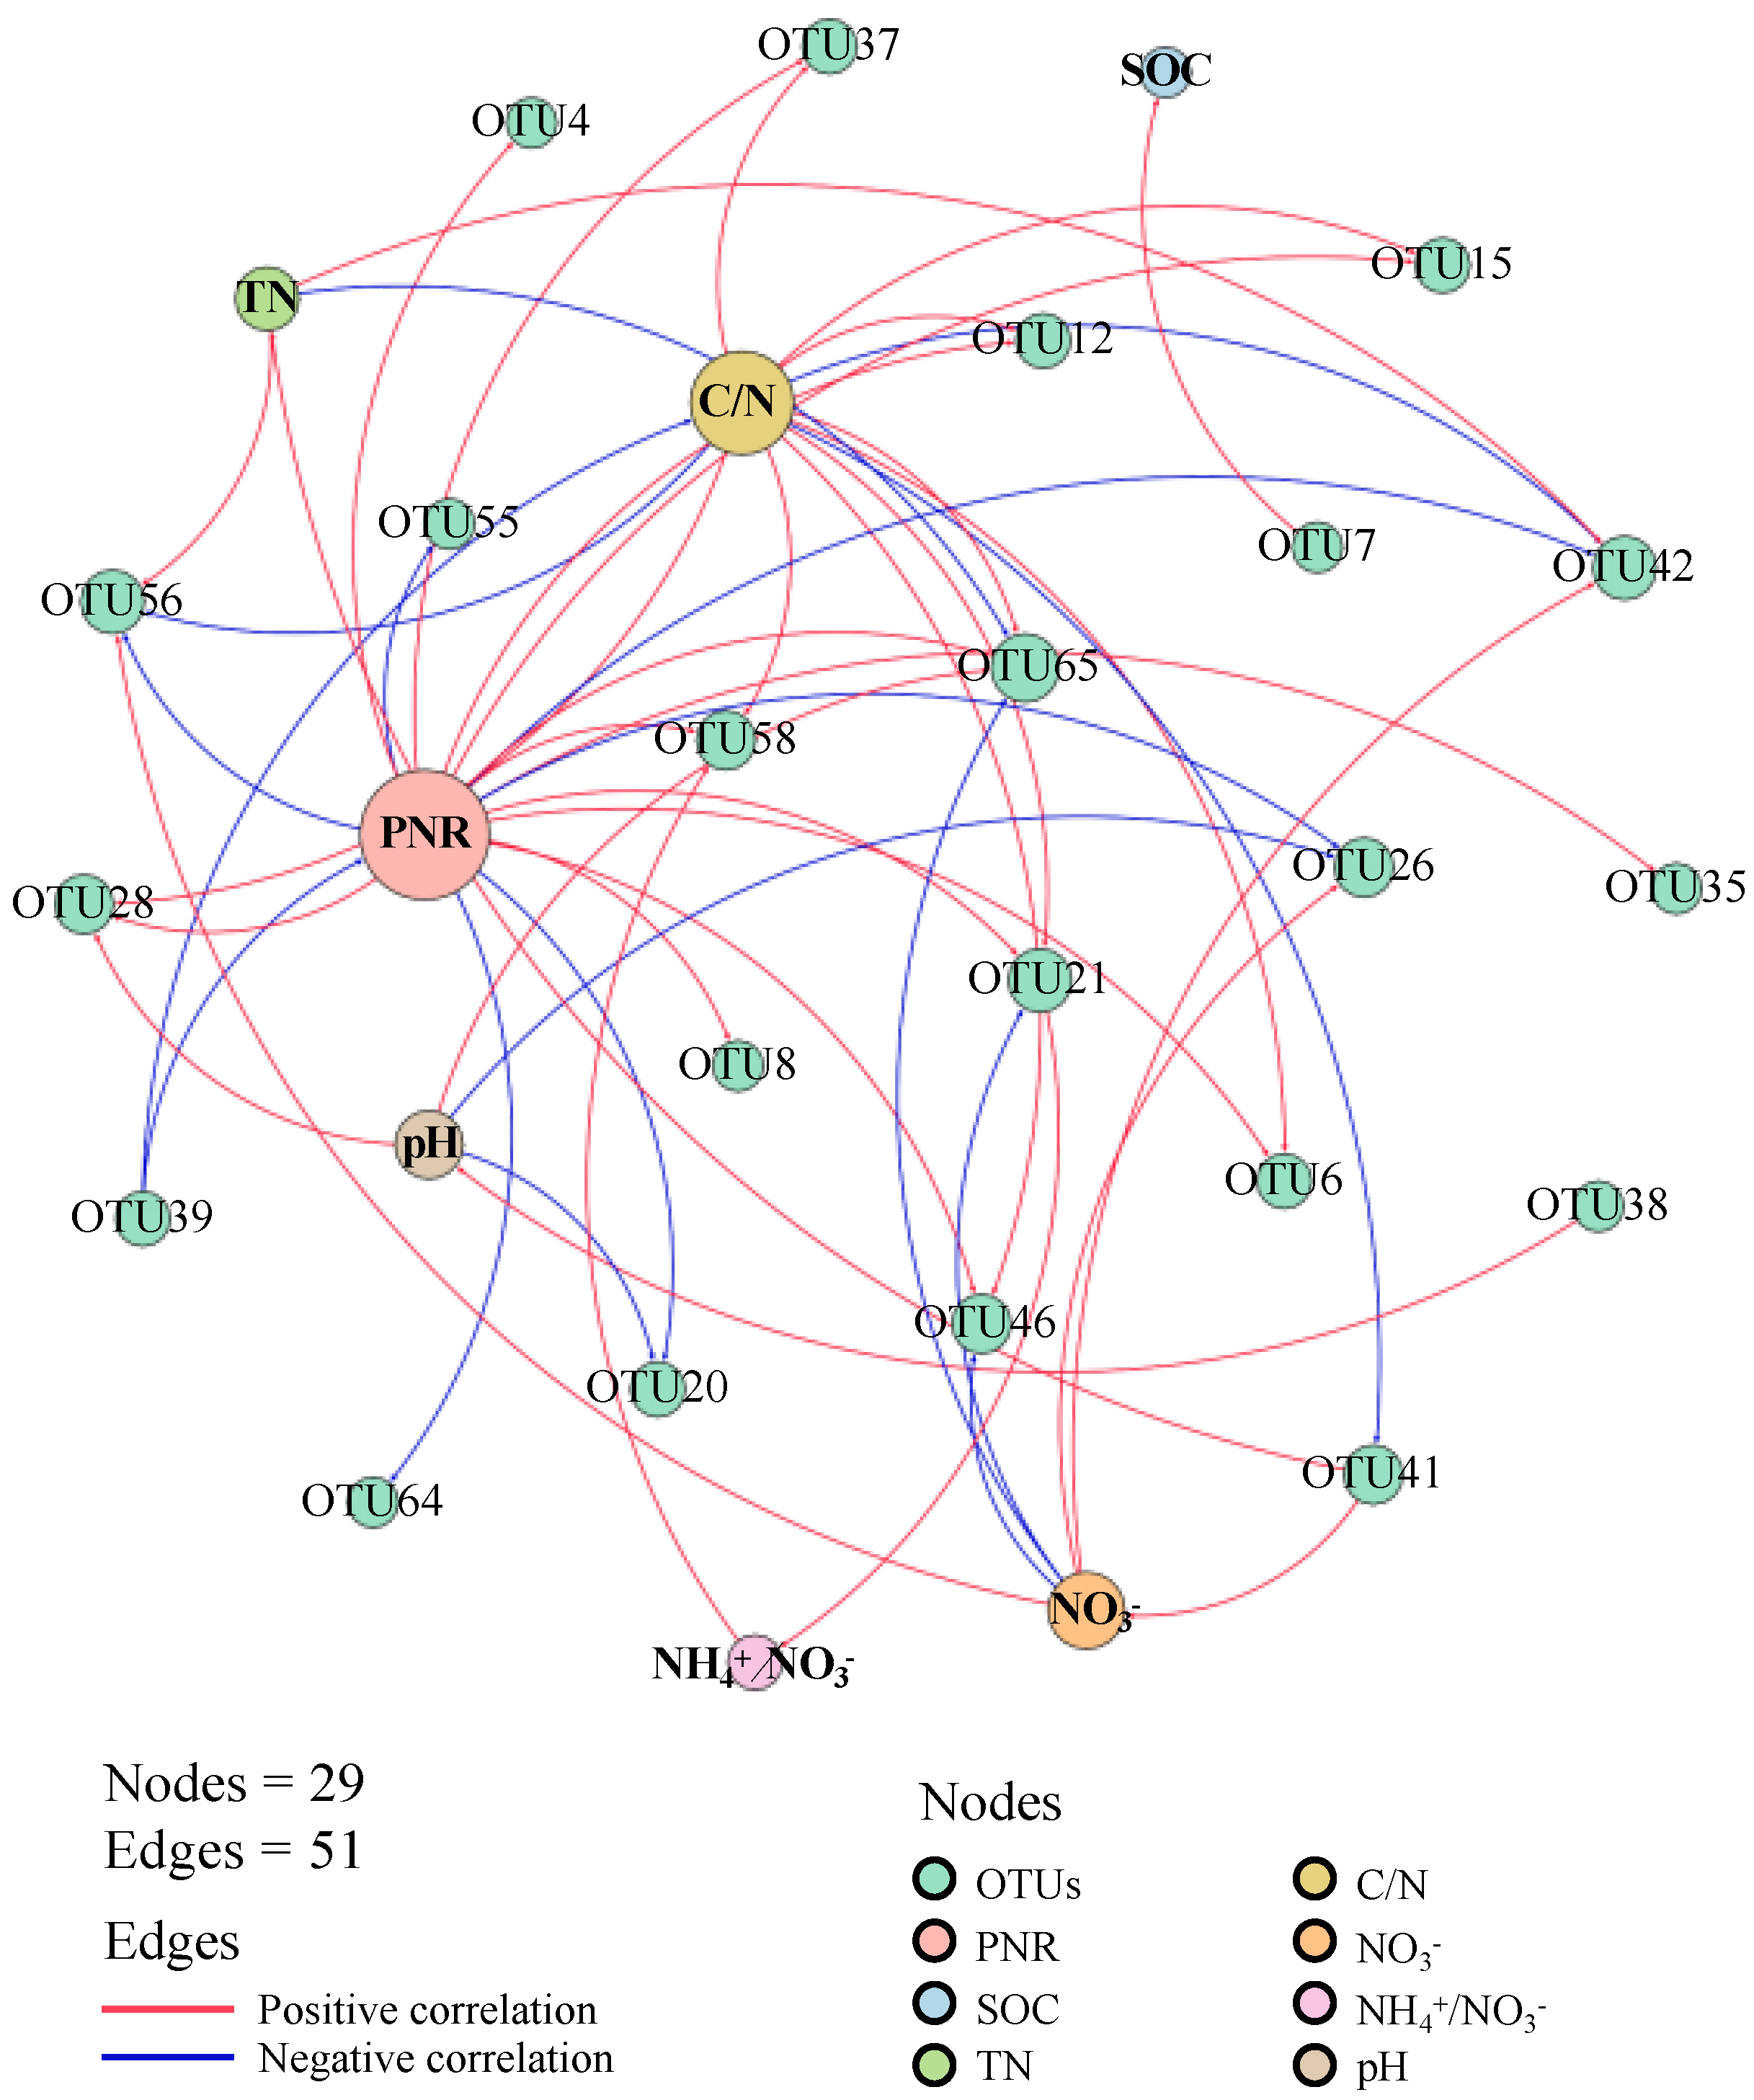
There were 22 AOA OTUs demonstrating strong correlations (|r| > 0.7) with soil chemical properties (Figure 2; Table S2). Of these, 19 OTUs showed significant correlations with soil potential nitrification rate, and two OTUs were significantly correlated with the NH4+/NO3− ratio, highlighting their crucial role in soil nitrification. Additionally, 13 OTUs showed significant correlations with the soil C/N ratio, while only one OTU (OTU7) was significantly correlated with soil organic carbon (Table S3).
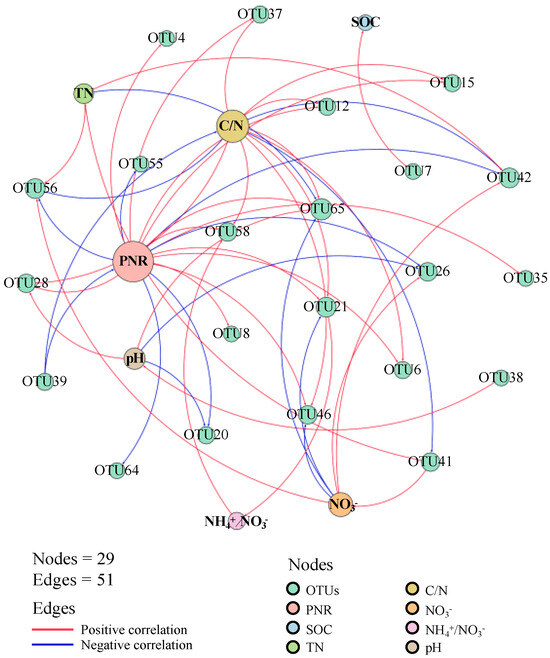
Figure 2.
Network analysis between AOA OTUs and soil chemical properties. SOC: soil organic carbon; TN: total nitrogen; NH4+: ammonia nitrogen; NO3−: nitrate nitrogen; C/N: the ratio of SOC to TN; NH4+/NO3−: the ratio of ammonia nitrogen to nitrate nitrogen. Node size represents the number of significant correlations with other nodes.
3.2. Design of AOA Core Clusters Primer Sets
From network analysis, 22 AOA OTUs were detected (Figure 2). Following the exclusion of those with relative abundances below 0.1% across all treatments, 14 AOA core OTUs were selected. Phylogenetic analysis further grouped these 14 AOA core OTUs into 5 distinct clusters (Figure S2). Notably, Cluster G2, G3, and G5 each comprised two OTUs, while Clusters G1 and G4 each consisted of four OTUs.
All OTUs in Cluster G1 were classified under the Thaumarchaeota phylum, including OTU 21, OTU 28, OTU 35, and OTU 65. Additionally, Crenarchaeota was another prominent phylum, with OTU 20, OTU 42, OTU 56 and OTU 64, belonging to Cluster G3, G4 and G5. A unique phylum, Thermoproteota, was identified for OTU 26 in Cluster G4, while some OTUs (OTU 37, OTU 39, OTU 41, OTU 55, and OTU 58) remained Unclassified at the phylum level (Figure S2).
Five pairs of primers were designed for quantifying these AOA core clusters (Table S4). These primers varied in length from 18 to 25 bp, and the amplicon lengths ranged from 117 to 202 bp.
3.3. Change in AOA Core Clusters at the Brown Soil Experimental Station
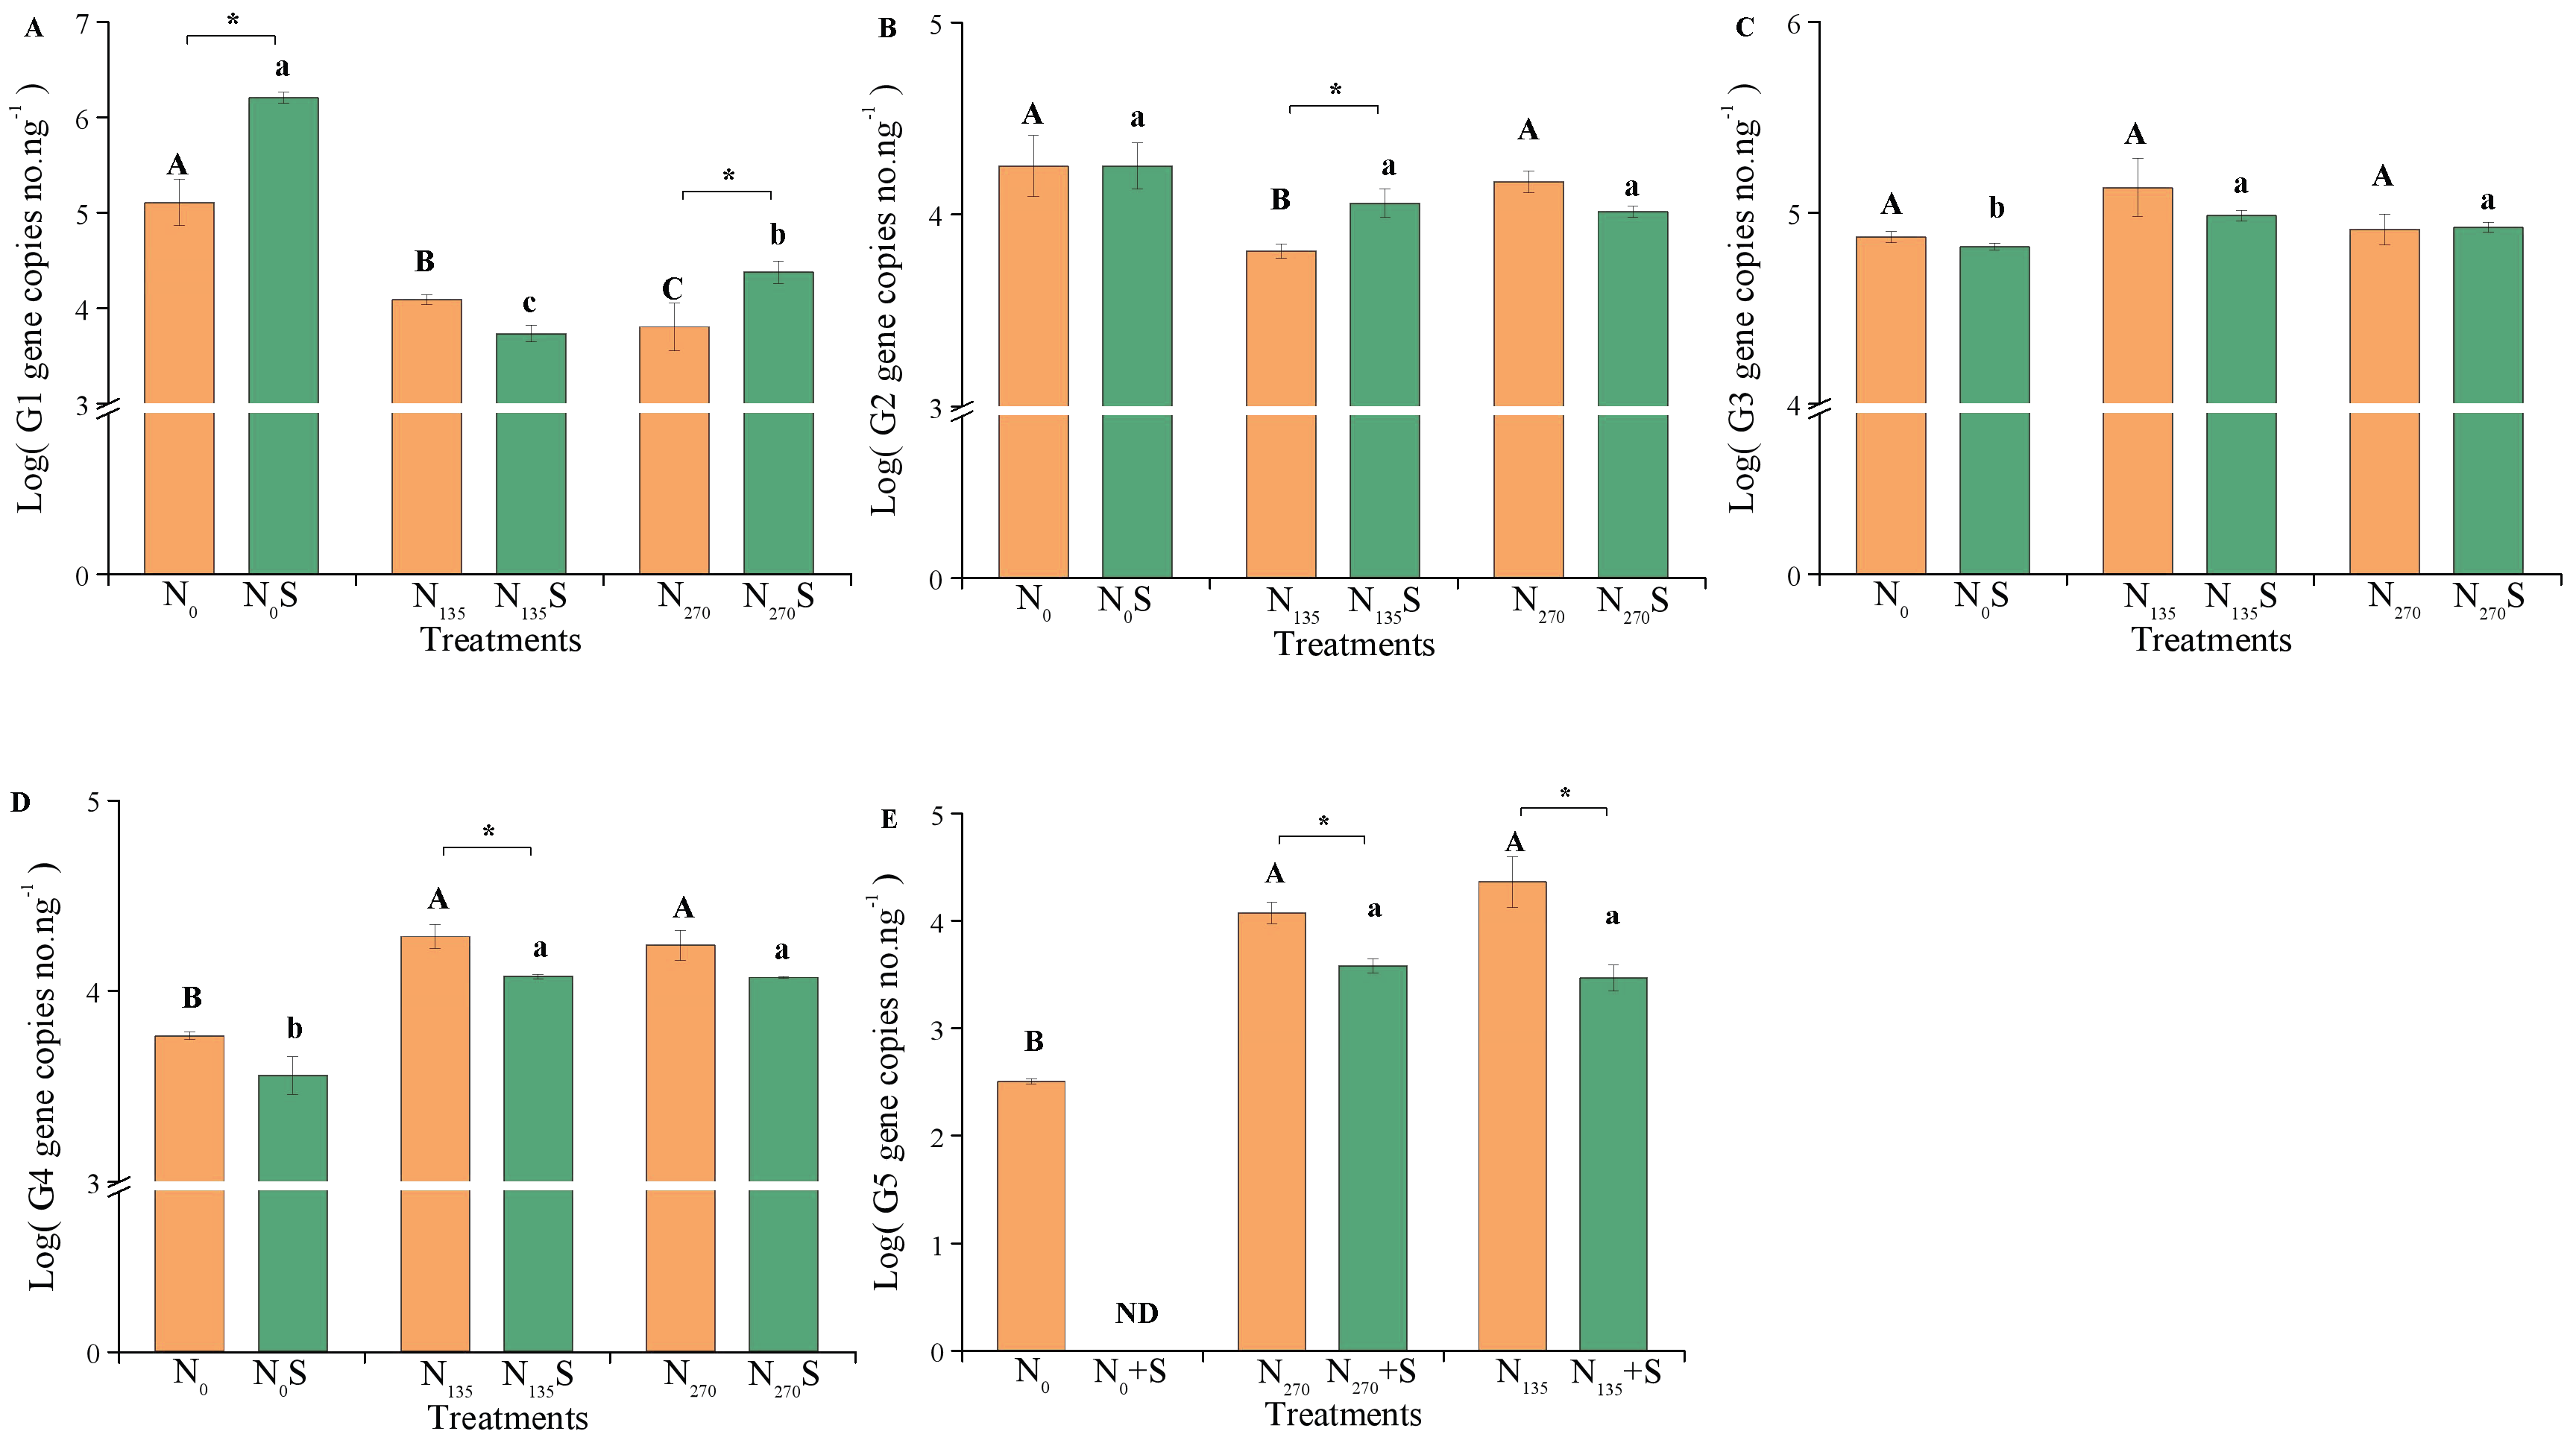
All AOA core clusters were detected in each treatment using the designed primers, except Cluster G5, which was not detected in the N0 treatment (Figure 3). Fertilization inhibited Cluster G1, but promoted Clusters G4 and G5. Compared to the unfertilized treatments (N0 and N0S), the absolute abundance of G1 significantly decreased in the N135, N135S, N270, and N270S treatments (p < 0.05), whereas the absolute abundances of G4 and G5 significantly increased in these treatments (p < 0.05). Cluster G2 only showed a significant reduction in the low fertilized treatment without straw addition (N135; p < 0.05), with no significant difference observed among the other treatments.
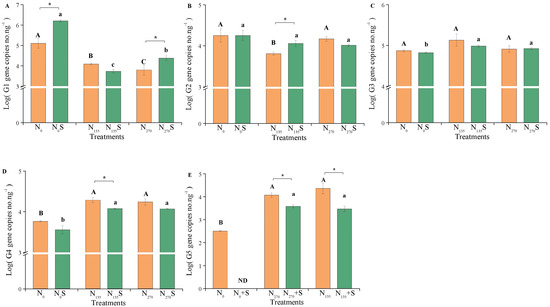
Figure 3.
Quantification of AOA core clusters in different treatments. Uppercase and lowercase letters represent significant differences between fertilization treatments without and with straw, respectively (p < 0.05). “*” indicates significant differences between straw samples (p < 0.05). “ND” represents non-detection. G1, G2, G3, G4, and G5 represent different clusters within the AOA core clusters. (A) G1; (B) G2; (C) G3; (D) G4; (E) G5.
Straw addition also notably influenced the variation in AOA core clusters (Figure 3). Compared to treatments without straw addition, straw addition significantly increased the absolute abundance of Cluster G1 in both unfertilized and high fertilized soils (N0S and N270S treatments; p < 0.05) and Cluster G2 in low fertilized soil (N135S treatment; p < 0.05). Conversely, it decreased the absolute abundances of Clusters G4 and G5 in fertilized soils (N135S and N270S treatments; p < 0.05). However, there were no significant changes observed in the absolute abundance of Cluster G3 between treatments with and without straw addition.
Although AOA core clusters had divergent responses to fertilization and straw addition, they all demonstrated high sensitivity to environmental changes, except Cluster G3. Furthermore, the response of AOA amoA to fertilization and straw addition was similar to that of Clusters G1 and G2 but opposite to that of Clusters G4 and G5 (Figure S3 and Figure 3).
3.4. Contribution of AOA Core Clusters to Soil Nitrification at the Brown Soil Experimental Station
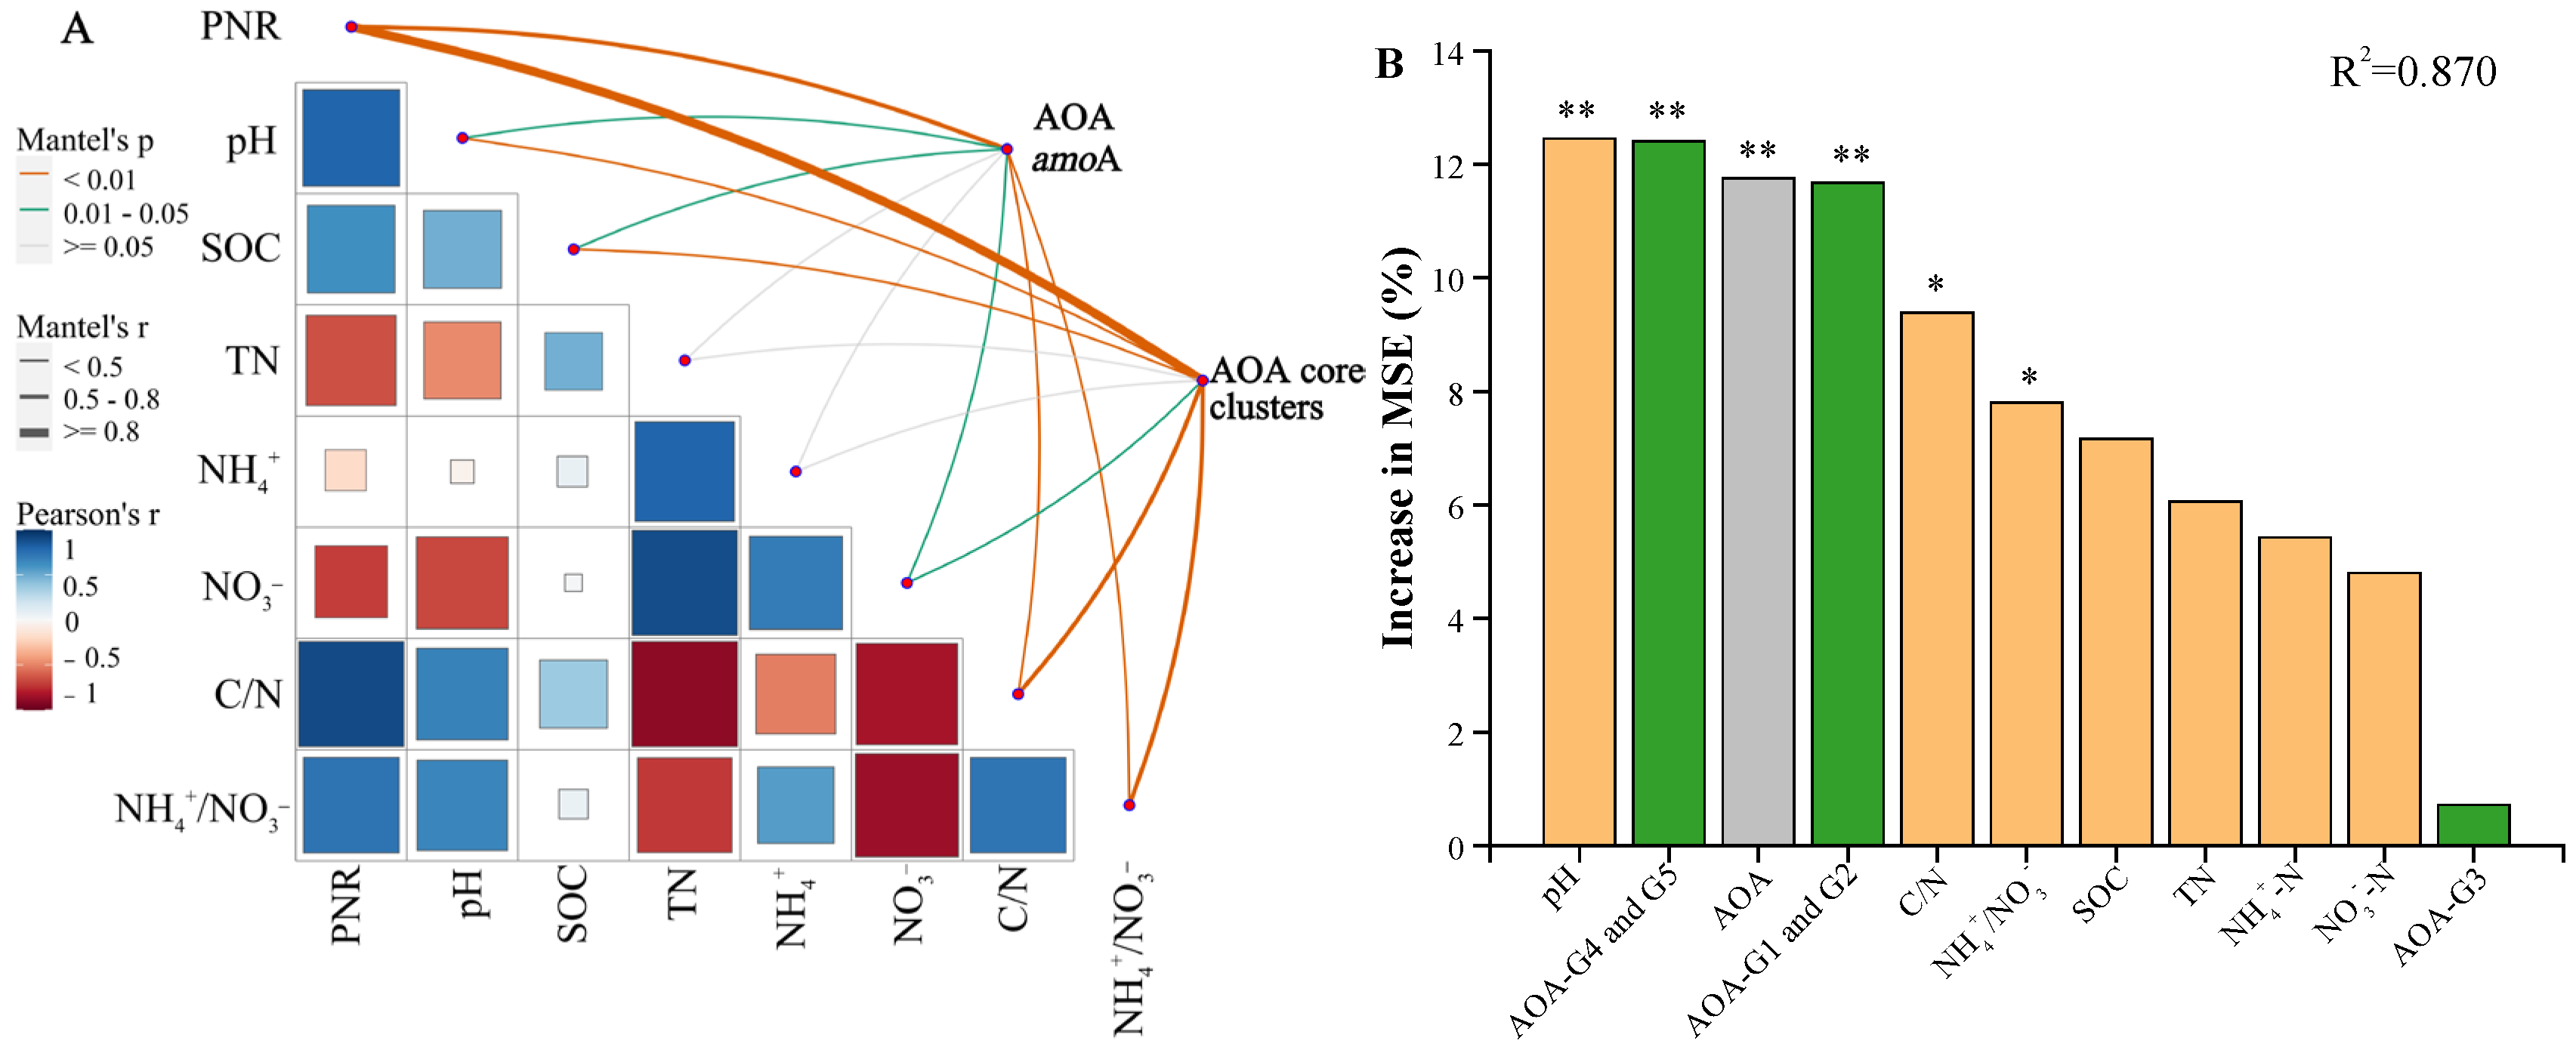
Comparing the responses of AOA amoA and AOA core clusters to soil potential nitrification rate and environmental factors (Figure 4A), a strong correlation between the AOA core clusters abundance and soil potential nitrification rate (r = 0.857; p-adjust = 0.003) was observed (Table S5), which is higher than that of AOA amoA (r = 0.735; p-adjust = 0.003). A stronger correlation between AOA core clusters and soil organic carbon (r = 0.412; p-adjust = 0.005) and pH (r = 0.447; p-adjust = 0.009) was also observed, indicating their heightened sensitivity to environmental changes compared to AOA amoA.
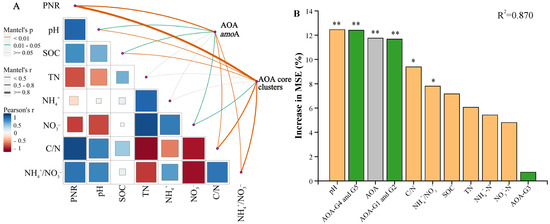
Figure 4.
Comparative analysis of AOA amoA and AOA core clusters responses to environmental factors and soil potential nitrification rate. (A) correlation and Mantel test analysis of potential nitrification rate and soil properties with AOA amoA and AOA core clusters. (B) the importance of biotic and abiotic variables to soil potential nitrification rate. Green, gray, and orange bars represent the effects of AOA core clusters, AOA amoA, and soil chemical properties, respectively. “*” and “**” represent significance of variables at 0.05 and 0.01 level, respectively. SOC: soil organic carbon; TN: total nitrogen; NH4+: ammonia nitrogen; NO3−: nitrate nitrogen; C/N: the ratio of SOC to TN; NH4+/NO3−: the ratio of ammonia nitrogen to nitrate nitrogen. AOA-G1, G2, G3, G4, and G5: different cluster of AOA core clusters.
Furthermore, we evaluated the individual importance of biotic and abiotic factors on soil potential nitrification rate (Figure 4B). Based on their similar abundance response patterns under different treatments, Clusters G1 and G2 were grouped together, as were Clusters G4 and G5. The results revealed that soil pH and the quantification of Clusters G4 and G5 had the greatest influence on soil potential nitrification rate, explaining 12.46% and 12.40% of the variance, respectively (p < 0.01), followed by the quantification of AOA amoA, and Clusters G1 and G2, explaining 11.77% and 11.67% of the variance, respectively (p < 0.01). The NH4+/NO3− ratio and C/N ratio also significantly impacted soil potential nitrification rate (p < 0.05). Moreover, the influence of Clusters G3 on soil potential nitrification rate was not significant (Figure 4B), suggesting that it may contribute less to soil nitrification potentially.
In summary, compared to AOA amoA, AOA core clusters showed higher environmental sensitivity and a stronger correlation with soil potential nitrification rate. This finding was further supported by linear regression analysis (Figure S4A–C). Clusters G1 and G2 showed a stronger positive correlation (R2 = 0.920; p < 0.001) than AOA amoA (R2 = 0.796; p < 0.001), while Clusters G4 and G5 showed a significant negative correlation (R2 = −0.659; p < 0.01) with soil potential nitrification rate. These results highlighted the contrasting roles of specific AOA groups in regulating soil nitrification processes.
3.5. Comparison of AOA amoA, AOA Core Clusters, and Potential Nitrification Rate at Typical Black Soil Zone
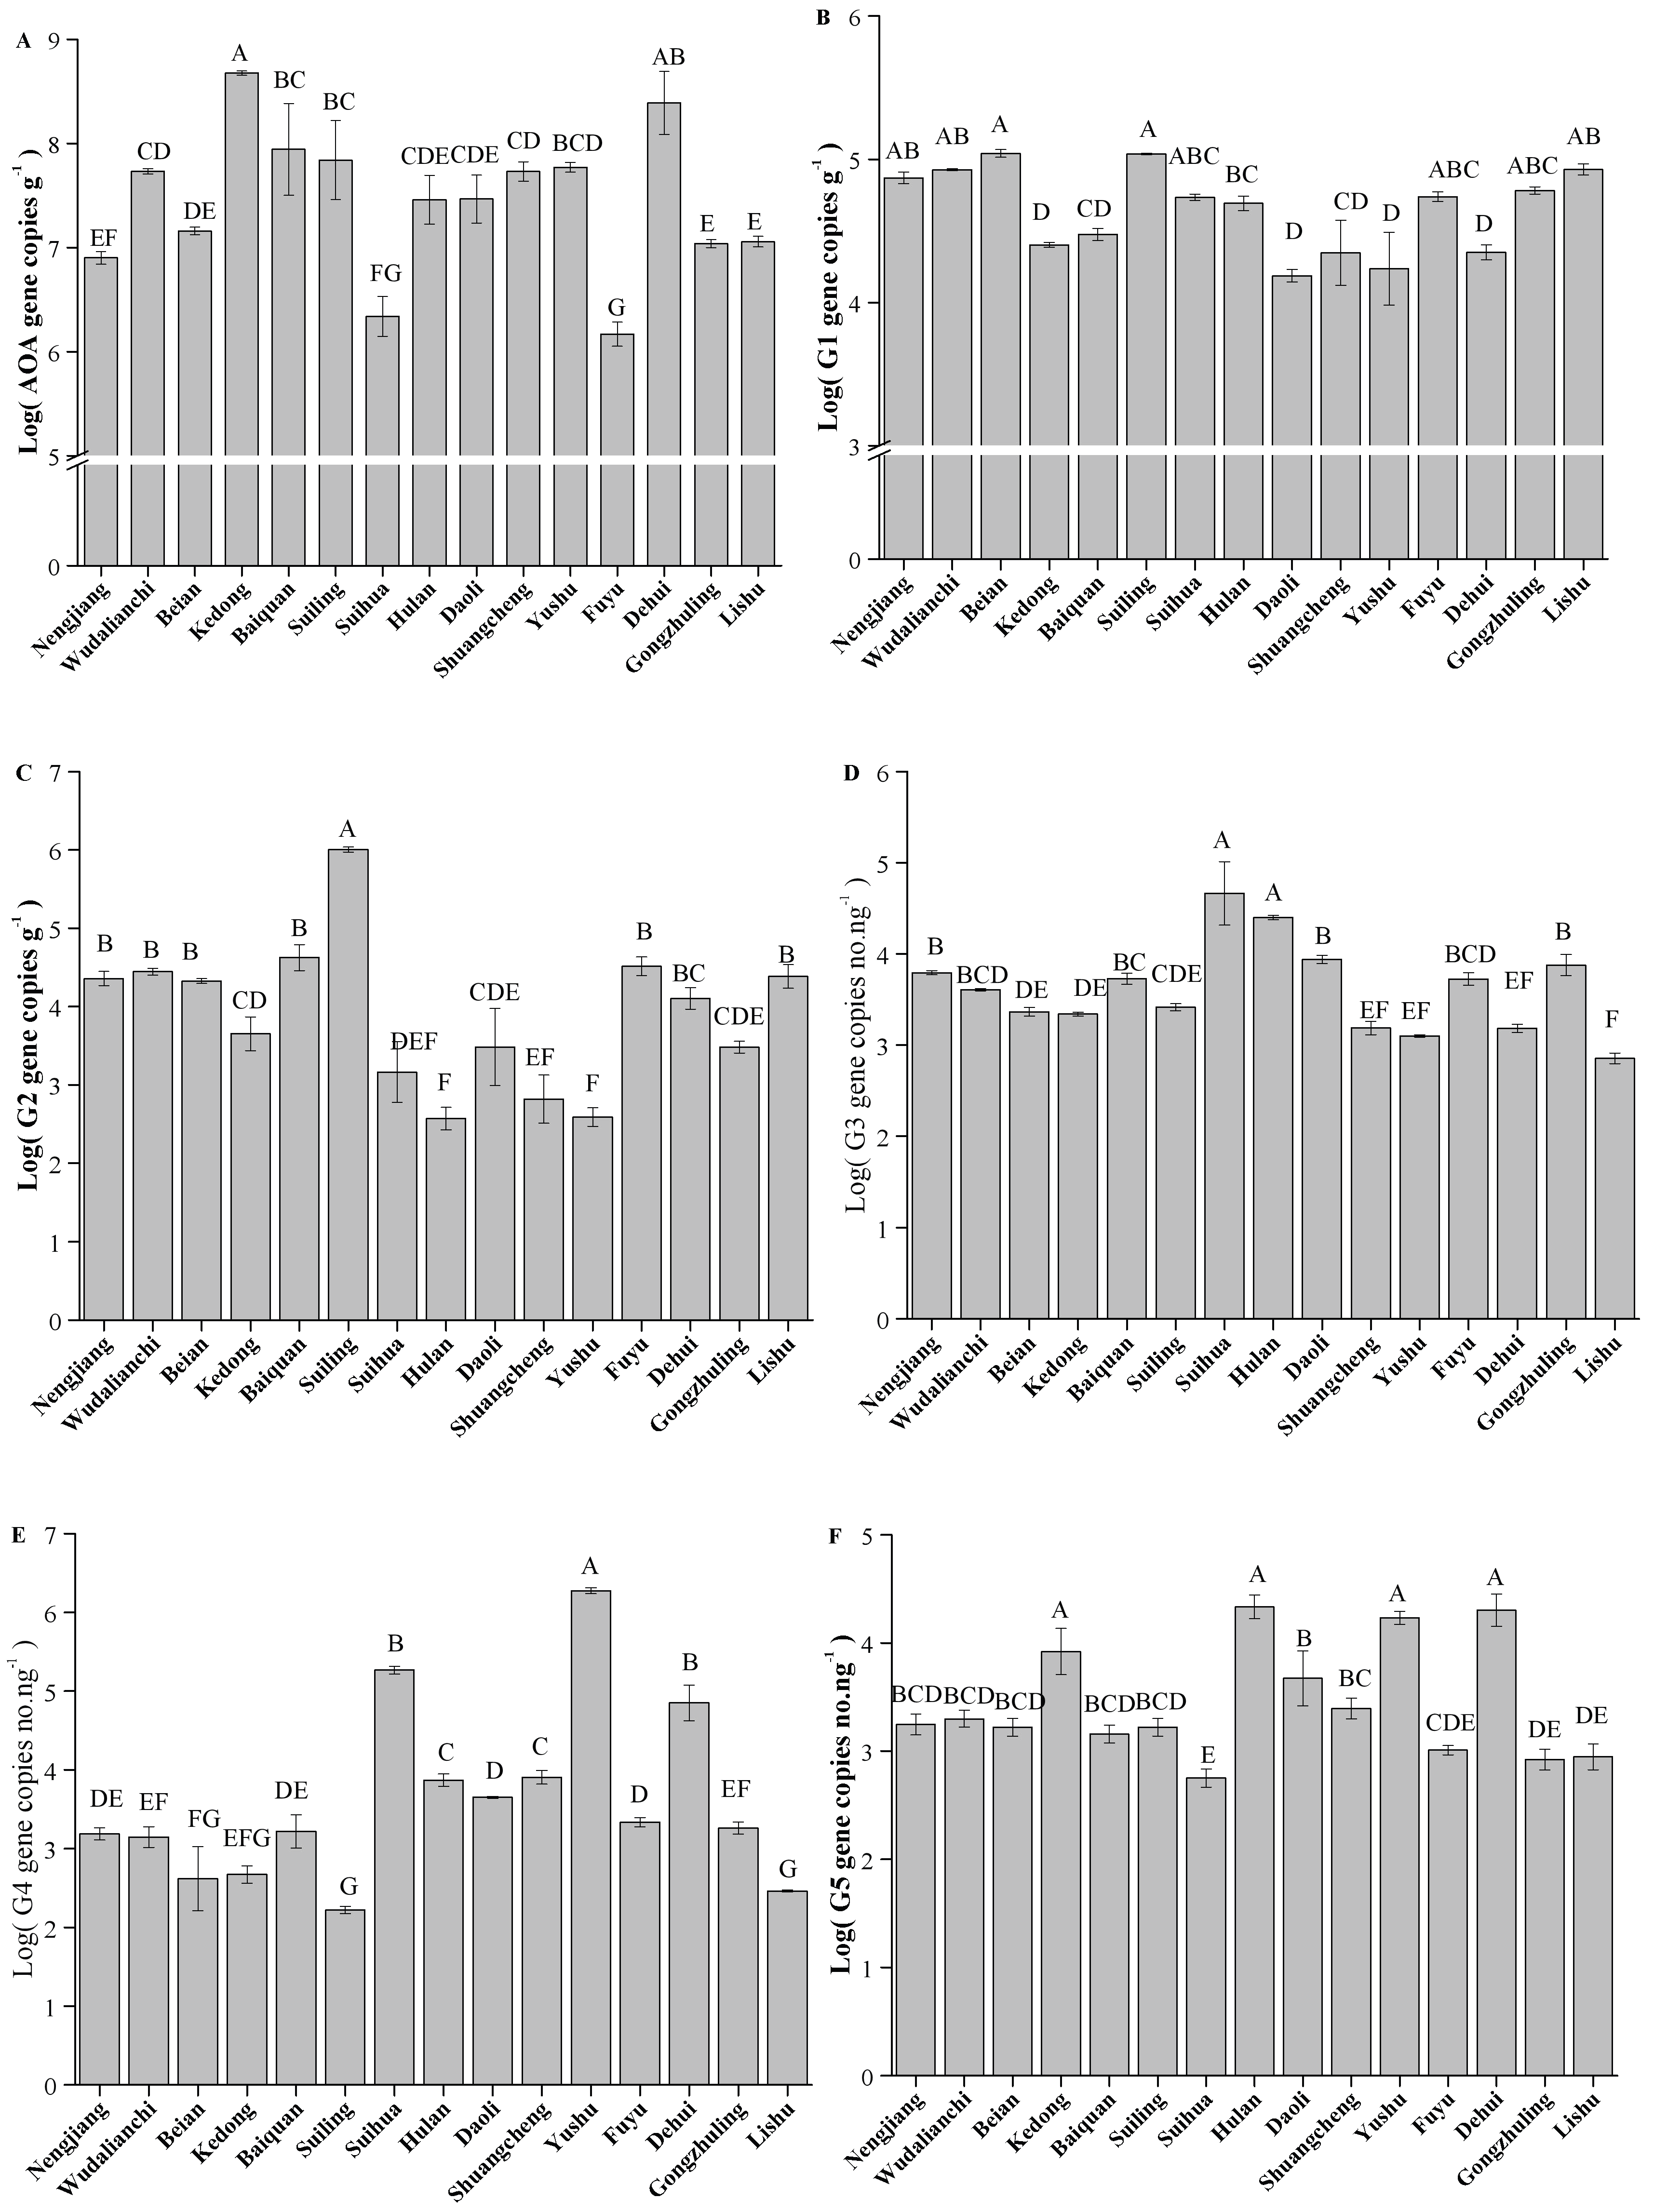
The absolute abundance of AOA amoA varied significantly across different counties (Figure 5A, p < 0.05). The highest AOA amoA absolute abundance was observed at Kedong with a value of 4.75 × 10⁸ copies g−1, followed by Dehui. The lowest abundance was recorded at Fuyu with a value of 1.47 × 10⁶ copies g−1. Furthermore, different trends were observed among the various clusters of AOA core clusters (Figure 5B–F). Despite significant variation in the absolute abundances of Clusters G1–G5 across different counties, some consistent trends were observed (p < 0.05). Both Clusters G1 and G2 had relatively high abundances at Suiling and Lishu, while their abundances were lower at Shuangcheng and Yushu (p < 0.05). In contrast, Clusters G4 and G5 showed an opposite trend, with lower abundances at Suiling and Lishu, but higher abundances at Shuangcheng, Yushu, and Dehui (p < 0.05). Additionally, Cluster G3 had its highest abundance at Suihua and lowest abundance at Lishu. These results reflected the unique ecological preferences and responses of AOA core clusters to local environments.
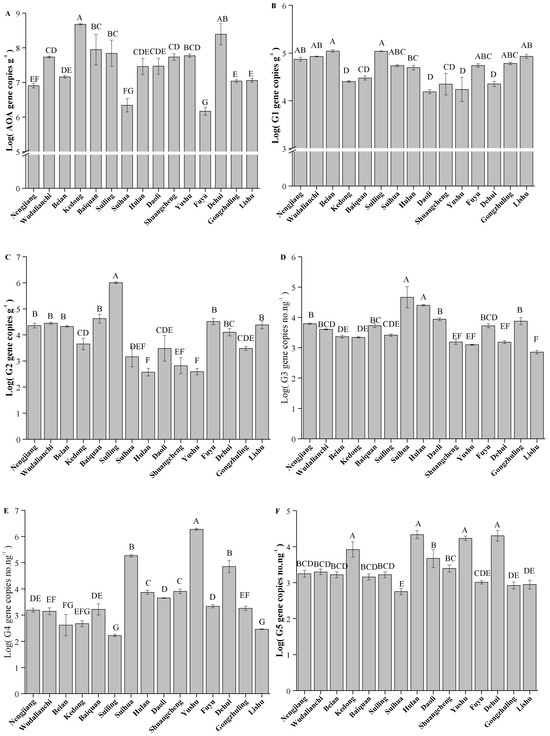
Figure 5.
Quantification of AOA amoA and AOA core clusters in Typical Black Soil Zone. The letters represent significant differences between samples (p < 0.05). G1, G2, G3, G4, and G5 represent different clusters within the AOA core clusters. (A) AOA amoA; (B) G1; (C) G2; (D) G3; (E) G4; (F) G5.
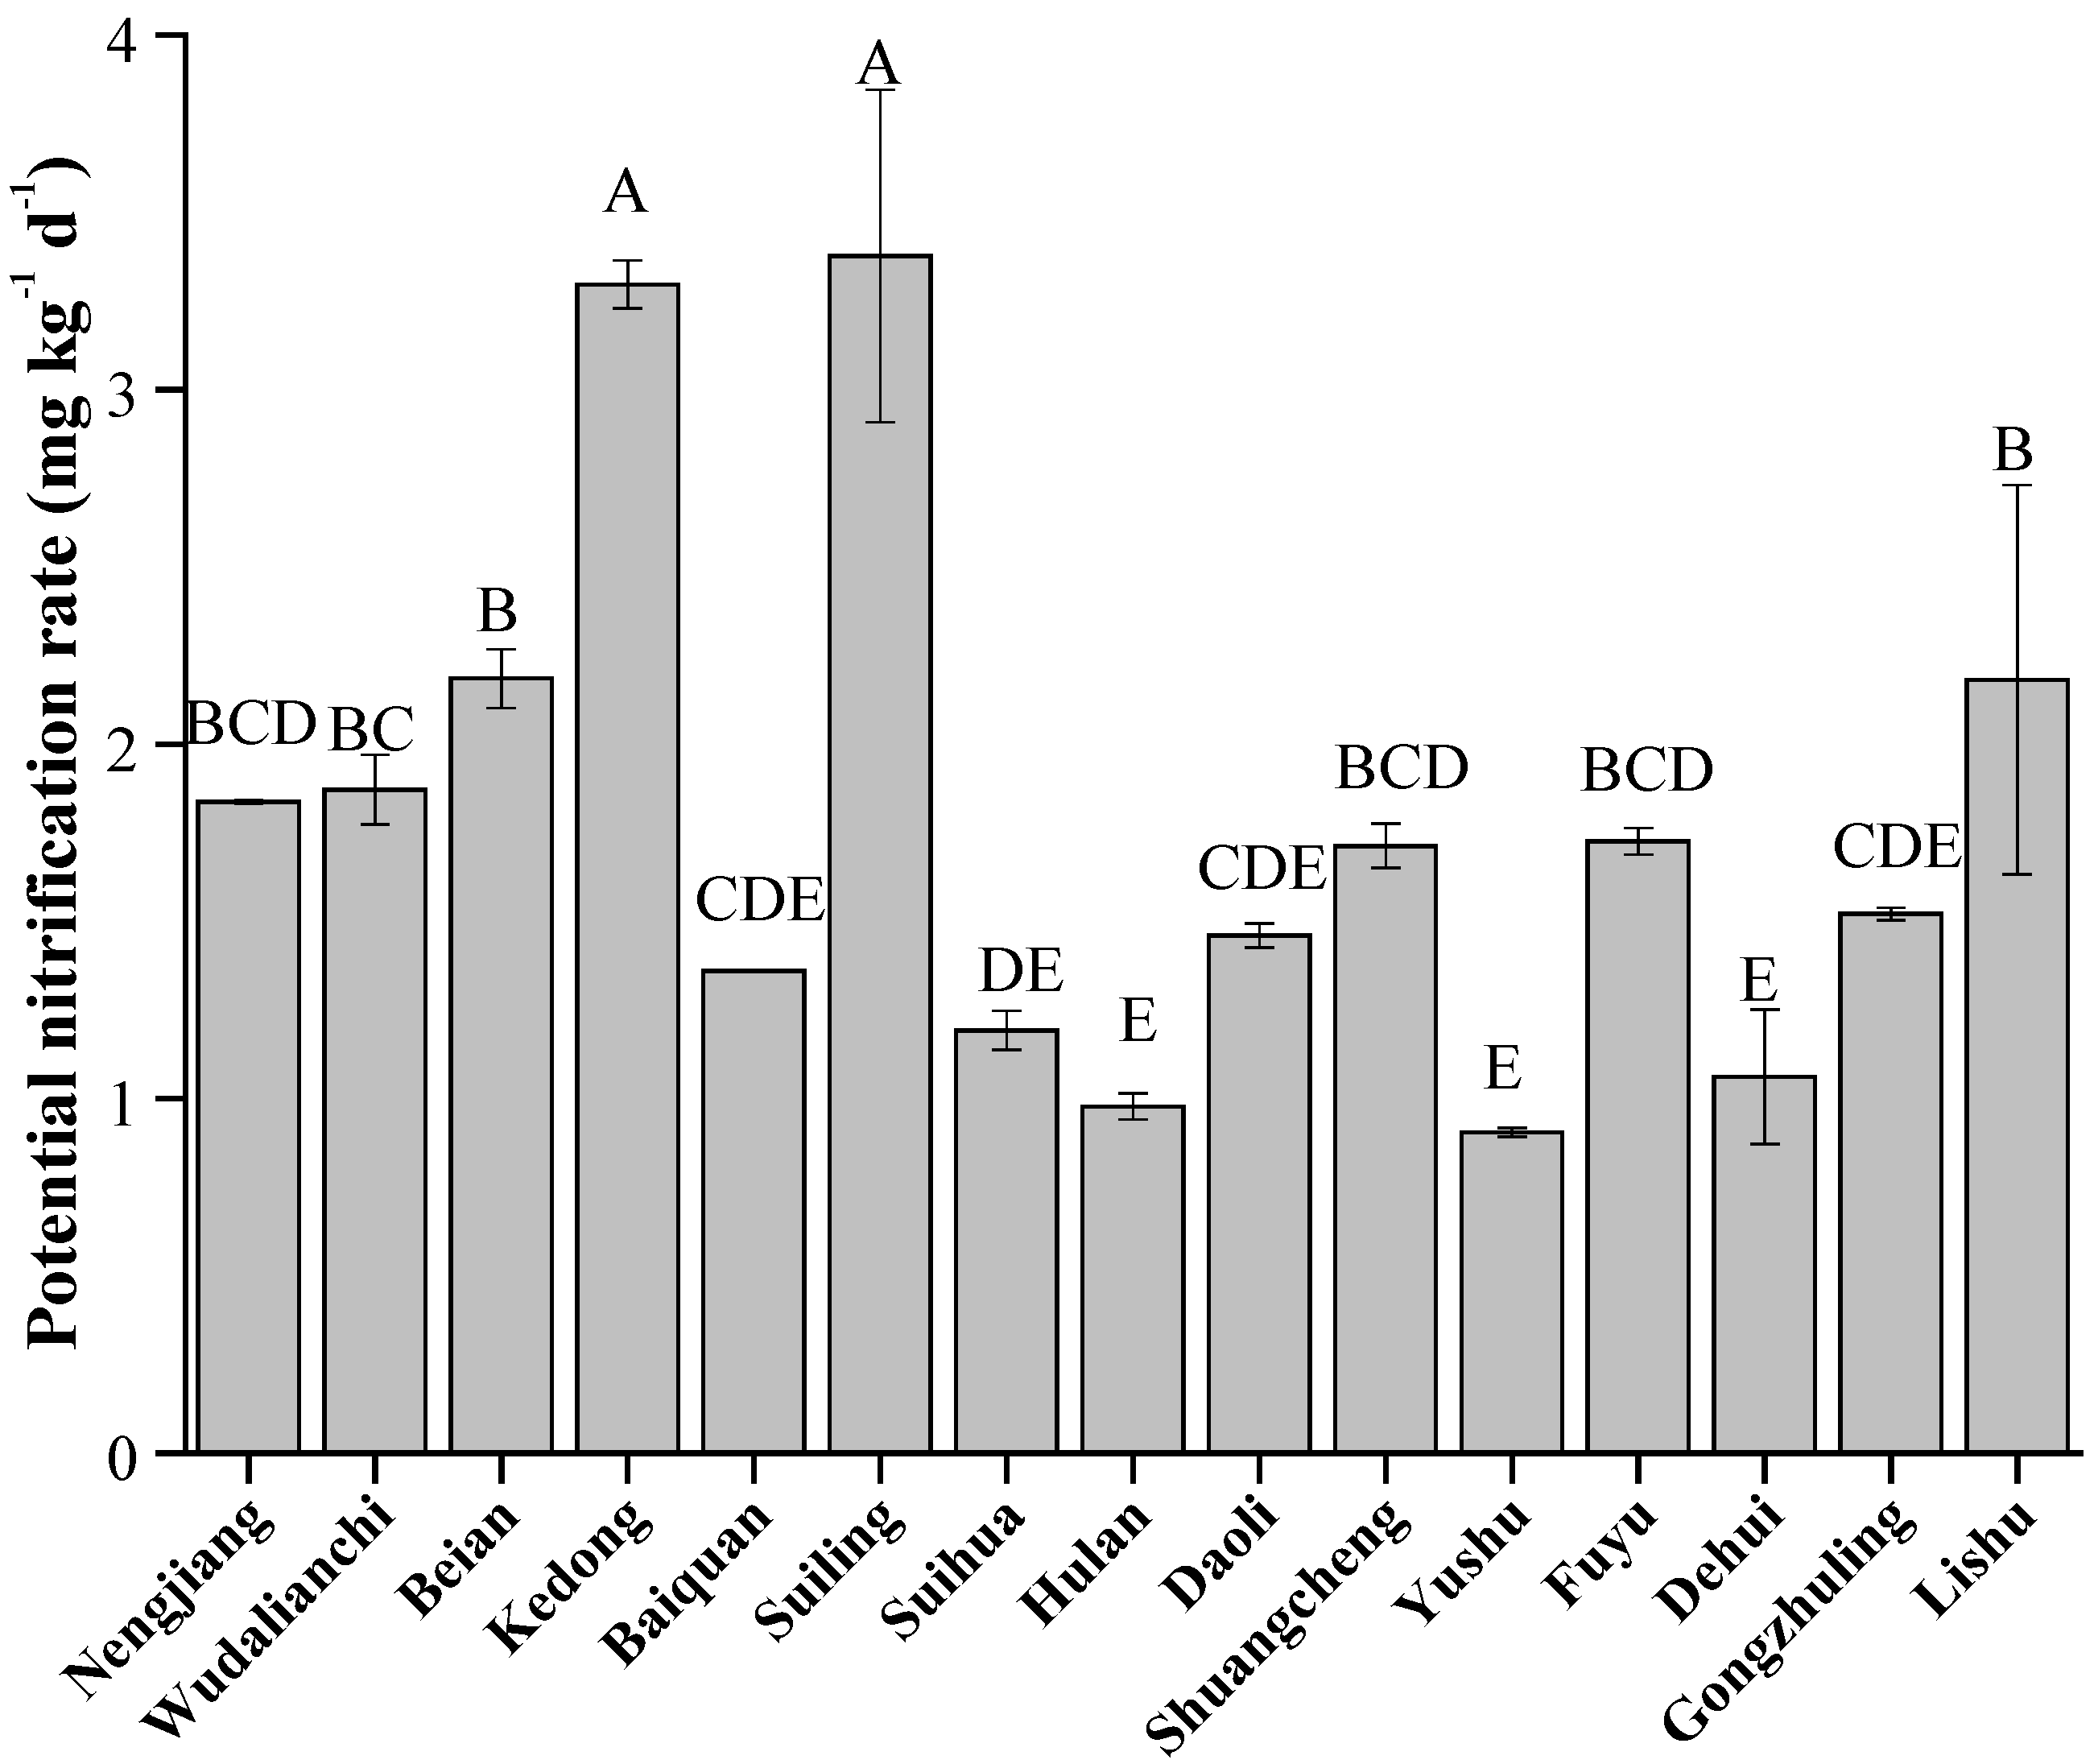
The soil potential nitrification rate varied significantly across different counties (Figure 6, p < 0.05), with the highest values observed at Suiling and Kedong (3.38 and 3.30 mg kg−1 d−1, respectively), while the lowest at Yushu and Hulan (0.90 and 0.98 mg kg−1 d−1, respectively). Overall, the trend in potential nitrification rate was similar to the changes in absolute abundance of Clusters G1 and G2, but opposite to those of Clusters G4 and G5.
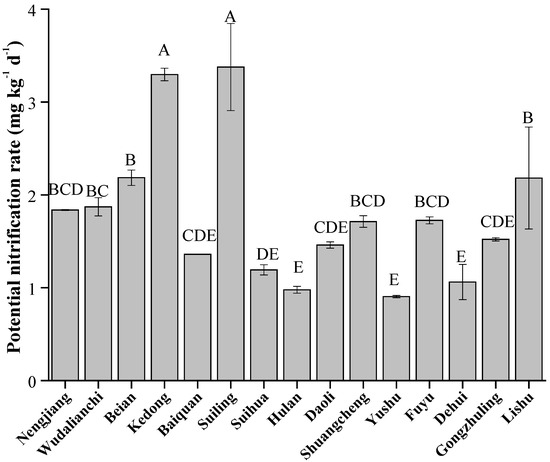
Figure 6.
Soil potential nitrification rate in Typical Black Soil Zone. The letters represent significant differences between samples (p < 0.05).
3.6. Correlation of AOA amoA and AOA Core Clusters to Soil Potential Nitrification Rate at Typical Black Soil Zone
The Pearson correlation analysis revealed notable relationships between AOA amoA, AOA core clusters, and various environmental factors (Table 1). AOA amoA was positively correlated with SOC (r = 0.619, p < 0.01), TN (r = 0.599, p < 0.05) and pH (r = 0.580, p < 0.05), but negatively correlated with NH4+ (r = −0.513, p < 0.05). Different AOA core clusters showed distinct environmental preferences: Cluster G1 was positively correlated with NH4+ (r = 0.763, p < 0.01), C/N (r = 0.507, p < 0.05), and NH4+/NO3− (r = 0.450, p < 0.05), while negatively correlated with pH (r = −0.469, p < 0.05). Cluster G2 was significantly positively correlated with SOC (r = 0.426, p < 0.05), TN (r = 0.425, p < 0.05), NH4+ (r = 0.580, p < 0.05), and NH4+/NO3− (r = 0.661, p < 0.01). Conversely, Clusters G4 and G5 showed significant negative correlations with NH4+ (r = −0.519 and −0.670, p < 0.05), NH4+/NO3− (r = −0.618 and −0.634, p < 0.01), and positive correlations with NO3− (r = 0.796 and 0.610, p < 0.05). Overall, except for Cluster G3, which was significantly positively correlated only with longitude (r = 0.435, p < 0.05), Clusters G1, G2, G4 and G5 showed stronger correlations with mineral nitrogen (NH4+, NO3−, and NH4+/NO3−) than AOA amoA (p < 0.05).

Table 1.
Pearson correlations of AOA amoA and AOA core clusters with various environmental factors.
Compared to AOA amoA, AOA core clusters have a stronger correlation with the potential nitrification rate. Specifically, Cluster G2 was positively correlated with the potential nitrification rate (r = 0.621, p < 0.01), whereas Clusters G4 and G5 had strong negative correlations with soil PNR (r = −0.750 and −0.413, p < 0.05). The results of linear regression analysis further supported these results (Figure S4D–F), with Clusters G1 and G2 demonstrating a significant positive correlation (R2 = 0.275; p < 0.05), while Clusters G4 and G5 showed a significant negative correlation (R2 = −0.306; p < 0.05) with soil PNR. In contrast, AOA amoA had no significant correlation with soil PNR. These results suggested that, across the 15 counties in the Typical Black Soil Zone, AOA core clusters showed a more pronounced sensitivity to the potential nitrification rate than AOA amoA.
4. Discussion
4.1. Bidirectional Role of the AOA Community in Soil Nitrification
AOA is widely distributed in environments such as soils, oceans, and artificial ecosystems [33]. Due to the significant habitat specificity of different AOA groups [34,35], differentiating core and non-core groups within the AOA community is essential to better understand their role in ecosystem function. In this study, network analyses revealed that only a portion of the AOA community was closely linked to soil nitrification. Although 47 OTUs were detected in all treatments (Figure S1), only 22 OTUs had strong correlations (r > 0.7) with soil properties and potential nitrification rate (PNR). These results suggest that focusing solely on the entire AOA community may obscure the nuanced contributions of core OTUs to nitrification [36].
Fertilization notably altered the AOA community composition, with contrasting responses observed among specific phylogenetic clusters (Figure 1, Figure 3 and Figure 5). The relative abundance of Cluster G1 (including OTUs 21, 28, 35, and 65), affiliated with phylum Thaumarchaeota, and Cluster G2 (including OTUs 37 and 58), which remained unclassified, decreased significantly under fertilization (Figure S2). Both clusters were positively correlated with soil PNR (Figure S4), implying their promotive role in soil nitrification. In contrast, Clusters G4 and G5, including several OTUs such as 41, 42, and 64, showed increased abundance following fertilization. Most of these OTUs were assigned to the phylum Crenarchaeota and had negative correlations with soil PNR, implying a potential regulatory or inhibitory role in soil nitrification under nitrogen input.
Thaumarchaeota and Crenarchaeota differ in both their physiological traits and ecological responses. Crenarchaeota are generally associated with extreme and oligotrophic environments [37], whereas Thaumarchaeota show strong ecological adaptability, typically thriving in soils with moderate to high organic matter and a pH range of 5.5 to 8.5 [38,39]. The historical reclassification of non-thermophilic Thaumarchaeota from Crenarchaeota [40] demonstrates their phylogenetic diversity. Based on this diversity, the core AOA clusters examined in our study (Figure S2) showed contrasting physiological characteristics and ecological responses. For instance, in the Typical Black Soil Zone, Clusters G4 and G5 showed negative correlations with NH4+, suggesting low ammonia tolerance, whereas Clusters G1 and G2 were positively correlated with the C/N ratio and NH4+/NO3− ratio (Table 1).
In summary, these findings reveal the complex and contrasting roles of the AOA community in soil nitrification. The dual functionality highlights the importance of considering both the phylogenetic diversity and functional roles within the AOA community, offering a more nuanced understanding of its role in nitrogen cycling.
4.2. Enhanced Environmental Sensitivity of AOA Core Clusters
Due to the bidirectional regulatory roles of the AOA community, analyzing the community as a whole may obscure the distinct ecological responses of specific phylogenetic clusters [41,42,43]. In contrast, AOA core clusters showed more precise responses to fertilization and straw addition. At the Brown Soil Experimental Station, nitrogen fertilization significantly decreased the abundance of Cluster G1, while Clusters G4 and G5 increased under the same treatment. Straw addition further influenced these clusters, promoting Cluster G1 in unfertilized soils but inhibiting Clusters G4 and G5 in fertilized soils (Figure 3, p < 0.05). The varied responses can be attributed to differences in environmental adaptability and competition mechanisms among these clusters. Nitrogen fertilization typically prefers clusters that can efficiently utilize increased nitrogen levels [44].
Additionally, the distribution and abundance of AOA core clusters were strongly influenced by soil properties reflecting both resources competition and the varying physiological responses of individual clusters to specific environmental changes [45,46]. AOA phylogeny is highly variable, making it difficult to reach a consensus on functional phylotypes. The entire AOA amoA gene includes multiple phylogenetic clusters, some of which may have overlapping or redundant functions. This functional redundancy can reduce the response to environmental changes, whereas core clusters provide clearer results [47]. The responses of AOA core clusters to variations in soil properties, including SOC, C/N, NO3−, NH4+/NO3-, and pH, was more significant and evident than that of the AOA amoA (Figure 4A; Table S5). Across the Typical Black Soil Zone, Clusters G1 and G2 were positively correlated with C/N ratio, NH4+ and NH4+/NO3−, while Clusters G4 and G5 were negatively correlated with NH4+ and NH4+/NO3− but positively correlated with NO3− (p < 0.05). A similar pattern was observed with soil pH (Table 1), indicating the advantage of AOA core clusters in capturing more detailed soil dynamics [48,49]. The spatial heterogeneity across the 15 counties in this region further revealed the enhanced environmental sensitivity of these clusters under a more realistic agricultural system [26]. For example, Clusters G1 and G2 were most abundant in the acidic soils of Suiling, while Clusters G4 and G5 were more abundant in the neutral to alkaline soils of Yushu and Dehui (Figure 5). This pH-dependent distribution highlights the importance of understanding the environmental preferences of different AOA clusters, as these preferences can influence their ecological roles and contributions to soil nitrification under diverse soil conditions [48].
AOA core clusters demonstrated greater sensitivity to environmental changes than the AOA amoA, which includes multiple phylogenetic clusters that differ in ecological function [50,51]. Their distinctive responses to soil conditions enable a more accurate reflection of soil nitrification dynamics, emphasizing the potential of AOA core clusters as an effective tool for ecological monitoring and sustainable soil management in agricultural ecosystems [52,53].
4.3. AOA Core Clusters as Reliable Indicators of Soil Nitrification in Agricultural Soils
Although previous studies have demonstrated that AOA amoA abundance can reflect soil nitrification dynamics [54,55], our findings reveal that only a subset of core clusters within the AOA community has strong environmental sensitivity and functional relevance. These AOA core clusters showed significantly stronger correlations with, and greater contributions to, soil PNR than the abundance of AOA amoA gene (Figure 4 and Table 1; p < 0.05), suggesting that changes in specific phylogenetic groups may better reflect actual nitrification dynamics [34].
Specifically, regression analyses revealed that Clusters G1 and G2 showed significant positive correlations with soil PNR, and their prediction was stronger than that of AOA amoA, while clusters G4 and G5 showed negative correlations with soil PNR across both the Brown Soil Experimental Station and the Typical Black Soil Zone (Figure S4; p < 0.05). This suggests that Clusters G4 and G5 may be stress-tolerant populations that increase in abundance when the activity of Clusters G1 and G2 is suppressed under nitrogen stress. Although they increase under such conditions, their initially low abundance (1–2 orders of magnitude lower than G1 and G2) is insufficient to compensate for the overall decline in PNR (Figure 3). This pattern is consistent with previous studies showing that low-abundance taxa can be activated under stress but have limited functional contribution functionally [56,57]. These results highlight the functional diversity of the AOA community and the advantage of core clusters in predicting soil nitrification dynamics. Such functional diversity has been demonstrated, as phylogenetically distinct AOA clusters respond differently to nitrogen availability, pH, and other environmental factors [14,51].
Further supporting this perspective, we observed that AOA amoA abundance failed to capture spatial variations of soil PNR at the regional scale. For example, in Yushu and Dehui, although AOA AOA abundance was high, soil PNR remained low. In contrast, the spatial distribution of AOA core clusters corresponded closely with regional differences in nitrification dynamics: Clusters G1 and G2 were associated with high PNR sites, while G4 and G5 were dominant in sites where nitrification was inhibited (Figure 5 and Figure 6). Notably, this distinction of AOA core clusters is closely linked to their phylogenetic and ecological differentiation. This pattern suggests that the functional traits of AOA core clusters are not randomly distributed, enhancing their reliability and stability as indicators of nitrification dynamics [58].
Microbial indicators in agricultural ecosystems have received increasing attention, particularly for their potential to reflect nutrient cycling processes and support sustainable soil management [59]. Our results demonstrate that core clusters provide more precise insights into soil nitrification than the overall AOA amoA abundance. This has practical implications for nitrogen management in the black soil region, where excessive nitrogen fertilization can lead to reduced nitrogen use efficiency and environmental pollution. Monitoring the dynamics of core clusters (e.g., the decline in Clusters G1 and G2 and the increase in Clusters G4 and G5 under nitrogen input) could act as an early warning indicator of soil nitrification inhibition, thereby supporting timely adjustments to fertilization strategies. While further validation across broader soil types and management regimes is needed, our findings suggest that AOA core clusters have potential as ecological indicators for sustainable nitrogen management in Northeast China.
5. Conclusions
Our findings highlight the importance of distinguishing core clusters within the AOA community to more accurately reflect and predict soil nitrification processes in agricultural systems. Although the overall AOA community and its abundance provided limited insight into nitrification dynamics, especially in response to spatial environmental variations, AOA core clusters exhibited clear bidirectional regulatory roles. This functional divergence was consistent with their phylogenetic affiliations: Clusters G1 and G2 were associated with enhanced nitrification, whereas Clusters G4 and G5 played the opposite role. Moreover, AOA core clusters showed greater environmental sensitivity. They responded more precisely to fertilization and straw addition, and more effectively captured regional differences in soil potential nitrification rates. Taken together, our findings suggest that AOA core clusters are phylogenetically conserved, functionally relevant, and environmentally sensitive, making them accurate and reliable microbial indicators in the Northeast China Black Soil Region. Monitoring these core clusters could provide farmers and soil managers with timely information to optimize nitrogen application, minimize environmental impacts, and support sustainable agricultural practices.
Supplementary Materials
The following supporting information can be downloaded at: https://www.mdpi.com/article/10.3390/agronomy15092064/s1, Figure S1: Flower plot of AOA community; Figure S2: Neighbor-joining dendrogram derived from the AOA core clusters (with 1000 bootstrap replications). G1, G2, G3, G4, and G5 represent different clusters within the AOA core clusters; Figure S3: Quantification of AOA amoA in different treatments. Uppercase and lowercase letters represent significant differences between fertilization treatments without and with straw, respectively (p < 0.05). “*” indicates significant differences between straw samples (p < 0.05); Figure S4: Linear regression analysis between the abundance of AOA communities and soil potential nitrification rate (PNR). A-C: Data from the Brown Soil Experimental Station. D-F: Data from the Typical Black Soil Zone. A, D: Relationship between the abundance of G1 and G2 and soil PNR. B, E: Relationship between the abundance of G4 and G5 and soil PNR. C, F: Relationship between AOA amoA abundance and soil PNR. The orange line and the blue line represent positive correlation and negative correlation, respectively. Table S1: Soil properties and potential nitrification rate in Experimental Station and Typical Black Soil Zone; Table S2: Indices of network; Table S3: Significant network edge correlations (p < 0.05). SOC: soil organic carbon; TN: total nitrogen; NO3−: nitrate nitrogen; C/N: the ratio of SOC to TN; NH4+/NO3−: the ratio of ammonia nitrogen to nitrate nitrogen. - indicate non-significant (p ≥ 0.05) or weak (|r| ≤ 0.7) correlations; Table S4: Properties and specific targets of the newly designed primer sets developed in this study for quantitative PCR; Table S5: Mantel test analysis of potential nitrification rate and soil properties with AOA amoA and AOA core clusters. SOC: soil organic carbon; TN: total nitrogen; NH4+: ammonia nitrogen; NO3−: nitrate nitrogen; C/N: the ratio of SOC to TN; NH4+/NO3−: the ratio of ammonia nitrogen to nitrate nitrogen. P-adjust: adjusted p-values (FDR) for multiple comparisons.
Author Contributions
F.W.: Writing–original draft, Writing–review and editing, Formal Analysis, Investigation. L.L.: Writing—review and editing, Methodology, Supervision, Funding acquisition. W.Z.: Resources, Investigation. K.W.: Writing—review and editing. B.G.: Investigation. T.A.: Methodology. S.L.: Resources. X.G.: Funding acquisition. J.W.: Funding acquisition, Supervision. All authors have read and agreed to the published version of the manuscript.
Funding
This work was supported by the National Key Research and Development Program [Grant numbers 2024YFD1501302]; the National Natural Science Foundation of China [Grant numbers 42277321]; the National Key Research and Development Program Young Scientist Project [Grant numbers 2023YFD1501700]; and the China Scholarship Council Visiting Scholar Program [Grant number CSC202308210384].
Data Availability Statement
Data will be made available on request.
Acknowledgments
Feng Wang was thankful to China Scholarship Council for the financial support (No. CSC202308210384) from the visiting scholar program.
Conflicts of Interest
The authors declare that they have no known competing financial interests or personal relationships that could have appeared to influence the work reported in this paper.
References
- FAO. Global Status of Black Soils; FAO: Rome, Italy, 2022. [Google Scholar]
- Wang, W.; Deng, X.; Yue, H. Black soil conservation will boost China’s grain supply and reduce agricultural greenhouse gas emissions in the future. Environ. Impact Assess. Rev. 2024, 106, 107482. [Google Scholar] [CrossRef]
- Xue, P.; Pei, J.; Ma, N.; Wang, J. Microbial Residual Nitrogen Distribution in Brown Earth’s Aggregates as Affected by Different Maize Residues and Soil Fertility Levels. Front. Environ. Sci. 2022, 10, 892039. [Google Scholar] [CrossRef]
- Xu, X.Z.; Xu, Y.; Chen, S.C.; Xu, S.G.; Zhang, H.W. Soil loss and conservation in the black soil region of Northeast China: A retrospective study. Environ. Sci. Policy 2010, 13, 793–800. [Google Scholar] [CrossRef]
- Qiu, B.; Jian, Z.; Yang, P.; Tang, Z.; Zhu, X.; Duan, M.; Yu, Q.; Chen, X.; Zhang, M.; Tu, P.; et al. Unveiling grain production patterns in China (2005–2020) towards targeted sustainable intensification. Agric. Syst. 2024, 216, 103878. [Google Scholar] [CrossRef]
- Kopittke, P.M.; Menzies, N.W.; Wang, P.; McKenna, B.A.; Lombi, E. Soil and the intensification of agriculture for global food security. Environ. Int. 2019, 132, 105078. [Google Scholar] [CrossRef] [PubMed]
- Wang, F.; Liang, X.; Ding, F.; Ren, L.; Liang, M.; An, T.; Li, S.; Wang, J.; Liu, L. The active functional microbes contribute differently to soil nitrification and denitrification potential under long-term fertilizer regimes in North-East China. Front. Microbiol. 2022, 13, 1021080. [Google Scholar] [CrossRef] [PubMed]
- Zhang, X.; Guo, J.; Vogt, R.D.; Mulder, J.; Wang, Y.; Qian, C.; Wang, J.; Zhang, X. Soil acidification as an additional driver to organic carbon accumulation in major Chinese croplands. Geoderma 2020, 366, 114234. [Google Scholar] [CrossRef]
- Beeckman, F.; Motte, H.; Beeckman, T. Nitrification in agricultural soils: Impact, actors and mitigation. Curr. Opin. Biotechnol. 2018, 50, 166–173. [Google Scholar] [CrossRef] [PubMed]
- Norton, J.; Ouyang, Y. Controls and Adaptive Management of Nitrification in Agricultural Soils. Front. Microbiol. 2019, 10, 1931. [Google Scholar] [CrossRef]
- Wang, F.; Liang, X.; Ma, S.; Liu, L.; Wang, J. Ammonia-oxidizing archaea are dominant over comammox in soil nitrification under long-term nitrogen fertilization. J. Soils Sediments 2021, 21, 1800–1814. [Google Scholar] [CrossRef]
- Kuypers, M.M.M.; Marchant, H.K.; Kartal, B. The microbial nitrogen-cycling network. Nat. Rev. Microbiol. 2018, 16, 263–276. [Google Scholar] [CrossRef]
- Li, C.; Hu, H.W.; Chen, Q.L.; Chen, D.; He, J.Z. Comammox Nitrospira play an active role in nitrification of agricultural soils amended with nitrogen fertilizers. Soil Biol. Biochem. 2019, 138, 107609. [Google Scholar] [CrossRef]
- Hatzenpichler, R. Diversity, physiology, and niche differentiation of ammonia-oxidizing archaea. Appl. Environ. Microbiol. 2012, 78, 7501–7510. [Google Scholar] [CrossRef] [PubMed]
- Kim, J.G.; Jung, M.Y.; Park, S.J.; Rijpstra, W.I.; Sinninghe Damste, J.S.; Madsen, E.L.; Min, D.; Kim, J.S.; Kim, G.J.; Rhee, S.K. Cultivation of a highly enriched ammonia-oxidizing archaeon of thaumarchaeotal group I.1b from an agricultural soil. Environ. Microbiol. 2012, 14, 1528–1543. [Google Scholar] [CrossRef] [PubMed]
- Lehtovirta-Morley, L.E.; Sayavedra-Soto, L.A.; Gallois, N.; Schouten, S.; Stein, L.Y.; Prosser, J.I.; Nicol, G.W. Identifying Potential Mechanisms Enabling Acidophily in the Ammonia-Oxidizing Archaeon “Candidatus Nitrosotalea devanaterra”. Appl. Environ. Microbiol. 2016, 82, 2608–2619. [Google Scholar] [CrossRef] [PubMed]
- Wang, B.; Zheng, Y.; Huang, R.; Zhou, X.; Wang, D.; He, Y.; Jia, Z. Active ammonia oxidizers in an acidic soil are phylogenetically closely related to neutrophilic archaeon. Appl. Environ. Microbiol. 2014, 80, 1684–1691. [Google Scholar] [CrossRef]
- Fan, X.Y.; Gao, J.F.; Pan, K.L.; Li, D.C.; Dai, H.H.; Li, X. Temporal heterogeneity and temperature response of active ammonia-oxidizing microorganisms in winter in full-scale wastewater treatment plants. Chem. Eng. J. 2019, 360, 1542–1552. [Google Scholar] [CrossRef]
- Hatzenpichler, R.; Lebedeva, E.V.; Spieck, E.; Stoecker, K.; Richter, A.; Daims, H.; Wagner, M. A moderately thermophilic ammonia-oxidizing crenarchaeote from a hot spring. Proc. Natl. Acad. Sci. USA 2008, 105, 2134–2139. [Google Scholar] [CrossRef]
- Martens-Habbena, W.; Berube, P.M.; Urakawa, H.; de la Torre, J.R.; Stahl, D.A. Ammonia oxidation kinetics determine niche separation of nitrifying Archaea and Bacteria. Nature 2009, 461, 976–979. [Google Scholar] [CrossRef]
- Ren, B.; Wang, W.; Shen, L.; Yang, W.; Yang, Y.; Jin, J.; Geng, C. Nitrogen fertilization rate affects communities of ammonia-oxidizing archaea and bacteria in paddy soils across different climatic zones of China. Sci. Total Environ. 2023, 902, 166089. [Google Scholar] [CrossRef]
- Cai, F.; Luo, P.; Yang, J.; Irfan, M.; Zhang, S.; An, N.; Dai, J.; Han, X. Effect of Long-Term Fertilization on Ammonia-Oxidizing Microorganisms and Nitrification in Brown Soil of Northeast China. Front. Microbiol. 2020, 11, 622454. [Google Scholar] [CrossRef]
- Qiao, Y.; Wang, Z.; Sun, H.; Guo, H.; Song, Y.; Zhang, H.; Ruan, Y.; Xu, Q.; Huang, Q.; Shen, Q.; et al. Synthetic community derived from grafted watermelon rhizosphere provides protection for ungrafted watermelon against Fusarium oxysporum via microbial synergistic effects. Microbiome 2024, 12, 101. [Google Scholar] [CrossRef] [PubMed]
- Soil Survey Staff of the United States. Soil Taxonomy: A Basic System of Soil Classification for Making and Interpreting Soil Surveys, 2nd ed.; For sale by the Superintendent of Documents; U.S. Department of Agriculture: Washington, DC, USA, 1999; p. 436.
- Bastian, F.; Bouziri, L.; Nicolardot, B.; Ranjard, L. Impact of wheat straw decomposition on successional patterns of soil microbial community structure. Soil Biol. Biochem. 2009, 41, 262–275. [Google Scholar] [CrossRef]
- Zhang, W.; Munkholm, L.J.; An, T.; Liu, X.; Zhang, B.; Xu, Y.; Ge, Z.; Zhang, Y.; Zhang, J.; Li, S.; et al. Influence of environmental factors on soil organic carbon in different soil layers for Chinese Mollisols under intensive maize cropping. Sci. Total Environ. 2022, 835, 155443. [Google Scholar] [CrossRef] [PubMed]
- Edgar, R.C. UPARSE: Highly accurate OTU sequences from microbial amplicon reads. Nat. Methods 2013, 10, 996–998. [Google Scholar] [CrossRef]
- Sun, S.; Wang, Y.; Chen, S.; Li, Z.; Zhao, C.; Liu, Q.; Zhang, X. Functionality, characterization and DEGs contribution by engineering isolate Pseudomonas P1 to elucidate the regulation mechanisms of p-chlorophenol-4-Chloroaniline bioremediation. Chem. Eng. J. 2023, 468, 143798. [Google Scholar] [CrossRef]
- Kumar, S.; Stecher, G.; Li, M.; Knyaz, C.; Tamura, K. MEGA X: Molecular Evolutionary Genetics Analysis across Computing Platforms. Mol. Biol. Evol. 2018, 35, 1547–1549. [Google Scholar] [CrossRef]
- Lalitha, S. Primer Premier 5. Biotech Softw. Internet Rep. 2000, 1, 270–272. [Google Scholar] [CrossRef]
- Madeira, F.; Madhusoodanan, N.; Lee, J.; Eusebi, A.; Niewielska, A.; Tivey, A.R.N.; Lopez, R.; Butcher, S. The EMBL-EBI Job Dispatcher sequence analysis tools framework in 2024. Nucleic Acids Res. 2024, 52, W521–W525. [Google Scholar] [CrossRef]
- Huang, H. LinkET: Everything is Linkable. 2021. Available online: https://github.com/Hy4m/linkET (accessed on 29 May 2023).
- Jung, M.Y.; Sedlacek, C.J.; Kits, K.D.; Mueller, A.J.; Rhee, S.K.; Hink, L.; Nicol, G.W.; Bayer, B.; Lehtovirta-Morley, L.; Wright, C.; et al. Ammonia-oxidizing archaea possess a wide range of cellular ammonia affinities. ISME J. 2022, 16, 272–283. [Google Scholar] [CrossRef]
- Alves, R.J.E.; Minh, B.Q.; Urich, T.; von Haeseler, A.; Schleper, C. Unifying the global phylogeny and environmental distribution of ammonia-oxidising archaea based on amoA genes. Nat. Commun. 2018, 9, 1517. [Google Scholar] [CrossRef]
- Zhang, M.; Alves, R.J.E.; Zhang, D.; Han, L.; He, J.; Zhang, L. Time-dependent shifts in populations and activity of bacterial and archaeal ammonia oxidizers in response to liming in acidic soils. Soil Biol. Biochem. 2017, 112, 77–89. [Google Scholar] [CrossRef]
- Cheung, S.; Mak, W.; Xia, X.; Lu, Y.; Cheung, Y.; Liu, H. Overlooked Genetic Diversity of Ammonia Oxidizing Archaea Lineages in the Global Oceans. JGR Biogeosci. 2019, 124, 1799–1811. [Google Scholar] [CrossRef]
- Bandopadhyay, S.; Shade, A. Chapter 3—Soil bacteria and archaea. In Soil Microbiology, Ecology and Biochemistry, 5th ed.; Paul, E.A., Frey, S.D., Eds.; Elsevier: Amsterdam, The Netherlands, 2024; pp. 41–74. [Google Scholar]
- Horz, H.P.; Rotthauwe, J.H.; Lukow, T.; Liesack, W. Identification of major subgroups of ammonia-oxidizing bacteria in environmental samples by T-RFLP analysis of amoA PCR products. J. Microbiol. Methods 2000, 39, 197–204. [Google Scholar] [CrossRef] [PubMed]
- Oton, E.V.; Quince, C.; Nicol, G.W.; Prosser, J.I.; Gubry-Rangin, C. Phylogenetic congruence and ecological coherence in terrestrial Thaumarchaeota. ISME J. 2016, 10, 85–96. [Google Scholar] [CrossRef] [PubMed]
- Brochier-Armanet, C.; Boussau, B.; Gribaldo, S.; Forterre, P. Mesophilic crenarchaeota: Proposal for a third archaeal phylum, the Thaumarchaeota. Nat. Rev. Microbiol. 2008, 6, 245–252. [Google Scholar] [CrossRef] [PubMed]
- Ding, J.; Ma, M.; Jiang, X.; Liu, Y.; Zhang, J.; Suo, L.; Wang, L.; Wei, D.; Li, J. Effects of applying inorganic fertilizer and organic manure for 35 years on the structure and diversity of ammonia-oxidizing archaea communities in a Chinese Mollisols field. Microbiologyopen 2020, 9, e00942. [Google Scholar] [CrossRef]
- Xi, R.; Long, X.E.; Huang, S.; Yao, H. pH rather than nitrification and urease inhibitors determines the community of ammonia oxidizers in a vegetable soil. AMB Express 2017, 7, 129. [Google Scholar] [CrossRef]
- Zhao, J.; Wang, B.; Zhou, X.; Alam, M.S.; Fan, J.; Guo, Z.; Zhang, H.; Gubry-Rangin, C.; Zhongjun, J. Long-Term Adaptation of Acidophilic Archaeal Ammonia Oxidisers Following Different Soil Fertilisation Histories. Microb. Ecol. 2022, 83, 424–435. [Google Scholar] [CrossRef]
- Wang, Z.; Li, Y.; Zheng, W.; Ji, Y.; Duan, M.; Ma, L. Ammonia oxidizing archaea and bacteria respond to different manure application rates during organic vegetable cultivation in Northwest China. Sci. Rep. 2023, 13, 8064. [Google Scholar] [CrossRef]
- Aigle, A.; Prosser, J.I.; Gubry-Rangin, C. The application of high-throughput sequencing technology to analysis of amoA phylogeny and environmental niche specialisation of terrestrial bacterial ammonia-oxidisers. Environ. Microbiome 2019, 14, 3. [Google Scholar] [CrossRef] [PubMed]
- Li, Q.; Cheng, X.; Liu, X.; Gao, P.; Wang, H.; Su, C.; Huang, Q. Ammonia-oxidizing archaea adapted better to the dark, alkaline oligotrophic karst cave than their bacterial counterparts. Front. Microbiol. 2024, 15, 1377721. [Google Scholar] [CrossRef]
- Wu, R.N.; Meng, H.; Wang, Y.F.; Lan, W.; Gu, J.D. A More Comprehensive Community of Ammonia-Oxidizing Archaea (AOA) Revealed by Genomic DNA and RNA Analyses of amoA Gene in Subtropical Acidic Forest Soils. Microb. Ecol. 2017, 74, 91–922. [Google Scholar] [CrossRef] [PubMed]
- Hu, H.; Zhang, L.; Dai, Y.; Di, H.J.; He, J.Z. pH-dependent distribution of soil ammonia oxidizers across a large geographical scale as revealed by high-throughput pyrosequencing. J. Soils Sediments 2013, 13, 1439–1449. [Google Scholar] [CrossRef]
- Yang, Y.; Liu, H.; Zhang, Y.; Fang, X.; Zhong, X.; Lv, J. Contribution of ammonia-oxidizing archaea and bacteria to nitrogen transformation in a soil fertilized with urea and organic amendments. Sci. Rep. 2023, 13, 20722. [Google Scholar] [CrossRef]
- Fudjoe, S.K.; Li, L.; Jiang, Y.; Karikari, B.; Xie, J.; Wang, L.; Anwar, S.; Wang, J. Soil Amendments Alter Ammonia-Oxidizing Archaea and Bacteria Communities in Rain-Fed Maize Field in Semi-Arid Loess Plateau. Land 2021, 10, 1039. [Google Scholar] [CrossRef]
- Zheng, J.; Tao, L.; Dini-Andreote, F.; Luan, L.; Kong, P.; Xue, J.; Zhu, G.; Xu, Q.; Jiang, Y. Dynamic Responses of Ammonia-Oxidizing Archaea and Bacteria Populations to Organic Material Amendments Affect Soil Nitrification and Nitrogen Use Efficiency. Front. Microbiol. 2022, 13, 911799. [Google Scholar] [CrossRef]
- Bastida, F.; Eldridge, D.J.; Garcia, C.; Kenny Png, G.; Bardgett, R.D.; Delgado-Baquerizo, M. Soil microbial diversity-biomass relationships are driven by soil carbon content across global biomes. ISME J. 2021, 15, 2081–2091. [Google Scholar] [CrossRef]
- Pester, M.; Rattei, T.; Flechl, S.; Grongroft, A.; Richter, A.; Overmann, J.; Reinhold-Hurek, B.; Loy, A.; Wagner, M. amoA-based consensus phylogeny of ammonia-oxidizing archaea and deep sequencing of amoA genes from soils of four different geographic regions. Environ. Microbiol. 2012, 14, 525–539. [Google Scholar] [CrossRef]
- Liu, Y.; Chen, Y.; Penttinen, P.; Chen, X.; Duan, P.; Fan, F.; Xiong, W.; Liu, M.; Tang, X.; Peng, D.; et al. Both AOA and AOB contribute to nitrification and show linear correlation with nitrate leaching in purple soils with a wide nitrogen gradient. Environ. Res. 2025, 264, 120403. [Google Scholar] [CrossRef]
- Ye, H.; Tang, C.; Cao, Y.; Li, X.; Huang, P. Contribution of ammonia-oxidizing archaea and bacteria to nitrification under different biogeochemical factors in acidic soils. Environ. Sci. Pollut. Res. Int. 2022, 29, 17209–17222. [Google Scholar] [CrossRef]
- Astudillo-García, C.; Bell, J.J.; Webster, N.S.; Glasl, B.; Jompa, J.; Montoya, J.M.; Taylor, M.W. Evaluating the core microbiota in complex communities: A systematic investigation. Environ. Microbiol. 2017, 19, 1450–1462. [Google Scholar] [CrossRef] [PubMed]
- Shade, A.; Peter, H.; Allison, S.D.; Baho, D.L.; Berga, M.; Bürgmann, H.; Huber, D.H.; Langenheder, S.; Lennon, J.T.; Martiny, J.B.H.; et al. Fundamentals of microbial community resistance and resilience. Front. Microbiol. 2012, 3, 417. [Google Scholar] [CrossRef]
- Martiny, A.C.; Treseder, K.; Pusch, G. Phylogenetic conservatism of functional traits in microorganisms. ISME J. 2013, 7, 830–838. [Google Scholar] [CrossRef] [PubMed]
- Cusset, E.; Bennegadi-Laurent, N.; Recous, S.; Bernard, P.-Y.; Perrin, A.-S.; Tscheiller, R.; Trinsoutrot-Gattin, I.; Riah-Anglet, W. Which soil microbial indicators should be included in routine laboratory tests to support the transition to sustainable management of arable farming systems? A meta-analysis. Ecol. Indic. 2024, 167, 112706. [Google Scholar] [CrossRef]
Disclaimer/Publisher’s Note: The statements, opinions and data contained in all publications are solely those of the individual author(s) and contributor(s) and not of MDPI and/or the editor(s). MDPI and/or the editor(s) disclaim responsibility for any injury to people or property resulting from any ideas, methods, instructions or products referred to in the content. |
© 2025 by the authors. Licensee MDPI, Basel, Switzerland. This article is an open access article distributed under the terms and conditions of the Creative Commons Attribution (CC BY) license (https://creativecommons.org/licenses/by/4.0/).

