Article

Genetic Dissection of Hypocotyl Elongation Responses to Light Quality in Brassica napus

1
Institute of Crop Science, Zhejiang Key Laboratory of Crop Germplasm Innovation and Utilization, Zhejiang University, Hangzhou 310058, China
2
Zhongyuan Institute, Zhejiang University, Zhengzhou 450000, China
*
Authors to whom correspondence should be addressed.
Agronomy 2025, 15(9), 2047; https://doi.org/10.3390/agronomy15092047
Submission received: 20 July 2025 / Revised: 20 August 2025 / Accepted: 24 August 2025 / Published: 26 August 2025
(This article belongs to the Section Crop Breeding and Genetics)

Abstract

In Brassica napus, hypocotyl elongation under shade conditions poses a significant challenge in intensive agricultural systems, particularly in rice-rapeseed rotation regimes where straw mulching reduces light quality. However, the genetic basis of light-mediated hypocotyl growth responses in B. napus remains poorly understood. In this study, hypocotyl lengths were measured in a panel of 267 diverse rapeseed accessions under five light conditions including white, red, far-red, blue light, and complete darkness. Substantial phenotypic variation was observed among accessions and treatments, with red light exhibiting the weakest inhibitory effect on elongation, and white light showing the strongest suppression. Genome-wide association studies (GWAS) (−log10 (p) > 4.5) identified numerous significant SNPs associated with light response, highlighting candidate genes such as KAN1, ILL2, VQ18, HDA15, and HAT3 involved in photomorphogenesis and hormonal signaling pathways. These findings elucidate the polygenic control of light responsiveness in B. napus and provide molecular targets for breeding shade-tolerant varieties to enhance crop resilience under dense planting and straw mulching systems.

1. Introduction

Rapeseed (Brassica napus L.) is a globally important oilseed crop and ranks as the second-largest source of edible vegetable oil worldwide [1]. In the lower reaches of the Yangtze River of China, the rice-rapeseed rotation system is extensively practiced to improve land-use efficiency. However, residual rice stubble on the soil surface forms a straw mulch layer that imposes shade stress. Acting as an optical filter, the straw mulch substantially lowers the red-to-far-red (R:FR) light ratio, thereby activating shade avoidance syndrome (SAS) in rapeseed seedlings [2]. This light-quality-mediated response is characterized by excessive stem elongation, reduced mechanical strength, diminished lodging resistance, and impaired seedling establishment, collectively constituting a key physiological constraint on yield stability in this agroecosystem. Understanding the molecular and genetic mechanisms underlying SAS and low-light adaptation in rapeseed is thus critical for improving crop resilience and productivity under dense planting and rotation regimes.
Light is a fundamental regulator of plant growth and development, mediating both photosynthesis and photomorphogenic responses. To perceive and adapt to their light environment, plants have evolved sophisticated sensory mechanisms capable of detecting light intensity, duration, and spectral composition [3]. Hypocotyl elongation serves as a central phenotypic indicator of light quality and intensity. Under darkness, accelerated hypocotyl elongation facilitates seedling emergence toward light sources, whereas exposure to light suppresses hypocotyl elongation, preventing excessive stem growth and reducing the risk of lodging [4,5,6,7,8]. In agricultural systems, high-density planting and canopy shading reduce both the R:FR ratio and photosynthetically active radiation (PAR), thereby diminishing phytochrome activity and triggering SAS [9]. SAS is characterized by enhanced stem elongation, suppressed leaf expansion, reduced branching, and accelerated flowering, with photoassimilates diverted away from reproductive development and defense metabolism toward vertical growth. Collectively, these changes compromise biomass partitioning and significantly reduce crop yield potential [10,11,12,13,14].
It is important to note that increased far-red light within the spectral distribution does not universally impair plant growth and development. In some species and cultivation contexts, far-red light can promote biomass accumulation, leaf expansion, or reproductive success [15]. These contrasting outcomes reflect species-specific and environment-dependent light signaling mechanisms. Therefore, while our study focuses on the inhibitory roles of far-red light in B. napus seedlings, the broader literature indicates that far-red light can elicit both beneficial and detrimental effects, underscoring the need for balanced interpretation when extrapolating across species.
At the molecular level, phytochromes perceive red and far-red light through covalently bound chromophores, which mediate reversible photoconversion between the red light-absorbing (Pr) and far-red light-absorbing (Pfr) conformers. This photoreversibility directly regulates transcriptional networks governing plant developmental plasticity and resource allocation [16,17,18]. In Arabidopsis, phytochromes comprise two classes: PhyI (phyA) and PhyII (phyB, phyC, phyD, phyE), with phyA functioning primarily as a far-red light sensor, while phyB-phyE mediate red light responses. Notably, phyA accumulates in darkness but undergoes rapid degradation upon light exposure, whereas phyB-phyE proteins remain relatively stable under illumination [4,19]. Red light induces the formation of the active Pfr form, which is translocated into the nucleus and interacts with phytochrome-interacting factors (PIFs), modulating the expression of photoresponsive genes [20,21]. Red light rapidly stimulates cytoplasmic motility and ion fluxes, likely through phytochrome-mediated activation of plasma membrane proton pumps. This alters membrane potential, modulating K+ channel activity and intracellular Ca2+ levels. Cytosolic Pfr phytochromes may concurrently regulate mRNA translation [22]. PIFs promote hypocotyl elongation by activating genes involved in auxin biosynthesis and signaling (e.g., YUC8, YUC9, IAA19, IAA29, SAUR36), as well as those related to cell wall remodeling (e.g., XTHs, PMEs) [23,24]. Multiple hormonal pathways, including abscisic acid (promoting photomorphogenesis) and gibberellins, brassinosteroids, ethylene, and auxin (driving skotomorphogenesis), converge on the central transcriptional regulator HY5 to coordinate light-mediated developmental processes [25,26].
Although light signaling and response have been extensively studied in model species such as Arabidopsis, the genetic basis and natural variation underlying light responses in B. napus remain largely unexplored. Hypocotyl elongation, a critical trait for normal seedling establishment in rapeseed [27], is a hallmark of light response. To dissect the genetic basis of light response, we measured the hypocotyl length in a diverse panel of 267 rapeseed accessions under a series of multispectral light treatments, including white, red, far-red, blue, and complete darkness. Genome-wide association studies (GWAS) were performed by integrating these phenotypic data with 1,381,589 SNPs derived from genome-wide resequencing [28]. The objectives of this study were (1) to elucidate the genetic architecture regulating hypocotyl elongation under varying light conditions; (2) to identify germplasm exhibiting attenuated light responsiveness (i.e., reduced SAS); and (3) to pinpoint key candidate genes involved in the regulation of shade avoidance, thereby providing molecular targets for the genetic improvement of shade tolerance in rapeseed.

2. Materials and Methods

2.1. Plant Materials

A diverse panel of 267 B. napus accessions was obtained from the laboratory of Professor Jiang Lixi at Zhejiang University. These accessions have been previously genotyped for 1,381,589 single-nucleotide polymorphisms (SNPs) via whole-genome resequencing [28]. Phylogenetic, population structure analyses, and principal component analysis (PCA) refer to a previous study [28].

2.2. Plant Growth and Measurements of Hypocotyl Length

Seeds were sown in a 2:1 mixture of nutrient soil and vermiculite in 5 cm × 5 cm pots, with 3–5 biological replicates per cultivar per treatment, initial experiments included five replicates, but up to two replicates per condition were excluded due to non-experimental factors. The plants were grown in growth chambers under a 14 h light/10 h dark photoperiod at 22 ± 1 °C and 60% relative humidity. Five light treatments were applied: darkness (control), white light (100 µmol m−2 s−1), red light (660 nm, 30 µmol m−2 s−1), far-red light (730 nm, 15 µmol m−2 s−1), and blue light (460 nm, 30 µmol m−2 s−1).
The hypocotyl length of all materials was measured and recorded after 7 days of exposure to different light quality treatments.

2.3. GWAS Analysis

The relative hypocotyl lengths of white light/dark (W/D), blue light/dark (B/D), red light/dark (R/D), and far-red light/dark (FR/D) were used as phenotypic data. We conduct GWAS on the BnaGWAS website (https://bnapus-zju.com/gwas/, accessed on 1 June 2025). A total of 1,381,589 SNPs (MAF > 0.05, missing rates < 0.5) among the 267 core accessions were extracted and used for GWAS performed using EMMAX model. The degree of kinship was determined by emmax-kin-intel64 calculation. Significant associations were identified at -log10 (p) > 4.5, with candidate genes defined as those within 70kb flanking regions of significant loci [28,29,30]. To assess the robustness of the GWAS results, quantile–quantile (Q-Q) plots were generated for each light condition. Manhattan and Q-Q plots were generated using the R package CMplot v4.5.1 (https://github.com/YinLiLin/CMplot, accessed on 1 June 2025).

2.4. Linkage Disequilibrium Analysis and Haplotype Analysis

The LD heatmap was generated with LDBlockShow v1.4.0 [31]. The DNA sequences of transcript and promoter (2 kb) region for genes were extracted from 267 rapeseed accessions using VCFtools (https://vcftools.github.io/, accessed on 20 June 2025) [32].

2.5. Statistical Analysis

Statistical differences between data sets were evaluated using Student’s t-test and one-way analysis of variance (ANOVA).

3. Results

3.1. Phenotypic Variation in Hypocotyl Length Among 267 Rapeseed Accessions Exposed to Divergent Light Qualities

To investigate the response of rapeseed seedlings to different light qualities, we measured the hypocotyl length in a panel of 267 accessions after 7 days of exposure to distinct light conditions, including white, red, far-red, and blue light and darkness (Table S1). To normalize for inherent variation in hypocotyl length across accessions, relative hypocotyl length was calculated as the ratio of hypocotyl length under each light treatment to that measured in darkness (W/D, R/D, FR/D, B/D) (Figure 1). As shown in Figure 1A–D, the distribution of relative hypocotyl lengths varied significantly among the light treatments. Relative hypocotyl length values were the lowest under white light, with the majority of accessions exhibiting ratios between 0.07 and 0.47 (the average value is 0.21 ± 0.07), indicating strong inhibition of hypocotyl elongation (Figure 1A). In contrast, red light induced the weakest inhibition, with most R/D values ranging from 0.22 to 1.06 (the average value is 0.60 ± 0.12) (Figure 1B). Far-red and blue light exerted moderate inhibitory effects, with FR/D and B/D values ranging from 0.20 to 0.68 (the average value is 0.40 ± 0.08) and 0.24 to 0.94 (the average value is 0.49 ± 0.10), respectively (Figure 1C,D). Quantitative analysis further confirmed that hypocotyl elongation was most strongly inhibited under white light (median in W/D: 0.196), and least inhibited under red light (median in R/D: 0.588) (Figure 1E). Notably, a high correlation was detected between relative hypocotyl lengths under white and red light (r = 0.62) (Figure 1F), indicating that accessions with longer hypocotyls under white light also tended to exhibit elongation under red light.
Based on relative hypocotyl length, we identified both light-sensitive and light-insensitive accessions. As shown in Figure 2, accessions in cluster 2 (light-sensitive phenotypes) exhibited strong inhibition of hypocotyl elongation across all light treatments. In contrast, accessions in cluster 1 (light-insensitive phenotypes) showed minimal inhibition under most light conditions. However, certain exceptions were noted, such as R4955, R4268, and R4592, which exhibited strong inhibition specifically under far-red light.

3.2. Genome-Wide Association Analysis of Relative Hypocotyl Length Under Different Light Qualities

To elucidate the genetic basis underlying light-mediated inhibition of hypocotyl elongation in B. napus, we performed a genome-wide association study (GWAS) of relative hypocotyl length using the EMMAX model.
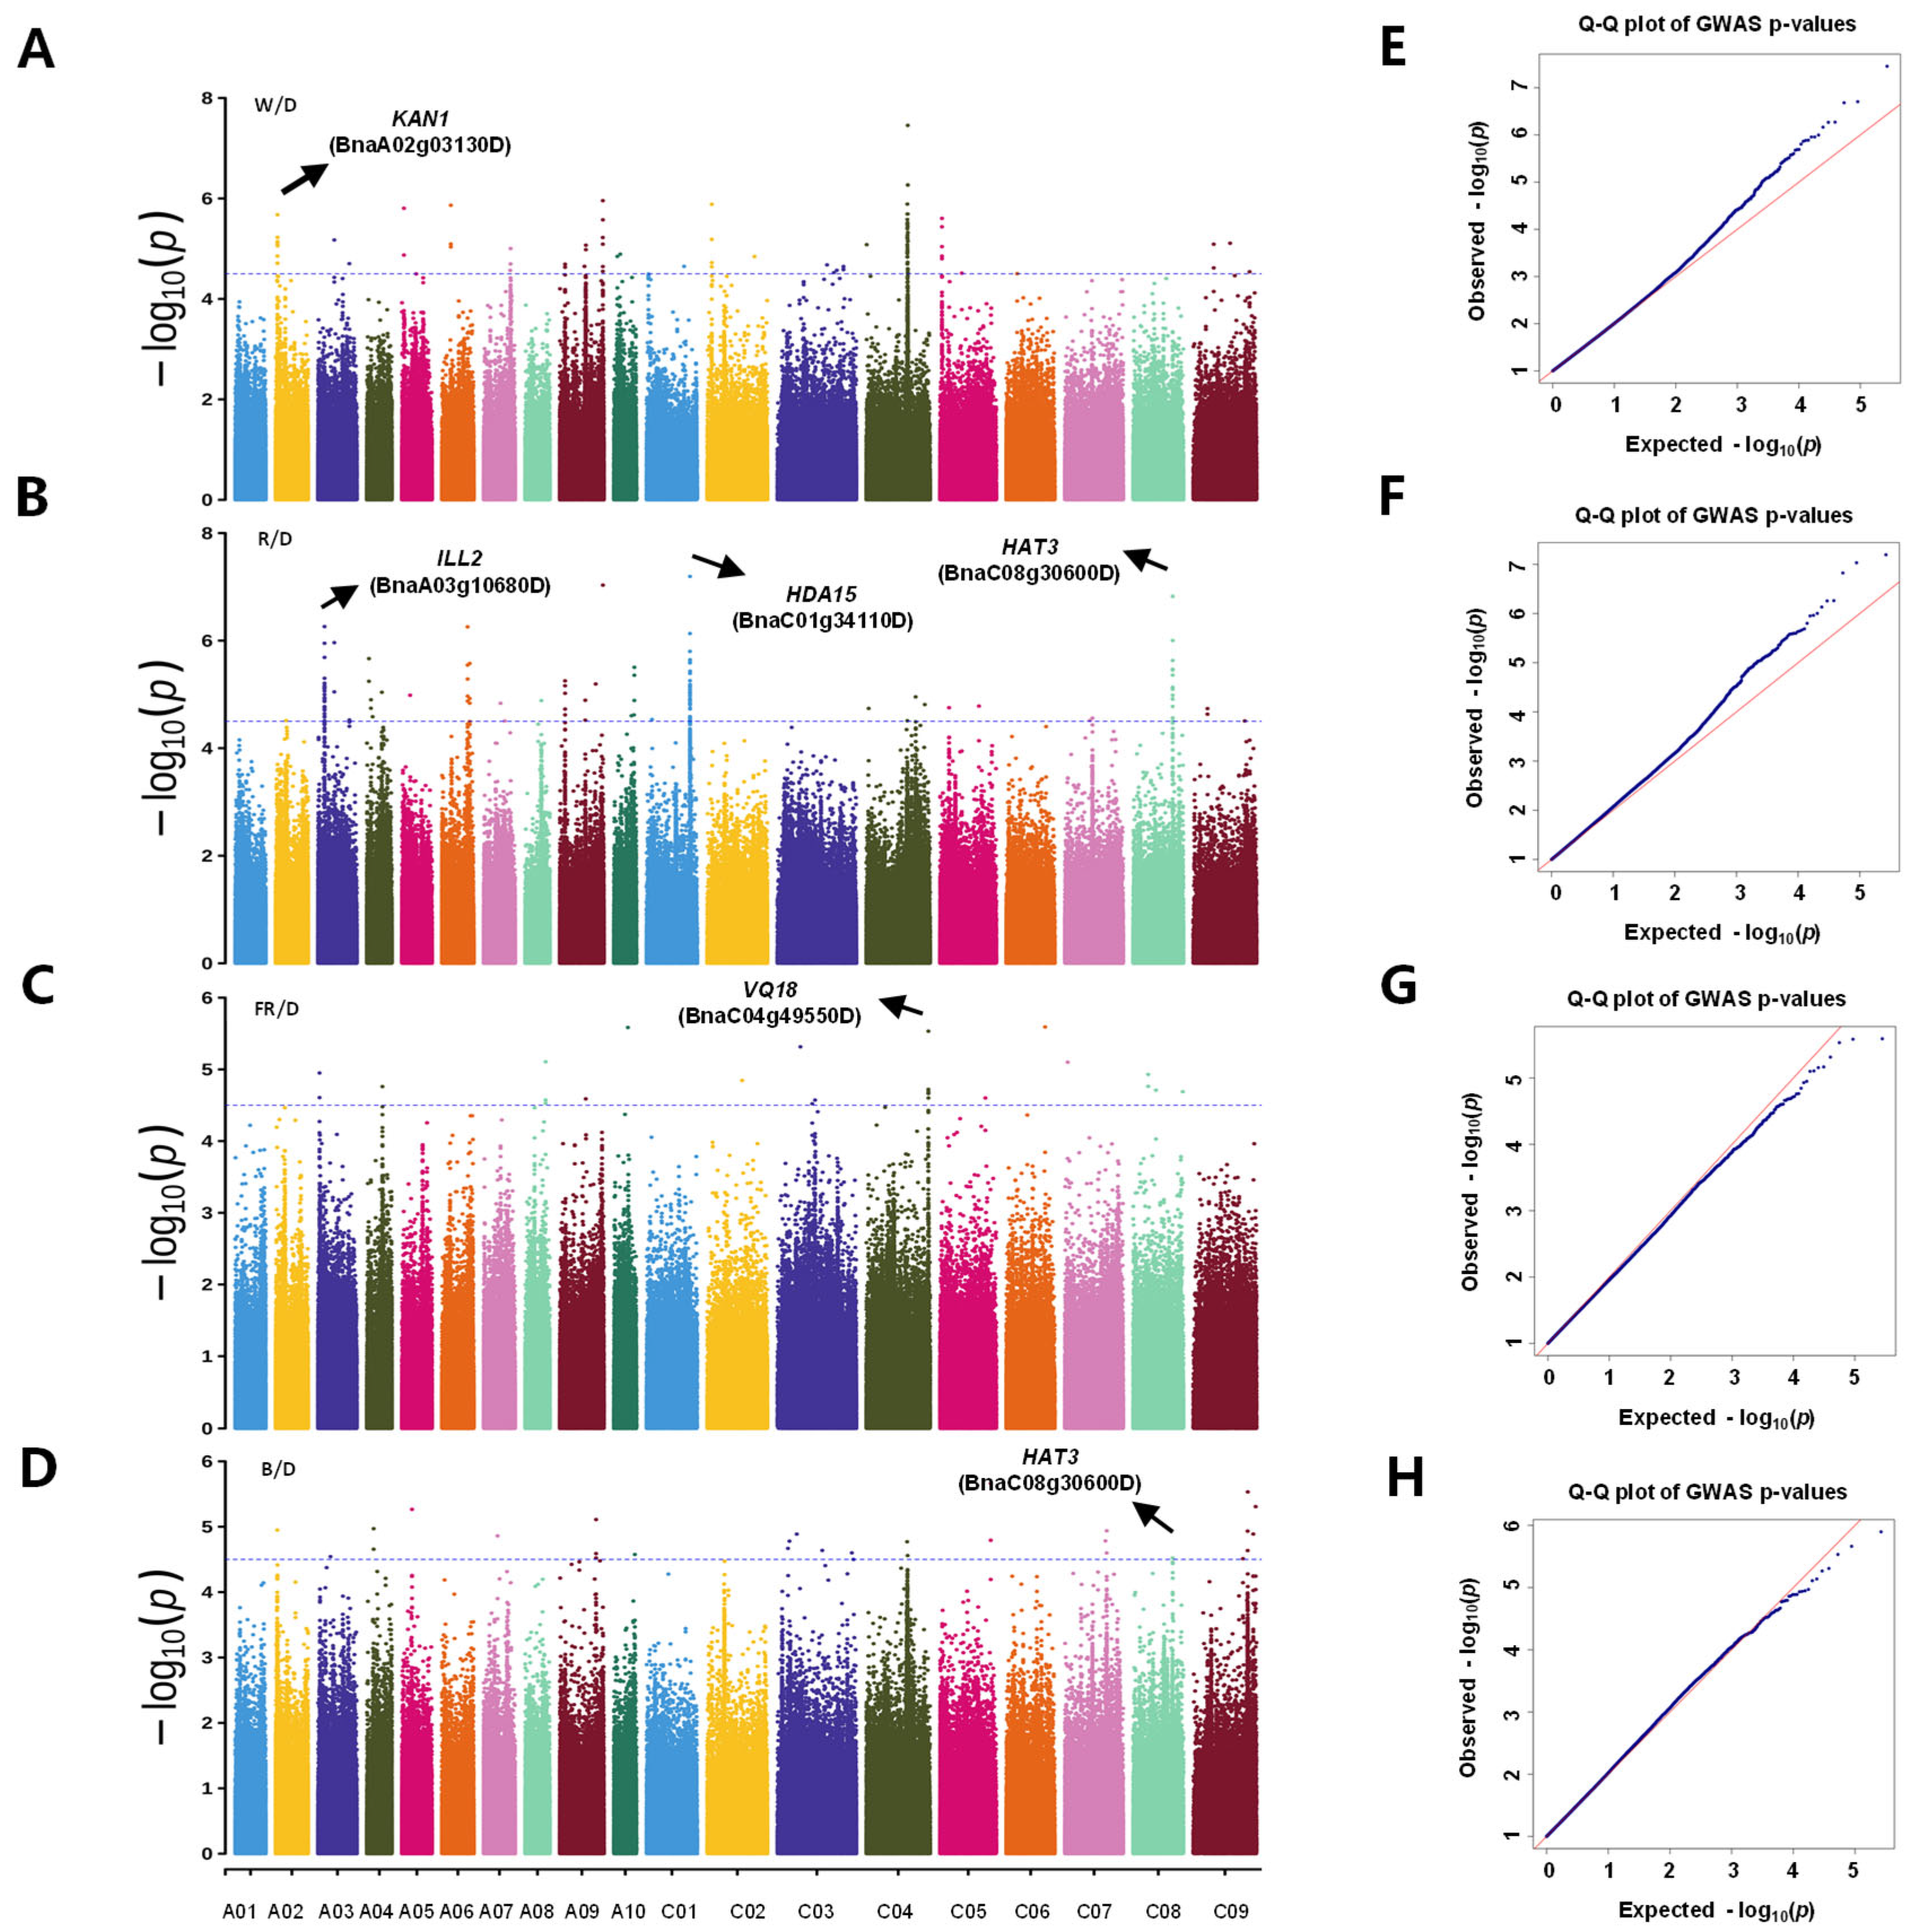
Under white light conditions, GWAS analysis identified eight significant SNPs (p < 10−4.5) on chromosome A02 (Figure 3A), implicating 42 putative candidate genes potentially involved in the suppression of hypocotyl elongation (Table S2). Under red light, a total of 78 significant SNPs were detected across three chromosomes: A03 (24 SNPs), C01 (42 SNPs), and C08 (12 SNPs) (Figure 3B), corresponding to 104, 23, and 38 candidate genes, respectively (Table S2). In far-red light, five significant SNPs were found on chromosome C04 (Figure 3C), suggesting the involvement of 30 candidate genes in light response pathways (Table S2). For blue light, the identified significant SNPs largely overlapped with those under red light, particularly on chromosome C08 (Figure 3D), indicating the presence of shared genetic components mediating hypocotyl elongation in response to different light qualities (Table S2).
The Q-Q plots showed that the majority of observed p-values closely aligned with the expected distribution under the null hypothesis, thereby confirming that the EMMAX model effectively mitigated population structure and cryptic relatedness effects in the association analysis (Figure 3E–H).

3.3. Key Candidate Genes Identified Under Different Light Conditions

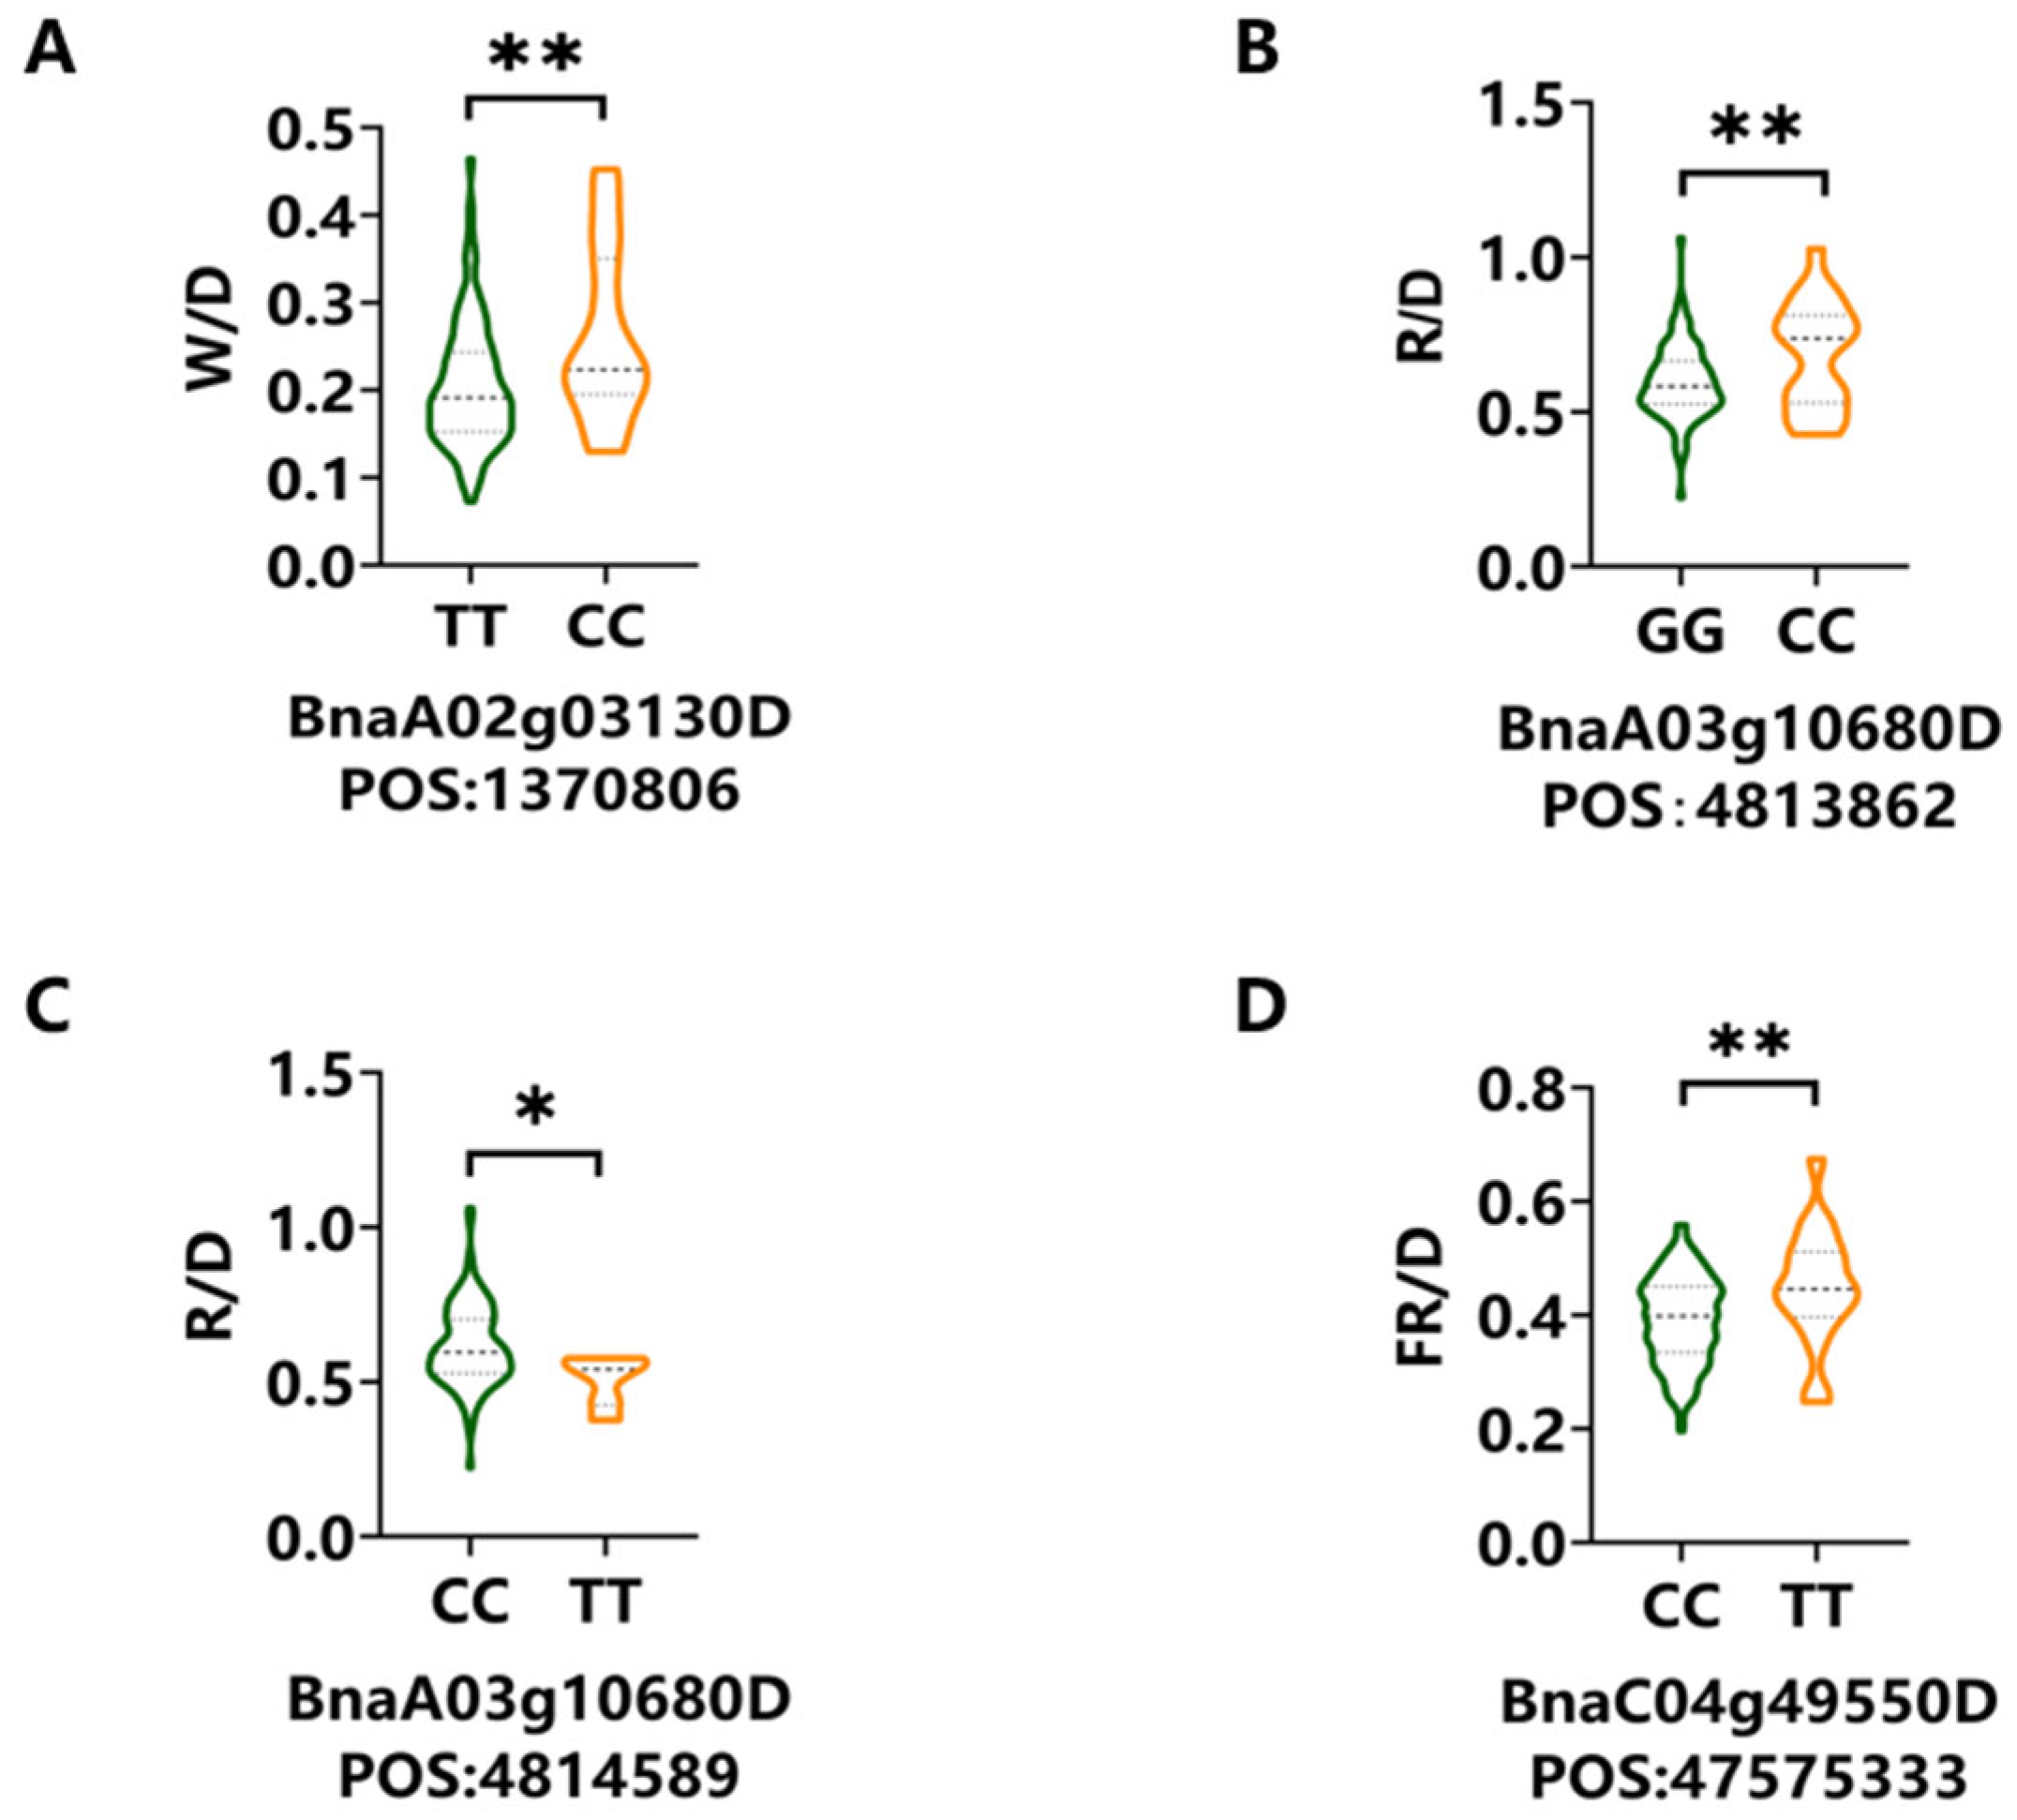
Under white light, the most significantly associated SNPs (p < 10−4.5) were localized to chromosome A02 (Figure 3A), where eight GWAS signals were identified to be significantly associated with relative hypocotyl length (Table S2). These loci corresponded to 42 candidate genes potentially involved in white light-mediated photomorphogenesis. Among them, KANADI1 (KAN1, BnaA02g03130D), a gene implicated in organ polarity regulation, was highlighted. Notably, one of the associated SNPs within this gene results in a missense mutation, which may influence KAN1 function (Figure 4A).
For red light, the most significant GWAS signals (p < 10−4.5) were detected on chromosomes A03, C01, and C08 (Figure 3B), comprising 24, 42, and 12 SNPs, respectively (Table S2). These SNPs were associated with 104, 23, and 38 candidate genes, respectively, suggesting a complex genetic architecture underlying red light responses. Among these, ILL2 (BnaA03g10680D), an auxin-related gene located on chromosome A03, was identified as a promising candidate. Two missense variants were found within ILL2, potentially altering its protein function and thereby contributing to variation in hypocotyl elongation under red light (Figure 4B,C).
Under far-red light conditions, the most significantly associated SNPs (p < 10−4.5) were located on chromosome C04 (Figure 3C). Five chromosomal regions in C04 were significantly associated with relative hypocotyl length under far-red light (Table S2), encompassing 30 candidate genes potentially involved in the regulation of hypocotyl elongation under far-red light. Among them, VQ18 (BnaC04g49550D), a gene involved in ABA signaling pathways, harbored a SNP within its promoter region, which may influence transcriptional activity and ABA-mediated hypocotyl responses (Figure 4D).
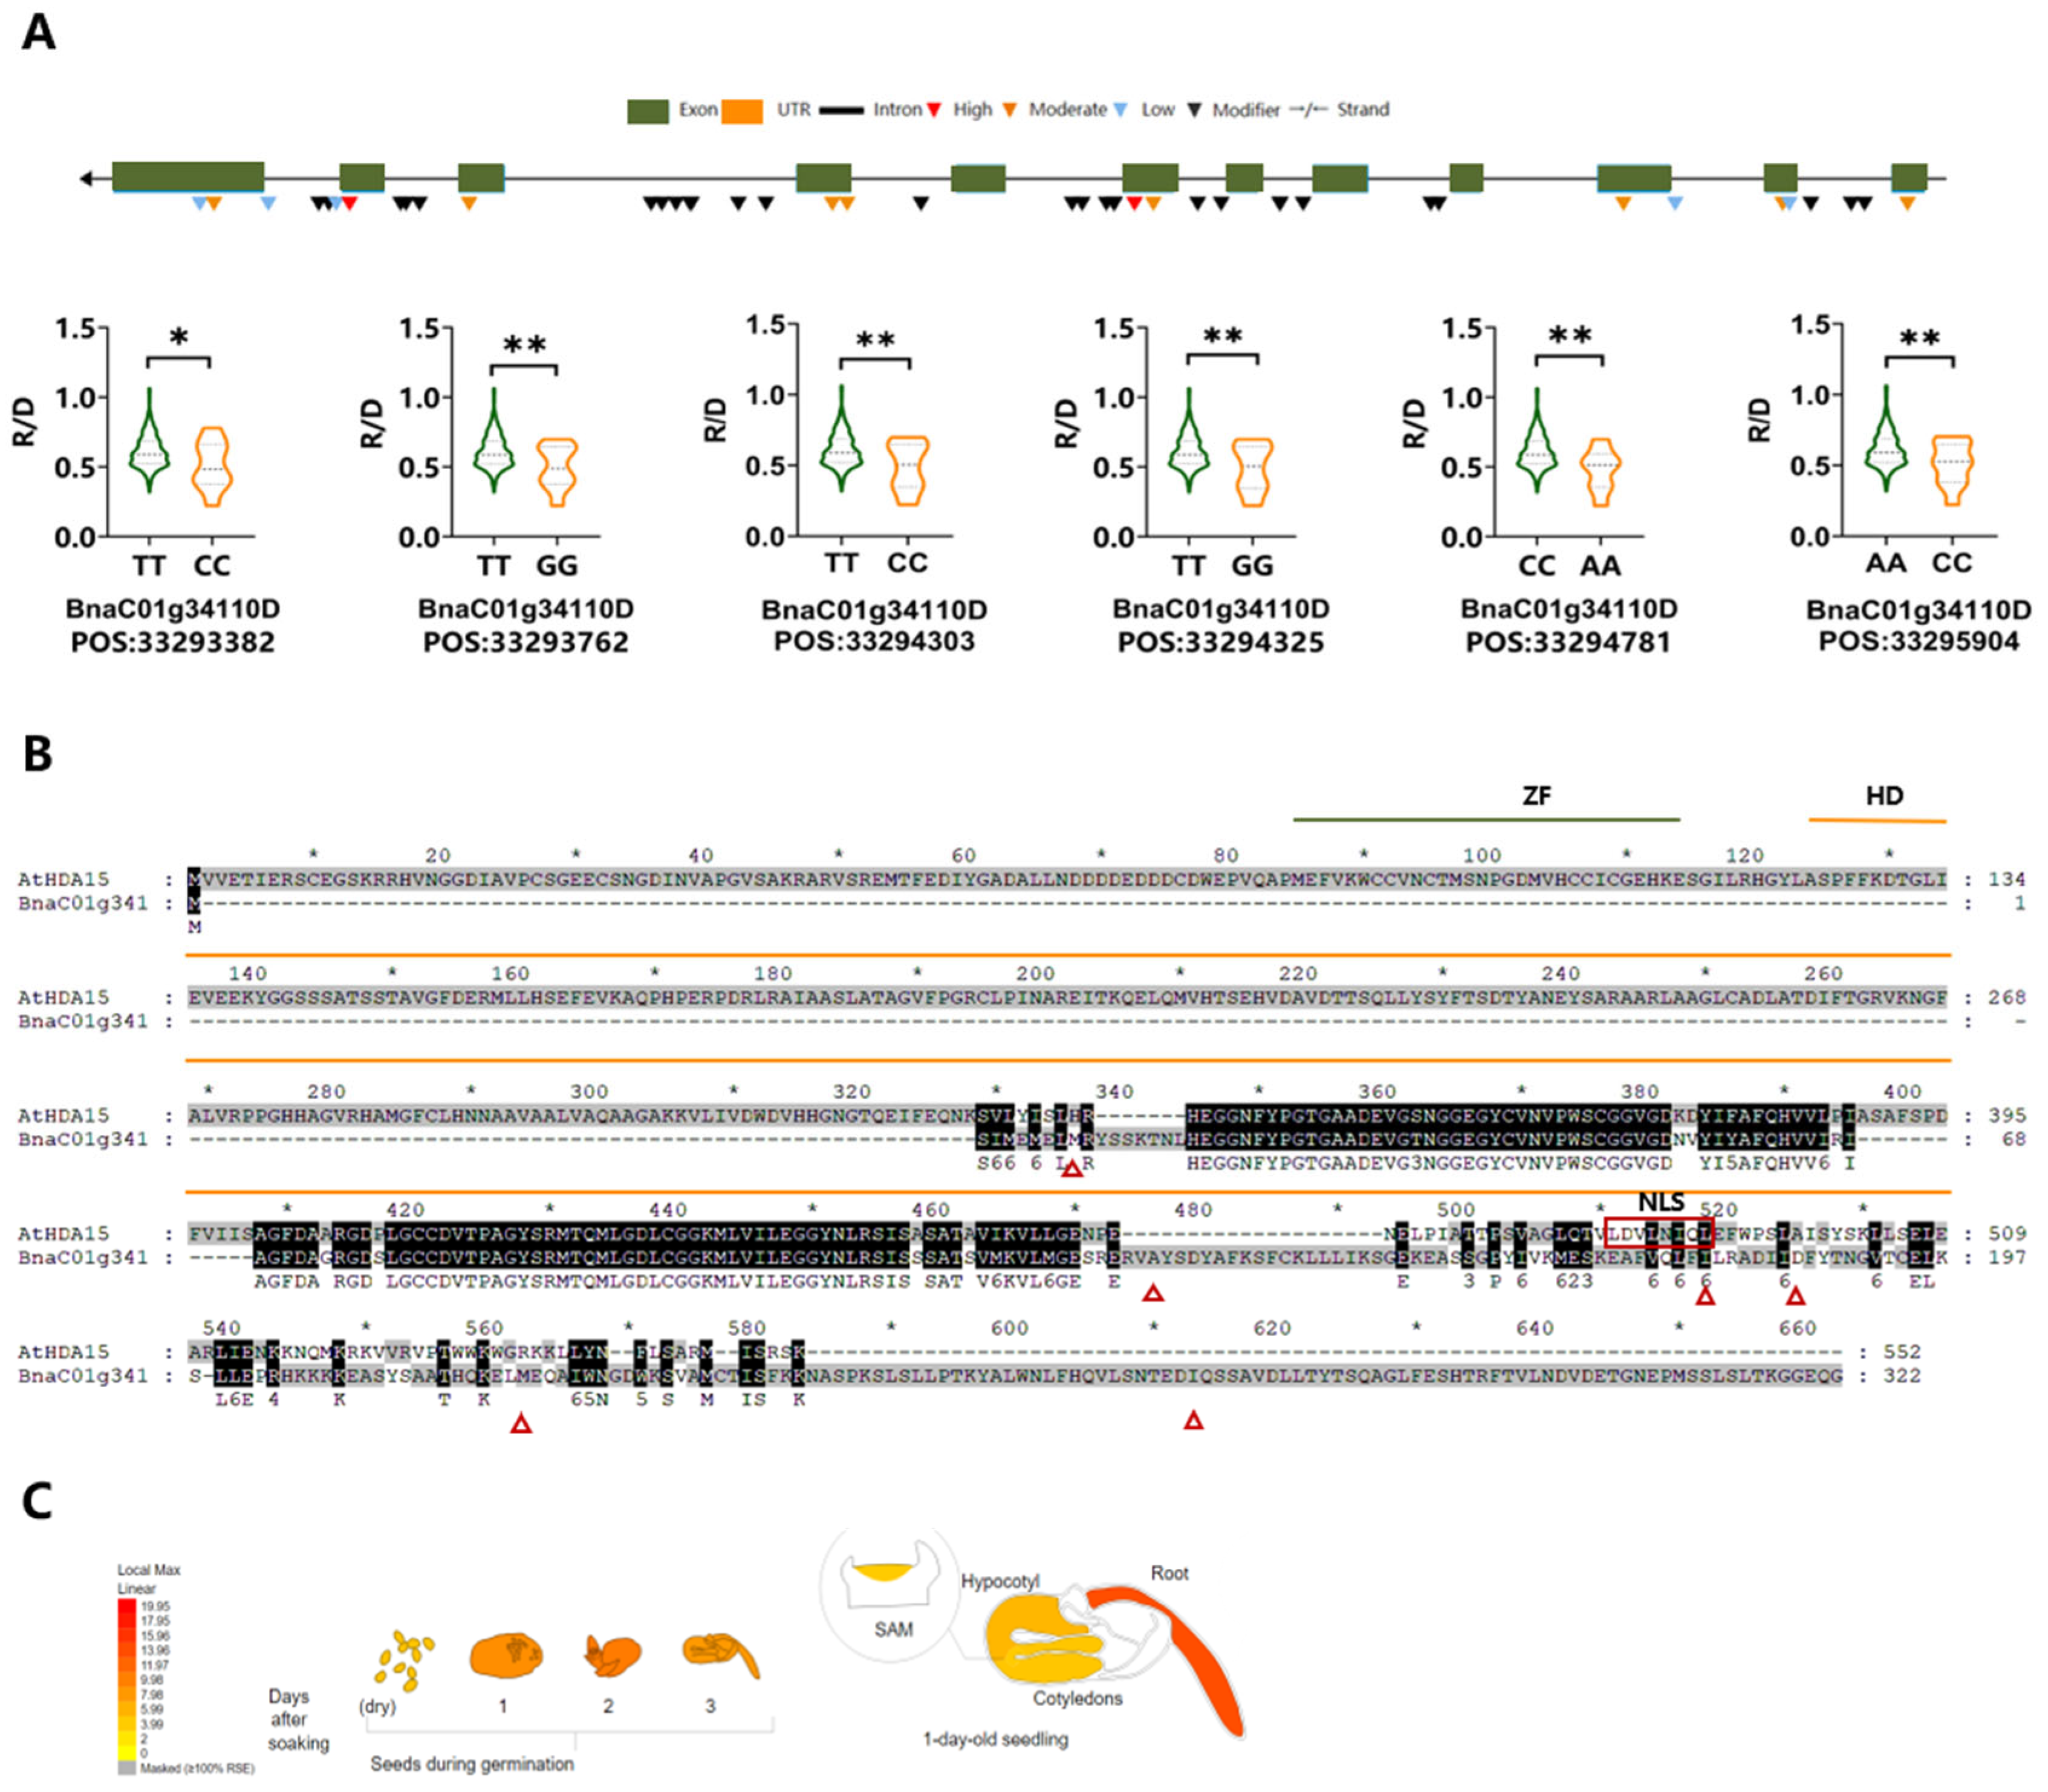
In red light conditions, a key gene HDA15 (BnaC01g34110D) was identified on chromosome C01. This gene belongs to the RPD3/HDA1 class II histone deacetylases (HDACs) and encodes a protein homologous to Arabidopsis AtHDA15 (AT3G18520), which is highly expressed in the hypocotyl (Figure 5C) [33]. Six significant SNPs were detected within its coding region (Figure 5A), four of which result in amino acid substitutions within the conserved HD domain, including one located within the nuclear localization signal (NLS) motif (Figure 5B).
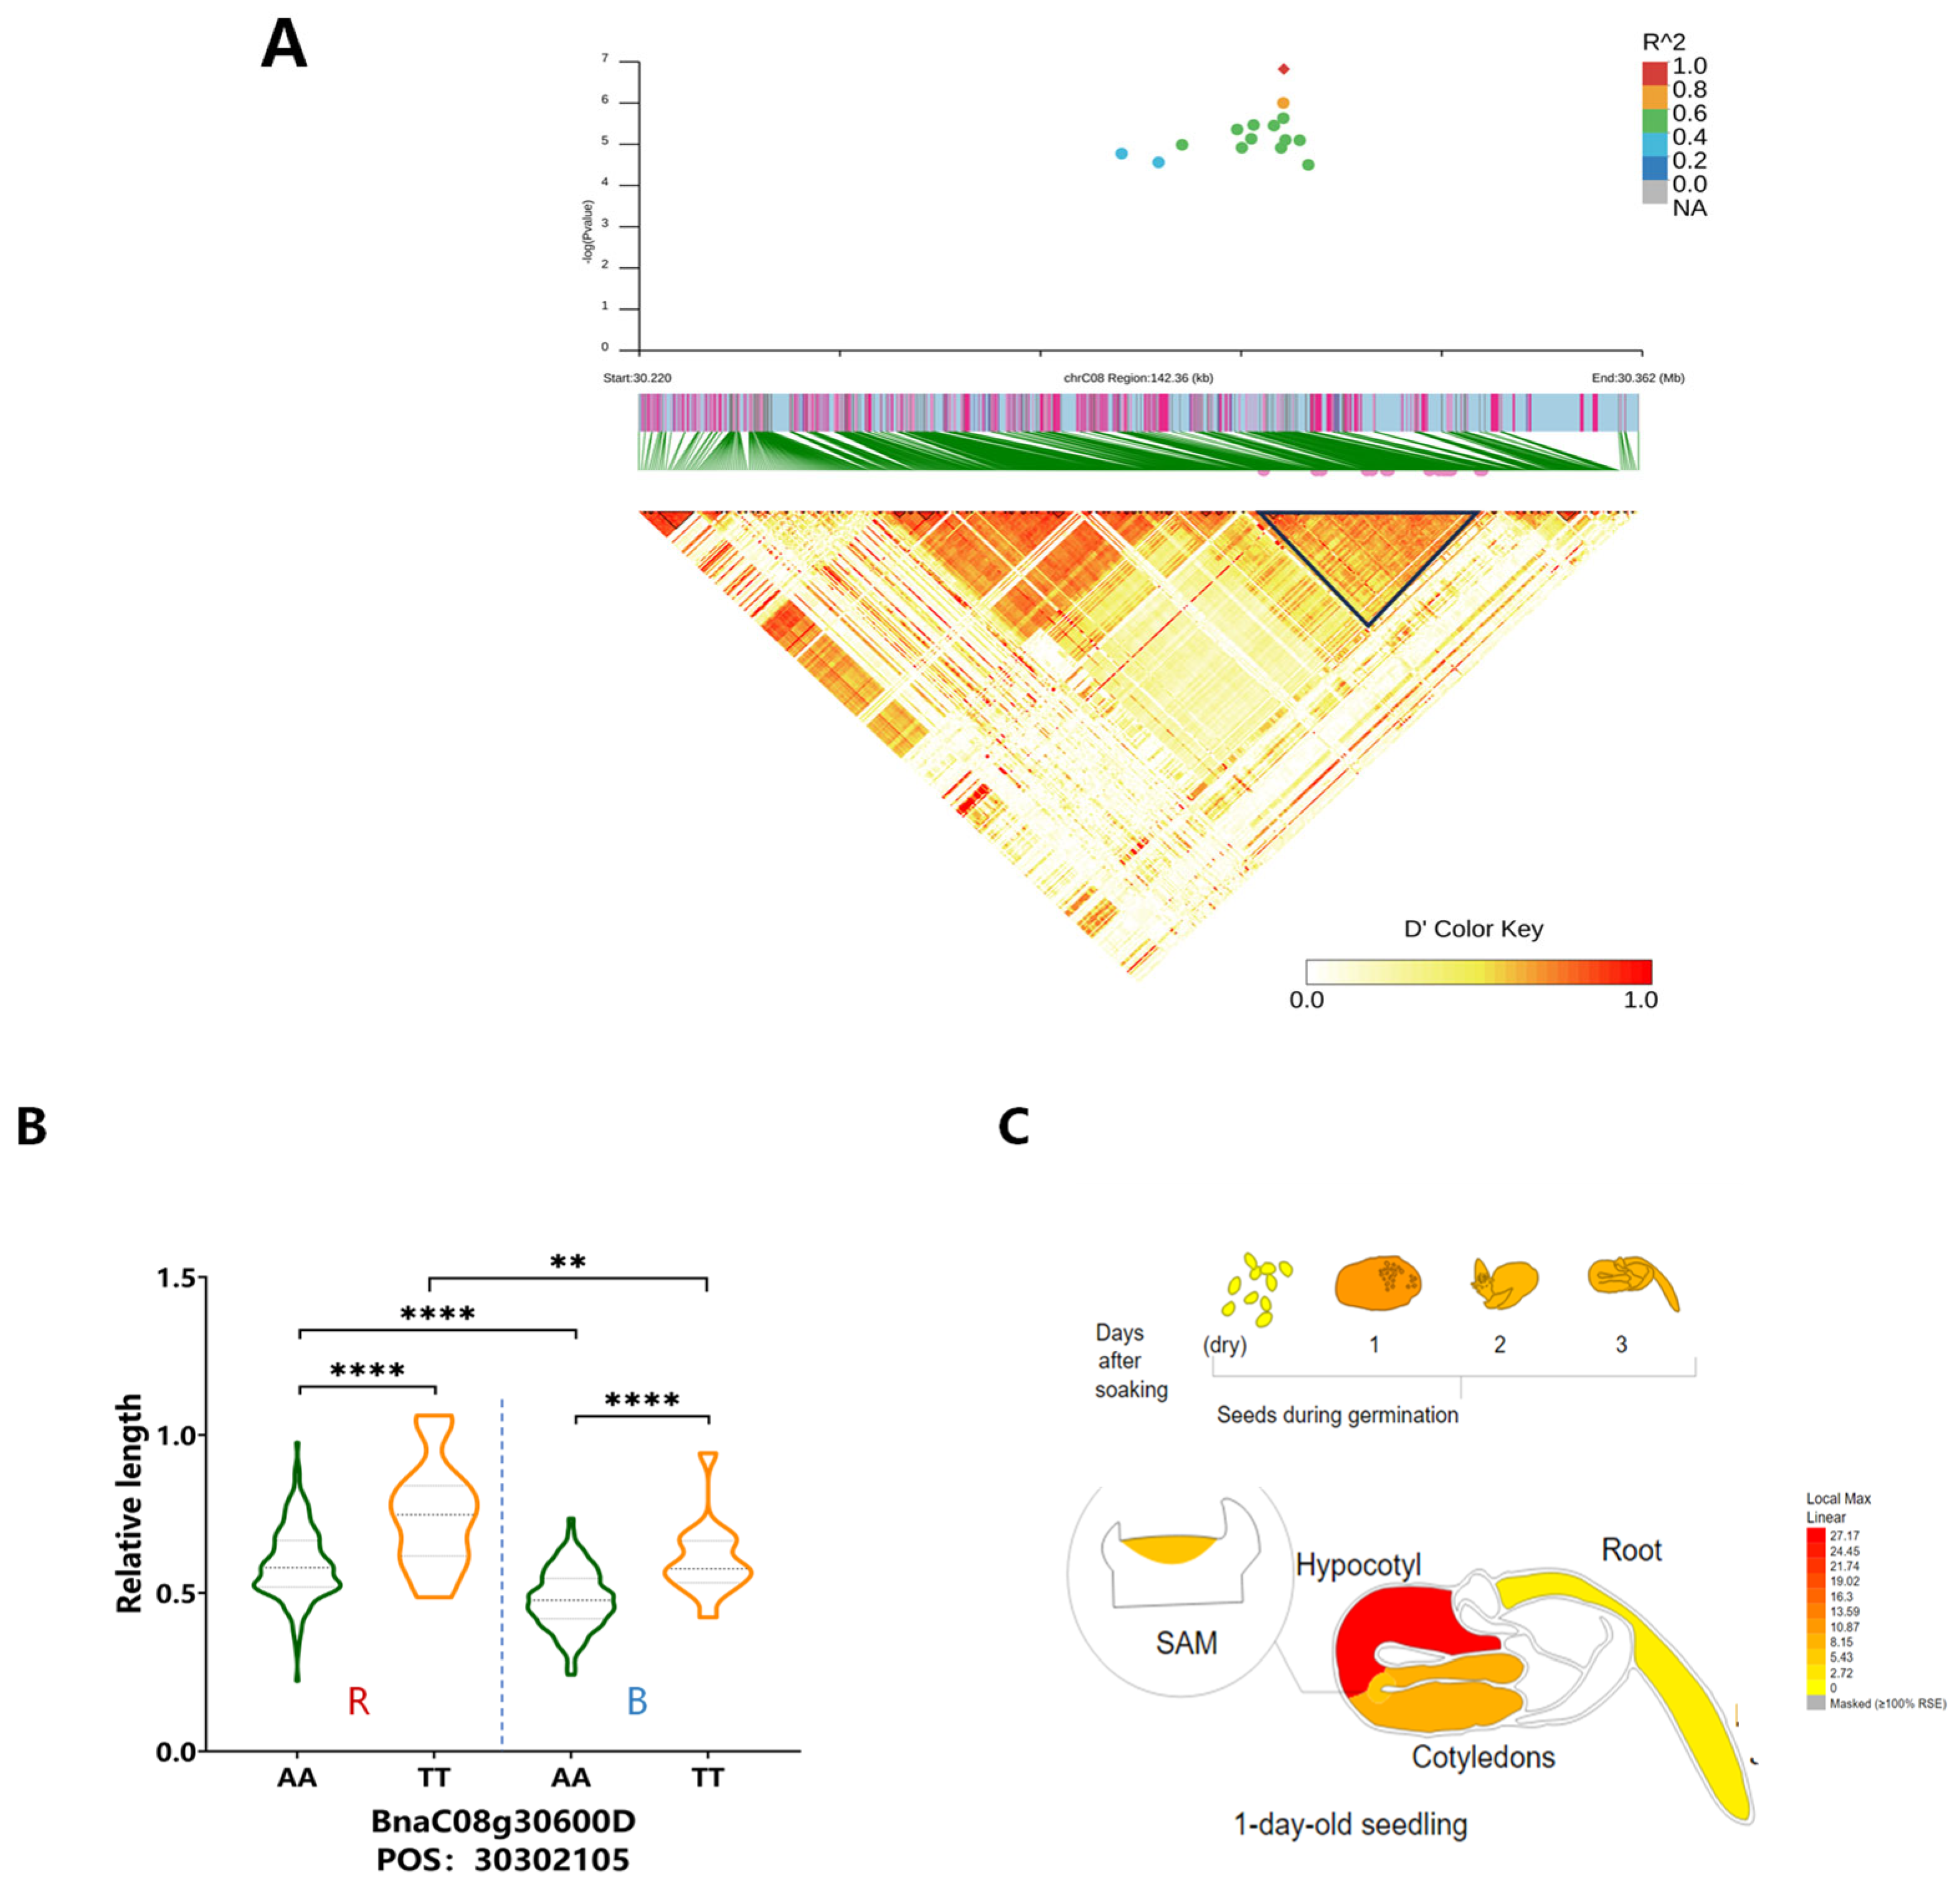
Furthermore, a significant SNP (p_C08_30311118) on chromosome C08, identified under both red and blue light, was located within a linkage disequilibrium (LD) block (Figure 6A) and was associated with HAT3 (BnaC08g30600D), a member of the homeodomain-leucine zipper (HD-Zip) class-II transcription factor family. This SNP was located in the 3′ untranslated region (3′ UTR) of HAT3. Haplotypic analysis revealed that the two alleles of this SNP were associated with significant differences in relative hypocotyl length under both red and blue light (Figure 6B). Its Arabidopsis homolog AtHAT3 (AT3G60390) is also highly expressed in the hypocotyl (Figure 6C) [33], suggesting that HAT3 may function as a shared regulatory component in both red and blue light signaling pathways, contributing to photomorphogenic development in B. napus.

4. Discussion

4.1. Light Quality Differentially Affects Plant Growth in B. napus

Hypocotyl elongation in B. napus exhibits differential responses to various light qualities. Red light weakly inhibited elongation, whereas white, far-red, and blue light exerted stronger suppression. These findings are consistent with previous observations in the cultivar ZD622 [34]. Similarly, McNellis and Deng demonstrated that continuous red light can promote photomorphogenesis in Arabidopsis seedlings but is less effective in suppressing hypocotyl elongation compared to other light qualities [4]. Transcriptomic data from our previous study revealed a strong co-expression pattern between far-red and blue light-responsive genes (r = 0.71) and a moderate correlation between gene expression under dark and red light conditions (r = 0.38) [34]. These transcriptional patterns are consistent with the phenotypic observation that red light suppresses hypocotyl elongation less effectively than far-red and blue light. The attenuated response under monochromatic red light could reflect either (1) suboptimal phyB activation without co-acting photoreceptors, or (2) broader defects in light signaling integration. Future studies using photoreceptor mutants under spectral combinations should help resolve this important question.
Notably, a strong phenotypic correlation was observed between hypocotyl length under red and white light (Figure 1F), indicating that red light is a major contributor to photomorphogenic responses under natural light conditions. Moreover, genotypic variation in hypocotyl length under white and red light was narrower than under far-red or blue light, suggesting a conserved response. We hypothesize that red light-mediated inhibition of hypocotyl elongation in rapeseed requires synergistic signaling with other light wavelengths. Under monochromatic red light, this regulatory network appears incomplete.
Based on relative hypocotyl length measurement, we identified accessions with extreme sensitivity or insensitivity to light (Figure 2). Light-sensitive (exhibiting strong inhibition of hypocotyl elongation across all light treatments) varieties are of agronomic interest because they are less prone to excessive elongation under shading, improving lodging resistance and light-use efficiency. Conversely, light-insensitive accessions may serve as valuable genetic materials for dissecting the regulatory mechanisms of photomorphogenesis.

4.2. Identification of Genes Involved in Light-Mediated Inhibition of Hypocotyl Elongation

In eukaryotes, transcriptional regulation is closely linked to chromatin remodeling, which is modulated by post-translational histone modifications such as acetylation, methylation, phosphorylation, and ubiquitination [35]. Histone acetylation, dynamically regulated by histone acetyltransferases and histone deacetylases (HDACs), plays a central role in modulating gene expression. HDA15, recruited by PIF3, represses chlorophyll and photosynthesis-related genes through H4 deacetylation in etiolated seedlings [36]. Similarly, PIF1 recruits HDA15 to the promoter of light-responsive genes in dark-germinated seeds, leading to reduced H3 acetylation and gene silencing [23]. Genetic evidence has shown that HDA15 negatively regulates hypocotyl elongation under both red and far-red light. Through its interaction with HY5, HDA15 represses cell wall organization and auxin signaling genes [37]. CDKC2 acts synergistically with HDA15 to regulate of cell wall organization and auxin signaling during FR light-mediated cell elongation [38]. Upon light exposure, HDA15 dissociates from target loci, leading to increased histone acetylation and gene activation [35]. In addition, PIF1/PIF3 can also recruit HDA19 and MED25 to suppress transcription by reducing chromatin accessibility [39]. These studies collectively highlight HDAs as critical repressors in photomorphogenesis. To further investigate the role of HDA15 in the inhibition of hypocotyl elongation in rapeseed, in the future, it can be studied by constructing hda15 knockout mutants and overexpression plants to observe their specific manifestations under red light and far-red light.
Auxin is a key hormonal regulator of hypocotyl growth. The most abundant endogenous auxin is indole-3-acetic acid (IAA). ILR1 encodes IAA-amino acid hydrolases that release free IAA, while IAA7 and IAA14, negative regulators of auxin signaling, are upregulated by HY5 to inhibit hypocotyl elongation [26]. In this study, we identified BnILL2 (BnaA03g10680D), a homolog of AtILR1 sharing ~44% identity with ILR1, as a candidate gene likely involved in auxin production under red light.
VQ18 (BnaC04g49550D), an ABA-responsive gene, was identified under far-red light (Figure 3C). It physically interacts with ABI5, a central transcription factor in ABA signaling pathway. ABI5 is directly activated by HY5, thereby promoting photomorphogenesis. VQ18, together with its paralog VQ26, has been shown to negatively regulate ABA responses during early seedling development [40], suggesting its role in fine-tuning light-hormone crosstalk.
KAN1 (BnaA02g03130D), encoding a member of the KANADI transcription factor family, is essential for establishing abaxial identity in both leaves and carpels. Together with KAN2 and KAN4, KAN1 is involved in regulating PIN1 expression during early embryogenesis [41,42], suggesting its broader developmental role.
ATHB4 and HAT3 function as negative regulators of SAUR15 and HAT2, which are involved in hormone or shade responses and are key components in SAS regulation [43,44,45]. Our GWAS results identified HAT3 (BnaC08g30600D) as significantly associated with hypocotyl length under both red and blue light. This suggests a potential role for HAT3 in integrating red and blue light signals.
Although our GWAS results identified several strong candidate genes (e.g., KAN1, ILL2, VQ18, HDA15, HAT3) potentially involved in light-mediated hypocotyl elongation, their causal roles remain to be confirmed. Future work will integrate multiple approaches to functionally validate these genes. For example, transcriptomic profiling and RT-qPCR analyses under contrasting light qualities can be used to confirm differential expression patterns. Moreover, targeted genome editing (e.g., CRISPR/Cas9 knockouts) and overexpression in B. napus or model species can determine phenotypic effects. These strategies will facilitate the translation of our association results into mechanistic understanding and breeding applications.

5. Conclusions

In this study, we quantified hypocotyl elongation phenotypes across a diverse panel of 267 Brassica napus accessions grown under five distinct light regimes: white, red, far-red, blue light, and complete darkness. Our phenotypic analyses revealed substantial genetic variation in light responsiveness, with red light demonstrating the weakest inhibitory effect on hypocotyl elongation, while white light imposed the strongest suppression.
Through genome-wide association mapping, we identified multiple significant SNPs associated with differential light responses. Notably, we pinpointed several promising candidate genes—including KAN1, ILL2, VQ18, HDA15, and HAT3—that are functionally implicated in photomorphogenic regulation and phytohormone signaling pathways. These findings provide novel insights into the polygenic architecture governing light responsiveness in B. napus and reveal potential molecular targets for genetic improvement of shade tolerance.
The discovery of SNPs with significant allelic effects offers valuable markers for molecular breeding programs aimed at developing cultivars with enhanced resilience to low-light conditions, particularly relevant for high-density planting systems and straw mulching agricultural practices. However, subsequent functional characterization of these candidate genes and validation of associated markers through marker-assisted selection will be essential to confirm their practical utility in breeding applications.

Supplementary Materials

The following supporting information can be downloaded at: https://www.mdpi.com/article/10.3390/agronomy15092047/s1, Supplementary Table S1. The lengths and relative values of the hypocotyls of 267 rapeseed varieties under white light, red light, far-red light, blue light and dark conditions. Supplementary Table S2. Significant loci identified by GWAS.

Author Contributions

H.Z. and S.C. designed and supervised this study. Y.Z., Q.W., T.H. and Z.H. performed bioinformatics analysis. X.Z. conducted the physiological experiments. Y.Z. wrote the manuscript. H.Z. and S.C. revised the manuscript. All authors have read and agreed to the published version of the manuscript.

Funding

This study was supported by National Key Research and Development Program of China (2024YFD1200401).

Data Availability Statement

Data are contained within the article and Supplementary Materials.

Conflicts of Interest

The authors declare no conflicts of interest.

References

  1. Nagaharu, U. Genome analysis in Brassica with special reference to the experimental formation of B. napus and peculiar mode of fertilization. J. Exp. Bot. 1935, 7, 389–452. [Google Scholar]
  2. Smith, H.; Whitelam, G. The shade avoidance syndrome: Multiple responses mediated by multiple phytochromes. Plant Cell Environ. 1997, 20, 840–844. [Google Scholar] [CrossRef]
  3. Cheng, M.C.; Kathare, P.K.; Paik, I.; Huq, E. Phytochrome signaling networks. Annu. Rev. Plant Biol. 2021, 72, 217–244. [Google Scholar] [CrossRef] [PubMed]
  4. McNellis, T.W.; Deng, X.W. Light control of seedling morphogenetic pattern. Plant Cell 1995, 7, 1749–1761. [Google Scholar] [PubMed]
  5. Briggs, W.R. Editorial: In the light of day: Plant photomorphogenesis. Molecular Plant 2008, 1, 2–3. [Google Scholar] [CrossRef]
  6. Nemhauser, J.L.; Chory, J. Photomorphogenesis. Arab. Book. 2002, 1, e0054. [Google Scholar] [CrossRef]
  7. Nemhauser, J.L. Dawning of a new era: Photomorphogenesis as an integrated molecular network. Curr. Opin. Plant Biol. 2008, 11, 4–8. [Google Scholar] [CrossRef] [PubMed]
  8. Shi, H.; Lyu, M.; Luo, Y.; Liu, S.; Li, Y.; He, H.; Wei, N.; Deng, X.W.; Zhong, S. Genome-wide regulation of light-controlled seedling morphogenesis by three families of transcription factors. Proc. Natl. Acad. Sci. USA 2018, 115, 6482–6487. [Google Scholar] [CrossRef]
  9. Buti, S.; Hayes, S.; Pierik, R. The bHLH network underlying plant shade-avoidance. Physiol. Plant 2020, 169, 312–324. [Google Scholar] [CrossRef]
  10. Quail, P.H. Photosensory perception and signalling in plant cells: New paradigms? Curr. Opin. Cell Biol. 2002, 14, 180–188. [Google Scholar] [CrossRef]
  11. Izaguirre, M.M.; Mazza, C.A.; Biondini, M.; Baldwin, I.T.; Ballare, C.L. Remote sensing of future competitors: Impacts on plant defenses. Proc. Natl. Acad. Sci. USA 2006, 103, 7170–7174. [Google Scholar] [CrossRef]
  12. Franklin, K.A. Shade avoidance. New Phytol. 2008, 179, 930–944. [Google Scholar] [CrossRef] [PubMed]
  13. Martinez-Garcia, J.F.; Galstyan, A.; Salla-Martret, M.; Cifuentes-Esquivel, N.; Gallemi, M.; Bou-Torrent, J. Regulatory components of shade avoidance syndrome. Adv. Bot. Res. 2010, 53, 65–116. [Google Scholar]
  14. Fraser, D.P.; Panter, P.E.; Sharma, A.; Sharma, B.; Dodd, A.N.; Franklin, K.A. Phytochrome a elevates plant circadian-clock components to suppress shade avoidance in deep-canopy shade. Proc. Natl. Acad. Sci. USA 2021, 118, e2108176118. [Google Scholar] [CrossRef]
  15. Jang, I.T.; Lee, J.H.; Shin, E.J.; Nam, S.Y. Evaluation of growth, flowering, and chlorophyll fluorescence responses of viola cornuta cv. penny red wing according to spectral power distributions. J. People Plants Environ. 2023, 26, 335–349. [Google Scholar] [CrossRef]
  16. Li, L.; Ljung, K.; Breton, G.; Schmitz, R.J.; Pruneda-Paz, J.; Cowing-Zitron, C.; Cole, B.J.; Ivans, L.J.; Pedmale, U.V.; Jung, H.S.; et al. Linking photoreceptor excitation to changes in plant architecture. Genes Dev. 2012, 26, 785–790. [Google Scholar] [CrossRef]
  17. Roig-Villanova, I.; Bou-Torrent, J.; Galstyan, A.; Carretero-Paulet, L.; Portolés, S.; Rodríguez-Concepción, M.; Martínez-García, J.F. Interaction of shade avoidance and auxin responses: A role for two novel atypical bHLH proteins. EMBO J. 2007, 26, 4756–4767. [Google Scholar] [CrossRef]
  18. Hornitschek, P.; Kohnen, M.V.; Lorrain, S.; Rougemont, J.; Ljung, K.; López-Vidriero, I.; Franco-Zorrilla, J.M.; Solano, R.; Trevisan, M.; Pradervand, S.; et al. Phytochrome interacting factors 4 and 5 control seedling growth in changing light conditions by directly controlling auxin signaling. Plant J. 2012, 71, 699–711. [Google Scholar] [CrossRef] [PubMed]
  19. Sharrock, R.A.; Clack, T. Patterns of expression and normalized levels of the five Arabidopsis phytochromes. Plant Physiol. 2002, 130, 442–456. [Google Scholar] [CrossRef]
  20. Castillon, A.; Shen, H.; Huq, E. Phytochrome Interacting Factors: Central players in phytochrome-mediated light signaling networks. Trends Plant Sci. 2007, 12, 514–521. [Google Scholar] [CrossRef] [PubMed]
  21. Duek, P.D.; Fankhauser, C. bHLH class transcription factors ake centre stage in phytochrome signalling. Trends Plant Sci. 2005, 10, 51–54. [Google Scholar] [CrossRef]
  22. Paik, I.; Yang, S.; Choi, G. Phytochrome regulates translation of mRNA in the cytosol. Proc. Natl. Acad. Sci. USA 2012, 109, 1335–1340. [Google Scholar] [CrossRef]
  23. Gu, D.; Chen, C.Y.; Zhao, M.; Zhao, L.; Duan, X.; Duan, J.; Wu, K.; Liu, X. Identification of HDA15-PIF1 as a key repression module directing the transcriptional network of seed germination in the dark. Nucleic Acids Res. 2017, 45, 7137–7150. [Google Scholar] [CrossRef]
  24. Paulišić, S.; Qin, W.; Arora Verasztó, H.; Then, C.; Alary, B.; Nogue, F.; Tsiantis, M.; Hothorn, M.; Martínez-García, J.F. Adjustment of the PIF7-HFR1 transcriptional module activity controls plant shade adaptation. EMBO J. 2021, 40, e104273. [Google Scholar] [CrossRef]
  25. Jiao, Y.; Lau, O.S.; Deng, X.W. Light-regulated transcriptional networks in higher plants. Nat. Rev. Genet. 2007, 8, 217–230. [Google Scholar] [CrossRef] [PubMed]
  26. Gangappa, S.N.; Botto, J.F. The multifaceted roles of HY5 in plant growth and development. Mol. Plant 2016, 9, 1353–1365. [Google Scholar] [CrossRef]
  27. Luo, X.; Xue, Z.; Ma, C.; Hu, K.; Zeng, Z.; Dou, S.; Tu, J.; Shen, J.; Yi, B.; Fu, T. Joint genome-wide association and transcriptome sequencing reveals a complex polygenic network underlying hypocotyl elongation in rapeseed (Brassica napus L.). Sci. Rep. 2017, 7, 41561. [Google Scholar] [CrossRef]
  28. Wu, D.; Liang, Z.; Yan, T.; Xu, Y.; Xuan, L.; Tang, J.; Zhou, G.; Lohwasser, U.; Hua, S.; Wang, H.; et al. Whole-genome resequencing of a worldwide collection of rapeseed accessions reveals the genetic basis of ecotype divergence. Mol. Plant 2019, 12, 30–43. [Google Scholar] [CrossRef]
  29. Wang, H.; Wang, Q.; Pak, H.; Yan, T.; Chen, M.; Chen, X.; Wu, D.; Jiang, L. Genome-wide association study reveals a patatin-like lipase relating to the reduction of seed oil content in Brassica napus. BMC Plant Biol. 2021, 21, 6. [Google Scholar] [CrossRef] [PubMed]
  30. Wang, R.; Wu, G.; Zhang, J.; Hu, W.; Yao, X.; Jiang, L.; Zhu, Y. Integration of GWAS and transcriptome analysis to identify temperature-dependent genes involved in germination of rapeseed (Brassica napus L.). Front. Plant Sci. 2025, 16, 1551317. [Google Scholar] [CrossRef] [PubMed]
  31. Dong, S.S.; He, W.M.; Ji, J.J.; Zhang, C.; Guo, Y.; Yang, T.L. LDBlockShow: A fast and convenient tool for visualizing linkage disequilibrium and haplotype blocks based on variant call format files. Brief. Bioinform. 2021, 22, bbaa227. [Google Scholar] [CrossRef]
  32. Danecek, P.; Auton, A.; Abecasis, G.; Albers, C.A.; Banks, E.; DePristo, M.A.; Handsaker, R.E.; Lunter, G.; Marth, G.T.; Sherry, S.T.; et al. The variant call format and VCFtools. Bioinformatics 2011, 27, 2156–2158. [Google Scholar] [CrossRef]
  33. Klepikova, A.V.; Kasianov, A.S.; Gerasimov, E.S.; Logacheva, M.D.; Penin, A.A. A high resolution map of the Arabidopsis thaliana developmental transcriptome based on RNA-seq profiling. Plant J. 2016, 88, 1058–1070. [Google Scholar] [CrossRef]
  34. Zhang, X.; Fang, T.M.; Huang, Y.Q.; Sun, W.Y.; Cai, S.G. Transcriptional regulation of photomorphogenesis in seedlings of Brassica napus under different light qualities. Planta 2022, 256, 77. [Google Scholar] [CrossRef]
  35. Berger, S.L. Histone modifications in transcriptional regulation. Curr. Opin. Genet. 2002, 12, 142–148. [Google Scholar] [CrossRef]
  36. Liu, X.; Chen, C.Y.; Wang, K.C.; Luo, M.; Tai, R.; Yuan, L.; Zhao, M.; Yang, S.; Tian, G.; Cui, Y.; et al. PHYTOCHROME INTERACTING FACTOR3 associates with the histone deacetylase HDA15 in repression of chlorophyll biosynthesis and photosynthesis in etiolated Arabidopsis seedlings. Plant Cell 2013, 25, 1258–1273. [Google Scholar] [CrossRef]
  37. Zhao, L.; Peng, T.; Chen, C.Y.; Ji, R.; Gu, D.; Li, T.; Zhang, D.; Tu, Y.T.; Wu, K.; Liu, X. HY5 Interacts with the Histone Deacetylase HDA15 to Repress Hypocotyl Cell Elongation in Photomorphogenesis. Plant Physiol. 2019, 180, 1450–1466. [Google Scholar] [CrossRef] [PubMed]
  38. Chen, C.Y.; Chang, C.H.; Wu, C.H.; Tu, Y.T.; Wu, K. Arabidopsis cyclin-dependent kinase C2 interacts with HDA15 and is involved in far-red light-mediated hypocotyl cell elongation. Plant J. 2022, 112, 1462–1472. [Google Scholar] [CrossRef] [PubMed]
  39. Guo, Q.; Jing, Y.; Gao, Y.; Liu, Y.; Fang, X.; Lin, R. The PIF1/PIF3-MED25-HDA19 transcriptional repression complex regulates phytochrome signaling in Arabidopsis. New Phytol. 2023, 240, 1097–1115. [Google Scholar] [CrossRef] [PubMed]
  40. Pan, J.; Wang, H.; Hu, Y.; Yu, D. Arabidopsis VQ18 and VQ26 proteins interact with ABI5 transcription factor to negatively modulate ABA response during seed germination. Plant J. 2018, 95, 529–544. [Google Scholar] [CrossRef]
  41. Neha, B.; Henrik, Å.; Henrik, J.; Marcus, G.H. Quantitative analysis of auxin sensing in leaf primordia argues against proposed role in regulating leaf dorsoventrality. ELife 2019, 8, e39298. [Google Scholar]
  42. Preciado, J.; Begcy, K.; Liu, T. The Arabidopsis HDZIP class II transcription factor ABA INSENSITIVE TO GROWTH 1 functions in leaf development. J. Exp. Bot. 2022, 73, 1978–1991. [Google Scholar] [CrossRef] [PubMed]
  43. Ohgishi, M.; Oka, A.; Morelli, G.; Ruberti, I.; Aoyama, T. Negative autoregulation of the Arabidopsis homeobox gene ATHB-2. Plant J. 2001, 25, 389–398. [Google Scholar] [CrossRef] [PubMed]
  44. Sawa, S.; Ohgishi, M.; Goda, H.; Higuchi, K.; Shimada, Y.; Yoshida, S.; Koshiba, T. The HAT2 gene, a member of the HD-Zip gene family, isolated as an auxin inducible gene by DNA microarray screening, affects auxin response in Arabidopsis. Plant J. 2002, 32, 1011–1022. [Google Scholar] [CrossRef] [PubMed]
  45. Sorin, C.; Salla-Martret, M.; Bou-Torrent, J.; Roig-Villanova, I.; Martínez-García, J.F. ATHB4, a regulator of shade avoidance, modulates hormone response in Arabidopsis seedlings. Plant J. 2009, 59, 266–277. [Google Scholar] [CrossRef]
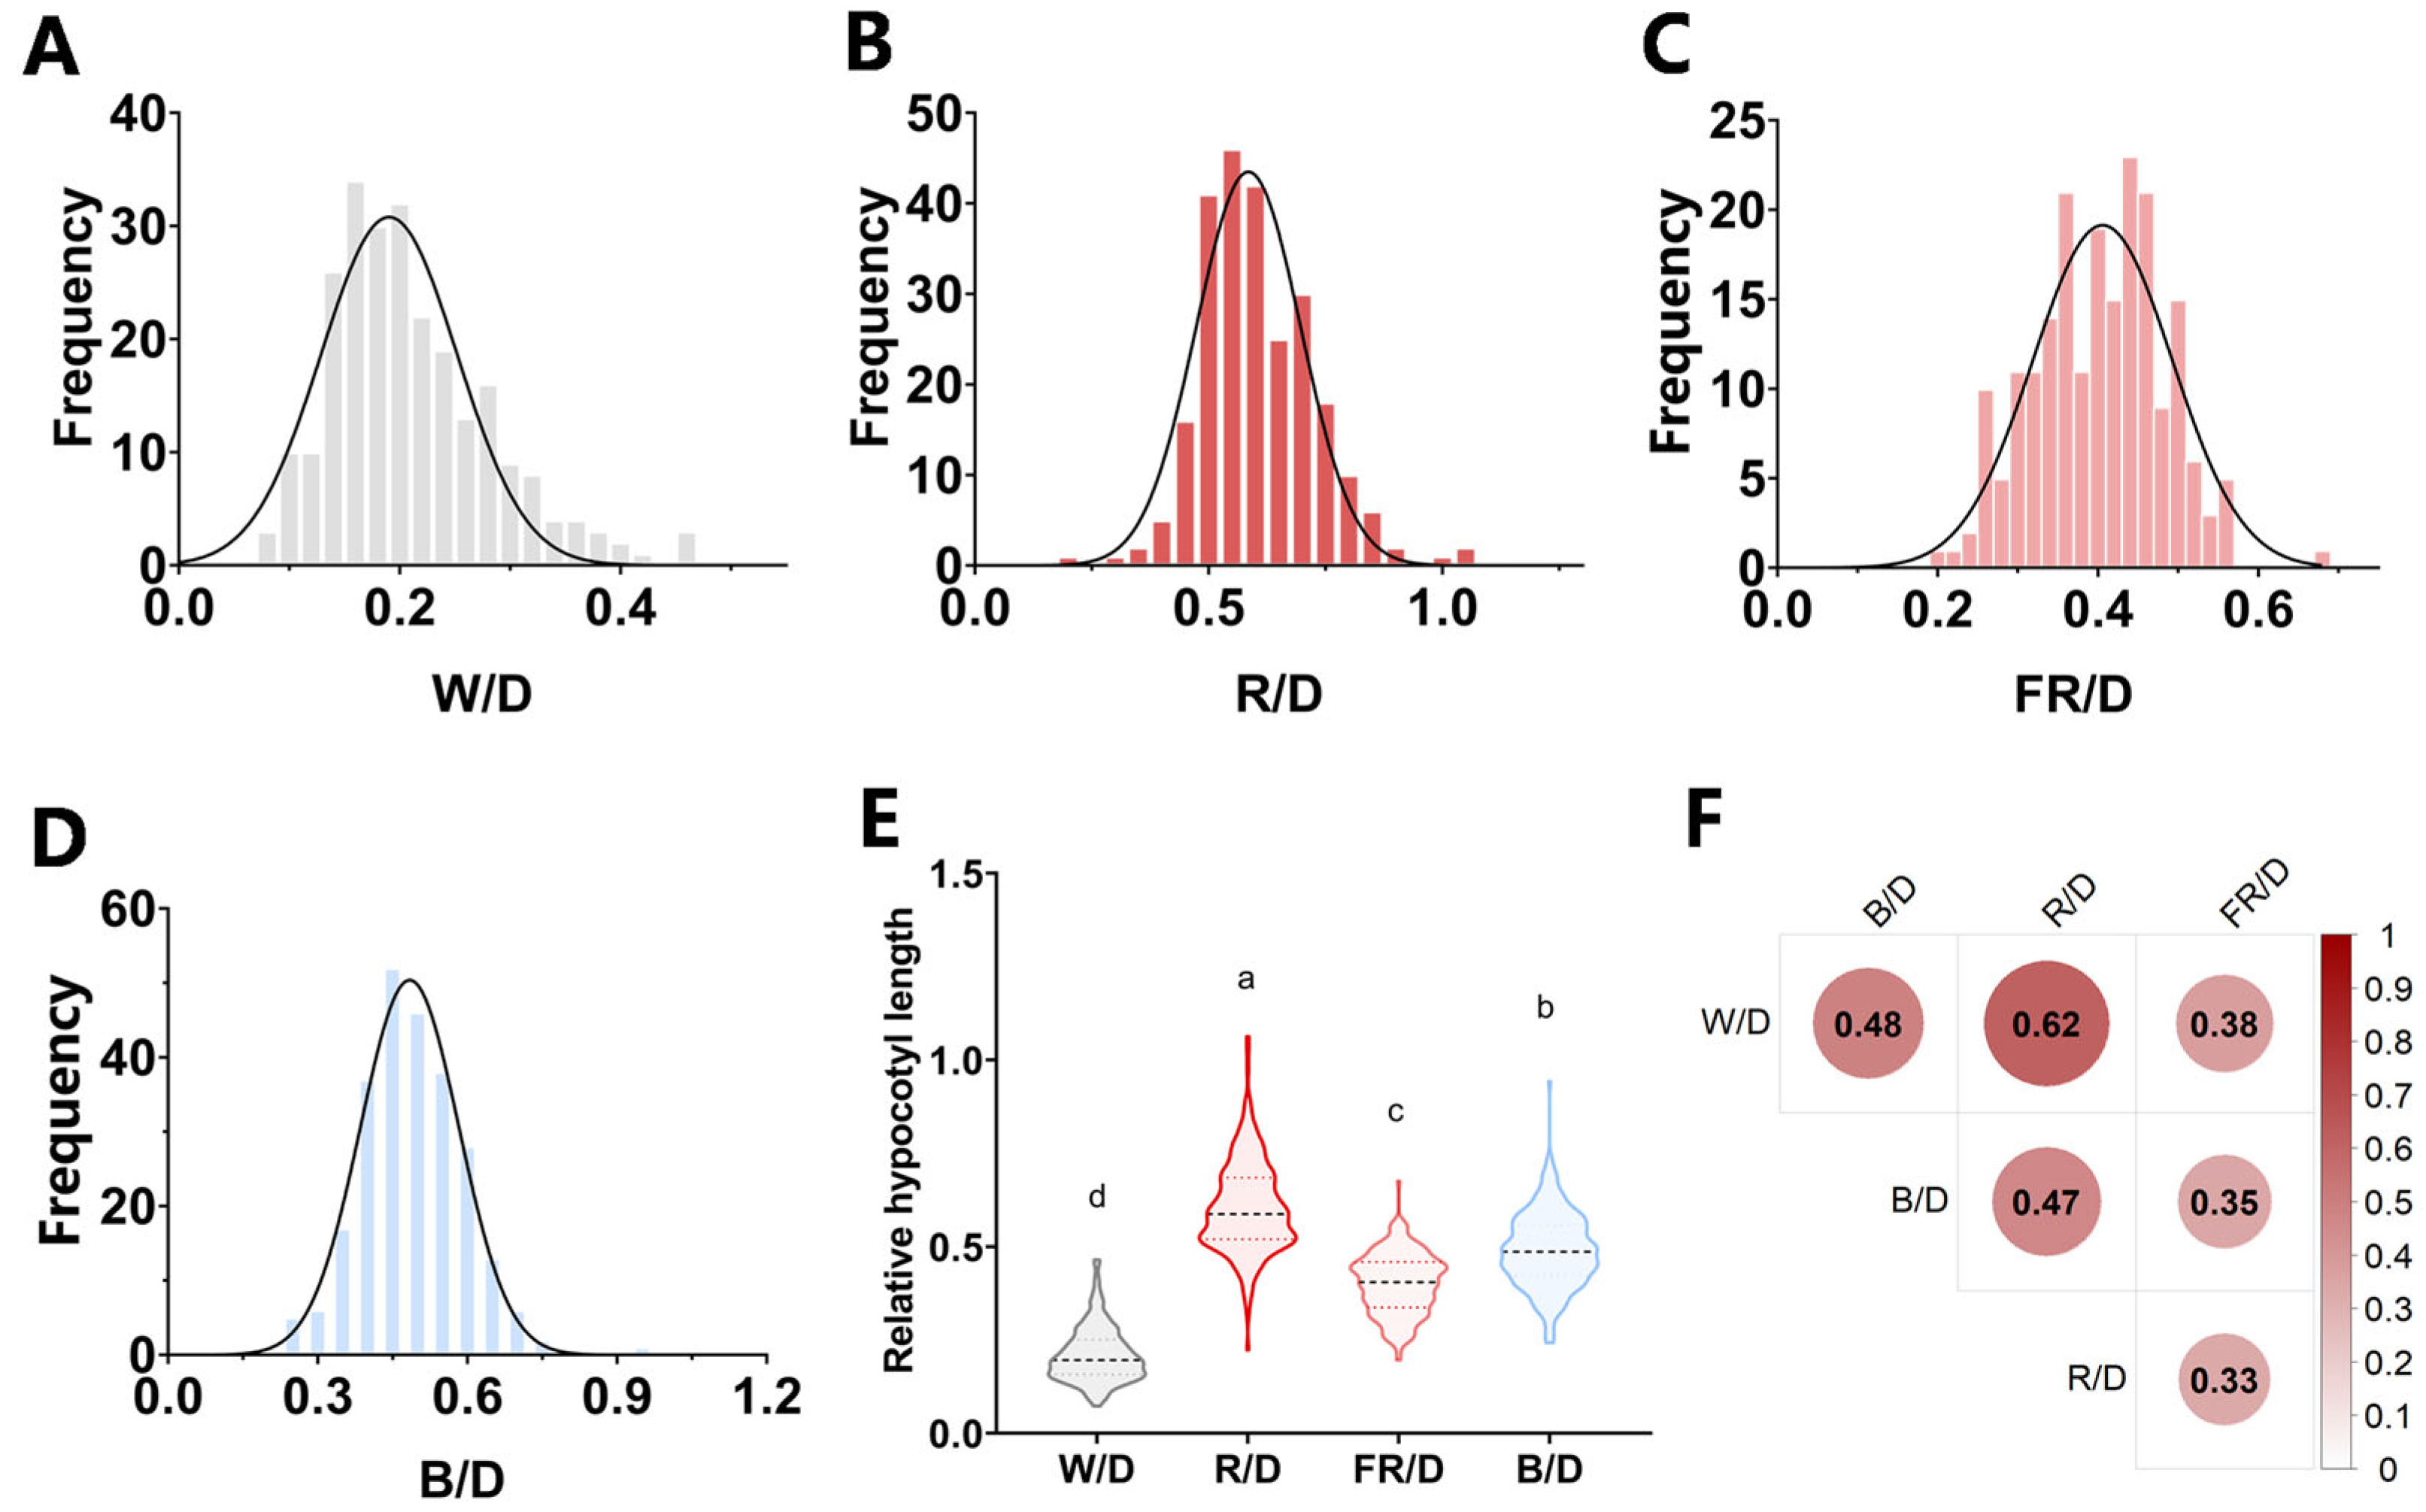
Figure 1. Phenotypic analysis of Brassica napus under different light quality treatments. (A) Frequency distribution of relative hypocotyl length in white light compared to dark. (B) Frequency distribution of relative hypocotyl length in red light compared to dark. (C) Frequency distribution of relative hypocotyl length in far-red light compared to dark. (D) Frequency distribution of relative hypocotyl length in blue light compared to dark. (E) Distribution of relative hypocotyl length under different light quality treatment. One-way ANOVA was performed to analyze the significant differences between samples. (F) Correlation analysis of relative hypocotyl length under different light quality treatment. Data are means ± SD of 3-5 biological replicates, and complete datasets are provided in Table S1, different letters indicate significant differences at the level of p < 0.05.
Agronomy 15 02047 g001
Figure 2. Hierarchical cluster of the relative hypocotyl length under white light, red light, far-red light, and blue light. The label on the outside of the ring is the variety. The data were normalized by taking the logarithm base 2 for each column, and then clustered by rows.
Agronomy 15 02047 g002
Figure 3. The GWAS of relative hypocotyl length of Brassica napus under different light quality treatment. (A) Manhattan plots for relative hypocotyl length in white light compared to dark. The dashed horizontal line depicts the uniform significance threshold (–log10 (p) = 4.5). (B) Manhattan plots for relative hypocotyl length in red light compared to dark. The dashed horizontal line depicts the uniform significance threshold (–log10 (p) = 4.5). (C) Manhattan plots for relative hypocotyl length in far-red light compared to dark. The dashed horizontal line depicts the uniform significance threshold (–log10 (p) = 4.5). (D) Manhattan plots for relative hypocotyl length in blue light compared to dark. The dashed horizontal line depicts the uniform significance threshold (–log10 (p) = 4.5). (E) Quantile–quantile plots for relative hypocotyl length in white light compared to dark. (F) Quantile–quantile plots for relative hypocotyl length in red light compared to dark. (G) Quantile–quantile plots for relative hypocotyl length in far-red light compared to dark. (H) Quantile–quantile plots for relative hypocotyl length in blue light compared to dark. (EH) The horizontal coordinate represents the expected value and the vertical coordinate represents the observed value. The red line in the graph represents the 45° centerline.
Agronomy 15 02047 g003
Figure 4. Comparison of relative hypocotyl length in genotypes with different alleles of significant SNPs. (A) Phenotypic difference between lines carrying different alleles of locus Bn-A02-p1370806 in BnKAN1 under white light. (B) Phenotypic difference between lines carrying different alleles of locus Bn-A03-p4813862 in BnILL2 under red light. (C) Phenotypic difference between lines carrying different alleles of locus Bn-A03-p4814589 in BnILL2 under red light. (D) Phenotypic difference between lines carrying different alleles of locus Bn-C04-p47575333 in BnVQ18 under far-red light. The statistical significance was estimated by t-test, * significant at p ≤ 0.05; ** significant at p ≤ 0.01.
Agronomy 15 02047 g004
Figure 5. Analysis of the haplotypes of BnHDA15 under red light. (A) Gene structure and SNP distribution of BnHDA15 and phenotypic difference between lines carrying different alleles of locus Bn-C01-p33293382, p33293762, p33294303, p33294325, p33294781, and p33295904 in BnHDA15. The statistical significance was estimated by t-test, * significant at p ≤ 0.05; ** significant at p ≤ 0.01. (B) Amino acid sequence alignment of AtHDA15 and BnHDA15. ZF indicates the zinc finger domain. HD indicates alignment of histone deacetylase domains. Red frame indicates the nuclear export signal. Red arrows indicate SNPs of HDA15 identified in this study. (C) The expression of AtHDA15(AT3G18520) in different tissues [33].
Agronomy 15 02047 g005
Figure 6. Comparison of relative hypocotyl length in genotypes with different alleles of significant SNPs. (A) LD heatmap of chrC08. The points in the figure are significant SNP sites, –log10(p value) = 4.5. (B) Phenotypic difference between lines carrying different alleles of locus Bn-C08-p30302105 in BnHAT3 under red and blue light. The statistical significance was estimated by one-way ANOVA, ** significant at p ≤ 0.01; **** significant at p ≤ 0.0001. (C) The expression of AtHAT3(AT3G60390) in different tissues [33].
Agronomy 15 02047 g006
Disclaimer/Publisher’s Note: The statements, opinions and data contained in all publications are solely those of the individual author(s) and contributor(s) and not of MDPI and/or the editor(s). MDPI and/or the editor(s) disclaim responsibility for any injury to people or property resulting from any ideas, methods, instructions or products referred to in the content.