Article

Transcriptomics and Metabolomics Analyses Reveal How Rhizobacteria Acinetobacter calcoaceticus Enhance the Growth and Stress Tolerance in Lespedeza davurica

1
College of Grassland Science, Shanxi Agricultural University, Jinzhong 030801, China
2
Carbon Sink Trading Coordination Service Center of Hulun Buir City, Hulun Buir 021008, China
3
School of Grassland Science, Beijing Forestry University, Beijing 100083, China
*
Authors to whom correspondence should be addressed.
Agronomy 2025, 15(8), 1992; https://doi.org/10.3390/agronomy15081992
Submission received: 14 July 2025 / Revised: 15 August 2025 / Accepted: 16 August 2025 / Published: 19 August 2025
(This article belongs to the Special Issue Research Progress on Pathogenicity of Fungi in Crops—2nd Edition)

Abstract

Background: Lespedeza davurica is an important perennial leguminous shrub endemic to China’s Loess Plateau, and it plays a crucial role in ecosystem restoration and soil erosion control. However, phosphorus deficiency and environmental stresses limit its growth potential and ecological function. Methods: In the present study, the interaction between Acinetobacter calcoaceticus DP25, a phosphate-solubilizing rhizobacterium isolated from L. davurica rhizosphere, and L. davurica was investigated. We performed biochemical analyses of leaves from L. davurica planted in saline–alkali soil to monitor antioxidant defense systems and stress-related metabolites, and conducted a combination of transcriptomics and metabolomics approaches to elucidate the bacteria-mediated enhancement of growth and stress tolerance in L. davurica. Results: DP25 inoculation substantially enhanced L. davurica growth performance, increasing plant height by 47.68%, biomass production by 102.54–132.42%, and root architecture parameters by 62.68–78.79% (p < 0.0001). Catalase activity, a key antioxidant enzyme, showed a marked increase of 41.53% (p < 0.001), while malondialdehyde and free proline contents decreased by 18.13% and 19.33%, respectively (p < 0.05). Transcriptomic analysis revealed 263 differentially expressed genes, with enrichment in carotenoid biosynthesis, ABC transporters, and pentose and glucuronate interconversion pathways. Metabolomic profiling identified 246 differentially accumulated metabolites, highlighting enhanced secondary metabolite production and stress response mechanisms. Integration of multi-omics data revealed 19 co-regulated pathways involved in growth promotion and stress tolerance. Conclusions: A. calcoaceticus DP25 enhances L. davurica growth through coordinated regulation of metabolic pathways involved in photosynthesis, antioxidant defense, and secondary metabolite biosynthesis. These findings provide molecular insights into beneficial plant–microbe interactions and support the development of sustainable strategies for ecosystem restoration in degraded environments.

1. Introduction

The Loess Plateau of China, covering approximately 640,000 km2 in the middle reaches of the Yellow River, is one of the world’s most severely eroded regions and a critical area for understanding ecosystem degradation and restoration dynamics [1,2]. Lespedeza davurica (Laxm.) Schindl., a perennial leguminous forage species, plays a crucial ecological role in grassland restoration and sustainable agriculture across China’s Loess Plateau region [3]. This species exhibits exceptional adaptability to harsh environmental conditions, including drought, salinity, and nutrient-poor soils, making it invaluable for ecosystem rehabilitation and livestock production [4,5]. However, widespread soil degradation, phosphorus deficiency, and increasing environmental stresses in the Loess Plateau region seriously threaten the stability and sustainable development of the ecosystem in this region and significantly limit its growth potential and ecological benefits in these marginal landscapes [6,7,8].
Plant growth-promoting rhizobacteria (PGPR) have become a sustainable biotechnological solution for enhancing plant growth and stress tolerance while reducing dependence on chemical fertilizers [9,10]. These beneficial microorganisms colonize plant rhizospheres and promote growth through diverse mechanisms, including phosphate solubilization, phytohormone production, siderophore synthesis, and enhancement of plant stress tolerance [11,12]. As a critical nutrient element, phosphorus is indispensable for plant development. Although the phosphorus content in soil is high, there is little available phosphorus for plants to absorb and utilize. Phosphate in soil mostly exists in an insoluble state, with insoluble phosphorus accounting for approximately 95–99% of the phosphorus in soil [13,14]. Phosphate-solubilizing bacteria (PSB), which fall under the PGPR group, can efficiently transform insoluble plant phosphorus in soil into available phosphorus for plants to absorb and utilize in a variety of ways [15]. The rhizospheres of Lespedeza are relatively rich in microbial resources. Thirty-nine bacterial strains were isolated from L. davurica rhizospheres and root nodules, twenty-four of which possessed phosphate-solubilizing and cowpea growth-promoting functions [16]. Phosphorus-solubilizing bacteria around the roots of Lespedeza can promote plant stability by increasing the contents of hemicellulose and lignin [17]. Among PGPR, Acinetobacter calcoaceticus has demonstrated exceptional phosphate-solubilizing capabilities and plant growth-promoting activities across diverse plant species [18]. A. calcoaceticus strains solubilize phosphate and generate considerable levels of indole acetic acid (IAA), effectively decrease the arsenic load, and improve plant growth, making them some of the most promising candidates for promoting plant growth in arsenic-contaminated regions [19]. A. calcoaceticus DP25 is a PGPR isolated from the rhizospheres of L. davurica that can solubilize potassium and produce organic acids, siderophores, and IAA to promote the growth of L. davurica. However, the plant response pattern in L. davurica to A. calcoaceticus and the causal mechanisms for the growth enhancement mediated by A. calcoaceticus DP25 in L. davurica have not been determined.
The mechanisms by which PGPR promote growth and resist diseases include improving nutrient supply and uptake, producing phytohormones and signaling molecules, synthesizing volatile organic compounds, and secreting antibiotics [20,21]. Rhizosphere growth-promoting bacteria are associated with plant osmoregulation by influencing the synthesis of soluble protein, soluble sugars, and free proline. Additionally, these bacteria contribute to plant stress tolerance by stimulating the activity of antioxidant enzymes, such as catalase (CAT), peroxidase (POD), and superoxide dismutase (SOD), which are essential for detoxifying reactive oxygen species (ROS) and mitigating oxidative damage [22,23,24]. Specifically, SODs can transform O2 into hydrogen peroxide (H2O2) through disproportionation reactions, followed by the decomposition of H2O2 by CAT and POD [25,26]. Under abiotic stress, malonaldehyde (MDA) accumulates as a byproduct of lipid peroxidation, serving as an indicator of oxidative damage to cell membranes [27,28,29]. Transcriptomic sequencing technology can be used to quickly obtain comprehensive transcriptional mRNA sequence data for a particular tissue during specific stages to reveal the molecular mechanism underlying a biological process [30]. Metabolomics enables precise discrimination of metabolites with important biological and statistical significance in biological samples and reveals the mechanisms underlying metabolic changes in organisms [31]. By integrating transcriptomics with metabolomics, the limitations of single-omics studies can be addressed to a certain extent, and this method can be used to better analyze the transcriptional regulatory mechanisms related to metabolic pathways.
Here, we conducted the first integrated transcriptomic and metabolomic analysis of A. calcoaceticus DP25-mediated growth enhancement in L. davurica. Our objectives were to (1) characterize the physiological effects of DP25 inoculation on L. davurica growth and stress tolerance; (2) identify differentially expressed genes and metabolic pathways involved in the plant response to bacterial inoculation; (3) elucidate the molecular mechanisms underlying enhanced growth and stress tolerance through integration of multi-omics data; and (4) provide insights into the evolutionary and ecological significance of beneficial plant–microbe interactions in ecosystem restoration contexts. Our findings provide molecular insights that can inform the development of microbial inoculants for sustainable ecosystem restoration on the Loess Plateau and similar degraded environments worldwide.

2. Materials and Methods

2.1. Bacterial Strain and Plant Material

The experiment was conducted from July 2023 to February 2024. A. calcoaceticus DP25, a phosphate-solubilizing rhizobacterium previously isolated from the L. davurica rhizosphere soil collected from Taigu District, Jinzhong City, Shanxi Province, China (112°60′ E, 37°44′ N). The bacterial isolate was authenticated through 16S rRNA gene sequencing and maintained in glycerol stocks at −80 °C [32]. Seeds of L. davurica ‘Jinnong No. 1’ were provided by the National Forage Germplasm Resource Nursery (Taigu) of Shanxi Agricultural University and stored under controlled conditions.

2.2. Bacterial Inoculum Preparation

Single colonies of DP25 were cultured in Luria-Bertani (LB) broth (10 g/L tryptone, 5 g/L yeast extract, and 10 g/L sodium chloride, pH 7.0–7.5) at 28 °C, with constant agitation at 180 rpm for 20 h [33,34]. Bacterial cells were harvested by centrifugation at 4 °C at 10,000 rpm for 10 min and then resuspended in sterile distilled water to achieve an optical density of 0.01 at 600 nm (approximately 5 × 10⁶ CFU/mL), as determined by serial dilution and plate counting.

2.3. Plant Growth Assay and Experimental Design

The soil used was collected from L. davurica planting fields in Jinzhong City, Shanxi Province (112°60′ E, 37°44′ N). The physicochemical characteristics of the soil are as follows: total phosphorus is 0.57 g·kg−1, available phosphorus is 33.40 mg·kg−1, total nitrogen is 1.20 g·kg−1, alkali-hydrolysis nitrogen is 10.00 mg·kg−1, total potassium is 18.7 g·kg−1, available potassium is 275 mg·kg−1, water-soluble salt content is 5.33 g·kg−1, pH value is 8.60, saturation capacity is 24.01%, and it is a saline–alkali soil.
Seeds were surface sterilized with 5% sodium hypochlorite for 10 min, followed by six rinses with sterile distilled water. Following sterilization, the seeds were planted in an autoclaved soil mixture (15 seeds·pot−1) and maintained under controlled growth conditions in an incubator (at 25:20 °C (day/night), with a photoperiod of 14:10 h (light:dark) cycle, 8000 Lux light intensity, and 50% relative humidity) in July 2023. Sterile water was regularly replenished using gravimetry to maintain the soil water content at 75% of the maximum field capacity. After 7 days of cultivation, seedlings were selectively thinned such that one uniformly developed plant per pot was retained. The stem base of L. davurica plants was inoculated with 20 mL of DP25 bacterial suspension with an OD600 of 0.01 (5 × 10⁶ cfu·mL−1) on the 14th day of seedling growth and subsequently inoculated every 7 days for a total of 4 times. The control plants were inoculated with 20 mL of sterile water, with each experimental condition replicated in 120 individual pots.
After 42 days of culture, samples were collected. Plant height was measured vertically with a ruler. The shoots and roots were then separated, and their fresh and dry weights were determined using an analytical balance. The root parameters were acquired using a root scanner (MICROTEK, Shanghai, China).

2.4. Biochemical Assays

The leaves were weighed and used to determinate the antioxidant enzyme activities and stress-related metabolite contents. Nitro blue tetrazolium (NBT) reduction assays were employed to determine SOD activity levels [35]. POD activity analysis was performed following standard guaiacol protocols [36]. A spectrophotometric assay for CAT activity was conducted by monitoring the consumption of H2O2 with guaiacol as the substrate [37]. The total soluble protein content was determined colorimetrically using Coomassie blue G250 [38]. Anthrone-based colorimetry was employed for soluble sugar determination [39]. Ninhydrin colorimetry was employed for free proline determination [40]. A thiobarbituric acid (TBA) assay was employed for MDA determination [41]. The following enzyme activities and metabolite contents were determined spectrophotometrically: SOD (560 nm), CAT (240 nm), POD (470 nm), soluble protein (595 nm), soluble sugars (620 nm), free proline (520 nm), and MDA (532 nm and 600 nm) [42].

2.5. Transcriptome Sequencing and Analysis

According to the manufacturer’s instructions, fresh leaf samples (0.5 g) were subjected to RNA extraction using a Tiangen DP411 kit (Tiangen Biochemical Technology Co., Ltd., Beijing, China). The concentration of RNA was quantified using a Nanodrop2000 spectrophotometer (Thermo Fisher Scientific, Wilmington, DE, USA), and RNA integrity was assessed using an Agilent Bioanalyzer 2100 system (Agilent Technologies Inc., Santa Clara, CA, USA) [43]. Qualified RNA samples were used for transcriptomic sequencing. The raw sequencing data were deposited in the National Center for Biotechnology Information (NCBI) database under the accession number SRP557964, maintained by the National Library of Medicine (Bethesda, MD, USA).
A transcriptome library was constructed according to the botanical method on the basis of sequencing by synthesis (SBS) technology. cDNA libraries were prepared for six leaves using the Illumina NovaSeq 6000 platform (Illumina, San Diego, CA, USA) and used for subsequent bioinformatics analysis. HISAT2 2.2.1 software was used to quickly and accurately compare the clean reads with the reference genome to obtain the location of the reads relative to the reference genome [44]. The HISAT2-aligned reads were analyzed using StringTie to detect both annotated and previously uncharacterized transcripts [45]. Gene functional annotation was conducted by querying multiple databases, including the NCBI nonredundant protein sequence (Nr), protein family (Pfam), SwissProt, Gene Ontology (GO), Clusters of Eukaryotic Orthologous Groups (KOGs), KEGG, and KEGG Orthology (KO) databases. For the identification of DEGs, fragments per kilobase per million (FPKM)-normalized read counts were statistically analyzed using DESeq2, with DEGs determined by fold change (FC) thresholds between sample groups [46,47]. DEGs were identified between DP25-treated and water-treated leaf samples using an FC cut-off of ≥1.5 and a false discovery rate (FDR)-adjusted p-value threshold of <0.01.
Fourteen DEGs were randomly selected for quantitative real-time PCR (qRT-PCR) validation to corroborate the RNA-seq results (Table S1). Quantitative analysis of the cDNA templates was performed using a CFX96TM Real-Time System (Bio-Rad Laboratories, Hercules, CA, USA), with Actin-7 (evm.TU.LG07.1400) serving as the internal reference gene. Gene expression levels were calculated using the 2−ΔΔCt method across three technical replicates [48].

2.6. Metabolomic Analysis

Leaf tissue samples (50 mg) were accurately weighed into prechilled 1.5 mL microcentrifuge tubes. Each sample received 1000 μL of ice-cold extraction solvent (methanol/acetonitrile/water, 2:2:1) containing 2 mg/L internal standard. The samples were vortexed vigorously for 30 s and then homogenized using a ball mill grinder (10 min at 45 Hz frequency), followed by ice-bath ultrasonication to ensure complete cell lysis and metabolite extraction. The samples were protein-precipitated (−20 °C, 1 h) and centrifuged (12,000 rpm, 4 °C, 15 min), and 500 μL of the supernatant was vacuum-dried for downstream analysis. The dried extracts were redissolved in 160 μL of a 1:1 (v/v) acetonitrile–water extraction mixture, vortexed (30 s), and ultrasonicated (10 min in an ice bath). The samples were subsequently centrifuged at 12,000 rpm at 4 °C for 15 min. Finally, 120 μL of the supernatant was transferred to a 2 mL injection bottle, and 10 μL of each sample was collected for UPLC-MS/MS analysis.
Data analysis was performed with an Acquity UPLC HSS T3 column (2.1 mm × 100 mm, 1.8 μm; Waters, Milford, MA, USA) using a UPLC system (Acquity UPLC I-Class PLUS, Waters, Milford, MA, USA). A gradient elution method was employed, utilizing mobile phases A and B. Ultrapure water containing 0.1% formic acid was employed as mobile phase A, while acetonitrile with 0.1% formic acid served as mobile phase B. The gradient elution program was set as follows: 98:2 (A/B) for the initial 10 min, 2:98 (A/B) from 11 to 13 min, and 98:2 (A/B) from 14 to 15 min.
The effluent was subjected to analysis using a Xevo G2-XS QTOF mass spectrometer (Waters, Milford, MA, USA) equipped with Mass Lynx V4.2 acquisition software (Waters, Milford, MA, USA). During each data acquisition cycle, dual-channel data collection was performed concurrently at low and high collision energies [49]. The low collision energy was set at 2 V, whereas the high collision energy spanned a range of 10 to 40 V, with a scanning frequency of 0.2 s per spectrum. The electrospray ionization (ESI) source parameters were as follows: capillary voltage of 2000 V (positive ion mode) or −1500 V (negative ion mode); cone voltage of 30 V; ion source temperature of 150 °C; desolvent gas temperature of 500 °C; backflush gas flow rate of 50 L/h; and desolventizing gas flow rate of 800 L/h [50].
Peak extraction, alignment, and other data processing steps were performed on the raw data acquired from MassLynx V4.2 via Progenesis QI 4.0 software [50]. Metabolite identification was carried out by querying the online METLIN database and Biomark’s in-house library, with theoretical fragment annotation and mass deviation constrained to within 100 ppm. Following normalization of the raw peak area data to the total peak area, subsequent analyses were carried out. Orthogonal projections to latent structures discriminant analysis (OPLS-DA) was applied, and the R package 3.6.1 ropls was used for model construction. Model reliability was validated using 200 permutation tests, and variable importance in projection (VIP) values were computed via multiple cross-validations [51]. Differential accumulated metabolites (DAMs) were identified by integrating the fold change (FC > 1), p-value (<0.05), and VIP (>1) thresholds. KEGG pathway analysis was conducted to identify metabolic pathways associated with the DAMs.

2.7. Statistical Analysis

In the present study, twenty biological replicates were used for phenotypic characterization, three biological replicates were utilized for biochemical determinations and transcriptomic profiling, and six biological replicates were employed for metabolic profiling. The statistical significance of the differences was evaluated using t-tests via SPSS Statistics software (Version 19.0; SPSS Inc., Chicago, IL, USA). Figures were generated using Origin 2021 software.

3. Results

3.1. A. calcoaceticus DP25 Inoculation Significantly Enhances Growth Performance of L. davurica

DP25 significantly promoted the growth of L. davurica (Figure 1a). The plant height and fresh and dry weight of aboveground and belowground parts of L. davurica plants inoculated with DP25 were 6.04 cm, 99.90 mg, 63.77 mg, 33.85 mg, and 9.58 mg, and their values were significantly greater (by 47.68%, 132.42%, 118.90%, 130.90%, and 102.54%, respectively) than those of control L. davurica plants (p < 0.001) (Figure 1b–f).
A. calcoaceticus DP25 significantly improved the root morphology of L. davurica (Figure 2). The root tip number, root length, total root surface area, and root volume of L. davurica plants inoculated with DP25 were 90.10, 28.76 cm, 89.86 mm2, and 2.67 mm3, and they presented significantly greater values (by 73.27%, 71.48%, 62.68%, and 78.79%, respectively) than the control L. davurica plants did (p < 0.001) (Figure 2).

3.2. A. calcoaceticus DP25 Treatment Modulates Antioxidant Defense Systems and Stress-Related Metabolites

A. calcoaceticus DP25 significantly improved antioxidant enzyme activity in L. davurica. SOD and POD activity in L. davurica inoculated with DP25 increased by 1.42% and 11.02%, respectively. However, there was no statistical significance between the treated plants and the control ones. CAT activity in L. davurica inoculated with DP25 significantly increased to 222.92 U·g−1 FW (p < 0.001), representing a 41.53% increase over that in the control group. The content of soluble protein in L. davurica inoculated with DP25 (1.67 mg/g) and untreated control (1.68.mg/g) was similar. The soluble sugar content was 6.82 μmol/g and increased by 14.88% than that of the untreated control with no statistical significance. Moreover, the MDA (26.98 μmol/g) and free proline contents (31.39 mg/g) significantly decreased by 18.13% and 19.33%, respectively (p < 0.05; Figure 3).

3.3. Transcriptomic Profiling of A. calcoaceticus DP25-Mediated Growth Promotion in L. davurica

3.3.1. Transcriptome Sequencing and Identification of Differentially Expressed Genes (DEGs)

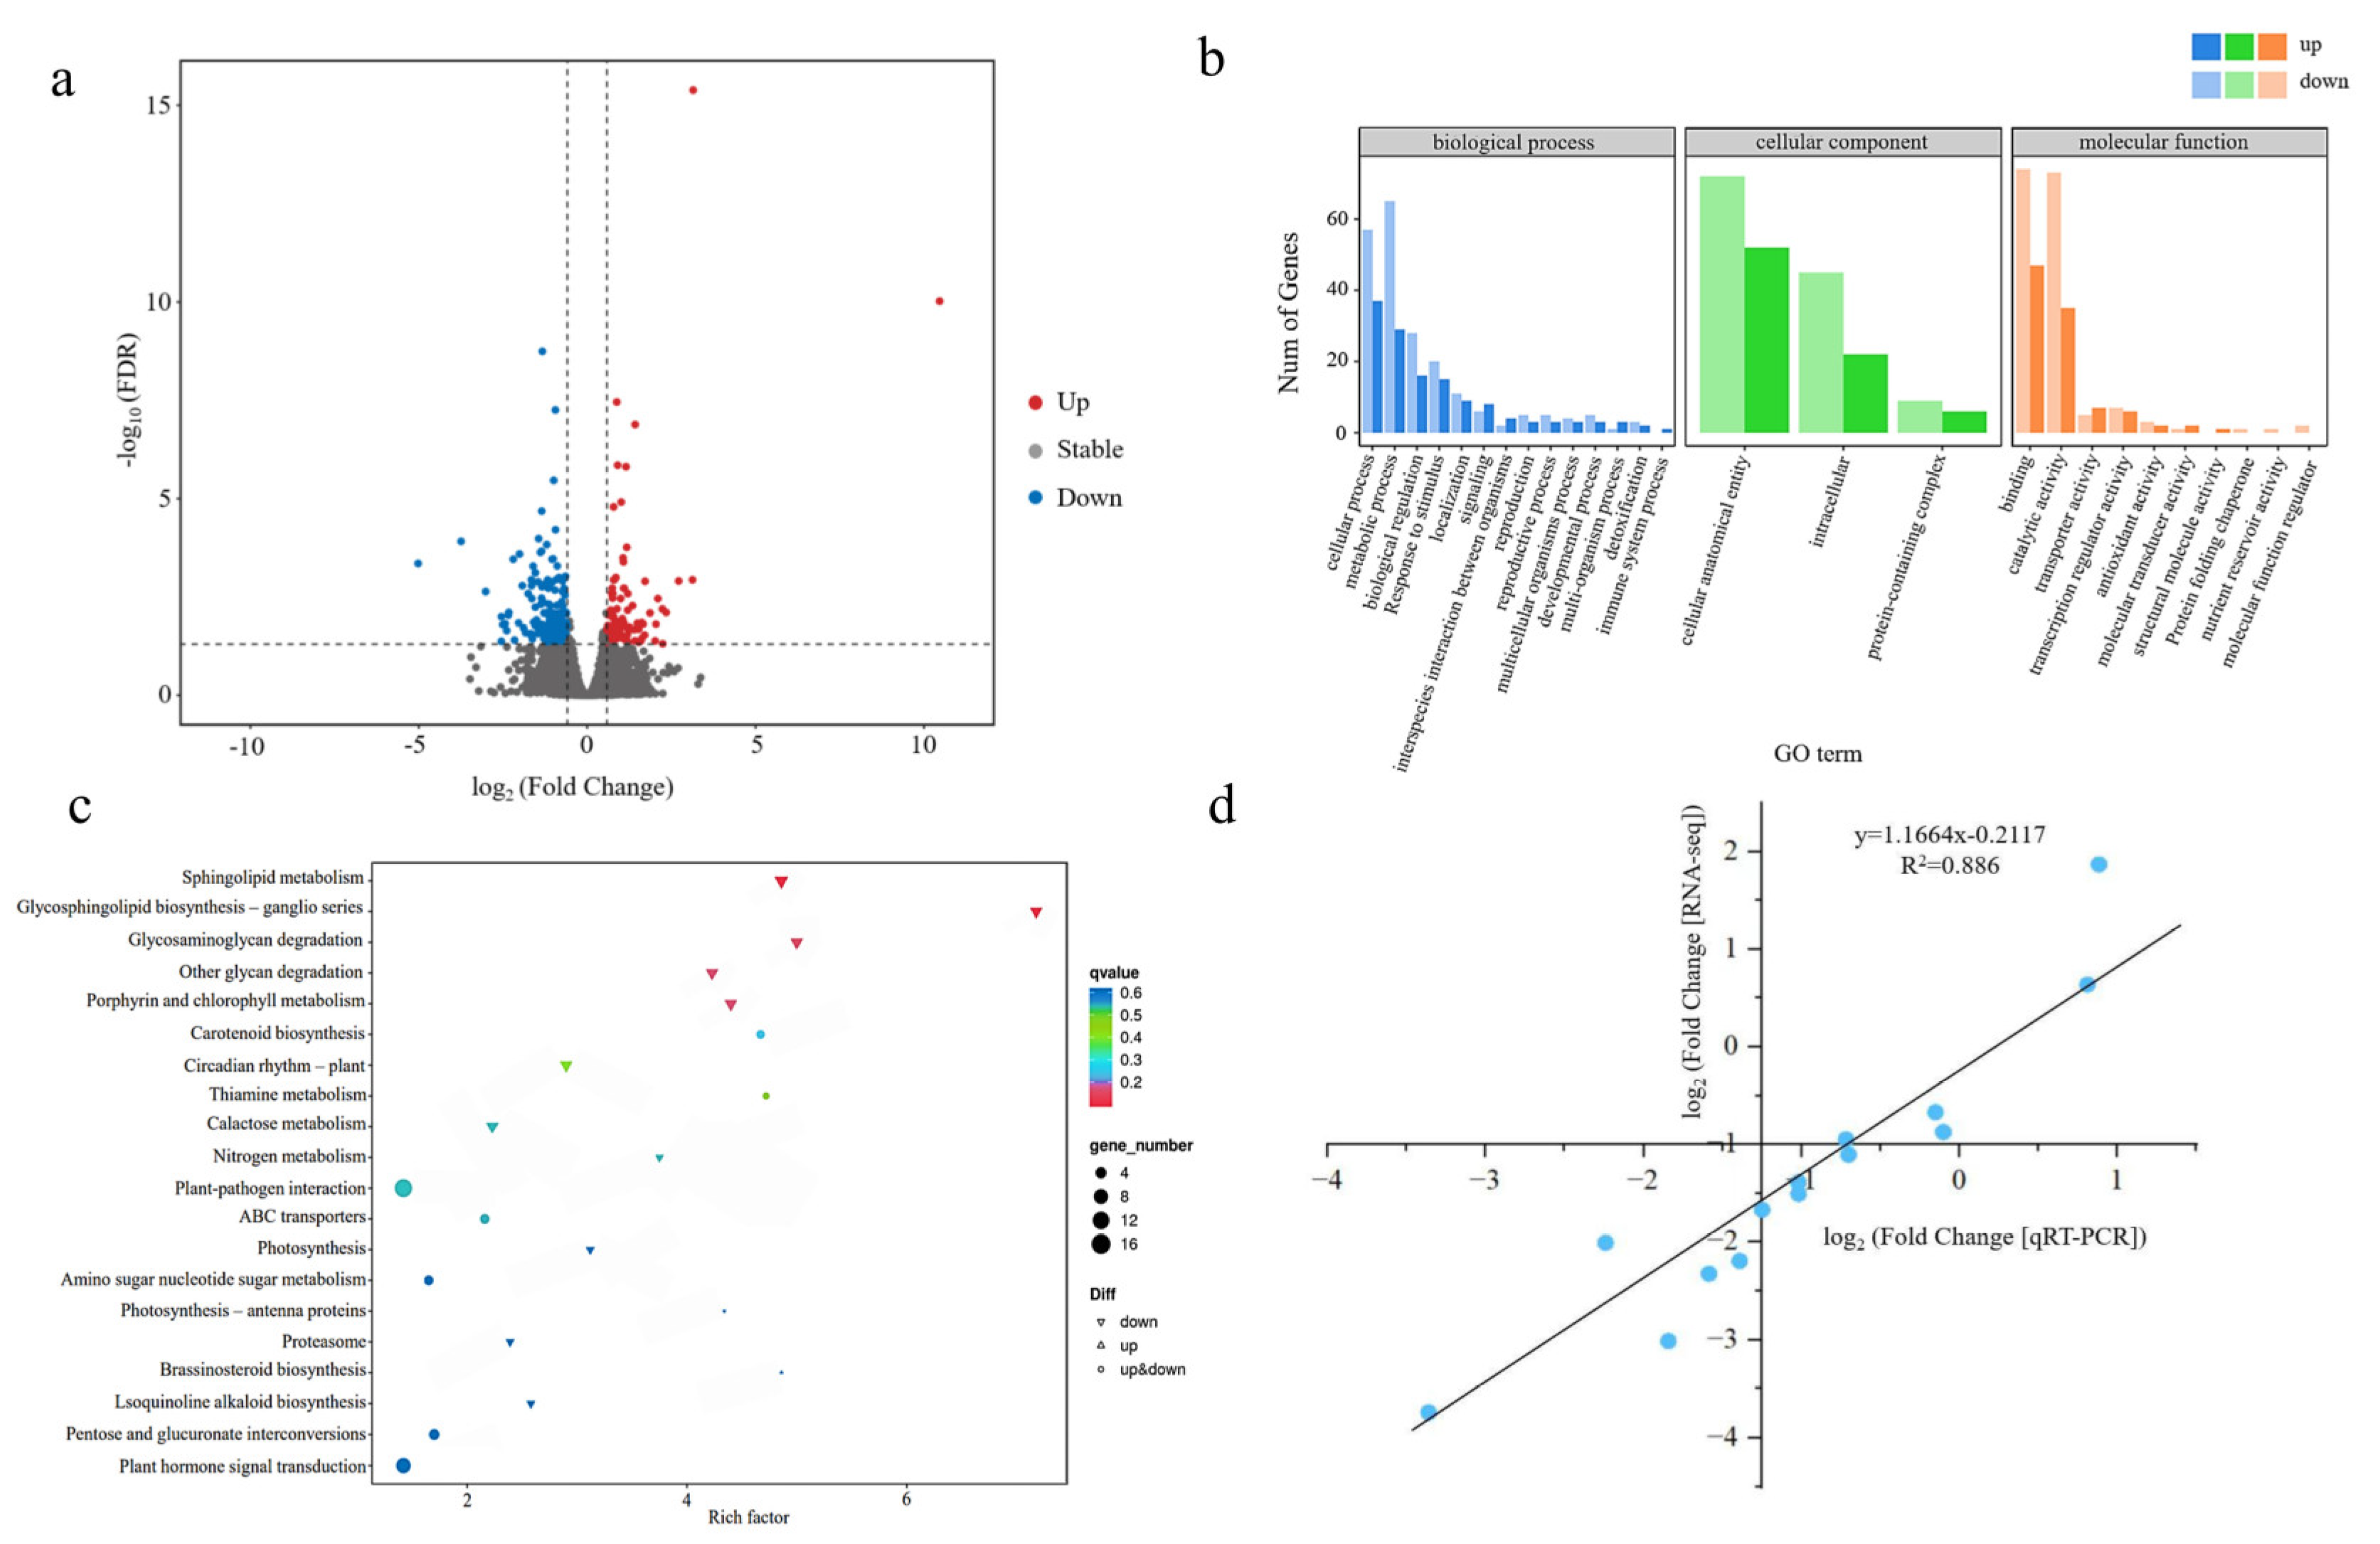
Following the elimination of low-quality reads, a cumulative 41.13 gigabytes of high-quality clean data was produced. The average clean data yield per sample was 5.78 gigabytes, with a base error rate of 0.02%. The percentage of Q30 bases in all the samples was no less than 92.97%. The GC content ranged from 43.72 to 44.36%, and the percentage of transcriptome sequencing reads aligning to the L. davurica reference genome fell within 69.56–70.71%. These metrics indicated high sequencing quality and suitability of the transcriptome dataset for downstream analyses. In the comparative analysis of the water-treated and DP25-treated samples, a total of 263 differentially expressed genes (DEGs) were detected, including 93 upregulated genes and 170 downregulated genes (Figure 4a and Table S2).

3.3.2. GO Functional Enrichment Analysis of DEGs

Gene Ontology (GO) enrichment analysis revealed that DEGs between L. davurica inoculated with A. calcoaceticus DP25 and L. davurica not inoculated with DP25 were significantly enriched in 27 enriched GO terms (Table S3). The biological processes associated with the greatest number of DEGs enriched were the cellular process and metabolic process. Many biological processes related to stress response, signal transduction, reproduction, etc., also involve a certain number of genes, but the overall number is relatively small. The cellular components associated with the greatest number of DEGs enriched were cellular anatomy and the intracellular space. The molecular functions associated with the greatest number of DEGs enriched were binding and catalytic activity (Figure 4b).

3.3.3. Functional Enrichment Analysis of DEGs Using the Kyoto Encyclopedia of Genes and Genomes (KEGG)

DEGs were enriched in the top 20 pathways with the lowest q-values, encompassing sphingolipid metabolism; glycosphingolipid biosynthesis—ganglio series; glycosaminoglycan degradation; other glycan degradation; porphyrin and chlorophyll metabolism; carotenoid biosynthesis; plant circadian rhythm; thiamine metabolism; galactose metabolism; nitrogen metabolism; plant-pathogen interaction; ABC transporters; photosynthesis; amino sugar and nucleotide sugar metabolism; photosynthesis-antenna proteins; proteasome; brassinosteroid biosynthesis; isoquinoline alkaloid biosynthesis; pentose and glucuronate interconversions; and plant hormone signal transduction (Figure 4c). Among these pathways, eight KEGG categories were enriched with upregulated DEGs. These included (1) metabolic pathways such as carotenoid biosynthesis, thiamine metabolism, brassinosteroid biosynthesis, amino sugar and nucleotide sugar metabolism, and pentose and glucuronate interconversions; (2) stress response and signaling pathways, including plant–pathogen interaction and plant hormone signal transduction; and (3) transport and energy conversion pathways represented by ABC transporters.

3.3.4. Verification of DEGs by qRT-PCR

To validate the RNA-seq results, we performed qRT-PCR analysis on 14 randomly selected DEGs using gene-specific primers (Table S1). The results of the qRT-PCR analysis of 14 randomly selected DEGs between the DP25-treated and control plants were highly concordant (r = 0.886) with the RNA-seq data, validating the accuracy of the transcriptome profile (Figure 4d).

3.4. Metabolomic Analysis of the Growth Promotion Effect of DP25 on L. davurica

3.4.1. Metabolite Annotation

Metabolomic investigation of L. davurica revealed 20,839 detectable peaks, with 5914 metabolites positively identified. KEGG pathway mapping was employed for systematic metabolite classification. The top 20 enriched KEGG pathways enriched with the most annotations included tyrosine metabolism; tryptophan metabolism; biosynthesis of various plant secondary metabolites; neomycin, kanamycin, and gentamicin biosynthesis; isoquinoline alkaloid biosynthesis; flavonoid biosynthesis; anthocyanin biosynthesis; phenylpropanoid biosynthesis; glucosinolate biosynthesis; flavone and flavonol biosynthesis; indole alkaloid biosynthesis; isoflavonoid biosynthesis; amino sugar and nucleotide sugar metabolism; arachidonic acid metabolism; ABC transporters; porphyrin metabolism; ubiquinone and other terpenoid-quinone biosynthesis; carotenoid biosynthesis; diterpenoid biosynthesis; and purine metabolism.

3.4.2. Statistical Characterization of Significantly Altered Metabolites

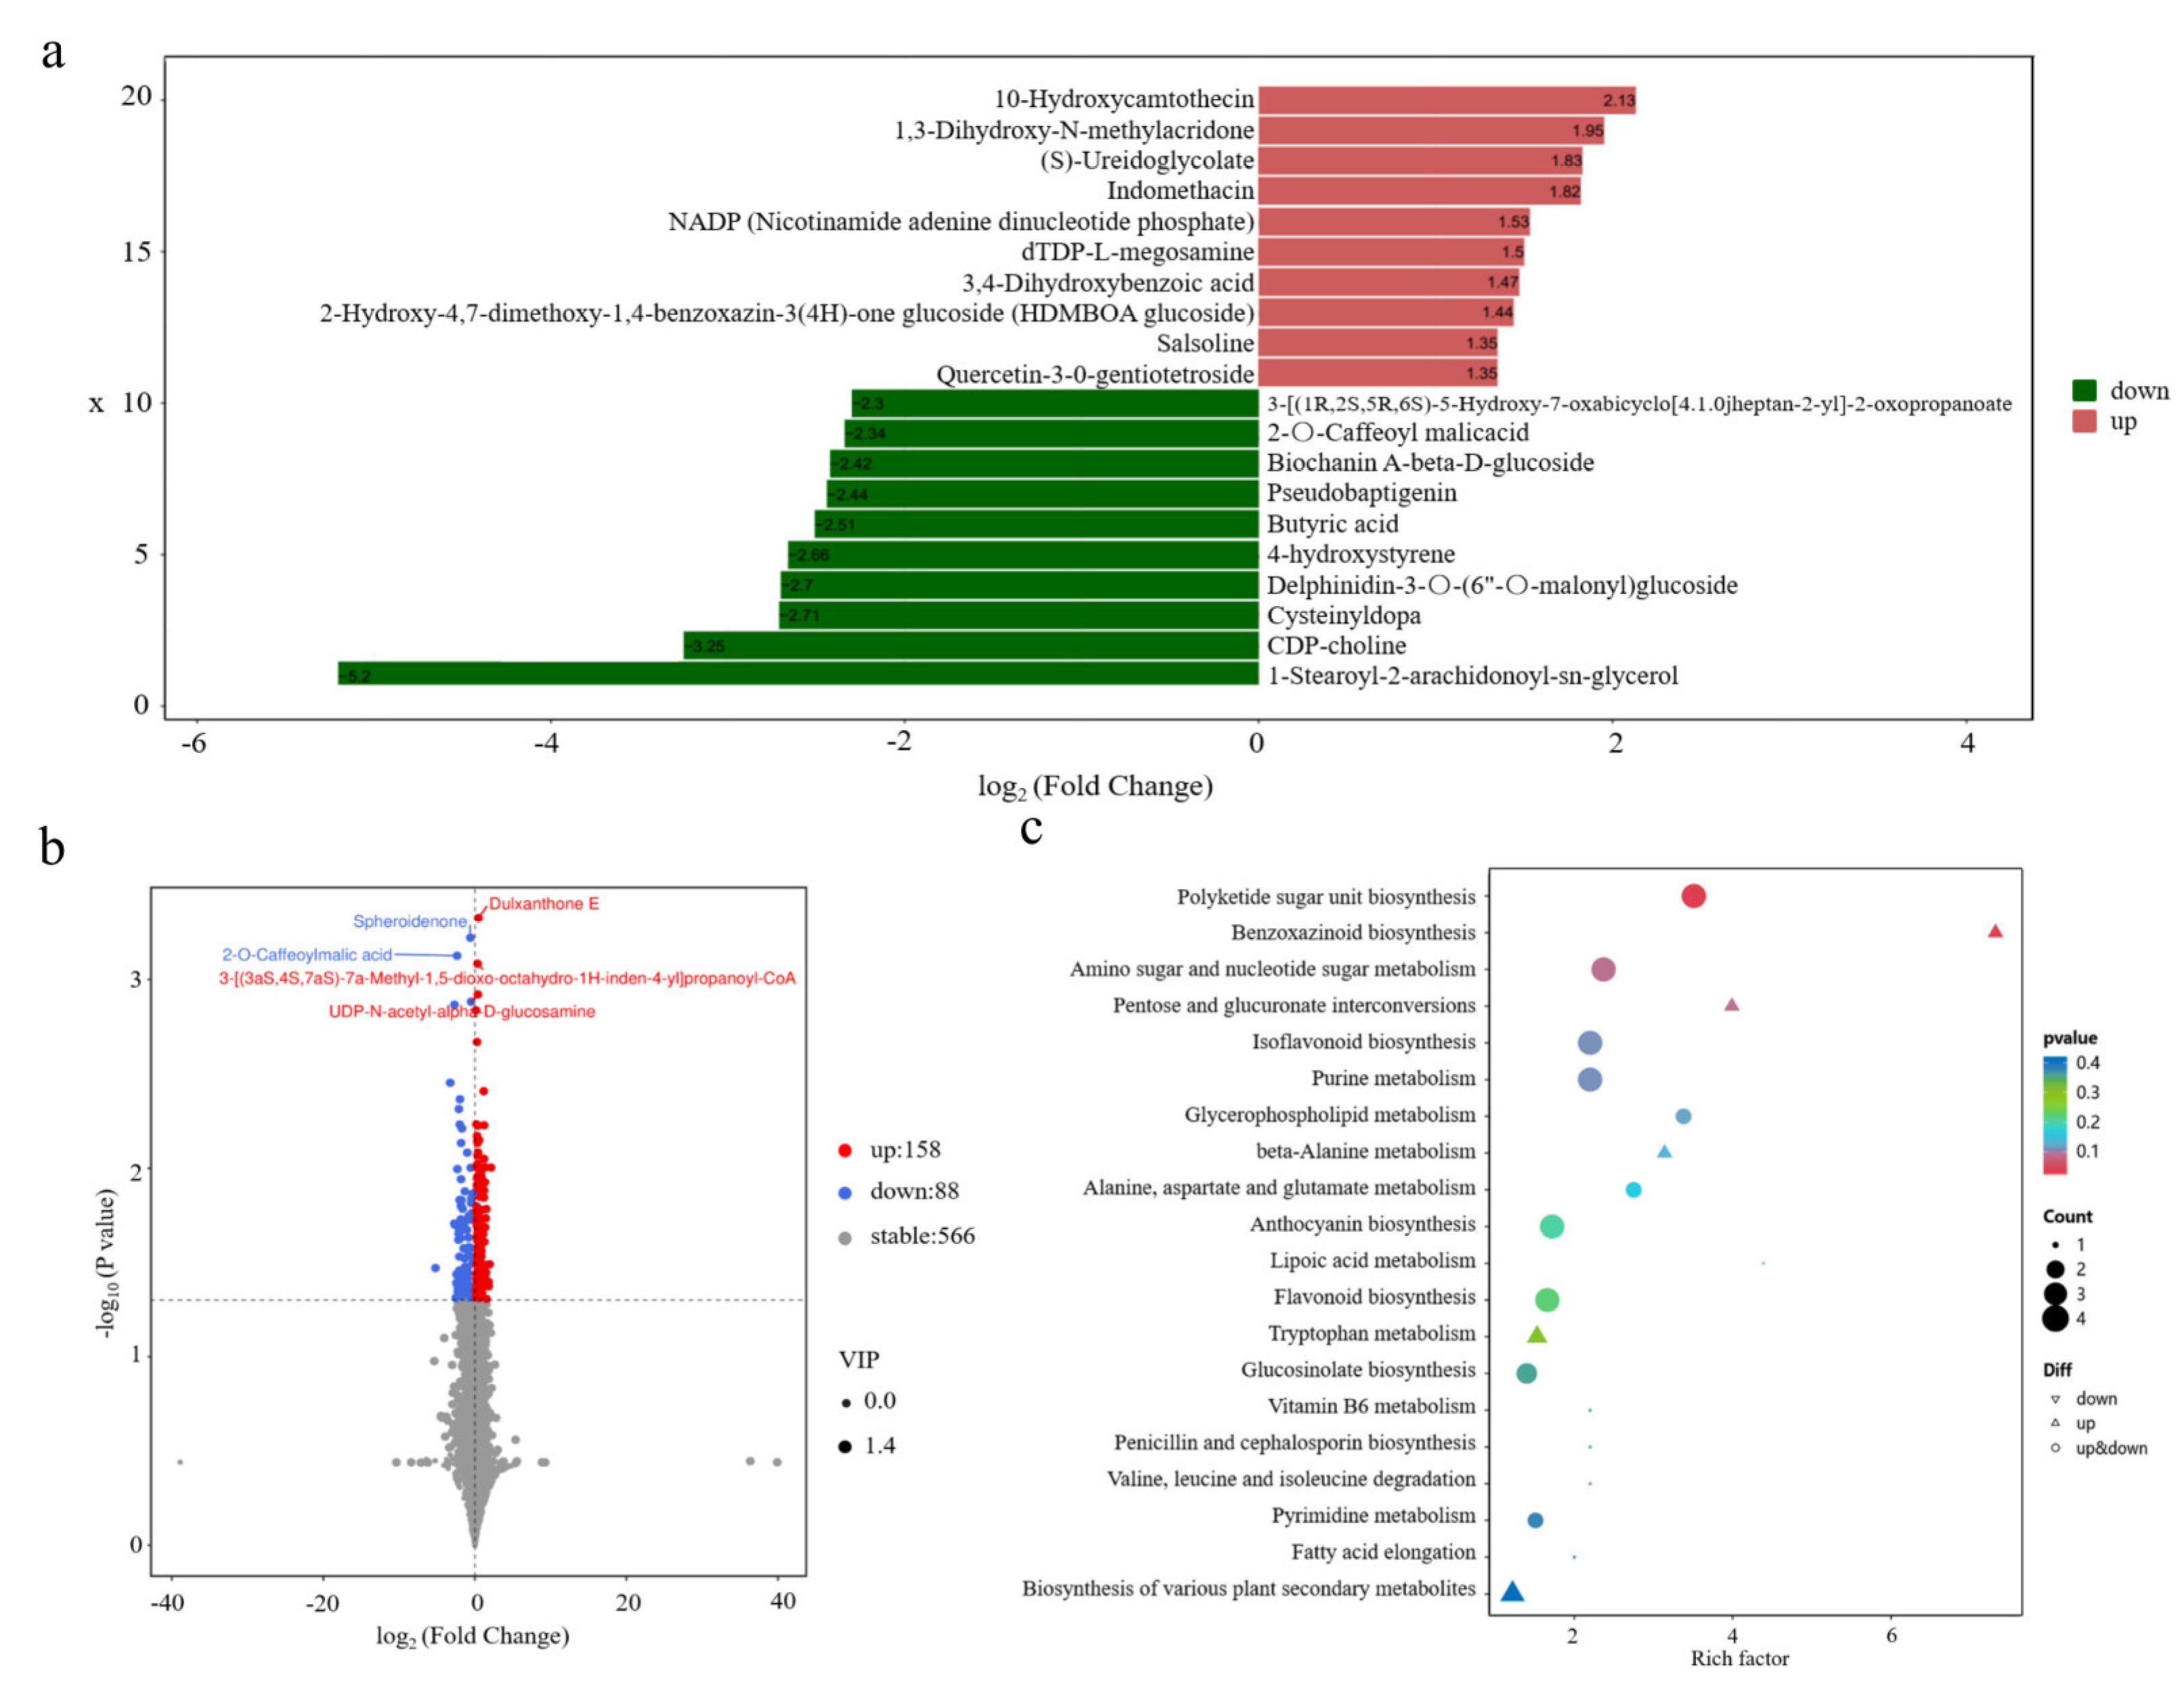
Metabolomic profiling revealed 246 DAMs between A. calcoaceticus DP25-inoculated and water-treated L. davurica plants; the levels of 158 of these metabolites increased, and the levels of 88 of these metabolites decreased. The top 10 metabolites with the greatest increase in expression were 10-hydroxycamate, 1,3-dihydroxy-N-methylacridone, (S)-ureidoglycolate, indomethacin, nicotinamide adenine dinucleotide phosphate (NADP), dTDP-L-megosamine, 3,4-dihydroxybenzoic acid, 2-hydroxy-4,7-dimethoxy-1,4-benzoxazin-3(4H)-one glucoside (HDMBOA glucoside), salsoline, and quercetin-3-O-gentiotetroside (Figure 5a). The top 10 metabolites with the greatest decrease in expression were 1-stearoyl-2-arachidonoyl-sn-glycerol, CDP-choline, cysteinyldopa, delphinidin-3-O-(6″-O-malonyl)glucoside, 4-hydroxystyrene, butyric acid, pseudobaptigenin, biochanin A-beta-D-glucoside, 2-O-caffeoylmalic acid, and 3-[(1R,2S,5R,6S)-5-hydroxy-7-oxabicyclo[4.1.0]heptan-2-yl]-2-oxopropanoate (Figure 5a). The five metabolites with the most significant variation in expression were dulxanthone E, spheroidenone, 2-O-caffeoylmalic acid, 3-[(3aS,4S,7aS)-7a-methyl-1,5-dioxo-octahydro-1H-inden-4-yl]propanoyl-CoA, and UDP-N-acetyl-alpha-D-glucosamine. Among them, the content of dulxanthone E, 3-[(3aS,4S,7aS)-7a-methyl-1,5-dioxo-octahydro-1H-inden-4-yl]propanoyl-CoA, and UDP-N-acetyl-alpha-D-glucosamine was upregulated (Figure 5b).

3.4.3. Functional Enrichment Analysis of DAMs Using KEGG

According to the p-values, the top twenty most significantly enriched KEGG pathways are depicted in Figure 5c, including those related to polyketide sugar unit biosynthesis, benzoxazinoid biosynthesis, amino sugar and nucleotide sugar metabolism, nucleotide sugar metabolism, pentose and glucuronate interconversions, isoflavonoid biosynthesis, and other metabolic pathways.

3.5. Transcriptome and Metabolomics Integration Analysis of the Growth Promoting Effect of DP25 on L. davurica

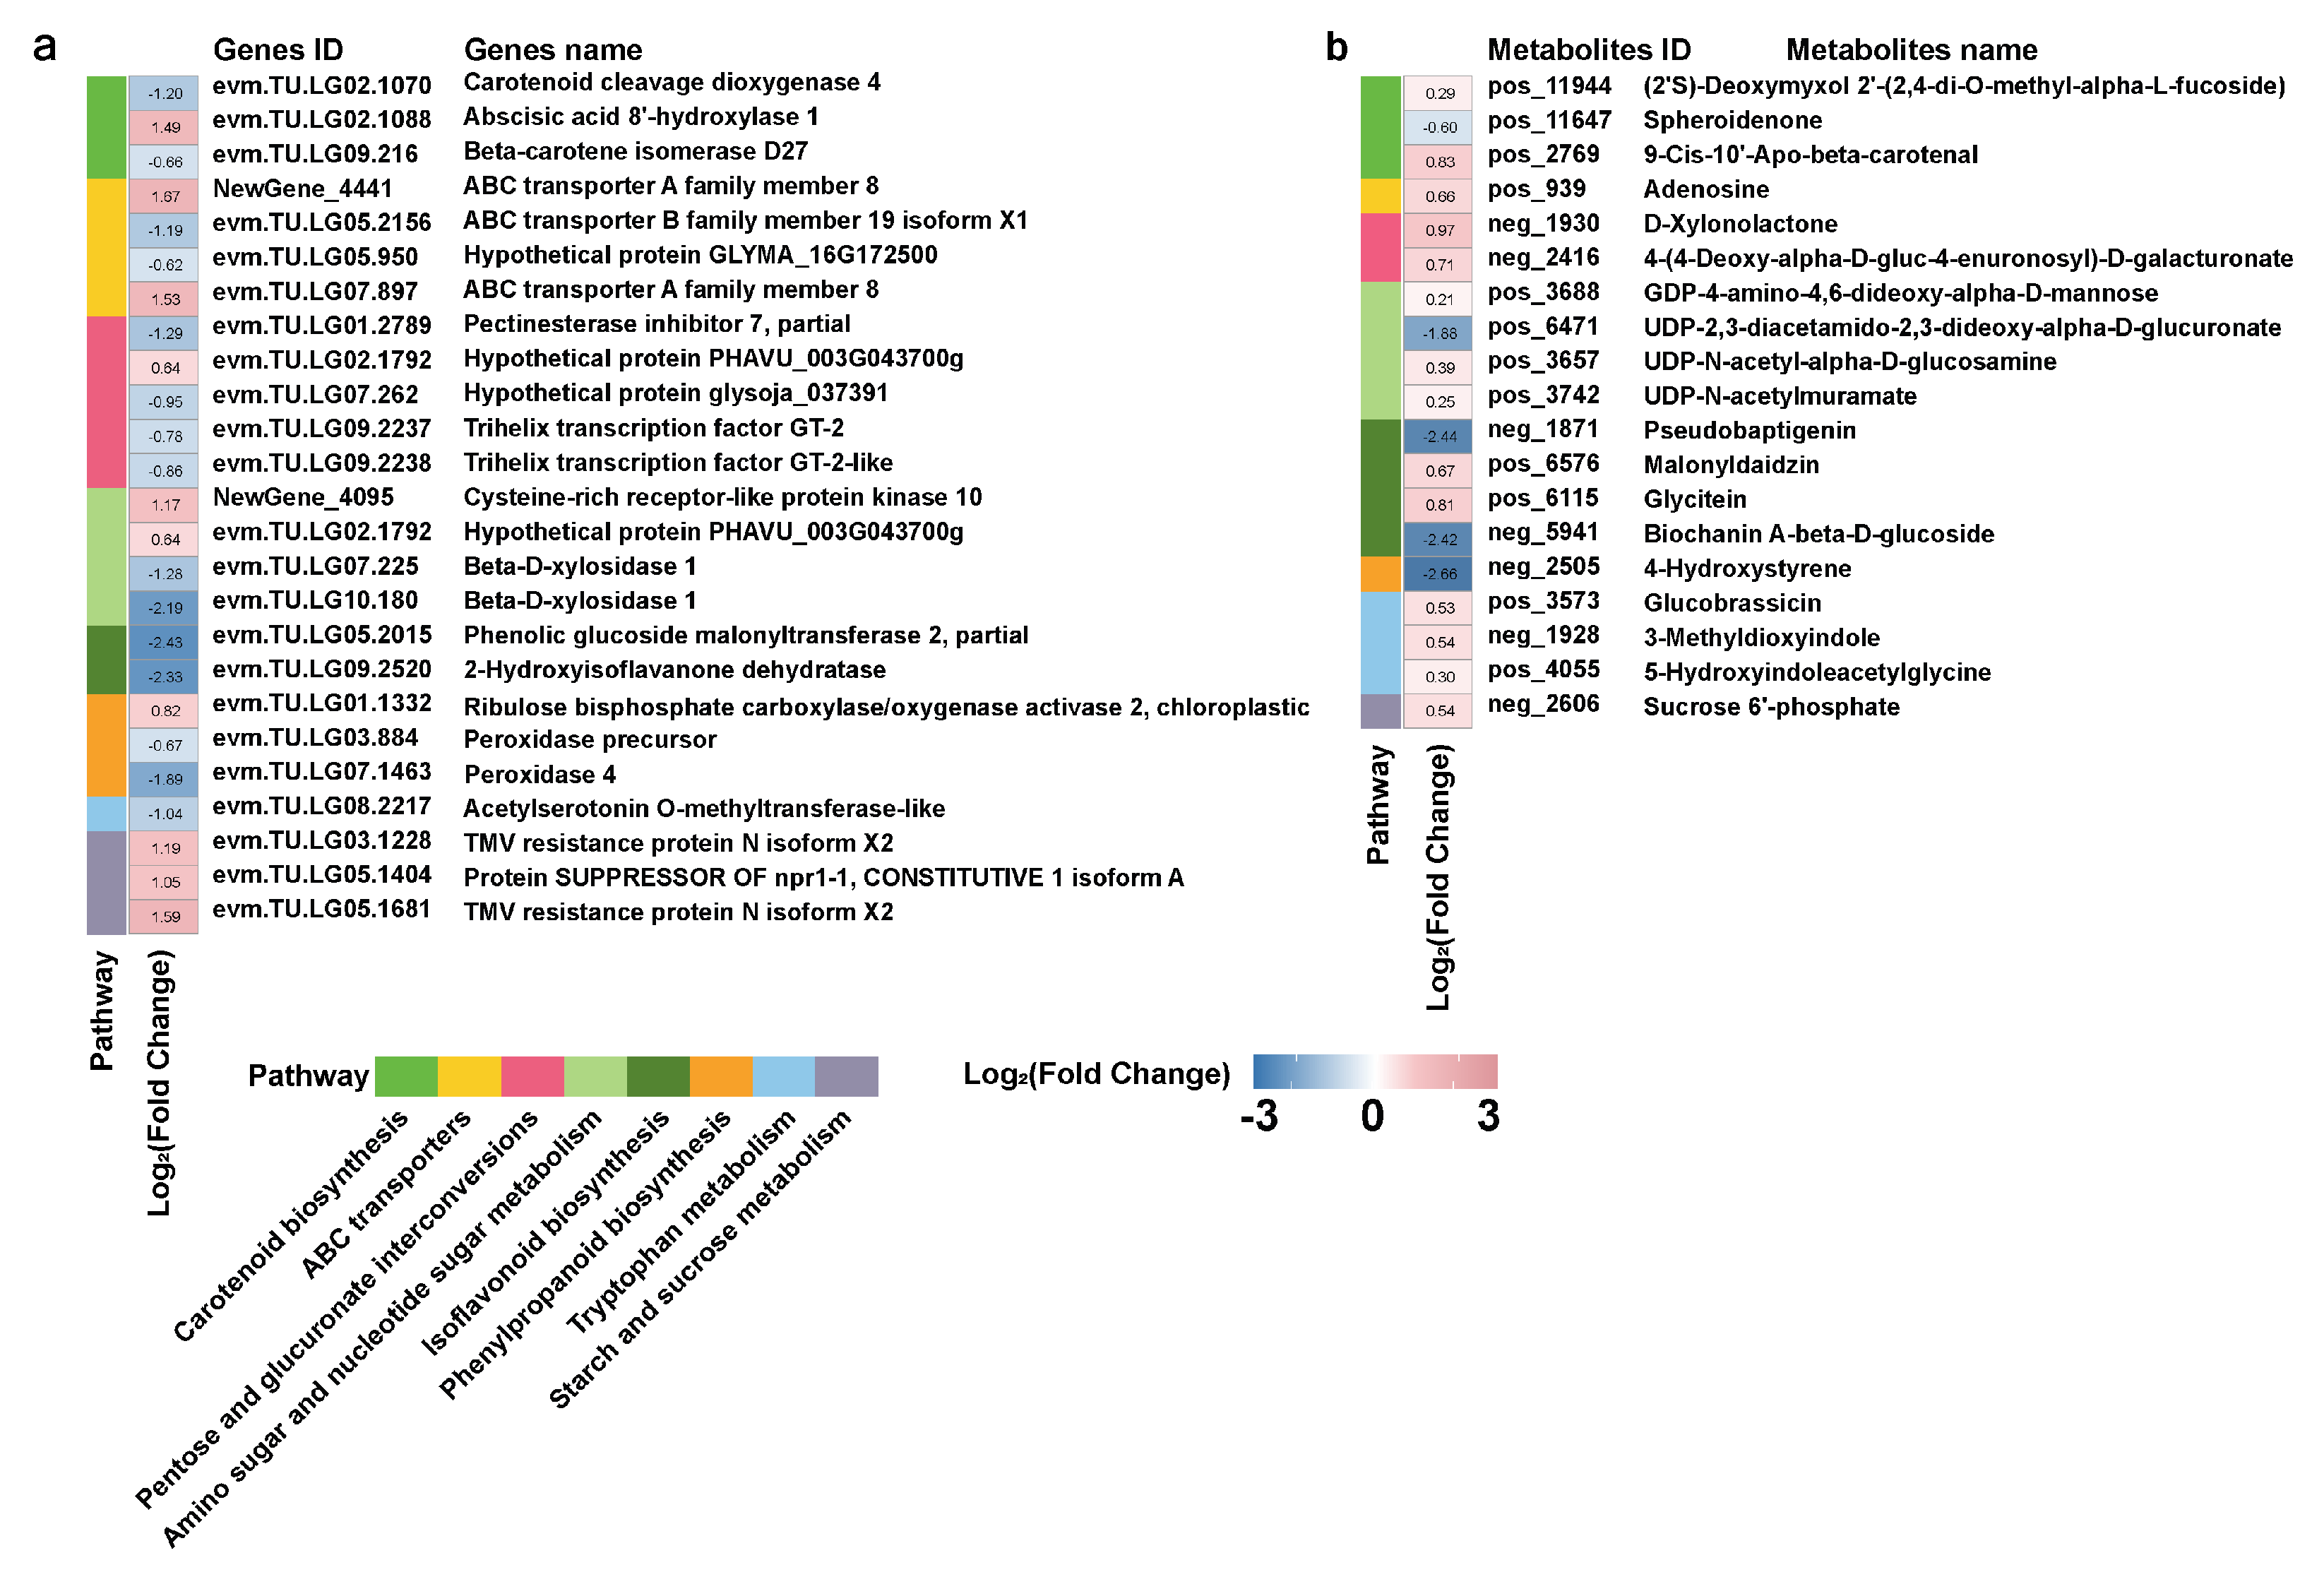
Transcriptomic analysis revealed that DEGs were enriched in 42 pathways, whereas metabolomic analysis revealed that DAMs were enriched in 41 pathways. There were 19 common pathways between the metabolomic and transcriptomic data, including carotenoid biosynthesis; ABC transporters; pentose and glucuronate interconversions; isoquinoline alkaloid biosynthesis; brassinosteroid biosynthesis; amino sugar and nucleotide sugar metabolism; zeatin biosynthesis; isoflavonoid biosynthesis; folate biosynthesis; flavone and flavonol biosynthesis; fatty acid elongation; suberin and wax biosynthesis; fatty acid degradation; pantothenate and CoA biosynthesis; tyrosine metabolism; valine, leucine, and isoleucine degradation; phenylpropanoid biosynthesis; tryptophan metabolism; and starch and sucrose metabolism (Figure 6 and Table S4). Information on the DEGs and DAMs enriched in the same KEGG pathways in L. davurica treated with DP25 compared with control L. davurica is presented in Table S5. More than 3 DEGs or DAMs were enriched in 8 KEGG pathways, including carotenoid biosynthesis, ABC transporters, pentose and glucuronate interconversions, amino sugar and nucleotide sugar metabolism, isoflavonoid biosynthesis, phenylpropanoid biosynthesis, tryptophan metabolism, and starch and sucrose metabolism (Figure 7).

4. Discussion

4.1. PGPR-Mediated Enhancement of Plant Growth and Stress Tolerance

Our findings demonstrate that A. calcoaceticus DP25 promoted the height and the weight of plants, and it significantly increased root growth performance, including length, surface area, volume, and underground biomass, through multiple synergistic mechanisms (Figure 2). Studies have shown that roots’ responses to environmental constraints are highly relevant to plant plasticity [52,53]. When plants are exposed to long-term adverse soil conditions, the roots first perceive stress stimuli and gradually transmit related information to the aboveground parts, thus regulating plant physiological activity [54]. Therefore, optimal root architecture and efficient nutrient acquisition are critical for mitigating abiotic stress and enhancing plant growth. Inoculation with strain DP25 improved the root morphogenesis of L. davurica and may increase the provision of nutrients and water to the plants, which may have promoted biomass accumulation and the growth of the whole L. davurica plant.
The activity of antioxidant enzymes plays an important role in plant stress and plant growth. When plants are under stress, antioxidant enzyme activity increases to allow for the elimination of excess oxygen free radicals [55,56]. In this study, after inoculation with DP25, CAT activities significantly increased in plants planted in saline-alkali soil compared with those in the control group, which attempted to detoxify excess H2O2 generated under saline–alkali condition, enhancing plant stress tolerance. In conclusion, inoculation with the phosphorus-solubilizing bacterium DP25 can promote the growth of L. davurica by improving its root structure and increasing CAT activity, thus promoting water absorption and nutrient absorption, and possibly increasing stress resistance. These results indicate that DP25 can be used to promote the growth of L. davurica on the Loess Plateau.

4.2. Molecular Mechanisms Underlying PGPR–Plant Interactions

The integrated transcriptomics and metabolomics analyses reveal the correlations between gene expression and metabolites in plants, illuminating how these relationships influence plant physiological states and environmental adaptability processes that may reflect dynamic changes in life activities. Bacillus subtilis MBI600 induces the expression of genes involved in signaling related to plant immunity, phytohormone production and nutrient availability, and substantial reprogramming involving hydrocarbon accumulation and amino acid metabolic pathways, promoting cucumber growth [57]. In the present study, 19 common pathways associated with genes and metabolites that presented significant upregulation following inoculation with DP25 were identified; the most highly enriched KEGG pathways were phenylpropanoid metabolism, isoflavonoid biosynthesis, carotenoid synthesis, tryptophan metabolism, ABC transporter, pentose and glucuronate interconversions, amino sugar and nucleotide sugar metabolism, and starch and sucrose metabolism, which were implicated in promoting L. davurica growth. ABC transporters facilitate plant growth and stress resistance through coordinated regulation of hormone flux, lipid homeostasis, and toxic compound efflux [58]. The enrichment of carotenoid biosynthesis pathways is particularly noteworthy, as carotenoids mediate crucial plant functions, ranging from photosynthetic apparatus assembly to photomorphogenic signal transduction and reactive oxygen species scavenging [59]. Abscisic acid hydroxylase played important roles in carotene biosynthesis by regulating the ABA content [60,61]. The upregulation of genes involved in carotenoid metabolism, coupled with increased accumulation of carotenoid-related metabolites, suggests that DP25 enhances photosynthetic efficiency and photoprotection mechanisms. This finding is consistent with the observed improvements in nutrient acquisition and stress tolerance.

4.3. Secondary Metabolite Biosynthesis and Plant Defense

The activation of phenylpropanoid biosynthesis and isoflavonoid biosynthesis pathways represents a critical component of DP25-mediated plant growth enhancement. Phenylpropanoid metabolism serves as a key secondary biosynthesis route in plants, generating compounds such as lignin, flavonoids, and coumarins, which contribute significantly to adaptive growth under environmental stress [62,63]. As multifunctional phenolic metabolites, isoflavonoids in leguminous plants play dual roles: as phytoalexins providing pathogen defense and as symbiotic signals facilitating rhizobial communication, thereby enhancing environmental adaptation through biological nitrogen fixation [64,65]. Isoflavonoids participate in key symbiotic processes, modulating root system development and facilitating arbuscular mycorrhizal colonization through intracellular structure formation [64,65].
The tryptophan metabolic pathway serves as a critical biochemical hub in plants, influencing protein production, auxin biosynthesis, and overall growth regulation [66]. The pentose–glucuronate interconversion pathway plays a pivotal role in modulating plant cell-wall dynamics through its dual function in polysaccharide biosynthesis and degradation [67]. The metabolic pathways of amino sugars and nucleotide sugars critically influence cellular architecture, signal transduction, and bioenergetics, thereby modulating developmental processes and environmental adaptation in plants [68,69]. The physiological adaptation of Aquilegia vulgaris to saline conditions depends significantly on the modulation of starch and sucrose metabolism [70]. During ontogenetic progression, plants exhibit temporal increases in starch and sucrose metabolism [71,72].
Integrated transcriptomics and metabolomics revealed that Bacillus megaterium BT22 promotes Arabidopsis thaliana growth development through hormonal equilibrium adjustment and global metabolite remodeling [73]. In this study, after DP25 was administered, L. davurica might have produced secondary metabolites through the phenylpropanoid metabolic and isoflavonoid biosynthesis pathways, as phenylpropanoids and isoflavonoids are secreted into the surrounding soil through roots and alter the rhizosphere microenvironment to promote root growth and the absorption of soil nutrients and increase the chlorophyll content and photosynthesis through the carotenoid synthesis pathway. Furthermore, DP25 regulated the ABC transporter pathway to promote hormone transport and self-growth; regulated the metabolism of starch, sucrose, amino sugars, and nucleotide sugars; and promoted dry matter accumulation.

5. Conclusions

This study represents the first comprehensive multi-omics analysis of A. calcoaceticus DP25-mediated growth enhancement in L. davurica, providing unprecedented molecular insights into beneficial plant–microbe interactions. Our integrated transcriptomic and metabolomic approach revealed that DP25 enhances plant performance through coordinated activation of multiple metabolic pathways, including carotenoid biosynthesis, phenylpropanoid metabolism, and ABC transporter systems. The key findings include (1) significant enhancement of plant growth parameters and stress tolerance mechanisms; (2) activation of 19 co-regulated metabolic pathways involved in photosynthesis, antioxidant defense, and secondary metabolite biosynthesis; (3) coordinated upregulation of genes and metabolites associated with plant stress responses and nutrient acquisition; and (4) evidence of enhanced root system architecture facilitating improved nutrient and water uptake. These findings have important implications for sustainable agriculture and ecosystem restoration, particularly in challenging environments such as the Loess Plateau. The molecular mechanisms identified in this study provide a foundation for developing next-generation biofertilizers and for engineering improved plant–microbe interactions through synthetic biology approaches. Our work demonstrates the power of multi-omics approaches in unraveling the complex molecular networks underlying plant–microbe interactions and contributes to the growing understanding of how beneficial bacteria can be harnessed to improve crop productivity and environmental sustainability. The identification of specific molecular targets and pathways opens new avenues for developing more effective PGPR inoculants and for breeding crops with enhanced responsiveness to beneficial microorganisms.

Supplementary Materials

The following supporting information can be downloaded at https://www.mdpi.com/article/10.3390/agronomy15081992/s1, Table S1: qRT-PCR primer sequences; Table S2: DEGs calculated via DESeq2; Table S3: Significantly enriched GO categories; Table S4: Common KEGG pathways between DAMs enriched in the metabolomics data and DEGs enriched in the transcriptomics data; Table S5: Information on differentially expressed genes (DEGs) and differential accumulated metabolites (DAMs) co-enriched KEGG pathways in L. davurica treated with DP25 compared with control.

Author Contributions

Y.L., X.Z. (Xiang Zhao), P.G., L.H. and L.J. designed the research; Y.L., L.J. and Y.Z. performed the research; L.J., Y.L., Z.G., X.Z. (Xiaoyan Zhao) and Y.Z. analyzed the data; Y.L., L.J., Y.Z., X.Z. (Xiaoyan Zhao) and X.Z. (Xiang Zhao) wrote the paper. All authors have read and agreed to the published version of the manuscript.

Funding

This work was supported by Research Project Supported by Shanxi Scholarship Council of China (No. 2022-097), the Shanxi Central Guide Local Science and Technology Development Fund Project (YDZJSX2024B008), and the Key Research and Development Project of Shanxi Province (202402140601011).

Data Availability Statement

Data are contained within the article or Supplementary Materials.

Acknowledgments

We gratefully acknowledge Biomarker Technologies Co., Ltd., for their expertise in sequencing and bioinformatic data processing, and declare that there are no conflicts of interest between Biomarker Technologies Co., Ltd., and the authors.

Conflicts of Interest

The authors declare no conflicts of interest.

References

  1. Chen, L.; Wei, W.; Fu, B.; Lu, Y. Soil and water conservation on the Loess Plateau in China: Review and perspective. Prog. Phys. Geogr. 2007, 31, 3547–3554. [Google Scholar] [CrossRef]
  2. Zhao, G.; Mu, X.; Wen, Z.; Wang, F. Soil erosion, conservation, and eco-environment changes in the Loess Plateau of china. Land Degrad. Dev. 2013, 24, 499–510. [Google Scholar] [CrossRef]
  3. Lirong Tong, J.W. Morphological study on the differentiation of flower buds and the embryological stages of male and female floral organs in Lespedeza davurica (Laxm.) Schindl. cv. JinNong (Fabaceae). Plants 2024, 13, 1661. [Google Scholar] [CrossRef]
  4. Wang, F.; Shi, L.; Zhang, R.; Xu, W.; Xu, W.; Bo, Y.; Bo, Y. Effects of nitrogen addition and Bothriochloa ischaemum and Lespedeza davurica mixture on plant chlorophyll fluorescence and community production in semi-arid grassland. Front. Plant Sci. 2024, 15, 1400309. [Google Scholar] [CrossRef] [PubMed]
  5. Niu, F.; Chen, J.; Xiong, P.; Wang, Z.; Zhang, H.; Xu, B. Responses of soil respiration to rainfall pulses in a natural grassland community on the semi-arid Loess Plateau of China. Catena 2019, 178, 199–208. [Google Scholar] [CrossRef]
  6. Ma, J.; Chen, Y.; Zhou, J.; Wang, K.; Wu, J. Soil quality should be accurate evaluated at the beginning of lifecycle after land consolidation for eco-sustainable development on the Loess Plateau. J. Clean. Prod. 2020, 267, 122244. [Google Scholar] [CrossRef]
  7. Xu, B.; Xu, W.; Wang, Z.; Chen, Z.; Palta, J.; Chen, Y. Accumulation of N and P in the legume Lespedeza davurica in controlled mixtures with the grass bothriochloa ischaemum under varying water and fertilization conditions. Front. Plant Sci. 2018, 9, 165. [Google Scholar] [CrossRef] [PubMed]
  8. Xu, B.; Gao, Z.; Wang, J.; Xu, W.; Palta, J.; Chen, Y. N:P ratio of the grass Bothriochloa ischaemum mixed with the legume Lespedeza davurica under varying water and fertilizer supplies. Plant Soil 2016, 400, 67–79. [Google Scholar] [CrossRef]
  9. Vejan, P.; Abdullah, R.; Khadiran, T.; Ismail, S.; Nasrulhaq Boyce, A. Role of plant growth promoting rhizobacteria in agricultural sustainability—A Review. Molecules 2016, 21, 573. [Google Scholar] [CrossRef]
  10. Bhattacharyya, P.N.; Jha, D.K. Plant growth-promoting rhizobacteria (PGPR): Emergence in agriculture. World J. Microbiol. Biotechnol. 2012, 28, 1327–1350. [Google Scholar] [CrossRef] [PubMed]
  11. Gouda, S.; Kerry, R.G.; Das, G.; Paramithiotis, S.; Shin, H.-S.; Patra, J.K. Revitalization of plant growth promoting rhizobacteria for sustainable development in agriculture. Microbiol. Res. 2018, 206, 131–140. [Google Scholar] [CrossRef]
  12. Singh, A.; Yadav, V.K.; Chundawat, R.S.; Soltane, R.; Awwad, N.S.; Ibrahium, H.A.; Yadav, K.K.; Vicas, S.I. Enhancing plant growth promoting rhizobacterial activities through consortium exposure: A review. Front. Bioeng. Biotechnol. 2023, 11, 1099999. [Google Scholar] [CrossRef] [PubMed]
  13. Balemi, T.; Negisho, K. Management of soil phosphorus and plant adaptation mechanisms to phosphorus stress for sustainable crop production: A review. J. Soil Sci. Plant Nutr. 2012, 12, 547–562. [Google Scholar] [CrossRef]
  14. Khan, M.; Asaf, S.; Khan, A.; Adhikari, A.; Jan, R.; Ali, S.; Imran, M.; Kim, K.M.; Lee, I.J. Plant growth-promoting endophytic bacteria augment growth and salinity tolerance in rice plants. Plant Biol. 2020, 22, 850–862. [Google Scholar] [CrossRef] [PubMed]
  15. Wahid, F.; Sharif, M.; Shah, F.; Ali, A.; Adnan, M.; Shah, S.; Danish, S.; Ali, M.A.; Ahmed, N.; Arslan, H. Mycorrhiza and phosphate solubilizing bacteria: Potential bioagents for sustainable phosphorus management in agriculture. Phyton 2022, 91, 257. [Google Scholar] [CrossRef]
  16. Palaniappan, P.; Chauhan, P.S.; Saravanan, V.S.; Anandham, R.; Sa, T. Isolation and characterization of plant growth promoting endophytic bacterial isolates from root nodule of Lespedeza sp. Biol. Fertil. Soils 2010, 46, 807–816. [Google Scholar] [CrossRef]
  17. Li, C.; Jia, Z.; Peng, X.; Zhai, L.; Zhang, B.; Liu, X.; Zhang, J. Functions of mineral-solubilizing microbes and a water retaining agent for the remediation of abandoned mine sites. Sci. Total Environ. 2021, 761, 143215. [Google Scholar] [CrossRef]
  18. Ishizawa, H.; Ogata, Y.; Hachiya, Y.; Tokura, K.-I.; Kuroda, M.; Inoue, D.; Toyama, T.; Tanaka, Y.; Mori, K.; Morikawa, M.; et al. Enhanced biomass production and nutrient removal capacity of duckweed via two-step cultivation process with a plant growth-promoting bacterium, Acinetobacter calcoaceticus P23. Chemosphere 2020, 238, 124682. [Google Scholar] [CrossRef]
  19. Laha, A.; Sarkar, S.; Sengupta, S.; Das, A.; Paul, S.; Bhattacharyya, S. Unraveling the potential of Acinetobacter calcoaceticus for arsenic resistance and plant growth promotion in contaminated lentil field. S. Afr. J. Bot. 2024, 168, 61–70. [Google Scholar] [CrossRef]
  20. Dutta, P.; Muthukrishnan, G.; Gopalasubramaiam, S.K.; Dharmaraj, R.; Karuppaiah, A.; Loganathan, K.; Periyasamy, K.; Pillai, M.A.; Upamanya, G.K.; Boruah, S.; et al. Plant growth-promoting rhizobacteria (PGPR) and its mechanisms against plant diseases for sustainable agriculture and better productivity. Biocell 2022, 46, 1843–1859. [Google Scholar] [CrossRef]
  21. Ríos-Ruiz, W.F.; Jave-Concepción, H.G.; Torres-Chávez, E.E.; Rios-Reategui, F.; Padilla-Santa-Cruz, E.; Guevara-Pinedo, N.E. Plant-growth-promoting microorganisms: Their impact on crop quality and yield, with a focus on rice. Int. J. Plant Biol. 2025, 16, 9. [Google Scholar] [CrossRef]
  22. Yin, H.; Jing, Y.; Lin, Y.; Song, N.; Zong, H.; Wang, F.; Li, S.; Song, X.; Hou, H.; Guan, Y.S.; et al. Phosphorus and selenium compounding mitigates Cr stress in peanut seedlings by enhancing growth homeostasis and antioxidant properties. Environ. Sci. Pollut. Res. 2024, 31, 50929–50941. [Google Scholar] [CrossRef]
  23. Kumawat, K.C.; Nagpal, S.; Sharma, P. Potential of plant growth-promoting rhizobacteria-plant interactions in mitigating salt stress for sustainable agriculture: A review. Pedosphere 2022, 32, 223–245. [Google Scholar] [CrossRef]
  24. Ullah, S.; Ashraf, M.; Asghar, H.N.; Iqbal, Z.; Ali, R. Plant growth promoting rhizobacteria mediated amelioration of drought in crop plants: A Review. Soil Environ. 2019, 38, 1–20. [Google Scholar] [CrossRef]
  25. Kanghong, F.; Ping, S.; Youyuan, C.; Jiameng, G.; Kanghong, F.; Ping, S.; Youyuan, C.; Jiameng, G. Endophytic bacteria promote the growth of Suaeda glauca in saline-alkali stress: Regulation of osmotic pressure and antioxidative defense system. J. Ocean Univ. China 2023, 22, 1109–1118. [Google Scholar] [CrossRef]
  26. Abogadallah, G.M. Antioxidative defense under salt stress. Plant Signal. Behav. 2010, 5, 369–374. [Google Scholar] [CrossRef]
  27. Shemi, R.; Wang, R.; Gheith, E.M.S.; Hussain, H.A.; Hussain, S.; Irfan, M.; Cholidah, L.; Zhang, K.; Zhang, S.; Wang, L. Effects of salicylic acid, zinc and glycine betaine on morpho-physiological growth and yield of maize under drought stress. Sci. Rep. 2021, 11, 3195. [Google Scholar] [CrossRef] [PubMed]
  28. Wang, J.; Wang, R.; Liu, L.; Zhang, W.; Yin, Z.; Guo, R.; Wang, D.; Guo, C. Integrated physiological, transcriptomic and metabolomic analyses of the response of rice to aniline toxicity. Int. J. Mol. Sci. 2025, 26, 582. [Google Scholar] [CrossRef] [PubMed]
  29. Tanveer, M.; Mahmood, A.; Alawadi, H.F.N.; Adiba, A.; Javaid, M.M.; Khan, B.A.; Wahid, A.; Abdullah, F.; Seleiman, M.F. Impact of boron on Glycine max L. to mitigate salt stress by modulating the morpho-physiological and biochemical responses. BMC Plant Biol. 2025, 25, 286. [Google Scholar] [CrossRef] [PubMed]
  30. Dong, Z.; Chen, Y. Transcriptomics: Advances and approaches. Sci. China Life Sci. 2013, 56, 960–967. [Google Scholar] [CrossRef] [PubMed]
  31. Johnson, C.H.; Ivanisevic, J.; Siuzdak, G. Metabolomics: Beyond biomarkers and towards mechanisms. Nat. Rev. Mol. Cell Biol. 2016, 17, 451–459. [Google Scholar] [CrossRef]
  32. Rychlik, I.; Martin, G.; Methner, U.; Lovell, M.; Cardova, L.; Sebkova, A.; Sevcik, M.; Damborsky, J.; Barrow, P.A. Identification of Salmonella enterica serovar Typhimurium genes associated with growth suppression in stationary-phase nutrient broth cultures and in the chicken intestine. Arch. Microbiol. 2002, 178, 411–420. [Google Scholar] [CrossRef]
  33. De Leersnyder, I.; De Gelder, L.; Van Driessche, I.; Vermeir, P. Influence of growth media components on the antibacterial effect of silver ions on Bacillus subtilis in a liquid growth medium. Sci. Rep. 2018, 8, 9325. [Google Scholar] [CrossRef] [PubMed]
  34. Li, C.; Bai, J.; Cai, Z.; Ouyang, F. Optimization of a cultural medium for bacteriocin production by Lactococcus lactis using response surface methodology. J. Biotechnol. 2002, 93, 27–34. [Google Scholar] [CrossRef]
  35. Beyer, W.F.; Fridovich, I. Assaying for superoxide dismutase activity: Some large consequences of minor changes in conditions. Anal. Biochem. 1987, 161, 559–566. [Google Scholar] [CrossRef] [PubMed]
  36. Yang, Z.; Yong-Sheng, L.; Gao, X.-F. A new method for accurate determination of peroxidase activity based on fluorescence decrease of guaiacol. Chin. J. Anal. Chem. 2015, 43, 1040–1046. [Google Scholar]
  37. Beers, R.F.; Sizer, I.W. A spectrophotometric method for measuring the breakdown of hydrogen peroxide by catalase. J. Biol. Chem. 1952, 195, 133–140. [Google Scholar] [CrossRef]
  38. Georgiou, C.D.; Grintzalis, K.; Zervoudakis, G.; Papapostolou, I. Mechanism of Coomassie brilliant blue G-250 binding to proteins: A hydrophobic assay for nanogram quantities of proteins. Anal. Bioanal. Chem. 2008, 391, 391–403. [Google Scholar] [CrossRef]
  39. Loewus, F.A. Improvement in anthrone method for determination of carbohydrates. Anal. Chem. 1952, 24, 219. [Google Scholar] [CrossRef]
  40. Ábrahám, E.; Cabassa, C.; Erdei, L.; Szabados, L. Methods for determination of proline in plants. Methods Mol. Biol. 2010, 639, 317–331. [Google Scholar]
  41. Heath, R.L.; Packer, L. Photoperoxidation in isolated chloroplasts: I. Kinetics and stoichiometry of fatty acid peroxidation. Arch. Biochem. Biophys. 1968, 125, 189–198. [Google Scholar] [CrossRef]
  42. Ali, M.B.; Hahn, E.-J.; Paek, K.-Y. Effects of light intensities on antioxidant enzymes and malondialdehyde content during short-term acclimatization on micropropagated Phalaenopsis plantlet. Environ. Exp. Bot. 2005, 54, 109–120. [Google Scholar] [CrossRef]
  43. Gan, P.; Li, P.; Zhang, X.; Li, H.; Ma, S.; Zong, D.; He, C. Comparative Transcriptomic and Metabolomic Analyses of Differences in Trunk Spiral Grain in Pinus yunnanensis. Int. J. Mol. Sci. 2023, 24, 14658. [Google Scholar] [CrossRef]
  44. Kim, D.; Langmead, B.; Salzberg, S.L. HISAT: A fast spliced aligner with low memory requirements. Nat. Methods 2015, 12, 357–360. [Google Scholar] [CrossRef]
  45. Pertea, M.; Pertea, G.M.; Antonescu, C.M.; Chang, T.-C.; Mendell, J.T.; Salzberg, S.L. StringTie enables improved reconstruction of a transcriptome from RNA-seq reads. Nat. Biotechnol. 2015, 33, 290–295. [Google Scholar] [CrossRef] [PubMed]
  46. Trapnell, C.; Williams, B.A.; Pertea, G.; Mortazavi, A.; Kwan, G.; van Baren, M.J.; Salzberg, S.L.; Wold, B.J.; Pachter, L. Transcript assembly and quantification by RNA-Seq reveals unannotated transcripts and isoform switching during cell differentiation. Nat. Biotechnol. 2010, 28, 511–515. [Google Scholar] [CrossRef]
  47. Love, M.I.; Huber, W.; Anders, S. Moderated estimation of fold change and dispersion for RNA-seq data with DESeq2. Genome Biol. 2014, 15, 550. [Google Scholar] [CrossRef] [PubMed]
  48. Livak, K.J.; Schmittgen, T.D. Analysis of relative gene expression data using real-time quantitative PCR and the 2(-Delta Delta C(T)) Method. Methods 2001, 25, 402–408. [Google Scholar] [CrossRef]
  49. Wang, H.; Hu, Q.; Chen, Y.; Huang, X.; Feng, Y.; Shi, Y.; Li, R.; Yin, X.; Song, X.; Liang, Y.; et al. Ferritinophagy mediates adaptive resistance to EGFR tyrosine kinase inhibitors in non-small cell lung cancer. Nat. Commun. 2024, 15, 4195. [Google Scholar] [CrossRef]
  50. Yan, F.; Wei, T.; Yang, C.; Yang, Y.; Luo, Z.; Jiang, Y. Combined analysis of untargeted metabolomics and transcriptomics revealed seed germination and seedling establishment in Zelkova schneideriana. Genes 2024, 15, 488. [Google Scholar] [CrossRef] [PubMed]
  51. Feng, X.; Meng, D.; Wang, Y.; Fernie, A.R.; Bai, C.; He, X.; Tao, J.; Zhou, X.; Ren, Y.; Zuo, J.; et al. Chlorine dioxide affects metabolism of harvested cauliflower. Postharvest Biol. Technol. 2025, 230, 113735. [Google Scholar] [CrossRef]
  52. Rattan, B.; Banerjee, A.; Dhobale, K.V.; Garg, A.; Sreedeep, S.; Sahoo, L. Examining the soil bacterial community under the combined influence of water-absorbing polymer and plant subjected to drought stress. Plant Soil 2024, 504, 763–777. [Google Scholar] [CrossRef]
  53. Freschet, G.T.; Violle, C.; Bourget, M.Y.; Scherer-Lorenzen, M.; Fort, F. Allocation, morphology, physiology, architecture: The multiple facets of plant above- and below-ground responses to resource stress. New Phytol. 2018, 219, 1338–1352. [Google Scholar] [CrossRef]
  54. Li, H.; Testerink, C.; Zhang, Y. How roots and shoots communicate through stressful times. Trends Plant Sci. 2021, 26, 940–952. [Google Scholar] [CrossRef] [PubMed]
  55. Mehla, N.; Sindhi, V.; Josula, D.; Bisht, P.; Wani, S.H. An introduction to antioxidants and their roles in plant stress tolerance. In Reactive Oxygen Species and Antioxidant Systems in Plants: Role and Regulation Under Abiotic Stress; Khan, M.I.R., Khan, N.A., Eds.; Springer: Singapore, 2017; pp. 1–23. [Google Scholar]
  56. Mir, R.A.; Khah, M.A. Chapter 10—Recent progress in enzymatic antioxidant defense system in plants against different environmental stresses. In Improving Stress Resilience in Plants; Ahanger, M.A., Bhat, J.A., Ahmad, P., John, R., Eds.; Academic Press: Cambridge, MA, USA., 2024; pp. 203–224. [Google Scholar]
  57. Samaras, A.; Kamou, N.; Tzelepis, G.; Karamanoli, K.; Menkissoglu-Spiroudi, U.; Karaoglanidis, G.S. Root transcriptional and metabolic dynamics induced by the plant growth promoting rhizobacterium (PGPR) Bacillus subtilis Mbi600 on Cucumber Plants. Plants 2022, 11, 1218. [Google Scholar] [CrossRef] [PubMed]
  58. Mall, M.S.; Shah, S.; Singh, S.; Singh, N.; Singh, N.; Vaish, S.; Gupta, D. Genome-wide identification and characterization of ABC transporter superfamily in the legume Cajanus cajan. J. Appl. Genet. 2023, 64, 615–644. [Google Scholar] [CrossRef]
  59. Ke, D.; Xie, Y.; Li, H.; Hu, L.; He, Y.; Guo, C.; Zhai, Y.; Guo, J.; Li, K.; Chu, Z.; et al. Anchorene, a carotenoid-derived growth regulator, modulates auxin homeostasis by suppressing GH3-mediated auxin conjugation. J. Integr. Plant Biol. 2024, 66, 2490–2504. [Google Scholar] [CrossRef] [PubMed]
  60. Qiao, H.; Zhao, W.; Tian, S.; Wang, D.; Wu, H.; Wang, C.; Zhu, J.; Li, N.; Zhu, X.; Mu, S.; et al. Exploring the mechanisms underlying petal pigmentation differences in two cultivars of Physalis philadelphica based on HPLC and NGS. Horticulturae 2024, 10, 507. [Google Scholar] [CrossRef]
  61. Chen, Z.; Zhou, Y.; Jiang, X.; Li, H.; Liu, X.; Deng, L.; Wang, G. Integrated transcriptomics and metabolomics analysis of volatiles and variations in carotenoid biosynthesis during different developmental stages of Camellia huana. BMC Plant Biol. 2025, 25, 734. [Google Scholar] [CrossRef]
  62. Dong, N.Q.; Lin, H.X. Contribution of phenylpropanoid metabolism to plant development and plant-environment interactions. J. Integr. Plant Biol. 2021, 63, 180–209. [Google Scholar] [CrossRef]
  63. Ortiz, A.; Sansinenea, E. Phenylpropanoid derivatives and their role in plants’ health and as antimicrobials. Curr. Microbiol. 2023, 80, 380. [Google Scholar] [CrossRef] [PubMed]
  64. Trush, K.; Pal’ove-Balang, P. Biosynthesis and role of isoflavonoids in legumes under different environmental conditions. Plant Stress 2023, 8, 100153. [Google Scholar] [CrossRef]
  65. Wang, L.; Li, C.; Luo, K. Biosynthesis and metabolic engineering of isoflavonoids in model plants and crops: A review. Front. Plant Sci. 2024, 15, 1384091. [Google Scholar] [CrossRef]
  66. Liu, W.-C.; Song, R.-F.; Zheng, S.-Q.; Li, T.-T.; Zhang, B.-L.; Gao, X.; Lu, Y.-T. Coordination of plant growth and abiotic stress responses by tryptophan synthase β subunit 1 through modulation of tryptophan and ABA homeostasis in Arabidopsis. Mol. Plant 2022, 15, 973–990. [Google Scholar] [CrossRef]
  67. Tang, H.; Zhang, X.; Gong, B.; Yan, Y.; Shi, Q. Proteomics and metabolomics analysis of tomato fruit at different maturity stages and under salt treatment. Food Chem. 2020, 311, 126009. [Google Scholar] [CrossRef]
  68. Bar-Peled, M.; O’Neill, M.A. Plant nucleotide sugar formation, interconversion, and salvage by sugar recycling. Annu. Rev. Plant Biol. 2011, 62, 127–155. [Google Scholar] [CrossRef]
  69. Figueroa, C.M.; Lunn, J.E.; Iglesias, A.A. Nucleotide-sugar metabolism in plants: The legacy of Luis F. Leloir. J. Exp. Bot. 2021, 72, 4053–4067. [Google Scholar] [CrossRef]
  70. Chen, L.; Meng, Y.; Bai, Y.; Yu, H.; Qian, Y.; Zhang, D.; Zhou, Y. Starch and sucrose metabolism and plant hormone signaling pathways play crucial roles in aquilegia salt stress adaption. Int. J. Mol. Sci. 2023, 24, 3948. [Google Scholar] [CrossRef] [PubMed]
  71. Li, W.; Huang, D.; Wang, B.; Hou, X.; Zhang, R.; Yan, M.; Liao, W. Changes of starch and sucrose content and related gene expression during the growth and development of Lanzhou lily bulb. PLoS ONE 2022, 17, e0262506. [Google Scholar] [CrossRef]
  72. Yoon, J.; Cho, L.H.; Tun, W.; Jeon, J.S.; An, G. Sucrose signaling in higher plants. Plant Sci. 2021, 302, 110703. [Google Scholar] [CrossRef] [PubMed]
  73. Liu, X.; Du, Y.; Na, X.; Wang, M.; Qu, Y.; Ge, L.; Wang, Y.; Gao, L.; Bai, W.; Bi, Y.; et al. Integrative transcriptome and metabolome revealed the molecular mechanism of Bacillus megaterium BT22-mediated growth promotion in Arabidopsis thaliana. J. Plant Physiol. 2023, 285, 153995. [Google Scholar] [CrossRef] [PubMed]
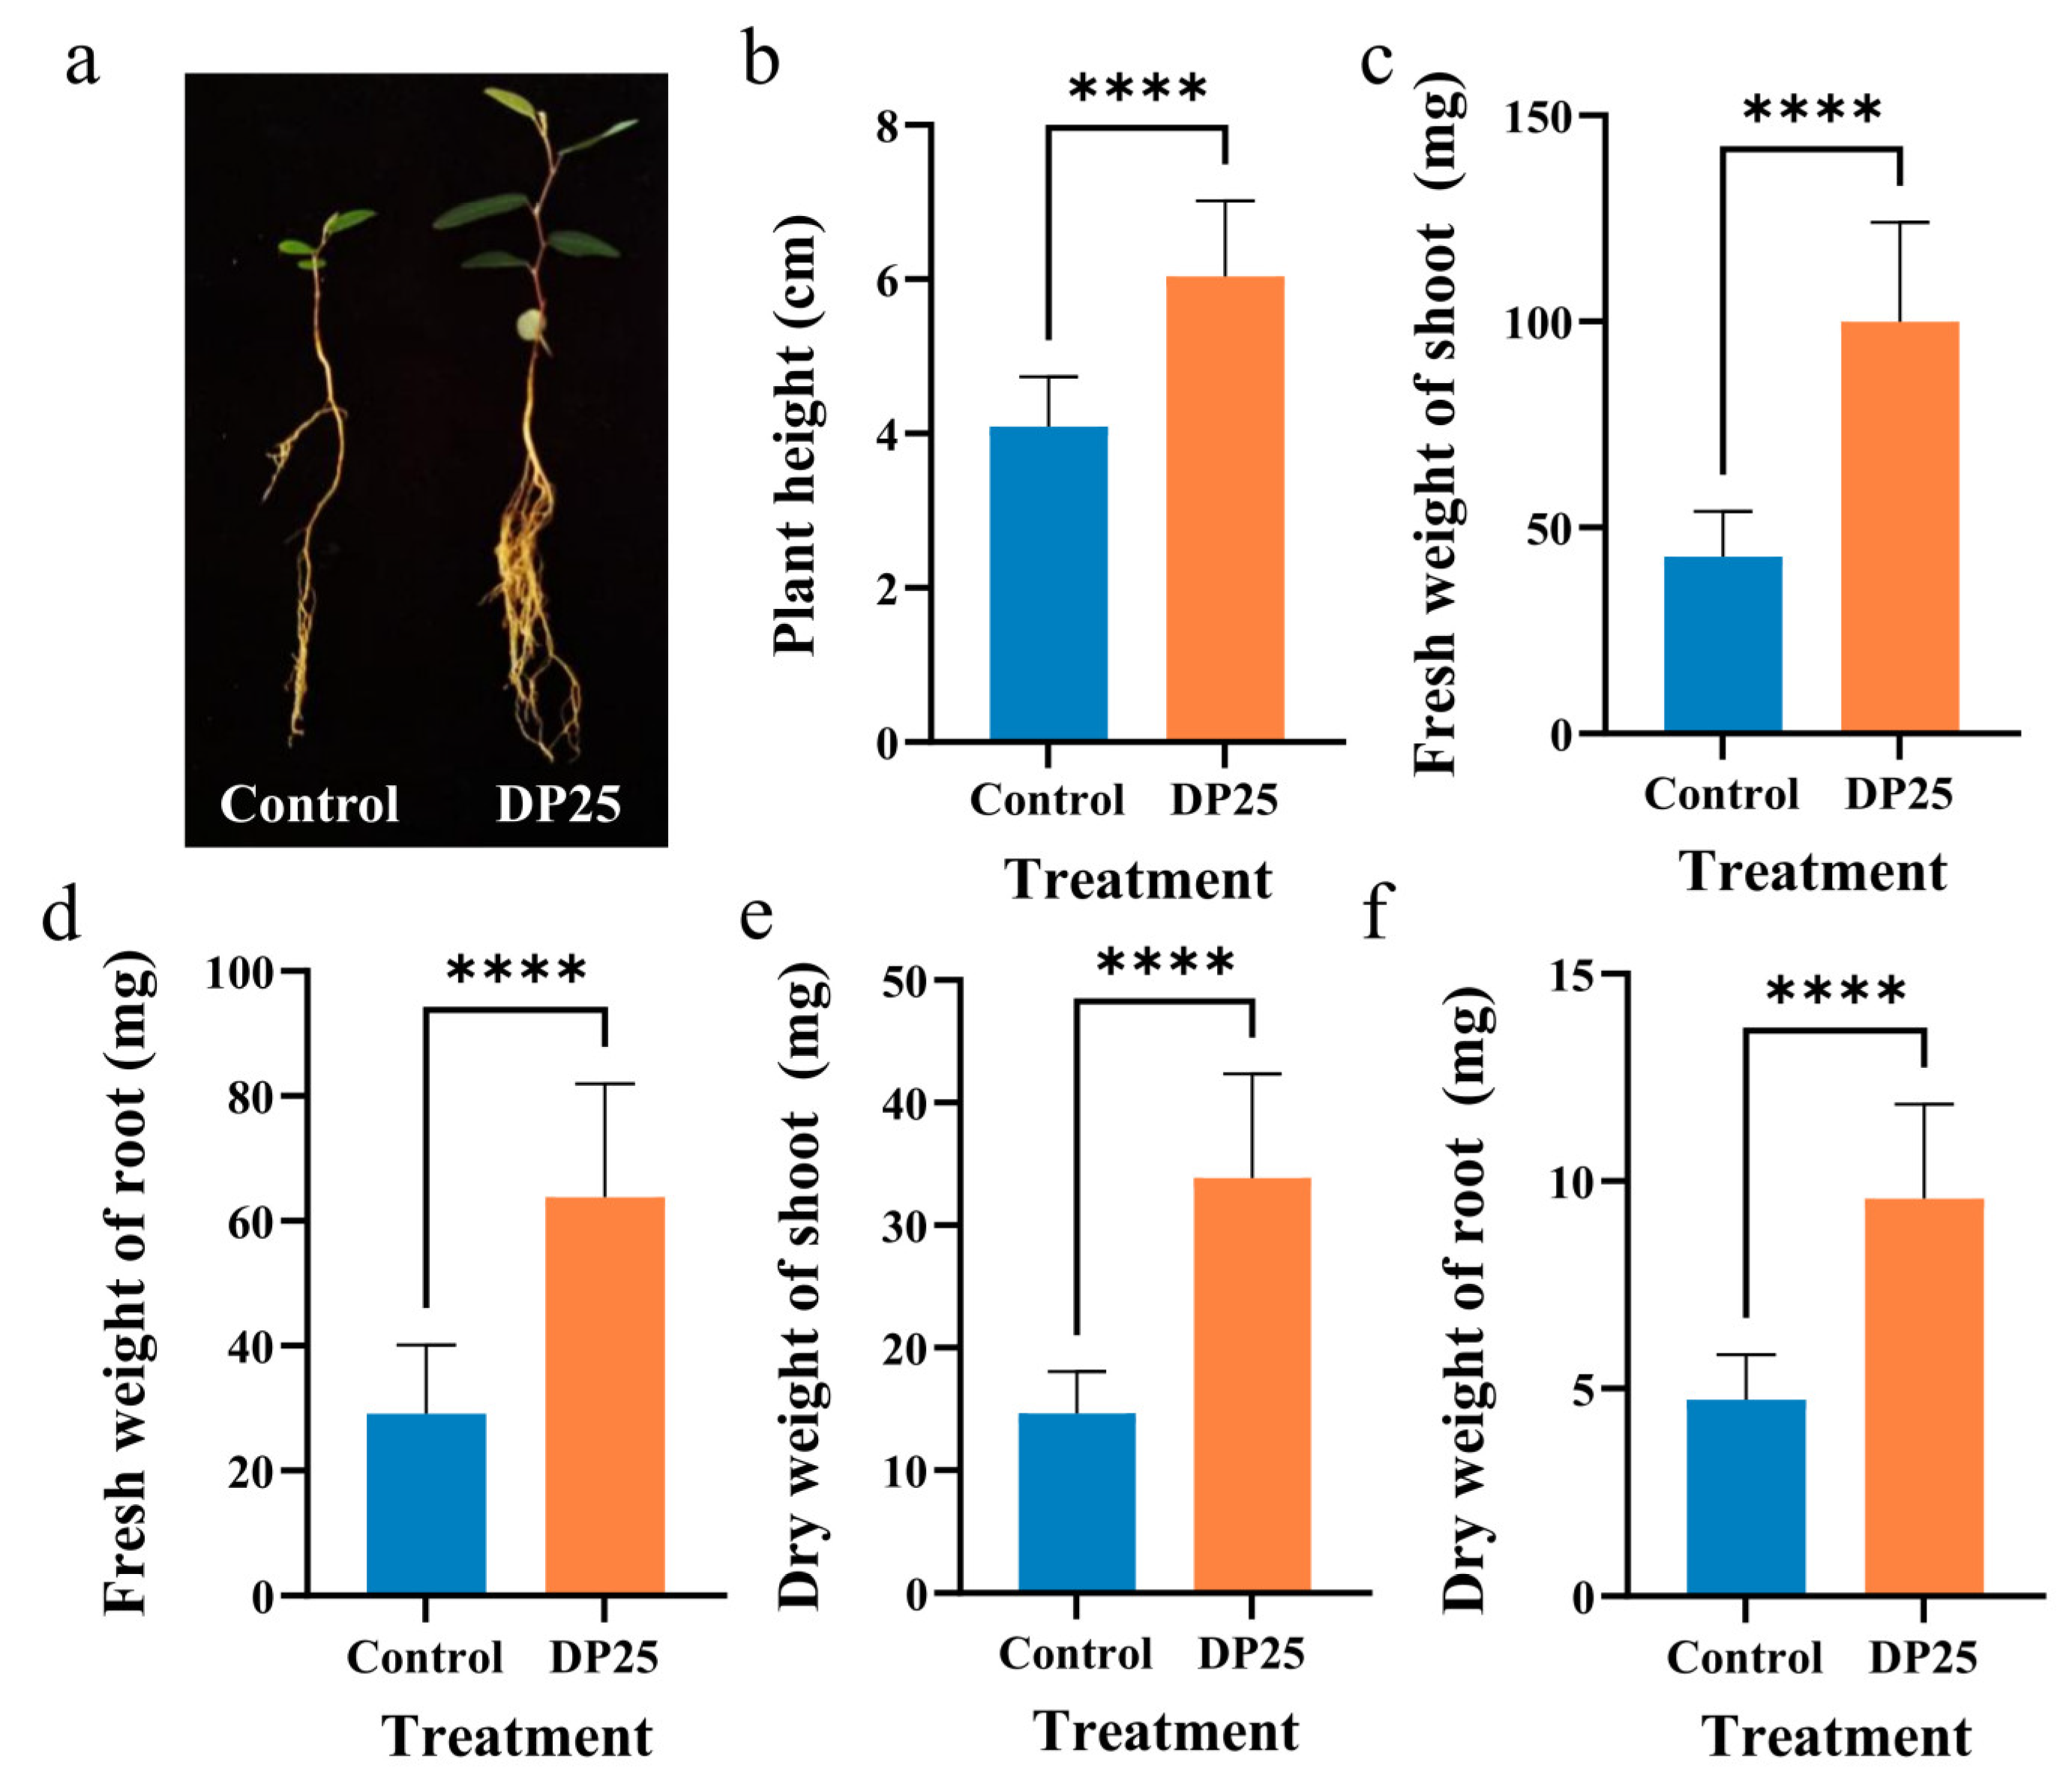
Figure 1. A. calcoaceticus DP25 treatment promotes growth of L. davurica seedlings. (a) Representative images of L. davurica treated with DP25. The plant on the left served as a control and was treated with water, and the plant on the right was treated with DP25. Scale bar = 5 cm. (bf) Changes in plant length, shoot fresh weight, root fresh weight, shoot dry weight, and root dry weight. “Control” indicates L. davurica treated with water, and “DP25” indicates L. davurica treated with the bacterial strain DP25. The data are presented as the mean ± standard deviations (SDs). The asterisks denote statistical significance (Student’s t-test): **** p < 0.0001.
Agronomy 15 01992 g001
Figure 2. A. calcoaceticus DP25 treatment enhances root architectural development in L. davurica. Panels (ad) illustrate the variations in root tip count, root length, root surface area, and root volume. “Control” indicates L. davurica treated with water, and “DP25” indicates L. davurica treated with the bacterial strain DP25. The data are presented as the mean ± standard deviations (SDs). The asterisks denote statistical significance (Student’s t-test): **** p < 0.0001.
Agronomy 15 01992 g002
Figure 3. A. calcoaceticus DP25 treatment modulates antioxidant enzyme activities and stress-related metabolites in L. davurica. (ag) Details of the changes in SOD, POD, CAT, soluble protein, soluble sugar, MDA, and free proline levels. “Control” indicates L. davurica treated with water, and “DP25” indicates L. davurica treated with the bacterial strain DP25. The data are presented as the mean ± standard deviations (SDs). The asterisks denote statistical significance (Student’s t-test): * p < 0.05, and *** p < 0.001, and ns denotes no significant difference between treatments.
Agronomy 15 01992 g003
Figure 4. Transcript levels of DEGs in L. davurica treated with A. calcoaceticus DP25 compared with control L. davurica. (a) Volcano plots displaying differentially expressed genes (DEGs) in L. davurica treated with the bacterial strain DP25 compared with control, L. davurica. (b) GO enrichment analysis of upregulated and downregulated DEGs. (c) KEGG enrichment analysis of DEGs. (d) Correlations between the RNA-seq and qRT-PCR data.
Agronomy 15 01992 g004
Figure 5. Metabolomic analysis identifies differentially accumulated metabolites in A. calcoaceticus DP25-treated L. davurica. (a) The ten most significantly upregulated and ten most substantially downregulated metabolites were identified on the basis of expression fold changes. (b) Volcano plots showing DAMs in L. davurica treated with the bacterial strain DP25 compared with the L. davurica control. (c) KEGG enrichment analysis of DAMs.
Agronomy 15 01992 g005
Figure 6. Integrated pathway analysis reveals co-regulated metabolic networks in DP25-treated L. davurica. Bubble plot showing KEGG pathway enrichment for both differentially expressed genes (circles) and differentially accumulated metabolites (triangles). Circle/triangle size indicates the number of genes or metabolites enriched in each pathway; color intensity represents statistical significance (−log10 p-value).
Agronomy 15 01992 g006
Figure 7. Heatmap visualization of pathway-specific gene expression and metabolite profiles in DP25-treated L. davurica. Comprehensive analysis showing differentially expressed genes ((a) gene names) and corresponding differentially accumulated metabolites ((b) metabolite names) involved in the 8 co-enriched KEGG pathways with more than 3 DEGs or DAMs. Gene expression levels are displayed as log2(fold change) values, with color intensity indicating upregulation (red) or downregulation (blue) relative to water control. Metabolite abundance changes follow the same color scheme. Pathway classifications are organized by functional categories, as indicated in the legend.
Agronomy 15 01992 g007
Disclaimer/Publisher’s Note: The statements, opinions and data contained in all publications are solely those of the individual author(s) and contributor(s) and not of MDPI and/or the editor(s). MDPI and/or the editor(s) disclaim responsibility for any injury to people or property resulting from any ideas, methods, instructions or products referred to in the content.