Article

Keel Petal Fusion in Soybean: Anatomical Insights and Transcriptomic Identification of Candidate Regulators

1
Sanya Nanfan Research Institute, Hainan University, Sanya 572025, China
2
School of Tropical Agriculture and Forestry, Hainan University, Haikou 570228, China
3
Yazhouwan National Laboratory, Sanya 572025, China
4
State Key Laboratory of Seed Innovation, Institute of Genetics and Developmental Biology, Chinese Academy of Sciences, Beijing 100101, China
5
Institute of Genetics and Developmental Biology, Chinese Academy of Sciences, Beijing 100101, China
6
Hainan Institute, Zhejiang University, Sanya 572025, China
*
Authors to whom correspondence should be addressed.
Agronomy 2025, 15(8), 1971; https://doi.org/10.3390/agronomy15081971
Submission received: 3 July 2025 / Revised: 30 July 2025 / Accepted: 13 August 2025 / Published: 15 August 2025
(This article belongs to the Section Crop Breeding and Genetics)

Abstract

The fusion of keel petals is a defining trait of Papilionoideae flowers, contributing to floral architecture and promoting self-pollination but hindering hybridization in crops like soybean. Here, we investigated the cellular and molecular basis of keel petal fusion in Glycine max (L.) Merr. cv. Jack using anatomical and transcriptomic approaches. Microscopy revealed that keel petal fusion involves marginal cell reshaping and postgenital adhesion with defective cuticle continuity, consistent with fusion modes in other Papilionoideae species. Comparative transcriptome analysis between fused and unfused petal stages identified 23,328 differentially expressed genes, with lipid and cuticle metabolism genes showing coordinated downregulation during fusion. A set of 384 keel-enriched genes was identified, among which a previously uncharacterized gene, KPEG1 (Keel Preferential Expression Gene 1), was preferentially expressed in fused keel petals. Protein interaction network analysis revealed that KPEG1 co-expresses with epigenetics-related genes, suggesting a regulatory role in fusion through chromatin-mediated mechanisms. These findings uncover the cellular dynamics and transcriptional reprogramming underlying keel petal fusion in soybean and provide a candidate regulator for further functional studies.

1. Introduction

Leguminosae (Fabaceae), commonly known as the pea family, is one of the largest and most diverse families of flowering plants, comprising over 765 genera and approximately 19,500 species. As the third largest angiosperm family—following Asteraceae and Orchidaceae—it includes species with widespread distribution across tropical and temperate regions, contributing significantly to global ecosystems and agricultural economies. Within Fabaceae, the subfamily Papilionoideae represents the largest clade [1], encompassing numerous economically important crops such as soybean, peanut, pea, common bean, and alfalfa [2,3,4]. Members of this subfamily are characterized by their bilaterally symmetrical (zygomorphic) flowers.
The typical Papilionoideae flower consists of 21 floral organs arranged in four concentric whorls: five sepals, five petals, ten stamens, and a single carpel, usually flanked by two bracteoles at the outermost layer [5]. The five petals are morphologically distinct and consist of one adaxial flag petal, two lateral wing petals, and two abaxial keel petals. The keel petals are postgenitally fused, enclosing the reproductive organs and thereby restricting access to foreign pollen [5]. This fusion structure, while evolutionarily advantageous, poses a major challenge for hybrid breeding in crops such as soybean (Glycine max) [6,7,8]. One potential strategy to overcome this barrier is the development of open-flower soybean varieties. In fact, mutations or genetic modifications in other legumes, such as exposed pistils in chickpea mutants [9], or altered petal identity in transgenic Lotus japonicus through modifying CYCLOIDEA (CYC) homolog LjCYC2 expression [10], suggest the feasibility of modifying floral architecture. However, the developmental process and molecular mechanisms underlying keel petal fusion remain largely unexplored in Papilionoideae.
Fossil evidence suggests that the floral organs of ancestral angiosperms were morphologically simple and unfused. Over evolutionary time, floral organs in many lineages developed fusion to optimize reproductive success [11]. However, the evolutionary trajectory of organ fusion is not linear or universal [12]. Two prevailing theories attempt to explain the mechanisms of floral organ fusion and separation. One posits that fusion results from sustained activity in meristematic tissues, allowing organ primordia to merge by removing inter-organ boundaries [13,14]. The other emphasizes the formation of physical boundaries—marginal zones that inhibit fusion by preventing intercellular adhesion and growth [15].
Fusion between plant organs or cells is widely observed in nature and can generally be categorized into four types [16]: (1) Protoplast fusion, as observed during gamete fertilization, where plasma membranes and cytoplasmic contents merge; (2) cell fusion, often associated with wound healing or grafting; (3) congenital fusion, also known as phylogenetic fusion or zonal growth, where organs fuse during early development through shared primordia; and (4) postgenital fusion, also referred to as ontogenetic fusion or surface fusion, where independently developed organs come into contact and adhere post-developmentally.
In this study, we investigated the anatomical and molecular basis of keel petal fusion in soybean and its relatives. Detailed histological analyses revealed dynamic cellular changes during fusion, including marginal cell rearrangement and disrupted cuticle continuity. Transcriptomic profiling of keel petals before and after fusion, alongside mixed flag and wing petals, uncovered coordinated downregulation of genes involved in lipid metabolism and cuticle biosynthesis during fusion. Through integrative analysis of differentially expressed genes and public transcriptome datasets from soybean floral tissues, we identified a previously uncharacterized gene, KPEG1 (Keel Preferential Expression Gene 1), as a potential regulator of keel petal development. Our findings provide a framework for understanding postgenital fusion in legume floral evolution and lay the foundation for future genetic manipulation of petal morphology through reverse genetics.

2. Materials and Methods

2.1. Plant Materials and Growth Conditions

The soybean cultivar Jack (Glycine max (L.) Merr. cv. Jack), Lupinus micranthus (Lupinus micranthus Guss.), Medicago truncatula (A17), and Lablab purpureus (Lablab purpureus (L.) Sweet) were maintained in Wei-Cai Yang’s group (Yazhou National Laboratory), and Medicago truncatula (A17) was obtained from Prof. Jian Feng’s group (Institute of Genetics and Developmental Biology, Chinese Academy of Sciences). The plants were grown under controlled growth room conditions with a 16 h light/8 h dark cycle at temperatures ranging from 25 °C to 28 °C. Additionally, soybeans were cultivated in the field at two locations in China: Beijing (39°58′ N, 116°20′ E) and Sanya (18°27′ N, 109°11′ E).

2.2. Light and SEM

Based on the established 13-stage classification system for soybean floral development that utilizes bract-to-bud positional relationships and sepal-to-bract/petal size ratios [17], our study specifically examined six critical developmental nodes relevant to floral organogenesis: (i) bract-enclosed floral buds with sepals shorter than bracts (Supplemental Figure S1A), (ii) developmental transition where bracts and sepals attain equal length (Supplemental Figure S1B), (iii) stage characterized by sepals surpassing bract length accompanied by bud expansion that induces bract unfolding (Supplemental Figure S1C), (iv) developmental window permitting corolla observation through sepal fissures (Supplemental Figure S1D), (v) phase of partial corolla emergence preceding anthesis (Supplemental Figure S1E), and (vi) final stage exhibiting fully expanded papilionaceous corolla (Supplemental Figure S1F). Morphological observations of soybean floral organs were systematically conducted at these six developmental nodes.
Fresh soybean flowers were collected and dissected using a stereomicroscope (Discovery.V12, Zeiss, Shanghai, China) equipped with a digital camera (Axiocam 208 color, Zeiss). For scanning electron microscopy (SEM) observation, floral buds of soybean in pre-fusion and near-fusion states were collected and dissected, following a slightly modified sample preparation method for SEM [7]. The samples were fixed in formalin–acetic acid–alcohol (FAA), dehydrated in a graded ethanol series, and freeze-dried overnight using a freeze dryer at −80 °C (Scientz-18N, SCIENTZ, Ningbo, China). After freeze-drying, the samples were dissected under a stereomicroscope to remove the bracts and sepals. The samples were then mounted on sonicated aluminum stubs, coated with gold palladium, and observed using a JCM-7000 scanning electron microscope (JEOL, Tokyo, Japan).
Fresh samples of unopened floral buds with completely fused keel petals (from Jack, Lupinus micranthus, Medicago truncatula, and Lablab purpureus) were collected for cryo-scanning observation using a modified method [18]. Briefly, the fresh samples were dissected and immediately placed in liquid nitrogen after removal from the plant. The samples were then coated with gold palladium and observed using a SEM Zeiss Crossbeam 340 (Zeiss) equipped with a VCT500 cryo-preparation system (Leica, Wetzlar, Germany), which included the process of cryo-focused ion beam (Cryo-FIB) milling [19,20]. Images were processed using ZEN microscopy software (Zeiss ZEN v3.8, Zeiss).

2.3. Histochemical Analysis

Fresh floral buds with fused keel petals from soybean were collected for histochemical analysis, according to a slightly modified paraffin embedding method [6,21,22]. The samples were first fixed in a 4% paraformaldehyde and 0.25% glutaraldehyde solution for 1 h, and then replaced with fresh fixative and left to fix overnight at 4 °C. After fixation, the samples were dehydrated through a graded ethanol series (30%, 50%, 70%, 90%, 100%) and a graded dimethylbenzene: ethanol series (1:3, 1:1, 3:1, 1:0) and embedded in paraffin. Continuous cross-sections of 8 μm thickness were obtained.
The cutinized cell walls were stained with Sudan reagent (G1525, Solarbio, Beijing, China). Lignified cell walls were stained using either Safranin O reagent (G1375, Solarbio) or toluidine blue (G4807, Solarbio). Pectin in the cell walls was stained using Ruthenium Red reagent (R8460, Solarbio). The stained sections were then observed using a microscope (Axio Imager 2, Zeiss) equipped with a digital camera (Axiocam 506 color, Zeiss).

2.4. RNA Isolation, Library Construction, and Sequencing

Soybean flowers were dissected using RNase-free forceps and dissecting needles. The different petals were collected at pre- and post-fusion stages of keel petals, with flag petals and wing petals mixed as “FW”, and keel petals as “K”. In total, twelve groups of samples, each with three biological replicates, consisting of mixed flag and wing petals (FW) and keel petals (K) at the two developmental stages, were collected (i.e., IK, MK, IFW, MFW). Total RNA was extracted from each sample group using the PicoPure® RNA Isolation Kit (KIT0204, Thermo Fisher Scientific, Shanghai, China), and RNA integrity was assessed with an Agilent 2100 Bioanalyzer (Agilent Technologies, Santa Clara, CA, USA), according to the reported [23].
cDNA libraries of each RNA sample (1 µg) were constructed using two library preparation methods: the NEB library and the strand-specific library [24]. Briefly, mRNA with polyA tails was enriched from total RNA using oligo(poly-T) primers. First-strand cDNA synthesis was performed using M-MuLV Reverse Transcriptase (RNase H-), followed by second-strand synthesis using DNA Polymerase I and RNase H. The library fragments, with lengths between 370 bp and 420 bp, were purified using the AMPure XP system (Beckman Coulter, Beverly, MA, USA). PCR amplification was conducted using Phusion High-Fidelity DNA Polymerase. The cDNA libraries were assessed with an Agilent Bioanalyzer 2100 system, and qualified libraries were sequenced on an Illumina NovaSeq 6000 platform to generate raw reads for subsequent analysis.

2.5. Analysis of Differentially Expressed Genes (DEGs)

Clean reads were obtained by filtering raw reads through adapter trimming, removal of N-containing reads, and elimination of low-quality reads (where >50% of bases had Qphred ≤20) using fastp (version 0.19.7) [25]. The reference genome (Glycine_max_v2.1) and gene model annotation files were downloaded directly from the genome website. Hisat2 v2.0.5 was used to build the reference genome index and align paired-end clean reads with the reference genome. The mapped reads of each sample were assembled using StringTie (v1.3.3b) in a reference-based approach [26], and read counts mapped to each gene were quantified using featureCounts (v1.5.0-p3) [27]. The FPKM (fragments per kilobase of transcript sequence per million base pairs sequenced) of each gene was calculated based on gene length and read count [28].
Pearson correlation coefficients (PCCs) were calculated for samples within and between groups based on the FPKM values of all genes in each sample, and heatmaps of Pearson correlations between samples were generated under the processed and analyzed with the cor (x, method = ‘pearson’) function and ggplot2 (R package Version 4.3.3). Differential expression analysis between groups with biological replicates was performed using the DESeq2 R package (1.20.0). The screening criteria employed the Benjamini and Hochberg approach, with an adjusted |log2(FoldChange)| ≥ 1 and a p-value ≤ 0.05 [29,30]. Gene Ontology (GO) enrichment analysis of differentially expressed genes, corrected for gene length bias, was conducted using the clusterProfiler R package (3.4.4), considering only genes with a corrected p-value < 0.05 for significant enrichment in the GO terms. Similarly, KEGG enrichment analysis of differentially expressed genes with a p-value < 0.05 was performed using the clusterProfiler (3.4.4) software [31,32,33]. Venn diagrams were generated using jvenn software (Version 1.7) [34]. A dot plot map was made from Evolview v2 web [35]. Heatmaps of expression for DEGs related to cuticle biosynthesis and preferentially expressed genes in MK and IK were created using OmicStudio tools (https://www.omicstudio.cn/tool/4, accessed on 13 November 2024).

2.6. Validation and Functional Analysis of Candidate Gene Expression in Tissues

Tissue samples were collected following the protocol in Section 2.4. Total RNA was extracted using the RNA Easy Fast Kit (DP452, TIANGEN, Beijing, China), followed by cDNA synthesis with the FastKing gDNA Dispelling RT SuperMix (KR118, TIANGEN). Quantitative real-time PCR (qRT-PCR) was performed using the SuperReal PreMix Plus (SYBR Green) Kit (FP205; TIANGEN) on a Roche LightCycler® 480 II, with GmEF1-α (gene bank accession NO. X56856) serving as the internal control (calculation of dCt), primers EF1F (TGTTGCTGTTAAGGATTTGAAGCG) and EF1R (AACAGTTTGACGCATGTCCCTAAC) were used to amplify a 358 bp gene fragment [36]. The KPEG1 gene in MFW was used as the calibrator, primers KPEG1F (GGAAAGGCAAGTCCCGATGA) and KPEG1R (GGTTTCGCTGGTGGCAATTT) were used to amplify a 135 bp fragment, and a 2% agarose gel electrophoresis was employed to verify the band size. The relative expression levels were calculated via the 2−ΔΔCt method. Publicly available transcriptome data encompassing 28 tissues from Wm82 and 314 tissues from ZH13 were obtained from the SoyOmics database (https://ngdc.cncb.ac.cn/soyomics/index, accessed on 10 December 2024). The bar graphs were generated using GraphPad Prism (version 10.1.2). The homologous genes of ZH13 and Wm82 genomes in Arabidopsis thaliana were identified with reference to the SoyGVD (https://yanglab.hzau.edu.cn/SoyGVD/#/, accessed on 28 December 2024) and SoyOmics databases. Protein–protein interaction network and gene structure analyses were performed using the UniProt (https://www.uniprot.org/, accessed on 17 January 2025), STRING (https://string-db.org/, accessed on 17 January 2025), and SMART (http://smart.embl.de/, accessed on 17 January 2025) databases.

3. Results

3.1. Morphology of the Papilionaceous Corolla of Soybean

The soybean petals and sepals are arranged oppositely, with the longest sepal aligning with the fused line of the keel petals, and the two smallest sepals located opposite the keel petals (Figure 1A,B). Inside, the ten stamens and one carpel are enclosed by the two fused keel petals (Figure 1C). During development, the five sepals fuse at the base, forming an adnate sepal tube, with a lanceolate shape at the top (Figure 1D). The five petals differentiate into three types: one flag petal on the adaxial side, two wing petals on the lateral sides, and two keel petals on the abaxial side. The flag petal, being the largest, displays bilateral symmetry along its central axis (Figure 1E). The two wing petals are positioned on either side of the keel petals but do not fuse despite their partial spatial overlap (Figure 1F). Notably, the innermost keel petals are connate (Figure 1G). Altogether, there are twenty-one organs arranged in 4 successive whorls: five sepals, five petals, ten stamens, and one carpel along the floral radial axis (Figure 1H).
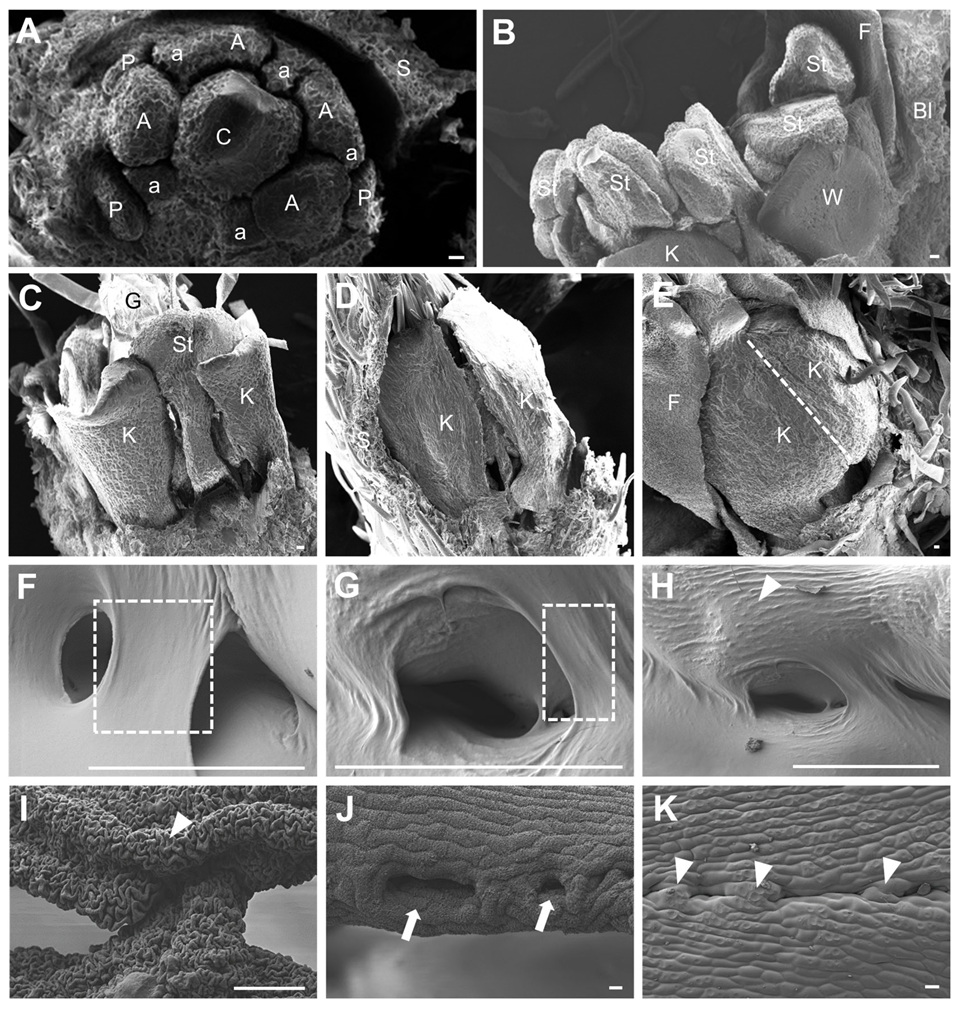
To investigate the organ fusion process of the keel petals, we conducted scanning electron microscopy (SEM) imaging. We observed that petal primordia emerge early during floral development (Figure 2A). The different petal types could be distinguished by their expansion rates, with the flag petal primordia expanding more rapidly than the others (Figure 2B). Initially, the keel petals were separated (Figure 2C), but as floral development progressed, the two keel petals approached and fused along their adjacent margins (Figure 2D), forming a fusion line (Figure 2E). These observations suggest that the keel petals undergo postgenital fusion during floral development.
We next observed the postgenital fusion process of keel petals in detail using SEM. At the initial fusion stage, specific epidermal substances covered the surface of the petals, forming a bridge, and they may facilitate the contact between the opposing edges of the two keel petals on the abaxial side (Figure 2F,G). As the keel petals developed, cell wall textures gradually appeared on the abaxial side of the keel petals (Figure 2H), eventually forming nanoridges (Figure 2I). Along the fusion line, alternating patterns of fused and unfused regions (apertures) between the two keel petals became evident (Figure 2J,K).
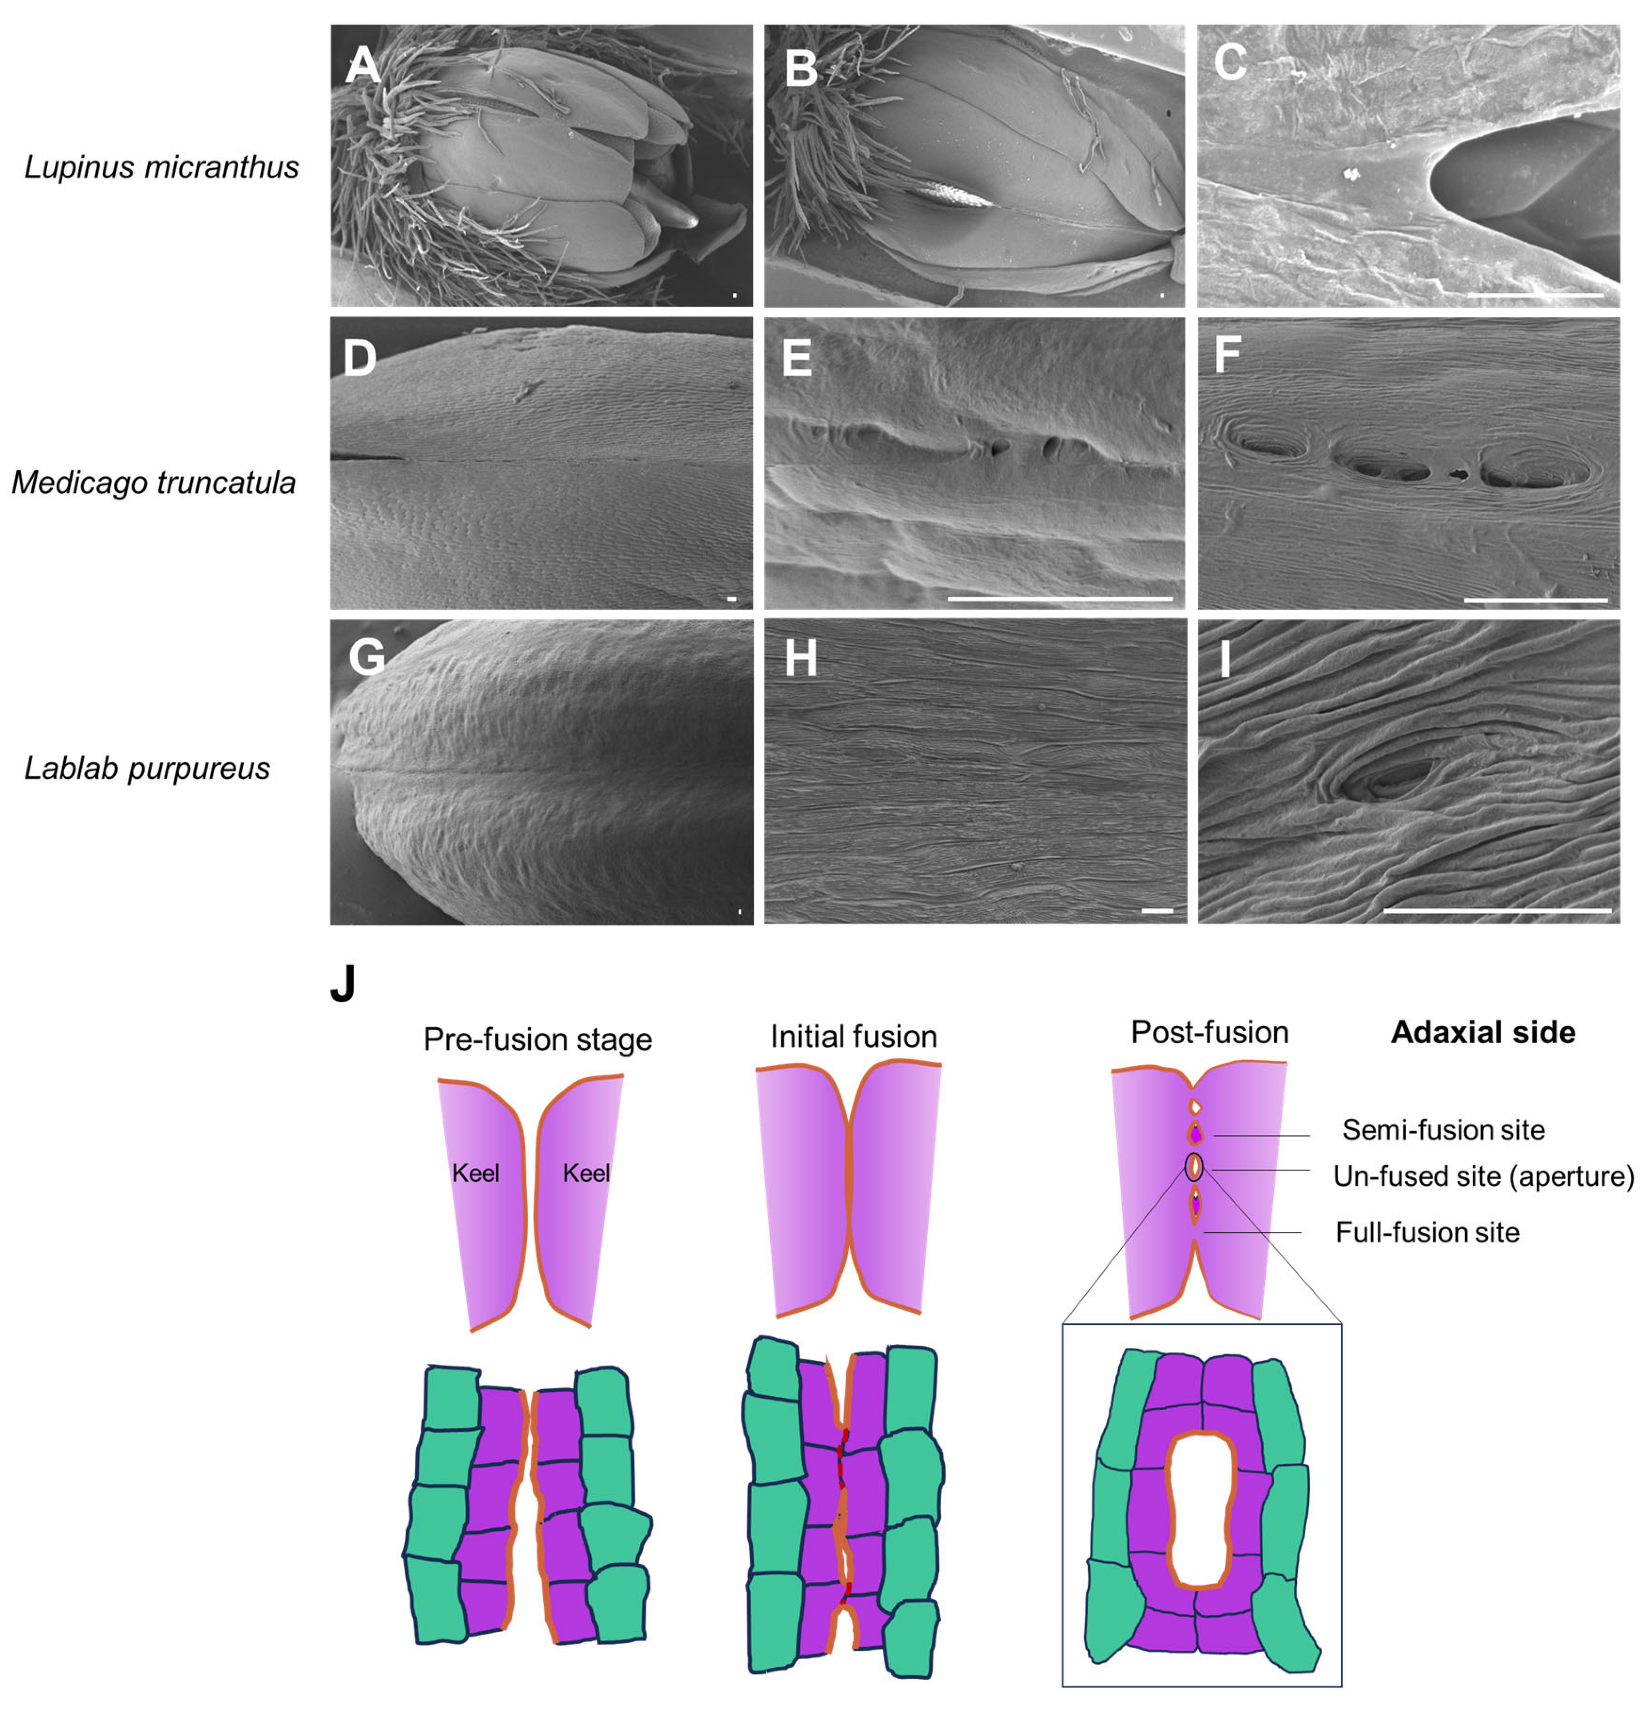
To assess whether the keel petal fusion pattern observed in soybean is conserved across the Papilionoideae subfamily, we examined the fused keel petal morphology in three additional species: Lupinus micranthus, Medicago truncatula, and Lablab purpureus. Scanning SEM revealed that all three species exhibit progressive keel petal adhesion, similar to soybean, characterized by marginal contact and the accumulation of intercellular substances at the fusion interface (Figure 3A–I). Notably, the extent of fusion appeared more compact in these species compared to soybean, as indicated by a reduced proportion of unfused regions (Figure 3A–I). These observations suggest that discontinuous postgenital fusion of keel petals is a conserved morphological feature among Papilionoideae species (Figure 3J).

3.2. Different Morphology of the Opposite Marginal Cells at the Contact Site

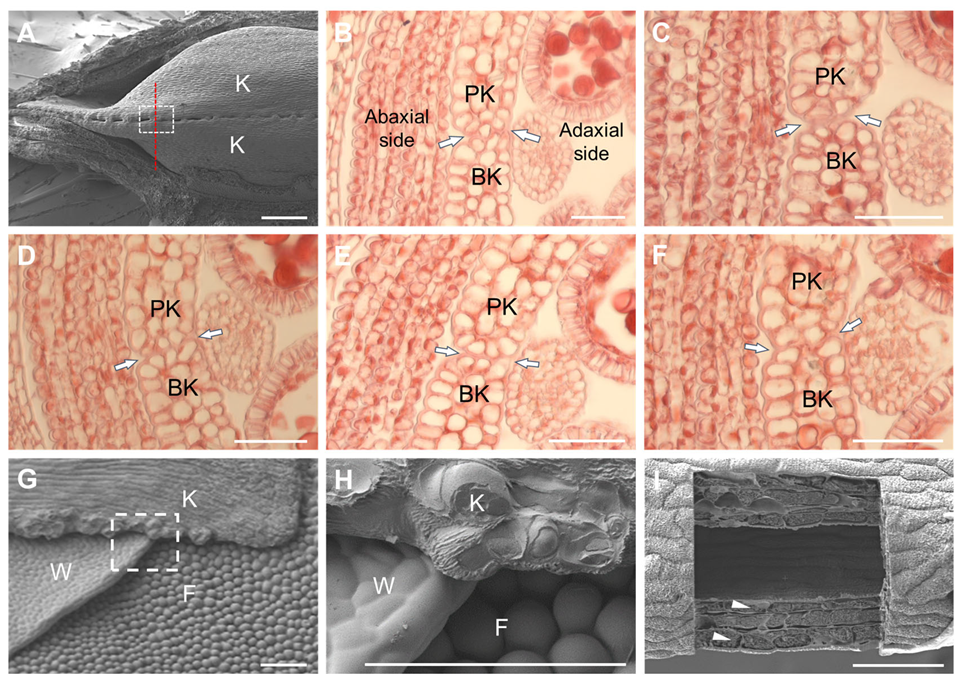
To investigate the morphological changes in cells at the fusion zone, we performed successive sectioning at the fusion point and its adjacent unfused region (Figure 4A). The contacting marginal cells of the two keel petals were not morphologically identical. At the fusion point, the two keel petals formed a beveled surface, with a blunt keel (BK) extending adaxially compared to a pointed keel (PK) along this bevel (Figure 4B). Additionally, some intercellular substances filled the gaps between the adjoining margins (Figure 4C). In the initial fused region, a cell from the adaxial side of the BK extended toward the end of the PK (Figure 4D). As the fusion progressed, the margins of the two keel petals connected at the fusion points with the epidermal cell layers (Figure 4E). Interestingly, one of the epidermal cells from the BK reshaped and projected into the extracellular space between the two epidermal cells of the PK, blurring the boundary between the two keel petals (Figure 4F). These findings suggest that the adjacent marginal cells of the two keel petals adhere, which is accompanied by the reshaping of the contacting epidermal cells.
To determine whether the fusion of keel petals is associated with specific features of the epidermal cells, we performed Cryo-SEM and based on the obtained paraffin sections to observe the epidermal cells of the flag, wing, and keel petals. The epidermal cells of the flag petal resembled the conical cells of Arabidopsis petals [37], featuring outward-facing domes (Figure 4G). The epidermal cells of the wing petals were nearly circular, with a mild outward bulge, displaying a mosaic pattern, and the marginal cells formed a smooth edge (Figure 4H). Additionally, the epidermis of the two keel petals was flatter than that of the flag and wing petals (Figure 4I), resembling the cylindrical palisade cells of Arabidopsis [38].

3.3. Cell Reshaping and Cuticle Changes on the Keel Fusion Site

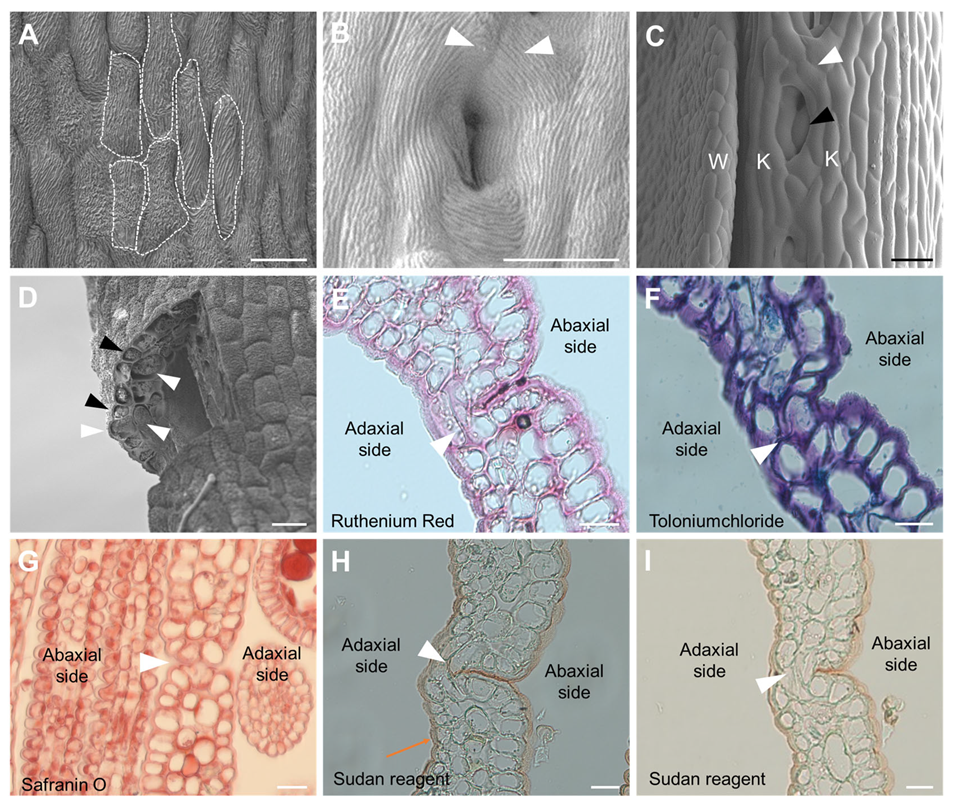
Epidermal cell shapes differ between the abaxial surface and the fusion points of the keel petals. On the abaxial surface, the epidermal cells were long and parallel, forming neat textures with an interlaced or parallel arrangement (Figure 5A). In contrast, at the fusion points, the adjacent marginal cells bent towards the opposing keel petal, creating an interlocking buckle pattern (Figure 5B). Additionally, the keel petals tended to bend inward along the fused line, with the semi-fusion site showing a connection on the adaxial side and separation on the abaxial side (Figure 5C). Using cryo-focused ion beam (cryo-FIB) imaging on the fused zone, we observed several enlarged cells within the three layers of keel petals at the adjacent margins (Figure 5D). These findings suggest that the postgenital fusion of keel petals is discontinuous and that the marginal cells at fusion points may undergo an active developmental process, involving changes in intercellular substances during reshaping and fusion.
To further investigate whether the fusion process of keel petals is associated with changes in epidermal cells—particularly the marginal cells undergoing reshaping at the fusion zone—we performed histochemical staining of paraffin sections to analyze the cell wall components. We used Ruthenium Red (for pectin), Safranin O, Toloniumchloride (for lignin), and Sudan reagent (for cutinized cell walls). Ruthenium Red, Toloniumchloride, and Safranin O staining showed no differences in the fused zone, with all of them resulting in intense staining (Figure 5E–G). Interestingly, Sudan reagent stained only the surface of the abaxial and adaxial sides and showed partial staining in the contacting region (Figure 5H) but not in the completely fused zone (Figure 5I). These results suggest that the cuticle covering the contacting cells is eliminated during organ fusion.

3.4. Distinct Transcriptomes Between the Petals

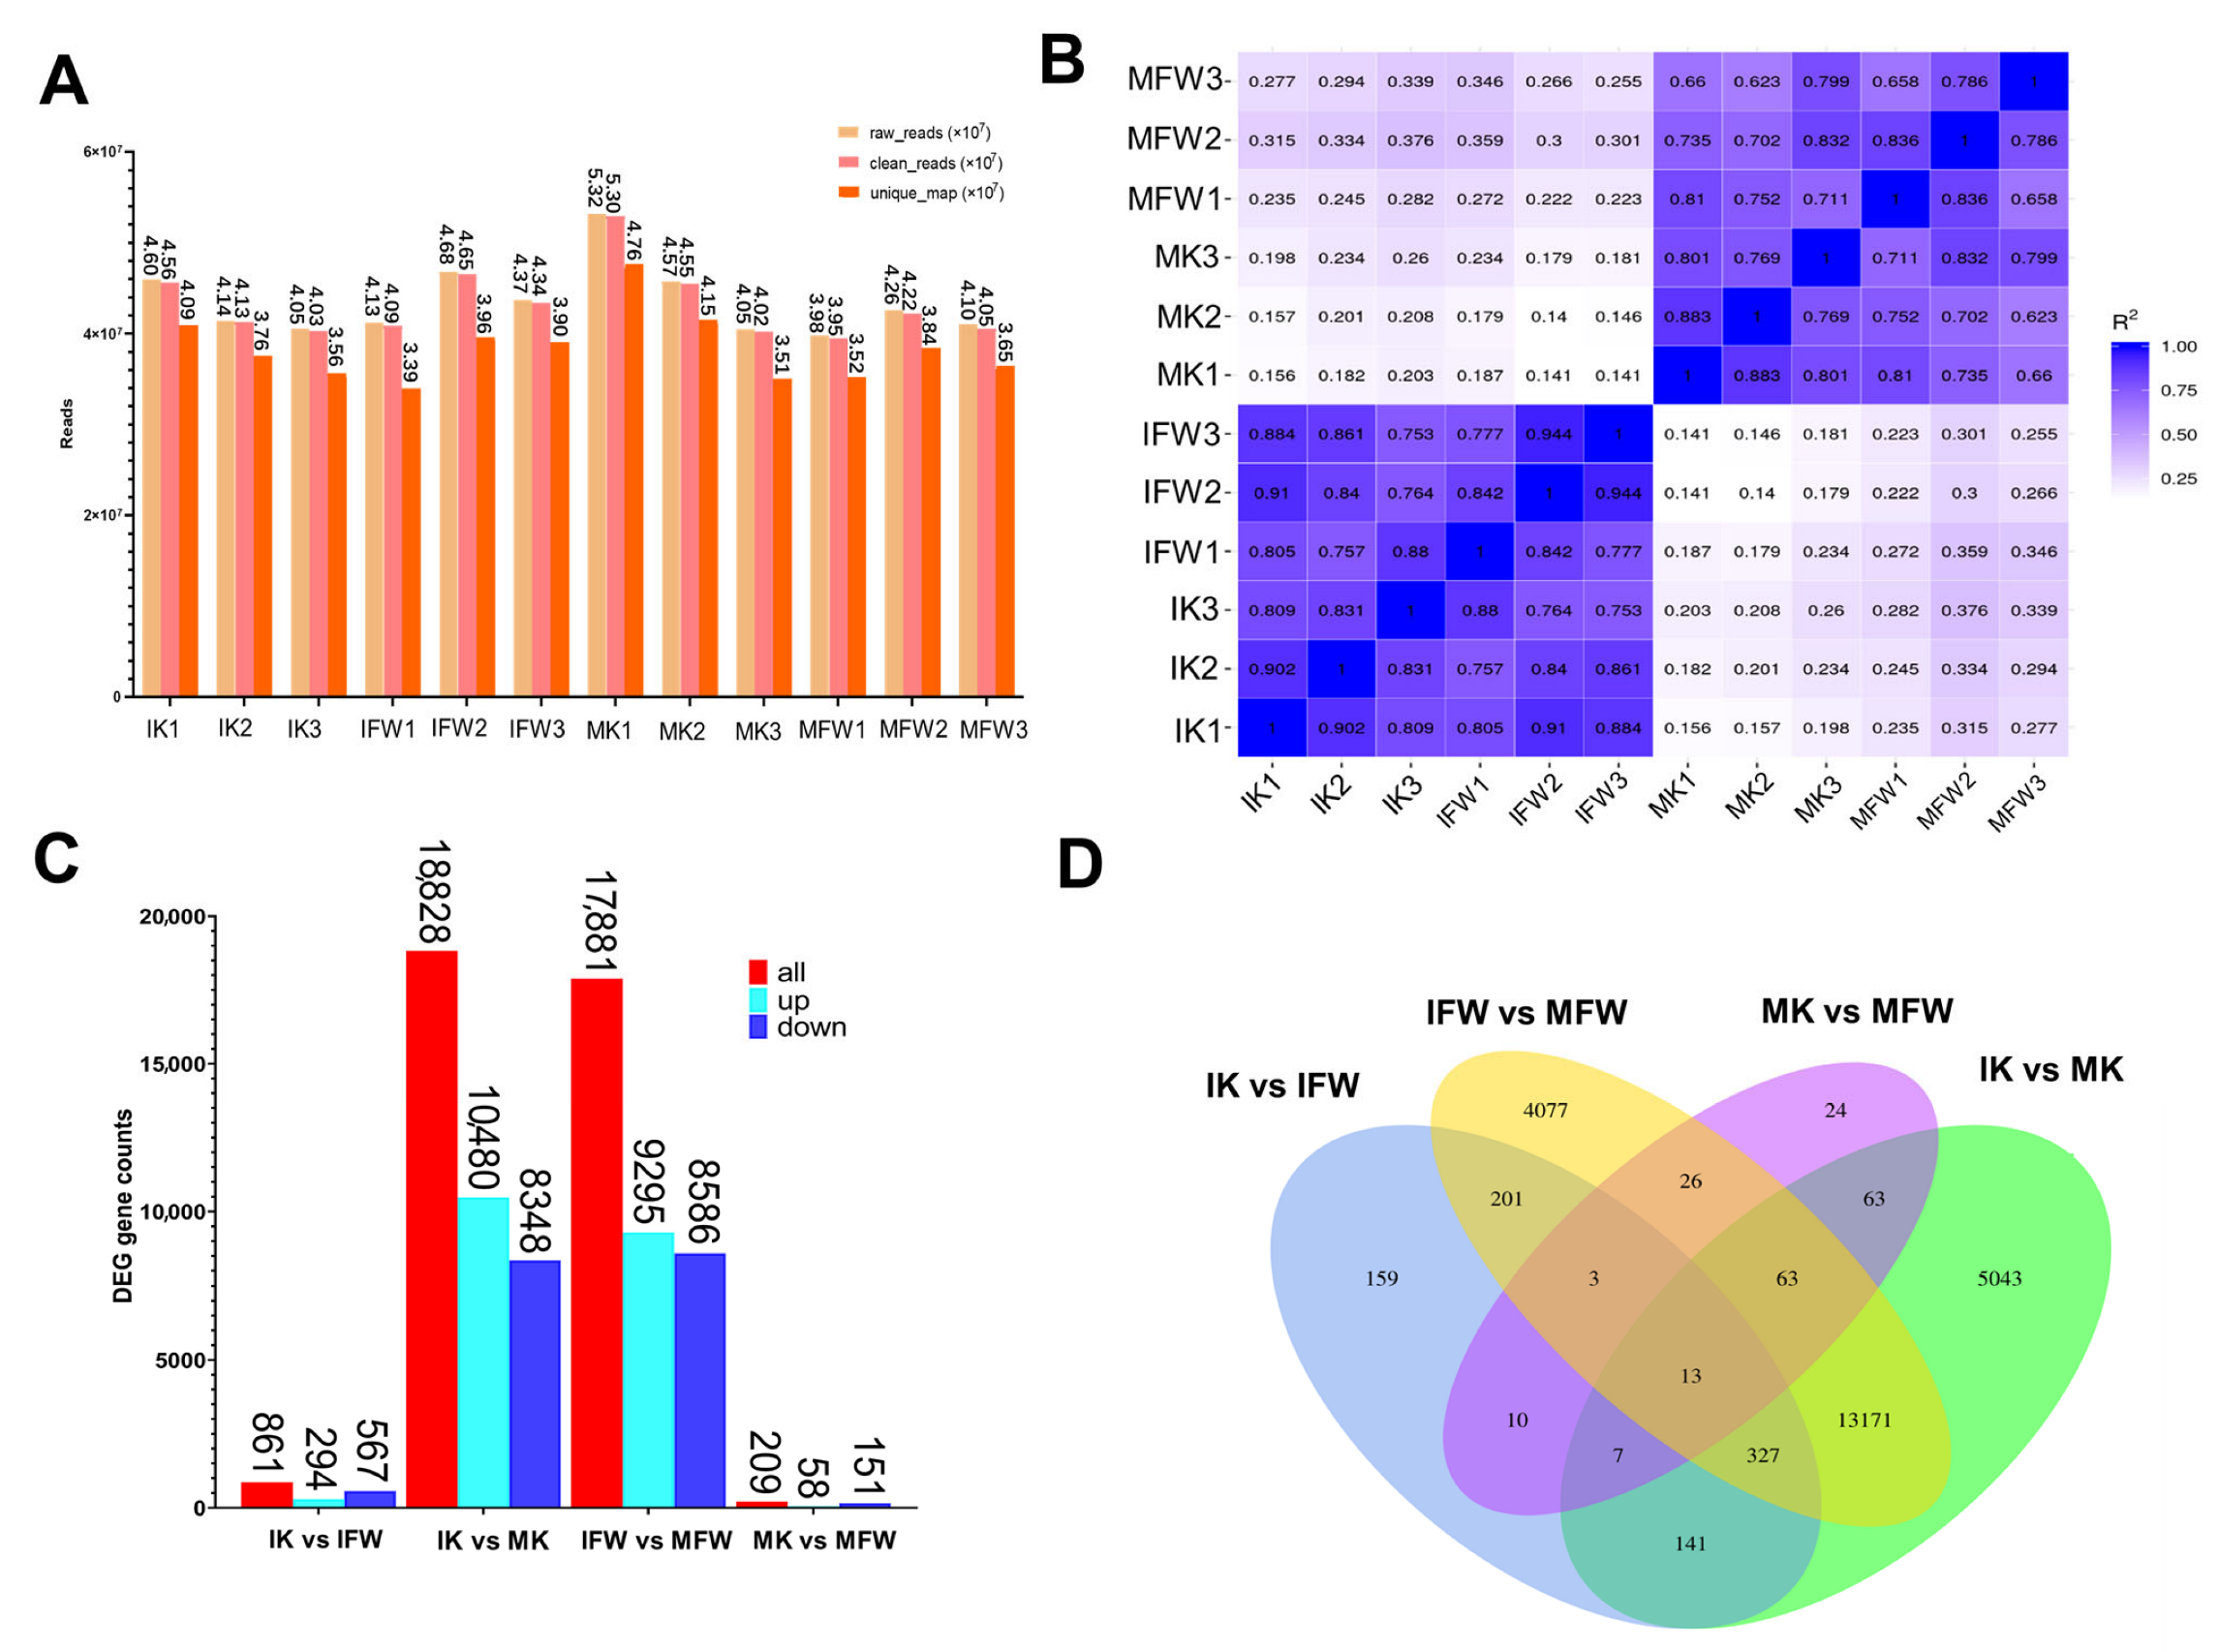
To investigate the molecular regulations underlying the fusion of keel petals, we performed RNA-seq transcriptome profiling with mixed flag and wing petal samples compared to keel petals at both pre-fusion (approaching but still spatially separated) and post-fusion stages (right after fusion, before anthesis). The samples included immature keel (IK), mature keel (MK), immature mixed samples of flag and wing (IFW), and mixed mature flag and wing (MFW), each with three biological replicates. Finally, we obtained a total of 12 groups of transcriptome data, and the raw sequencing data (raw reads) obtained from each sample group were processed to generate clean reads. For every sample group, clean reads accounted for over 99% of the raw reads, comprising more than 39 million reads, with over 80% of these clean reads being uniquely mapped to the reference genome (Figure 6A). Based on the Pearson correlation coefficient (PCC) results, the transcriptome data showed higher correlations between the same floral organ at the same developmental stage than between different organs at the same stage. Additionally, the correlations were low among replicates from the same organ at different stages and even lower between different organs at different stages (Figure 6B). These results indicate that the transcriptome data are reliable and suitable for further analysis.
To identify genes specifically expressed in keel petals, we compared gene expression between different petals at the same developmental stages (IK vs. IFW; MK vs. MFW) and within the same petals at different stages (IK vs. MK; IFW vs. MFW), using a two-fold difference in normalized read count as the criterion. We identified 861 differentially expressed genes (DEGs) for IK vs. IFW, 18,828 for IK vs. MK, 17,881 for IFW vs. MFW, and 209 for MK vs. MFW (Figure 6C). Comparisons of IK vs. IFW and MK vs. MFW showed fewer DEGs than IK vs. MK and IFW vs. MFW. Notably, the number of DEGs was similar between IK vs. MK and IFW vs. MFW, indicating large gene expression changes between the same organs at different developmental stages (Figure 6C). Moreover, we observed a large number of DEGs during the early developmental stage (immature) compared to the later stage (mature) in organ comparisons (IK vs. IFW and MK vs. MFW) (Figure 6C). In total, we identified 23,328 unique DEGs across the four comparison groups, of which 5043 were specifically differential expression in keel petals (Figure 6D).
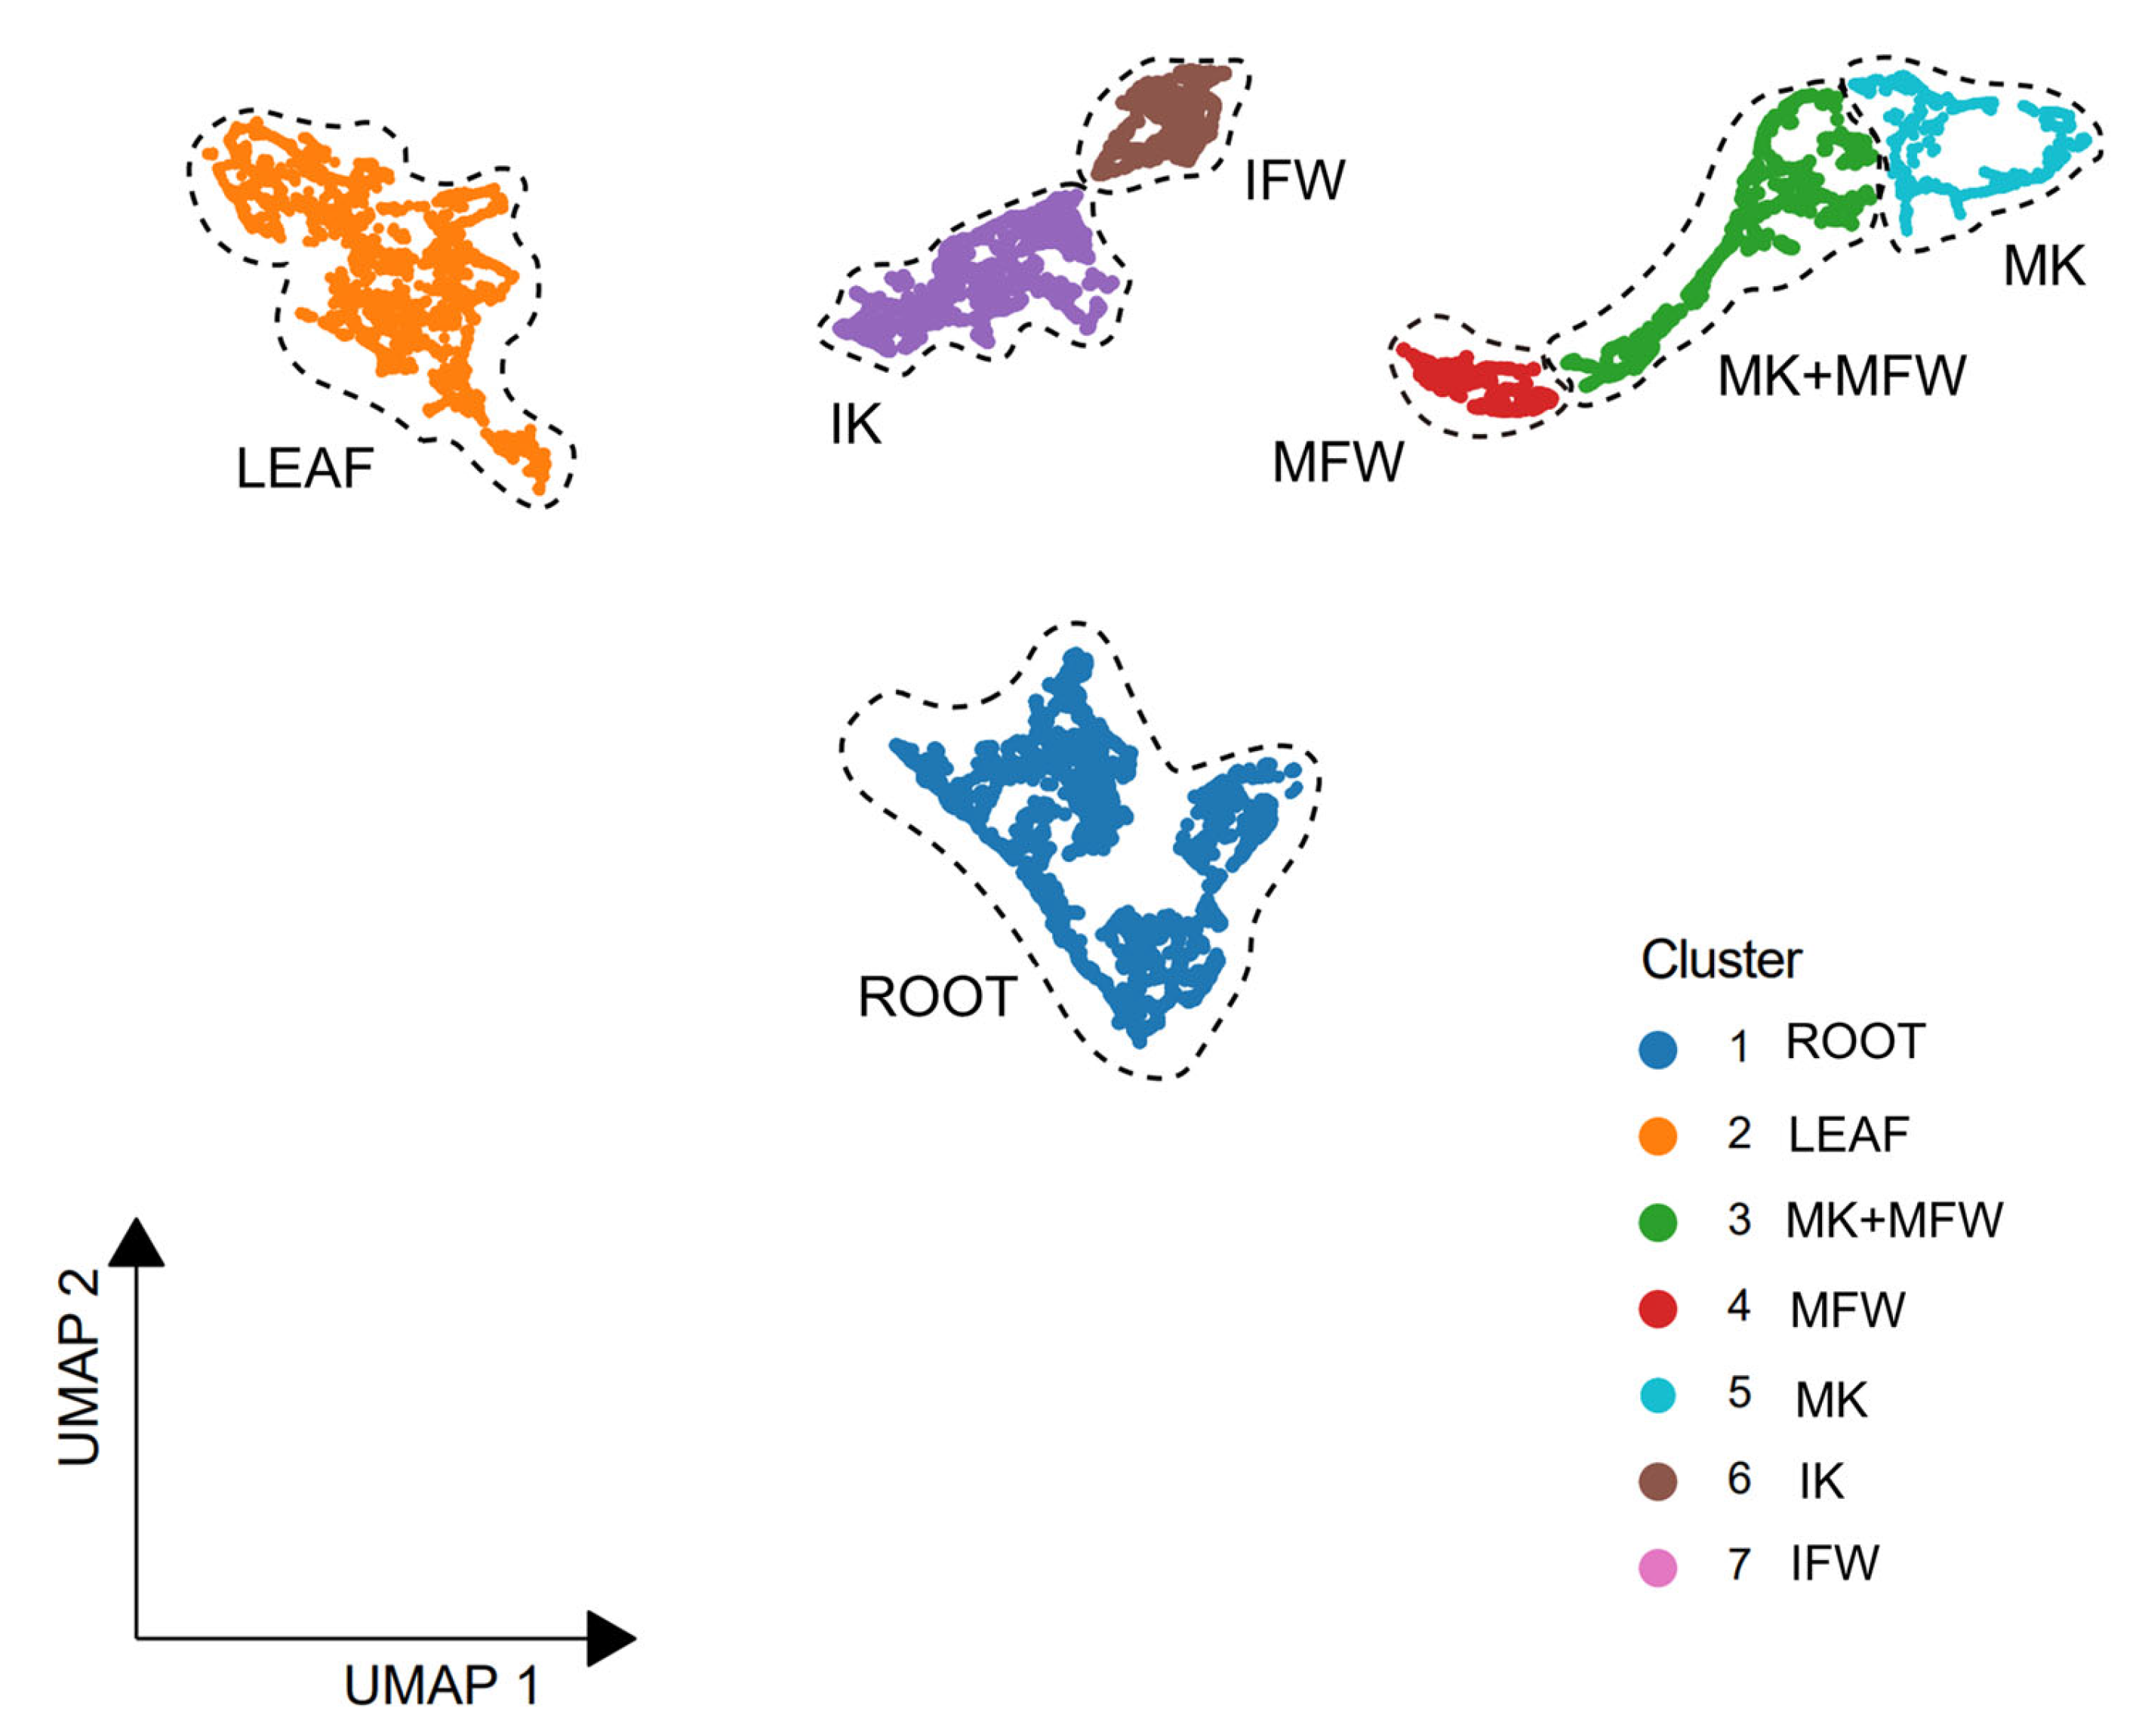
We used the Uniform Manifold Approximation and Projection (UMAP) algorithm to identify the unique genes in each sample [39]. Our results demonstrated that the expression levels of different tissues are highly distinctive. The UMAP transcriptome atlas allows for the identification of differentially expressed genes (DEGs) across various tissues, revealing unique transcriptomic signatures. The IK and IFW clusters are positioned closely together with a distinct boundary; while MK and MFW have a partial overlapping pattern, they each have a specifically distinct pattern (Figure 7). As controls, the root and leaf clusters are distributed distantly (data from the Plant Public RNA-seq Database [40]) (Figure 7).
To explore the potential metabolic and signaling pathways in which these DEGs may be involved, we performed KEGG enrichment analysis on the four comparison groups. We observed that different petal types exhibited distinct metabolic preferences during the pre-fusion stage of the keel petals. In the keel petals (IKs), more genes were significantly downregulated compared to mixed wing/flag petals (IFWs) in the flavonoid biosynthesis (12 DEGs: 3 up, 9 down), glycerolipid metabolism (8 DEGs: 1 up, 7 down), and glyoxylate and dicarboxylate metabolism (8 DEGs: 3 up, 5 down) KEGG pathways. However, the linoleic acid metabolism pathway showed more upregulated genes (11 DEGs: 10 up, 1 down) (Supplemental Figure S2A, Supplemental Table S1). These findings suggest that these metabolic pathways might be related to the different petal identities during early development. Conversely, the DEGs from the MK vs. MFW group are enriched in light response-related pathways (Supplemental Figure S2B, Supplemental Table S2), suggesting that different petals may have distinct light signaling.
DEGs within the same petal type were significantly enriched in substance metabolism-related pathways. During the pre-fusion stage of keel petals, more genes were expressed at a higher level compared to the post-fusion stage, including genes involved in amino acid biosynthesis (232 DEGs: 171 in IK, 61 in MK), glycolysis/gluconeogenesis (154 DEGs: 114 in IK, 40 in MK), purine metabolism (114 DEGs: 77 in IK, 37 in MK), and pyruvate metabolism (105 DEGs: 77 in IK, 28 in MK) (Supplemental Figure S2C, Supplemental Table S3). Similarly, IFW had more genes with a higher expression level than MFW in the amino acid biosynthesis (230 DEGs: 165 in IFW, 65 in MFW), glycolysis/gluconeogenesis (144 DEGs: 107 in IFW, 37 in MFW), pyruvate metabolism (100 DEGs: 74 in IFW, 26 in MFW), and fatty acid metabolism (85 DEGs: 59 in IFW, 26 in MFW) (Supplemental Figure S2D, Supplemental Table S4). These findings suggest that keel and mixed flag/wing petals have more active metabolic activities during the pre-fusion stage than the post-fusion stage.
Additionally, we found that the DEGs from the IK vs. MK and IFW vs. MFW groups are classified in similar pathways and patterns, particularly in pathways such as the amino acid biosynthesis, glycolysis/gluconeogenesis, and pyruvate metabolism. Notably, seven identical KEGG pathways related to lipid metabolism (KEGG IDs: gmx01212, gmx00061, gmx00071, gmx00620, gmx01040, gmx00062, gmx00073) were enriched in both groups, with 228 DEGs in the IK vs. MK group and 226 DEGs in the IFW vs. MFW group. In both cases, more genes were upregulated in the pre-fusion stage (IK and IFW) than in the post-fusion stage (MK and MFW). Furthermore, 192 DEGs were shared between the two groups, with 139 genes with higher levels and 53 with lower levels at the pre-fusion stages compared to the post-fusion stages (Supplemental Figure S3, Supplemental Table S5). These findings suggest that different petal types share some similar metabolic pathways and gene expression patterns during development.
Interestingly, 36 DEGs among the 228 DEGs related to pyruvate metabolism and fatty acid metabolism in the IK vs. MK group, distinct from those in the IFW vs. MFW group, including 24 with higher levels and 12 with lower levels in IK compared to MK, indicated specific gene expression in IK (Supplemental Figure S3, Supplemental Table S5). Additionally, among the seven lipid-related pathways in the IK vs. MK group, we identified one distinct pathway—fatty acid degradation (KEGG ID: gmx00071)—with almost the same number of enriched genes in IK and MK (64 DEGs: 33 enriched in IK, 31 enriched in MK). Notably, DEGs related to fatty acid degradation exhibited a higher proportion of enriched genes in MK compared to IK, unlike the other lipid metabolism pathways. Since cuticular metabolism is closely related to fatty acid and pyruvate metabolism [41], and the cuticle was eliminated after fusion in the fused zone of the keel petals (as mentioned above), this suggests that the formation of a functional cuticle in the fused zone may be terminated during the keel petal fusion stage.
To further validate whether cuticle biosynthesis shares congruent expression patterns with lipid metabolism-related genes, we performed expression profiling of soybean orthologs encoding key Arabidopsis cuticle biosynthesis regulators during pre- and post-fusion stages of keel petal development based on the transcriptome data generated in this study. We identified 73 homologous genes in soybean corresponding to the 17 known cuticle biosynthetic genes in Arabidopsis (Table 1), which are involved in different cuticle biosynthetic processes, including the biosynthesis and transport of fatty acids, waxes, and cutins (Figure 8).
Among these, 42 genes were differentially expressed across the four comparison groups, including 33 genes in keel petals (IK vs. MK), 37 genes in flag/wing mixed petals (IFW vs. MFW), and 5 genes across petal types during early developmental stages (IK vs. IFW) (Supplemental Table S6). Of the 42 genes, 32 were downregulated and 10 were upregulated in MK compared to IK. Although the enrichment in cuticular metabolism of the expressed genes in keel petals among the 42 genes was similar to flag/wing mixed petals, there were differentially expressed genes, including 8 genes that were upregulated and 4 genes that downregulated in the post-fusion-stage keel petals compared with the pre-fusion-stage keel petals. Specifically, among the 33 differentially expressed genes in keel petals, 4 were significantly upregulated and 29 were downregulated in MK, indicating a downregulation of cuticular metabolism in MK compared to IK (Supplemental Figure S4, Supplemental Table S7). These results demonstrate that both keel petals and mixed flag/wing petals show similar expression patterns in cuticular and lipid metabolic genes during keel petal fusion, with most genes in these pathways being downregulated.
However, postgenital fusion characteristics were uniquely observed in keel petals. Meanwhile, comparative analysis also revealed only partial overlap in differentially expressed genes (DEGs) related to lipid and cuticle metabolism between keel petals and mixed flag/wing petals, with many distinct genes remaining. Additionally, considering the inherent complexity of lipid metabolism and cuticle biosynthesis networks, we hypothesize that an unidentified upstream master regulator may coordinate the expression of these gene networks, thereby influencing localized cuticle synthesis in keel petal marginal cells. The identification of such a key regulatory factor would be of significant importance, as it would not only advance our understanding of floral organ fusion mechanisms but also provide potential targets for modifying petal morphology in legume crops.

3.5. Analysis of Keel-Preferentially Expressed Genes and Screening of Candidate Regulators

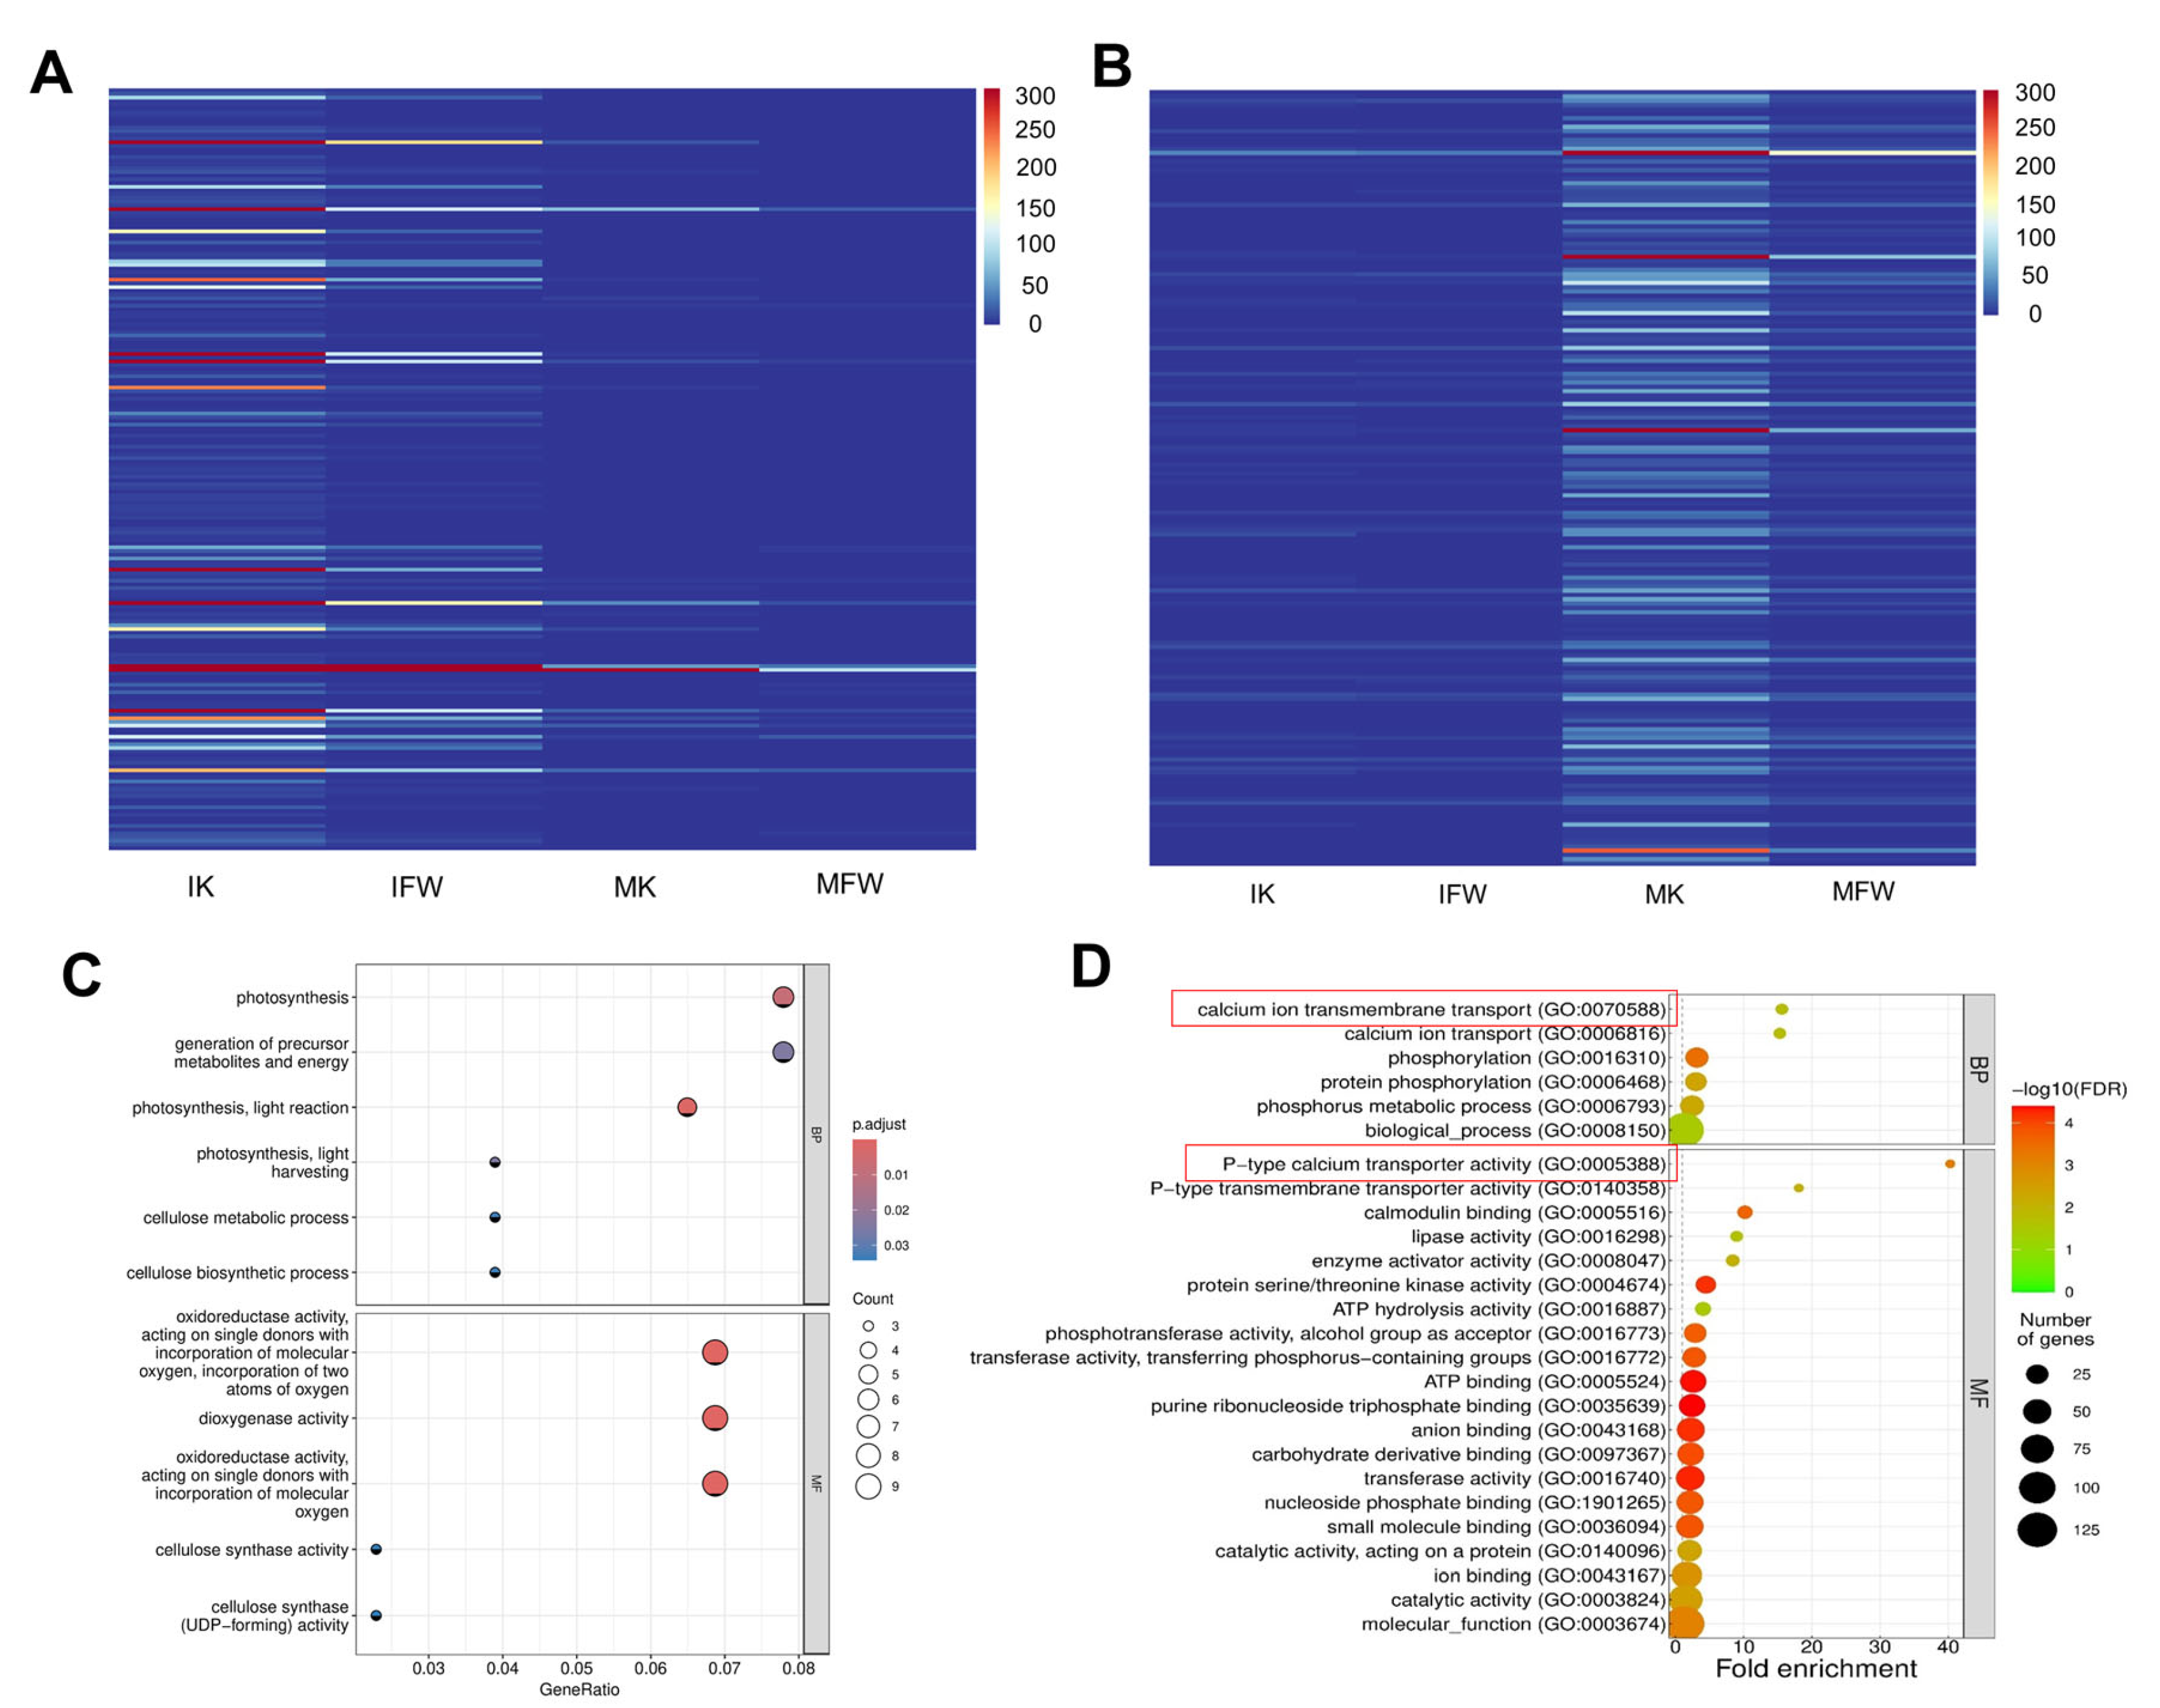
To further identify potential core regulatory factors responsible for the overall co-downregulation of lipid metabolism and cuticle metabolism during keel petal fusion, we conducted an in-depth screening of differentially expressed genes (DEGs) before and after the fusion of keel petals, and integrating gene expression profiling and Gene Ontology (GO) enrichment analysis, we identified 205 preferentially expressed genes in the IK group (pre-fusion stage), and 179 preferentially expressed genes in the MK group (fusion stage), and a heatmap was generated to display the expression levels of these DEGs based on their mean FPKM values for every three replicates (Figure 9A,B). GO enrichment analysis was then performed on these preferentially expressed genes in IK and MK. Interestingly, the 205 DEGs from IK were enriched in signaling pathways in photosynthesis, the generation of metabolites and energy, oxidoreductase activity, and cellulose biosynthesis (Figure 9C, Supplemental Table S8). The 179 DEGs from MK were significantly enriched in pathways related to P-type calcium transporter activity, P-type transmembrane transporter activity, calmodulin binding, and lipase activity (Figure 9D, Supplemental Table S9). These findings suggest that unique regulators may be involved in controlling the lipid metabolism and cuticle biosynthesis pathways.
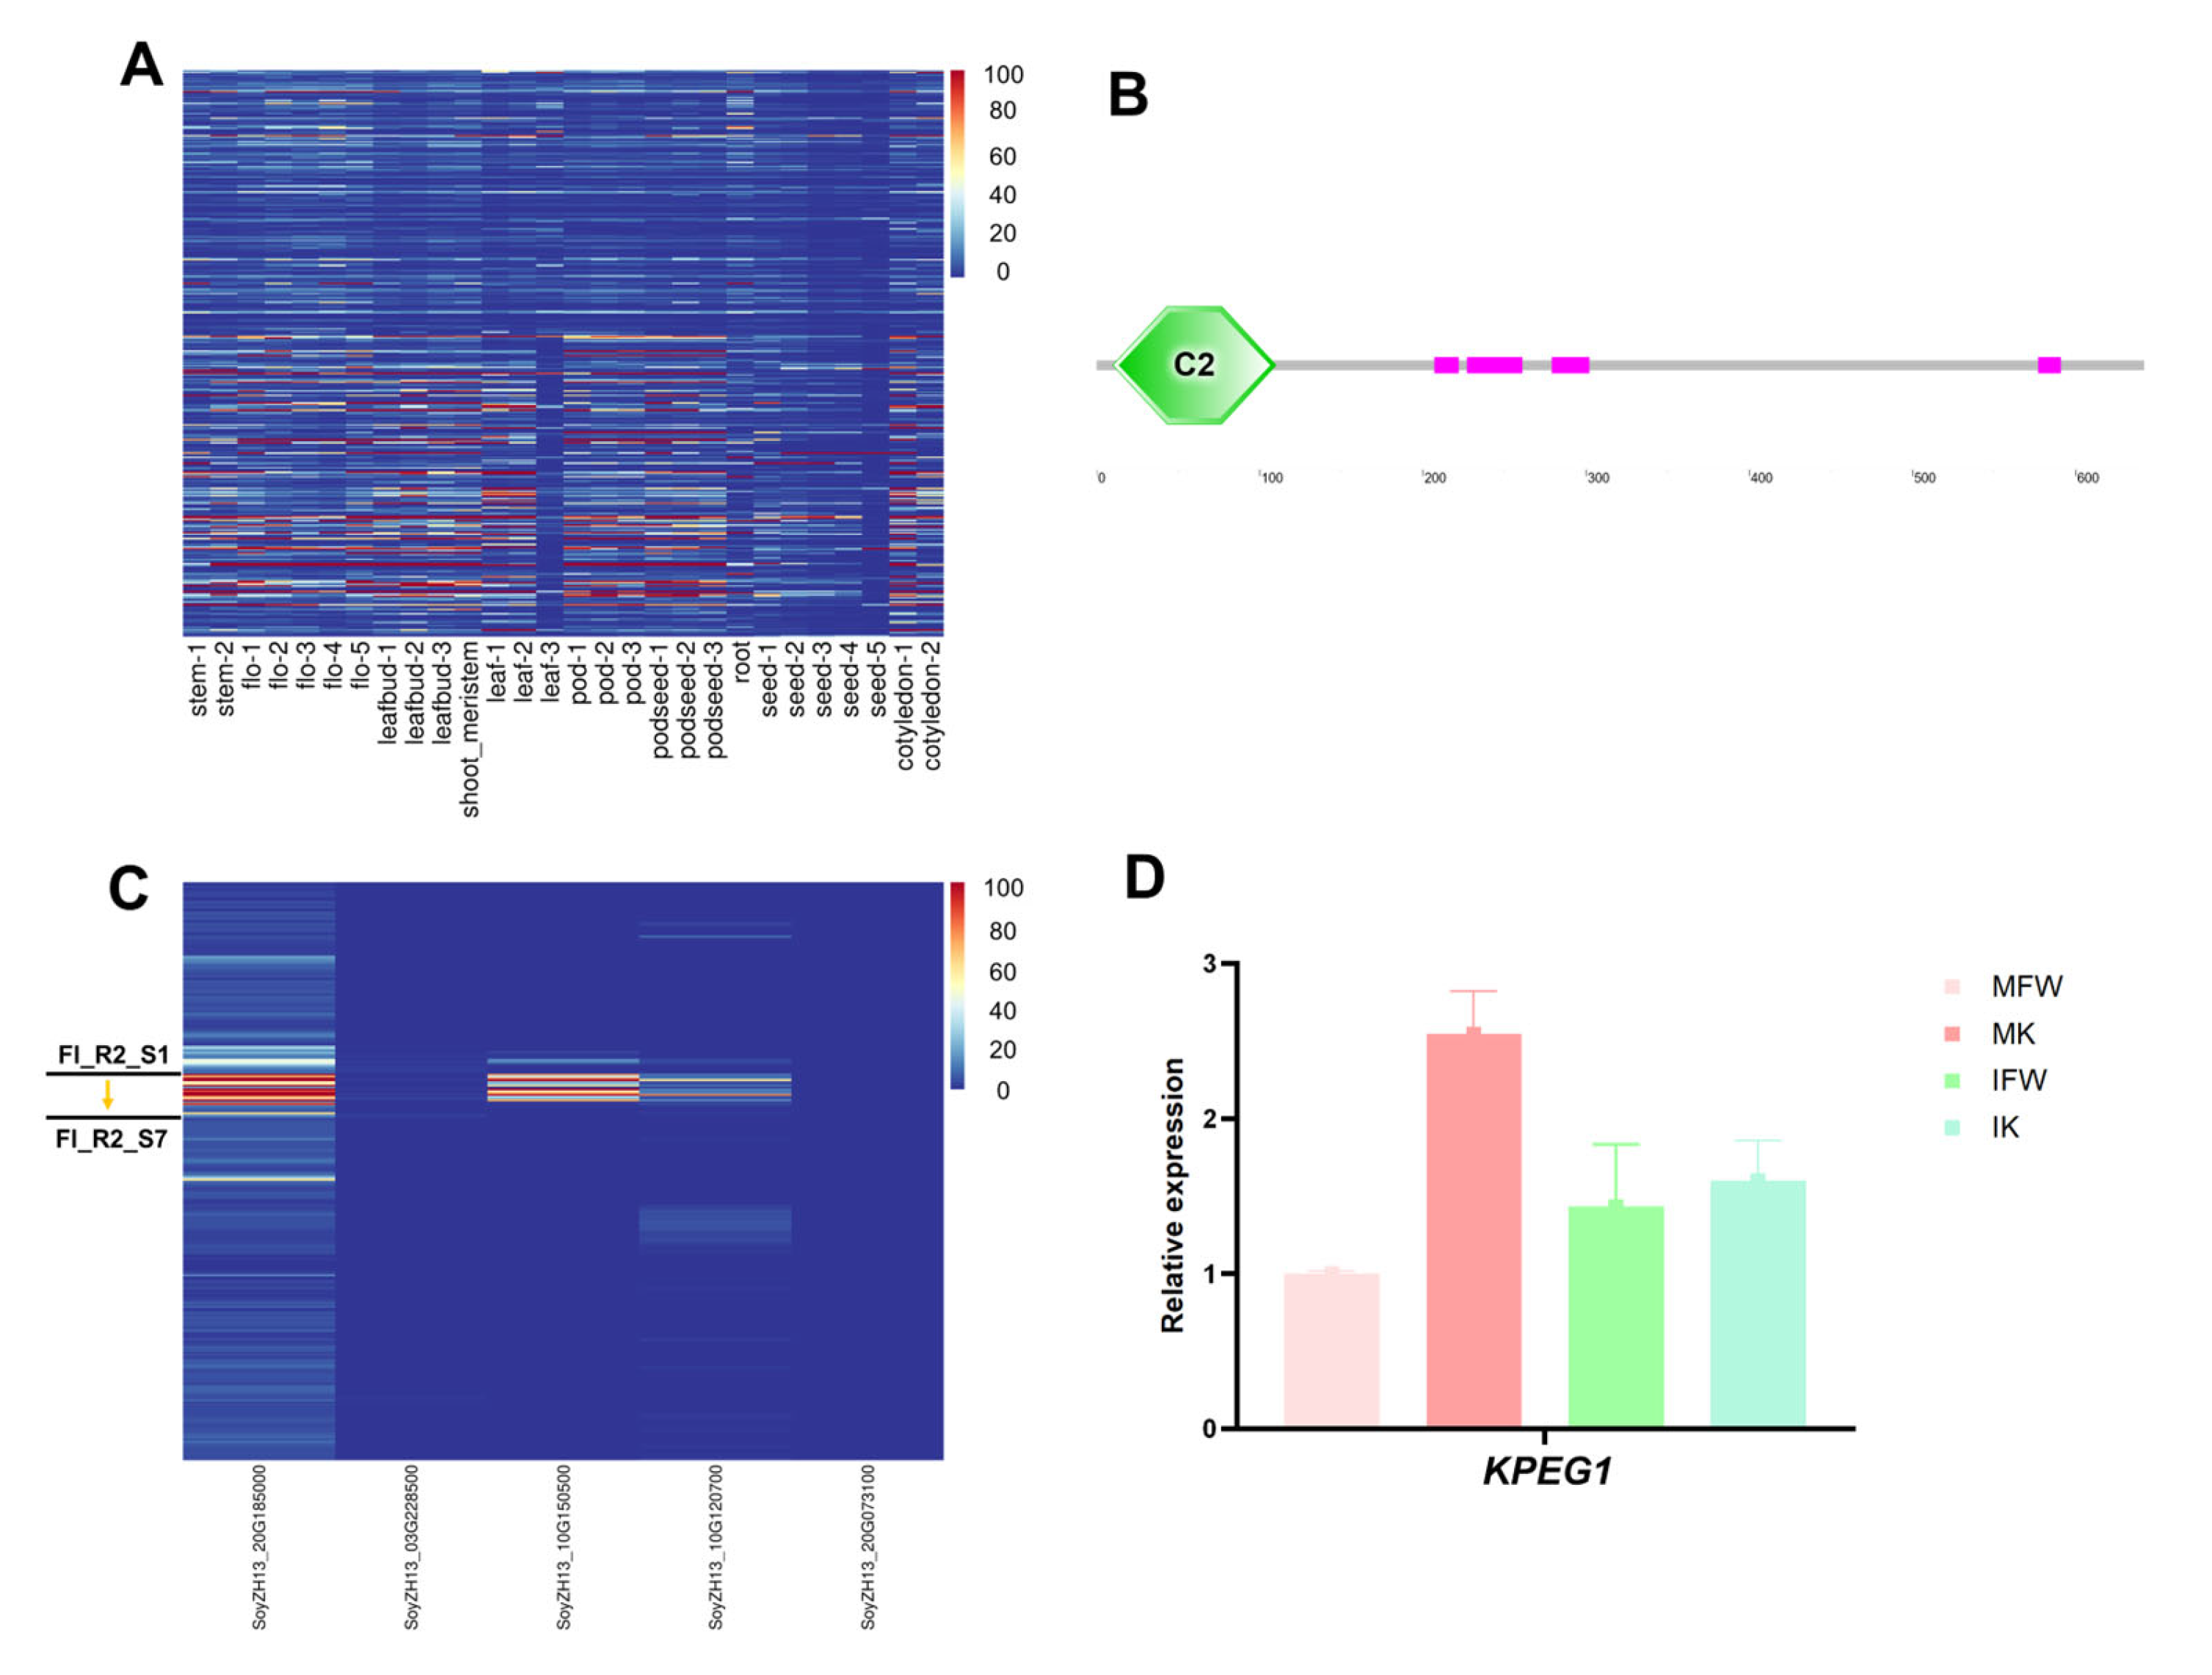
To further identify the genes which are specifically high expression in flowers among these 384 genes, we analyzed publicly available transcriptomic data from 28 tissues (including roots, stems, flowers, and leaves, etc.) of Wm82 obtained from the Soyomics database (Figure 10A). Through a comparative analysis of expression profiles across 28 tissues in the Wm82 cultivar, we identified a promising candidate gene, KPEG1 (keel preferential expression gene 1), which exhibits specific and high expression in floral tissues, particularly during flower developmental stages flo2-flo4.
Further analysis revealed that this gene contains a conserved C2 domain (protein kinase C conserved region 2), belonging to the calcium-dependent lipid-binding (CaLB) family protein (Figure 10B). Additionally, the soybean Wm82 and ZH13 genomes each harbor four homologs of KPEG1 (Table 2). Based on expression profiling across 314 tissues in the ZH13 genome, KPEG1 and its homologs exhibit higher expression in floral organs, with particularly elevated levels in the keel petals compared to the flag and wing petals during the Fl_R2_S2 to Fl_R2_S4 periods (Figure 10C). Furthermore, quantitative real-time PCR (qRT-PCR) analysis of KPEG1 expression during the pre- and post-fusion stages of keel petal development confirmed its preferential expression in keel petals, especially in the post-fusion stage (Figure 10D, Supplemental Figure S5). These results align with existing transcriptomic data, demonstrating significantly higher expression in the MK of KPEG1.
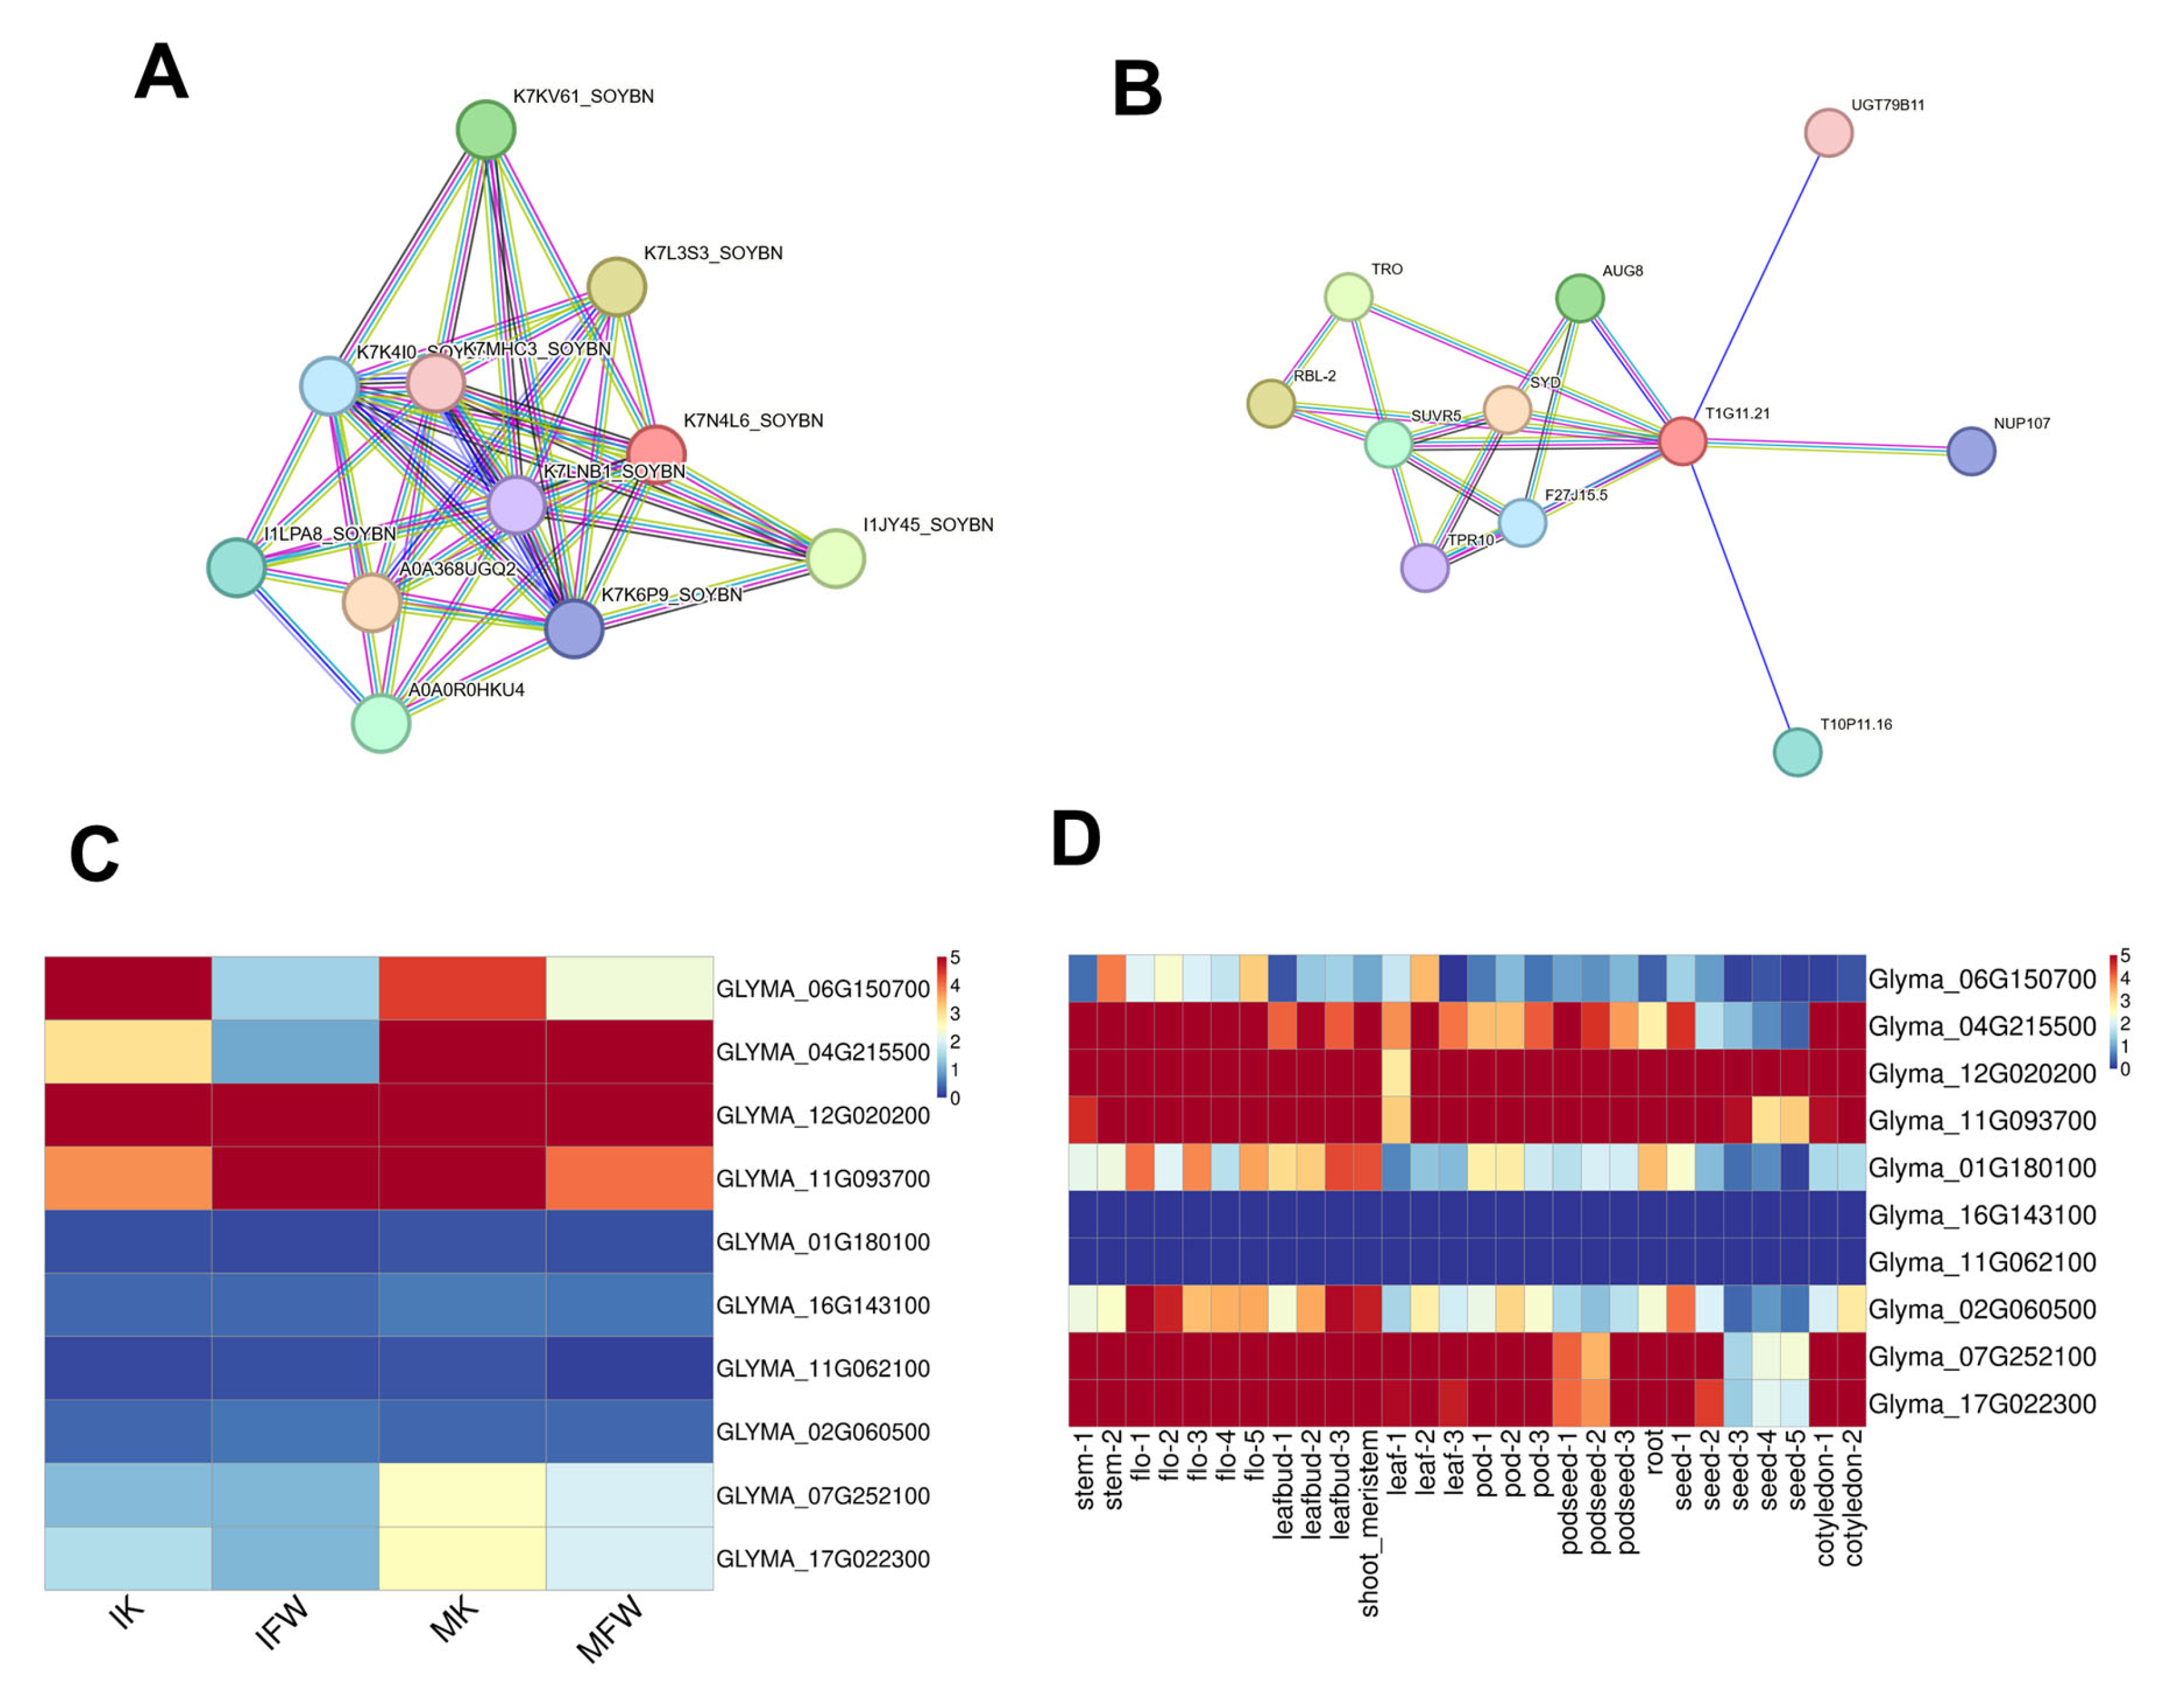
Furthermore, the molecular functions of KPEG1 and its Arabidopsis homologs remain uncharacterized. To explore its potential regulatory pathways, we analyzed the protein–protein interaction (PPI) networks of both KPEG1 and its Arabidopsis ortholog. In the soybean KPEG1 PPI network, the top ten interacting proteins were classified into four families: ATG1T, TRO, SUVR5, and SYD (Table 3, Figure 11A). Notably, these four protein families were also enriched in the Arabidopsis interaction network (Table 3, Figure 11B). To further characterize the expression patterns of these 10 KPEG1-interacting protein factors, our transcriptomic data revealed that all interactors were ubiquitously expressed in both keel petals and combined mixed flag and wing petals. Notably, four soybean homologs of Arabidopsis SUR5 exhibited relatively low expression levels, whereas the remaining six genes showed significantly elevated expression, particularly in post-fusion keel petals (Figure 11C). Consistent with this, expression profiling across 28 tissues in the Wm82 genome demonstrated analogous patterns: eight genes (excluding two Arabidopsis SUVR5 homologs with suppressed expression) displayed preferential high expression in floral organs (Figure 11D), exhibiting distinct co-expression trends with KPEG1.
Previous studies suggest that these proteins may participate in epigenetic regulatory networks, leading us to hypothesize that KPEG1 might be involved in floral organ development through epigenetic regulation. However, the precise molecular mechanisms require further validation using approaches such as gene knockout in the future. In summary, this study employed transcriptome profiling to identify KPEG1 as a potential regulator of keel petal development. These findings not only provide valuable insights and experimental data for future research on floral organ development but may also facilitate future flower morphology modification.

4. Discussion

The connate structure of keel petals in leguminous plants presents an important natural adaptation and also a challenge for crop hybridization. Despite this, there has been limited research on the mechanisms underlying this connation. In this study, we conducted anatomical and transcriptomic analyses of soybean keel petals to investigate the connation process and its potential genetic mechanisms. Our findings indicate that keel petal connation is a discontinuous postgenital fusion, marked by intercellular contacting and adhesion, cuticle elimination, and cell reshaping. Transcriptome analysis further revealed a co-downregulation trend of lipid metabolism and cuticle metabolism during keel petal fusion. Given that cuticle biosynthesis and lipid metabolism inherently constitute an intricate network-regulated process, we hypothesize the existence of a core regulatory factor coordinating these biological processes during keel petal fusion. Through the systematic screening of preferentially expressed genes in keel petals, combined with published tissue-specific expression data from both Wm82 and ZH13 genomes and qRT-PCR experiments, we successfully identified KPEG1 as a candidate gene showing keel petal-biased expression. However, as its functional mechanism remains uncharacterized, future studies employing gene knockout approaches will be required for validation.
Organ fusion or adnation is a highly conserved and widespread phenomenon in plant evolution, where ancestral plant species generally exhibited separated floral organs [16], whereas papilionoid legumes (Faboideae) have evolved distinctive zygomorphic floral symmetry and a postgenital fusion structure of keel petals [5,11]. These traits typically provide crucial biological benefits for preserving species integrity, with the co-evolved specialized pollination mechanisms substantially reinforcing the functional importance of organ differentiation [60]. Nevertheless, whether and how this feature adapts to natural/artificial selection remains undetermined, yet it undoubtedly constitutes a persistent obstacle for contemporary hybrid breeding practices.
The fusion of keel petals in legumes appears to share similarities with other fusion events, such as carpel fusion, which involves the active cellular processes at the fusion zone margins [61]. In the carpel fusion of Catharanthus roseus, only a few epidermal cells come into contact and recognize each other and undergo dedifferentiation and redifferentiation to form vacuolated, isodiametric parenchyma cells. Remnants of a thin cuticle remain during this contact process [61,62]. Studies on nutrient transport and radioactive tracers have shown that essential metabolites can move across the two cell walls and through the permeable cuticle between the fusing carpels, a process typically completed within nine hours, indicating a regulated fusion mechanism rather than a random one [16,62]. Similarly, the fusion of keel petals in soybean displays differentiation dynamics across adjacent margins and involves only a few epidermal cells at the contact sites, which undergo significant shape changes and clearance of cuticles, which is required for organ separation, but whether material exchange occurs requires further in-depth research.
Although multiple active cellular processes are involved during soybean keel petal fusion, the cuticle likely represents one of the most critical factors, given that most cases of abnormal inter-organ fusion are associated with cuticular defects [63]. The hydrophobic cuticle covers the epidermal cells of the aerial parts of plants, plays essential roles throughout a plant’s life, including limiting non-stomatal water loss, protecting against UV radiation, and defending against pests and pathogens. Additionally, the cuticle serves as a barrier to prevent non-spontaneous fusion between plant organs [63,64]. Multiple biological processes are involved in the biosynthesis of the cuticle, specifically, the cutins and cuticular waxes are the primary components of cuticle which are synthesized intracellularly through various enzyme-catalyzed processes. These components are then transported to the extracellular cuticular matrix via multiple pathways, eventually forming cuticular polymers on the surface of epidermal cells. Disruptions in these processes can lead to incomplete cuticle deposition and the abnormal fusion of separated organs [65,66,67], as observed in the mutants of key regulators of cuticular biosynthesis, such as adherent1 (AD1), fiddlehead (FDH), and cutin deficient 1 (CD1) [68,69,70,71].
Moreover, soybean keel petals exhibit distinct morphological characteristics compared to flag and wing petals, with postgenital fusion occurring exclusively in keel petals. This suggests potential differences in cuticular metabolism associated with the postgenital fusion traits of keel petals. Previous qualitative and quantitative analyses of cuticular waxes on the floral organs of faba bean (Vicia faba L.) also revealed that keel petals exhibit distinct cuticular composition compared to flag and wing petals. The keel petals have higher wax coverage compared to wing and flag petals, with alkanes, particularly odd-numbered chains such as C27, C29, and C31, being predominant [72]. Although the cuticular wax composition in flag and wing petals is similar to that of keel petals, alkyl esters and cinnamyl alcohol esters are present in flag and wing petals, while primary alcohols, indicative of the alcohol-forming pathway, are unique to keel petals [65,72]. Meanwhile, we identified differential expression of regulators related to cuticular biosynthesis in keel petals between pre-fusion and post-fusion stages in our transcriptome profiling, suggesting the possible involvement of cuticle metabolism in keel fusion.
Transcriptome comparisons between unfused and fused keel petals and mixed wing/flag petals at the same developmental stages revealed DEGs involved in aliphatic metabolism pathways. In keel petals at both early and late stages, DEGs were enriched in pathways related to pyruvate metabolism and fatty acid metabolism, which are crucial for lipid synthesis and the biosynthesis of its derivatives, particularly very-long-chain fatty acids (VLCFAs). VLCFAs serve as precursors for cuticular waxes and cutins [65]. These differences in aliphatic compounds and metabolites among the different petals suggest developmental heterogeneity, potentially contributing to the distinct developmental trajectories of keel petals compared to other petal types.
Through a further analysis of gene expression related to lipid metabolism and cuticular metabolic pathways, we observed a general downregulation trend of these genes during keel petal fusion in both keel petals and mixed flag/wing petal samples. Although certain genes exhibited upregulation—such as MYB94, a positive regulator of cutin biosynthesis—their expression patterns differed significantly between keel petals and mixed flag/wing petals, likely reflecting distinct developmental behaviors. Notably, cuticular and lipid metabolism constitute an intricate regulatory network where biosynthesis is not determined by isolated gene expression changes, such as the Beta-Keto-acyl-CoA Synthase (KCS) family members, which participate in the synthesis of VLCFAs [73]. The predominant downregulation of these metabolic pathway genes suggests the involvement of an upstream master regulator, potentially linked to the postgenital fusion process in keel petals.
To identify such regulators, we analyzed keel-preferentially expressed genes and integrated publicly available soybean transcriptomic data. This approach identified KPEG1, a functionally uncharacterized gene highly expressed in floral organs, particularly in keel petals. KPEG1 contains a conserved C2 domain and belongs to the calcium-dependent lipid-binding (CaLB) family member. Previous studies have shown that CaLB family proteins are involved in multiple regulatory pathways. In Arabidopsis thaliana, the nuclear-localized DNA-binding protein AtCLB functions as a negative transcriptional regulator of thalianol synthase (THAS1), which is a gravity- and light-responsive gene. Mutations of Atclb confer enhanced tolerance to both drought and salt stress conditions in plants [74]. Additionally, the identified annexins (OsANN10) in rice function as a negative regulator of osmotic stress responses [75], while in cotton, GhCaLB42 and GhCaLB123 regulate fiber development and cellulose biosynthesis processes, respectively [76]. Moreover, calcium ions (Ca2+), as intracellular second messengers, participate in multiple processes such as signal transduction and vesicle trafficking [77]. Meanwhile, the C2 domain represents the second most prevalent Ca2+-regulatory domain, and protein family members containing this domain play essential roles in plant development [78]. However, their functional studies in plants remain largely unexplored—as exemplified by KPEG1, one of the CaLB family members, its precise molecular mechanism remains unclear.
In the protein–protein interaction (PPI) network of KPEG1, we identified enrichment of four Arabidopsis homologous gene families, including Autophagy-Related1 (ATG1T), SPLAYED (SYD), SU(VAR)3-9 RELATED 5 (SUVR5), and TRAUCO (TRO). Among these, the ATG1T, a member of the ATG1 protein kinase family involved in autophagy, represents a unique variant distinct from conventional ATG1a/b/c isoforms in existing studies and which solely contains a kinase domain and is exclusively present in seed plants, likely resulting from an inadvertent transposition event during plant evolution; however, its precise functional mechanisms remain to be elucidated [79]. The SYD, a SWItch/Sucrose Non-Fermentable (SWI/SNF)-type chromatin remodeling enzyme, utilizes ATP hydrolysis-derived energy to modulate DNA–histone interactions. In Arabidopsis, SYD functions as a repressor of floral morphological transition, likely regulating floral organ formation by controlling LEAFY (LFY) transcription factor expression in response to both external and internal signals. Furthermore, this gene directly anchors to the WUSCHEL (WUS) promoter region to regulate WUS transcription factor expression, thereby participating in stem cell maintenance [80,81,82].
The SUVR5, a SET domain-containing member of the Su(var)3-9 homolog gene family, regulates gene expression through an H3K9me2-independent deposition mechanism. By anchoring to DNA via its zinc finger domain, which can establish heterochromatic states to repress specific gene sets, enabling plants to rapidly respond to environmental stimuli and developmental demands. In Arabidopsis, SUVR5 mutations frequently cause delayed flowering time and upregulation of metabolic pathway genes, including auxin-related genes [83]. The TRAUCO/ARABIDOPSIS Ash2 RELATIVE (TRO/ASH2R) is a core component of the histone H3 lysine-4 (H3K4) methyltransferase complex. It participates in transcriptional activation through H3K4 trimethylation of genes, such as the flowering repressor gene FLOWERING LOCUS C (FLC), thereby playing crucial roles in various developmental processes, including embryogenesis, seed development, leaf growth, and floral organ transition [84]. Therefore, we speculate that KPEG1 may be involved in potential epigenetic regulatory pathways that participate in the development of keel petals and other floral organs and may also regulate the postgenital fusion development process of the keel petal by directly or indirectly modulating lipid metabolism and cuticular metabolism. However, the precise molecular mechanisms underlying its function still require further validation through approaches such as gene knockout.

5. Conclusions

In this study, we identified two distinct marginal cell structures (pointed and blunt ends) in keel petals exhibiting postgenital fusion characteristics, accompanied by localized cell deformation and cuticular defects. The cuticle, as one of the hallmark features of organ fusion, may represent the most critical factor driving keel petal connation. A transcriptomic analysis of mixed flag/wing and keel petals at pre- and post-fusion stages revealed the coordinated downregulation of genes associated with lipid metabolism and cuticular pathways, suggesting the potential involvement of a central regulator orchestrating this complex network. Among the keel-preferentially expressed genes, we identified KPEG1, a CaLB family member containing a C2 domain, which showed predominant expression in floral organs—particularly in keel petals, with approximately two-fold higher expression than in wing/flag petals (qRT-PCR verified). Although the molecular functions of KPEG1 and its Arabidopsis homologs remain uncharacterized, protein–protein interaction network analysis revealed a significant enrichment of epigenetic regulators, implying KPEG1’s potential role in floral organ development via epigenetic pathways. However, the precise molecular mechanisms of KPEG1 require further validation through gene knockout approaches. Collectively, this study elucidates active cellular processes during keel petal postgenital fusion and provides foundational data for reverse genetics studies on floral organ development, paving the way for agriculturally beneficial floral modifications.

Supplementary Materials

The following supporting information can be downloaded at: https://www.mdpi.com/article/10.3390/agronomy15081971/s1, Figure S1: Six developmental nodes in soybean; Figure S2: KEGG pathway enrichment analysis of the DEGs; Figure S3: Differential expression analysis of genes involved in lipid metabolism; Figure S4: The expression heatmap of the 42 DEGs related the cuticle biosynthesis; Figure S5: 2% agarose gel electrophoresis image of qRT-PCR products; Table S1: IK vs. IFW_KEGG enrich; Table S2: MK vs. MFW_KEGG enrich; Table S3: IK vs. MK_KEGG enrich; Table S4: IFW vs. MFW_KEGG enrich; Table S5: Venn_IK vs. MK & IFW vs. MFW lipid metabolism DEGs; Table S6: Distribution of the cuticle biosynthesis related-42 DEGs across four comparison groups; Table S7: Relative expression of the cuticle biosynthesis related-42 DEGs in IK and MK groups; Table S8: IK_UP_DEG_GO enrich; Table S9: MK_UP_DEG_GO enrich.

Author Contributions

H.-J.L. and W.-C.Y. supervised the project, experimental design, and manuscript editing; D.C. did the transcriptome sampling and UMAP analysis; L.-N.G. was responsible for generating Figure 3A–I; X.-F.W. contributed to the preparation of Figure 9D; S.-G.J. did the morphology analysis, transcriptome analysis, and manuscript writing; S.-G.J. and D.-L.W. were involved in material cultivation and sample collection. All authors have read and agreed to the published version of the manuscript.

Funding

This work was supported by the National Key Research and Development Program of China (2022YFF1003500), National Natural Science Foundation of China (32425009, 31991203, and 32130032), CAS Project for Young Scientists in Basic Research (No. YSBR-078).

Data Availability Statement

The following information was supplied regarding data availability. The transcriptome raw data generated in this study are available in the National Center for Biotechnology Information (NCBI): PRJNA1171388. https://dataview.ncbi.nlm.nih.gov/object/PRJNA1171388?reviewer=fj2sns300o3cgstjm7jhrql6q4 (accessed on 11 June 2025). The data presented in this study are available on request from the corresponding author due to ongoing related studies.

Conflicts of Interest

The authors declare that they have no conflicts of interest.

Abbreviations

BKblunt keel petal
Fflag petal
IKimmature/unfused keel petal
IFWimmature/unfused mixed samples of flag and wing petals (keel petal stage)
Kkeel petal
MKmature/fused keel petal
MFWmature/fused mixed samples of flag and wing petals (keel petal stage)
PKpointed keel petal
Wwing petal

References

  1. Zhao, Y.Y.; Zhang, R.; Jiang, K.W.; Qi, J.; Hu, Y.; Guo, J.; Zhu, R.B.; Zhang, T.K.; Egan, A.N.; Yi, T.S.; et al. Nuclear phylotranscriptomics and phylogenomics support numerous polyploidization events and hypotheses for the evolution of rhizobial nitrogen-fixing symbiosis in Fabaceae. Mol. Plant 2021, 14, 748–773. [Google Scholar] [CrossRef]
  2. Azani, N.; Babineau, M.; Bailey, C.D.; Banks, H.; Barbosa, A.; Barbosa Pinto, R.; Boatwright, J.; Borges, L.; Brown, G.; Bruneau, A.; et al. A new subfamily classification of the Leguminosae based on a taxonomically comprehensive phylogeny. Taxon 2017, 66, 44–77. [Google Scholar] [CrossRef]
  3. Yahara, T.; Javadi, F.; Onoda, Y.; de Queiroz, L.P.; Faith, D.P.; Prado, D.E.; Akasaka, M.; Kadoya, T.; Ishihama, F.; Davies, S.; et al. Global legume diversity assessment: Concepts, key indicators, and strategies. Taxon 2013, 62, 249–266. [Google Scholar] [CrossRef]
  4. Lewis, G.; Schrire, B.; Mackinder, B.; Lock, M. Legumes of the World; Royal Botanic Gardens Kew: London, UK, 2005; pp. 1–577. [Google Scholar]
  5. Tucker, S.C. Floral development in legumes. Plant Physiol. 2003, 131, 911–926. [Google Scholar] [CrossRef] [PubMed]
  6. Saitoh, K.; Wakui, N.; Mahmood, T.; Kuroda, T. Differentiation and development of floral organs at each node and raceme order in an indeterminate type of soybean. Plant Prod. Sci. 1999, 2, 47–50. [Google Scholar] [CrossRef]
  7. Washburn, C.F.; Thomas, J.F. Reversion of flowering in Glycine Max (Fabaceae). Am. J. Bot. 2000, 87, 1425–1438. [Google Scholar] [CrossRef]
  8. Tilton, V.R.; Wilcox, L.W.; Palmer, R.G.; Albertsen, M.C. Stigma, style, and obturator of soybean, Glycine Max (L.) Merr. (Leguminosae) and their function in the reproductive process. Am. J. Bot. 1984, 71, 676–686. [Google Scholar] [CrossRef]
  9. Srinivasan, S.; Gaur, P.M. Genetics and characterization of an open flower mutant in chickpea. J. Hered. 2012, 103, 297–302. [Google Scholar] [CrossRef]
  10. Feng, X.; Zhao, Z.; Tian, Z.; Xu, S.; Luo, Y.; Cai, Z.; Wang, Y.; Yang, J.; Wang, Z.; Weng, L.; et al. Control of petal shape and floral zygomorphy in Lotus japonicus. Proc. Natl. Acad. Sci. USA 2006, 103, 4970–4975. [Google Scholar] [CrossRef]
  11. Sauquet, H.; von Balthazar, M.; Magallón, S.; Doyle, J.A.; Endress, P.K.; Bailes, E.J.; Barroso de Morais, E.; Bull-Hereñu, K.; Carrive, L.; Chartier, M.; et al. The ancestral flower of angiosperms and its early diversification. Nat. Commun. 2017, 8, 16047. [Google Scholar] [CrossRef]
  12. Endress, P.K. Evolutionary diversification of the flowers in angiosperms. Am. J. Bot. 2011, 98, 370–396. [Google Scholar] [CrossRef]
  13. Bell, E.M.; Lin, W.C.; Husbands, A.Y.; Yu, L.F.; Jaganatha, V.; Jablonska, B.; Mangeon, A.; Neff, M.M.; Girke, T.; Springer, P.S. Arabidopsis lateral organ boundaries negatively regulates brassinosteroid accumulation to limit growth in organ boundaries. Proc. Natl. Acad. Sci. USA 2012, 109, 21146–21151. [Google Scholar] [CrossRef] [PubMed]
  14. Siegel, B.A.; Verbeke, J.A. Diffusible factors essential for epidermal cell redifferentiaion in Catharanthus roseus. Science 1989, 244, 580–582. [Google Scholar] [CrossRef] [PubMed]
  15. Phillips, H.R.; Landis, J.B.; Specht, C.D. Revisiting floral fusion: The evolution and molecular basis of a developmental innovation. J. Exp. Bot. 2020, 71, 3390–3404. [Google Scholar] [CrossRef]
  16. Verbeke, J.A. Fusion events during floral morphogenesis. Annu. Rev. Plant Physiol. Plant Mol. Biol 1992, 43, 583–598. [Google Scholar] [CrossRef]
  17. Li, F.; Shao, Y.P.; Ejaz, I.; Chen, Z.Y.; Wang, Z.W.; Wang, X.; Zhou, S.L. A morphological and anatomical study for tracking the growth and development of individual flowers and pods in soybean (Glycine max L.). Crop J. 2025, 13, 304–309. [Google Scholar] [CrossRef]
  18. Saitta, V.; Rebora, M.; Piersanti, S.; Gorb, E.; Gorb, S.; Salerno, G. Effect of leaf trichomes in different species of cucurbitaceae on attachment ability of the melon ladybird beetle Chnootriba elaterii. Insects 2022, 13, 1123. [Google Scholar] [CrossRef]
  19. Nogales, E.; Mahamid, J. Bridging structural and cell biology with cryo-electron microscopy. Nature 2024, 628, 47–56. [Google Scholar] [CrossRef]
  20. Schaffer, M.; Pfeffer, S.; Mahamid, J.; Kleindiek, S.; Laugks, T.; Albert, S.; Engel, B.D.; Rummel, A.; Smith, A.J.; Baumeister, W.; et al. A cryo-FIB lift-out technique enables molecular-resolution cryo-ET within native Caenorhabditis elegans tissue. Nat. Methods 2019, 16, 757–762. [Google Scholar] [CrossRef]
  21. Zhang, B.; Wang, M.D.; Sun, Y.F.; Zhao, P.; Liu, C.; Qing, K.; Hu, X.T.; Zhong, Z.D.; Cheng, J.L.; Wang, H.J.; et al. Glycine max NNL1 restricts symbiotic compatibility with widely distributed bradyrhizobia via root hair infection. Nat. Plants 2021, 7, 73–86. [Google Scholar] [CrossRef]
  22. Lee, D.; Geisler, M.; Springer, P.S. LATERAL ORGAN FUSION1 and LATERAL ORGAN FUSION2 function in lateral organ separation and axillary meristem formation in Arabidopsis. Development 2009, 136, 2423–2432. [Google Scholar] [CrossRef]
  23. Wang, J.; Wang, X.F.; Yang, W.C.; Li, H.J. Loss of function of CENH3 causes genome instability in soybean. Seed Biol. 2023, 2, 24. [Google Scholar] [CrossRef]
  24. Parkhomchuk, D.; Borodina, T.; Amstislavskiy, V.; Banaru, M.; Hallen, L.; Krobitsch, S.; Lehrach, H.; Soldatov, A. Transcriptome analysis by strand-specific sequencing of complementary DNA. Nucleic Acids Res. 2009, 37, e123. [Google Scholar] [CrossRef] [PubMed]
  25. Chen, S.; Zhou, Y.; Chen, Y.; Gu, J. fastp: An ultra-fast all-in-one FASTQ preprocessor. Bioinformatics 2018, 34, i884–i890. [Google Scholar] [CrossRef]
  26. Pertea, M.; Pertea, G.M.; Antonescu, C.M.; Chang, T.C.; Mendell, J.T.; Salzberg, S.L. StringTie enables improved reconstruction of a transcriptome from RNA-seq reads. Nat. Biotechnol. 2015, 33, 290–295. [Google Scholar] [CrossRef]
  27. Liao, Y.; Smyth, G.K.; Shi, W. Feature counts: An efficient general purpose program for assigning sequence reads to genomic features. Bioinformatics 2014, 30, 923–930. [Google Scholar] [CrossRef]
  28. Trapnell, C.; Williams, B.A.; Pertea, G.; Mortazavi, A.; Kwan, G.; van Baren, M.J.; Salzberg, S.L.; Wold, B.J.; Pachter, L. Transcript assembly and quantification by RNA-Seq reveals unannotated transcripts and isoform switching during cell differentiation. Nat. Biotechnol. 2010, 28, 511–515. [Google Scholar] [CrossRef]
  29. Love, M.I.; Huber, W.; Anders, S. Moderated estimation of fold change and dispersion for RNA-seq data with DESeq2. Genome Biol. 2014, 15, 550. [Google Scholar] [CrossRef]
  30. Anders, S.; Pyl, P.T.; Huber, W. HTSeq—A Python framework to work with high-throughput sequencing data. Bioinformatics 2015, 31, 166–169. [Google Scholar] [CrossRef]
  31. Kanehisa, M.; Goto, S. KEGG: Kyoto Encyclopedia of Genes and Genomes. Nucleic Acids Res. 2000, 28, 27–30. [Google Scholar] [CrossRef]
  32. Kanehisa, M. Toward understanding the origin and evolution of cellular organisms. Protein Sci. 2019, 28, 1947–1951. [Google Scholar] [CrossRef]
  33. Kanehisa, M.; Furumichi, M.; Sato, Y.; Matsuura, Y.; Ishiguro-Watanabe, M. KEGG: Biological systems database as a model of the real world. Nucleic Acids Res. 2024, 53, D672–D677. [Google Scholar] [CrossRef]
  34. Bardou, P.; Mariette, J.; Escudié, F.; Djemiel, C.; Klopp, C. Jvenn: An interactive Venn diagram viewer. BMC Bioinf. 2014, 15, 293. [Google Scholar] [CrossRef]
  35. He, Z.L.; Zhang, H.K.; Gao, S.H.; Lercher, M.J.; Chen, W.H.; Hu, S.N. Evolview v2: An online visualization and management tool for customized and annotated phylogenetic trees. Nucleic Acids Res. 2016, 44, W236–W241. [Google Scholar] [CrossRef]
  36. Nunes, A.C.; Vianna, G.R.; Cuneo, F.; Amaya-Farfán, J.; de Capdeville, G.; Rech, E.L.; Aragão, F.J. RNAi-mediated silencing of the myo-inositol-1-phosphate synthase gene (GmMIPS1) in transgenic soybean inhibited seed development and reduced phytate content. Planta 2006, 224, 125–132. [Google Scholar] [CrossRef] [PubMed]
  37. Dang, X.; Yu, P.H.; Li, Y.J.; Yang, Y.Q.; Zhang, Y.; Ren, H.B.; Chen, B.; Lin, D.S. Reactive oxygen species mediate conical cell shaping in Arabidopsis thaliana petals. PLoS Genet. 2018, 14, e1007705. [Google Scholar] [CrossRef] [PubMed]
  38. Kozuka, T.; Kong, S.G.; Doi, M.; Shimazaki, K.; Nagatani, A. Tissue-autonomous promotion of palisade cell development by phototropin 2 in Arabidopsis. Plant Cell 2011, 23, 3684–3695. [Google Scholar] [CrossRef]
  39. Becht, E.; McInnes, L.; Healy, J.; Dutertre, C.A.; Kwok, I.W.H.; Ng, L.G.; Ginhoux, F.; Newell, E.W. Dimensionality reduction for visualizing single-cell data using UMAP. Nat. Biotechnol. 2019, 37, 38–44. [Google Scholar] [CrossRef] [PubMed]
  40. Yu, Y.M.; Zhang, H.; Long, Y.P.; Shu, Y.; Zhai, J.X. Plant Public RNA-seq Database: A comprehensive online database for expression analysis of ~45,000 plant public RNA-Seq libraries. Plant Biotechnol. J. 2022, 20, 806–808. [Google Scholar] [CrossRef]
  41. Li-Beisson, Y.; Neunzig, J.; Lee, Y.; Philippar, K. Plant membrane-protein mediated intracellular traffic of fatty acids and acyl lipids. Curr. Opin. Plant Biol. 2017, 40, 138–146. [Google Scholar] [CrossRef]
  42. Zhu, L.; He, S.Y.; Liu, Y.Y.; Shi, J.X.; Xu, J. Arabidopsis FAX1 mediated fatty acid export is required for the transcriptional regulation of anther development and pollen wall formation. Plant Mol. Biol. 2020, 104, 187–201. [Google Scholar] [CrossRef] [PubMed]
  43. Bugaeva, W.; Könnel, A.; Peter, J.; Mees, J.; Hankofer, V.; Schick, C.; Schmidt, A.; Banguela-Castillo, A.; Philippar, K.; Philippar, K. Plastid fatty acid export (FAX) proteins in Arabidopsis thaliana-the role of FAX1 and FAX3 in growth and development. bioRxiv 2023. [Google Scholar] [CrossRef]
  44. Lü, S.Y.; Song, T.; Kosma, D.K.; Parsons, E.P.; Rowland, O.; Jenks, M.A. Arabidopsis CER8 encodes long-chain acyl-coa synthetase 1 (LACS1) that has overlapping functions with LACS2 in plant wax and cutin synthesis. Plant J. 2009, 59, 553–564. [Google Scholar] [CrossRef] [PubMed]
  45. Fiebig, A.; Mayfield, J.A.; Miley, N.L.; Chau, S.; Fischer, R.L.; Preuss, D. Alterations in CER6, a gene identical to CUT1, differentially affect long-chain lipid content on the surface of pollen and stems. Plant Cell 2000, 12, 2001–2008. [Google Scholar] [CrossRef]
  46. Beaudoin, F.; Wu, X.Z.; Li, F.L.; Haslam, R.P.; Markham, J.E.; Zheng, H.Q.; Napier, J.A.; Kunst, L. Functional characterization of the Arabidopsis beta-ketoacyl-coenzyme A reductase candidates of the fatty acid elongase. Plant Physiol. 2009, 150, 1174–1191. [Google Scholar] [CrossRef]
  47. Bach, L.; Michaelson, L.V.; Haslam, R.; Bellec, Y.; Gissot, L.; Marion, J.; Da Costa, M.; Boutin, J.; Miquel, M.; Tellier, F.; et al. The very-long-chain hydroxy fatty acyl-CoA dehydratase pasticcino2 is essential and limiting for plant development. Proc. Natl. Acad. Sci. USA 2008, 105, 14727–14731. [Google Scholar] [CrossRef]
  48. Zheng, H.Q.; Rowland, O.; Kunst, L. Disruptions of the Arabidopsis enoyl-CoA reductase gene reveal an essential role for very-long-chain fatty acid synthesis in cell expansion during plant morphogenesis. Plant Cell 2005, 17, 1467–1481. [Google Scholar] [CrossRef]
  49. Takeda, S.; Iwasaki, A.; Matsumoto, N.; Uemura, T.; Tatematsu, K.; Okada, K. Physical interaction of floral organs controls petal morphogenesis in Arabidopsis. Plant Physiol. 2013, 161, 1242–1250. [Google Scholar] [CrossRef]
  50. Li, Y.H.; Beisson, F.; Koo, A.J.K.; Molina, I.; Pollard, M.; Ohlrogge, J. Identification of acyltransferases required for cutin biosynthesis and production of cutin with suberin-like monomers. Proc. Natl. Acad. Sci. USA 2007, 104, 18339–18344. [Google Scholar] [CrossRef]
  51. Panikashvili, D.; Shi, J.X.; Schreiber, L.; Aharoni, A. The Arabidopsis DCR encoding a soluble BAHD acyltransferase is required for cutin polyester formation and seed hydration properties. Plant Physiol. 2009, 151, 1773–1789. [Google Scholar] [CrossRef]
  52. Lee, E.J.; Kim, K.Y.; Zhang, J.; Yamaoka, Y.; Gao, P.; Kim, H.; Hwang, J.; Suh, M.C.; Kang, B.; Lee, Y. Arabidopsis seedling establishment under waterlogging requires ABCG5-mediated formation of a dense cuticle layer. New Phytol. 2021, 229, 156–172. [Google Scholar] [CrossRef]
  53. Kim, H.; Lee, S.B.; Kim, H.J.; Min, M.K.; Hwang, I.; Suh, M.C. Characterization of glycosylphosphatidylinositol-anchored lipid transfer protein 2 (LTPG2) and overlapping function between LTPG/LTPG1 and LTPG2 in cuticular wax export or accumulation in Arabidopsis thaliana. Plant Cell Physiol. 2012, 53, 1391–1403. [Google Scholar] [CrossRef]
  54. Hong, L.L.; Brown, J.; Segerson, N.A.; Rose, J.K.C.; Roeder, A.H.K. Cutin Synthase 2 maintains progressively developing cuticular ridges in Arabidopsis sepals. Mol. Plant. 2017, 10, 560–574. [Google Scholar] [CrossRef] [PubMed]
  55. Kannangara, R.; Branigan, C.; Liu, Y.; Penfield, T.; Rao, V.; Mouille, G.; Höfte, H.; Pauly, M.; Riechmann, J.L.; Broun, P. The transcription factor WIN1/SHN1 regulates cutin biosynthesis in Arabidopsis thaliana. Plant Cell 2007, 19, 1278–1294. [Google Scholar] [CrossRef] [PubMed]
  56. Lee, S.B.; Kim, H.U.; Suh, M.C. MYB94 and MYB96 additively activate cuticular wax biosynthesis in Arabidopsis. Plant Cell Physiol. 2016, 57, 2300–2311. [Google Scholar] [CrossRef] [PubMed]
  57. Huang, H.D.; Yang, X.P.; Zheng, M.L.; Lü, S.Y.; Zhao, H.Y. Fine-tuning the activities of β-ketoacyl-CoA synthase 3 (KCS3) and KCS12 in Arabidopsis is essential for maintaining cuticle integrity. J. Exp. Bot. 2023, 74, 6575–6587. [Google Scholar] [CrossRef]
  58. Lü, S.Y.; Zhao, H.Y.; Des Marais, D.L.; Parsons, E.P.; Wen, X.X.; Xu, X.J.; Bangarusamy, D.K.; Wang, G.C.; Rowland, O.; Juenger, T.; et al. Arabidopsis eceriferum9 involvement in cuticle formation and maintenance of plant water status. Plant Physiol. 2012, 159, 930–944. [Google Scholar] [CrossRef]
  59. Wu, R.H.; Li, S.B.; He, S.; Waßmann, F.; Yu, C.H.; Qin, G.J.; Schreiber, L.; Qu, L.J.; Gu, H.Y. CFL1, a WW domain protein, regulates cuticle development by modulating the function of HDG1, a class IV homeodomain transcription factor, in rice and Arabidopsis. Plant Cell 2011, 23, 3392–3411. [Google Scholar] [CrossRef]
  60. Huang, L.C.; Jin, L.; Li, J.; Zhang, X.; Yang, Y.; Wang, X. Floral morphology and its relationship with pollination systems in Papilionoideae. Acta Ecol. Sin. 2014, 34, 5360–5368. [Google Scholar] [CrossRef]
  61. Walker, D.B. Postgenital carpel fusion in Catharanthus roseus (Apocynaceae). I. light and scanning electron microscopic study of gynoecial ontogeny. Am. J. Bot. 1975, 62, 457–467. [Google Scholar] [CrossRef]
  62. Verbeke, J.A.; Walker, D.B. Morphogenetic factors controlling differentiation and dedifferentiation of epidermal cells in the gynoecium of Catharanthus roseus. Planta 1986, 168, 43–49. [Google Scholar] [CrossRef] [PubMed]
  63. Ingram, G.; Nawrath, C. The roles of the cuticle in plant development: Organ adhesions and beyond. J. Exp. Bot. 2017, 68, 5307–5321. [Google Scholar] [CrossRef] [PubMed]
  64. Yeats, T.H.; Rose, J.K.C. The formation and function of plant cuticles. Plant Physiol. 2013, 163, 5–20. [Google Scholar] [CrossRef] [PubMed]
  65. Delude, C.; Moussu, S.; Joubès, J.; Ingram, G.; Domergue, F. Plant surface lipids and epidermis development. Subcell. Biochem. 2016, 86, 287–313. [Google Scholar] [CrossRef]
  66. Bird, S.M.; Gray, J.E. Signals from the cuticle affect epidermal cell differentiation. New Phytol. 2003, 157, 9–23. [Google Scholar] [CrossRef]
  67. Bernard, A.; Joubès, J. Arabidopsis cuticular waxes: Advances in synthesis, export and regulation. Prog. Lipid Res. 2013, 52, 110–129. [Google Scholar] [CrossRef]
  68. Liu, X.; Bourgault, R.; Galli, M.; Strable, J.; Chen, Z.L.; Feng, F.; Dong, J.Q.; Molina, I.; Gallavotti, A. The fused leaves1-adherent1 regulatory module is required for maize cuticle development and organ separation. New Phytol. 2021, 229, 388–402. [Google Scholar] [CrossRef]
  69. Sinha, N.; Lynch, M. Fused organs in the adherent1 mutation in maize show altered epidermal walls with no perturbations in tissue identities. Planta 1998, 206, 184–195. [Google Scholar] [CrossRef]
  70. Yephremov, A.; Wisman, E.; Huijser, P.; Huijser, C.; Wellesen, K.; Saedler, H. Characterization of the fiddlehead gene of Arabidopsis reveals a link between adhesion response and cell differentiation in the epidermis. Plant Cell 1999, 11, 2187–2201. [Google Scholar] [CrossRef]
  71. Yeats, T.H.; Martin, L.B.B.; Viart, H.M.F.; Isaacson, T.; He, Y.H.; Zhao, L.X.; Matas, A.J.; Buda, G.J.; Domozych, D.S.; Clausen, M.H.; et al. The identification of cutin synthase: Formation of the plant polyester cutin. Nat. Chem. Biol. 2012, 8, 609–611. [Google Scholar] [CrossRef]
  72. Zhao, X.; Huang, L.; Kang, L.; Jetter, R.; Yao, L.H.; Li, Y.; Xiao, Y.; Wang, D.K.; Xiao, Q.L.; Ni, Y.; et al. Comparative analyses of cuticular waxes on various organs of faba bean (Vicia faba L.). Plant Physiol. Biochem. 2019, 139, 102–112. [Google Scholar] [CrossRef]
  73. Haslam, T.M.; Kunst, L. Extending the story of very-long-chain fatty acid elongation. Plant Sci. 2013, 210, 93–107. [Google Scholar] [CrossRef]
  74. de Silva, K.; Laska, B.; Brown, C.; Sederoff, H.W.; Khodakovskaya, M. Arabidopsis thaliana calcium-dependent lipid-binding protein (AtCLB): A novel repressor of abiotic stress response. J. Exp. Bot. 2011, 62, 2679–2689. [Google Scholar] [CrossRef]
  75. Gao, S.; Song, T.; Han, J.; He, M.; Zhang, Q.; Zhu, Y.; Zhu, Z. A calcium-dependent lipid binding protein, OsANN10, is a negative regulator of osmotic stress tolerance in rice. Plant Sci. 2020, 293, 110420. [Google Scholar] [CrossRef]
  76. Xiao, S.; Wu, C.; Zuo, D.; Cheng, H.; Zhang, Y.; Wang, Q.; Lv, L.; Song, G. Systematic analysis and comparison of CaLB genes reveal the functions of GhCaLB42 and GhCaLB123 in fiber development and abiotic stress in cotton. Ind. Crop Prod. 2022, 184, 115030. [Google Scholar] [CrossRef]
  77. Hepler, P.K.; Winship, L.J. Calcium at the cell wall-cytoplast interface. J. Integr. Plant Biol. 2010, 52, 147–160. [Google Scholar] [CrossRef]
  78. Hinderliter, A.K.; Almeida, P.F.F.; Biltonen, R.L.; Creutz, C.E. Membrane domain formation by calcium-dependent, lipid-binding proteins: Insights from the C2 motif. Biochim. Biophys. Acta 1998, 1448, 227–235. [Google Scholar] [CrossRef]
  79. Suttangkakul, A.; Li, F.; Chung, T.; Vierstra, R.D. Corrigendum to: The ATG1/ATG13 protein kinase complex is both a regulator and a target of autophagic recycling in Arabidopsis. Plant Cell 2021, 33, 3743–3744. [Google Scholar] [CrossRef] [PubMed]
  80. Wagner, D.; Meyerowitz, E.M. SPLAYED, a novel SWI/SNF ATPase homolog, controls reproductive development in Arabidopsis. Curr. Biol. 2002, 12, 85–94. [Google Scholar] [CrossRef] [PubMed]
  81. Kwon, C.S.; Chen, C.; Wagner, D. WUSCHEL is a primary target for transcriptional regulation by SPLAYED in dynamic control of stem cell fate in Arabidopsis. Genes Dev. 2005, 19, 992–1003. [Google Scholar] [CrossRef] [PubMed]
  82. Shu, J.; Chen, C.; Li, C.; Thapa, R.K.; Song, J.; Xie, X.; Nguyen, V.; Bian, S.; Liu, J.; Kohalmi, S.E.; et al. Genome-wide occupancy of Arabidopsis SWI/SNF chromatin remodeler SPLAYED provides insights into its interplay with its close homolog BRAHMA and Polycomb proteins. Plant J. 2021, 106, 200–213. [Google Scholar] [CrossRef]
  83. Caro, E.; Stroud, H.; Greenberg, M.V.; Bernatavichute, Y.V.; Feng, S.; Groth, M.; Vashisht, A.A.; Wohlschlegel, J.; Jacobsen, S.E. The SET-domain protein SUVR5 mediates H3K9me2 deposition and silencing at stimulus response genes in a DNA methylation-independent manner. PLoS Genet. 2012, 8, e1002995. [Google Scholar] [CrossRef]
  84. Jiang, D.; Kong, N.C.; Gu, X.; Li, Z.; He, Y. Arabidopsis COMPASS-like complexes mediate histone H3 lysine-4 trimethylation to control floral transition and plant development. PLoS Genet. 2011, 7, e1001330. [Google Scholar] [CrossRef]
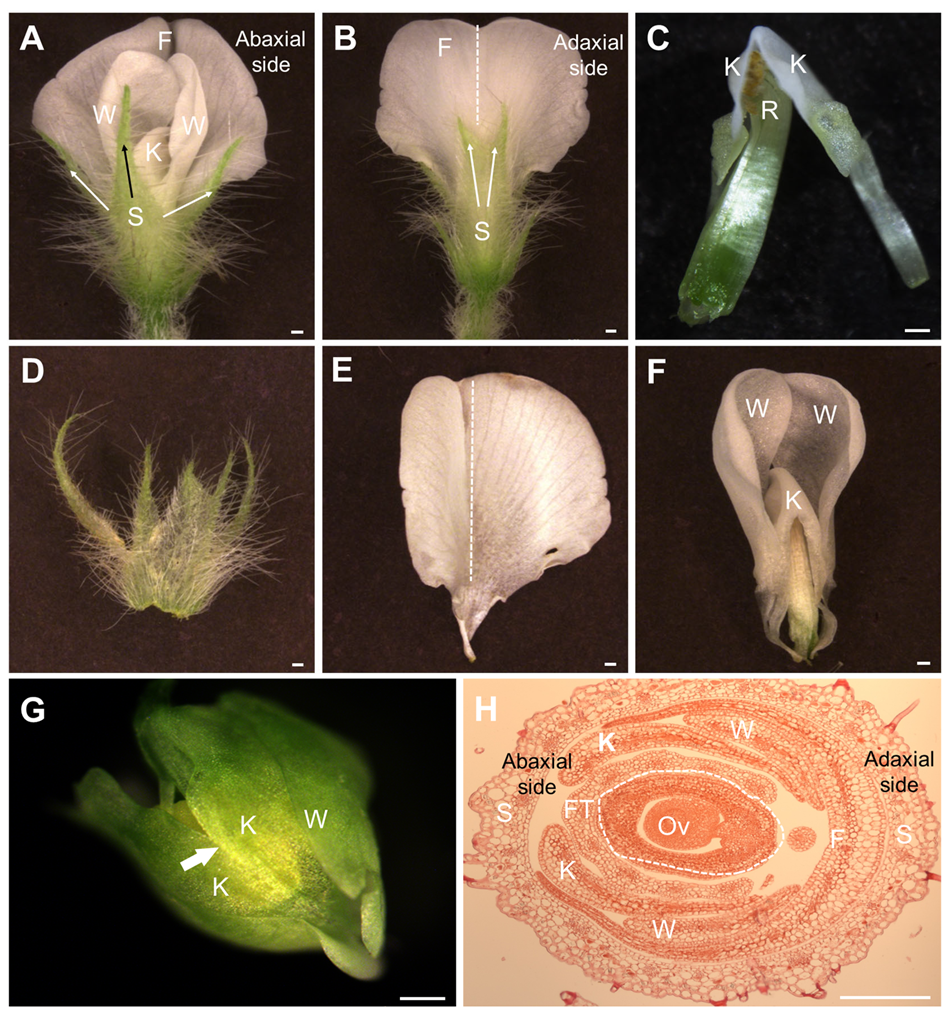
Figure 1. Morphology of the papilionaceous corolla in soybean. (A,B) The petals and sepals (approximately at developmental node vi). (C) Reproductive organs encased within the keel petals (approximately at developmental node v). (D) Five connate sepals (approximately at developmental node v). (E) Bilaterally symmetrical flag petals (approximately at developmental node vi) along their central axis (indicated by the white dashed line). (F) Wing petals positioned on either side of the keel petals (approximately at developmental node vi). (G) Keel petals (approximately at developmental node iv) display a fused feature (indicated by the white arrow). (H) The four successive whorls of floral organs (approximately at developmental node iv) in a section stained using Safranin O reagent. Abbreviations: F, flag petal; FT, filament tube; K, keel petal; Ov, ovule; R, reproductive organs (included ten stamens and one gynoecium); S, sepal/calyx tube; W, wing petal. Bar, 200 μm.
Agronomy 15 01971 g001
Figure 2. Postgenital fusion process of the keel petals in soybean. (A) Floral primordium (prior to developmental node i). (B) The three types of petals (approximately at developmental node i) showing different expansion rates. (C) Separated keel petals (approximately at the developmental node i–ii transitional phase). (D) Approaching keel petals (approximately at developmental node ii). (E) Fusion of the keel petals (approximately at the developmental node ii–iii transitional phase) along the fusion line (indicated by the white dashed line). (F,G) Epidermal substance (indicated by white dashed boxes) covering the surface of the fused zone along the two adjacent margins of the keel petal (approximately at the developmental node iii-iv transitional phase). (H,I) Ridges (indicated by white arrowheads) arising on the fused zone in keel petals (approximately at the developmental node iv-vi transitional phase). (J) Apertures (indicated by the white arrow) at the non-fused zones of keel petals (approximately at the developmental node iv–v transitional phase). (K) Discontinuous fusion points (indicated by white arrowheads) along the fusion line between keel petals (approximately at the developmental node iii-v transitional phase). Abbreviations: A, outer-whorl stamen; a, inner-whorl stamen; Bl, bracteole; C, carpel; F, flag petal; G, gynoecium; K, keel petal; P, petal; S, sepal/calyx tube; St, stamen; W, wing petal. Bar, 10 μm.
Agronomy 15 01971 g002
Figure 3. Postgenital fusion of the keel petals in different legumes. (A–I) SEM images of the keel petals at the fusion zone in Papilionoideae species Lupinus micranthus, Medicago truncatula, and Lablab purpureus. Their developmental stage is roughly equivalent to stages iii-v of soybean floral organ development nodes. Bar, 20 μm. (J) A diagrammatic model showing the partial fusion of keel petals in legumes. At the pre-fusion stage, the two opposing keel petals approach during petal growth. When they come into contact at the initial fusion stage, cuticle elimination and intercellular viscous substances possibly promote the discontinuous inter-organ adhesion between the marginal cells. After full fusion, the cuticle layer is completely eliminated at the fused region.
Agronomy 15 01971 g003
Figure 4. Morphology of the edge and epidermal cells of different petals. (A) Discontinuously fused points (indicated by the white dashed line) along the fusion line. (BF) Sections exhibit a transverse orientation (as indicated by the red dashed line in (A)) at the discontinuous fusion points (as indicated by the white dashed box in (A)) of the same sample and stained with Safranin O reagent. (B,C) Two keel petals with different end shapes featuring a bevel-like surface (indicated by the white arrow). (D) A cell from the adaxial side of the BK extending through the bevel-like surface (indicated by the white arrow) and contacting the tip of the PK. (E) Two opposed margins contacting and fusing along the bevel-like surface. (F) A cell on the margin from the BK reshaping and blurring the boundary between the two keel petals (indicated by the white arrow). (G) Epidermal cells from the flag petal. (H) Epidermal cells from wing petals (magnified view of the region indicated by dashed box in (G)). (I) Epidermal cells of the keel petals. Abbreviations: BK, blunt keel petal; F, flag petal; K, keel petal; PK, pointed keel petal; W, wing petal. Bar, 50 μm.
Agronomy 15 01971 g004
Figure 5. Cell reshaping and cuticle elimination at the fused region. (A) Rectangular cells on the abaxial surface of the keel petals (indicated by the white dashed line). (B) Reshaped cells at the fused points of the keel petals (indicated by white arrowheads). (C) Cells on the completely fused zone (indicated by white arrowheads) and the incompletely fused zone (indicated by black arrowheads). (D) Locally enlarged cells and unenlarged cells on the fused zone (indicated by white arrowheads and black arrowheads, respectively). (EG) Section on the fused zone (indicated by white arrowheads) stained by Ruthenium Red, Toloniumchloride, and Safranin O reagents, respectively. (H) Sample stained by Sudan reagent showing the initially fused zone (indicated by white arrowheads) and the surface (indicated by orange arrows) of the keel petals. (I) Sample of the completely fused zone stained by Sudan reagent. Abbreviations: K, keel petal; W, wing petal. Bar, 20 μm.
Agronomy 15 01971 g005
Figure 6. Transcriptome profiling of twelve soybean petal sample groups. (A) Sequencing data from twelve soybean petal sample groups. (B) Heatmap showing the correlation among the 12 samples. (C) The number of DEGs across various comparative combinations. all, the total number of DEGs; up, the number of upregulated DEGs; down, the number of downregulated DEGs. (D) Venn diagrams of DEGs among different comparative combinations.
Agronomy 15 01971 g006
Figure 7. UMAP visualization of 7 gene clusters. Each dot represents an expressed gene.
Agronomy 15 01971 g007
Figure 8. The cuticular biosynthesis pathway and expression dot plot map of the corresponding regulators. Left panel: a diagram showing the cuticle biosynthesis pathway and the related genes. Right panel: the dot plot map of the closest homologs of the corresponding regulators in the left panel, drawn based on their mean FPKM value. Abbreviations: LCFAs, long-chain fatty acids; VLC, very-long-chain; FAE, fatty acid elongase.
Agronomy 15 01971 g008
Figure 9. Expression heatmap and GO enrichment of keel petal 384 preferentially expressed genes. (A) The expression heatmap of the 205 preferentially expressed genes in IK. (B) Expression heatmap of the 179 preferentially expressed genes in MK. (C) GO dot map of the 205 preferentially expressed genes in IK. (D) GO dot plot of the 179 preferentially expressed genes in MK and the GO terms associated with calcium ions were significantly enriched (red box). FDR, false discovery rate. Fold enrichment is equivalent to GeneRatio or BgRatio. The Y-axis represents the GO terms, including biological process (BP) and molecular function (MF).
Agronomy 15 01971 g009
Figure 10. Candidate gene screening and tissue expression validation. (A) Heatmap of gene expression for 384 keel petal-preferential genes across 28 tissues in the Wm82 genome. (B) Protein domain structure of the candidate gene KPEG1. (C) Heatmap of gene expression for KPEG1 homologs across 314 tissues in the ZH13 genome. (D) Tissue-specific expression of KPEG1 in quantitative real-time PCR (qRT-PCR) analysis; error bars indicate ± SD (n = 3).
Agronomy 15 01971 g010
Figure 11. Protein interaction factors of KPEG1 and expression analysis for them. (A) Interaction network of KPEG1 protein in soybean. (B) Interaction network of KPEG1 protein in Arabidopsis. (C) Expression analysis of 10 KPEG1-interacting protein factors in keel petals and mixed banner/wing petals at the pre- and post-fusion stages of keel petals (data presented as mean values from three biological replicates for every group). (D) Expression analysis of 10 KPEG1-interacting protein factors across 28 tissues in the Wm82 genome.
Agronomy 15 01971 g011
Table 1. The regulators of cuticle biosynthesis in soybean.
Gene NameGene IDSoybean OrthologBiological FunctionTypes of RegulatorsDescription in MutantReference
FAX1At3g57280Glyma.03G133200,
Glyma.19G135000
Plastidial FAs export proteinpositiveAbnormal wax accumulation in stems, abnormal tapetum development, and pollen wall formation[42,43]
LACS1At2g47240Glyma.02G010300,
Glyma.03G092900,
Glyma.03G221400,
Glyma.10G010800,
Glyma.19G218300
Long-chain acyl-coenzyme A synthetasepositiveReduced the amount of wax and cutin on the stem and leaf[44]
CER6At1g68530Glyma.08G261100,
Glyma.10G241700,
Glyma.10G274400,
Glyma.20G115500
Keto-acyl-CoA SynthasepositiveReduced wax in stem and lipid contents in the pollen coats[45]
KCR1At1g67730Glyma.11G245600,
Glyma.11G245700,
Glyma.18G011500,
Glyma.18G011600
Keto-acyl-CoA reductasepositiveReduced wax in stem, fused rosette leaves, and embryo-lethal[46]
PAS2At5g10480Glyma.01G023400,
Glyma.08G279700,
Glyma.18G146900
Hydroxy-acyl-CoA dehydratasepositiveReduced wax deposition, fused flower buds, embryo lethal[47]
CER10At3g55360Glyma.02G273300,
Glyma.14G043500
Enoyl-CoA ReductasepositiveReduced wax deposition in stem[48]
FOP1At5g53390Glyma.06G291200,
Glyma.06G291300,
Glyma.07G000300,
Glyma.09G196400
Bifunctional wax ester synthase/diacylglycerol acyltransferasepositiveFlattened surface of the epidermal cells in petal, folded petal[49]
GPAT8At4g00400Glyma.03G008300,
Glyma.07G069700
Glycerol-3-phosphate acyltransferasespositiveReduced cutin on the stem and leaves, increased water loss, susceptibility to pathogens, and altered stomata structure[50]
DCRAt5g23940Glyma.09G134600,
Glyma.16G180500
BAHD family of acyltransferasespositiveReduced cutin monomer and postgenital fusions between the rosette leaves and flower buds[51]
ABCG5At2g13610Glyma.04G211800,
Glyma.05G192700,
Glyma.06G154500,
Glyma.08G000800
ATP-binding cassette transporter subfamily G proteinspositiveReduced wax contents in cotyledons, and seedling failed to develop true leaves under waterlogged conditions[52]
LTPG1At1g27950Glyma.05G147700,
Glyma.11G251100,
Glyma.18G005800
Glycosylphosphatidylinositol-anchored lipid transfer proteinpositiveReduced wax loads and altered wax composition in stem and silique[53]
CUS2At5g33370Glyma.01G106900,
Glyma.03G252600,
Glyma.03G252700,
Glyma.03G252800,
Glyma.04G109900,
Glyma.05G116300,
Glyma.09G241400,
Glyma.10G168400,
Glyma.10G168500,
Glyma.13G044500,
Glyma.13G045100,
Glyma.18G254800,
Glyma.19G050000,
Glyma.19G050800,
Glyma.19G050900,
Glyma.19G051000,
Glyma.19G051100,
Glyma.19G250100,
Glyma.19G250400,
Glyma.20G221200
Glycine-aspartic acid-serine-leucine-motif lipase/hydrolasepositiveReduced cuticular ridges on mature sepals[54]
WIN1At1g15360Glyma.04G147500,
Glyma.06G221800,
Glyma.07G031200,
Glyma.08G211600,
Glyma.13G166700,
Glyma.15G008600,
Glyma.17G114500
Transcription factor of the ethylene response factor (ERF) familypositiveReduced cutin composition on flower[55]
MYB94At3g47600Glyma.03G090800,
Glyma.04G170100,
Glyma.05G027000,
Glyma.06G193600,
Glyma.17G099800
Abscisic acid (ABA)-responsive R2R3-type MYB transcription factorpositiveReduced wax on the stem and leaves, more permeable cuticle, sensitive to droughts[56]
KCS12AT2G28630Glyma.12G075100,
Glyma.13G331600,
Glyma.15G042500
Ketoacyl-CoA synthasesnegativeIncreased wax and cutin contents in flower and leaves[57]
CER9At4g34100Glyma.02G103800,
Glyma.07G215200
E3 ubiquitin ligasenegativeIncreased cutin monomers and cuticle membrane thickness in leaves and stems[58]
CFL1At2g33510Glyma.18G302000WW domain proteinnegativeIncreased epicuticular wax on the surface of trichomes on the inflorescence stem[59]
Table 2. Homologous genes of KPEG1 in Wm82 and ZH13.
Arabidopsis Gene IDWm82 Gene IDZH13 Gene IDUniProt ID
AT1G04540Glyma.20G199700 (KPEG1)SoyZH13_20G185000K7N4L6_SOYBN
Glyma.03G249700SoyZH13_03G228500I1JRR2_SOYBN
Glyma.10G165300SoyZH13_10G150500I1LBP5_SOYBN
Glyma.10G130100SoyZH13_10G120700K7LJ48_SOYBN
Glyma.20G081900SoyZH13_20G073100I1NEL6_SOYBN
Table 3. KPEG1 protein–protein interaction partners.
Gene NameArabidopsis Gene IDUniProt IDSoybean Gene IDUniProt ID
ATG1TAT1G49180F27J15.5Glyma.06G150700K7KV61_SOYBN
Glyma.04G215500I1JY45_SOYBN
TROAT1G51450Q9C8J7Glyma.12G020200I1LPA8_SOYBN
Glyma.11G093700A0A0R0HKU4
SUVR5AT2G23740O64827Glyma.01G180100K7K4I0_SOYBN
Glyma.16G143100K7MHC3_SOYBN
Glyma.11G062100K7LNB1_SOYBN
Glyma.02G060500K7K6P9_SOYBN
SYDAT2G28290F4IHS2Glyma.07G252100K7L3S3_SOYBN
Glyma.17G022300A0A368UGQ2
Disclaimer/Publisher’s Note: The statements, opinions and data contained in all publications are solely those of the individual author(s) and contributor(s) and not of MDPI and/or the editor(s). MDPI and/or the editor(s) disclaim responsibility for any injury to people or property resulting from any ideas, methods, instructions or products referred to in the content.