Article

DEM Parameter Calibration and Experimental Definition for White Tea Granular Systems

1
College of Mechanical and Electrical Engineering, Fujian Agriculture and Forestry University, Fuzhou 350002, China
2
Fujian Key Laboratory of Agricultural Information Sensing Technology, Fuzhou 350002, China
3
College of Agriculture, Fujian Agriculture and Forestry University, Fuzhou 350002, China
*
Author to whom correspondence should be addressed.
Agronomy 2025, 15(8), 1909; https://doi.org/10.3390/agronomy15081909
Submission received: 17 July 2025 / Revised: 2 August 2025 / Accepted: 7 August 2025 / Published: 8 August 2025
(This article belongs to the Section Precision and Digital Agriculture)

Abstract

During automated packaging of white tea, uneven tea pile thickness leads to reduced weighing accuracy, while traditional experimental methods struggle to reveal the underlying particle flow mechanisms, hindering equipment optimization. Addressing the lack of discrete element method (DEM) parameters for Baihao Yinzhen tea, this study calibrates its DEM parameters based on the DEM approach, providing input for virtual commissioning of packaging machinery. Through physical experiments, the static friction coefficient (0.546), restitution coefficient (0.326), and rolling friction coefficient (0.133) between tea leaves and steel plates were determined. A three-dimensional DEM model of tea leaves was established using slicing techniques and the multi-sphere aggregation method. The steepest-ascent method and Box–Behnken design were employed to optimize the simulation parameters, resulting in the following optimal parameter combination: inter-particle restitution coefficient (0.16), static friction coefficient (0.14), and rolling friction coefficient (0.15). Validation simulations demonstrated that the mean angle of repose of tea leaves under the optimized parameter combination was 22.51°, with a relative error of only 1.29% compared to the actual experimental result of 22.80°. The calibrated parameters can be directly applied to the simulation of the feeding system in white tea automatic packaging machines, enabling optimization of vibration parameters through prediction of pile behavior, thereby reducing weighing errors.

1. Introduction

China’s tea culture is steeped in a long and storied history. White tea, as one of the six traditional Chinese teas, is primarily produced in regions such as Fuding, Zhenghe, Jianyang, and Songxi in Fujian Province. White tea is categorized into four types based on the parts of the tea plant harvested: Baihao Yinzhen (Silver Needle), Baimudan (White Peony), Gongmei (Tribute Eyebrow), and Shoumei (Long Life Eyebrow). Fuding, as the main production area for Baihao Yinzhen, is renowned for its high-quality tea characterized by plump buds covered in silvery white hairs, a bright white appearance, a pale apricot-yellow infusion, and a fresh and refreshing taste [1,2,3]. During the packaging and marketing of white tea, traditional manual bagging methods have been commonly used. However, these methods are not only difficult to control in terms of tea quality but also fail to meet the requirements for clean production. With the development of tea processing technology and equipment in China, automated tea bagging machines have gradually been adopted, significantly improving the efficiency of tea processing [4,5,6]. However, improper tea stacking, whether too thick or too thin, can affect the accuracy of weight sensors, leading to errors in the quality inspection of the final product. Traditional experimental methods have certain limitations in accurately revealing the dynamic mechanisms of tea particles within bagging machines, thereby constraining further optimization of the equipment.
With the maturation of discrete element method (DEM) and DEM-CFD (Computational Fluid Dynamics) coupling technologies, these numerical simulation techniques have provided new avenues for investigating the mechanical properties, motion behavior, and temperature distribution of tea particles within processing equipment. Therefore, conducting precise calibration studies of relevant particulate material properties holds significant theoretical and practical engineering value.
Scholars from both domestic and international institutions have conducted extensive simulations and parameter calibrations for granular materials. Ren Ning [7] performed discrete element calibration on soil particles, and the resulting soil model provides a technical foundation for subsequent research in tea plantations. Li Feixiang [8] employed physical simulation experiments of the angle of repose to determine the significant factors affecting the angle of repose of corn seeds and their value ranges. Li Hua [9] developed a three-dimensional discrete element model for rice mixtures, compared the sieving processes of different particles, and obtained key parameters conducive to the separation of shriveled grains. Ye Dapeng [10] used the discrete element method to calibrate parameters for soil of edible fungus grass, further optimizing the simulation model. Liu Hongjun [11] employed the Hertz–Mindlin with EEPA (Elastic–Plastic Adhesive) contact model to calibrate parameters for the heavy clay soil in the rice–wheat cropping regions. The calibrated parameters provide a foundation for the development of soil-engaging machinery in these regions. In China, research on the discrete element models of flat-leaf particles has primarily focused on multi-sphere filling models. Lai Z [12] and Guo Wujie [13] developed a model for sugarcane leaves, Hu Xiaoya [14] constructed a model for goji berry leaves, Zhang X [15] developed a model for fresh tea leaves, and Mu Guizhi et al. [16] established a model for sweet potato vine leaves. In the modeling of irregular leaf particles, Qin Kuan et al. [17] established a flexible polyhedral tea leaf particle model, and Jin Hao et al. [18] developed a flexible thin-shell tobacco leaf particle model.
Although research has been conducted on the discrete element method (DEM) simulation parameter calibration for needle-shaped tea particles, further in-depth studies are still needed for the specific variety of Baihao Yinzhen. In this study, a geometry reconstruction method based on slicing technology was employed to establish a three-dimensional solid model of tea particles. Subsequently, a discrete element model was constructed using a multi-sphere aggregation algorithm. Through the use of the angle of repose as the response value, steepest-ascent optimization experiments and Box–Behnken response surface experiments were conducted. Through comparative analysis between discrete element simulations and physical piling experiments, the optimal combination of simulation parameters for tea particles was ultimately determined. This provides data support for tea harvesting, processing, and related applications. Discrete element parameter calibration represents a common technical bottleneck in digital twin systems for agricultural product processing. The tea model established in this study exhibits parameter portability and real-time simulation capability (completing the angle-of-repose calculation for 300 particles within 10 s). It can be extended in the future to serve as a virtual mirroring layer for packaging production lines, dynamically updating simulation boundary conditions with sensor data (e.g., material level height, moisture content) to enable bi-directional physical–virtual optimization.

2. Materials and Methods

2.1. Test Materials

The experimental material consisted of Baihao Yinzhen tea obtained from Fujian Province. It was divided into five groups. The moisture content was measured using the electrically heated constant-temperature drying method [19]. The moisture content of the finished tea was calculated using the following formula (Equation (1)):
ω = m 0 m 1 m 0 × 100 %
where ω —moisture content (%); m0—mass before dehydration (g); and m1—constant dry mass after dehydration (g).
The measured mean moisture content across all batches was 1.73% with a coefficient of variation (CV) of 7.65%, indicating high sample consistency under controlled processing conditions.

2.2. Static Friction Factor

In this experiment, the static friction coefficient between tea leaves and steel plates was measured using the inclined-plane method, as shown in Figure 1. When the tea leaves are placed on an inclined platform, the force system acting on them includes the gravitational force G, the normal force N from the inclined plane, and the static frictional force f. Decomposing the gravitational force, we can obtain the component of the gravitational force parallel to the inclined plane, F1, and the component perpendicular to the inclined plane, F2. By gradually increasing the angle of inclination, when F1 equals the maximum static frictional force f, the tea particles reach the critical state of sliding. The tangent of the angle of inclination at this point is the static friction coefficient. The static friction coefficient is calculated as follows (Equation (2)):
μ s = tan θ
where μ s —static friction coefficient (dimensionless); and θ —critical inclination angle (°).
The static friction coefficient was determined using a precision inclined-plane apparatus, which mainly consists of a standard steel plate (300 mm × 300 mm × 1 mm), a digital angle gauge (accuracy 0.05°), and an adjustable lifting platform. During the experiment, the pretreated tea samples were evenly spread on the surface of the steel plate. The inclination of the platform was slowly increased until macroscopic displacement of the samples was observed through a high-speed camera. At this point, the angle adjustment was stopped immediately. The critical angle of inclination recorded by the digital angle gauge was then used to calculate the static friction coefficient θ as the tangent of this angle.

2.3. Collision Recovery Coefficient

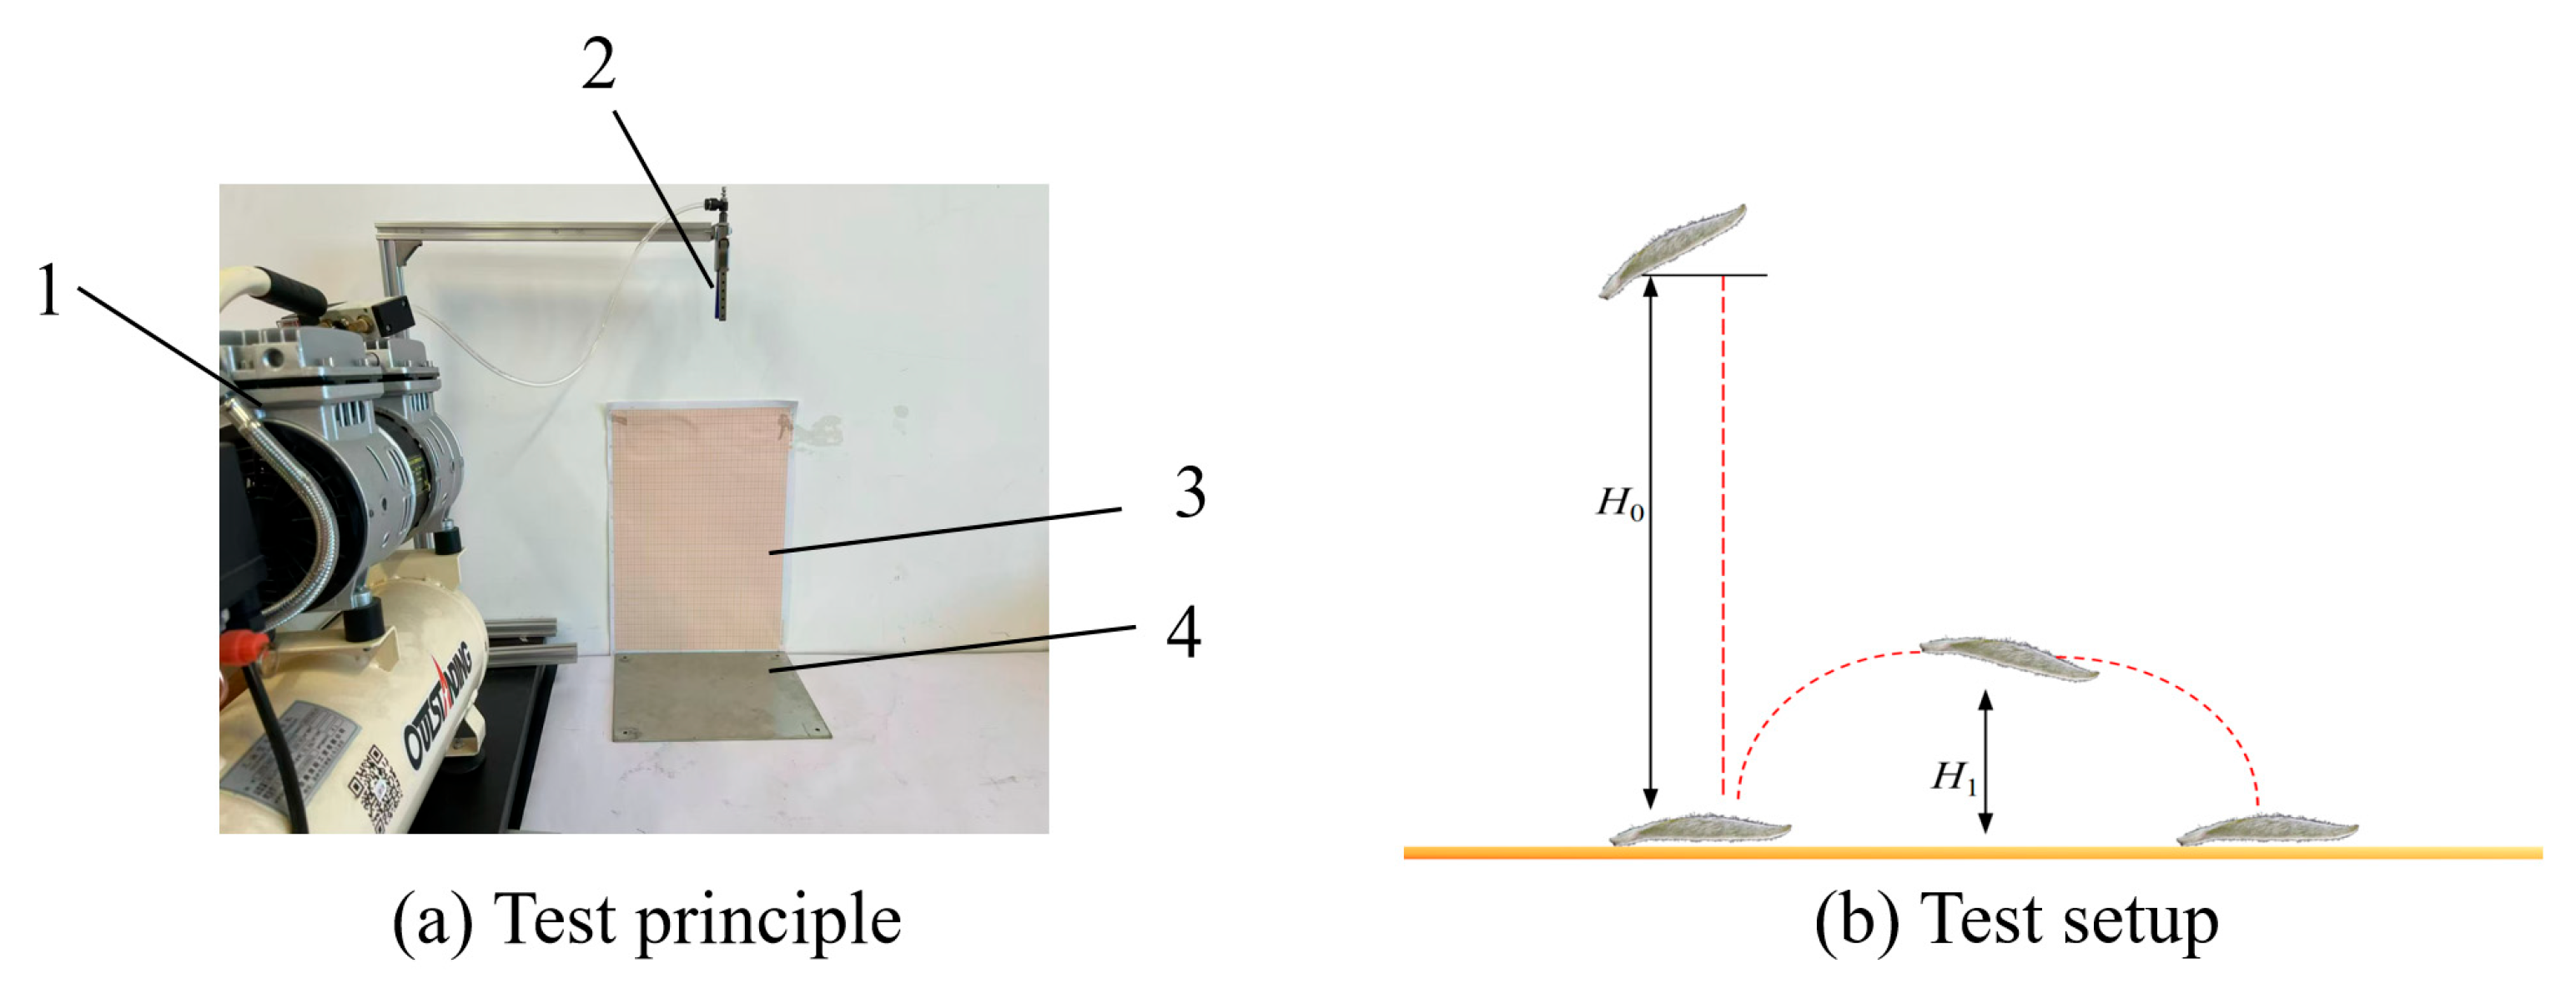
The experimental setup is shown in Figure 2. The collision interface is a horizontally fixed steel plate. Tea particles are released from an initial height H to fall freely. High-speed camera technology is used to capture the entire trajectory of the particle after collision. The maximum rebound height is obtained through image analysis, and the coefficient of restitution is calculated. This free-fall testing method, based on the principle of energy conservation, measures the change in kinetic energy before and after the collision, accurately characterizing the elastic recovery behavior of tea particles colliding with a metal surface.
Given that the velocity after the free-fall collision with the steel plate is v 2 * = 2 g H 1 , and the velocity before the collision is v 2 = 2 g H 0 , the collision recovery coefficient e between the tea leaves and the steel plate can be calculated using the following (Equation (3)):
e = v 1 * v 2 * v 1 v 2 = v 2 * v 2 = H 1 H 0
where v1 and v2—the velocity of the contact steel and the tea leaves before collision, m/s; v1* and v2*—the velocity of the contact steel and the tea leaves after collision, m/s; H1—the height after the first bounce, mm; and H0—the height at the release point, mm.

2.4. Rolling Friction Coefficient

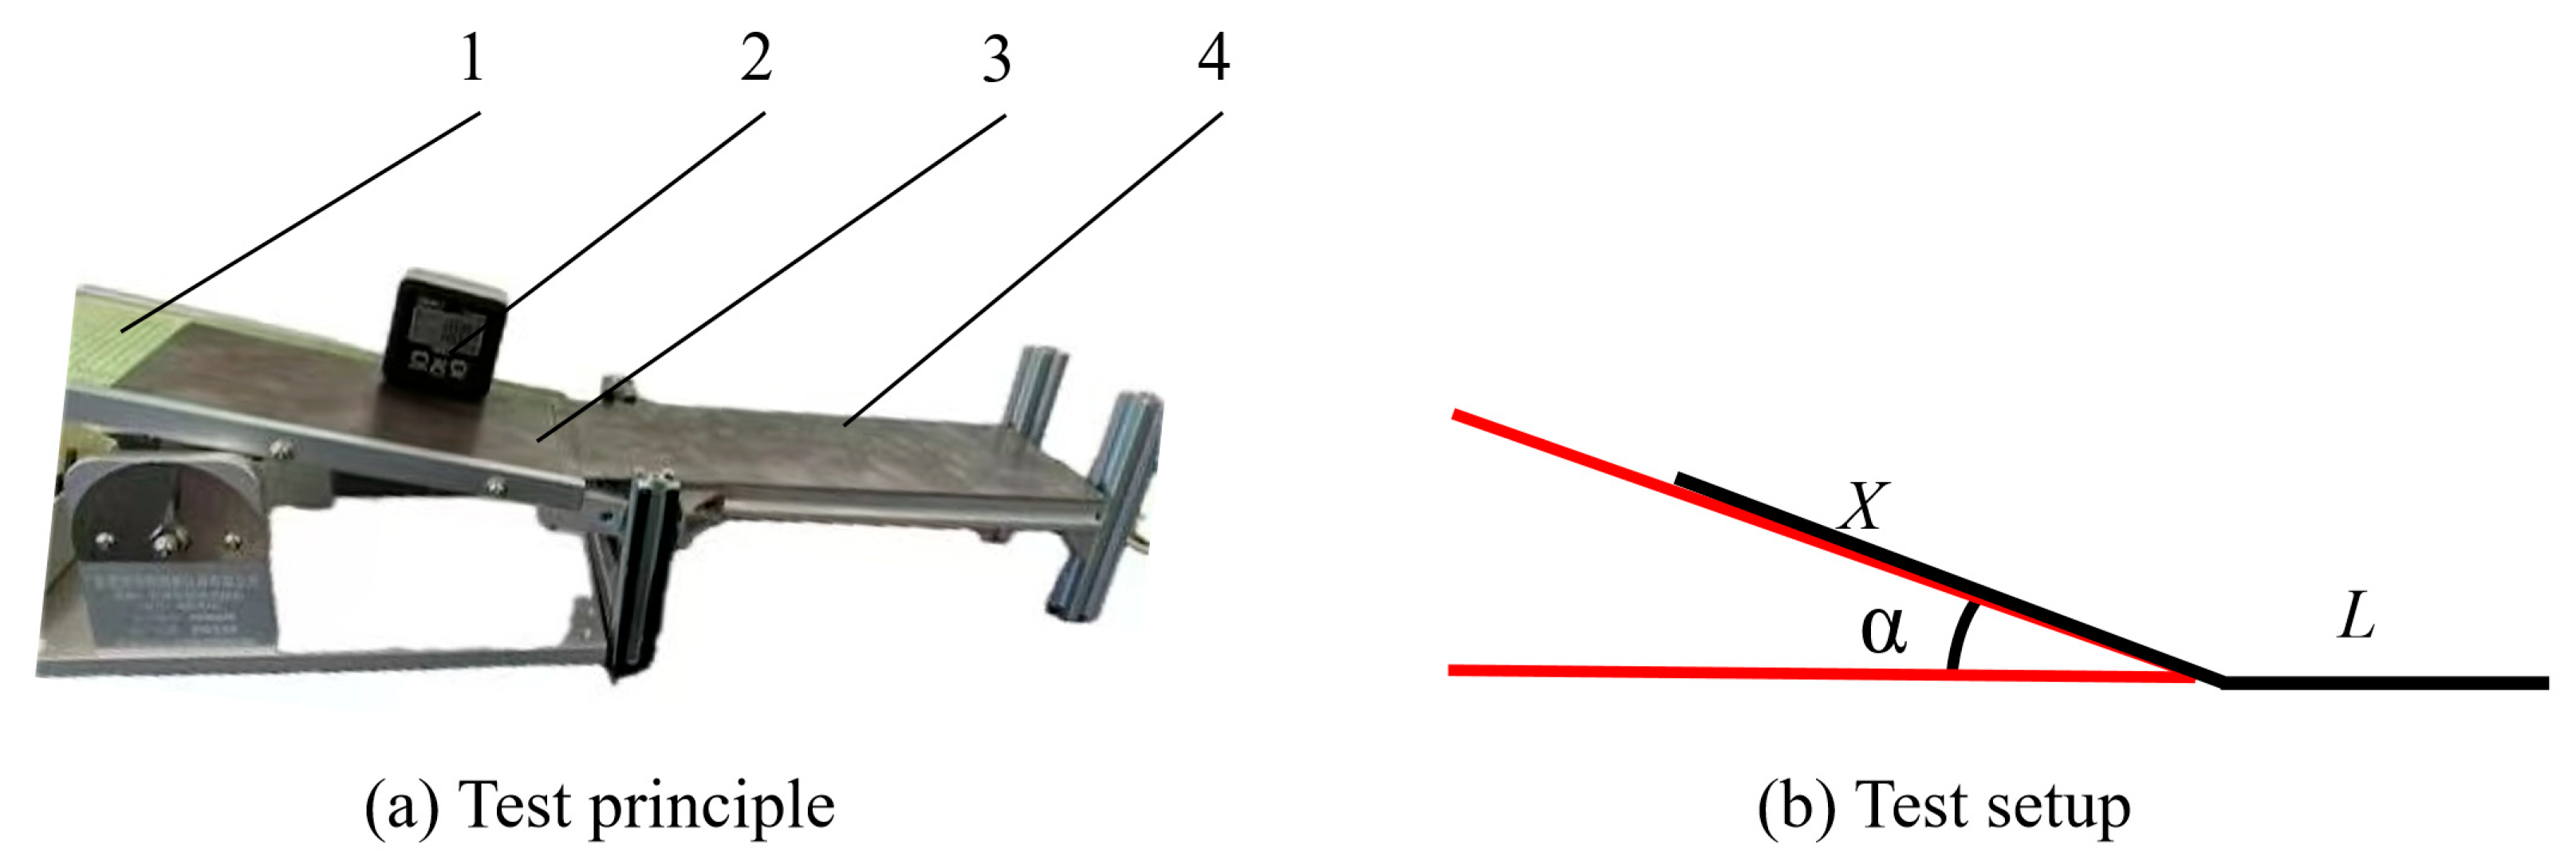
In this study, the rolling friction coefficient between tea particles and steel plates was determined using the inclined-plane rolling method, as shown in Figure 3. The measurement platform mainly consists of a horizontal base plate, an adjustable inclined platform, and a support structure. During the experiment, the sample to be tested is placed at a distance X from the bottom edge of the inclined platform (along the direction of the inclined plane) and released from rest. The motion trajectory of the particle is recorded. When the particle rolls down to the horizontal base plate and finally comes to rest, the sliding distance L is measured. Based on the principle of energy conservation, the rolling friction coefficient μ k can be calculated using the following formula, Equation (4):
μ k = X sin α X cos α + L

2.5. Physical Test of Repose Angle

The angle of repose is a macroscopic parameter that reflects the shear strength, internal friction, and other characteristics of granular materials. It is related to the size, moisture content, and surface shape of the particles [20,21]. To measure the angle of repose, the same batch of tea leaves was divided into groups of 50 g each and sequentially poured into a cylindrical container. After the tea particles had settled, the container was lifted using a tensile testing machine, allowing the tea to naturally form the angle of repose. Once the tea had fully settled and stabilized, multiple photographs were taken at 120° intervals to minimize measurement errors caused by relying on a single camera position. The experimental process is shown in Figure 4.
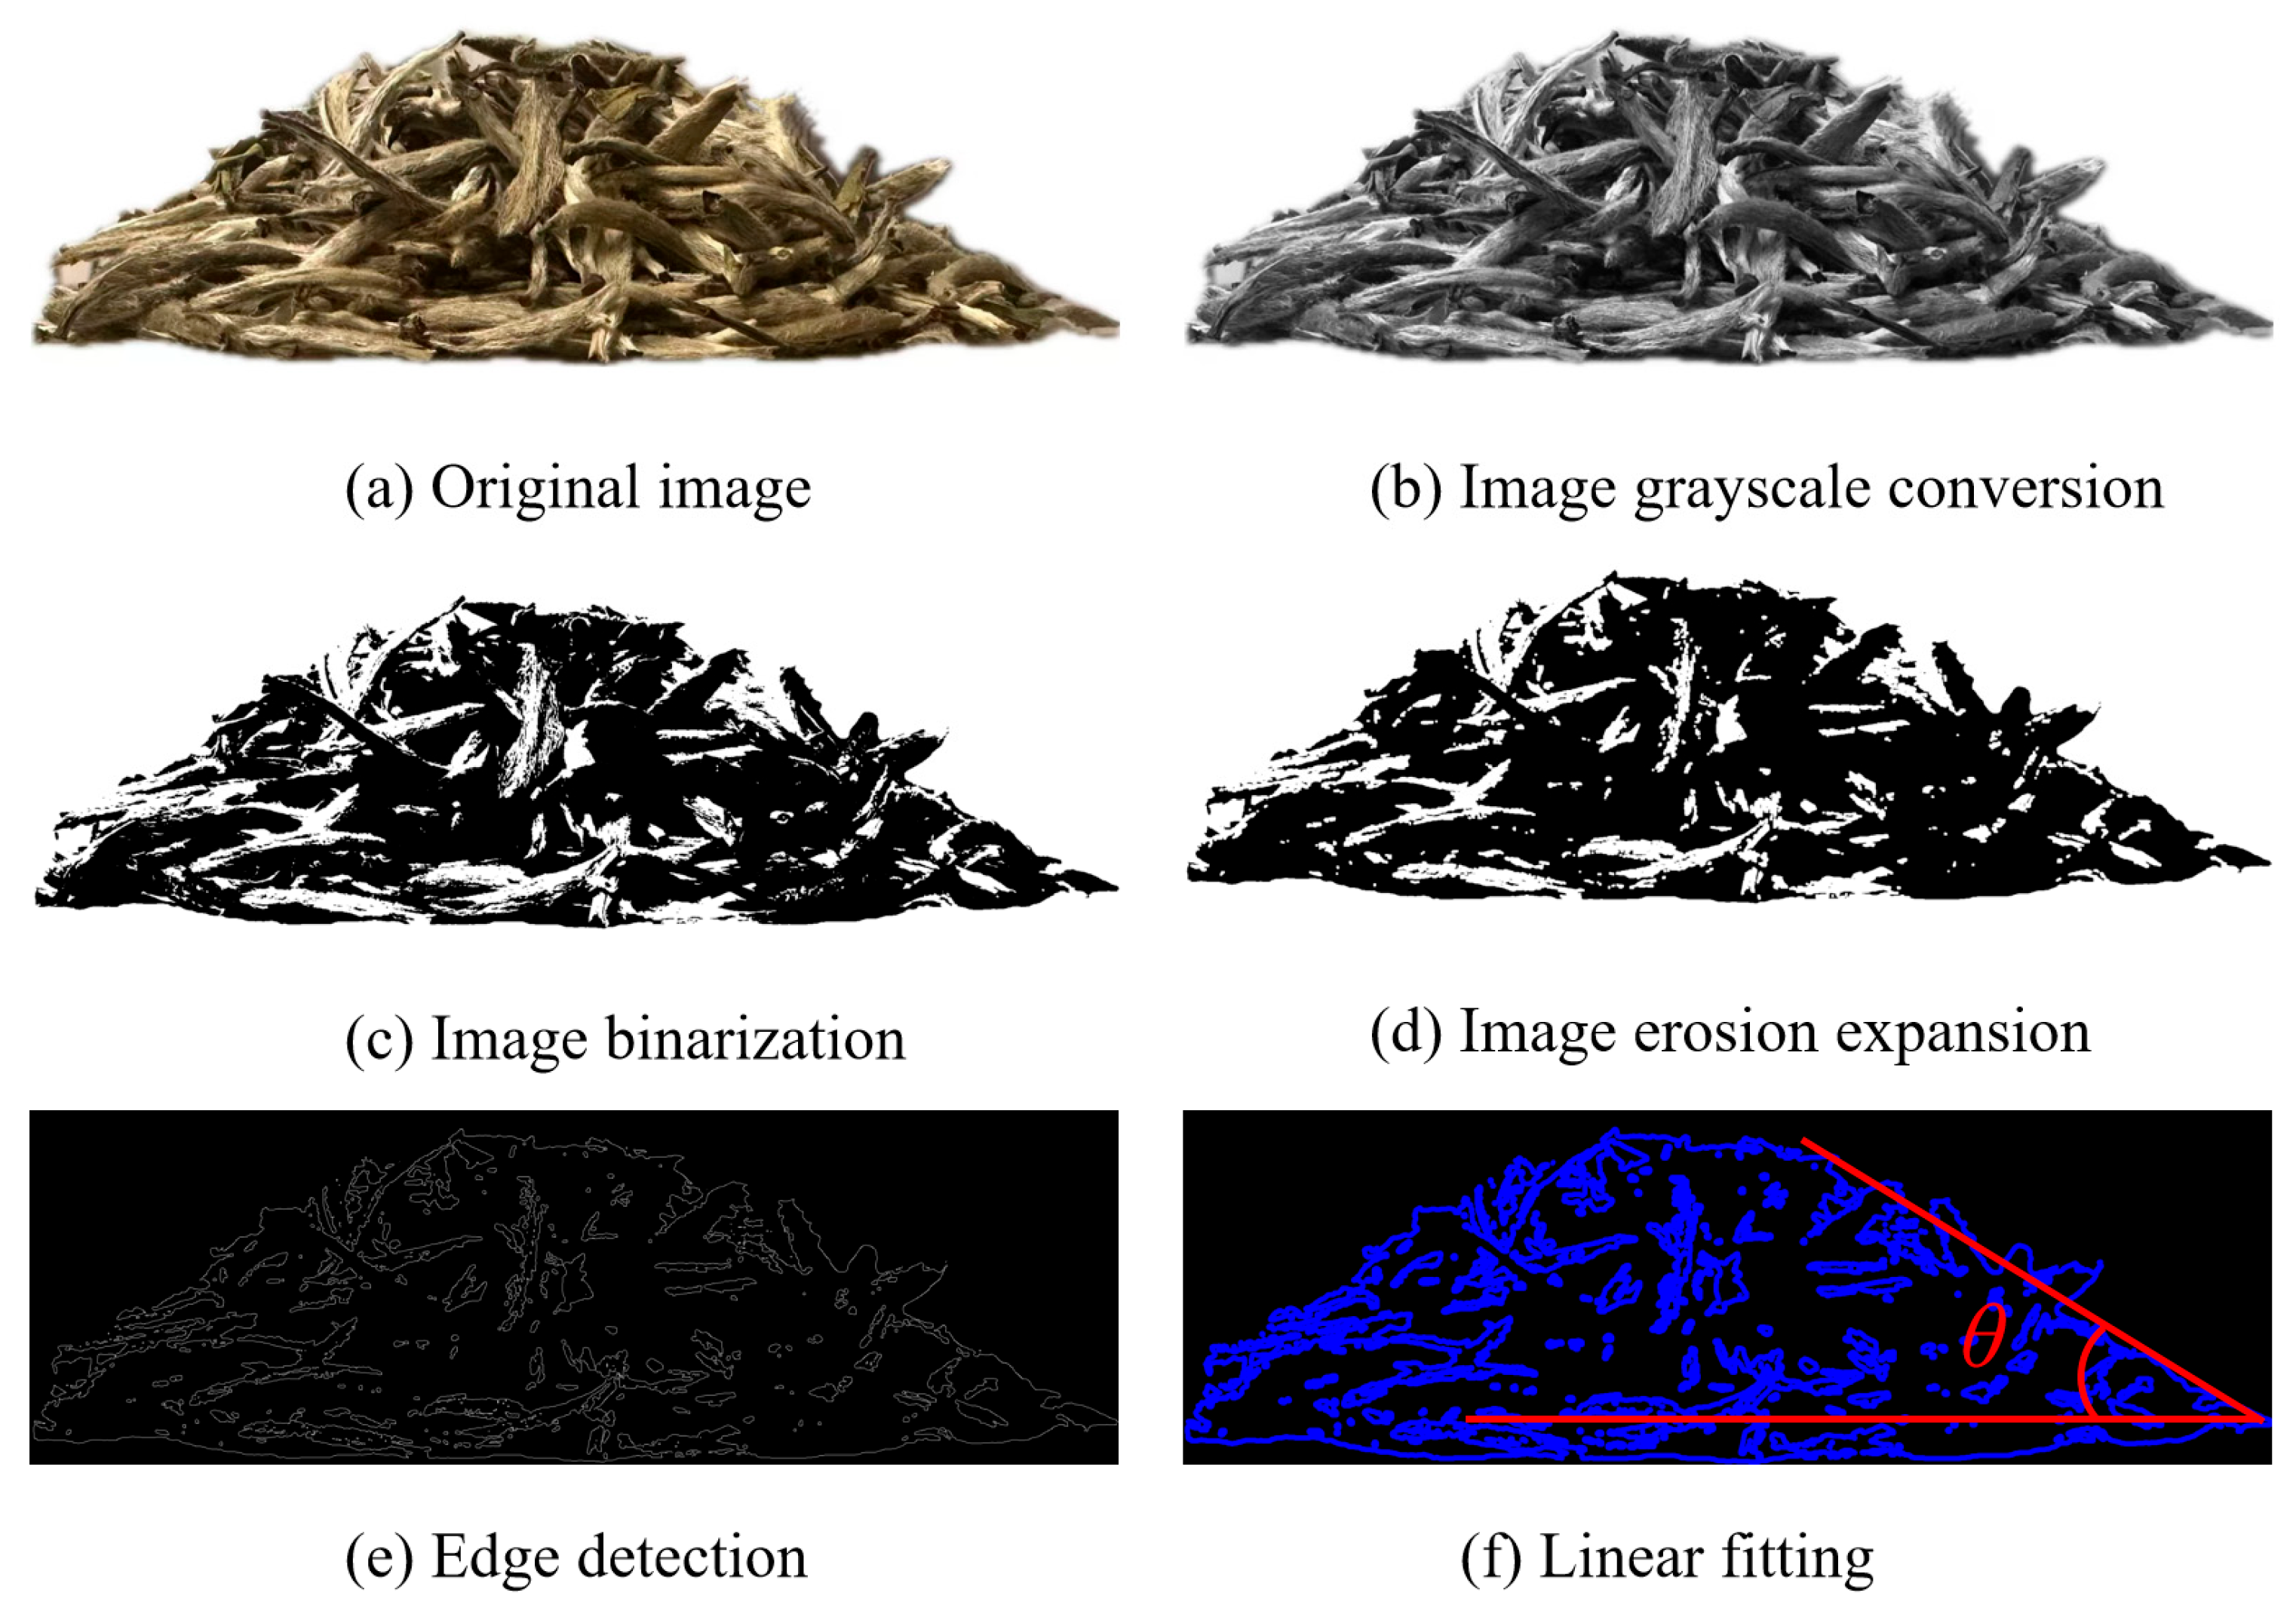
Through the use of Python (V3.9) image processing software, the original images were first converted to grayscale and then subjected to dilation and erosion processes. Subsequently, edge detection was performed on the images. Finally, linear fitting was applied to obtain the slope k. The angle of repose was then calculated as angle of repose θ = arctan (k). The processing procedure is shown in Figure 5.

2.6. Simulation Model

2.6.1. Establishment of the Tea Particle Model

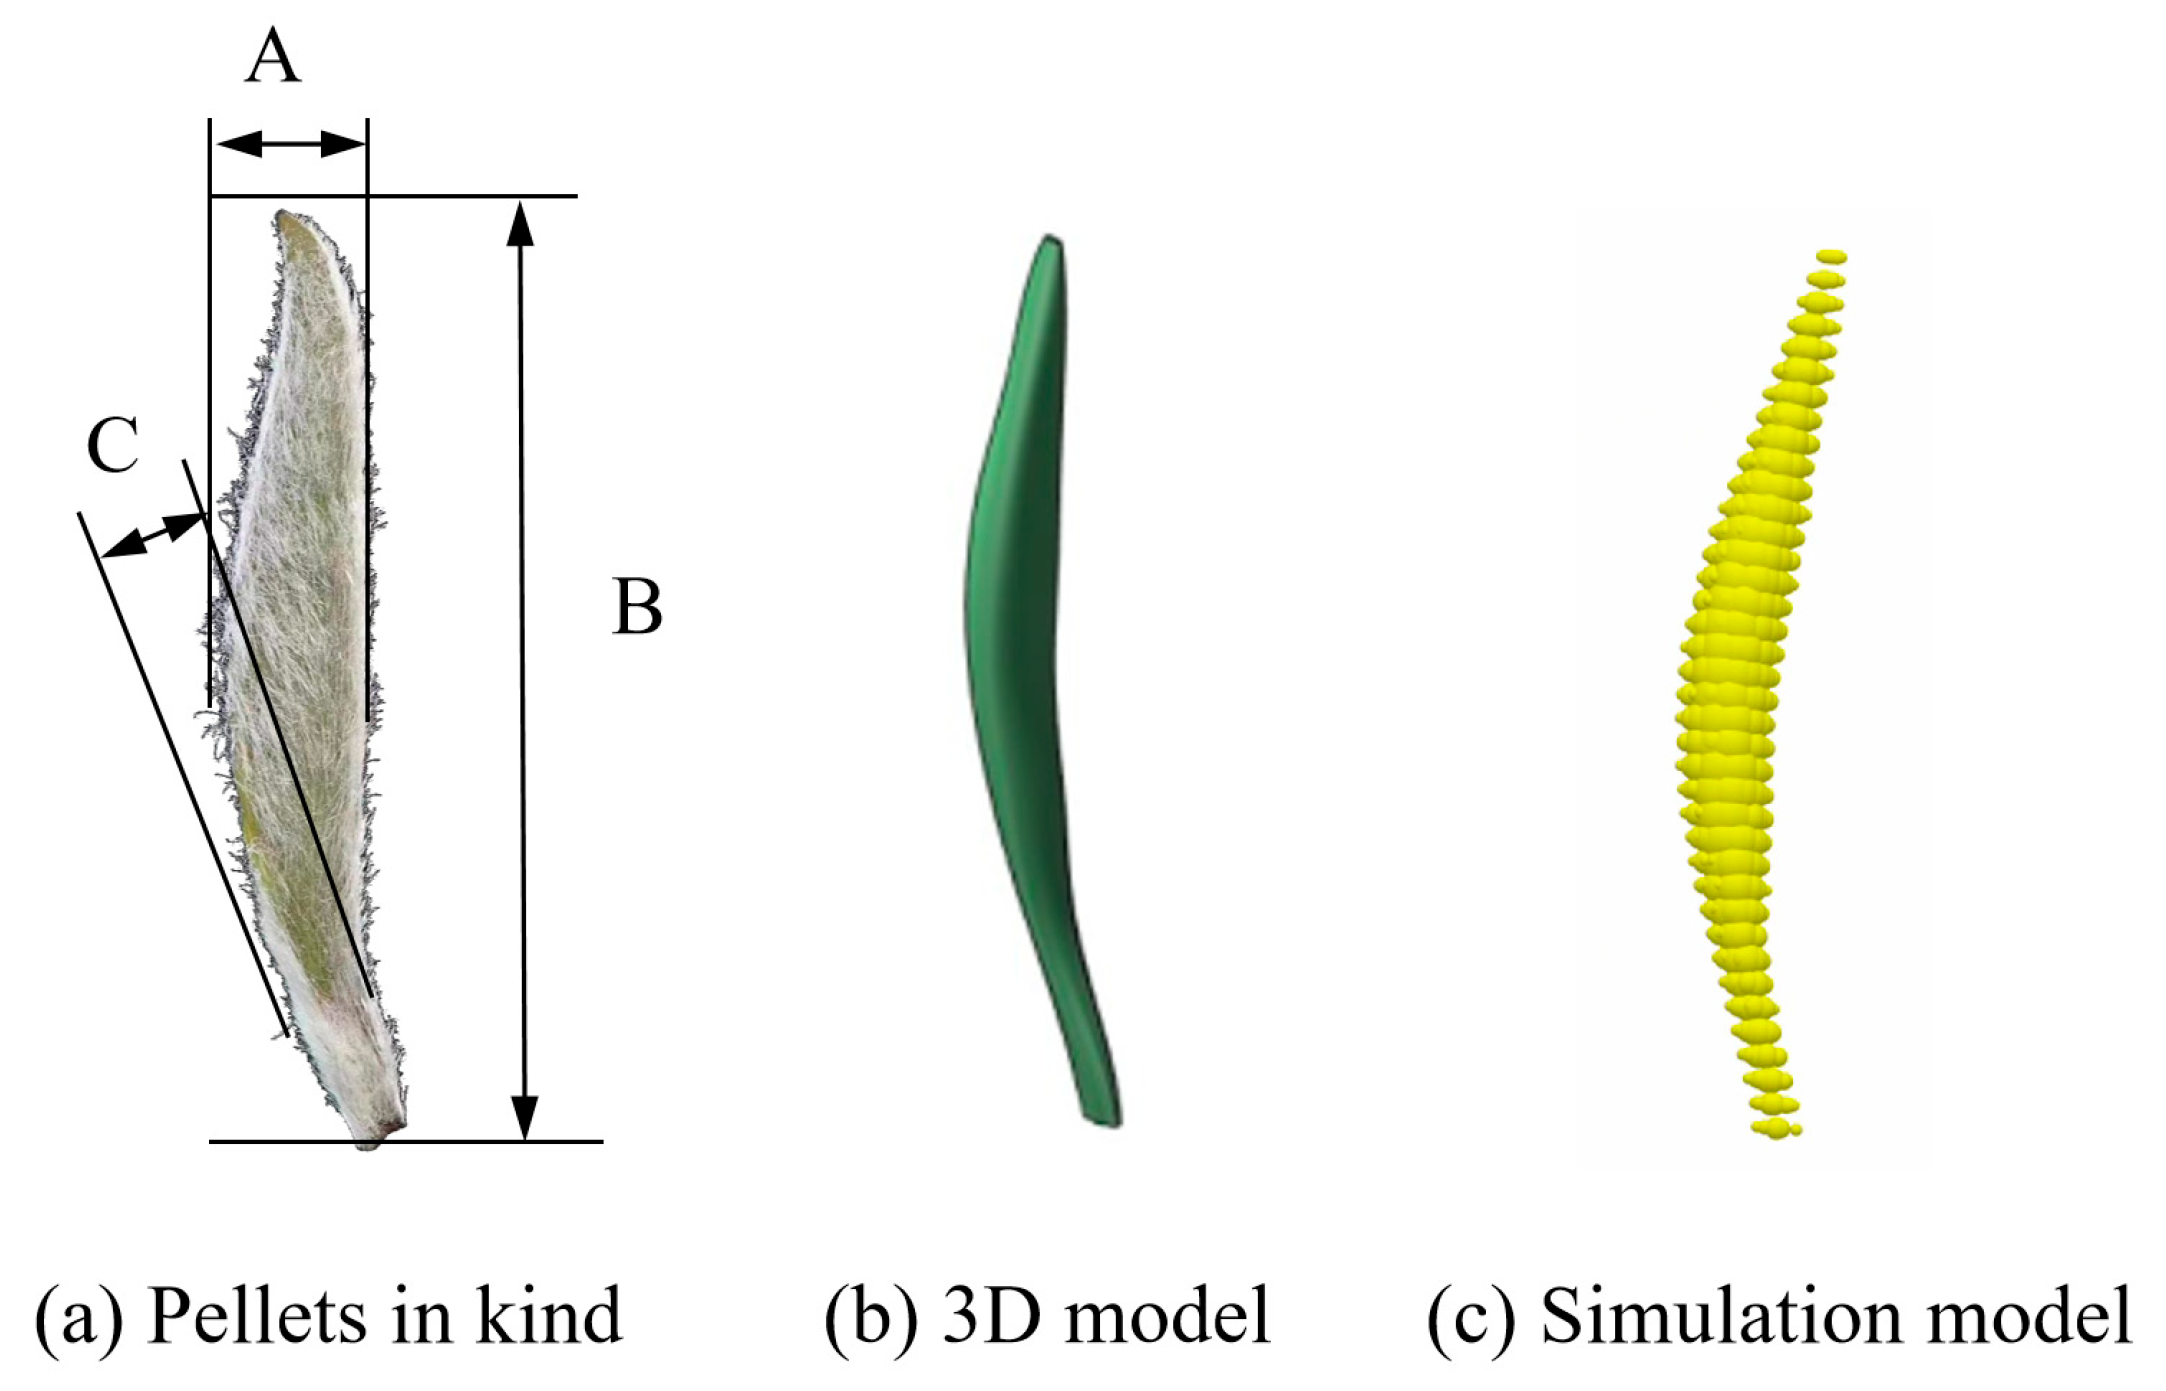
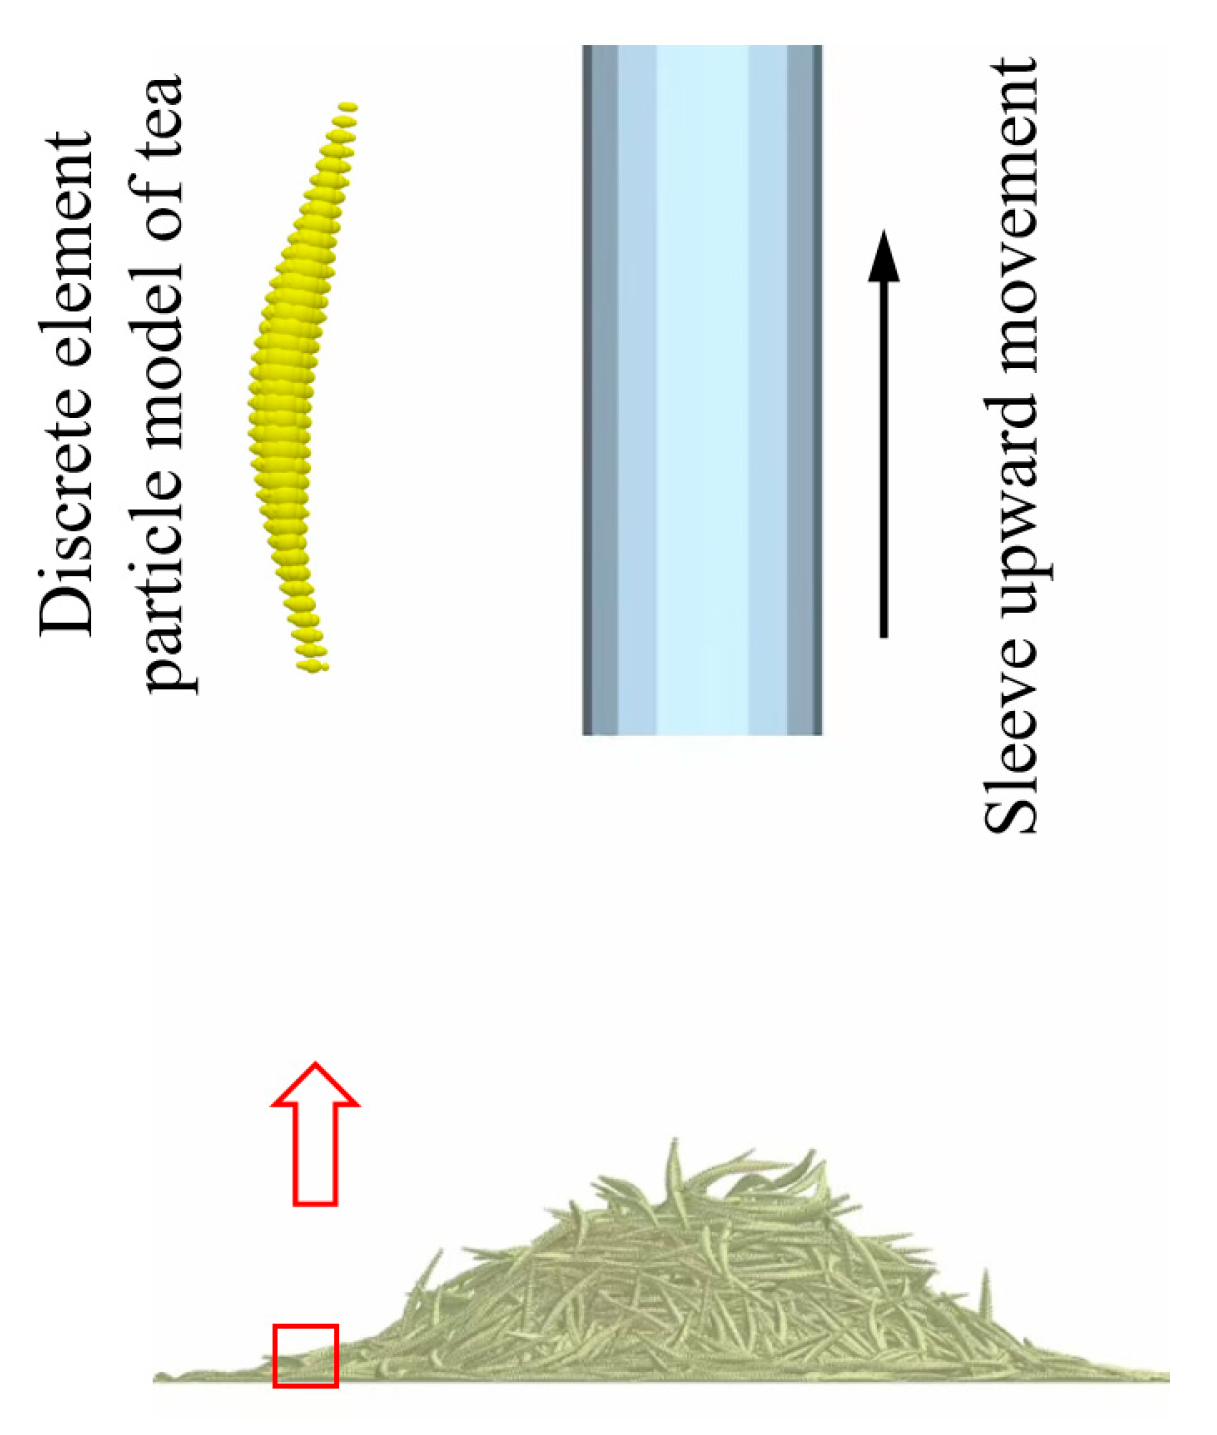
In this study, the discrete element model of tea particles was constructed using the slicing approximation method [22]. The specific modeling process is as follows: First, 300 standard tea samples with a length of 20 mm were randomly selected and divided into 15 cross-sections along the length direction. The width and thickness of each cross-section were measured using a digital vernier caliper (accuracy 0.01 mm). The specific data for each parameter are shown in Table 1. Based on the measured data, the geometric model of tea particles was constructed using SolidWorks 2022, a 3D modeling software. Subsequently, the model was imported into the EDEM discrete element simulation platform, where the final discrete element model of tea particles was generated using the single-sphere aggregation method. The specific morphology of the model is shown in Figure 6. This method, through precise size measurement and rational geometric simplification, effectively realized the numerical simulation of the complex shape of tea particles.

2.6.2. Contact Model

EDEM provides several basic models, each with distinct characteristics. These include the Hertz–Mindlin (no-slip) model, which accounts for elastic deformation but neglects adhesive forces between particles. The Hertz–Mindlin with Bonding model is used to simulate particles that are bonded together. The Hertz–Mindlin with JKR (Johnson–Kendall–Roberts) model is applicable for simulating particles that exhibit adhesive behavior due to moisture or other causes [23,24,25].
In this study, tea particles were modeled as elongated aggregates composed of spherical particles. The primary considerations were the collision interactions between the particles and the stainless-steel base plate, as well as among the particles themselves. Given the low moisture content of the finished tea leaves, the influence of moisture on inter-particle interactions was neglected in the modeling process. Regarding the selection of the contact model, the Hertz–Mindlin (no-slip) model was chosen for its ability to accurately characterize the viscoelastic behavior between particles. The model calculates the interaction forces between particles using the following equations [26]: normal force, normal damping force, tangential force, and tangential damping force. This modeling method considers the mechanical properties of tea particles while maintaining the rationality of the computational model.

2.6.3. Simulation Experiment of the Repose Angle of Tea Particles

The funnel model was constructed using SolidWorks software, with dimensions consistent with those of the experimental funnel. The distance from the lower plane of the funnel to the center of the accumulation platform was set at 10 cm. A particle generator of similar size to the funnel was established above the funnel, generating a total of 300 tea particles. Under the influence of gravity, the tea particles fell vertically with an initial velocity of 1.5 m/s. The total simulation time was set to 10 s, as shown in Figure 7.

3. Results

3.1. Determination Results of Relevant DEM Parameters for White Tea

According to the aforementioned experimental method, each group of experiments was repeated 25 times, yielding the results presented in Table 2. As shown in Table 2, the coefficient of restitution e between tea particles and the contacting steel plate is 0.326, the static friction coefficient μs between tea particles and tool steel is 0.546, and the rolling friction coefficient μk between tea particles and tool steel is 0.133.

3.2. The Steepest-Climb Test

Based on the literature review [27,28,29,30], the density of tea particles was determined to be 532 kg/m3, the Poisson’s ratio was 0.4, and the shear modulus was 6 MPa. Additionally, X1 was defined as the restitution coefficient between tea particles, X2 as the static friction coefficient between tea particles, and X3 as the kinetic friction coefficient between tea particles. In combination with the built-in GEMM database in EDEM, and using the actual angle of repose as the target value, the recommended ranges for the inter-particle parameters were obtained as follows: X1 ranges from 0.06 to 0.40, X2 ranges from 0.05 to 0.25, and X3 ranges from 0.05 to 0.25. Based on the recommended parameter ranges, this study designed five sets of gradient-increasing steepest-ascent experiments. The experimental schemes and results are detailed in Table 3. The experimental data show that as the values of parameters X1, X2, and X3 increase, the angle of repose of the particles exhibits a monotonic increasing trend. In contrast, the relative error between the simulated and physically measured angles of repose first decreases and then increases. Among them, the relative error in Experiment 3 was the smallest (only 0.6%), indicating that the optimal combination of parameters X1, X2, and X3 should be located near the parameter intervals corresponding to Experiment 3. This result provides a clear direction for subsequent parameter optimization. Therefore, the third set was used as the central level, while the second and fourth sets were used as the low and high levels of the experiment, respectively.

3.3. Box–Behnken Test

Based on the results of the steepest-ascent experiment, the third set was used as the central level, while the second and fourth sets were used as the low and high levels, respectively. A Box–Behnken experimental design was then employed.
The specific experimental design scheme and the corresponding response values are detailed in Table 4. This experimental design method not only effectively examines the interaction effects of each parameter but also assesses experimental error through repeated central-point experiments.

4. Discussion

4.1. Test Results and Analysis

In this study, the three key contact parameters X1, X2, and X3 were selected as independent variables, with the angle of repose as the response value. A quadratic polynomial prediction model for the angle of repose was established through regression analysis, and its mathematical expression is given by (Equation (5)). This model can quantitatively describe the comprehensive influence of each contact parameter on the particle accumulation characteristics.
θ = 22.65 0.8662 X 1 + 2.53 X 2 + 2.70 X 3 + 0.0275 X 1 X 2 0.67 X 1 X 3 0.52 X 2 X 3 + 0.1805 X 1 2 + 0.1980 X 2 2 + 0.0105 X 3 2
The regression equation R2 = 0.9654, with Radj2 = 0.9208. Analysis of variance was performed on the above model, as shown in Table 5.
As shown in the table, the p-value for the angle-of-repose model is less than 0.01, indicating that the model is statistically significant; the p-value for the residual term is greater than 0.05, indicating that the model fits well. X2 and X3 show extremely significant effects on the model, X1 shows a significant effect, and the remaining factors have no significant effect. Based on the F-value of the regression model, the order of significance of the effects is as follows: X3 > X2 > X1.
Furthermore, based on the analysis of variance (ANOVA), Fisher’s statistical test was conducted to verify the adequacy of the model. According to (Equation (6)),
F = S S R / k S S E / ( n k 1 ) ~ F ( k , n k 1 )
where
SSR = 118.61 (sum of squares due to regression);
SSE = 4.26 (sum of squares due to error);
K = 9 (degrees of freedom for the independent variables);
N = 17 (total number of experimental runs);
F cal = 118.61 / 9 4.26 / ( 17 9 1 ) = 13.18 0.608 = 21.68 .
The calculated value is F0.01 (9,7) = 6.72. Since Fcal > 6.72, the model is therefore highly significant and considered adequate.
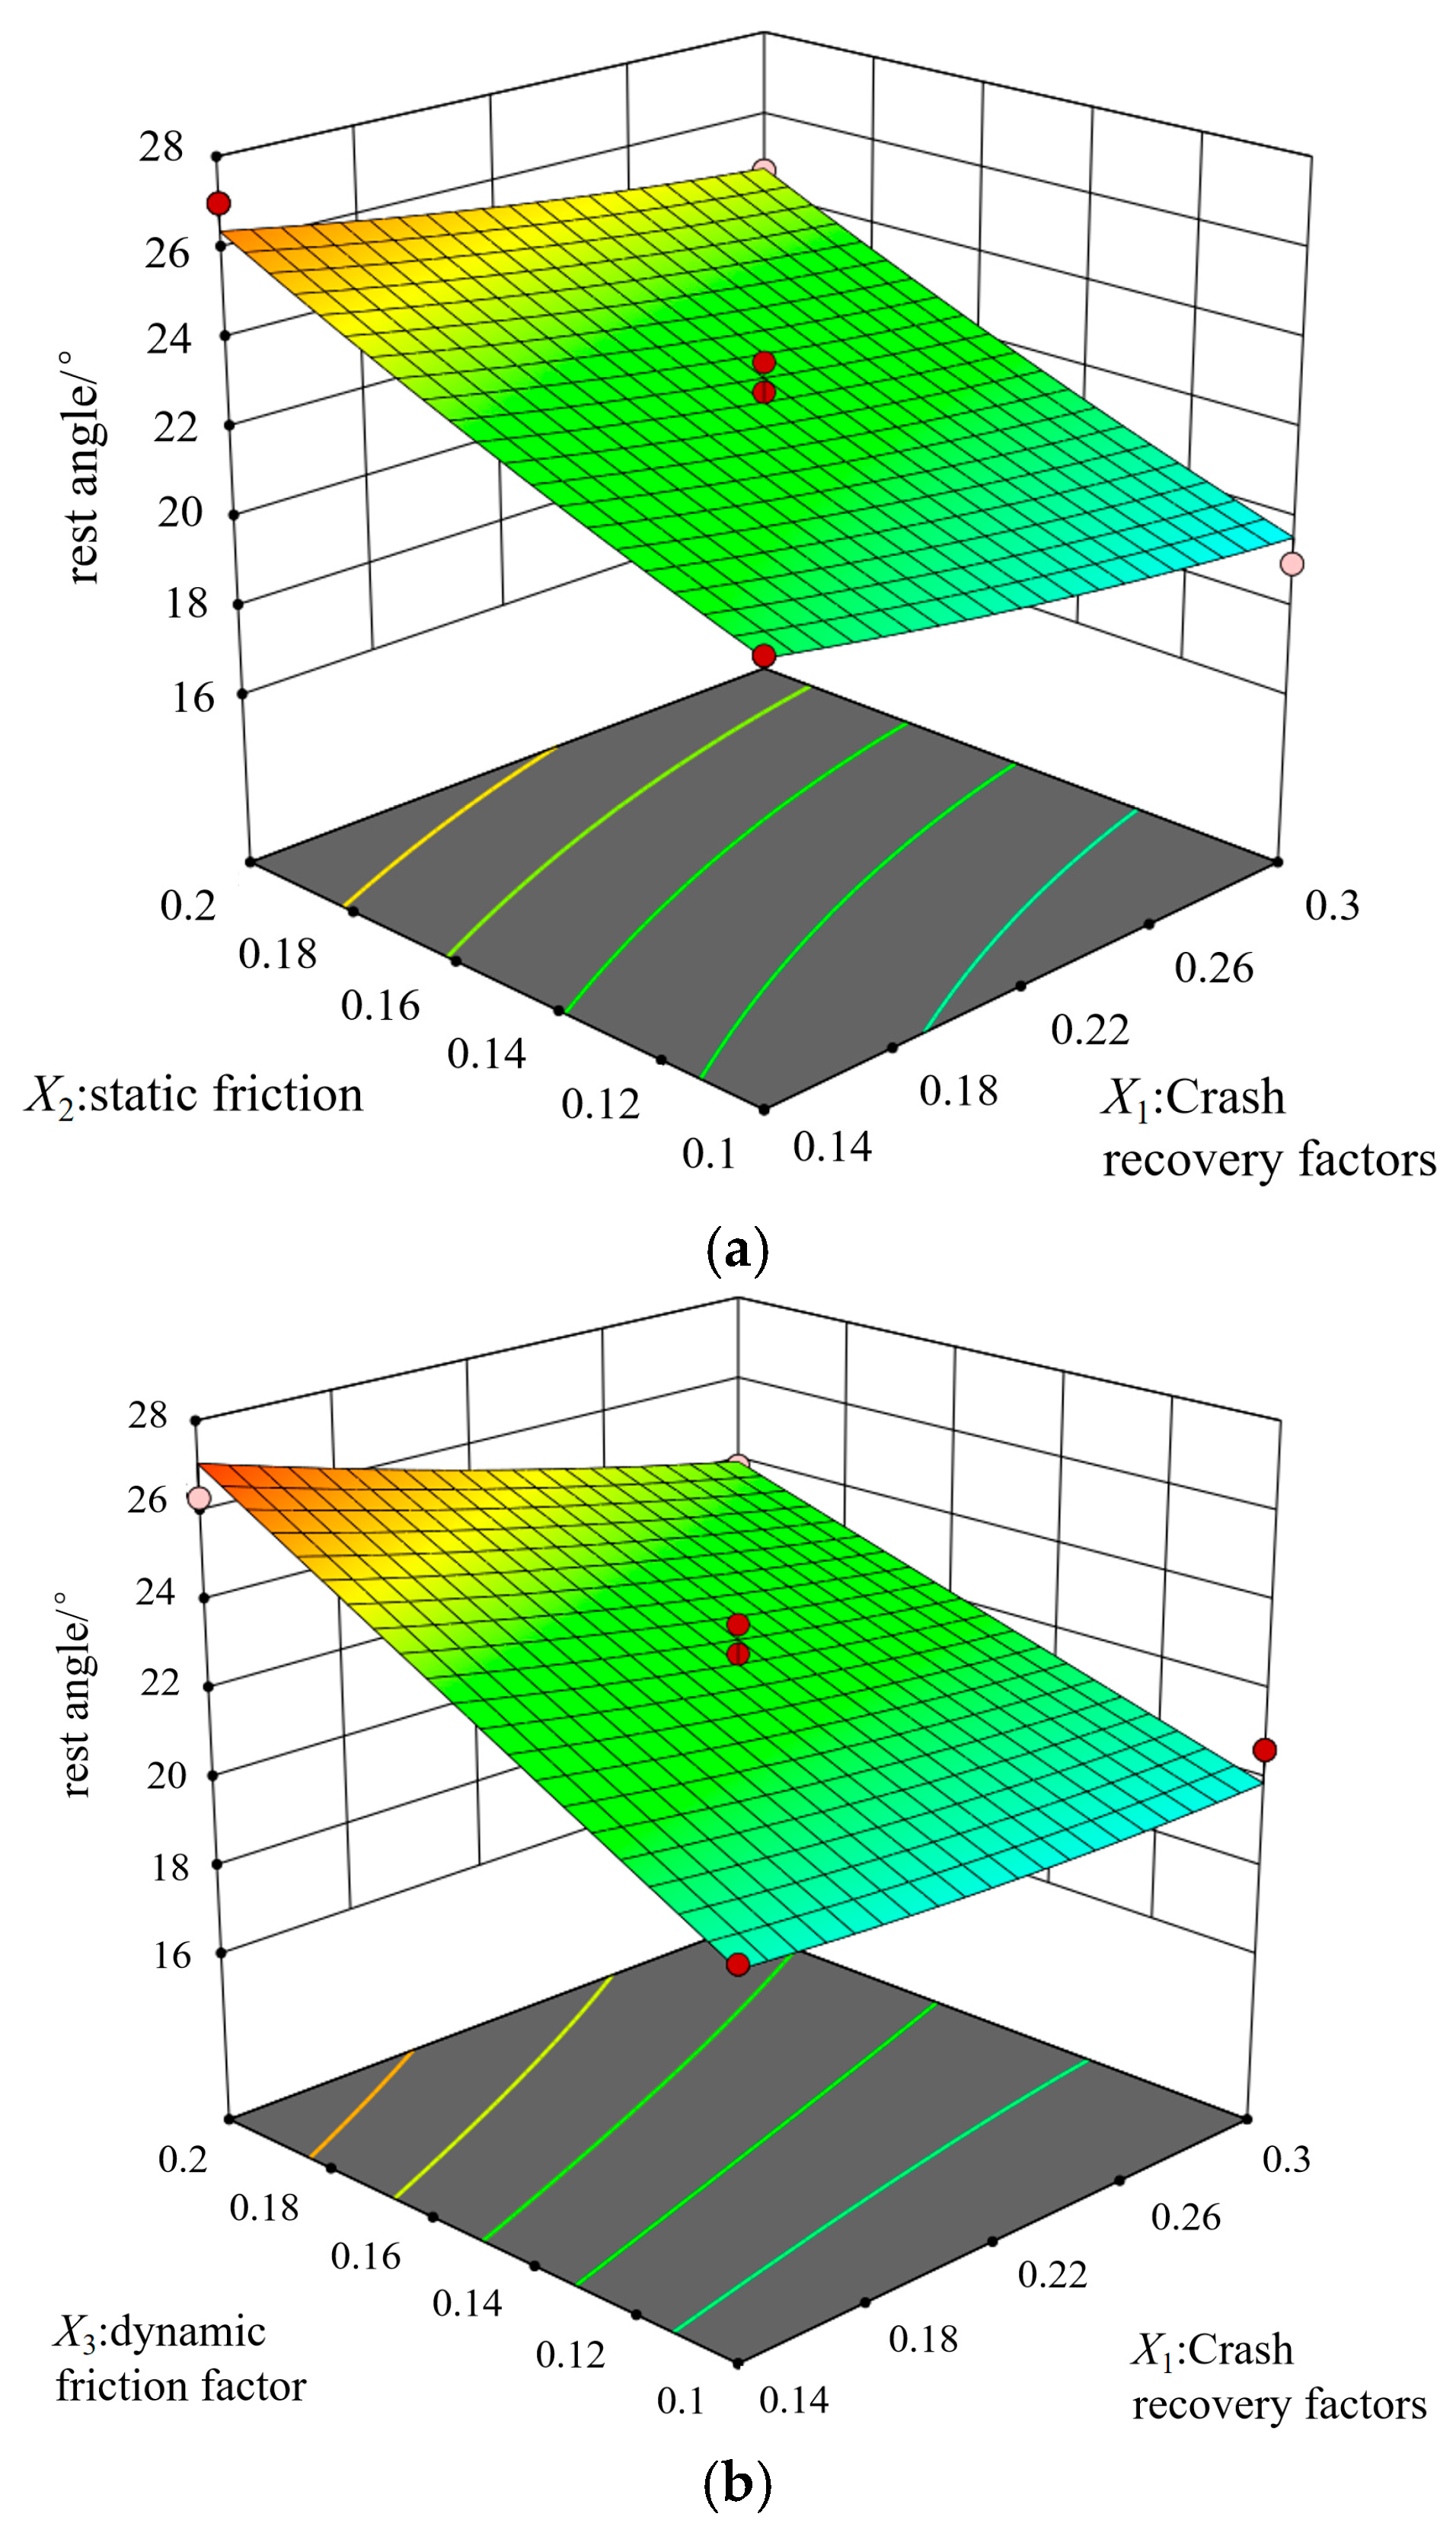
The response surfaces of the interactions between the factors are shown in Figure 8.
As shown in Figure 8a, when the kinetic friction coefficient (X1) between tea particles and the restitution coefficient are held constant, the angle of repose decreases linearly with the decreasing static friction coefficient. Conversely, when the static friction coefficient is kept constant, the angle of repose shows minimal variation with changes in the restitution coefficient.
As shown in Figure 8b, when the static friction coefficient remains at the central level and the restitution coefficient is constant, the angle of repose decreases linearly with the decrease in the kinetic friction coefficient. Conversely, when the kinetic friction coefficient remains constant, the angle of repose remains essentially unchanged with variations in the restitution coefficient. When the restitution coefficient is held constant at the center point, the angle of repose decreases with reductions in both the static and kinetic friction coefficients, indicating a distinct trend, as illustrated in Figure 8.
Based on the parameter optimization function of Design-Expert 13.0 software, this study used the measured angle of repose of tea particles (22.8°) as the optimization target. Through numerical calculations, the optimal parameter combination was obtained: the restitution coefficient between particles is 0.16, the static friction coefficient is 0.14, and the rolling friction coefficient is 0.15. This optimized result is highly consistent with the physical experimental data, indicating that the determined parameter combination can accurately characterize the mechanical properties of tea particles.

4.2. Experimental Verification

Based on the optimized results from the Box–Behnken design, X1 = 0.16, X2 = 0.14, and X3 = 0.15, validation experiments were conducted using the EDEM simulation platform. Five repeated simulations were performed, yielding angles of repose of 22.51°, 22.53°, 23.12°, 21.23°, and 23.12°, with an average value of 22.51°. Compared with the measured value from the physical experiment (22.80°), the relative error was only 1.29%. The comparison results shown in Figure 9 indicate that the simulation results are in good agreement with the physical experiments, validating the reliability of the discrete element parameter calibration method. This error range is within the acceptable limits, demonstrating that the discrete element model of tea particles accurately reflects the mechanical behavior characteristics of the actual particles.

5. Conclusions

We determined the Baihao Yinzhen–steel interface mechanics via inclined-plane, free-fall, and rolling tests; reconstructed a 3D DEM tea particle model using slice scanning and multi-sphere clumping; and calibrated inter-particle contact parameters with steepest-ascent and Box–Behnken designs targeting the angle of repose.
(1) Physical experiments were conducted to measure the contact parameters between the tea samples and the steel plate. The restitution coefficient, static friction coefficient, and rolling friction coefficient between tea leaves and the contact steel plate were measured to be 0.326, 0.546, and 0.133, respectively. Additionally, the angle of repose of the tea particle pile was determined by calculating the average angle between the fitted lines on both sides of the pile contour and the horizontal axis.
(2) By integrating steepest-ascent experiments with the Box–Behnken design, using the angle of repose as the response variable, the optimal set of simulation parameters for tea particles was identified through a combination of discrete element modeling and physical pile testing. The parameter calibration results indicate that X1 = 0.16, X2 = 0.14, and X3 = 0.15.
(3) The EDEM simulation results based on the optimal parameter combination show that the simulated angle of repose for Baihao Yinzhen tea leaves is 22.51°. Compared with the measured value of 22.80°, the relative error is only 1.29%. This validates that the parameter combination can accurately simulate the actual contact characteristics of Baihao Yinzhen tea leaves. This research result provides a reliable parameter basis for the discrete element simulation of tea particles.

Author Contributions

D.Y.: Investigation, Methodology, Software, Validation, Visualization, Writing—original draft. Y.G.: Investigation, Methodology, Validation, Visualization, Writing—original draft. Y.Q.: Formal analysis, Validation, Visualization, Writing—review and editing. H.W. (Hao Wang): Formal analysis, Visualization, Writing—review and editing. R.W.: Validation, Visualization, Writing—review and editing. H.W. (Haiyong Weng): Formal analysis, Project administration, Supervision, Visualization, Writing—review and editing. All authors have read and agreed to the published version of the manuscript.

Funding

This research was funded by the project under grant nos. 69914001004.

Data Availability Statement

Data will be made available on request.

Conflicts of Interest

The authors declare no conflicts of interest.

References

  1. Chen, Q.C.; Shi, J.; Mu, B.; Chen, Z.; Dai, W.; Lin, Z. Metabolomics combined with proteomics provides a novel interpretation of the changes in nonvolatile compounds during white tea processing. Food Chem. 2020, 332, 127412. [Google Scholar] [CrossRef]
  2. Czernicka, M.; Zagula, G.; Bajcar, M.; Saletnik, B.; Puchalski, C. Study of nutritional value of dried tea leaves and infusions of black, green and white teas from Chinese plantations. Rocz. Państwowego Zakładu Hig. 2017, 68, 237–245. [Google Scholar]
  3. Guo, A.; Feng, H.; Jing, P.; Lan, Y.; Cao, X. White tea: A review on composition characteristics, extraction techniques, and application potentials. J. Tea Sci. Res. 2024, 14, 19–43. [Google Scholar] [CrossRef]
  4. Zhou, C.Z.; Zhu, C.; Li, X.; Chen, L.; Xie, S.-Y.; Chen, G.-W.; Zhang, H.; Lai, Z.-X.; Lin, Y.-L.; Guo, Y.-Q. Transcriptome and phytochemical analyses reveal the roles of characteristic metabolites in the taste formation of white tea during the withering process. J. Integr. Agric. 2022, 21, 862–877. [Google Scholar] [CrossRef]
  5. Hong, Y.; Wang, J.; Ye, M.; Wu, G. Development of a fully automatic tea bag packaging machine based on neural network algorithms. In Proceedings of the 2024 8th International Conference on Electrical, Mechanical and Computer Engineering (ICEMCE), Xi’an, China, 25–27 October 2024; pp. 1136–1140. [Google Scholar]
  6. Wanniarachchi, D.N.; Punchihewa, H.K.G.; Gunawardhana, S.D.; Ranaweera, R.K.P.S.; Gawarammana, M.B.M.L.B.; Mangala, K.H.J. Development of a Bulk Tea Packaging System. In Proceedings of the 2020 from Innovation to Impact (FITI), Colombo, Sri Lanka, 15 December 2020; Volume 1, pp. 1–6. [Google Scholar]
  7. Ren, N.; Yu, G.; Zheng, H.; Chen, Z. Parameter calibration of tea garden soil based on discrete element method. Acta Agric. Zhejiangensis 2025, 37, 1353–1359. (In Chinese) [Google Scholar]
  8. Li, F.; Wang, P.; Wang, Y.; Ge, Y.F.; Tang, K.Y.; Li, D.Z. Calibration of Discrete Element Parameters of Corn Coated Seeds Based on Stacking Test. J. Agric. Sci. Technol. 2022, 24, 97–107, (In Chinese with English Abstract). [Google Scholar]
  9. Li, H.; Wangm, J.; Yuan, J.; Yin, W.; Wang, Z.; Qian, Y. Analysis of threshed rice mixture separation through vibration screen using discrete element method. Int. J. Agric. Biol. Eng. 2017, 10, 231–239. [Google Scholar] [CrossRef]
  10. Ye, D.; Lin, Z.; Qing, J.; Gao, Y.; Wu, Y.; Xie, L. Discrete element parameter calibration of soil-transplanting soil-touching parts of fungus under typical moisture content. J. Chin. Agric. Mech. 2025, 46, 279–286+294. (In Chinese) [Google Scholar]
  11. Liu, H.; Zhang, W.; Ji, Y.; Qi, B.; Li, K. Parameter calibration of soil particles in annual rice wheat region based on diserete element method. J. Chin. Agric. Mech. 2020, 41, 153–159. (In Chinese) [Google Scholar]
  12. Lai, Z.; Chen, Q.; Huang, L. Machine⁃learning⁃enabled discrete element method: Contact detection and resolution of irregular⁃shaped particles. Int. J. Numer. Anal. Methods Geomech. 2022, 46, 113–140. [Google Scholar] [CrossRef]
  13. Guo, W. Simulation Study of Sugarcane Havester Impurity Removal Based on CFD-DEM. Master’s Thesis, Guangxi University, Nanning, China, 2019. (In Chinese). [Google Scholar]
  14. Hu, X. Development of CFD-DEM-Based Wind Sorting Device for Wolfberry Picking Platform. Master’s Thesis, Ningxia University, Yinchuan, China, 2024. (In Chinese). [Google Scholar]
  15. Zang, X.; Zhu, X. Simulation and experiment on the falling pattern of fresh tea leaves based on discrete elements. HortScience 2023, 58, 1057–1067. [Google Scholar] [CrossRef]
  16. Mu, G.; Qi, X.; Zhang, W.; Lv, Z.; Zhang, T.; Wang, S.; Wang, G. Parameter measurement andcalibration in discrete element simulation of broken sweet potato seedlings (Wang Gongpu translator). J. Chin. Agric. Mech. 2021, 42, 72–79. (In Chinese) [Google Scholar]
  17. Qin, K.; Bu, K.; Shen, Z.; Cao, C.; Ge, J.; Fang, L. Tea Leaf Barber Optimization Design and Experiment of Continuous Compound. Trans. Chin. Soc. Agric. Mach. 2023, 54, 382–393. (In Chinese) [Google Scholar]
  18. Jin, H.; Jiang, M.; Xu, C.; Shen, K.; Pan, F.D.; Fan, H.; Jiao, K.X. Modeling and Simulation Parameters Calibration of Flexible Tobacco Strips Based on Discrete Element. J. Shenyang Agric. Univ. 2023, 54, 563–571. (In Chinese) [Google Scholar]
  19. Li, T.; Wang, Z.; Zhai, G.; Tian, F.; Xing, K. Establishment and Parameter Calibration of Discrete Element Model of Alfalfa Plant. Trans. Chin. Soc. Agric. Mach. 2024, 55, 187–199. (In Chinese) [Google Scholar]
  20. Al-Hashemi, H.M.B.; Al-Amoudi, O.S.B. A review on the angle of repose of granular materials. Powder Technol. 2018, 330, 397–417. [Google Scholar] [CrossRef]
  21. Hu, D.; Yan, J.; Zhang, Z.; Huang, X.; Niu, S.; Hu, Z. Simulation parameters calibration of needle-shaped tea based on pile-up test. J. Chin. Agric. Mech. 2024, 45, 66–73. (In Chinese) [Google Scholar]
  22. Liu, C.; Wang, Y.; Song, J.; Li, Y.; Ma, T. Experiment and diserete element model of rice seed based on 3D laser scanning. Trans. Chin. Soc. Agric. Eng. (Trans. CSAE) 2016, 32, 294–300, (In Chinese with English Abstract). [Google Scholar]
  23. Gong, F.; Hu, M.; Bao, A.; Li, D.; Gao, T.; Wang, C. Parameter calibration and significance analysis of rice straw based on Hertz-Mindlin model. J. Southwest Univ. Nat. Sci. Ed. 2022, 44, 186–196. [Google Scholar]
  24. Zhang, Z.; Xu, H.; Xue, H.; Ni, C.; Wang, C. Calibration and Experiment of Discrete Element Parameters of Panax notoginseng Stem. Trans. Chin. Soc. Agric. Mach. 2023, 54, 61–70+91. (In Chinese) [Google Scholar]
  25. Wu, H.; Gu, X.; Hu, J.; Zhou, Q. DEM simulation of small strain and large strain behaviors of granular soils with a coherent contact model. Granul. Matter 2022, 24, 125. [Google Scholar] [CrossRef]
  26. Dun, G.Q.; Gao, Z.Y.; Liu, Y.X.; Ji, W.; Mao, N.; Wu, X.; Liu, W. Optimization design of fertilizer apparatus owned arc gears based on discrete element method. Int. J. Agric. Biol. Eng. 2021, 14, 97–105. [Google Scholar] [CrossRef]
  27. Lyu, H.W.; Wu, C.Y.; Tu, Z.; Chen, J.N.; Jia, J.M.; Chen, Z.W.; Ye, Y. EDEM-based Optimization of Classification Parameters of Machine-picked Tea Fresh Leaf Vibratory Classifier. J. Tea Sci. 2022, 42, 120–130. (In Chinese) [Google Scholar]
  28. Li, B.; Li, W.; Bai, X.; Huang, J.H. Parameter Optimization and Experimental Study of Tea Twisting Machine Based on EDEM. J. Tea Sci. 2022, 42, 120–130. (In Chinese) [Google Scholar]
  29. Zhang, K.; Wang, W.; Zhao, X.; Lyu, X. Design and Experiment of Drum-type Hot Air Re-dryer for Tea. Trans. Chin. Soc. Agric. Mach. 2020, 51, 377–386. (In Chinese) [Google Scholar]
  30. Li, W.; Bai, X.; Li, B. Optimization of structural parameters of drum type tea re-dryer. Acta Agric. Zhejiangensis 2020, 32, 348–358. (In Chinese) [Google Scholar]
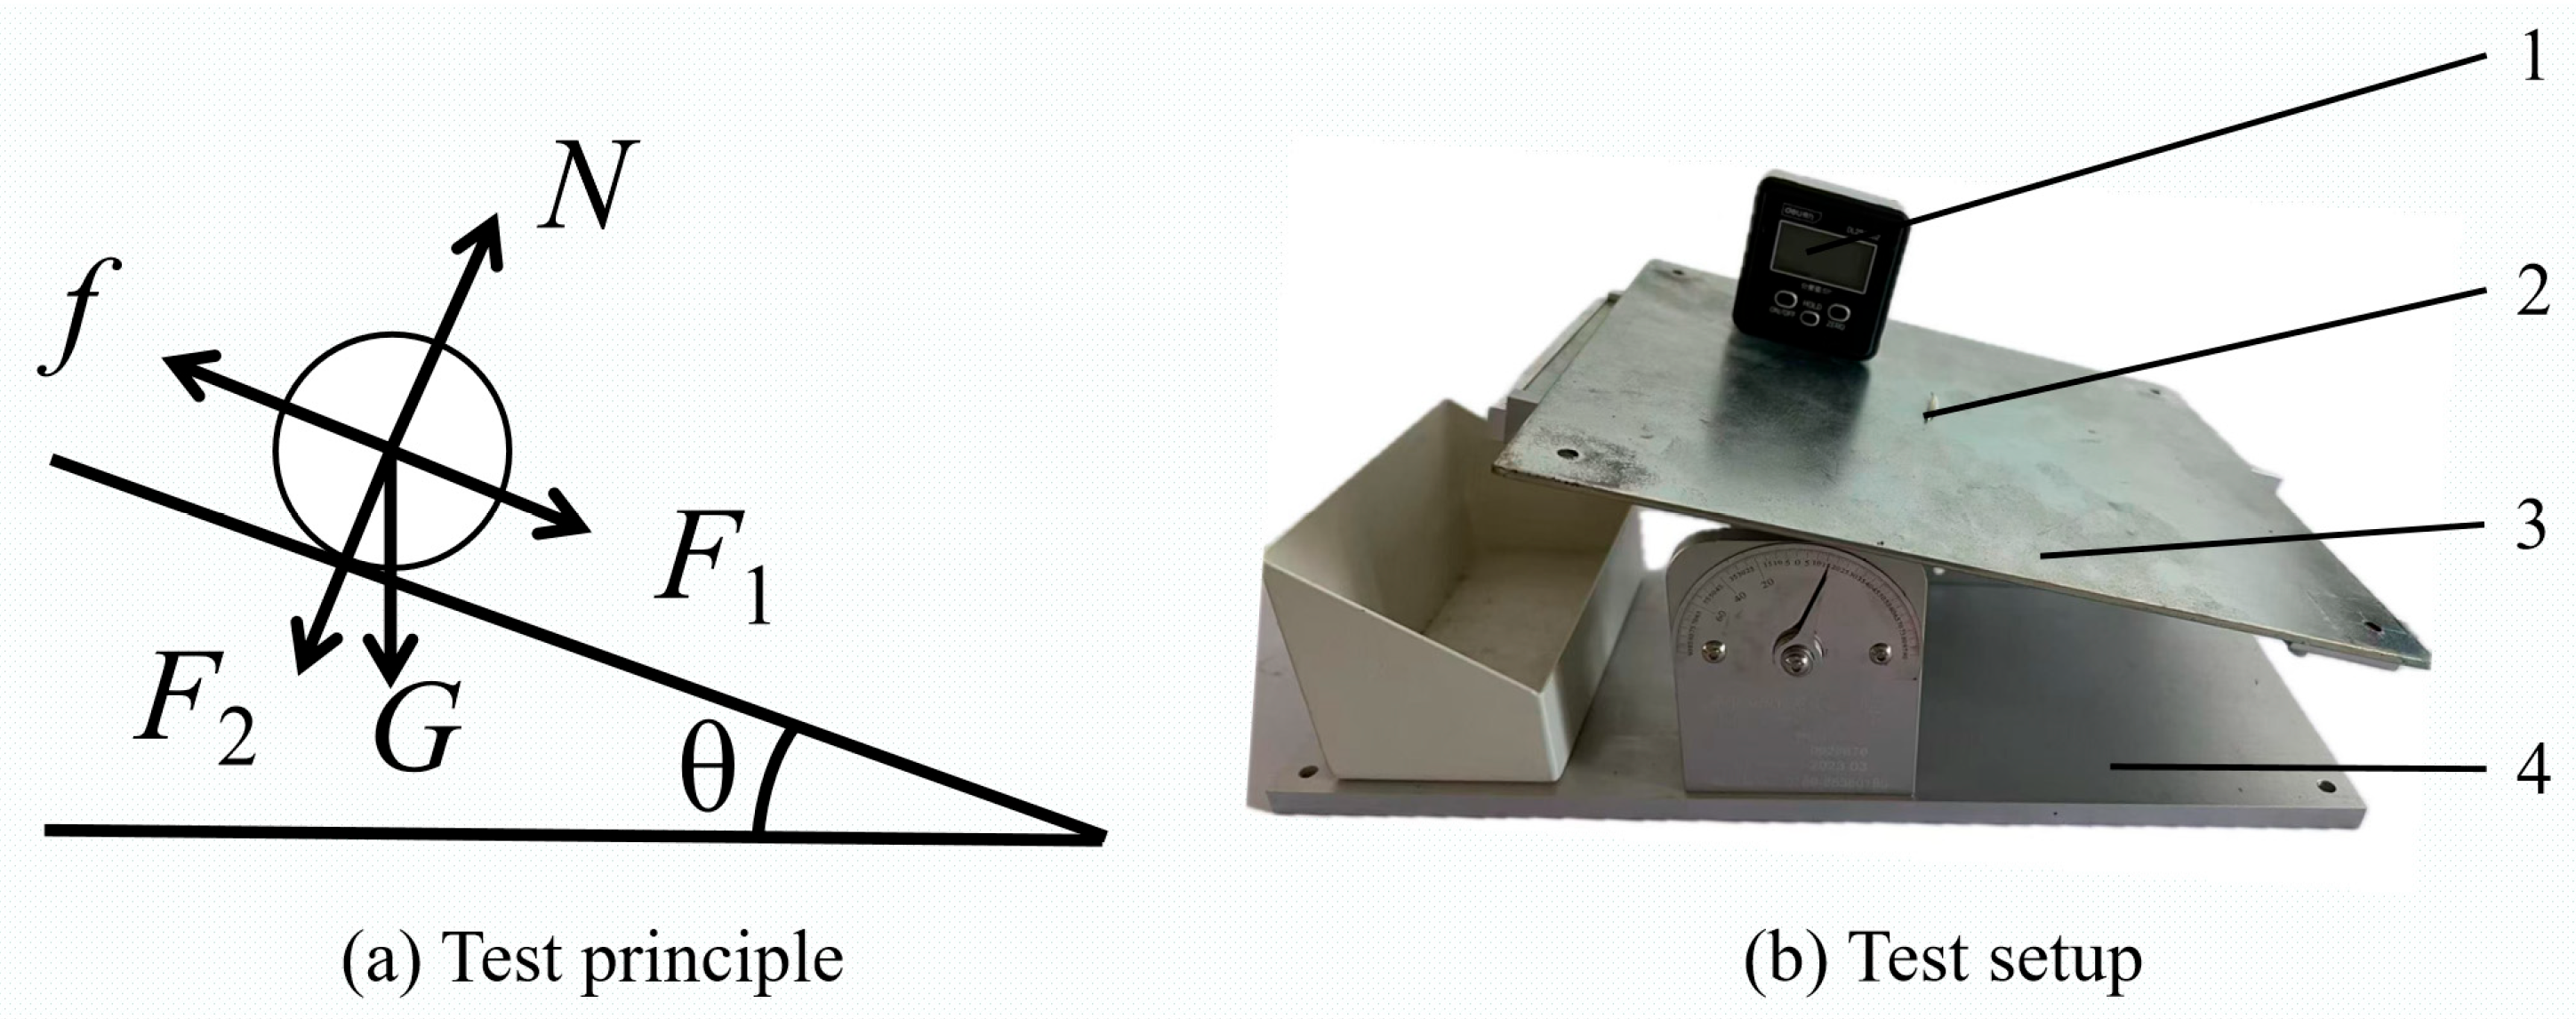
Figure 1. Particle-surface static friction measurement tester. 1. Digital angle display instrument. 2. Tea sample. 3. Contact steel plate. 4. Lifting platform. Note: All forces shown in the figure act on the tea particles; the reaction forces exerted by the steel plate are not depicted, consistent with Newton’s third law.
Agronomy 15 01909 g001
Figure 2. Experiment testing material collision elastic recovery characteristics. 1. Air pump. 2. Clamp. 3. Scale paper. 4. Contact steel plate.
Agronomy 15 01909 g002
Figure 3. Test platform of rolling friction coefficient. 1. Elevating platform. 2. Digital angle gauge. 3. Inclined steel plate. 4. Level steel plate.
Agronomy 15 01909 g003
Figure 4. Physical test of the angle of repose of tea particles. 1. Cylindrical measuring cylinder; 2. tea resting angle.
Agronomy 15 01909 g004
Figure 5. The treatment process of the angle of repose.
Agronomy 15 01909 g005
Figure 6. Discrete elemental geometric characterization model for tea. A—width; B—length; C—thickness.
Agronomy 15 01909 g006
Figure 7. Simulation experiment of tea stacking angle.
Agronomy 15 01909 g007
Figure 8. Response surface analysis. (a) The influence of the static friction factor and collision recovery factor on the angle of repose. (b) The influence of dynamic friction factors and collision recovery factors on the angle of repose. (c) The effects of dynamic friction and static friction on the angle of repose.
Agronomy 15 01909 g008aAgronomy 15 01909 g008b
Figure 9. Comparison of simulation test and physical test.
Agronomy 15 01909 g009
Table 1. Determination of geometric profile parameters of tea particles.
Cross-Sectional PositionAverage Width/mmAverage Thickness/mm
11.351.41
21.131.13
31.570.79
41.351.15
51.251.51
61.120.89
71.681.65
81.881.65
91.881.15
101.880.98
111.881.65
121.781.43
131.691.36
141.351.46
150.981.47
Table 2. Simulation parameters related to white tea.
Maximum ValueMinimum Value Average ValueStandard DeviationCoefficient of Variation
e: the collision recovery coefficient e between the tea leaves and the steel plate0.4500.2260.3260.040.09
Tea leaves—static friction coefficient in contact with steel plate0.6740.4560.5460.070.09
Tea leaves—rolling friction coefficient of contact steel plates0.2230.0560.1330.000140.076
Table 3. Design and results of climbing test.
Serial NumberX1X2X3Angle of Repose/°Relative Error/%
10.060.050.0510.4554.16
20.140.100.1018.5618.59
30.220.150.1523.352.41
40.300.200.2029.5129.42
50.380.250.2533.1445.35
Table 4. Design and results of Box–Behnken test.
Serial NumberX1X2X3Angle of Repose/°
10.140.100.1521.45
20.300.100.1519.01
30.140.200.1527.00
40.300.200.1524.67
50.140.150.1020.45
60.300.150.1020.71
70.140.150.2026.32
80.300.150.2023.90
90.220.200.1016.95
100.220.200.1022.51
110.220.100.2024.27
120.220.200.2027.72
130.220.150.1522.40
140.220.150.1522.34
150.220.150.1522.11
160.220.150.1522.88
170.220.150.1523.54
Table 5. Model analysis of variance.
Source of Variance Sum of Squares Degrees of Freedom Mean SquareF-Valuep-Value
model118.61913.1821.670.0003
X16.0016.009.870.0163 *
X251.11151.1184.04<0.01 **
X358.27158.2795.82<0.01 **
X1X20.003010.00300.00500.9457
X1X31.8011.802.950.1294
X2X31.1111.111.830.2182
X120.137210.13720.22560.6493
X220.165110.16510.27140.6184
X320.000510.00050.00080.9787
residual4.2670.6081
missing item2.9630.98723.050.1548
error1.3040.3238
total122.8716
Note: * and ** indicate statistical significance at the p < 0.05 and p < 0.01 levels, respectively.
Disclaimer/Publisher’s Note: The statements, opinions and data contained in all publications are solely those of the individual author(s) and contributor(s) and not of MDPI and/or the editor(s). MDPI and/or the editor(s) disclaim responsibility for any injury to people or property resulting from any ideas, methods, instructions or products referred to in the content.