Article

Elevational Patterns and Seasonal Dynamics of Soil Organic Carbon Fractions and Content in Rice Paddies of Yuanyang Terrace, Southwest China

College of Resources and Environment, Yunnan Agricultural University, Kunming 650201, China
*
Author to whom correspondence should be addressed.
These authors contributed equally to this work.
Agronomy 2025, 15(8), 1868; https://doi.org/10.3390/agronomy15081868
Submission received: 12 July 2025 / Revised: 28 July 2025 / Accepted: 30 July 2025 / Published: 1 August 2025
(This article belongs to the Section Soil and Plant Nutrition)

Abstract

Soil organic carbon (SOC) is an important part of the global C pool and is sensitive to climate change. The SOC content and fractions of rice paddies along four elevations (250, 1150, 1600 and 1800 m) on the same slope in four seasons (spring, summer, autumn and winter) at Yuanyang Terrace in southwest China were investigated, and their relationship with environmental factors was analyzed. The contents of SOC, unprotected SOC (uPOM), physically protected SOC (pPOM) and biochemically protected SOC (bcPOM) in rice paddies at a low elevation (250 m), were significantly lower by 49–51% than those at relatively high elevations (1600 m and 1800 m). Among the SOC fractions, the highest proportion (33–50%) was uPOM, followed by pPOM and bcPOM (accounting for 17–40%), and the lowest proportion was chemically protected SOC (cPOM). In addition, there were interseasonal differences among the contents of SOC fractions, with a significantly higher content of SOC, uPOM and pPOM at an elevation of 1600 m in summer than in the other three seasons, whereas the cPOM content at an elevation of 250 m in spring was significantly higher than in the other three higher elevations. According to the redundancy analysis (RDA), total nitrogen was the key environmental factor, with an explanatory degree of 56% affecting the contents of SOC and its fractions. Thus, the SOC content increased with increasing elevation, and physical and biochemical protection were potential stabilization mechanisms responsible for their stability in the rice paddy of Yuanyang Terrace. These results provides empirical evidence for the elevational distribution patterns and seasonal dynamics of SOC fractions in rice paddies across Yuanyang Terrace. These findings highlight the importance of physical and biochemical protection mechanisms in stabilizing SOC in rice paddies, which could enhance long-term C sequestration and contribute to climate change mitigation in terraced agroecosystems.

1. Introduction

The Sixth Assessment Report of the United Nations Intergovernmental Panel on Climate Change (IPCC) states that the Earth’s climate is warming at an unprecedented rate, with the current global average surface temperature approximately 1 °C above the preindustrial level and with the global temperature rise projected to reach or exceed 1.5 °C in the next 20 years [1]. To combat global warming, the IPCC’s Fourth Assessment Report has made it clear that agriculture’s nearly 90% share of emissions reductions can be achieved through soil C sequestration [2].
Soil is the largest organic carbon (OC) pool in the Earth’s terrestrial ecosystem [3]. Rice paddy soil is an important OC pool in agroecosystems, with a total global rice cultivation area of 180 million hm2, of which up to 90% is in Asia and 18.5% in China [4]. Soil organic carbon (SOC) in rice paddies is highly sensitive to global and regional environmental changes. Even minor fluctuations in SOC content may significantly influence atmospheric CO2 concentrations, with potential negative impacts on climate change [5]. Increasing the content and stability of SOC in rice paddies has become an important way to mitigate the pressure of global climate change [6]. SOC in rice paddies consists of different fractions with different functions and stabilities. In-depth study of the changes in SOC fractions in rice fields, their response to global climate change, and their potential stabilization mechanisms has become one of the key issues in current C cycle research. The stability of different SOC fractions varies substantially. A scientifically robust fractionation method can provide deeper insights into SOC dynamics and enhance C sequestration potential by distinguishing these stabilization mechanisms [7]. SOC studies have mainly used physical and chemical grouping methods, most of which focus on one or a few of the physical or chemical fractions, which were not sufficiently associated with the SOC potential stabilization mechanisms. To better explain the dynamics of SOC sequestration, the conceptual model of SOC stabilization indicates that there are many potential stabilization mechanisms, such as unprotected, physically protected, chemically protected and biochemically protected mechanisms [8]. Accordingly, Stewart et al. [9,10] proposed a combined physical-chemical grouping method for SOC, which is a more complete study of OC in the unprotected free state, physically protected, chemically protected and biochemically protected fractions and is helpful to understand the potential stabilization mechanisms of various SOC fractions more comprehensively [11]. Physically protected SOC, also called spatial inaccessibility, refers to the isolation of organic C substrates from decomposers and enzymes due to the occlusion of soil aggregates. The chemically protected SOC is the mutual adsorption of organic matter and mineral particles to form an organic-mineral complex, and the biochemically protected SOC is the intrinsic resistance to decomposition of chemical molecular properties, which is important for maintaining the stability of organic matter [12,13]. Soil C stabilization is influenced by a variety of factors, and elevation is an important factor affecting SOC content [14]. Elevation changes cause gradient effects of various environmental factors, such as temperature, humidity and light, and under the interaction among these factors, soil physical and chemical properties are changed, and SOC fractions are altered accordingly [15]. Relatively low temperatures at high elevations favor the formation of mineral surfaces that stabilize SOC and often lower soil pH, leading to reduced solubility and decomposition of organic matter. Therefore, studying the SOC fractions of rice paddies and their interactions with other environmental factors in the soil can help to reveal the SOC fraction distribution and its potential stabilization mechanisms. In addition, soil C pools and their C patterns vary with season, and climatic factors influence the seasonal dynamics of SOC by affecting vegetation growth and development and microbial activity, which determines the soil C balance in rice paddies [16]. Most of the existing studies have focused on the effects of single-factor elevation [17,18] or season [19,20] on OC fractions, which cannot fully reveal SOC fractions and interseasonal differences along the elevation gradient in rice paddies, and their distributions and patterns are still unclear.
The Yuanyang Terrace has a rice cultivation history of more than 1500 years, has been selected as a globally important agricultural cultural heritage and world heritage site and is distributed on gentle slopes with an elevation of 217–2388 m [21]. The Yuanyang Terrace has obvious gradients of environmental changes, covering rice cropping patterns along elevation gradients on the Yunnan Plateau and is an excellent, natural experimental site to study the SOC pools of rice paddies along elevation gradients on the Yunnan Plateau [22]. Therefore, in this study, we took rice paddy soil along the elevation gradient on the same slope of the Yuanyang Terrace in Yunnan Province as the research object and focused on the changes in SOC fractions along the elevation through the combined physical-chemical grouping method. We hypothesize that different fractions of SOC increase with altitude, which is closely related to soil environmental factors. The research results provide a scientific basis for the soil C sink and C sequestration potential of rice paddies on the Yunnan Plateau and enrich the understanding of the changing laws of agricultural SOC in China.

2. Materials and Methods

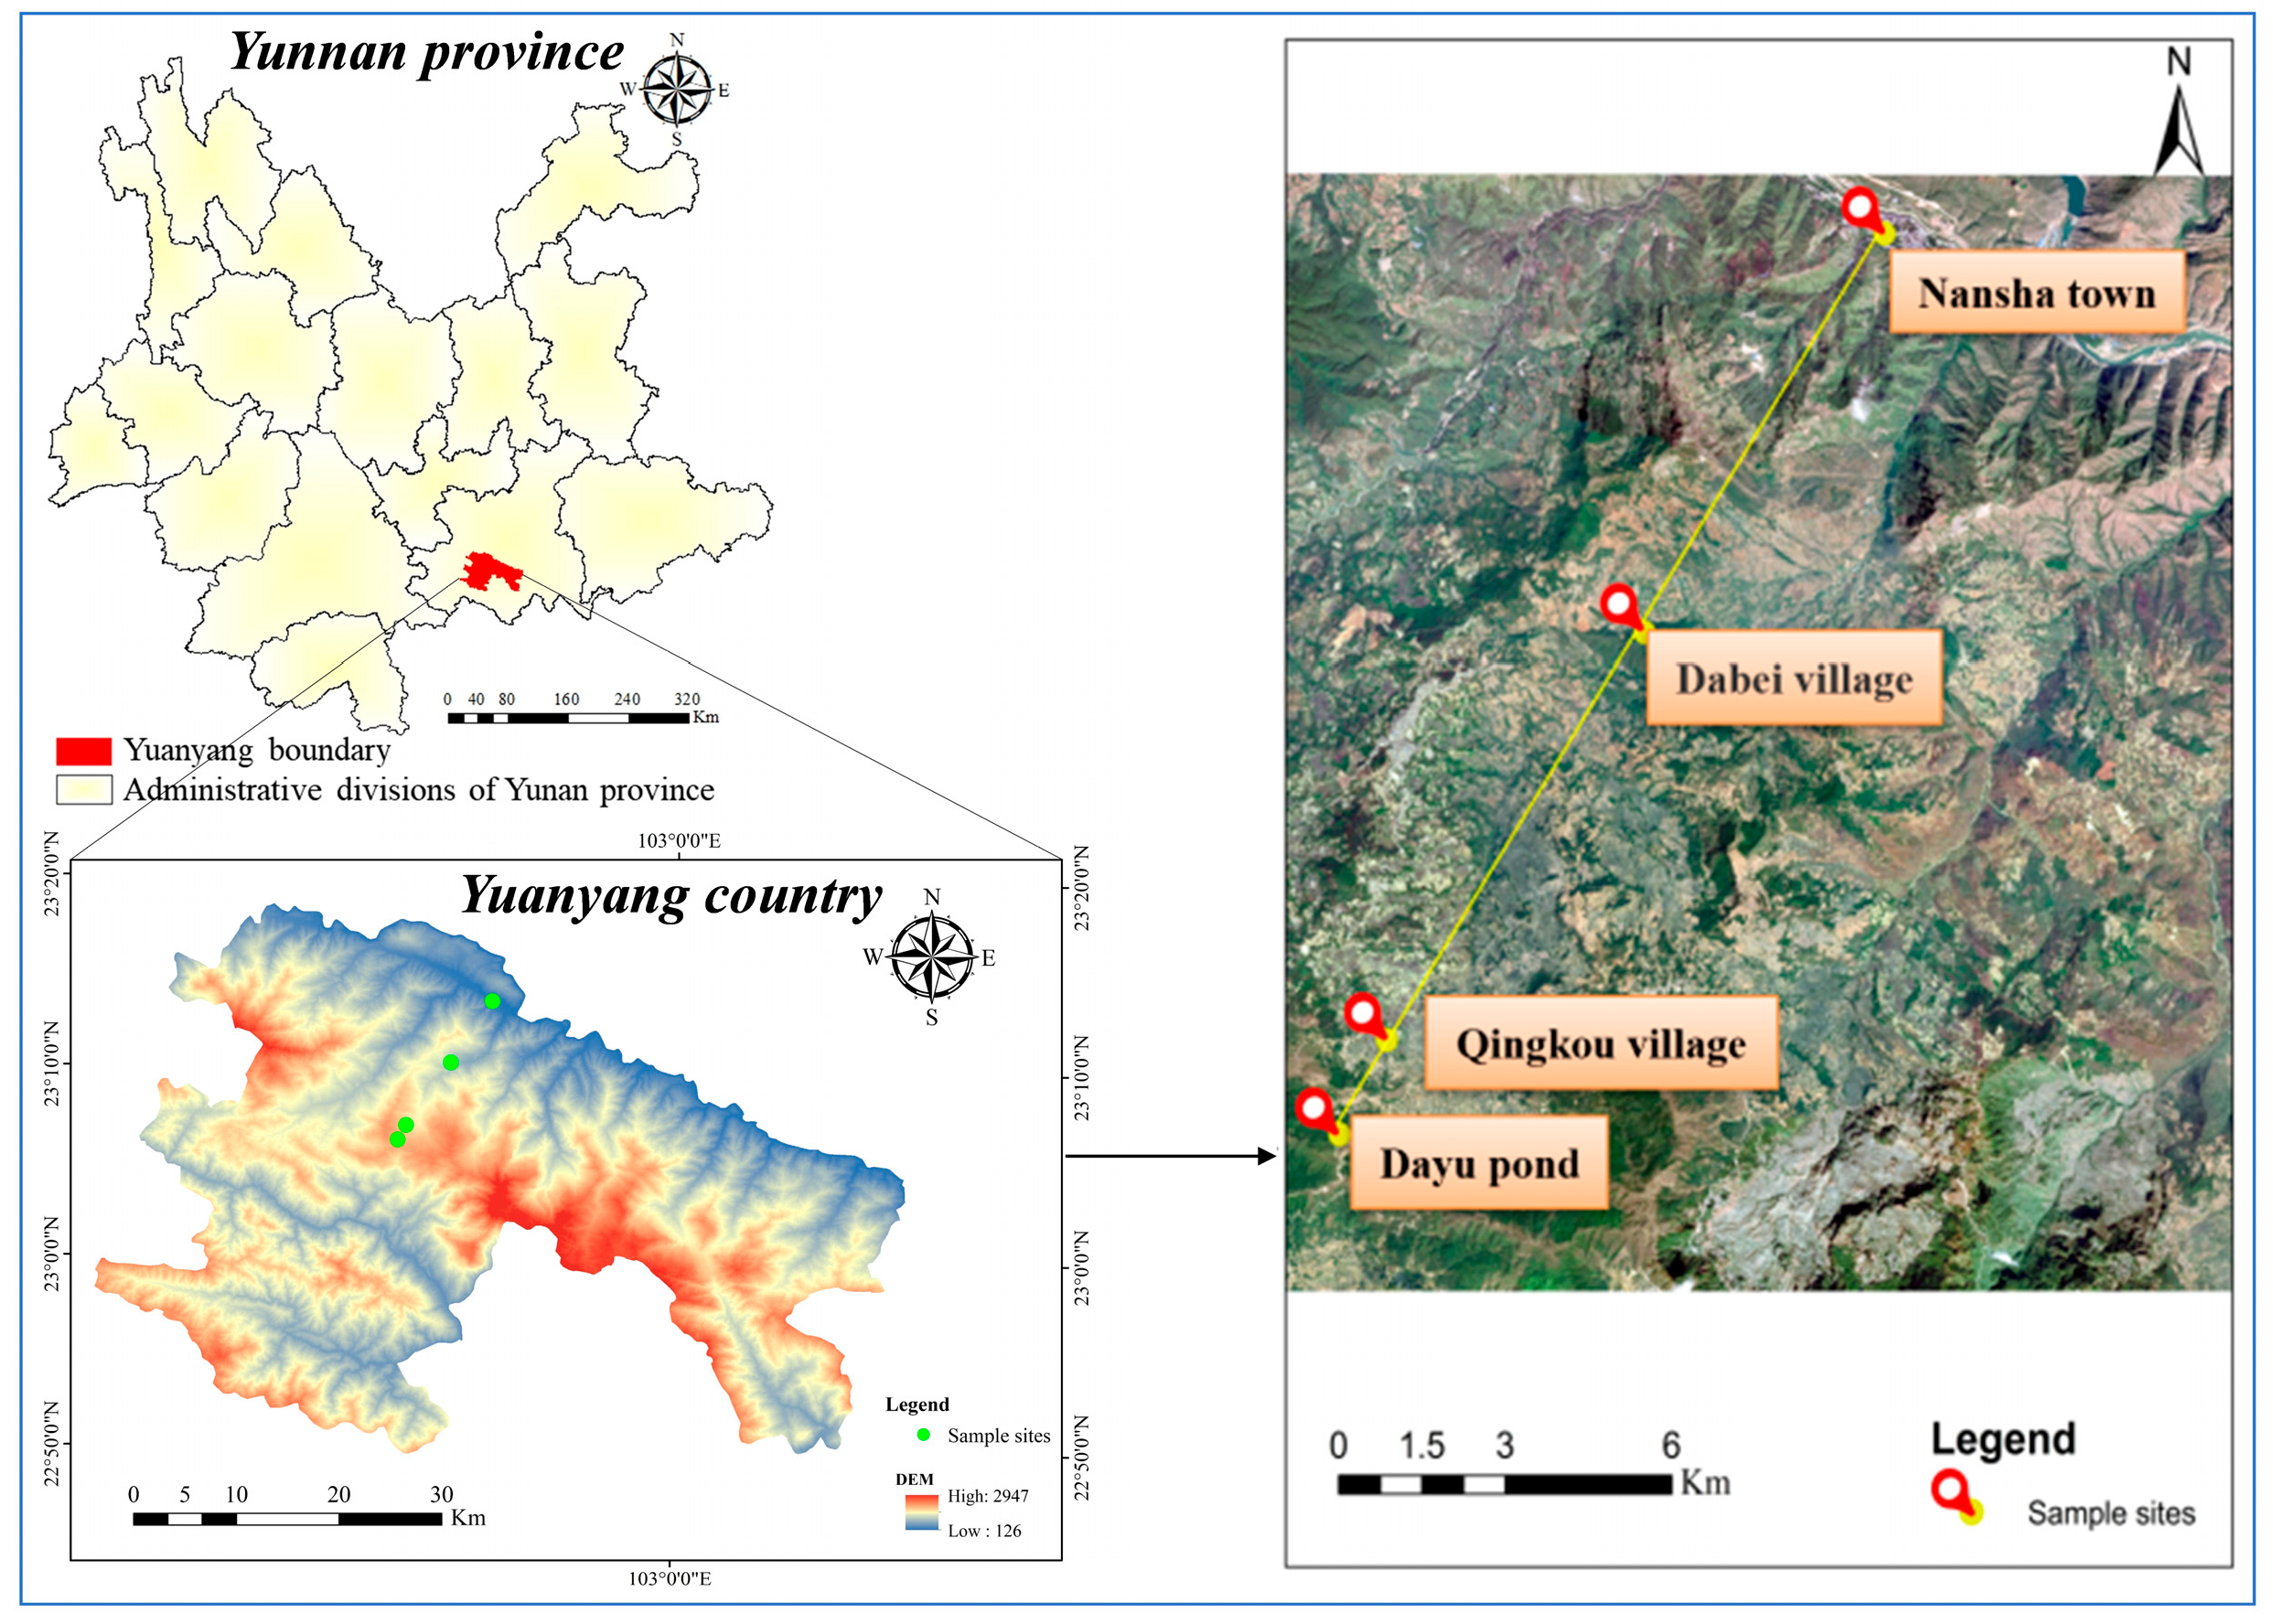
2.1. Summary of the Study Area

The Yuanyang Terraces are located in Yuanyang County, Honghe Prefecture, Yunnan Province in southwest China (22°49′~23°19′ N, 102°27′~103°13′ E), and in 2016, 478 km2 of terraces were distributed in Yuanyang County, which accounted for 23% of the national land area, and up to 3000 rice paddies were formed along the elevation gradient on gently sloping high mountain slopes at an elevation of 144–2500 m, with obvious vertical variation characteristics along the elevation gradient [23]. The region is located south of the Tropic of Cancer and has a subtropical mountain monsoon climate with distinct dry and wet seasons and is foggy and rainy, with an annual rainfall of 1397.6 mm, which is mainly concentrated in May–October, accounting for 78% of the annual precipitation. The average annual temperature in Yuanyang County is 20.5 °C, the extreme maximum temperature is 37.5 °C, the extreme minimum temperature is 0.6 °C, the annual sunshine duration is 1820.8 h, and the annual evaporation is 1184.1 mm [24]. At a very short spatial distance on the same slope of the Yuanyang Terrace, the cultivation patterns of double-season indica rice (elevation < 1000 m), single-season indica rice (elevation 1000–1500 m), indica-japonica rice interspersed (elevation 1500–1700 m), and single-season japonica rice (elevation > 1700 m) are presented along the elevation gradient, which can well represent rice cultivation at different elevations in the Yunnan Plateau. After fieldwork, we selected a terraced rice paddy at the same slope elevation of 250 m (Nansha Town, double-season indica rice), 1150 m (Dabei Village, single-season indica rice), 1600 m (Qingkou Village, indica-japonica rice interspersed) and 1800 m (Dayu pond, single-season japonica rice) (Figure 1), which represented the rice cropping areas of different elevation gradients in the Yunnan Plateau.

2.2. Soil Sample Collection

The sampling frequency of soil samples is once a quarter, and the sampling times were January (winter), April (spring), July (summer) and October (autumn) in 2022. Surface (0–20 cm) rice paddy soil samples were collected along four elevations (250 m, 1150 m, 1600 m and 1800 m) ± 50 m above sea level. The sampling method was based on the “S” shape to select five points. Each soil sample was a mixture of five sampling points, removing the plant and animal debris and gravel into self-sealing bags, standardized fill in the label and sealing. There were 10 fields at each elevation, one mixed sample was collected from each field, and 40 samples were collected in each period, totaling 160 samples. GPS (MagellanExplorist 610, MiTAC Digital Corporation, Taiwan, China) was used to record the elevation, latitude, longitude, slope and slope direction of each plot and to investigate and record the growth of rice in the plot.

2.3. Laboratory Analysis

2.3.1. Determination of Soil Physical and Chemical Properties

Before soil sampling, the temperature of the surface (0–20 cm) soil was measured by using a probe-type ground thermometer (Sdf-65, Xidebao, Huizhou, China). Fresh soil samples were dried in an oven at 105 °C to determine the soil moisture content. Soil pH was measured by using a pH meter (soil:water ratio 1:2.5) (ST5000, OHAUS, Parsippany, NJ, USA). Soil conductivity was measured by using a conductivity meter (soil:water ratio 1:5) (Leici, PHS-3C, Shanghai, China). Soil total nitrogen was determined by the Kjeldahl method with concentrated sulfuric acid digestion (SKD-250, Shanghai Peiou Analytical Instrument Co., Ltd., Shanghai, China) [25].

2.3.2. Soil OC Grouping and Determination

Grouping of SOC was performed using an improved combined physical-chemical grouping method [9,10] (Figure 2).
First, air-dried soil samples that had passed through a 2-mm sieve were separated by wet sieving on the top sieve of the microaggregate separator sieve set (250 μm sieve on top and 53 μm sieve on the bottom), with >250 μm agglomerates on the top sieve, i.e., coarse particulate OC fractions (CPOM), the microaggregate fractions (μagg) on the 53 μm sieve, and the free clay and silt fractions (dSilt + dClay) passing through the 53-μm sieve.
Second, the microaggregate fractions (μagg) were subjected to density flotation, and 50 mL of 1.7 g cm−3 sodium iodide was added for centrifugal filtration, sodium iodide enabled density-based separation of particulate organic matter. The light group fraction left on the 0.45 μm filter membrane was the free granular OC fraction (fPOM), and the recombinant fraction was shaken with 60 mL of 5 g·L−1 sodium hexametaphosphate solution and passed through a 53 μm sieve, in this step, sodium hexametaphosphate solution acted as the dispersing agent for microaggregate breakdown. What remained on the sieve was the physically protected OC fraction (iPOM), and what passed through the 53 μm sieve was the closed-accumulation clay and silt fraction (μSilt + μClay). Finally, dSilt + dClay and μSilt + μClay were refluxed in 25 mL of 6 mol·L−1 HCL for 16 h, and the acidolysis solution was filtered off, leaving the nonacidolysis part on the 0.45 μm filter membrane, that is, the nonacidolysis free powder clay fractions (NH-dSilt + dClay) and the nonacidolysis closed powder clay fractions (NH-μSilt + μClay). The acidolysis part is the difference between the whole fractions and the nonacidolysis fractions, and the acidolysis free powder clay fractions (H-dSilt + dClay) and the acidolysis closed powder clay fractions (H-μSilt + μClay) were obtained. All soil fractions were dried at 60 °C and weighed for further determination of C content. The method divides SOC into four fractions: unprotected SOC fractions (uPOM), namely, CPOM and fPOM; physically protected SOC fractions (pPOM), namely, iPOM; chemically protected SOC fractions (cPOM), namely, H-dSilt + dClay and H-μSilt + μClay; and biochemically protected SOC fractions (bcPOM), namely, NH-dSilt + dClay and NH-μSilt + μClay. All soil samples and the abovementioned dried soil material fractions were screened by 0.15 mm, and the OC content was determined by the potassium dichromate-external heating method [25].

2.4. Data Processing and Statistical Analysis

Calculation formula of SOC fractions,
SOC (iF)content = MP (iF) × OC (iF)content
where SOC (iF)content is the content of OC fraction i in soil (g·kg−1); MP (iF) is the content of substance i in soil (%) and OC (iF)content is the OC content in soil i (g·kg−1).
Calculation and publicity of the proportion of SOC pools to total OC,
AP = SOC (iF)content/TOCcontent × 100
where AP is the proportion of the SOC pool to total OC (%) and TOCcontent is the total OC content of the soil (g·kg−1) [26].
The experimental data were processed by Microsoft Excel 2016, and the average and standard deviation were calculated. The data were analyzed by one-way ANOVA and the GLM using IBM SPSS Statistics 26, and multiple comparisons were made between groups using the Duncan model. When p < 0.05, the difference was considered significant. Using Origin 21 to draw the thermal map of SOC fractions and related analysis, redundancy (RDA) analysis was carried out with Canoco 5 to test the relationship between SOC fractions and environmental factors.

3. Results

3.1. Analysis of Soil Environmental Factors

Soil pH was significantly higher at 250 m than at the rest of the elevations. As the elevation decreased, ST increased, and the highest ST reached 30 °C when the elevation was 250 m in summer. SW increased with the elevation gradient in winter; SW increased first and then decreased along the elevation gradient in spring, summer and autumn, and the highest SW reached 71% at an elevation of 1600 m in summer. The EC at 250 m was significantly higher than that at other elevations. TN first increased and then decreased along the elevation gradient and reached the highest value of 2.92 g·kg−1 at 1600 m in summer. There was no significant difference in C/N ratio at different elevations in winter and autumn. The C/N ratio at 250 m in spring was significantly higher than that at 1150 m and 1800 m in summer, and the C/N ratio was significantly higher at 1600 m and 1800 m than at 250 m and 1150 m in summer (Figure 3). In other words, the environmental factors of rice paddies vary significantly with elevation.

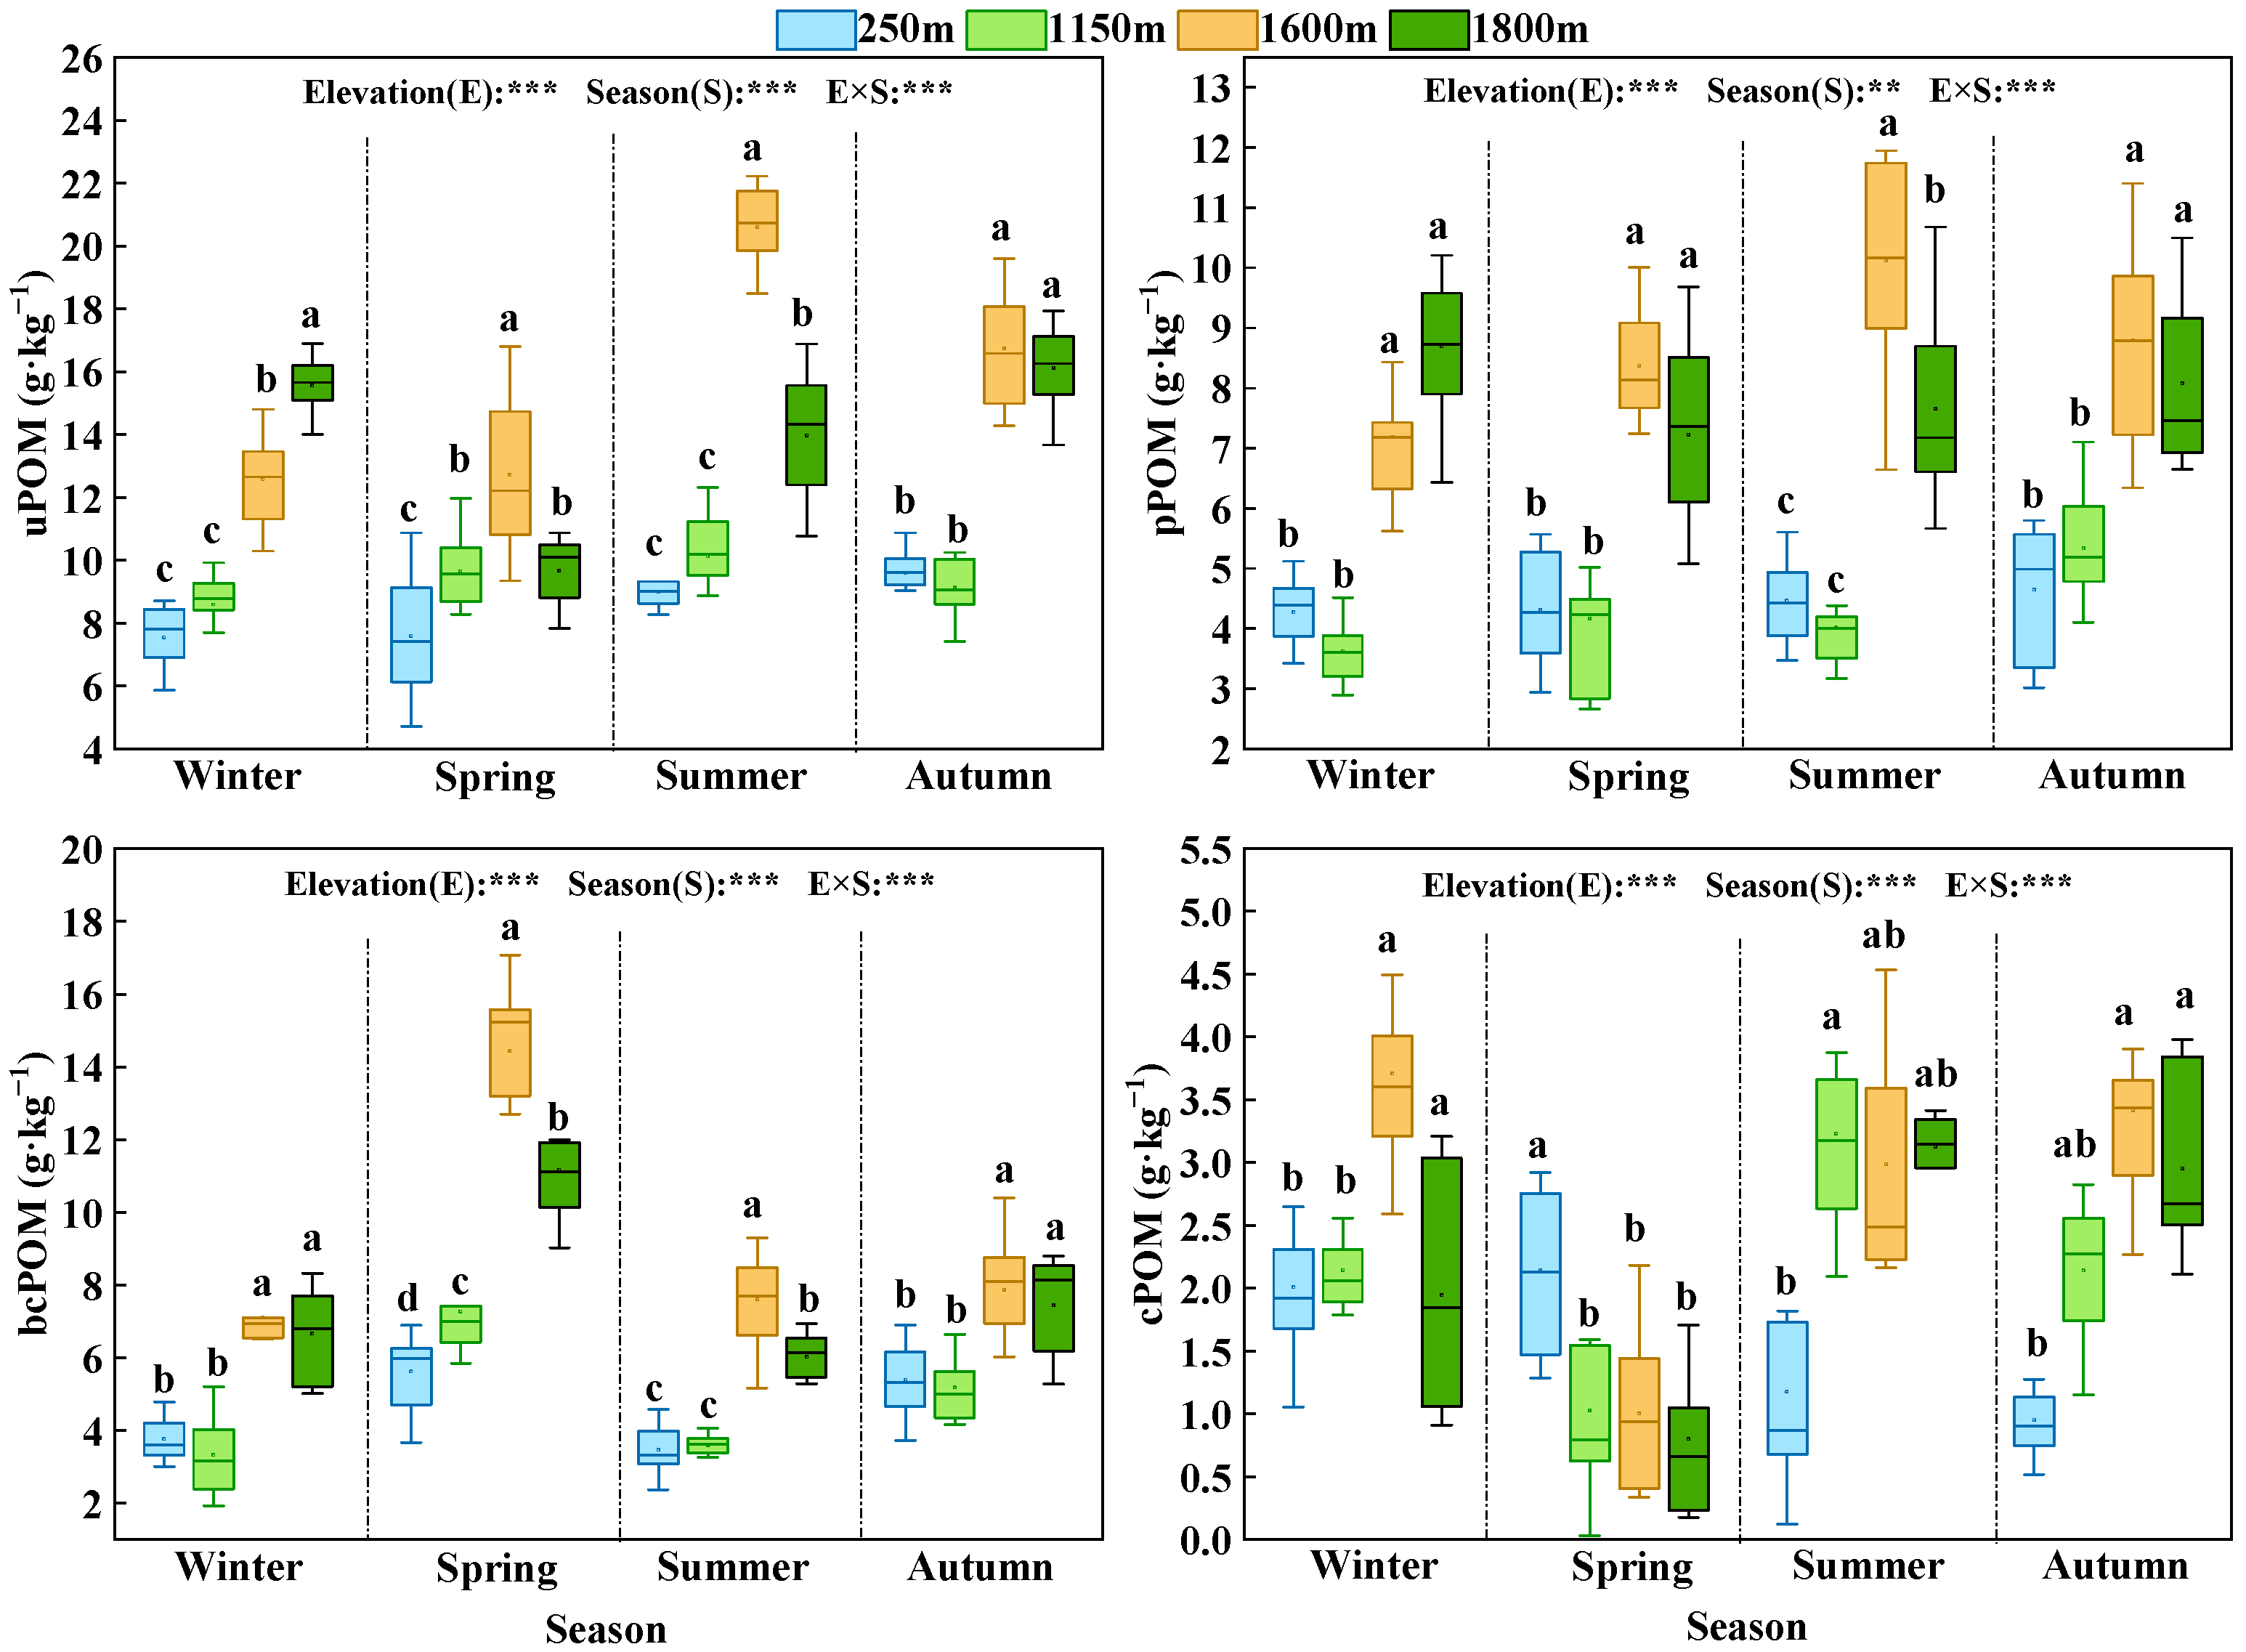
3.2. SOC and SOC Fraction Contents in Rice Paddies

In winter, the SOC content decreased with decreasing elevation, and the highest SOC was 33.0 g·kg−1 at 1800 m. In spring, summer, and autumn, the SOC content increased and then decreased along the elevation gradient and peaked at 1600 m. In summer, the highest SOC was 41.3 g·kg−1 at 1600 m. Two-factor analysis showed that elevation had a highly significant effect on SOC (p < 0.001), season had a highly significant effect on SOC (p < 0.01), and there was a highly significant interaction between elevation and season in affecting SOC (p < 0.01) (Figure 4). Therefore, SOC varied significantly along the elevation gradient in rice paddies, and elevation and season had highly significant effects on SOC.
Collectively, the relative abundance of SOC fractions along the elevational gradient followed the pattern: uPOM > bcPOM > pPOM > cPOM. The trends of uPOM in winter, spring, and summer were consistent with those of SOC, and uPOM was significantly higher in autumn at elevations 1600 m and 1800 m than at elevations 250 m and 1150 m. pPOM was significantly higher in winter, spring and autumn at elevations 1600 m and 1800 m than at elevations 250 m and 1150 m. In summer, pPOM was significantly higher at elevation 1600 m than at the rest of the elevations, amounting to 10.1 g·kg−1. In winter and autumn, bcPOM was significantly higher than bcPOM at elevations of 1600 m and 1800 m, while in spring and summer, bcPOM was significantly higher than other bcPOM at an elevation of 1600 m, and the highest bcPOM was 14.43 g·kg−1 at an elevation of 1600 m in spring. In winter, cPOM was significantly higher at elevations 1600 m and 1800 m than at 250 m and 1150 m. In spring, cPOM was significantly higher at 250 m than at the rest of the elevations, amounting to 2.1 g·kg−1, and in summer and autumn, cPOM was lower at 250 m than at the rest of the elevations (Figure 5).
Two-factor analysis showed that elevation had a highly significant effect on uPOM, pPOM, bcPOM and cPOM (p < 0.001), season had a highly significant effect on uPOM, bcPOM and cPOM (p < 0.001), and pPOM (p < 0.01), and elevation and season had a highly significant interaction effect on uPOM, pPOM, bcPOM and cPOM. In conclusion, elevation and season had highly significant effects on SOC fractions (Figure 5).
The generalized linear mixed model (GLM) showed that elevation had a highly significant effect (p < 0.0001) on SOC, uPOM, bPOM and bcPOM contents and a highly significant effect (p < 0.001) on cPOM (Table 1). Thus, elevation is an important factor influencing SOC fractions.

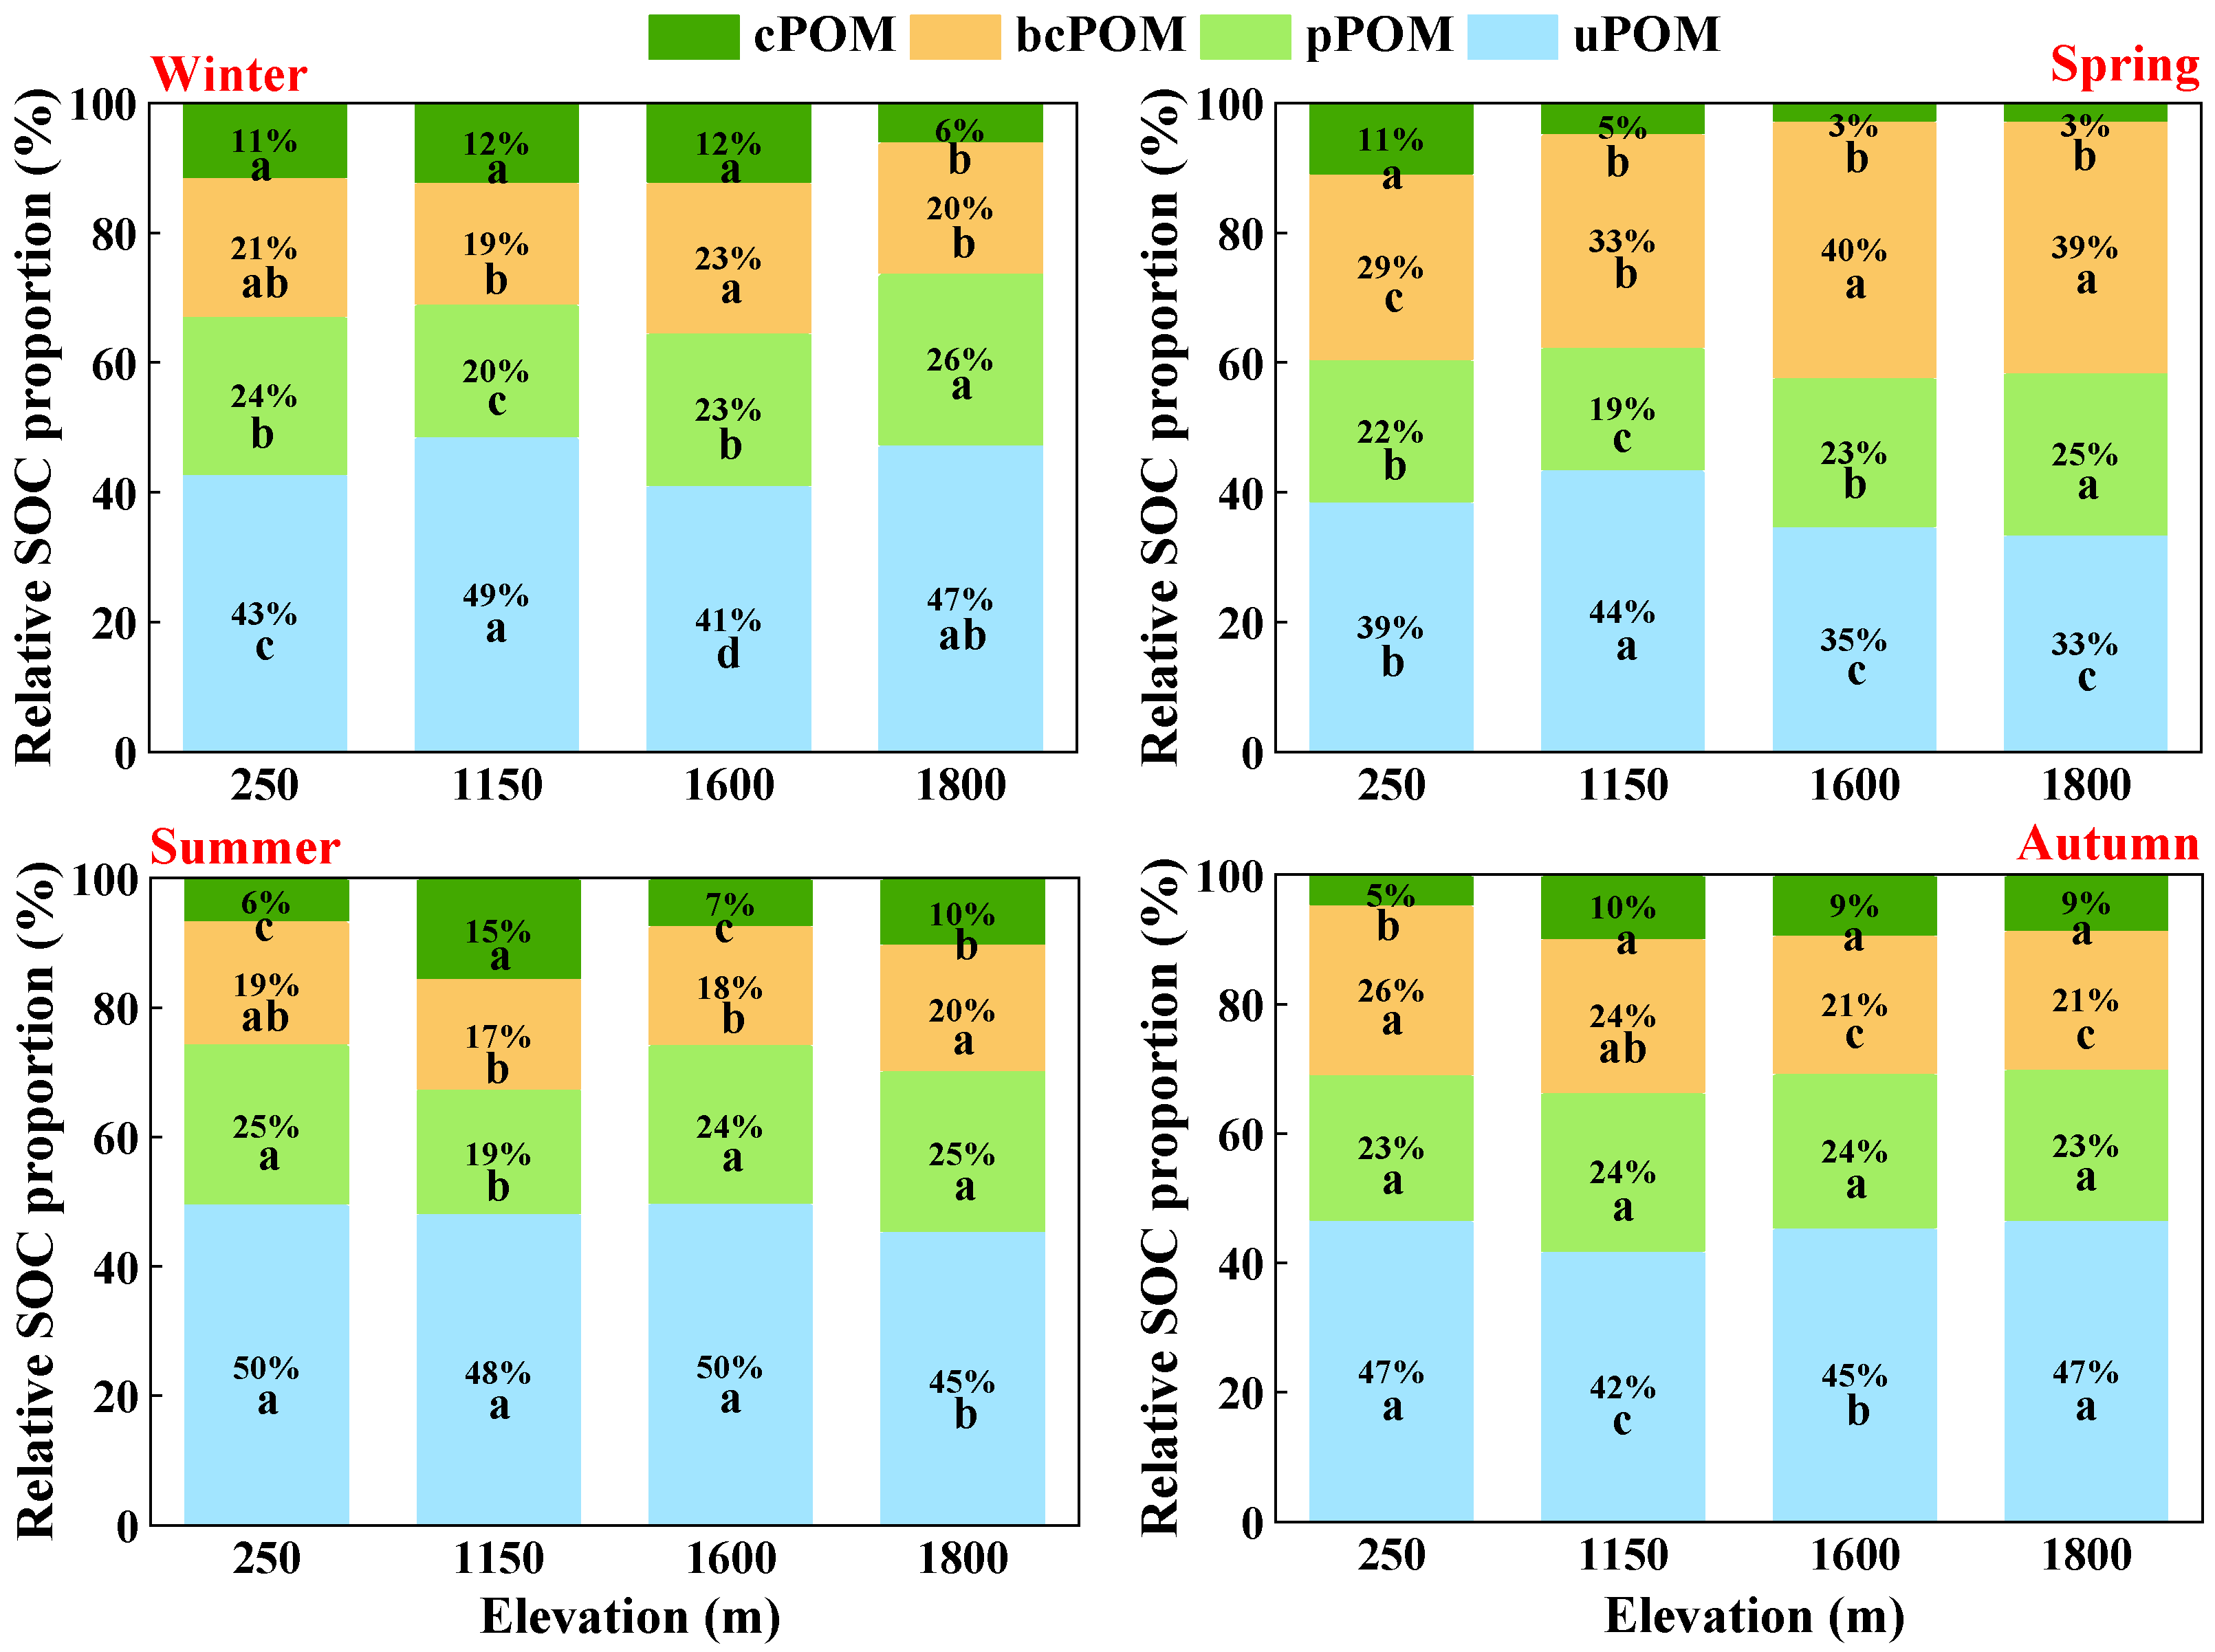
3.3. Proportion of SOC Fractions to SOC in Rice Paddies

The proportion of cPOM to SOC decreased along the elevation increase in spring, and the proportion of bcPOM was higher than that in the remaining three seasons. The proportion of uPOM was higher than that in the remaining three elevations at 1150 m in winter and spring. The SOC of rice paddy was highest in uPOM, followed by pPOM and bcPOM, and lowest in cPOM. In summer, the proportion of uPOM was higher than that in the remaining three seasons, with the highest proportion of 50%. In spring, cPOM had the lowest percentage of 3%, and uPOM was up to 12 times higher than cPOM. (Figure 6). In short, there were significant differences in the proportion of OC fractions to SOC along the elevation gradient, with uPOM being the main source of C pools and pPOM and bcPOM being the main protective mechanisms.

3.4. Correlation Analysis

Correlation analyses showed that soil temperature (ST) was highly significant and negatively correlated with SOC, uPOM, pPOM and bcPOM. Soil water (SW) was highly significantly and positively correlated with SOC, uPOM and pPOM. Electrical conductivity (EC) was either significantly or highly significantly and negatively correlated with pPOM and cPOM. pH and C/N ratio were highly significantly and negatively correlated with SOC and its fractions, total nitrogen (TN) was highly significantly and positively correlated with SOC, and its fractions were significantly positively correlated (Figure 7). Therefore, there were significant correlations between soil environmental factors and SOC fractions.
Redundancy analysis (RDA) showed that ST, SW, EC, pH, TN and C/N ratio explained 69.11% of the variation in SOC and the four protected state C fractions. Based on the Monte Carlo permutation test, ST, SW, EC, pH and TN all had highly significant effects on SOC fraction changes, and C/N ratio had significant effects on SOC fraction changes. Among them, TN was the main limiting factor (56%) for SOC fraction changes (Figure 8). In conclusion, the changes in SOC fractions were extremely significantly influenced by environmental factors.

4. Discussion

4.1. Soil OC Fractions in Rice Paddy

uPOM and pPOM are active C fractions that are more sensitive to agricultural management measures. Our study found that uPOM accounts for the highest proportion in the elevation gradient in winter, summer and autumn, followed by pPOM, and uPOM in summer was higher than in other seasons (Figure 5), indicating that uPOM is the main C pool in paddy soil and is more sensitive to temperature changes. This is because uPOM is mainly composed of plant residues, fungal hyphae and spores, and the exogenous C input into the soil is first transformed into uPOM and pPOM after decomposition [27,28], which is consistent with the research results of Xu et al. [29]. However, the proportion of pPOM to SOC in spring is lower than that of bcPOM to SOC, which may be because spring is in the plowing period of local rice fields, and soil tillage destroys its aggregate structure, resulting in a decrease in pPOM [30]. As the stabilizing OC fractions, bcPOM and cPOM are the parts of the soil sticky meal grains combined with the end products of organic matter decomposition, which are mainly composed of humus [31]. It was found that the application of organic fertilizer enhanced soil microbial activity and promoted the increase in its metabolic secretions, and the intermediate metabolites of soil microbial activity were directly transferred to the sticky powder particle fraction to accumulate bcPOM and cPOM [32], which was contrary to the lowest cPOM of this study (Figure 5). This may be because no fertilizer was applied to the selected sample sites in this study, microbial-derived humus production was insufficient to enhance C stabilization within clay-particle aggregates, where strong soil adsorption further slowed OC turnover [33]. While our current study documents these relationships, the underlying mechanisms warrant systematic investigation through controlled experiments integrated with isotopic tracing techniques and multi-omics microbial analyses.

4.2. Soil OC Fractions and Stability Changes in Rice Paddies Along the Elevation Gradient

This study shows that elevation is the main factor affecting the distribution characteristics of SOC (Table 1), which is consistent with the research results of Li et al. [18]. In this study, the contents of SOC, uPOM, pPOM and bcPOM decreased with decreasing elevation in winter, and their stability decreased (Figure 4 and Figure 5). The reasons may be as follows: on the one hand, the temperature of rice paddies in high-elevation areas is low, and the decomposition and mineralization of SOC are slow, but the litter continues to be imported, and OC continues to accumulate [34]. Furthermore, low-temperature conditions at high elevations promote simplified rice paddy communities, resulting in reduced litter input diversity and quantity. This constrained species composition correlates with diminished microbial activity and slower SOC decomposition rates in these ecosystems [35,36]. Therefore, different elevation gradients simulate the vertical change in OC under climate warming. The observed lower SOC stability at low elevations may be linked to higher temperatures, which could potentially diminish the C sequestration potential of paddy soils. This pattern suggests that under projected warming scenarios, terrace soils at lower elevations might be more vulnerable to C loss [37].
In this study, the SOC content, uPOM, pPOM and bcPOM increased and then decreased along the elevation gradient in spring, summer and autumn and peaked at an elevation of 1600 m (Figure 4) because, in the elevation range of 250–1600 m, the humidity increased with elevation, the growth conditions of rice gradually improved, the litter storage reserve increased, and the soil withered leaves and root secretions increased, which promoted the conversion of plant litter into soil organic matter and was favorable to the accumulation of soil organic matter [38,39]. However, with the continual increase in elevation, the low-temperature and high-humidity environment suppressed the activity of soil microorganisms, which made the SOC and density decrease with increasing elevation [40]. The differences in SOC along the elevation gradient in different seasons were mainly because the local rice paddy was in a winter idle state in winter, and the microbial activity was weak to reduce the decomposition of OC to reduce the output, whereas the local rice paddy was plowed in the spring, the rice growth was vigorous in summer, the rice harvest was conducted in fall, the microbial activity was weak to reduce the decomposition of plant residue to reduce the input of OC, and the SOC peaked at an elevation of 1600 m. The local rice paddy was more planted and grew more closely. The peak SOC at 1600 m is closely related to the fact that the local rice at 1600 m is planted more and grows better [41].
In conclusion, our results show that ST is higher at lower elevations concurrently with lower soil C stability, and that uPOM dominates the C pool in the Yuanyang rice paddy. This raises concerns that uPOM may become more susceptible to loss under projected warming trends, though its actual vulnerability would depend on future land-use practices and microbial adaptation.

4.3. Correlation Between SOC Fractions in Rice Paddies and Soil Environmental Factors

TN was higher in high-elevation rice paddy soils than in low-elevation paddy soils and was significantly and positively correlated with SOC and fraction content (Figure 3 and Figure 7). This is because soil N can promote the growth of crops aboveground and root systems, a large amount of root secretion enters the soil, increasing the C fixation of the soil, and the litter mass of the plant tends to increase significantly in the background of N enrichment [42]. These findings suggest that targeted N fertilization strategies in low-elevation paddies could potentially enhance C sequestration while maintaining crop yields. Therefore, the effective degree of soil C increases, and the effective degree of N increases as well [43]. Because of the high water content and long immersion time, the low-elevation paddy soil enhances anaerobic conditions and affects microbial activity and other biochemical processes, such as mineralization, nitrification and denitrification [44]. This implies that water management practices (e.g., controlled drainage) at lower elevations may help optimize nitrogen availability and subsequent C storage. Therefore, the N concentration detected in low-elevation areas is low, which is consistent with the results reported in other studies [45,46]. The synchronous change in C and N shows that N availability is an important controlling factor of the C cycle along the elevation gradient [47], which was consistent with the conclusion that TN was the main limiting factor of SOC and fraction content in this paper (Figure 8). For terrace management, this highlights the importance of elevation-specific fertilization plans—increasing nitrogen inputs at lower elevations while maintaining traditional practices at higher elevations where natural N cycling appears sufficient. Generally, N deficiency limits the accumulation of C in the soil [48], and the interaction between C and N is very important to determine whether the C sink in farmland soil can last for a long time [49]. Our results advocate for integrated C-N management in terraced systems, where nitrogen application rates could be adjusted based on elevation-dependent SOC stabilization potentials. Therefore, it is of great significance to clarify the dynamic relationship between C and N responses to elevation for sustainable soil management and the prediction of future climate change results [50].
The ST was highest at 250 m, but the soil C pools were lowest (Figure 3 and Figure 4). Increased temperature not only accelerates microbial activity but also increases plant growth rates, leading to increased C demand by organisms (plants and microbes) and thus accelerated C depletion [51]. Moisture affects rice growth and thus determines SOC input, and moist conditions are more favorable for SOC accumulation. Soil pH affects soil microbial growth and activity [52]. Soil pH affects soil microbial growth and activity [53]. In this study, pH showed a highly significant negative correlation with SOC and its fraction content (Figure 8), mainly because in acidic soils, microbial species are restricted to a fungal-dominated environment, microbial activity is weakened so that the enzyme activities involved in SOC cycling are also limited to a certain extent, and the turnover and mineralization of SOC are reduced, which leads to the continuous accumulation of SOC [54]. EC had a highly significant role in the variation of SOC fractions (Figure 7), which is consistent with the findings of Martinez et al. [55]. Soil C/N ratio is the result of the long-term balance of OC and N input and output, and in general, if the C/N ratio is too large, microbial decomposition will be slow and OC will be consumed more [56], which was consistent with the conclusion of the present study that the C/N ratio is negatively correlated with the SOC and the C of each fraction (Figure 7).
In summary, elevation-driven variations in soil environmental factors (ST, SW, EC, pH, TN and C/N ratio) collectively regulated SOC distribution in rice paddies, with TN emerging as the dominant control on both bulk SOC and its fractional composition. While this study establishes fundamental altitudinal patterns of SOC dynamics (particularly the 1600 m optimal storage threshold), three critical extensions emerge: (1) the TN-SOC coupling provides a mechanistic basis for refining nitrogen management in climate-smart agriculture policies targeting terraced landscapes; (2) elevation-specific SOC parameters offer empirical constraints for mountain SOC models in Earth System Models; and (3) the quantified elevation dependencies enable precise C stock assessments in regional accounting frameworks. Future work should prioritize elucidating SOC stabilization mechanisms across these elevation gradients to develop targeted C sequestration strategies.

5. Conclusions

Elevation and seasonally induced changes in the soil environment had a significant effect on SOC distribution. The SOC content in Yuanyang Terrace rice paddies shows a significant elevational increase, with distinct seasonal patterns emerging around the 1600 m threshold. During spring and summer, SOC exhibits a unimodal distribution peaking at 1600 m, while autumn and winter display a plateauing pattern following initial elevation-dependent accumulation. This altitudinal distribution is primarily stabilized through physical protection and biochemical protection. Total nitrogen was the key environmental factor affecting SOC and its fraction content. uPOM was the main C pool of the rice paddy in Yuanyang, which was more sensitive to environmental changes. It is necessary to strengthen the management of unprotected soil C in rice paddies to better cope with future climate changes. This study provides empirical evidence for the elevational distribution patterns and seasonal dynamics of SOC fractions in rice paddies across Yuanyang Terrace’s altitude gradient. Future research should focus on long-term monitoring of uPOM turnover under climate change and developing elevation-specific C models integrating microbial dynamics.

Author Contributions

Conceptualization, Y.H.; methodology, L.C. and Y.W.; software, H.L. and L.C.; validation, Y.L. and X.L.; formal analysis, F.Z.; investigation, H.L. and L.C.; resources, F.Z.; data curation, H.L.; writing—original draft preparation, H.L. and L.C.; writing—review and editing, H.L. and Y.H.; visualization, H.L. and L.C.; supervision, L.C.; project administration, Y.H.; funding acquisition, Y.H. All authors have read and agreed to the published version of the manuscript.

Funding

This work was financially supported by the National Natural Science Foundation of China (No. 32460294), and the Key Agricultural Joint Projects in Yunnan Province (No. 202301BD070001-014).

Data Availability Statement

The data presented in this study are available upon request from the corresponding author.

Acknowledgments

We thank Yongmei He from Yunnan Agricultural University for experimental design guidance. We also thank the editors and anonymous reviewers for their great support.

Conflicts of Interest

The authors declare no conflicts of interest.

References

  1. Kikstra, J.S.; Nicholls, Z.R.J.; Smith, C.J.; Lewis, J.; Lamboll, R.D.; Byers, E.; Riahi, K. The IPCC Sixth Assessment Report WGIII climate assessment of mitigation pathways: From emissions to global temperatures. Geosci. Model Dev. 2022, 15, 9075–9109. [Google Scholar] [CrossRef]
  2. Francisco, E.; Pierre, P.; Carlos, G.G.; Benjamín, M.L. A time-series analysis of the 20th century climate simulations produced for the IPCC’s Fourth Assessment Report. PLoS ONE 2013, 8, e60017. [Google Scholar]
  3. Scharlemann, J.P.W.; Tanner, E.V.J.; Hiederer, R.; Kapos, V. Global soil carbon: Understanding and managing the largest terrestrial carbon pool. Carbon Manag. 2014, 5, 81–91. [Google Scholar] [CrossRef]
  4. Mark, A. Climate Change 2014: Synthesis Report; IPCC: Geneva, Switzerland, 2016; Volume 141, p. 28. [Google Scholar]
  5. Luo, Z.K.; Feng, W.T.; Luo, Y.Q.; Baldock, J.; Wang, E.L. Soil organic carbon dynamics jointly controlled by climate, carbon inputs, soil properties and soil carbon fractions. Glob. Change Biol. 2017, 23, 4430–4439. [Google Scholar] [CrossRef]
  6. Liang, C.; Schimel, J.P.; Jastrow, J.D. The importance of anabolism in microbial control over soil carbon storage. Nat. Microbiol. 2017, 2, 17105. [Google Scholar] [CrossRef]
  7. Lützow, M.V.; Kögel-Knabner, I.; Ekschmitt, K.; Flessa, H.; Guggenberger, G.; Matzner, E.; Marschner, B. SOM fractionation methods: Relevance to functional pools and to stabilization mechanisms. Soil Biol. Biochem. 2007, 39, 2183–2207. [Google Scholar] [CrossRef]
  8. Six, J.; Conant, R.T.; Paul, E.A.; Paustian, K. Stabilization mechanisms of soil organic matter: Implications for C-saturation of soils. Plant Soil 2002, 241, 155–176. [Google Scholar] [CrossRef]
  9. Stewart, C.E.; Plante, A.F.; Paustian, K.; Conant, R.T.; Six, J. Soil carbon saturation: Linking concept and measurable carbon pools. Soil Sci. Soc. Am. J. 2008, 72, 379–392. [Google Scholar] [CrossRef]
  10. Stewart, C.E.; Paustian, K.; Conant, R.T.; Plante, A.F.; Six, J. Soil carbon saturation: Implications for measurable carbon pool dynamics in long-term incubations. Soil Biol. Biochem. 2009, 41, 357–366. [Google Scholar] [CrossRef]
  11. Wang, B.; Hao, S.; Zhang, Q.L. Protection mechanisms and influencing factors of soil organic carbon pools in the Larix gmelinii forests. Ecol. Indic. 2023, 150, 110242. [Google Scholar] [CrossRef]
  12. Feng, J.; Xu, X.; Wu, J.J.; Zhang, Q.; Zhang, D.D.; Li, Q.X.; Long, C.Y.; Chen, Q.; Chen, J.W.; Cheng, X.L. Inhibited enzyme activities in soil macroaggregates contribute to enhanced soil carbon sequestration under afforestation in central China. Sci. Total Environ. 2018, 640–641, 653–661. [Google Scholar] [CrossRef]
  13. Thevenot, M.; Dignac, M.F.; Rumpel, C. Fate of lignins in soils: A review. Soil Biol. Biochem. 2010, 42, 1200–1211. [Google Scholar] [CrossRef]
  14. Zinn, Y.L.; Andrade, A.B.; Araujo, M.A.; Lal, R. Soil organic carbon retention more affected by altitude than texture in a forested mountain range in Brazil. Soil Res. 2018, 56, 284–295. [Google Scholar] [CrossRef]
  15. Tian, Q.X.; Jiang, Y.; Tang, Y.N.; Wu, Y.; Tang, Z.Y.; Liu, F. Soil pH and organic carbon properties drive soil bacterial communities in surface and deep layers along an elevational gradient. Front. Microbiol. 2021, 12, 646124. [Google Scholar] [CrossRef]
  16. Wiesmeier, M.; Urbanski, L.; Hobley, E.; Lang, B.; Lützow, M.V.; Steffens, M.; Wesemael, B.V.; Rabot, E.; Ließ, M.; Garcia-Franco, N.; et al. Soil organic carbon storage as a key function of soils—A review of drivers and indicators at various scales. Geoderma 2019, 333, 149–162. [Google Scholar] [CrossRef]
  17. Wu, M.Y.; Pang, D.B.; Chen, L.; Li, X.B.; Liu, L.Z.; Liu, B.; Li, J.Y.; Wang, J.F.; Ma, L.L. Chemical composition of soil organic carbon and aggregate stability along an elevation gradient in Helan Mountains, northwest China. Ecol. Indic. 2021, 131, 108228. [Google Scholar] [CrossRef]
  18. Li, L.G.; Vogel, J.; He, Z.L.; Zou, X.M.; Ruan, H.H.; Huang, W.; Wang, J.S.; Bianchi, T.S. Association of soil aggregation with the distribution and quality of organic carbon in soil along an elevation gradient on Wuyi Mountain in China. PLoS ONE 2016, 11, e0150898. [Google Scholar] [CrossRef]
  19. Schiedung, H.; Bornemann, L.; Welp, G. Seasonal variability of soil organic carbon fractions under arable land. Pedosphere 2017, 27, 380–386. [Google Scholar] [CrossRef]
  20. Sun, X.L.; Tang, Z.X.; Ryan, M.G.; You, Y.M.; Sun, O.J. Changes in soil organic carbon contents and fractionations of forests along a climatic gradient in China. For. Ecosyst. 2019, 6, 1. [Google Scholar] [CrossRef]
  21. Wang, Y.; Zhang, C.; Song, W.F.; He, X.; Zhang, S.D. Spatial distribution characteristic of Yuanyang Rice Terrace. Res. Soil Water Conserv. 2013, 20, 103–107. [Google Scholar]
  22. Sundqvist, M.K.; Sanders, N.J.; Wardle, D.A. Community and ecosystem responses to elevational gradients: Processes, mechanisms, and insights for global change. Annu. Rev. Ecol. Evol. Syst. 2013, 44, 261–280. [Google Scholar] [CrossRef]
  23. Liu, Z.L.; Ding, Y.P.; Jiao, H.M.; Liu, C.J. Identification of potential abandoned farmland and driving factors in Honghe Hani Rice Terrace. Chin. J. Eco-Agric. 2020, 28, 124–135. [Google Scholar]
  24. Zhang, X.J.; Song, W.F.; Wu, J.K.; Wang, Z.J. Characteristics of hydrogen and oxygen isotopes of soil water in the water source area of Yuanyang Terrace. Environ. Sci. 2015, 36, 2102–2108. [Google Scholar]
  25. Bao, S.D. Soil Agrochemical Analysis, 3rd ed.; China Agricultural Press: Beijing, China, 2000. [Google Scholar]
  26. Li, W.J.; Huang, Q.H.; Li, D.M.; Liu, K.L.; Zhang, W.J.; Xu, M.G. Variation characteristics of organic carbon pools with different protection methods in upland red soil under long-term fertilization. J. Agric. Resour. Environ. 2023, 40, 106–115. [Google Scholar]
  27. Zhang, R.; Zhang, G.; Ji, Y.; Li, G.; Chang, H.; Yang, D. Effects of different fertilizer application on soil active organic carbon. Environ. Sci. 2013, 34, 277–282. [Google Scholar]
  28. Somasundaram, J.; Chaudhary, R.S.; Awanish, K.D.; Biswas, A.K.; Sinha, N.K.; Mohanty, M.; Hati, K.M.; Jha, P.; Sankar, M.; Patra, A.K.; et al. Effect of contrasting tillage and cropping systems on soil aggregation, carbon pools and aggregate-associated carbon in rainfed Vertisols. Eur. J. Soil Sci. 2018, 69, 879–891. [Google Scholar] [CrossRef]
  29. Xu, M.; Xiao, L.; Cai, X.; Li, X.; Zhang, X.; Zhang, J. Impact of land use type on soil organic carbon fractionation and turnover in Southeastern Tibet. Sci. Agric. Sin. 2018, 51, 3714–3725. [Google Scholar]
  30. Zhang, X.T.; Wang, J.; Feng, X.Y.; Yang, H.S.; Li, Y.L.; Kuzyakov, Y.; Liu, S.P.; Li, F.M. Effects of tillage on soil organic carbon and crop yield under straw return. Agric. Ecosyst. Environ. 2023, 354, 108543. [Google Scholar] [CrossRef]
  31. Six, J.; Paustian, K. Aggregate-associated soil organic matter as an ecosystem property and a measurement tool. Soil Biol. Biochem. 2014, 68, A4–A9. [Google Scholar] [CrossRef]
  32. Xu, M.G.; Li, R.; Sun, N.; An, Y.Q.; Wang, X.L.; Jin, D.S.; Li, J.H.; Zhang, Q.; Hong, J.P.; Shen, H.P. Soil organic carbon sequestration efficiency and fractions as affected by organic fertilization rate in reclaimed cultivated land. J. Plant Nutr. Fertil. 2022, 28, 2143–2151. [Google Scholar]
  33. Xu, X.R.; Zhang, W.J.; Xu, M.G.; Li, S.Y.; An, T.T.; Pei, J.B.; Xiao, J.; Xie, H.T.; Wang, J.K. Characteristics of differently stabilised soil organic carbon fractions in relation to long-term fertilisation in brown earth of Northeast China. Sci. Total Environ. 2016, 572, 1101–1110. [Google Scholar] [CrossRef] [PubMed]
  34. Wu, M.Y.; Chen, L.; Ma, J.P.; Zhang, Y.; Li, X.B.; Pang, D.B. Aggregate-associated carbon contributes to soil organic carbon accumulation along the elevation gradient of Helan Mountains. Soil Biol. Biochem. 2023, 178, 108926. [Google Scholar] [CrossRef]
  35. França, E.M.; Silva, C.A.; Zinn, Y.L. Coffee plantations can strongly sequester soil organic carbon at high altitudes in Brazil. Soil Res. 2022, 61, 198–207. [Google Scholar] [CrossRef]
  36. Feyissa, A.; Raza, S.T.; Cheng, X.L. Soil carbon stabilization and potential stabilizing mechanisms along elevational gradients in alpine forest and grassland ecosystems of Southwest China. Catena 2023, 229, 107210. [Google Scholar] [CrossRef]
  37. Pu, Y.L.; Ye, C.; Zhang, S.R.; Wang, G.Y.; Hu, S.J.; Xu, X.X.; Xiang, S.; Li, T.; Jia, Y.X. Response of the organic carbon fractions and stability of soil to alpine marsh degradation in Zoige, East Qinghai-Tibet Plateau. J. Soil Sci. Plant Nutr. 2020, 20, 2145–2155. [Google Scholar] [CrossRef]
  38. Kong, J.; He, Z.; Chen, L.; Yang, R.; Du, J.; Lin, P.; Zhu, X.; Tian, Q. Elevational gradients and distributions of aggregate associated organic carbon and nitrogen and stability in alpine forest ecosystems. Soil Sci. Soc. Am. J. 2020, 84, 1971–1982. [Google Scholar] [CrossRef]
  39. Tashi, S.; Singh, B.; Keitel, C.; Adams, M. Soil carbon and nitrogen stocks in forests along an altitudinal gradient in the eastern Himalayas and a meta-analysis of global data. Glob. Change Biol. 2016, 22, 2255–2268. [Google Scholar] [CrossRef]
  40. Liu, B.; Chen, L.; Pang, D.B.; Zhu, Z.Y.; Liu, L.Z.; Wu, M.Y.; Li, X.B. Altitudinal distribution rule of Larix principis-rupprechtii forest’s soil organic carbon and its influencing factors in Liupan Mountain. Acta Ecol. Sin. 2021, 41, 6773–6785. [Google Scholar]
  41. Li, J.S.; Wu, B.Y.; Zhang, D.D.; Cheng, X.L. Elevational variation in soil phosphorus pools and controlling factors in alpine areas of Southwest China. Geoderma 2023, 431, 116361. [Google Scholar] [CrossRef]
  42. Deng, L.; Peng, C.H.; Zhu, G.Y.; Chen, L.; Liu, Y.L.; Shangguan, Z.P. Positive responses of belowground C dynamics to nitrogen enrichment in China. Sci. Total Environ. 2018, 616–617, 1035–1044. [Google Scholar] [CrossRef]
  43. Larsen, K.S.; Andresen, L.C.; Beier, C.; Jonasson, S.; Albert, K.R.; Ambus, P.; Arndal, M.F.; Carter, M.S.; Christensen, S.; Holmstrup, M.; et al. Reduced N cycling in response to elevated CO2, warming, and drought in a Danish heathland: Synthesizing results of the climate project after two years of treatment. Glob. Change Biol. 2011, 17, 1884–1899. [Google Scholar] [CrossRef]
  44. Wang, W.Q.; Wang, C.; Sardans, J.; Tong, C.; Jia, R.X.; Zeng, C.S.; Peñuelas, J. Flood regime affects soil stoichiometry and the distribution of the invasive plants in subtropical estuarine wetlands in China. Catena 2015, 128, 144–154. [Google Scholar] [CrossRef]
  45. Liu, F.D.; Liu, Y.H.; Wang, G.M.; Song, Y.; Liu, Q.; Li, D.S. Seasonal variations of C:N:P stoichiometry and their trade-offs in different organs of Suaeda salsa in coastal wetland of Yellow River Delta, China. PLoS ONE 2015, 10, e0138169. [Google Scholar]
  46. Zhang, W.L.; Zeng, C.S.; Tong, C.; Zhai, S.J.; Lin, X.; Gao, D.Z. Spatial distribution of phosphorus speciation in marsh sediments along a hydrologic gradient in a subtropical estuarine wetland, China. Estuar. Coast. Shelf Sci. 2015, 154, 30–38. [Google Scholar] [CrossRef]
  47. Hartmann, A.A.; Barnard, R.L.; Marhan, S.; Niklaus, P.A. Effects of drought and N-fertilization on N cycling in two grassland soils. Oecologia 2013, 171, 705–717. [Google Scholar] [CrossRef]
  48. Kuzyakov, Y.; Horwath, W.R.; Dorodnikov, M.; Blagodatskaya, E. Review and synthesis of the effects of elevated atmospheric CO2 on soil processes: No changes in pools, but increased fluxes and accelerated cycles. Soil Biol. Biochem. 2019, 128, 66–78. [Google Scholar] [CrossRef]
  49. Kuzyakov, Y.; Xu, X. Competition between roots and microorganisms for nitrogen: Mechanisms and ecological relevance. New Phytol. 2013, 198, 656–669. [Google Scholar] [CrossRef]
  50. Du, B.M.; Kang, H.Z.; Pumpanen, J.; Zhu, P.H.; Yin, S.; Zou, Q.; Wang, Z.; Kong, P.Q.; Liu, C.J. Soil organic carbon stock and chemical composition along an altitude gradient in the Lushan Mountain, subtropical China. Ecol. Res. 2014, 29, 433–439. [Google Scholar] [CrossRef]
  51. Qi, R.; Li, J.; Lin, Z.A.; Li, Z.J.; Li, Y.T.; Yang, X.D.; Zhang, J.J.; Zhao, B.Q. Temperature effects on soil organic carbon, soil labile organic carbon fractions, and soil enzyme activities under long-term fertilization regimes. Appl. Soil Ecol. 2016, 102, 36–45. [Google Scholar] [CrossRef]
  52. Mi, W.H.; Sun, Y.; Zhao, C.; Wu, L.G. Soil organic carbon and its labile fractions in paddy soil as influenced by water regimes and straw management. Agric. Water Manag. 2019, 224, 105752. [Google Scholar] [CrossRef]
  53. Qian, J.; Liu, J.J.; Wang, P.F.; Wang, C.; Li, K.; Shen, M.M. Riparian soil physicochemical properties and correlation with soil organic carbon of an inflowing river of Taihu Lake. IOP Conf. Ser. Earth Environ. Sci. 2017, 59, 012053. [Google Scholar] [CrossRef]
  54. Ma, H.P.; Yang, X.L.; Guo, Q.Q.; Zhang, X.J.; Zhou, C.N. Soil organic carbon pool along different altitudinal level in the Sygera Mountains, Tibetan Plateau. J. Mt. Sci. 2016, 13, 476–483. [Google Scholar] [CrossRef]
  55. Martinez, G.; Vanderlinden, K.; Ordóez, R.; Muriel, J.L. Can apparent electrical conductivity improve the spatial characterization of soil organic carbon? Vadose Zone J. 2009, 8, 586–593. [Google Scholar] [CrossRef]
  56. Gaudel, G.; Mosongo, P.S.; Xing, L.; Oljira, A.M.; Zhang, Y.M.; Bizimana, F.; Liu, B.; Wang, Y.Y.; Dong, W.X.; Hu, C.S.; et al. Meta-analysis of the priming effect on native soil organic carbon in response to glucose amendment across soil depth. Plant Soil 2022, 479, 107–124. [Google Scholar] [CrossRef]
Figure 1. Sampling schematic diagram of the study area.
Agronomy 15 01868 g001
Figure 2. Framework diagram of SOC physical-chemical joint grouping. The flow chart is modified with reference to Stewart et al. [9]. Yellow stands for uPOM, Orange stands for pPOM, Green stands for cPOM and Blue stands for bcPOM.
Agronomy 15 01868 g002
Figure 3. Analysis of soil environmental factors in rice paddy along the elevation gradient. Different lowercase letters indicate significant differences between different elevations in the same season (p < 0.05). (a) pH, soil pH; (b) ST, soil temperature; (c) EC, soil electrical conductivity; (d) SW, soil moisture content; (e) TN, soil total nitrogen; (f) C/N ratio, SOC content to TN content ratio. The data are presented as mean ± standard deviation, n = 10.
Agronomy 15 01868 g003
Figure 4. SOC content in rice paddy along the elevation gradient. Different lowercase letters indicate significant differences between different elevations in the same season (p < 0.05). The data are presented as mean ± standard deviation, n = 10, “***” indicate that the treatments had significant effects on uPOM, pPOM, bcPOM and cPOM (p < 0.001).
Agronomy 15 01868 g004
Figure 5. Contents of uPOM, pPOM, bcPOM and cPOM in rice paddy along the elevation gradient. Different lowercase letters indicate significant differences between different elevations in the same season (p < 0.05). uPOM, unprotected SOC fractions; pPOM, physically protected SOC fractions; bcPOM, biochemically protected SOC fractions; cPOM, chemically protected SOC fractions. The data are presented as mean ± standard deviation, n = 10, asterisks indicate that the treatments had significant effects on uPOM, pPOM, bcPOM and cPOM (**, p < 0.01; ***, p < 0.001).
Agronomy 15 01868 g005
Figure 6. Proportion of SOC accounted for by uPOM, pPOM, bcPOM and cPOM along the elevation gradient. uPOM, unprotected SOC fractions; pPOM, physically protected SOC fractions; bcPOM, biochemically protected SOC fractions; cPOM, chemically protected SOC fractions, n = 10. Values in the figure represent the proportion of different OC components to SOC. Different lowercase letters indicate significant differences (p < 0.05) in the same component across different altitudes.
Agronomy 15 01868 g006
Figure 7. Thermal map of correlation between OC of soil fractions and environmental factors. *, p < 0.05; **, p < 0.01. Brown means positive correlation and green means negative correlation. ST, soil temperature; SW, soil moisture content; EC, soil electrical conductivity; pH, soil pH; TN, soil total nitrogen; C/N ratio, SOC content to TN content ratio; uPOM, unprotected SOC fractions; pPOM, physically protected SOC fractions; bcPOM, biochemically protected SOC fractions; cPOM, chemically protected SOC fractions.
Agronomy 15 01868 g007
Figure 8. RDA diagram of SOC fractions and environmental factors. ST, soil temperature; SW, soil moisture content; EC, soil electrical conductivity; pH, soil pH; TN, soil total nitrogen; C/N ratio, soil SOC to TN ratio; uPOM, unprotected SOC fractions; pPOM, physically protected SOC fractions; bcPOM, biochemically protected SOC fractions; cPOM, chemically protected SOC fractions. *, p < 0.05; **, p < 0.01.
Agronomy 15 01868 g008
Table 1. Generalized linear mixed Model (GLM) for repeated measurement (seasons) of SOC fractions at elevation.
IndexMolecular
Freedom
Denominator FreedomF Valuep Value
SOC3156105.156<0.0001
uPOM3156104.779<0.0001
bPOM3156115.012<0.0001
bcPOM315673.548<0.0001
cPOM315633.604<0.001
Disclaimer/Publisher’s Note: The statements, opinions and data contained in all publications are solely those of the individual author(s) and contributor(s) and not of MDPI and/or the editor(s). MDPI and/or the editor(s) disclaim responsibility for any injury to people or property resulting from any ideas, methods, instructions or products referred to in the content.

