Abstract
In the process of plant protection for fruit trees using rotary-wing UAVs, challenges such as droplet drift, insufficient canopy penetration, and low agrochemical utilization efficiency remain prominent. Among these, the uncertainty in the spatio-temporal distribution of downwash airflow is a key factor contributing to non-uniform droplet deposition and increased drift. To address this issue, we developed a wind field numerical simulation model based on an improved hierarchical leaf density model to clarify the spatio-temporal characteristics of downwash airflow, the scale of turbulence regions, and their effects on internal canopy airflow under varying flight altitudes and different rotor speeds. Field experiments were conducted in orchards to validate the accuracy of the model. Simulation results showed that the average error between the simulated and measured wind speeds inside the canopy was 8.4%, representing a 42.11% reduction compared to the non-hierarchical model and significantly improving the prediction accuracy. The coefficient of variation (CV) was 0.26 in the middle canopy layer and 0.29 in the lower layer, indicating a decreasing trend with an increasing canopy height. We systematically analyzed the variation in turbulence region scales under different flight conditions. This study provides theoretical support for optimizing UAV operation parameters to improve droplet deposition uniformity and enhance agrochemical utilization efficiency.
1. Introduction
In recent years, the application of unmanned aerial vehicles (UAVs) in agricultural fertilization has become increasingly widespread [1,2]. The downwash airflow generated by rotary-wing unmanned aerial vehicles (UAVs) is a key factor in determining the effectiveness of fertilizer and pesticide application in orchards [3,4,5]. The penetration ability of this downwash airflow directly affects the distribution of spray within the canopy, and this ability is significantly influenced by the canopy structure, particularly the leaf density distribution. Dense foliage can block or alter the direction of airflow, limiting its reach to the lower layers of the canopy, thus reducing spray uniformity and effectiveness.
Although rotary-wing UAVs offer advantages in pest and disease control, such as improving spray efficiency and reducing agrochemical usage, they still face several challenges in practical applications [6,7,8,9]. These challenges stem primarily from the limited penetration of downwash airflow through the canopy. The complexity of the canopy structure and the leaf density distribution directly affect the depth of airflow penetration and its diffusion path, which in turn impacts the spray performance, leading to issues such as droplet drift and an uneven distribution. This, in turn, leads to uncertainty in the spatio-temporal distribution of downwash airflow [10]. In particular, the instability of the airflow penetration depth and diffusion path when traversing the canopy exacerbates the uneven droplet distribution and drift risk, thereby affecting the efficacy of the application
Currently, researchers both in China and abroad actively explore the spatio-temporal distribution characteristics of downwash airflow generated by rotary-wing UAVs and its influence on canopy airflow. For instance, Zhang [11], Shou [12], Guo [13], and Zhang [14] apply computational fluid dynamics (CFD) with sliding mesh methods to investigate the spatial distribution patterns of downwash airflow. Wang [15] and Chen [16] conducted a predictive study on UAV rotor downwash airflow using a neural network model. Wang [17] used CFD simulations to investigate the deformation of seedling leaves under UAV rotor downwash airflow. Crowe [18] employs water mist and colored smoke as visualization media to reveal the morphology of the wind field and the tip vortex trajectories of unmanned helicopters. Wang [19] uses an attractant red tracer solution to substitute for pesticide spray and analyze the resulting droplet deposition patterns. Tian [20] applies aerial photography and machine vision techniques to evaluate the influence of downwash airflow on canopy deformation. Hu [21] employs anemometers to investigate wind speed variations across different canopy layers during UAV-assisted pollination. Zhang [22], Hong [23,24], Duga [25,26], and Salcedo [27] apply the porous media model to evaluate the penetration capability of downwash airflow produced by rotary-wing UAVs and confirm the reliability of this modeling approach. Despite the progress in understanding downwash airflow characteristics, methodological challenges remain. Most numerical studies utilize simplified assumptions such as a uniform leaf area density (LAD) within the canopy, overlooking vertical heterogeneity that critically affects airflow penetration and turbulence development. Porous media models, although widely adopted for their computational efficiency, often lack sufficient physical grounding when not coupled with layer-specific canopy structures. Experimental approaches provide valuable insights but frequently face limitations in capturing three-dimensional, time-dependent airflow behavior under realistic orchard conditions. Furthermore, current simulation frameworks rarely incorporate dynamically varying vertical LAD distributions, which are essential for accurately predicting the complex interactions between downwash airflow and heterogeneous canopy environments.
In this context, this study focuses on apple trees and investigates the spatio-temporal distribution characteristics of downwash airflow, as well as its interaction mechanisms with the fruit tree canopy. We propose an improved hierarchical leaf density model to quantitatively characterize the canopy’s resistance to rotor-induced airflow. By incorporating real-time rotor speed measurements, we develop a numerical simulation model to represent canopy airflow under rotary-wing UAV downwash conditions. The results of this research provide a theoretical foundation for reducing droplet drift, enhancing penetration uniformity, and improving agrochemical utilization efficiency during UAV-based plant protection operations.
2. Materials and Methods
2.1. Governing Equations
Direct Numerical Simulation (DNS) solves the governing equations of turbulent flows without introducing assumptions or simplifications, theoretically providing highly accurate results. However, accurately capturing the multi-scale characteristics of turbulence requires an extremely fine spatial and temporal resolution. This demand leads to high computational costs, long simulation durations, and substantial hardware requirements.
In contrast, the RNG k-ε turbulence model is more suitable for engineering applications, especially in scenarios involving strong turbulence induced by rotors on rotary-wing UAVs, which significantly influence the mean flow field. The RNG k-ε model accounts for the effects of flow rotation, thereby substantially improving the accuracy of simulating highly swirling turbulent flows. Based on these advantages, this study employs the RNG k-ε model as the primary turbulence modeling approach.
The transport equations for the turbulent kinetic energy (k) and turbulent dissipation rate (ε) in the RNG k-ε model are presented in Equations (1) and (2). In this framework, the dissipation term of turbulent viscosity is defined by the following expression. These equations were obtained by consulting the ANSYS 2022R1 Fluent Theory Guide, which provides the standard form of the RNG k-ε turbulence model.
where Gk is the generation of turbulent kinetic energy due to mean velocity gradients (shear production term); Gb is the generation of turbulent kinetic energy due to buoyancy effects; YM is the contribution to the dissipation rate from the fluctuation-induced expansion in compressible turbulence; C1, C2, and C3 are model constants; σk and σε are turbulent Prandtl numbers for the k-equation and ε-equation, respectively; and Sk and Sε are user-defined source terms for the turbulent kinetic energy and turbulence dissipation rate.
The RNG k-ε turbulence model effectively filters out small-scale vortical structures, retaining only the large-scale eddies that have a significant impact on turbulent transport processes. This approach not only reduces computational complexity but also enables accurate capture of the overall behavior of turbulence. In addition, a differential equation is introduced to characterize the variation in turbulent viscosity, allowing the model to better accommodate the influence of eddies across multiple scales. As a result of the scale elimination process inherent to the RNG framework, the differential equation governing turbulent viscosity is given in Equation (3), enabling the model to more effectively handle low-Reynolds-number conditions and near-wall flows.
Turbulence is influenced by flow rotation and vortical structures, and their effects are accounted for by applying a correction to the turbulent viscosity, as expressed in Equation (5):
where μt0 is turbulent viscosity without vortex correction, Ω is the characteristic vorticity used for evaluating rotational effects, and αs is the vortex correction coefficient.
The value of αs varies depending on the dominant flow characteristics. The vortex correction is consistently applicable to both axisymmetric vortical flows and three-dimensional flows. When employing the RNG k-ε turbulence model, a value of αs = 0.05 is recommended for mildly swirling flows, while αs > 0.05 is used for strongly vortical flow conditions.
2.2. Construction of the Improved Hierarchical Leaf Density Model
As the downwash airflow generated by the rotary-wing UAV passes through the fruit tree canopy, its velocity decreases. This attenuation can be simulated by calculating the momentum loss using the Darcy–Forchheimer equation for porous media flow [28].
where Si is source term in the i-th momentum equation (in the x-, y-, or z-direction), α is permeability, and C2 is the inertial resistance coefficient.
Since the downwash airflow generated by the rotary-wing UAV is turbulent, inertial forces become more dominant, and the viscous loss term can be neglected. The corresponding expression is given as follows [29]:
Studies have shown that porosity exhibits a linear regression relationship with the drag coefficient Cd [30]:
The inertial resistance coefficient C2 is related to the leaf area density (LAD, m2/m3) and the drag coefficient Cd (dimensionless), and it is specifically defined as follows [31]:
The key variable leaf area density (LAD) exhibits a non-uniform distribution pattern that dynamically varies with the canopy structure, height, and other factors. The LAD calculation process is structured as follows. First, the point cloud data of fruit trees during both the full-leaf stage and the leafless branch stage are collected. The data are then denoised and filtered to determine canopy boundaries. Next, using the specific leaf weight method, branches are stratified by height, and the numbers of long and short shoots are statistically analyzed. Representative branches are selected to count the number of leaves, and individual leaves are randomly sampled and punched to calculate the leaf area, which is then combined with measured canopy coverage to obtain LAD through a direct measurement. The point cloud is subsequently divided into a voxel grid, and the Hosoi and Omasa model is applied to calculate the LAD values voxel by voxel. Finally, the LAD obtained from the voxel-based method is validated against the results from the specific leaf weight method to ensure accuracy. Execute Algorithm 1 pseudocode to calculate LAD in detail.
| Algorithm 1. Detailed calculation flow. |
| Inputs: raw tree point cloud data, raw branch stem data, leaf season data, k, T1, T2, Se Outputs: lad, validation_result |
| # Step 1: Point Cloud Data Acquisition and Processing 1:def acquire_point_cloud_data(): 2: leafy_tree_data = capture_leafy_season_tree_data("leafy-season") 3: branch_stem_data = capture_leafless_tree_data("leafless") 4: filtered_data = filter_point_cloud_data(leafy_tree_data, branch_stem_data) 5: return filtered_data # Step 2: Measured LAD using Specific Leaf Weight Method 6:def measured_lad_using_leaf_weight_method(filtered_data) 7: branches_by_layer = count_branches_by_layer(filtered_data) 8: selected_branches = random_select_branches(branches_by_layer) 9: leaf_count = count_leaves_on_selected_branches(selected_branches) 10: punched_leaves = randomly_select_and_punch_leaves(leaf_count) 11: leaf_area = calculate_leaf_area(punched_leaves) 12: lad_with_canopy_coverage = calculate_lad_with_canopy(leaf_area) 13: return lad_with_canopy_coverage # Step 3: Voxel Method for Calculating Leaf Area Density (LAD) 14:def voxel_method_for_calculating_lad(filtered_data): 15: voxel_grid = segment_point_cloud_into_voxels(filtered_data, delta_i, delta_j, delta_s) 16: lad = calculate_lad_using_hosoi_omasa(voxel_grid) 17: return lad # Step 4: Validation 18:def validate_lad(lad_from_leaf_weight, lad_from_voxel_method): 19: validation_result = validate_lad(lad_from_leaf_weight, lad_from_voxel_method) 20: return validation_result |
To explain the above pseudocode, the preprocessed fruit tree point cloud data are segmented to enable the effective identification and extraction of target regions. The point cloud data are divided into cubes of size i × j × s. The main formula is as follows:
where i, j, and s, respectively, represent the number of voxels in the x-, y-, and z-axis directions; xmax, xmin, ymax, ymin, zmax, and zmin represent the boundary values of the point cloud data along the x-, y-, and z-axes; and Δi, Δj, and Δs are voxel sizes along the x-, y-, and z-axis directions, respectively.
After completing the voxel partitioning, the voxel method is used to statistically analyze the distribution of point clouds within each small cube. By determining the interaction between laser beams and each voxel during canopy scanning (whether the laser is blocked or penetrates leaves), the number of laser contacts and penetrations for each voxel is counted. This data is then used to calculate canopy structural parameters such as the leaf area density (LAD). The specific calculation formulas are as follows [32]:
where LAD(h, ΔH) is the leaf area density at height h with a horizontal layer thickness of ΔH, cos θ/G(θ) is the correction factor for the leaf inclination angle relative to the laser beam direction, nI(k) is the number of voxels that intercept the laser beam in the k-th layer, and np(k) is the number of voxels that are penetrated by the laser beam in the k-th layer.
The specific leaf weight method was employed, whereby two holes with a diameter of 1 cm were punched into each leaf. By measuring the weight of both the punched leaf segments and the entire leaf, the area of a single leaf was calculated based on the proportional relationship between the weight and corresponding area. The calculation formula is given below:
where WPL is the weight of the punched leaf segment, WTL is the total weight of the leaf, APH is the area of the punched holes, and ATL is total leaf area.
We obtained the estimated leaf area density (LAD) values for each canopy layer by incorporating the measured canopy coverage. The resulting experimental data validated the accuracy of the point-cloud-based LAD inversion method, providing reliable field evidence for research on the structural parameters of fruit tree canopies.
A function-fitting process was applied to the raw data, where index i was assigned based on height intervals as follows: for the interval [0, 1), i = 1; for [1, 2), i = 2; for [2, 3), i = 3; and for [3, 4), i = 4. Through the fitted curves, we derived the following equation:
where LAD is the fitted variable leaf area density, a is the coefficient of the cubic term, b is the coefficient of the quadratic term, c is the coefficient of the linear term, d is the constant term, and H is height.
A linear regression analysis was performed between the fitted values and the original data points, revealing a significant correlation. In summary, the function-fitting results are deemed accurate. Figure 1 shows the performance of the interval-based function fitting.
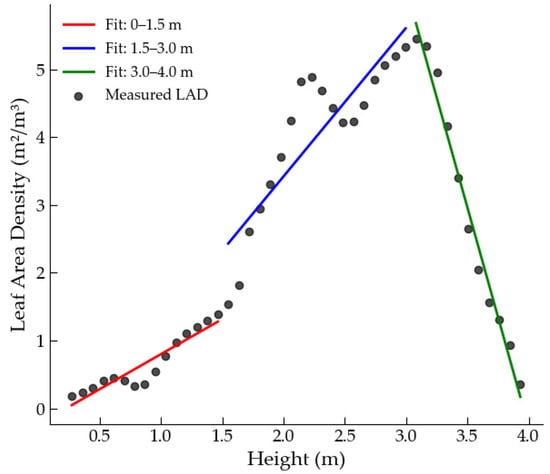
Figure 1.
Interval function-fitting result plot.
To eliminate random spatial layout errors in the fruit tree canopy model, coordinate normalization was applied. The starting point along the Y-axis was set to (0, −2.67, 1.7), establishing a consistent reference position. The transformation from non-standard heights to standardized heights was defined as follows:
where hs is the standardized coordinate value, and hns is the non-standardized coordinate value.
After standardization, the grid was aligned with the corresponding height intervals to enable the calculation of the associated C2 coefficients. A looping algorithm was then employed to traverse all grid cells within the fruit tree canopy model, assigning a specific C2 coefficient to each cell based on its vertical position. This process completed the construction of the hierarchical leaf density model, which supports the simulation of spatial variations in inertial resistance coefficients across canopies with diverse leaf densities and structural characteristics.
2.3. Rotor Model and Simulated Fruit Tree Canopy Structure
Taking the apple tree as a representative case—with its canopy exhibiting an approximately conical structure—a 3-year-old specimen was selected for geometric modeling. The tree has a total height of approximately 2.97 m, a canopy height of about 2.3 m, and a canopy diameter of around 2.2 m. Based on these parameters, the fruit tree canopy model was constructed in SolidWorks 2021, as shown in Figure 2.
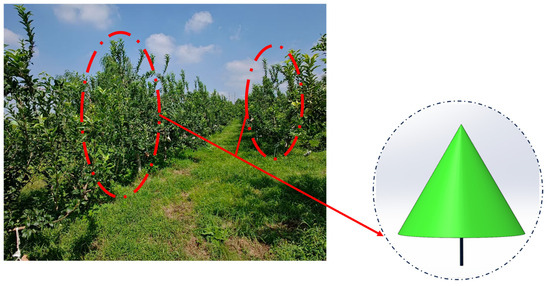
Figure 2.
Simplified modeling diagram of the fruit tree.
A 3D optical scanner was employed to capture the geometry of the UAV rotor blade, and the corresponding 3D model was reconstructed using Geomagic Design X (64-bit). Figure 3 illustrates the reverse engineering process: (a) displays the scanned point cloud data of the rotor blade, while (b) shows the reconstructed 3D rotor model.

Figure 3.
Reverse modeling of the rotor: (a) reverse modeling of the rotor; (b) 3D model of the rotor.
2.4. Boundary Conditions and Computational Methods
Considering that the UAV frame has a minimal impact on the downwash airflow, the numerical simulation simplified the model by excluding the frame and focusing solely on the rotor blades to reduce the computational cost [33]. The precise positions of the rotors were measured to ensure the spatio-temporal accuracy of the downwash airflow distribution. We defined the computational domain as a cuboid measuring 8 m in length (X direction), 8 m in width (Z direction), and 10 m in height (Y direction), as illustrated in Figure 4.
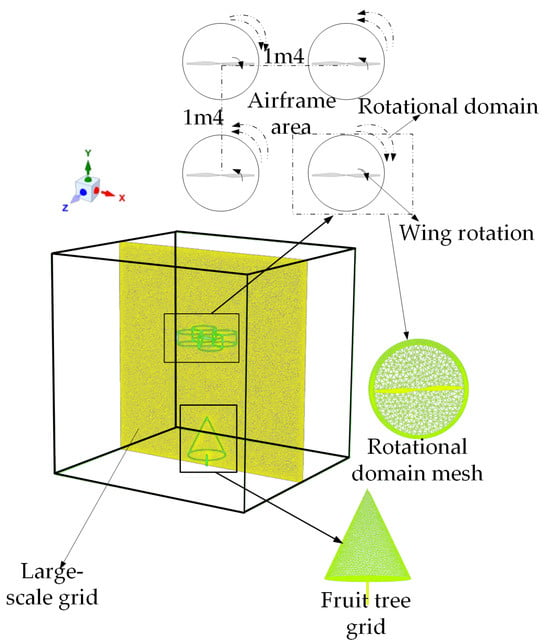
Figure 4.
Schematic diagram of model layout and mesh refinement.
The computational domain is divided into five regions: a static atmospheric domain, and four cylindrical rotating domains each containing a rotor, a canopy subdomain, and a trunk subdomain. Interface boundaries connect the rotating domains with the static atmospheric domain to transfer the rotor downwash airflow into the atmosphere. Similarly, the interface between the canopy subdomain and the static atmospheric domain simulates the canopy’s obstructive effect on the downwash airflow. The trunk subdomain is modeled as a solid body, and the ground is set as a wall boundary. All other boundaries of the computational domain serve as pressure outlets.
The rotating domains prescribe the rotational speed and direction of the rotors. The rotational speed is approximately 1300 r/min and remains stable across different flight altitudes, as confirmed by the rotor speed measurement system. The canopy subdomain applies the improved hierarchical leaf density porous model.
Since the study focuses on the downwash airflow generated by rotary-wing UAVs and its canopy-penetration characteristics, the mesh in the atmospheric domain, rotating domains, and around the fruit tree canopy undergoes local refinement at varying resolutions to ensure simulation accuracy. The detailed model layout and mesh refinement are illustrated in Figure 4.
The rotor blade constitutes the most critical component in the numerical simulation because accurately replicating the downwash airflow generated by its irregular and complex surface geometry is essential to ensuring simulation accuracy. A patch-conforming meshing method generates a high-fidelity mesh that precisely captures the blade’s intricate geometry. The mesh generation results for the rotor blade appear in Figure 5.

Figure 5.
Wing mesh division results.
A medium-resolution mesh captures the primary features of the downwash airflow. Although further mesh refinement improves the simulation accuracy, surpassing a certain resolution threshold causes a disproportionate increase in the computational time while yielding only marginal accuracy gains [34]. The simulation adopts a medium-sized mesh, comprising a total of 17,740,741 mesh elements.
2.5. Computational Method
The rotor downwash airflow of the UAV was simulated using the RNG k–ε turbulence model with swirl-dominated corrections. Air was modeled as an incompressible, viscous Newtonian fluid at a constant temperature of 25 °C. The computational domain was discretized using an unstructured mesh primarily composed of tetrahedral cells generated with a patch-conforming method. The total number of mesh elements was approximately 17.74 million, with local mesh refinement applied near the UAV rotors and inside the canopy to capture critical flow features. The pressure–velocity coupling was handled using the SIMPLE algorithm. For spatial discretization, the Second-Order Upwind scheme was used for the pressure and momentum equations, while the turbulence equations (k and ε) were discretized using the First-Order Upwind scheme. Temporal discretization was performed using a First-Order Implicit scheme. Convergence was considered achieved when the scaled residuals of continuity, velocity components, and turbulence variables (k, ε) dropped below 1 × 10⁻³.
2.6. Field Test
A field validation experiment was conducted on 29 August 2024, at the Daiqingshan Selenium-Rich Ecological Science and Technology Orchard in Zichuan District, Zibo City, Shandong Province, China (36°40′03″ N, 117°57′55″ E). The weather was clear, with ambient temperatures ranging from 20 °C to 29 °C and wind speeds below 1 m/s. To ensure the reliability and reproducibility of the data, each measurement was repeated three times under identical conditions.
To accurately measure the rotor speed of the plant protection UAV and capture the dynamic variation of downwash airflow inside the canopy, we developed a novel measurement system. This system integrates an infrared photoelectric sensor as the core detection component. Each time a rotor blade blocks the infrared beam, the sensor generates a high-level signal, which is then captured by the STM32F103C8T6 microcontroller (STMicroelectronics, Geneva, Switzerland) through a GPIO interrupt. The collected measurement data are transmitted to the host computer via a LoRa communication module, enabling remote monitoring and data analysis. For wind speed measurements, we strategically positioned multiple testo 405i anemometers within the canopy to record changes in the downwash airflow velocity. The key hardware specifications of the system components are listed in Table 1.

Table 1.
Main technical specifications of the rotor speed measurement system hardware.
To verify the accuracy of the numerical simulation, we collected and analyzed wind speed data within the fruit tree canopy during field experiments. The rotor rotation directions were strictly configured according to the simulation model, with diagonal rotors rotating in the same direction and adjacent rotors in opposite directions. A photoelectric tachometer system was used to monitor the rotor speed in real time. Wind speed sensors were installed at different vertical heights within the canopy, with at least three sensors arranged at each layer to ensure data accuracy. The detailed experimental layout is illustrated in Figure 6.
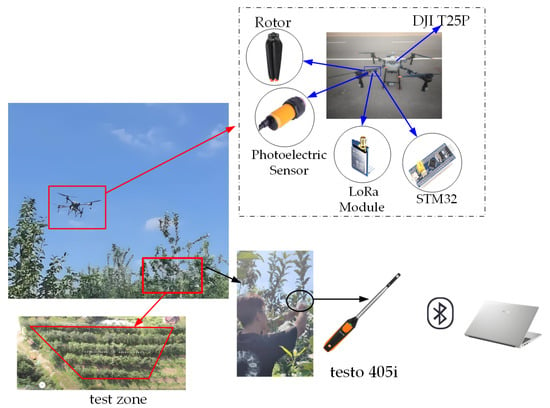
Figure 6.
Detailed experimental layout diagram.
The installation positions of the sensors within the canopy were arranged to match the corresponding sampling locations in the simulation model, enabling a one-to-one spatial correspondence between the measured data and the simulated results.
To ensure the reliability of the data, the average velocity was calculated by averaging the wind speed measurements obtained from multiple sensors placed within the same canopy layer across three independent trials. This approach reduces the influence of random fluctuations and improves the representativeness of the measured airflow characteristics.
A comparative analysis was conducted between the numerical simulation results and the measured data obtained from field experiments in the orchard. The relative error between the two datasets was calculated using the following equation. To obtain the overall mean error, the relative errors of the upper and lower canopy layers were averaged.
where εupper/mid/low is the relative error, is the mean simulated velocity, and is the mean experimental velocity.
The coefficient of variation (CV) plays a crucial role in evaluating the uniformity of velocity distribution within the same canopy layer [35]. By calculating the ratio of the standard deviation to the mean velocity, the CV quantifies the relative dispersion of velocity data. The calculation formula is as follows:
σV represents the standard deviation of velocity:
where Vi is the i-th velocity value, and N is the total number of velocity data points.
μV denotes the mean velocity:
3. Results and Discussion
We analyze numerical simulation results at different flight altitudes using Tecplot 360 EX 2024 R1. To assess the performance of the hierarchical leaf density porous model, we conduct a comparative analysis with the standard porous model.
3.1. Analysis of the Temporal Variation Characteristics of Downwash Airflow
To evaluate the accuracy of the proposed model and visualize the airflow distribution within the canopy, a comparison between simulated and reference airflow velocities was performed. Figure 7 presents the comparison results of the combined airflow velocity obtained from numerical simulations. During the spatio-temporal evolution of downwash airflow generated by the rotary-wing UAV, the airflow velocity remains relatively uniform upon initial contact with the canopy, diffusing downward layer by layer in a cylindrical shape. The first kinetic energy attenuation occurs within the upper canopy region. As the downwash airflow continues to penetrate the canopy, significant variations in the leaf area density increase airflow resistance, accelerating velocity decay. When the downwash airflow reaches the ground, a small-scale ground spreading develops, and near-ground vortices form at the terminal, creating a pronounced ground effect. Within approximately 3.5 s, the downwash airflow essentially covers the entire computational domain, achieving penetration distribution throughout the fruit tree canopy.

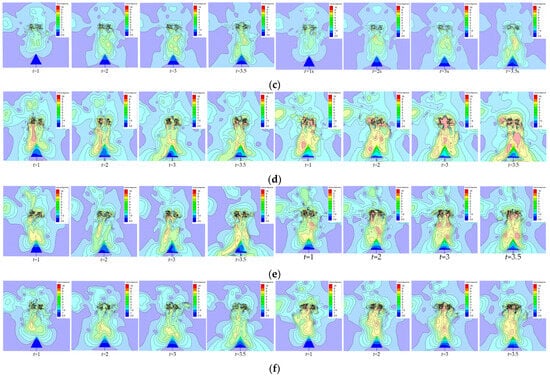
Figure 7.
Comparison diagram of airflow from numerical simulation: (a) porous model (left) and improved hierarchical leaf density porous model (right), H = 3 m; (b) porous model (left) and improved hierarchical leaf density porous model (right), H = 4 m; (c) porous model (left) and improved hierarchical leaf density porous model (right), H = 5 m; (d) improved hierarchical leaf density porous model, rotary wing rotational speed = 1800 r/min (left) and improved hierarchical leaf density porous model, rotary wing rotational speed = 2300 r/min (right); H = 3 m; (e) improved hierarchical leaf density porous model, rotary wing rotational speed = 1800 r/min (left) and improved hierarchical leaf density porous model, rotary wing rotational speed = 2300 r/min (right); H = 4 m; (f) improved hierarchical leaf density porous model, rotary wing rotational speed = 1800 r/min (left) and improved hierarchical leaf density porous model, rotary wing rotational speed = 2300 r/min (right); H = 5 m.
The numerical simulation results based on the porous model and the improved hierarchical leaf density porous model for the same canopy are presented in Figure 7a (left, right), respectively. At a UAV flight altitude of 3 m—defined as the distance between the top canopy contact zone and the UAV rotor—the wind speed decreases from 6.9 m/s to 4.0 m/s and 4.2 m/s under the porous and improved models, respectively. For flight altitudes of 4 m and below, corresponding to the middle and lower canopy layers, the wind speed drops to a minimum of 0.52 m/s with the porous model, while the improved model predicts a slightly higher minimum wind speed of 0.77 m/s. The porous model assumes a constant leaf area density coefficient throughout the canopy, which causes excessive kinetic energy attenuation and notable airflow velocity decay, resulting in similar velocity variations across different canopy positions and thus reducing model accuracy. The numerical simulation results based on the two models at different heights are presented in Figure 7b (left, right), as well as Figure 7c (left, right), respectively, allowing for a direct comparison of their performance. At all heights, the phenomenon of significant attenuation of the lower canopy penetration is evident. In contrast, the improved hierarchical leaf density porous model captures more distinct airflow velocity variations within the canopy, exhibiting a stepwise decay trend that better approximates the actual airflow field changes.
Based on the improved hierarchical leaf density porous model, the study analyzes the canopy-penetration characteristics of the wind field under different flight altitudes. Comparing Figure 7a–c(right), at t = 1 s, the airflow reaches the middle canopy layer at a flight altitude of 3 m, with a wind speed of approximately 1 m/s. At flight altitudes of 4 m and 5 m, the airflow only penetrates the upper canopy, also with wind speeds near 1 m/s. By t = 2 s, downwash airflow at altitudes of 3 m, 4 m, and 5 m all penetrate the middle canopy; however, the maximum wind speed inside the canopy at 3 m reaches about 3 m/s. The maximum wind speeds at 4 m and 5 m are only 66.7% of that at 3 m, although the penetration at 4 m is better than at 5 m. At t = 3 s, the maximum wind speed in the middle-to-lower canopy at 3 m is approximately 2 m/s, while at 4 m and 5 m, it decreases to about 1 m/s, indicating significant velocity attenuation. By t = 3.5 s, ground effects appear for downwash airflow at all flight altitudes; however, the airflow at 4 m and 5 m has not reached the canopy bottom.
Figure 7d–f present the airflow distribution within the canopy at operational heights of 3 m, 4 m, and 5 m, respectively, under different rotor speeds. Combining the analysis in Figure 7a–c(right), it can be concluded that as the rotor speed increases, the penetration effect of the airflow is significantly enhanced, and the airflow velocity inside the canopy also increases noticeably. This indicates that higher rotor speeds can effectively improve airflow penetration, thus enhancing operational efficiency and optimizing spraying performance. However, it is important to note that excessively high rotor speeds may cause the airflow velocity in the upper canopy to become too fast, potentially leading to trunk damage. Therefore, when optimizing operational parameters, a reasonable range of rotor speeds should be considered to avoid the potential risks associated with excessive speed. These results indicate that the downwash airflow penetration is optimal at 3 m, which favors effective fertilizer and pesticide application.
Figure 8 presents the numerical simulation results of the resultant airflow velocity at t = 3.5 s, including the maximum wind speeds at different operating heights and the velocity variation along the canopy centerline for both the porous model and the improved hierarchical leaf area density porous model. An upward airflow segment with a velocity of approximately 1 m/s appears above the rotor. The maximum airflow velocity occurs about 0.8 m below the rotor blade, reaching nearly 9.4 m/s. Between 0.8 m and 1 m below the rotor, the airflow velocity sharply decreases. The region from 1 m to 3 m is defined as the downwash zone, where the airflow velocity exhibits a gentle acceleration. The overall velocity profile in the downwash region displays a “V”-shaped distribution pattern [36]. As the operating height increases, airflow velocity inside the canopy gradually decreases, indicating that the penetration efficiency of the downwash airflow into the fruit tree canopy diminishes with height. Combining the spatio-temporal airflow distribution and canopy penetration analysis, the results show that at an operating height of 3 m, the downwash airflow effectively penetrates the interior of the fruit tree canopy.
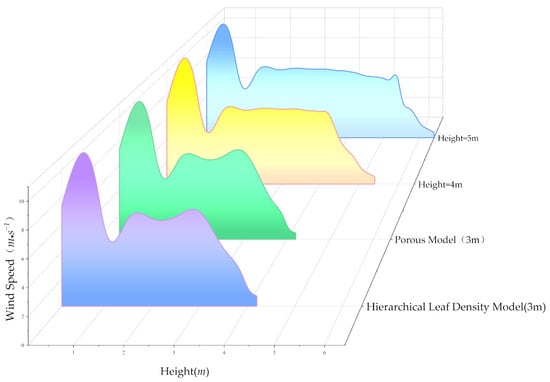
Figure 8.
Velocity variation of downwash airflow.
3.2. Analysis of the Variation Scale of Turbulence
To analyze the rotor-induced airflow structure, Figure 9 presents airflow streamlines under different operating conditions of the rotor. At a flight altitude of 3 m, the streamlines within the rotor zone predominantly follow a vertical downward path, indicating that the rotor forcibly accelerates the airflow, generating a strong downwash. Near the central axis, the streamlines descend almost linearly, representing a typical induced flow pattern. Upon impacting the fruit tree canopy surface below, the airflow disperses radially and expands laterally, creating a pair of symmetrical counter-rotating vortices on either side of the rotor. This vortex structure is especially evident within the red rectangular box, where airflow recirculates and rises. A localized low-pressure region forms at the vortex core, drawing airflow back into the circulation loop and establishing a pronounced recirculation zone. The interaction between rotor-induced airflow and the fruit tree canopy significantly influences the transport and deposition of spray droplets. Moreover, the emergence of vortex structures reveals complex near-ground aerodynamic behaviors that strongly affect the penetration efficiency and precision of rotary-wing UAV spraying operations.

Figure 9.
Rotor airflow streamline distribution.
Comparing flow fields at different flight altitudes reveals a clear trend: the scale of turbulent regions decreases as the altitude increases. Streamline distributions show that at a lower altitude of 3 m, the rotor airflow demonstrates stronger downwash penetration, rapidly reaching the lower canopy and forming distinct velocity gradients with the surrounding still air. This condition promotes turbulence development and swirling motions. At this altitude, turbulence structures become more complex, recirculation intensifies, and the disturbance range expands. Conversely, when the flight altitude rises to 4 or 5 m, the downwash airflow travels a longer path, causing greater energy dissipation, reduced penetration ability, and limited turbulence formation. Vortex structures simplify, and recirculation weakens accordingly. This phenomenon clearly indicates that the flight altitude significantly impacts the spatial characteristics of turbulence and recirculation formation. Specifically, lower altitudes concentrate airflow impact zones and amplify disturbances, whereas higher altitudes reduce turbulence interactions with the ground and canopy obstacles, thus weakening recirculation effects. Such recirculation directly affects droplet drift and constitutes a major factor contributing to spray liquid wastage.
The distributions of Y-direction velocity at various vertical positions relative to the UAV rotor—1.5 m and 1 m above, and 1 m and 1.5 m below—reveal the disturbance characteristics and flow patterns induced by rotor airflow at these locations (Figure 10). The Y-direction velocity serves as a crucial indicator, reflecting the vertical fluid motion, as well as the symmetry and intensity of airflow disturbances in both positive and negative directions. This parameter provides essential insight into the rotor’s downwash and suction effects.

Figure 10.
Y-direction rotor airflow velocity contour map. (a) 1.5 m above the rotor; (b) 1 m above the rotor; (c) 1 m below the rotor; (d) 1.5 m below the rotor.
Above the rotor, as depicted in Figure 10a,b, the Y-direction velocity predominantly exhibits negative values, featuring a pronounced negative velocity core near the center that reaches up to −5 m/s. This pattern signifies a strong downward airflow driven by the rotor’s suction. The negative-velocity region displays a four-lobed distribution pattern, corresponding to the vortex structures generated by the periodic disturbances of the rotor blades. The formation of this negative-velocity zone results from the high-speed rotation of the rotor creating a low-pressure area on the blade surfaces, which draws air from above into the rotor plane. At 1.5 m above the rotor, the magnitude of the negative velocity decreases and the velocity gradient becomes more moderate, indicating that the suction effect weakens with an increasing distance and vortices diffuse outward.
Below the rotor, illustrated in Figure 10c,d, the Y-direction velocity field remains mainly negative but contains embedded local zones of positive velocity, forming a complex flow structure. At 1 m below the rotor, the central region maintains strong negative velocity, while local positive velocity zones (shown as light green and yellow rings) progressively appear in the outer regions. This flow pattern reflects a typical downwash boundary recirculation phenomenon, in which the intense downward airflow entrains surrounding air upward, causing velocity reversal. This phenomenon arises from the rotor’s strong downward forcing interacting with the ambient still air, producing significant shear and vorticity superposition that induces annular recirculation or secondary flow structures. At 1.5 m below the rotor, the negative velocity weakens further, the core velocity zone expands outward, and a clearly symmetric vortex ring distribution emerges, indicating the non-uniform evolution of downwash diffusion.
The Y-direction velocity distributions across these heights comprehensively reveal the spatial extent and intensity of rotor-induced disturbances. Above the rotor, the airflow is dominated by negative suction flows with relatively symmetric velocity patterns. Below the rotor, the flow exhibits stronger negative velocities combined with localized positive velocities indicating recirculation, alongside a wider disturbance range. These observations demonstrate that the rotor’s downwash retains high kinetic energy and strong disturbances in the near field, while gradually attenuating and diffusing farther away.
3.3. Experimental Verification and Analysis
At t = 3.5 s and a working height of 3 m, a comparative analysis and validation were performed among the results of the improved hierarchical leaf density porous model, the conventional porous model, and the field experiment conducted in the orchard, based on the sensor installation positions within the canopy. The results are presented in Figure 11.
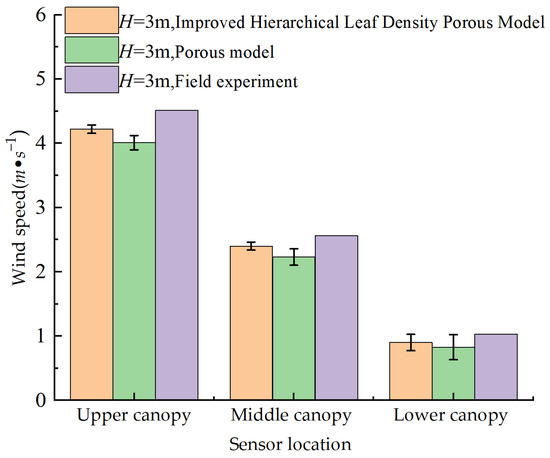
Figure 11.
Diagram of the average airflow velocity of sensors at each canopy layer.
A comparison of the airflow velocity data measured in the orchard experiment with the numerical simulation results reveals consistent trends between the orchard measurements and the improved hierarchical leaf density porous model, particularly in the wind speed variations within the middle canopy layer, where differences are minimal. In contrast, the conventional porous model exhibits significantly larger simulation errors in the middle and lower canopy layers. At t = 3.5 s and a flight height of 3 m, the average error between the orchard measurements and the improved hierarchical leaf density porous model was 8.4%, while the conventional porous model showed an average error of approximately 14.51%.
Previous studies, such as Reference 22, validated the porous model under non-canopy conditions, reporting relative errors within 10% at 0.3, 0.8, 1.3, and 1.8 m below the rotor and not exceeding 25% near the ground (2.3 m). While these results demonstrated the reliability of the porous model in open-field environments, they did not assess simulation accuracy within the tree canopy. The present study extends this line of research by evaluating airflow simulation inside the canopy structure, where flow attenuation and spatial heterogeneity are more complex. The improved model maintains an average error of only 8.4% in the middle and lower canopy layers, demonstrating its enhanced ability to reproduce internal airflow dynamics and providing a more accurate and reliable representation of UAV-induced downwash under orchard conditions.
The improved model was obtained by performing linear fitting between the average sensor-measured data from three sets of experiments and the corresponding simulated values. The results show an R2 of 0.973 for the middle layer and 0.926 for the bottom layer. The fitting equations are y = 1.1212x + 0.068 for the middle layer and y = 1.112x + 0.0107 for the bottom layer. The fitting results are presented in Figure 12. The lower fitting accuracy in the bottom layer may be attributed to greater airflow disturbances near the ground, which can cause more pronounced deformation and affect the fitting precision.
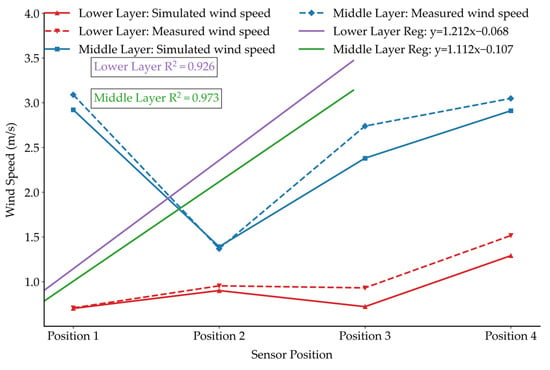
Figure 12.
R2 fitting effect drawing.
By calculating the ratio of the standard deviation to the mean velocity, the coefficient of variation (CV) effectively quantifies the relative dispersion of airflow velocity within the canopy. Figure 13 presents the wind speed data from three sets of orchard experiments, along with the maximum and minimum wind speeds derived from numerical simulations, and the corresponding CV values for each canopy layer. Due to the relatively small surface area of the upper canopy, it is excluded from detailed analysis.
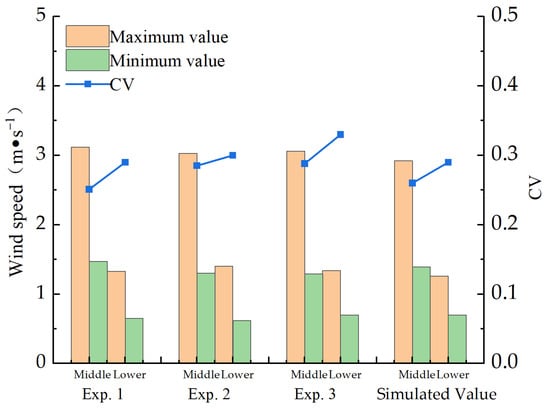
Figure 13.
Illustration of CV coefficient.
The airflow distribution pattern within the fruit tree canopy closely matches the results of the numerical simulation. The CV value for the middle canopy layer is 0.26, while that of the lower layer is 0.29. As the canopy height increases, the CV value gradually decreases. This trend suggests that airflow in the central regions of the middle and lower canopy layers is frequently obstructed, resulting in significant velocity attenuation and limited penetration. These flow disruptions are a major factor contributing to the difficulty of the UAV downwash airflow in reaching the interior canopy, ultimately causing an uneven airflow distribution.
4. Conclusions
In summary, this study proposed a novel CFD-based modeling and analysis framework to investigate UAV-induced downwash airflow interactions with fruit tree canopies, providing technical support for optimizing UAV operation parameters in precision plant protection. The main conclusions are as follows:
- (1)
- This study systematically investigated the spatio-temporal characteristics of UAV-induced downwash airflow and established a refined numerical simulation model to describe airflow velocity distributions within fruit tree canopies. The simulation revealed that the downwash airflow initially forms a cylindrical column, then disperses in a branching pattern upon impacting the canopy, eventually producing a ground effect. Among the tested configurations, a flight height of 3 m was found to deliver the most effective canopy penetration. This height balances the airflow impact intensity and turbulence structure development, ensuring improved interaction with the internal canopy structure.
- (2)
- An analysis of turbulence dynamics under varying flight altitudes showed that lower operating heights generate stronger turbulence and more pronounced recirculation, with intensified shear interactions near the rotor. In contrast, increasing the flight altitude reduces the size of turbulent structures and weakens the flow disturbance. The Y-direction velocity profile further confirmed that alternating positive and negative gradients near the rotor serve as the key mechanism for turbulence generation.
- (3)
- Validation results demonstrated the superior performance of the improved hierarchical leaf density porous model compared to the conventional porous model. At t = 3.5 s and a 3 m flight height, the average error between the simulation and orchard measurements was only 8.4%, significantly lower than the 14.51% error observed with the conventional model. Moreover, the coefficients of variation (CVs) in the middle and lower canopy layers were 0.26 and 0.29, respectively, indicating good agreement between simulated and measured airflow distribution uniformity. These findings confirm the improved model’s effectiveness in capturing real-world canopy airflow dynamics and provide a reliable reference for UAV operation optimization in precision agriculture.
- (4)
- Future research should further explore the application of this model framework under strong wind conditions, focusing on simulating the interaction between UAV downwash airflow and external wind disturbances. Such studies could provide insights into airflow deflection, penetration attenuation, and overall airflow stability within canopies, thereby enhancing the robustness of UAV operation strategies in open-field environments.
Author Contributions
Conceptualization, S.F. and W.Z.; Formal analysis, N.R. and Y.D.; Funding acquisition, S.F.; Investigation, S.L. and M.S.; Methodology, Y.J. and H.Z.; Project administration, S.F.; Resources, N.R. and S.L.; Software, N.R. and L.S.; Supervision, Y.J. and W.Z.; Validation, S.F., N.R., M.S. and W.Z.; Visualization, N.R.; Writing—original draft, N.R.; Writing—review and editing, S.F. and W.Z. All authors have read and agreed to the published version of the manuscript.
Funding
This research was funded by the Key R&D Program of Shandong Province, China (No. 2023TZXD064); the Key R&D Program of Shandong Province, China (No. 2023TZXD072); and the Shandong Provincial Natural Science Foundation (No. ZR2022QE217).
Data Availability Statement
The data presented in this study are available within the article.
Acknowledgments
The authors thank the equipment support provided by Shandong Agricultural University.
Conflicts of Interest
The authors declare no conflicts of interest.
References
- Zhu, Z.; Yang, M.; Li, Y.; Wongsuk, S.; Zhao, C.; Xu, L.; Zhang, Y.; He, X.; Wang, C. Optimization Design and Atomization Performance of a Multi-Disc Centrifugal Nozzle for Unmanned Aerial Vehicle Sprayer. Agronomy 2024, 14, 2914. [Google Scholar] [CrossRef]
- Wongsuk, S.; Qi, P.; Wang, C.; Zeng, A.; Sun, F.; Yu, F.; Zhao, X.; He, X. Spray performance and control efficacy against pests in paddy rice by UAV-based pesticide application: Effects of atomization, UAV configuration and flight velocity. Pest Manag. Sci. 2024, 80, 2072–2084. [Google Scholar] [CrossRef]
- Zeng, W.; Deng, J.; Gao, Q.; Jia, R.; Lan, Y.; Zhang, J.; Chen, P.; Xiao, H.; Zhang, Y. P20 plant protection UAV to control cnaphalocrocis medinalis by reduced pesticide application. Trans. Chin. Soc. Agric. Eng. 2021, 37, 53–59. [Google Scholar]
- Zhang, H.; Lan, Y.; Wen, S.; Xu, T.; Yu, F. Research progress in rotor airflow model of plant protection UAV and droplet motion mechanism. Trans. Chin. Soc. Agric. Eng. 2020, 36, 1–12. [Google Scholar]
- Liu, J.; Wang, H.; He, Y.; Wang, M.; Li, G.; YU, D.; Zhao, P.; Feng, Z. Application and challenges of UAV-based technology in precision forestry. Trans. Chin. Soc. Agric. Eng. 2024, 40, 14–24. [Google Scholar]
- Liao, J.; Zang, Y.; Zhou, Y.; Luo, X. Quality evaluation method and optimization of operating parameters in crop aerial spraying technology. Trans. Chin. Soc. Agric. Eng. 2015, 31, 38–46. [Google Scholar]
- Liu, L.; Sun, K.; Zhang, Q.; Chen, L.; Cheng, B.; Zheng, Q. Thermal Spray System Design and Droplet Distribution Characteristics Test of Maize Plant Protection UAV. Trans. Chin. Soc. Agric. Mach. 2022, 53, 80–88. [Google Scholar]
- Li, H.; Quan, L.; Pi, P.; Guo, Y.; Ma, Z.; Yu, T. Method for Controlling Directional Deposition of Mist Droplets for Target Application in Field. Trans. Chin. Soc. Agric. Mach. 2022, 53, 102–109+258. [Google Scholar]
- Liu, X.; Liu, X.; Cui, H.; Yuan, J. Research Progress and Trend Analysis of Crop Canopy Droplet Deposition. Trans. Chin. Soc. Agric. Mach. 2021, 52, 1–20. [Google Scholar]
- Liao, X.; Xiao, Q.; Zhang, H. UAV remote sensing: Popularization and expand application development trend. Nat. Remote Sens. Bull. 2019, 23, 1046–1052. [Google Scholar] [CrossRef]
- Zhang, Z.; Zeng, R.; Lai, Q.; Yuan, S.; Shen, S.; Yang, L. Investigation of Effects of Downwash Airflow Field on Droplet Motion Characteristics of Small Plant Protection Unmanned Aerial Vehicles. Trans. Chin. Soc. Agric. Mach. 2023, 54, 208–216+226. [Google Scholar]
- Shouji, C.; Yu, S.-H.; Kang, Y.-H.; Choi, Y.; Dafsari, R.A.; Lee, J. Experimental analysis of the downwash airflow created by a single rotor blade in agricultural drones. J. Biosyst. Eng. 2021, 46, 317–331. [Google Scholar] [CrossRef]
- Guo, Q.W.; Zhu, Y.Z.; Tang, Y.; Hou, C.J.; He, L.; Zhuang, J.J.; Zheng, Y.L.; Luo, S.M. CFD simulation and experimental verification of the spatial and temporal distributions of the downwash airflow of a quad-rotor agricultural UAV in hover. Comput. Electron. Agric. 2020, 172, 105343. [Google Scholar] [CrossRef]
- Zhang, J.; Chen, Q.; Liu, J.; Wang, Y.; Zhou, H.P.; Yang, F.B.; Ru, Y. Experiments and CFD simulation of downwash airflow and fog distribution discharged from a single-rotor UAV fitted with a pulse-jet thermal fogging machine. Biosyst. Eng. 2024, 240, 142–151. [Google Scholar] [CrossRef]
- Wang, T.; Wen, S.; Lan, Y.; Zhang, H.; Yin, X.; Zhang, J. Prediction model for the downwash flow field of single-rotor plant protection UAV using PINNs. Trans. Chin. Soc. Agric. Eng. 2023, 39, 83–91. [Google Scholar]
- Chen, Q.; Zhang, J.; Zhang, C.; Zhou, H.; Jiang, X.; Yang, F.; Wang, Y. CFD analysis and RBFNN-based optimization of spraying system for a six-rotor unmanned aerial vehicle (UAV) sprayer. Crop Prot. 2023, 174, 106433. [Google Scholar] [CrossRef]
- Wang, Q.L.; Ren, Y.L.; Wang, H.J.; Wang, J.S.; Zhou, G.S.; Yang, Y.; Xie, Z.W.; Bai, X.T. Research on UAV Downwash Airflow and Wind-Induced Response Characteristics of Rapeseed Seedling Stage Based on Computational Fluid Dynamics Simulation. Agriculture 2024, 14, 1326. [Google Scholar] [CrossRef]
- Crowe, T.; Downey, D.; Giles, D. Digital device and technique for sensing distribution of spray deposition. Trans. ASAE 2005, 48, 2085–2093. [Google Scholar] [CrossRef]
- Wang, C.; He, X.; Jane, B.; Qi, P.; Yang, Y.; Gao, W. Effect of Downwash Airflow Field of 8-rotor Unmanned Aerial Vehicle on Spray Deposition Distribution Characteristics under Different Flight Parameters. Smart Agric. 2020, 2, 124–136. [Google Scholar]
- Tian, Z.; Xue, X.; Xu, Y.; Yang, F.; Sun, Z. Effect of Plant Protection UAVs Downwash on Crop Canopy. Trans. Chin. Soc. Agric. Mach. 2021, 52, 40–48. [Google Scholar]
- Hu, S.; Cao, X.; Deng, Y.; Lai, Q.; Wang, G.; Hu, D.; Zhang, L.; Liu, M.; Chen, X.; Xiao, B.; et al. Effects of the flight parameters of plant protection drone on thedistribution of pollination droplets and the fruit setting rate of camellia. Trans. Chin. Soc. Agric. Eng. 2023, 39, 92–100. [Google Scholar]
- Zhang, H.; Qi, L.; Wu, Y.; Cheng, Z.; E, M. Spatio-temporal Distribution of Down-wash Airflow for Multi-rotor Plant Protection UAV Based on Porous Model. Trans. Chin. Soc. Agric. Mach. 2019, 50, 112–122. [Google Scholar]
- Hong, S.W.; Zhao, L.Y.; Zhu, H.P. CFD simulation of airflow inside tree canopies discharged from air-assisted sprayers. Comput. Electron. Agric. 2018, 149, 121–132. [Google Scholar] [CrossRef]
- Hong, S.-W.; Zhao, L.; Zhu, H. CFD simulation of pesticide spray from air-assisted sprayers in an apple orchard: Tree deposition and off-target losses. Atmos. Environ. 2018, 175, 109–119. [Google Scholar] [CrossRef]
- Duga, A.T.; Delele, M.A.; Ruysen, K.; Dekeyser, D.; Nuyttens, D.; Bylemans, D.; Nicolai, B.M.; Verboven, P. Development and validation of a 3D CFD model of drift and its application to air-assisted orchard sprayers. Biosyst. Eng. 2017, 154, 62–75. [Google Scholar] [CrossRef]
- Duga, A.T.; Dekeyser, D.; Ruysen, K.; Bylemans, D.; Nuyttens, D.; Nicolai, B.M.; Verboven, P. Numerical Analysis of the Effects of Wind and Sprayer Type on Spray Distribution in Different Orchard Training Systems. Bound.-Layer Meteorol. 2015, 157, 517–535. [Google Scholar] [CrossRef]
- Salcedo, R.; Vallet, A.; Granell, R.; Garcerá, C.; Moltó, E.; Chueca, P. Eulerian-Lagrangian model of the behaviour of droplets produced by an air-assisted sprayer in a citrus orchard. Biosyst. Eng. 2017, 154, 76–91. [Google Scholar] [CrossRef]
- Zhang, H.; Qi, L.J.; Wu, Y.L.; Musiu, E.M.; Cheng, Z.Z.; Wang, P. Numerical simulation of airflow field from a six-rotor plant protection drone using lattice Boltzmann method. Biosyst. Eng. 2020, 197, 336–351. [Google Scholar] [CrossRef]
- Ha, T.; Lee, I.B.; Hong, S.W.; Kwon, K.S. CFD assisted method for locating and processing data from wind monitoring systems in forested mountainous regions. Biosyst. Eng. 2019, 187, 21–38. [Google Scholar] [CrossRef]
- Zhang, Y. CFD Modeling Research on Orchard Spatial Airflowfield and Interaction Between Airflow and Tree Fororchard Spraying. Master’s dissertation. Northwest A&F University, Xianyang, China, 2021. [Google Scholar]
- Wilson, J.D. Numerical studies of flow through a windbreak. J. Wind Eng. Ind. Aerodyn. 1985, 21, 119–154. [Google Scholar] [CrossRef]
- Chen, Y.; Liu, J.; Yao, X.; Deng, Y.; Hao, Z.; Lin, L.; Wu, N.; Yu, K. Effect of layer thickness and voxel size inversion on leaf area density based on the voxel-based canopy profiling method. J. For. Res. 2022, 33, 1545–1558. [Google Scholar] [CrossRef]
- Yang, F.B.; Xue, X.Y.; Cai, C.; Sun, Z.; Zhou, Q.Q. Numerical Simulation and Analysis on Spray Drift Movement of Multirotor Plant Protection Unmanned Aerial Vehicle. Energies 2018, 11, 2399. [Google Scholar] [CrossRef]
- Tang, Q.; Zhang, R.R.; Chen, L.P.; Deng, W.; Xu, M.; Xu, G.; Li, L.L.; Hewitt, A. Numerical simulation of the downwash flow field and droplet movement from an unmanned helicopter for crop spraying. Comput. Electron. Agric. 2020, 174, 105468. [Google Scholar] [CrossRef]
- Zhong, W.; Yang, W.T.; Li, Y.L.; Wang, G.Q.; Dong, X.; Ou, M.X.; Jia, W.D.; Wang, X.W. Effects of Nozzle Arrangement Strategies on Spray Uniformity in Soybean-Maize Intercropping. Agronomy 2025, 15, 985. [Google Scholar] [CrossRef]
- Wang, L.; Zhang, Q.; Hou, Q.; Chen, D.; Wang, S. Vertical Distribution Law of Six-rotor Plant Protection UAV Based on Multi-feature Parameters. Trans. Chin. Soc. Agric. Mach. 2022, 53, 75–83. [Google Scholar]
Disclaimer/Publisher’s Note: The statements, opinions and data contained in all publications are solely those of the individual author(s) and contributor(s) and not of MDPI and/or the editor(s). MDPI and/or the editor(s) disclaim responsibility for any injury to people or property resulting from any ideas, methods, instructions or products referred to in the content. |
© 2025 by the authors. Licensee MDPI, Basel, Switzerland. This article is an open access article distributed under the terms and conditions of the Creative Commons Attribution (CC BY) license (https://creativecommons.org/licenses/by/4.0/).