1. Introduction
Against the backdrop of the severe challenges faced by global agriculture, environmental factors are increasingly influencing the growth and yield of crops [
1,
2]. In particular, under low-nitrogen and low-phosphorus stress conditions, the stress tolerance and growth performance of barley (
Hordeum vulgare L.), which is an important forage crop, is directly related to the sustainability of agricultural production and food security [
3,
4,
5]. Barley is a highly important crop with multiple significant aspects. As a forage crop, it offers nutrition for livestock [
6]. Ecologically, it helps prevent soil erosion, improves soil, and contributes to biodiversity [
7,
8]. In terms of food security, it is part of local diets in some areas, and its study aids agricultural sustainability [
9,
10]. With the over-use of nitrogen and phosphorus fertilizers and their negative impacts on the environment, how to efficiently utilize these nutrient resources has become an important topic in agricultural research [
8,
11,
12]. Nitrogen is vital for barley. It is present in chlorophyll for photosynthesis, and is also present in proteins and nucleic acids. It affects growth, yield, and quality; for example, it increases protein content for malting. Phosphorus is essential. It is involved in energy transfer (ATP), DNA, and cell membranes. Deficiency causes stunted growth and reduced yield, affecting root development, etc. [
8]. Therefore, enhancing the growth potential of barley in a low-nutrition environment is of great practical significance in terms of increasing farmers’ incomes, conserving resources, and protecting the environment. In addition, given the important role of barley in forage production and ecological improvement [
9,
10], studying its performance under low-nitrogen and low-phosphorus conditions can provide valuable references for the breeding and management of other crops. This, in turn, can lead to more widespread sustainable development in agriculture.
Barley is a multifunctional crop with critical roles in agriculture and ecology [
3]. As a forage crop, it provides high-quality feed for livestock, supporting animal husbandry development [
8]. Ecologically, its dense root system helps prevent soil erosion, improves soil structure, and promotes biodiversity in agricultural ecosystems [
9,
10]. In terms of food security, it serves as a staple food in some regions and a key raw material for brewing, making it economically vital [
11,
12]. Given these roles, understanding barley’s performance under low-nitrogen and low-phosphorus conditions is not only crucial for optimizing its cultivation, but also provides insights for improving stress tolerance in other crops, thereby advancing sustainable agriculture on a broader scale. Research on barley under low-nitrogen and low-phosphorus stresses has been gradually deepening. Numerous studies have centered on the differences in stress tolerance among various varieties, and it has been discovered that significant genotypic differences exist in barley’s sensitivity to nitrogen and phosphorus [
12]. For instance, Ren et al. [
12] demonstrated in an experiment involving 150 barley varieties that, under low-phosphorus stress conditions, there were significant differences in the expression levels of genes related to phosphorus uptake, transport, and metabolism in barley roots. Moreover, these changes were most closely associated with the genetic background and physiological characteristics of the varieties. Furthermore, previous studies have shown [
13,
14] that, in a low-phosphorus environment, some barley varieties are able to maintain a relatively high biomass by enhancing root structure and nitrogen-phosphorus absorption capabilities, thus increasing the yield. Heydari et al. [
14] noticed that, under low-phosphorus conditions, the roots of barley showed the traits of thinning and elongation. These growth traits enabled it to be an excellent phosphorus-efficient variety. These research findings strengthen the understanding of the physiological adaptation mechanisms of crops in adverse conditions and clarify the directions and goals for future barley breeding. In terms of fertilization management, researchers are also devoting themselves to exploring the effects of the combined application of bio-fertilizers, chemical fertilizers, and organic fertilizers on barley growth [
15,
16]. Numerous studies have demonstrated that, when organic and bio-fertilizers are applied, crops can more effectively preserve their growth vitality, particularly in drought and low-nutrient conditions [
17,
18]. This finding presents a new fertilization concept for agricultural production practice; namely, in the case of resource shortages, how multiple fertilizers can be comprehensively utilized to improve crop quality and yield.
Against the backdrop of global agricultural challenges, nutrient scarcity—particularly of N and P—has emerged as a pressing constraint. Nitrogen and phosphorus are non-renewable resources: global phosphate rock reserves are projected to deplete within 50–100 years, while nitrogen fertilizer production relies heavily on fossil fuels, contributing to energy insecurity and greenhouse gas emissions [
19,
20]. Regionally, in arid and semi-arid areas like the Hexi Corridor (where our experiment was conducted), low soil fertility (total N: 1.00 g·kg
−1; total P: 0.87 g·kg
−1 in 0–20 cm layer) and limited fertilizer accessibility exacerbate crop vulnerability to nutrient stress. The discovery that organic and bio-fertilizers can help crops maintain growth, especially in harsh conditions, has led to a novel fertilization concept, which is significant for optimizing agricultural production when resources are limited, aiming at enhancing both crop quality and yield [
21,
22]. Moreover, excessive reliance on N and P fertilizers to mitigate scarcity has led to severe environmental consequences, including soil acidification, water eutrophication, and biodiversity loss [
23,
24]. This creates a paradox: while fertilizers are used to combat nutrient shortage, their overuse worsens long-term resource depletion and ecological damage. Thus, exploring crops’ intrinsic tolerance to such stress is essential for sustainable agriculture. At present, the screening and identification of crop lines with tolerance to low nitrogen and phosphorus levels and the related physiological characteristics are mainly focused on major crops, such as wheat, corn, and rice. However, there are few studies on the screening of barley lines with tolerance to low nitrogen and phosphorus levels and the related physiological characteristics. Moreover [
10,
12,
25], the indicators and evaluation systems for screening barley lines with tolerance to low-nitrogen throughout the whole growth period are not yet perfect.
In this study, two consecutive years (2021–2022) of field experiments covering the whole growth period of barley were carried out. The differences in growth indexes and quality indexes of nine barley lines cultivated in the Industrial Crops and Beer-raw-materials Research Institute of Gansu Academy of Agricultural Sciences under low-nitrogen and low-phosphorus stress were studied. By analyzing the pooled data from both years, principal component analysis was conducted to calculate the comprehensive scores of principal components, and an evaluation index system for nitrogen and phosphorus utilization of barley lines was established. The stability of trait performance across the two years was considered, ensuring the reliability of the evaluation. In this way, excellent germplasms with strong adaptability and high nitrogen and phosphorus utilization efficiency can be found, providing a theoretical basis for the research on breeding barley varieties with low-nitrogen and low-phosphorus tolerance. The specific aim of this study is to: (1) evaluate the growth, quality, and yield responses of nine barley genotypes to low nitrogen (N) and phosphorus (P) stress over two growing seasons; (2) identify key stress tolerance traits correlated with yield under such conditions; and (3) screen superior genotypes with stable performance under low N/P stress for breeding programs, thereby providing a theoretical basis for reducing fertilizer input and promoting sustainable barley production.
2. Materials and Methods
2.1. Experimental Materials
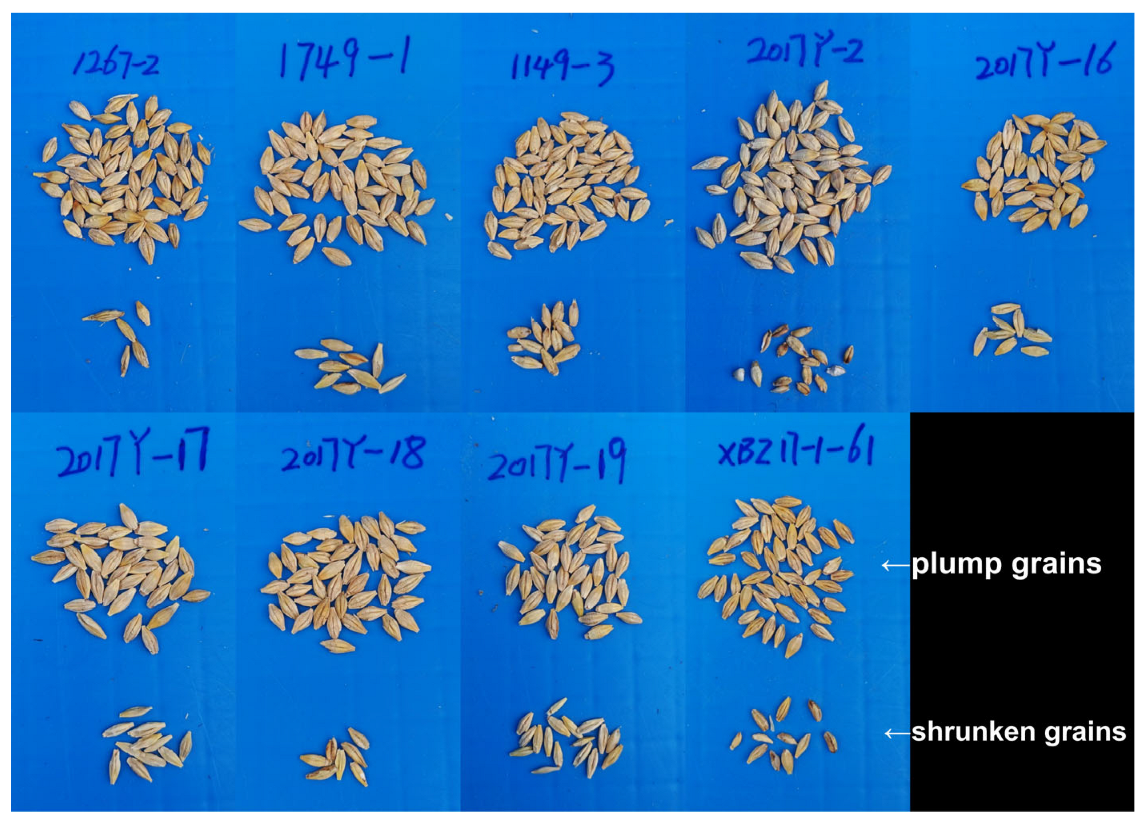
In the early stage of this experiment, we utilized the germplasm resources of our research group. Over two consecutive growing seasons (2021–2022), under no fertilization conditions, we screened 9 low-nitrogen and low-phosphorus tolerant lines from 30 materials through yield screening (compared with the drought-resistant variety Ganpi 7 as a control). We then conducted a correlation study between stress resistance traits and yield across both years to ensure the stability of screening results. The barley seeds for the test are barley lines 1267-2 (originated from 0321-40 × 0401), 1749-1 (originated from Ganpi 6 × 1312), 1149-3 (originated from Y0317-0-3 × 8810), 2017Y-2 (selected for salt-alkali tolerance), 2017Y-16 (selected for salt-alkali tolerance), 2017Y-17 (selected for salt-alkali tolerance), 2017Y-18 (selected for salt-alkali tolerance), 2017Y-19 (selected for salt-alkali tolerance), and XBZ17-1-61 (bred by microspore breeding). All these lines are cultivated by the Economic Crops and Beer Material Institute, Gansu Academy of Agricultural Sciences.
These barley lines are of the spring barley and two-rowed hulled barley types. Barley, as an important cereal crop model, can be used for feed and brewing. It can also be used as food and health food.
2.2. Experimental Site Conditions
Huangyang Town represents the plain irrigation area in the eastern part of Hexi. It has an altitude of 1766 m, with an annual sunshine duration of 2360–2920 h, an annual average temperature of 6.0–7.0 °C, an annual precipitation of 200–260 mm, and a frost-free period of 135–150 d. The soil is irrigated desert soil. The previous crop was barley. In the plough layer (0–20 cm), the organic matter content was 1.71%, the total nitrogen content is 1.00 g·kg−1, the total phosphorus content is 0.87 g·kg−1, the total potassium content is 38.50 g·kg−1, the available nitrogen content is 70.30 mg·kg−1, the available phosphorus content is 35 mg·kg−1, and the pH = 8.30. After the summer harvest last year, the land was ploughed. In mid-October, the land was flooded with water for soaking, and rotary-tilled once in early November. In January of the following year, it was compacted twice.
Regarding seed dressing and coating, seed dressing with pesticides is a way to prevent diseases and pests by mixing seeds with pesticides before barley sowing. In the barley—producing areas of Gansu province, the main disease is stripe disease, and the main pest is wireworm. To prevent barley stripe disease, carboxin can be used for seed coating. To control underground pests, isofenphos can be used for seed dressing. When the pesticide used for dressing is in powder form, the seeds must be dry, and it is better to cover the seeds after dressing; if it is a wet agent, generally, it should be sown immediately after dressing to avoid phytotoxicity. Using 3% carboxin + 40% isofenphos to dress or coat seeds at a rate of 2‰ of the seed quantity can prevent stripe disease, wireworm, barley smut, yellow dwarf disease, and net blotch disease.
2.3. Experimental Design
In the field experiment, two treatments, namely N/P Stress (NP0) and CK (NP180), were carried out. The field traits and yields were recorded for data analysis. NP0 represents no chemical fertilizer application, and NP180 represents the application of 180 kg/hm2 of nitrogen and phosphorus fertilizers. In March 2021 and 2022, the experiment was carried out at the Wheat Crop Experimental Base in Huangyang Town, Wuwei (Huangyang Town: 37.03° N, 103.05° E, altitude 1767 m). Two levels, normal fertilization and no fertilization, were set, and the experiment was repeated three times to ensure the reliability of the data. In the plots with uniform water and fertilizer, seeds were sown using artificial furrowing and broadcasting. Specifically, seeds were sown in furrows by hand-hoeing. The plots were arranged using the inter-comparison method to facilitate comparison between different treatments. Each treatment was planted three times. Each plot was 2.5 m long, 1.25 m wide, with a row spacing of 0.25 m, a plot-to-plot distance of 0.25 m, a walkway of 0.5 m, and an area of 3.125 m2. There were 5 rows in each plot, and 250 seeds were sown in each row. In mid-to-late March (specifically on 23 March 2024), seeds were sown in furrows by hand-hoeing, and the management was the same as that in an ordinary agricultural field.
Normal fertilization (CK): NP180: Pure nitrogen at 180 kg/ha, pure phosphorus at 180 kg/ha. The nitrogen fertilizer is urea (N 46%), and the phosphorus fertilizer is diammonium phosphate (N 18%, P2O5 46%).
Low-nitrogen-and-phosphorus-stress fertilization (N/P Stress): NP0: No fertilizers applied.
2.4. Measurement Methods
After the emergence of field-sown seeds, the basic seedlings (when the barley seedlings are at the two-leaves-and-one-heart stage) in each plot were recorded. At the maturity stage, 10 representative plants were randomly selected from each plot. After natural air-drying, indoor seed-testing was carried out. The plant height and spike length were measured with a ruler, and the spike weight per plant, grain weight per plant, and 1000-grain weight were measured. After harvesting, the grains were measured for quality indicators, such as protein and starch content. Correlation analysis was carried out for growth adaptability and yield performance in a low-nitrogen-and-phosphorus environment. The relationships between different traits and quality indicators, as well as their relationships with yield, were explored.
In the field experiment, the following traits were measured for each line sample: Plant population (×10
4 hm
−2), which refers to the number of seedlings per unit area at the two-leaf-one-heart stage after barley emergence; Spikelets per unit area (×10
4 hm
−2), namely the number of effective panicles at the maturity stage; Plant height (cm), representing the height from the ground to the top of the plant; Spikelets length (cm), which is the length of the wheat ear (measured from the bottom to the top of the wheat ear); Plump grains (ventral diameter ≥ 2.5 mm) (%) and Shrunken grains (ventral diameter ≤ 2.2 mm) (%) [
23], representing the proportions of the number of barley grains with ventral diameters greater than 2.5 mm and less than 2.2 mm, respectively; Thousand-grain weight (g), which is the weight of 1000 grains; Protein content (%) [
24], determined using the Kjeldahl method; Starch content (%) [
25], which was measured using near-infrared reflectance spectroscopy; and Yield (kg ha
−1), referring to the yield per hectare.
2.5. Data Analysis
Data were meticulously organized in Microsoft Excel 2019, then subjected to statistical significance testing in SPSS 23.0. Redundancy Analysis was executed in CANOCO 5 (
https://www.canoco5.com/, accessed on 28 August 2024), elucidating the core structure of the data. Correlation analyses in Origin 9.0 further illuminated variable relationships, while SIMCA 14.1’s (
https://www.sartorius.com/en/products/process-analytical-technology/data-analytics-software/mvda-software/simca, accessed on 3 September 2024) PLS-DA analysis discriminated effectively between groups. Cluster analysis was conducted using R 4.5.1. The structural equation model was created using Amos 26 and PowerPoint 2019.
3. Results
3.1. Barley Growth Indicators
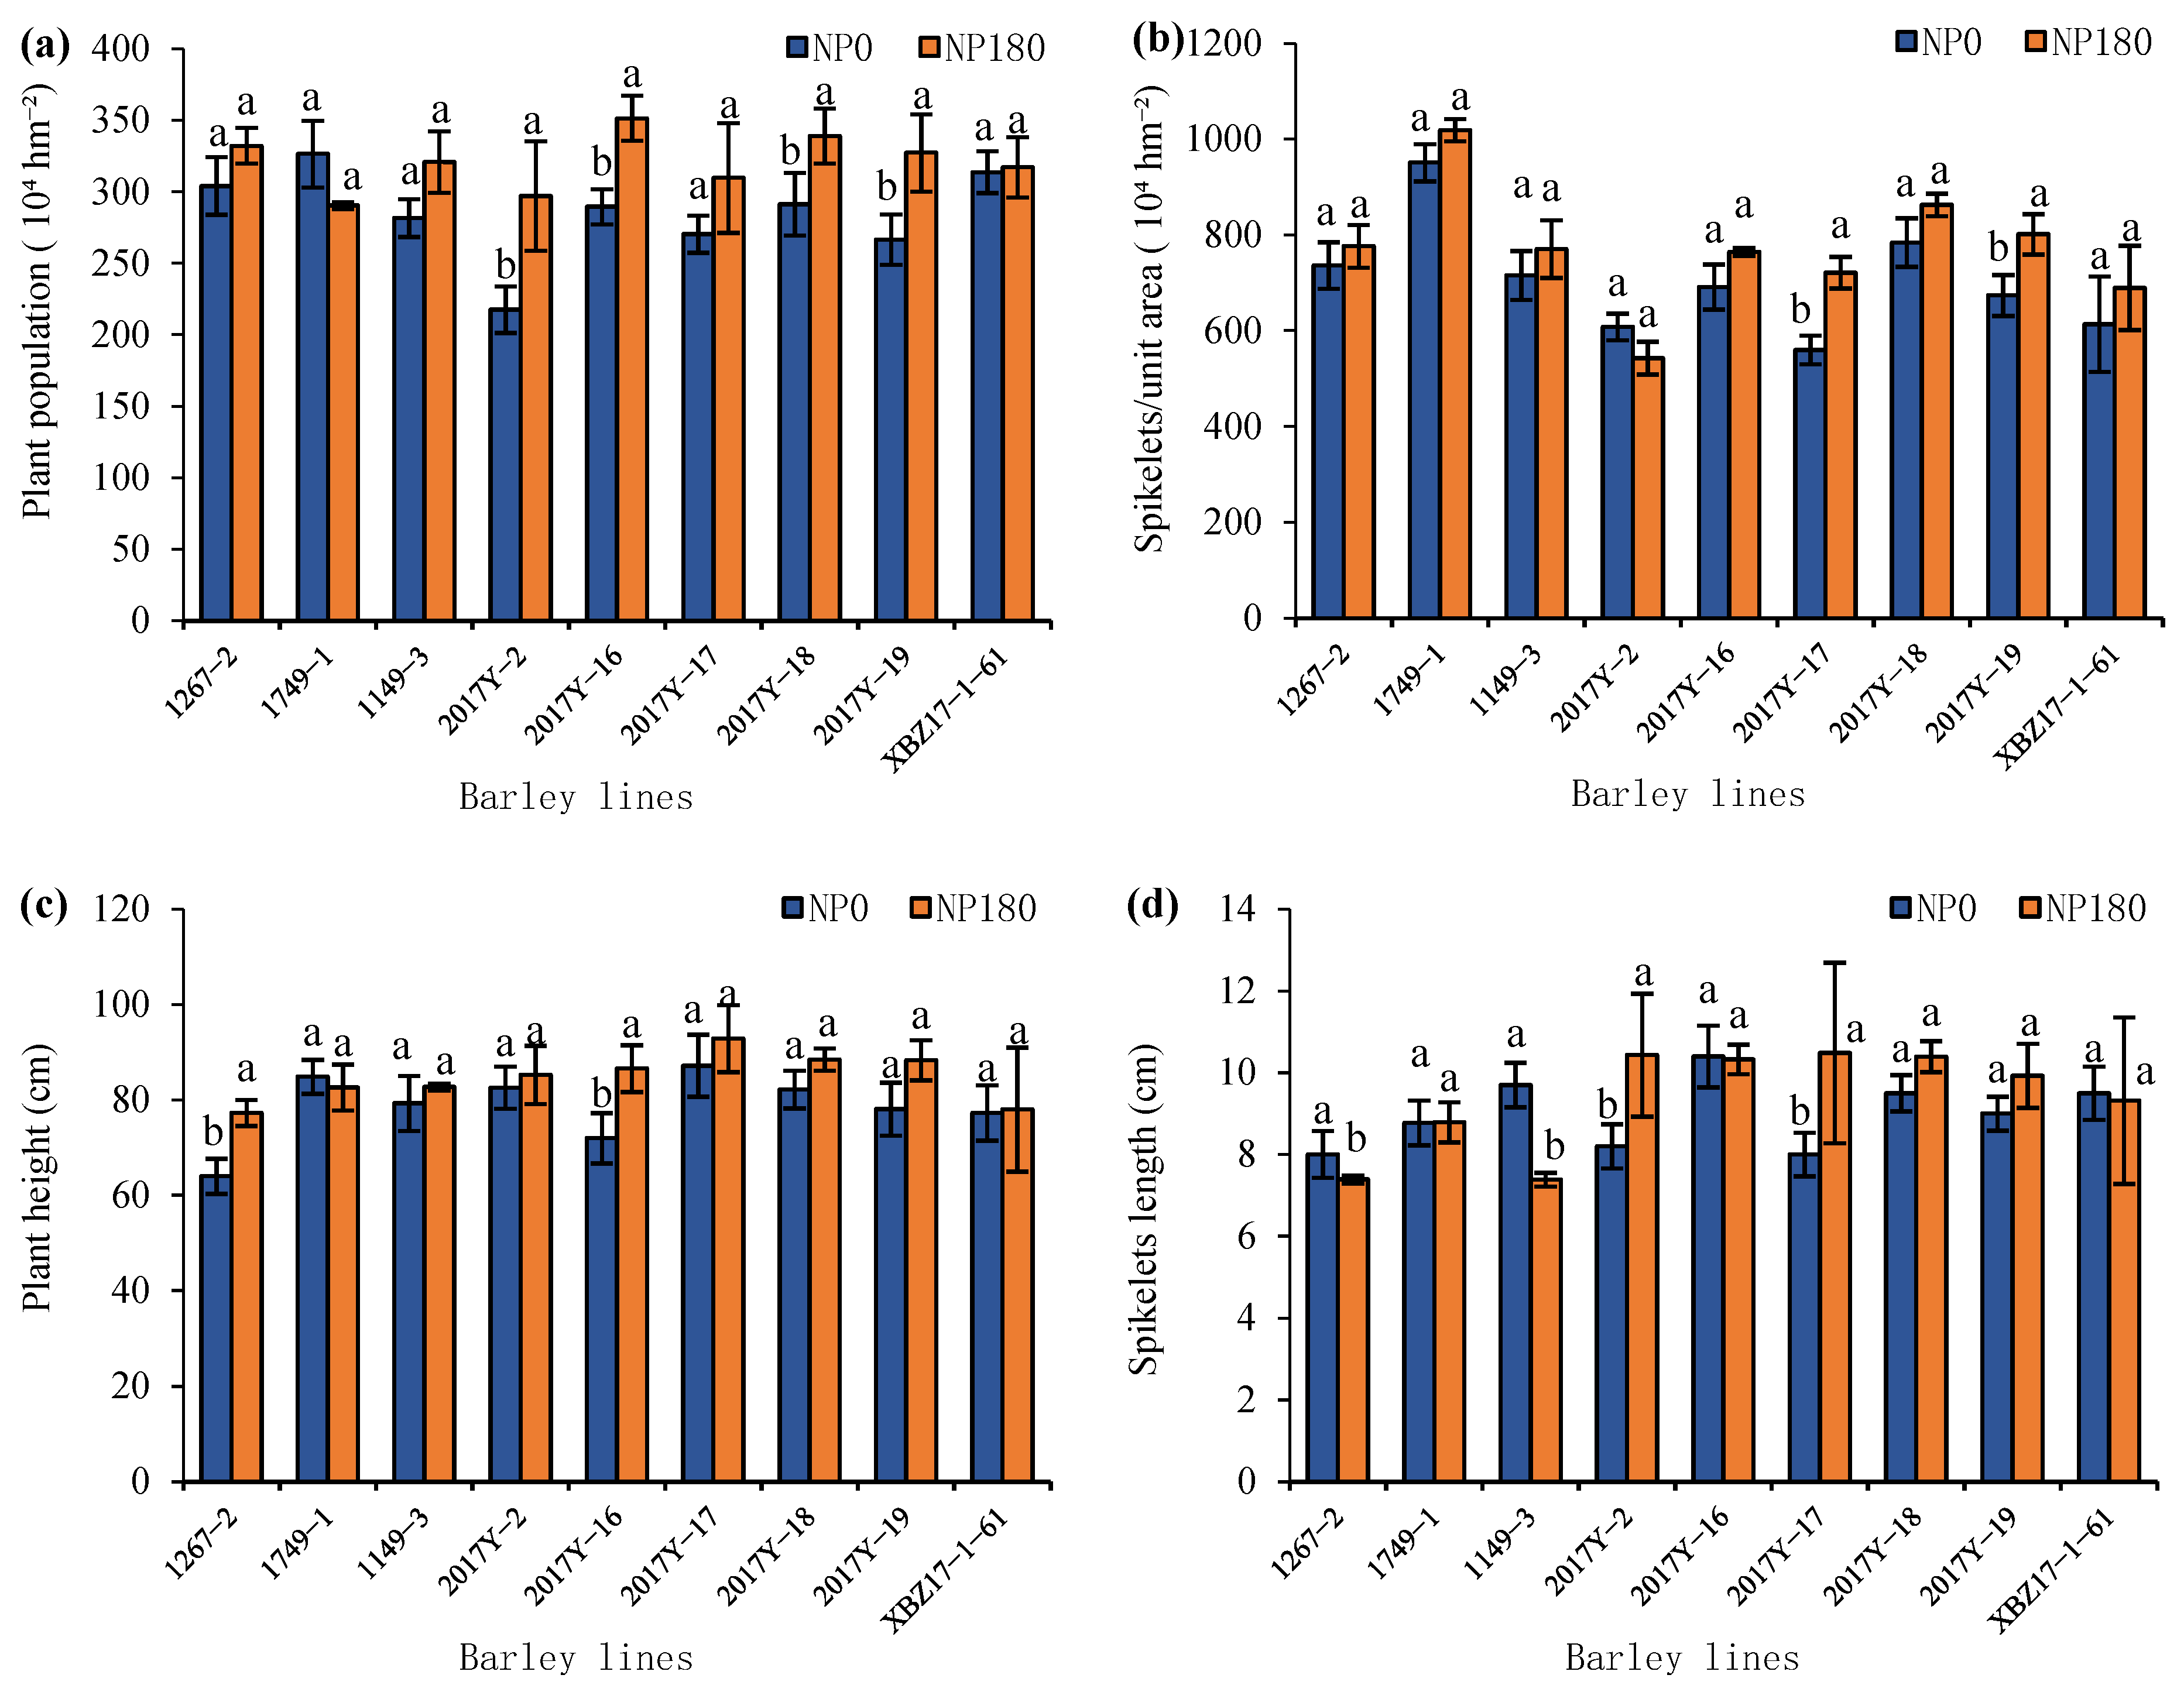
In the 2021 data (
Figure 1), low nitrogen-phosphorus stress significantly reduced the plant population of 2017Y-2, 2017Y-16, 2017Y-18, and 2017Y-19 lines by 26.73%, 17.56%, 14.10%, and 18.54%, respectively (
p < 0.05). Low nitrogen-phosphorus stress significantly reduced spikelets/unit area in 2017Y-17 and 2017Y-19 lines by 22.35% and 15.92%, respectively (
p < 0.05). Plant height of 1267-2 and 2017Y-16 lines was significantly reduced by 17.20% and 16.88%, respectively, under low nitrogen-phosphorus stress (
p < 0.05). Spikelet length of 2017Y-2 and 2017Y-17 lines was significantly reduced by 21.41% and 23.71%, respectively (
p < 0.05), while that of 1267-2 and 1149-3 lines was significantly increased by 8.28% and 31.34%, respectively (
p < 0.05).
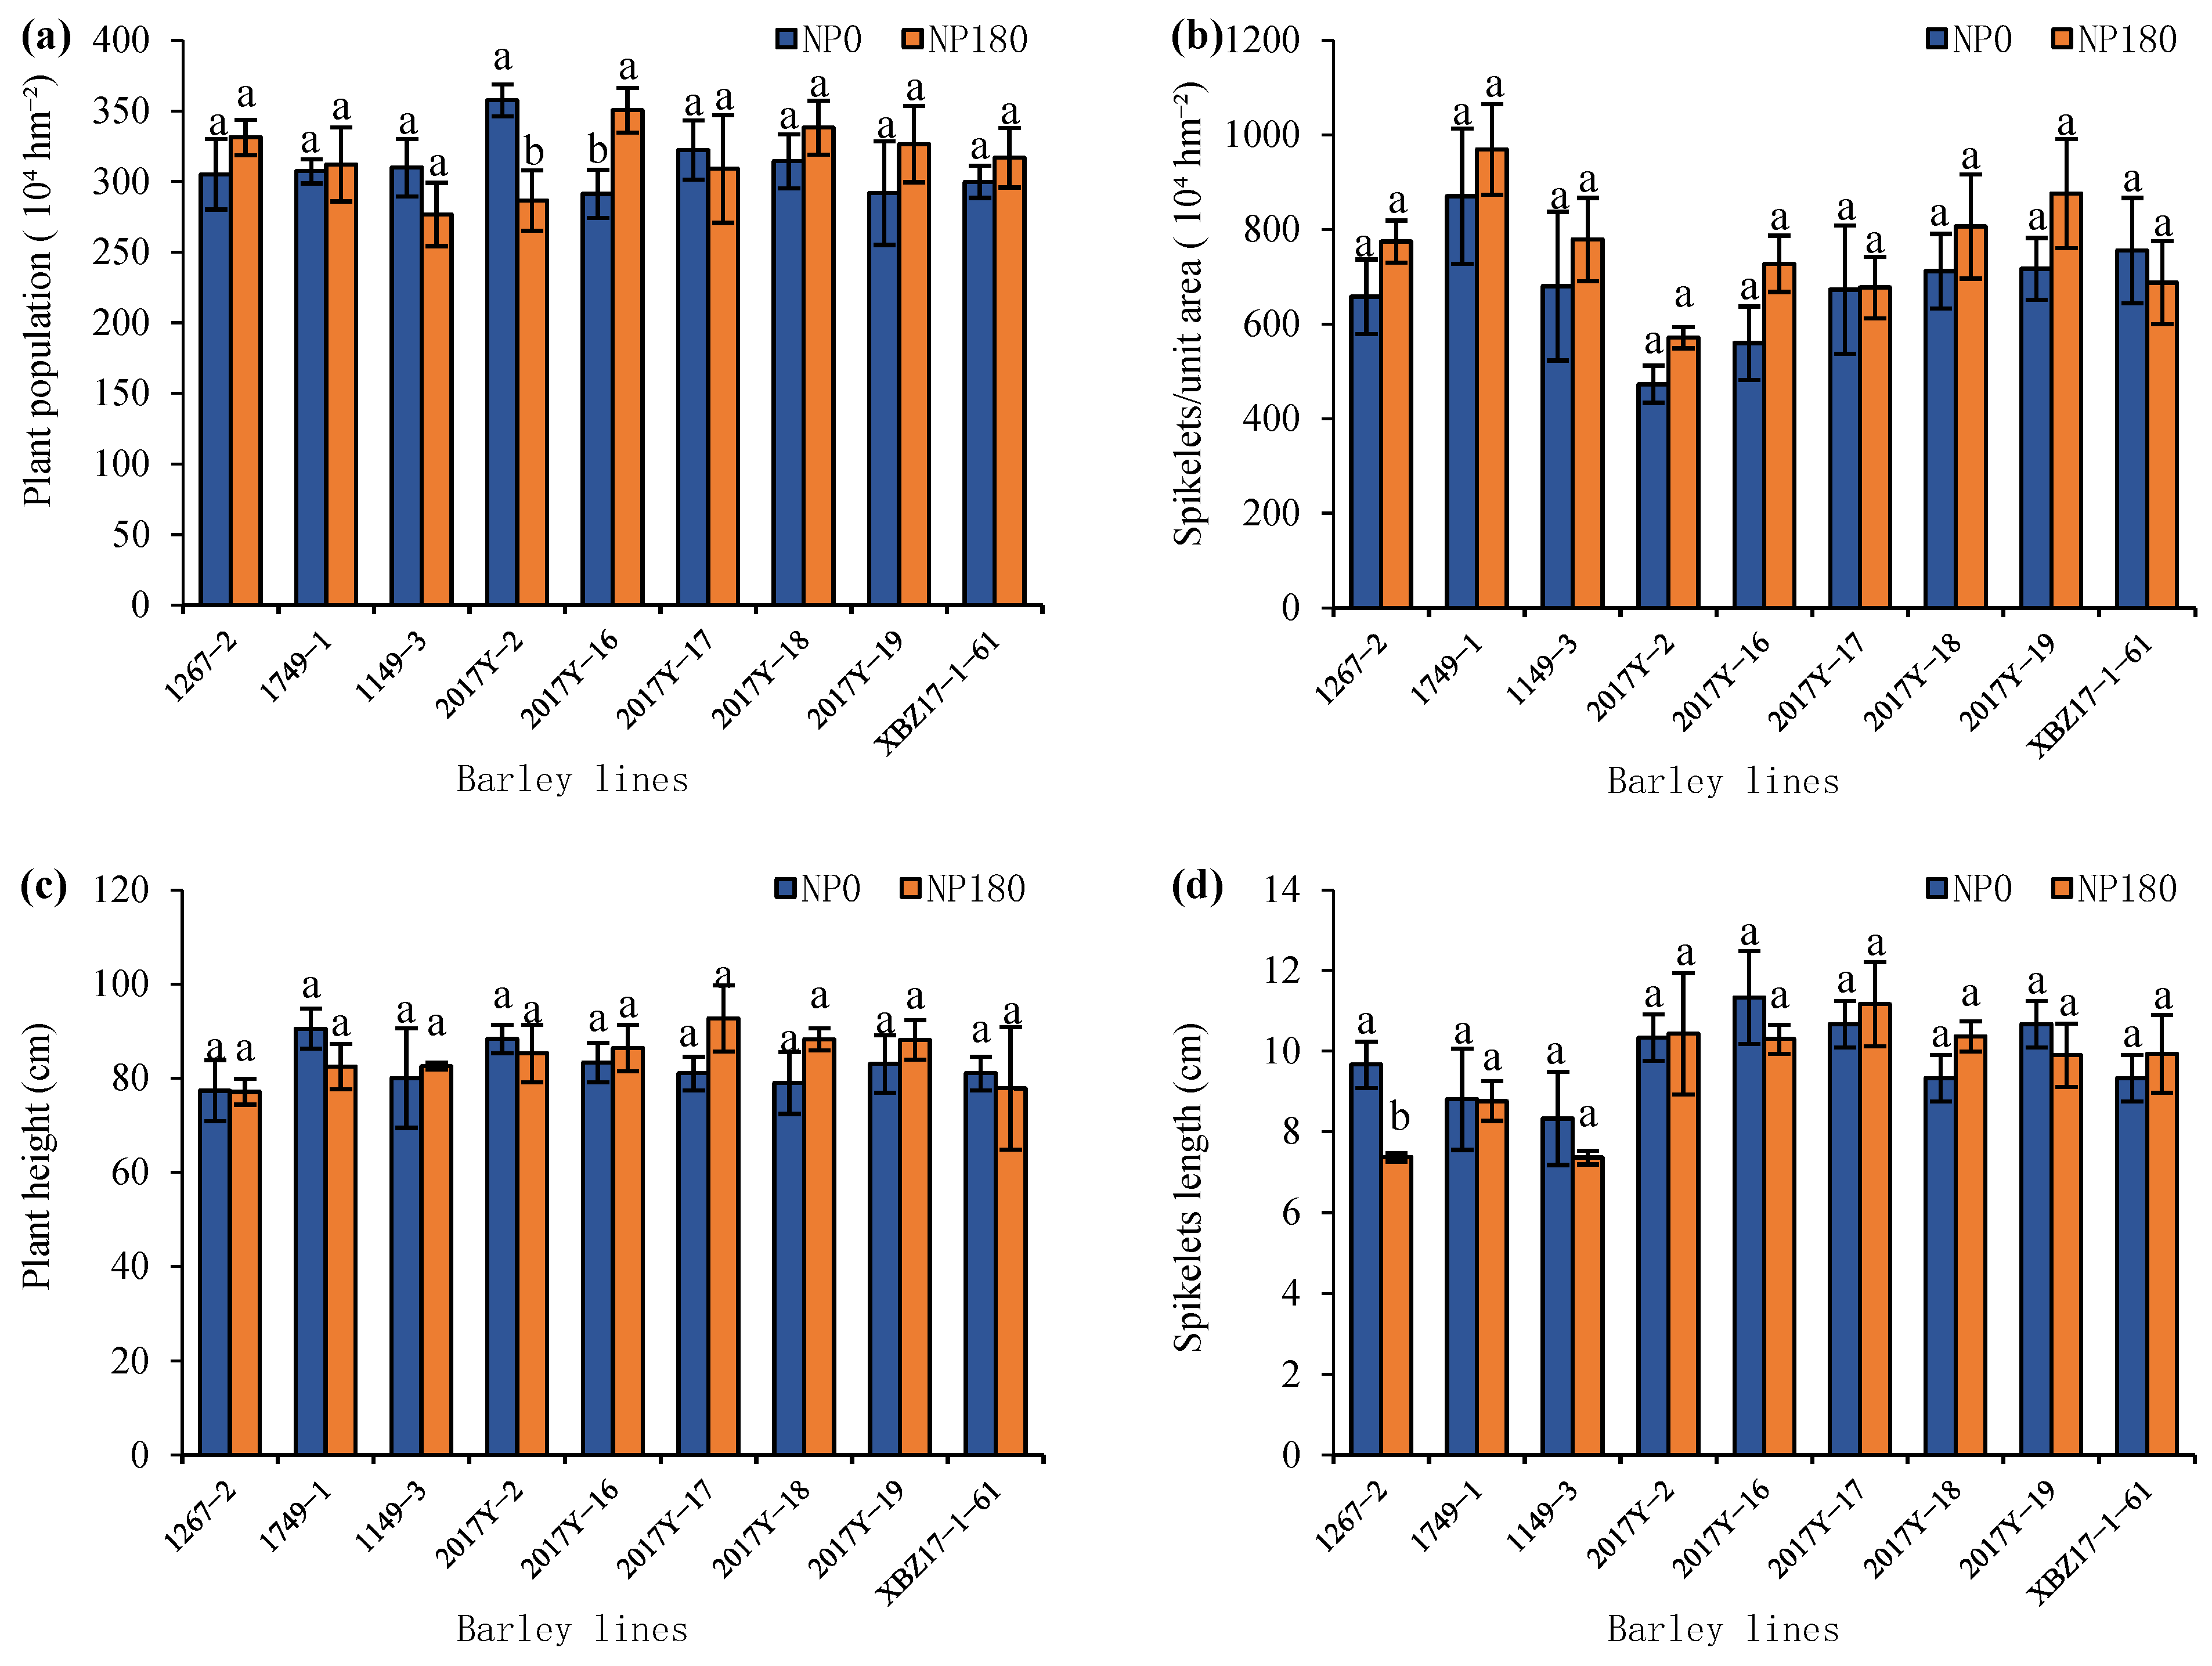
Overall, low nitrogen and phosphorus stress had little impact on the growth indices (Plant population, Spikelets/unit area, Plant height, Spikelets length) of various barley lines in 2022 (
Figure 2). Among them, the Plant population of the 2017Y-2 line under low nitrogen and phosphorus stress was significantly higher than that under normal fertilization treatment by 24.71% (
p < 0.05), while the Plant population of the 2017Y-16 line under low nitrogen and phosphorus stress was significantly lower than that under normal fertilization treatment by 16.89% (
p < 0.05). Low nitrogen and phosphorus stress had no significant effects on Spikelets/unit area and Plant height in all lines. The Spikelets length of the 1267-2 line under low nitrogen and phosphorus stress was significantly higher than that under normal fertilization treatment by 31.17% (
p < 0.05).
3.2. Barley Quality Indicators and Yield
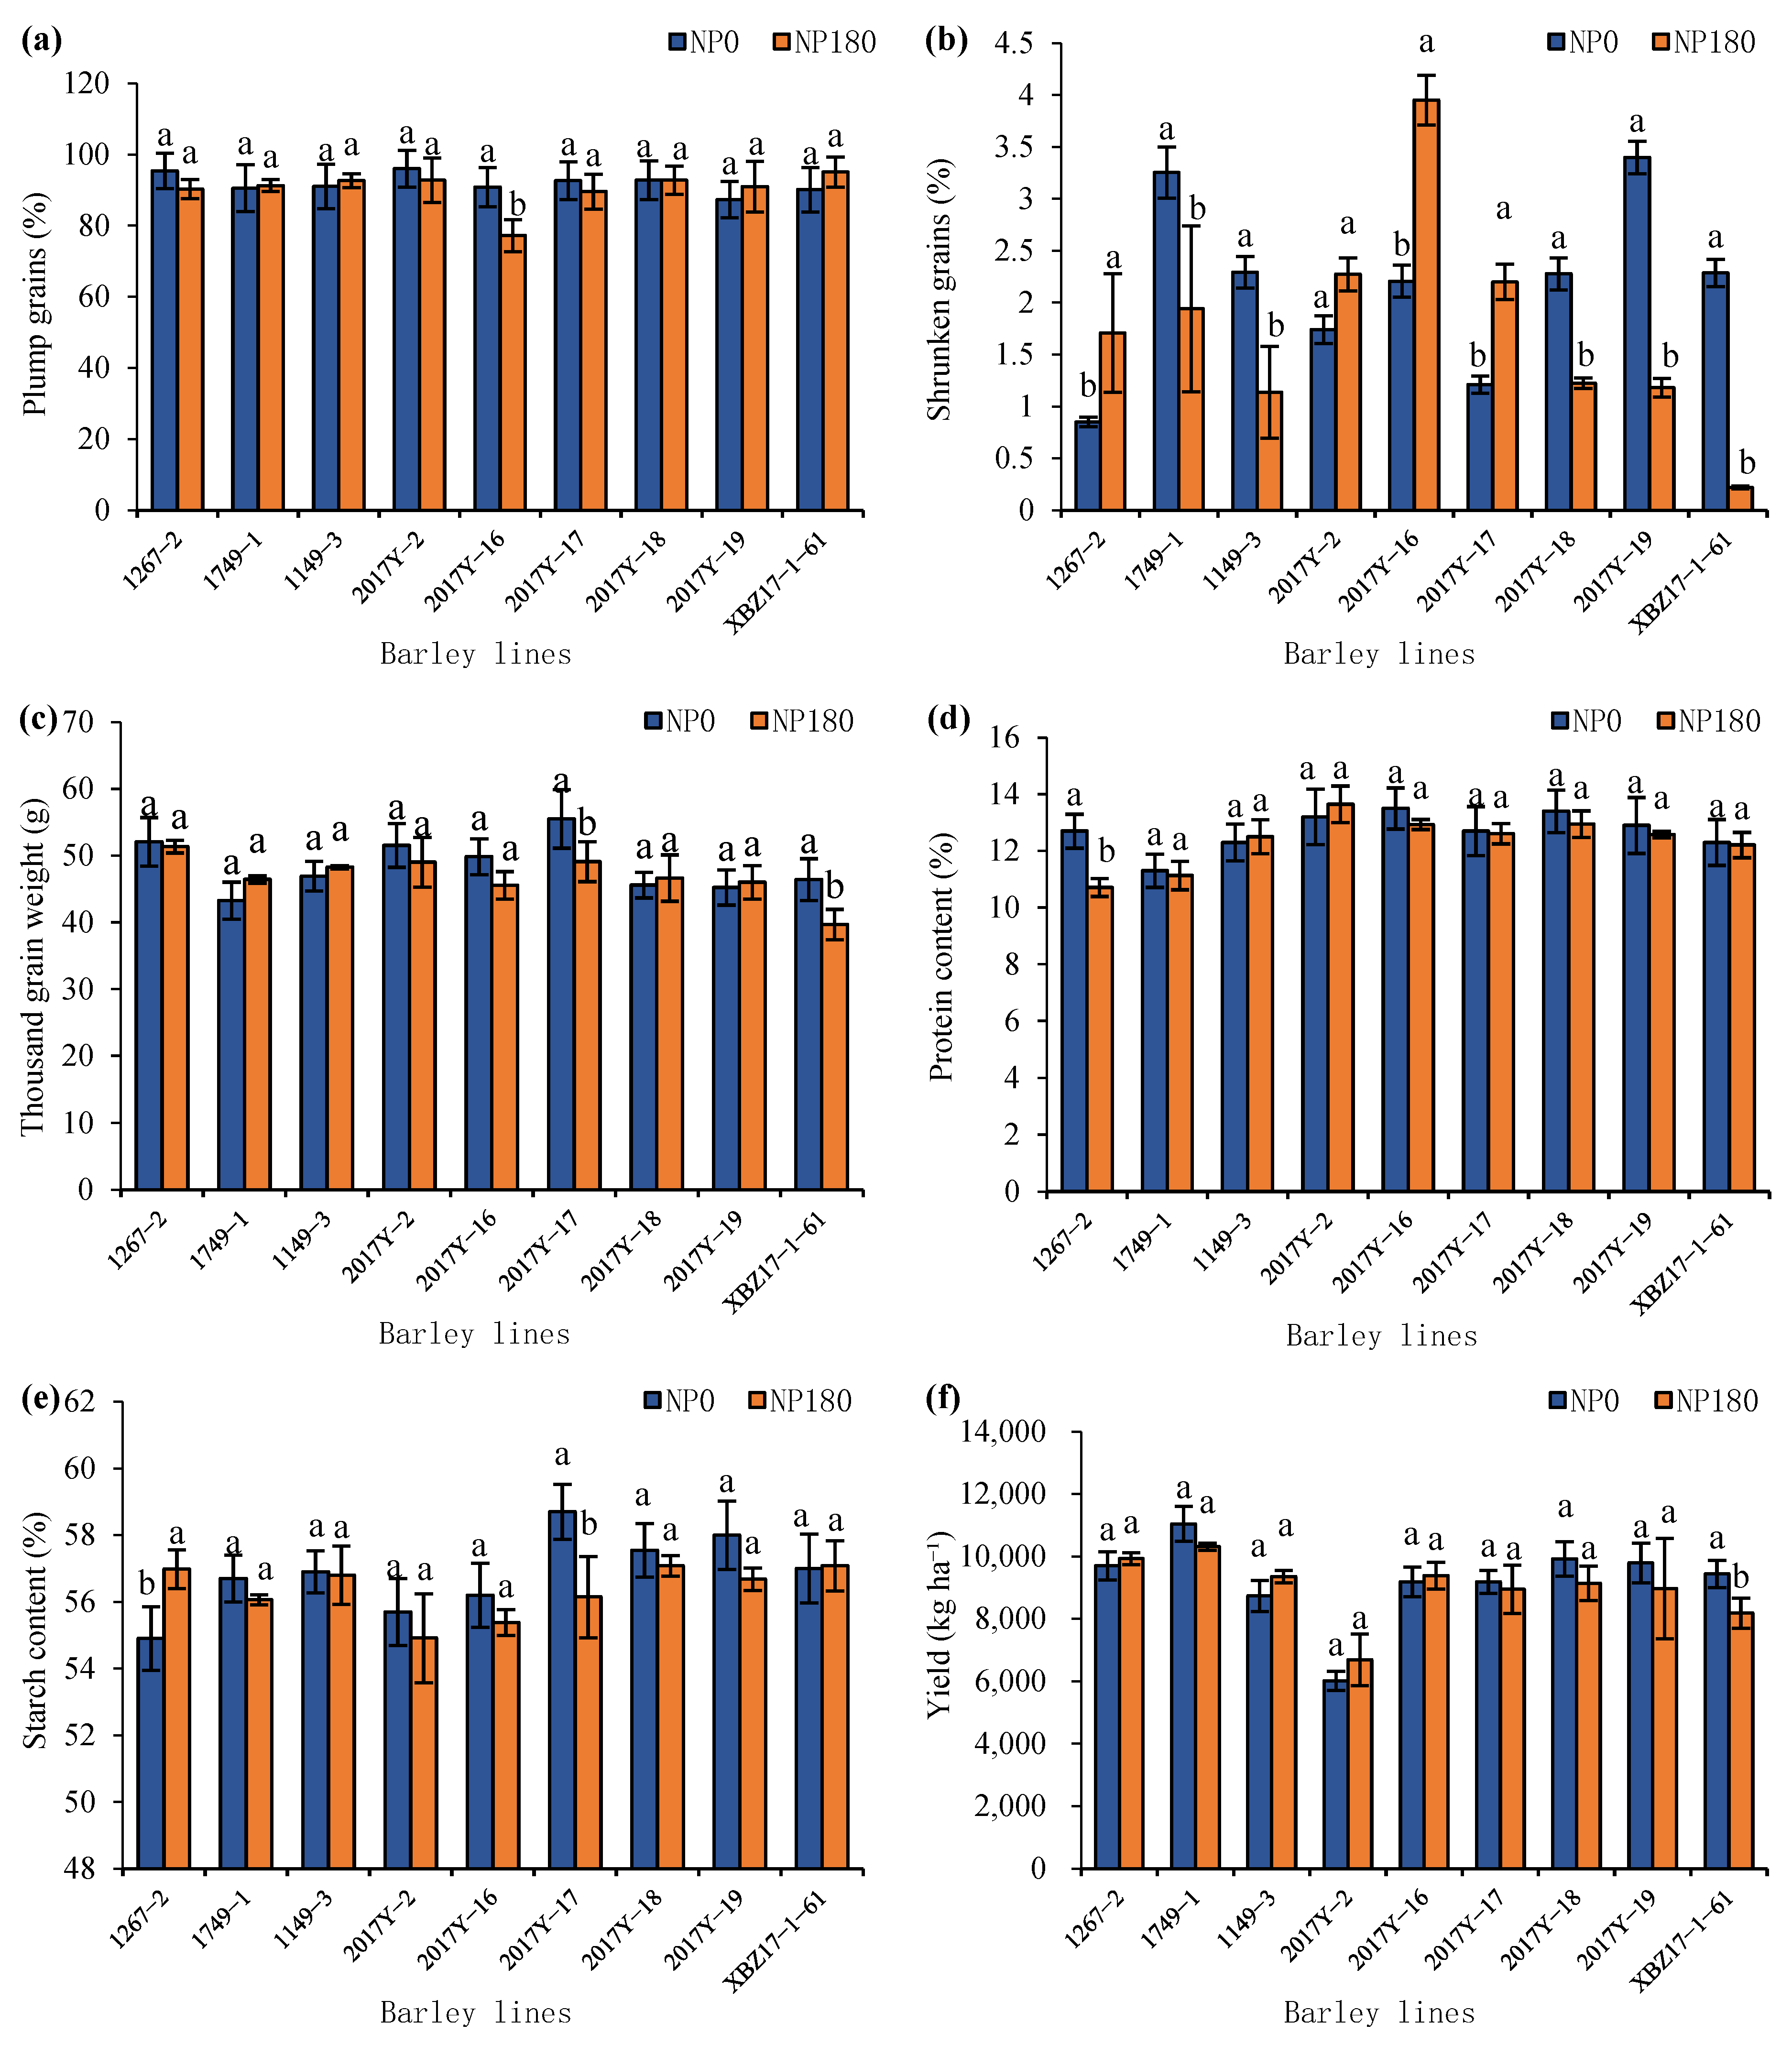
In the 2021 data (
Figure 3), low nitrogen-phosphorus stress significantly increased plump grains by 17.61% only in the 2017Y-16 line (
p < 0.05), with no significant effect on other lines. Low nitrogen-phosphorus stress significantly reduced shrunken grains in 1267-2, 2017Y-16, and 2017Y-17 lines by 50.22%, 44.17%, and 44.93%, respectively (
p < 0.05), while significantly increasing shrunken grains in 1749-1, 1149-3, 2017Y-18, 2017Y-19, and XBZ17-1-61 lines by 67.63%, 101.89%, 85.98%, 187.97%, and 933.26%, respectively (
p < 0.05). Thousand grain weight of 2017Y-17 and XBZ17-1-61 lines was significantly increased by 13.05% and 16.96%, respectively, and protein content of 1267-2 line was increased by 18.59% under low nitrogen-phosphorus stress (
p < 0.05). Starch content of 1267-2 line was significantly reduced by 3.65%, while that of 2017Y-17 line was significantly increased by 4.55% (
p < 0.05). Interestingly, low nitrogen-phosphorus stress significantly increased the yield of XBZ17-1-61 line by 15.39% (
p < 0.05).
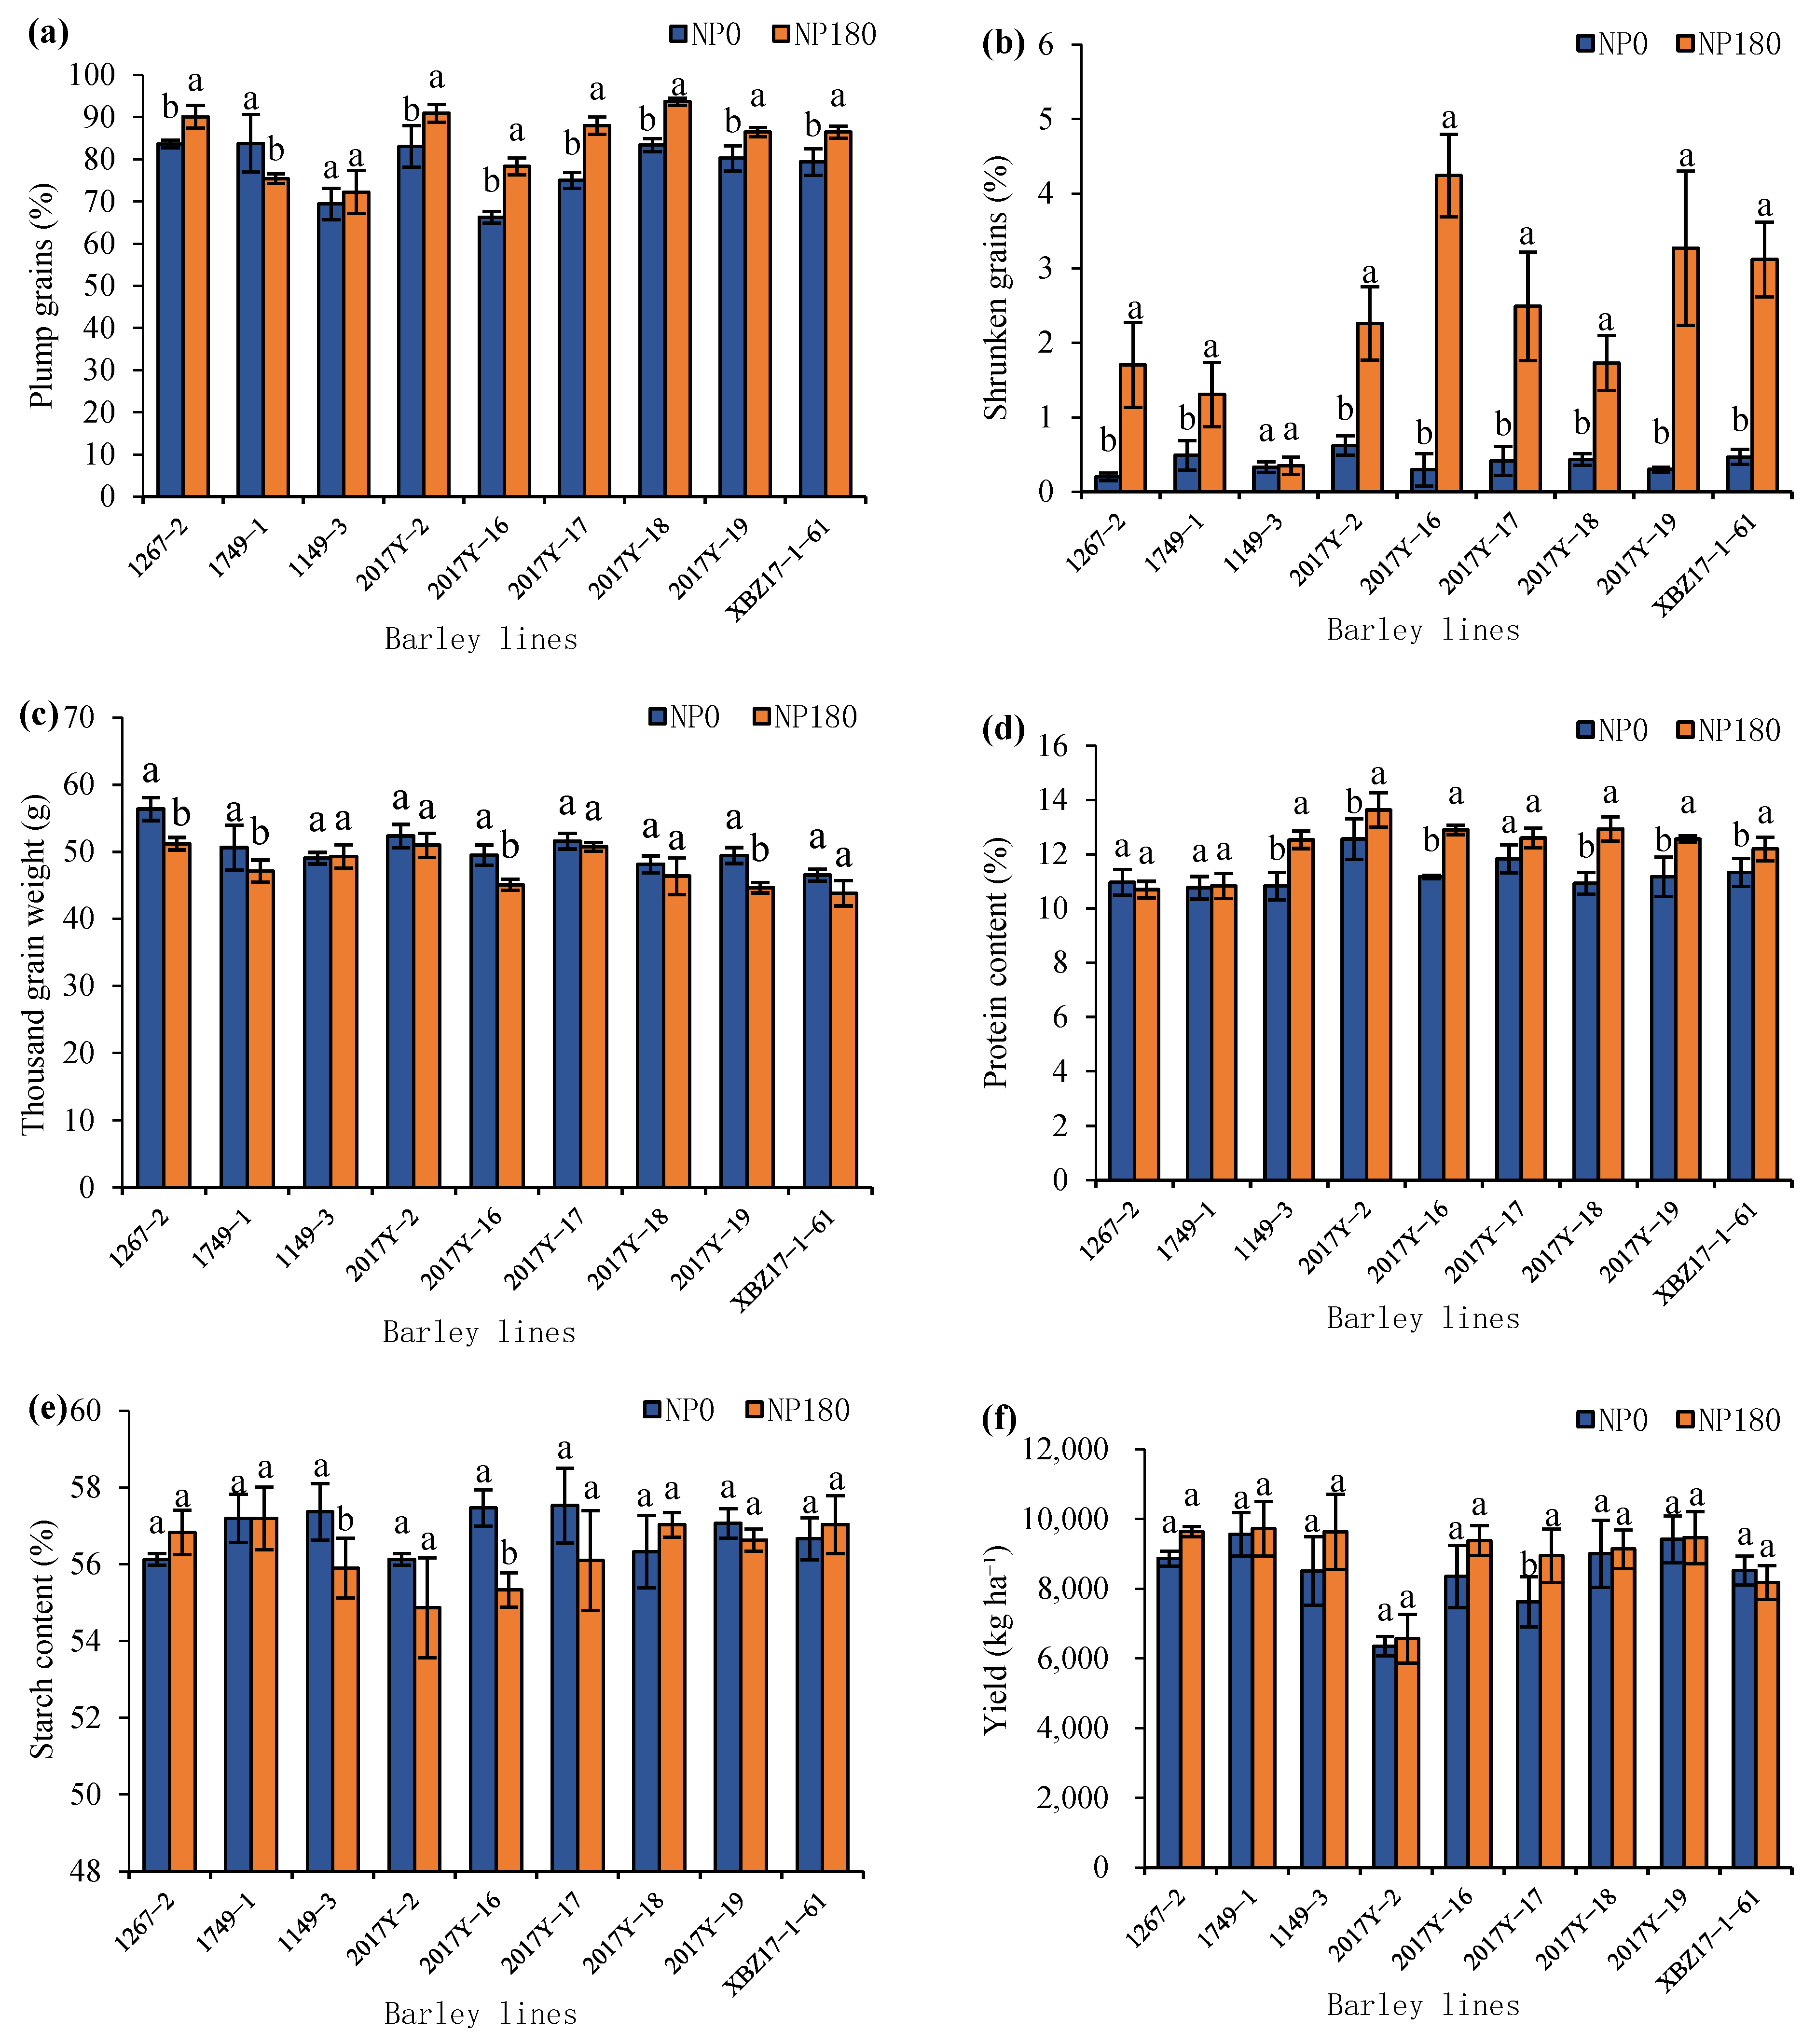
Low nitrogen and phosphorus had a great impact on the quality indicators of barley (Plump grains, Shrunken grains, Thousand-grain weight, Protein content, Starch content) in 2022 (
Figure 4). Under low-nitrogen-and-phosphorus stress, the Plump grains of lines 1267-2, 2017-2, 2017-16, 2017-17, 2017-18, 2017-19, and XBZ17-1-61 decreased significantly by 7.13%, 8.67%, 15.44%, 14.78%, 10.96%, 7.17%, and 8.15% (
p < 0.05), respectively. However, under low-nitrogen-and-phosphorus stress, the Plump grains of line 1749-1 increased significantly by 11.15%. Under low-nitrogen-and-phosphorus stress, the Shrunken grains of lines 1267-2, 1749-1, 2017Y-2, 2017Y-16, 2017Y-17, 2017Y-18, 2017Y-19, and XBZ17-1-61 decreased significantly by 88.06%, 62.55%, 72.43%, 92.93%, 83.27%, 74.95%, 90.72%, and 84.92% (
p < 0.05), respectively. Low-nitrogen-and-phosphorus stress could significantly increase the Thousand-grain weight of lines 1267-2, 1749-1, 2017Y-16, and 2017Y-19 by 10.09%, 7.41%, 9.83%, and 10.78% (
p < 0.05), respectively. Low-nitrogen -and-phosphorus stress did significantly reduce the protein content of lines 1149-3, 2017Y-2, 2017Y-16, 2017Y-18, 2017Y-19, and XBZ17-1-61 by 13.56%, 7.82%, 13.44%, 15.46%, 11.14%, and 7.10% (
p < 0.05), respectively, and significantly increase the starch content of lines 1149-3 and 2017Y-16 by 2.62% and 3.86% (
p < 0.05), respectively. Only line 2017Y-17 had a 14.74% (
p < 0.05) decrease in yield under low-nitrogen-and-phosphorus stress. Among them, line 1749-1 had the best yield performance, with the highest yield regardless of whether it was under low-nitrogen-and-phosphorus stress. Through significance analysis, 1267-2, 1149-3, 2017Y-16, 2017Y-18, 2017Y-19, and XBZ17-1-61 showed no significant differences from line 1749-1, indicating that these seven lines are all low-nitrogen-and-low-phosphorus stress-tolerant lines.
3.3. Correlation Analysis
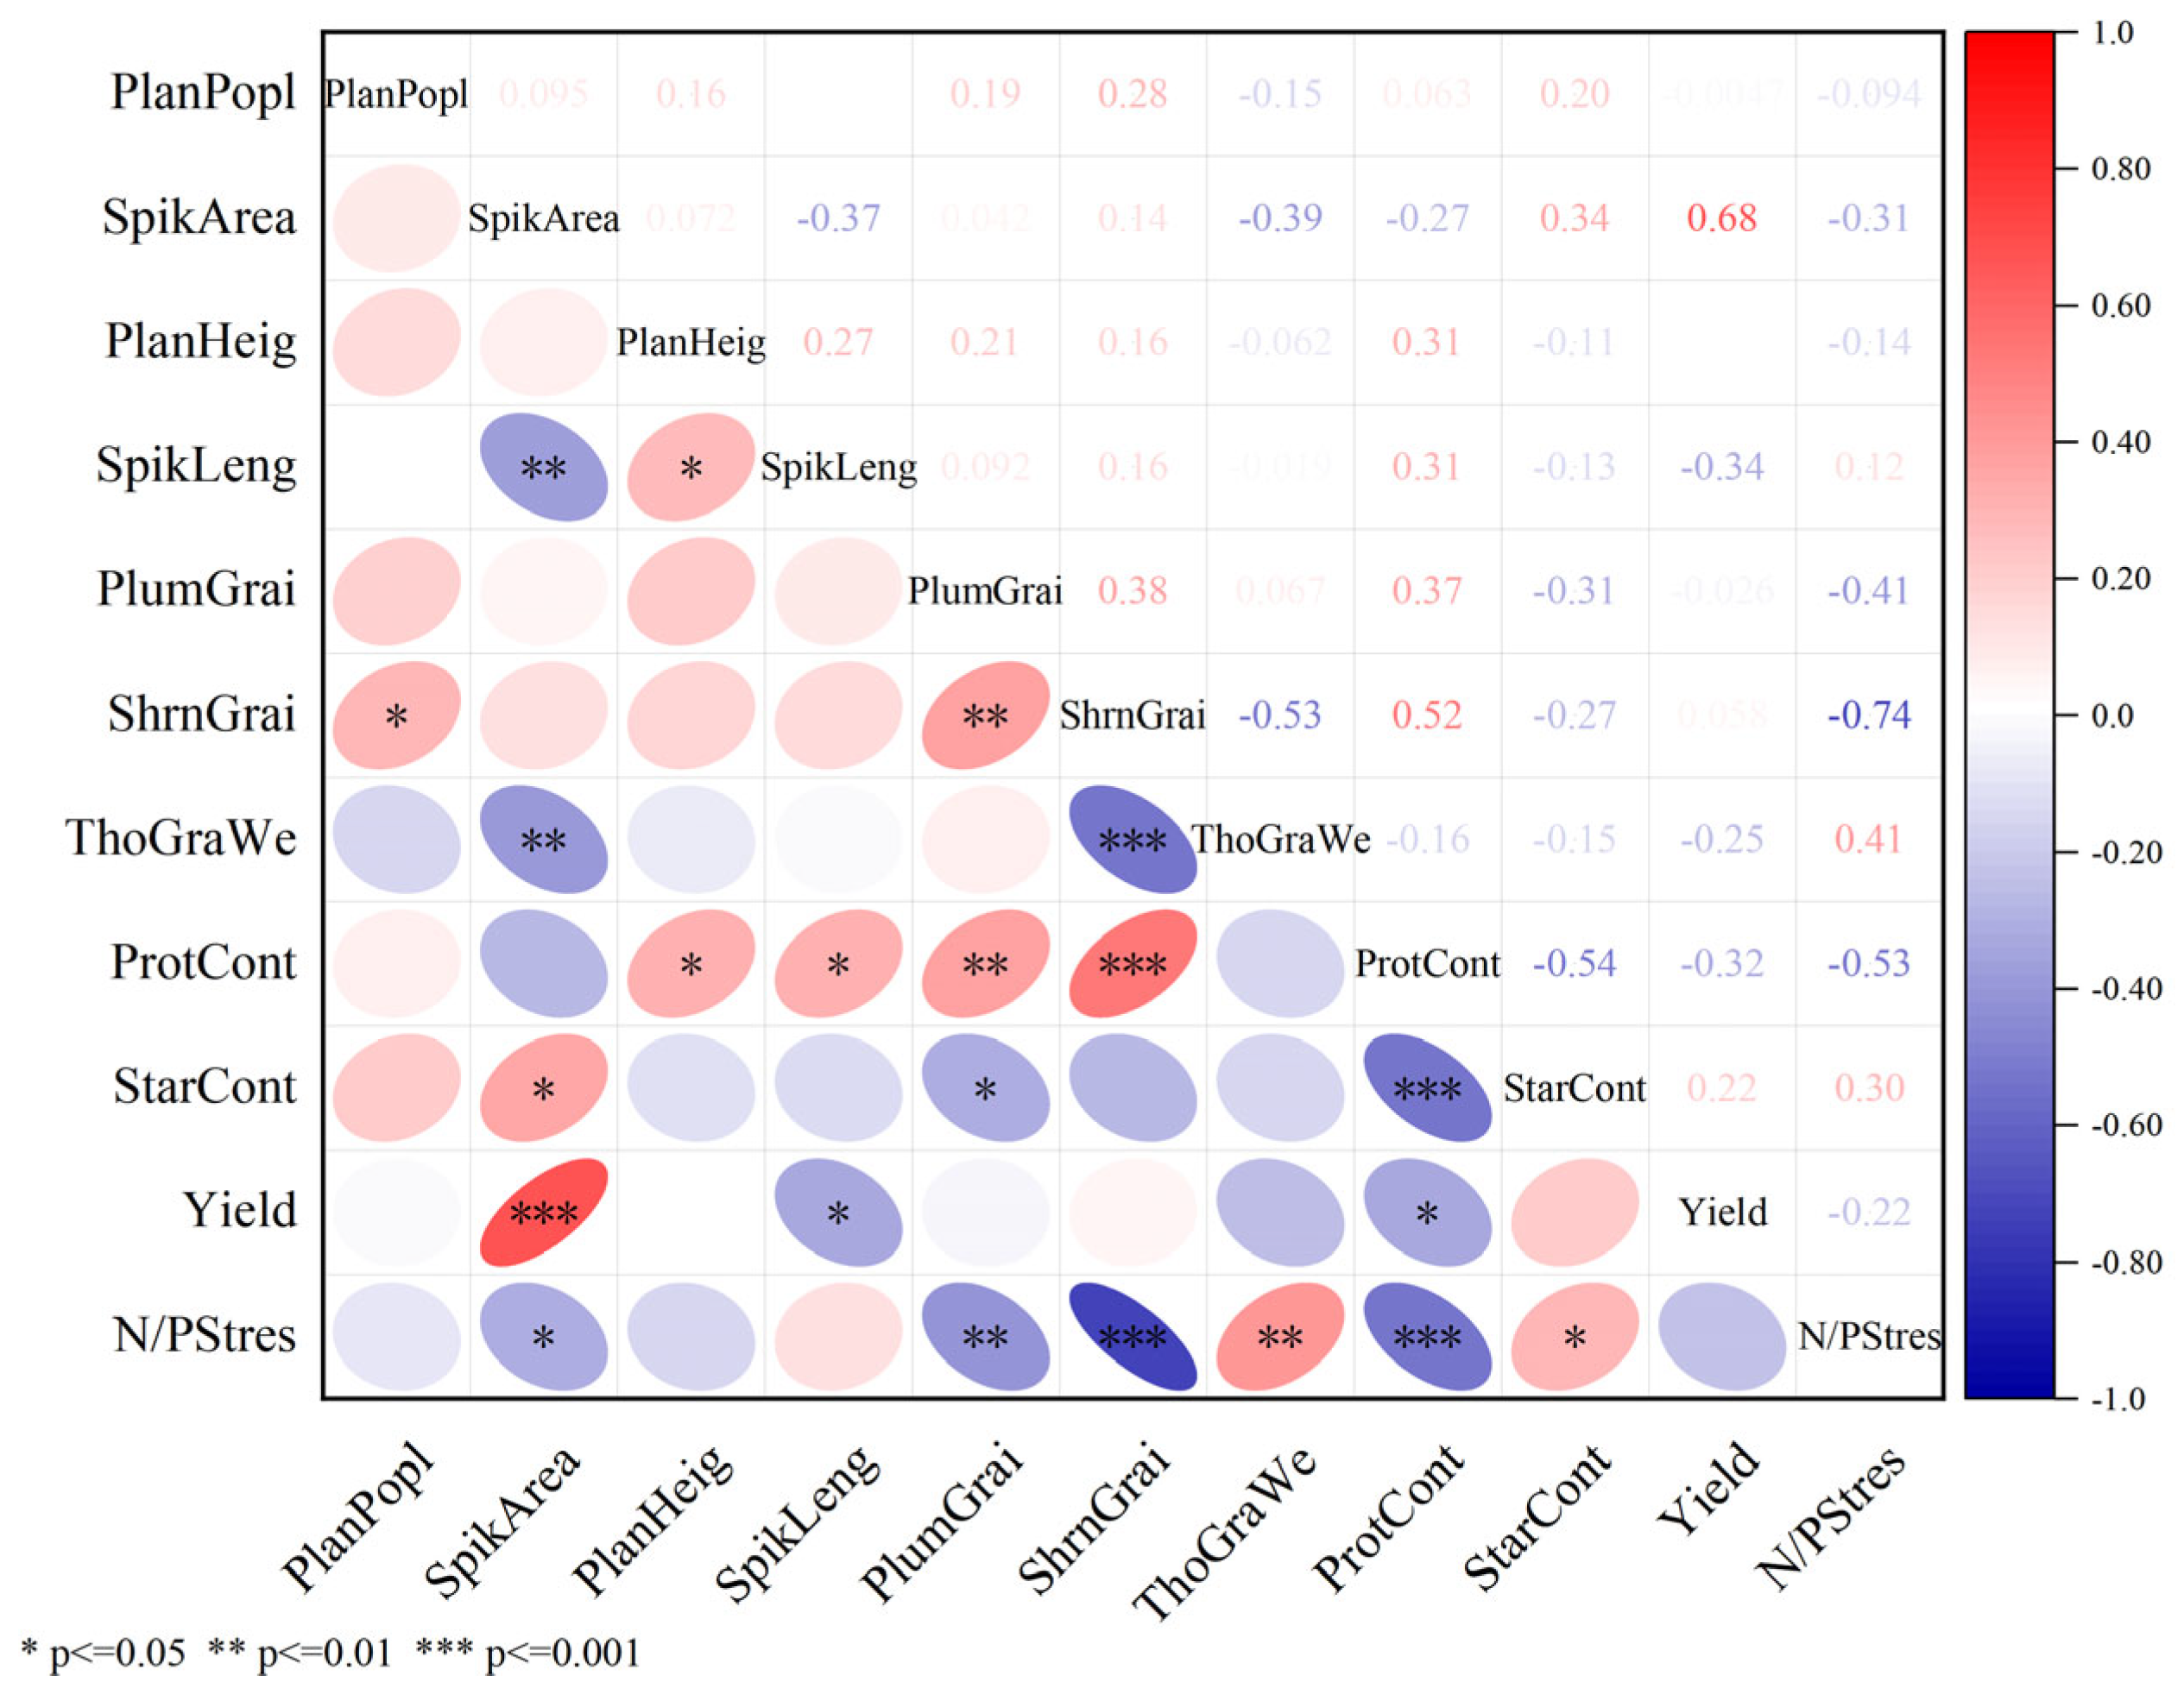
Through Pearson correlation analysis, we investigated the relationships among barley growth indicators, quality indicators, yield, and low-nitrogen-and-phosphorus stress.
Figure 5 intuitively displays these correlations using a color heatmap, where red represents positive correlation, blue represents negative correlation, and the intensity of the color reflects the magnitude of the correlation coefficient. Significant correlations are marked with * (
p ≤ 0.05), ** (
p ≤ 0.01) or *** (
p ≤ 0.001).
N/P Stress shows significantly negative correlations with Spikelets/unit area (r = −0.31 *), Plump grains (r = −0.41 **), Shrunken grains (r = −0.74 ***), and Protein content (r = −0.53 ***), and significantly positive correlations with Thousand-grain weight (r = 0.41 **) and Starch content (r = 0.30 *). This implies that low-nitrogen-and-phosphorus stress does not entirely have a negative impact on barley quality; low nitrogen and phosphorus can also have positive effects, such as reducing Shrunken grains and increasing Thousand-grain weight and Starch content. Yield shows a significantly positive correlation with Spikelets/unit area (r = 0.68 ***), as well as significantly negative correlations with Spikelets length (r = −0.34 *) and Protein content (r = −0.31 *). These results indicate that Spikelets/unit area is a crucial factor with a positive impact on yield.
Among them, according to the correlation coefficients, the number of Spikelets per unit area (p < 0.05, correlation coefficient: −0.31), the Protein content (correlation coefficient: −0.53), Plump grains (correlation coefficient: −0.41), Shrunken grains (correlation coefficient: −0.74) and Thousand-grain weight (correlation coefficient: 0.41) are the preferred indicators for evaluating the ability of barley to tolerate low-nitrogen and low-phosphorus. The number of Spikelets per unit area (correlation coefficient: −0.31) and Starch content (correlation coefficient: 0.30) are the secondary indicators for evaluating the ability of barley to tolerate low-nitrogen and low-phosphorus.
3.4. Principal Component Analysis and Cluster Analysis
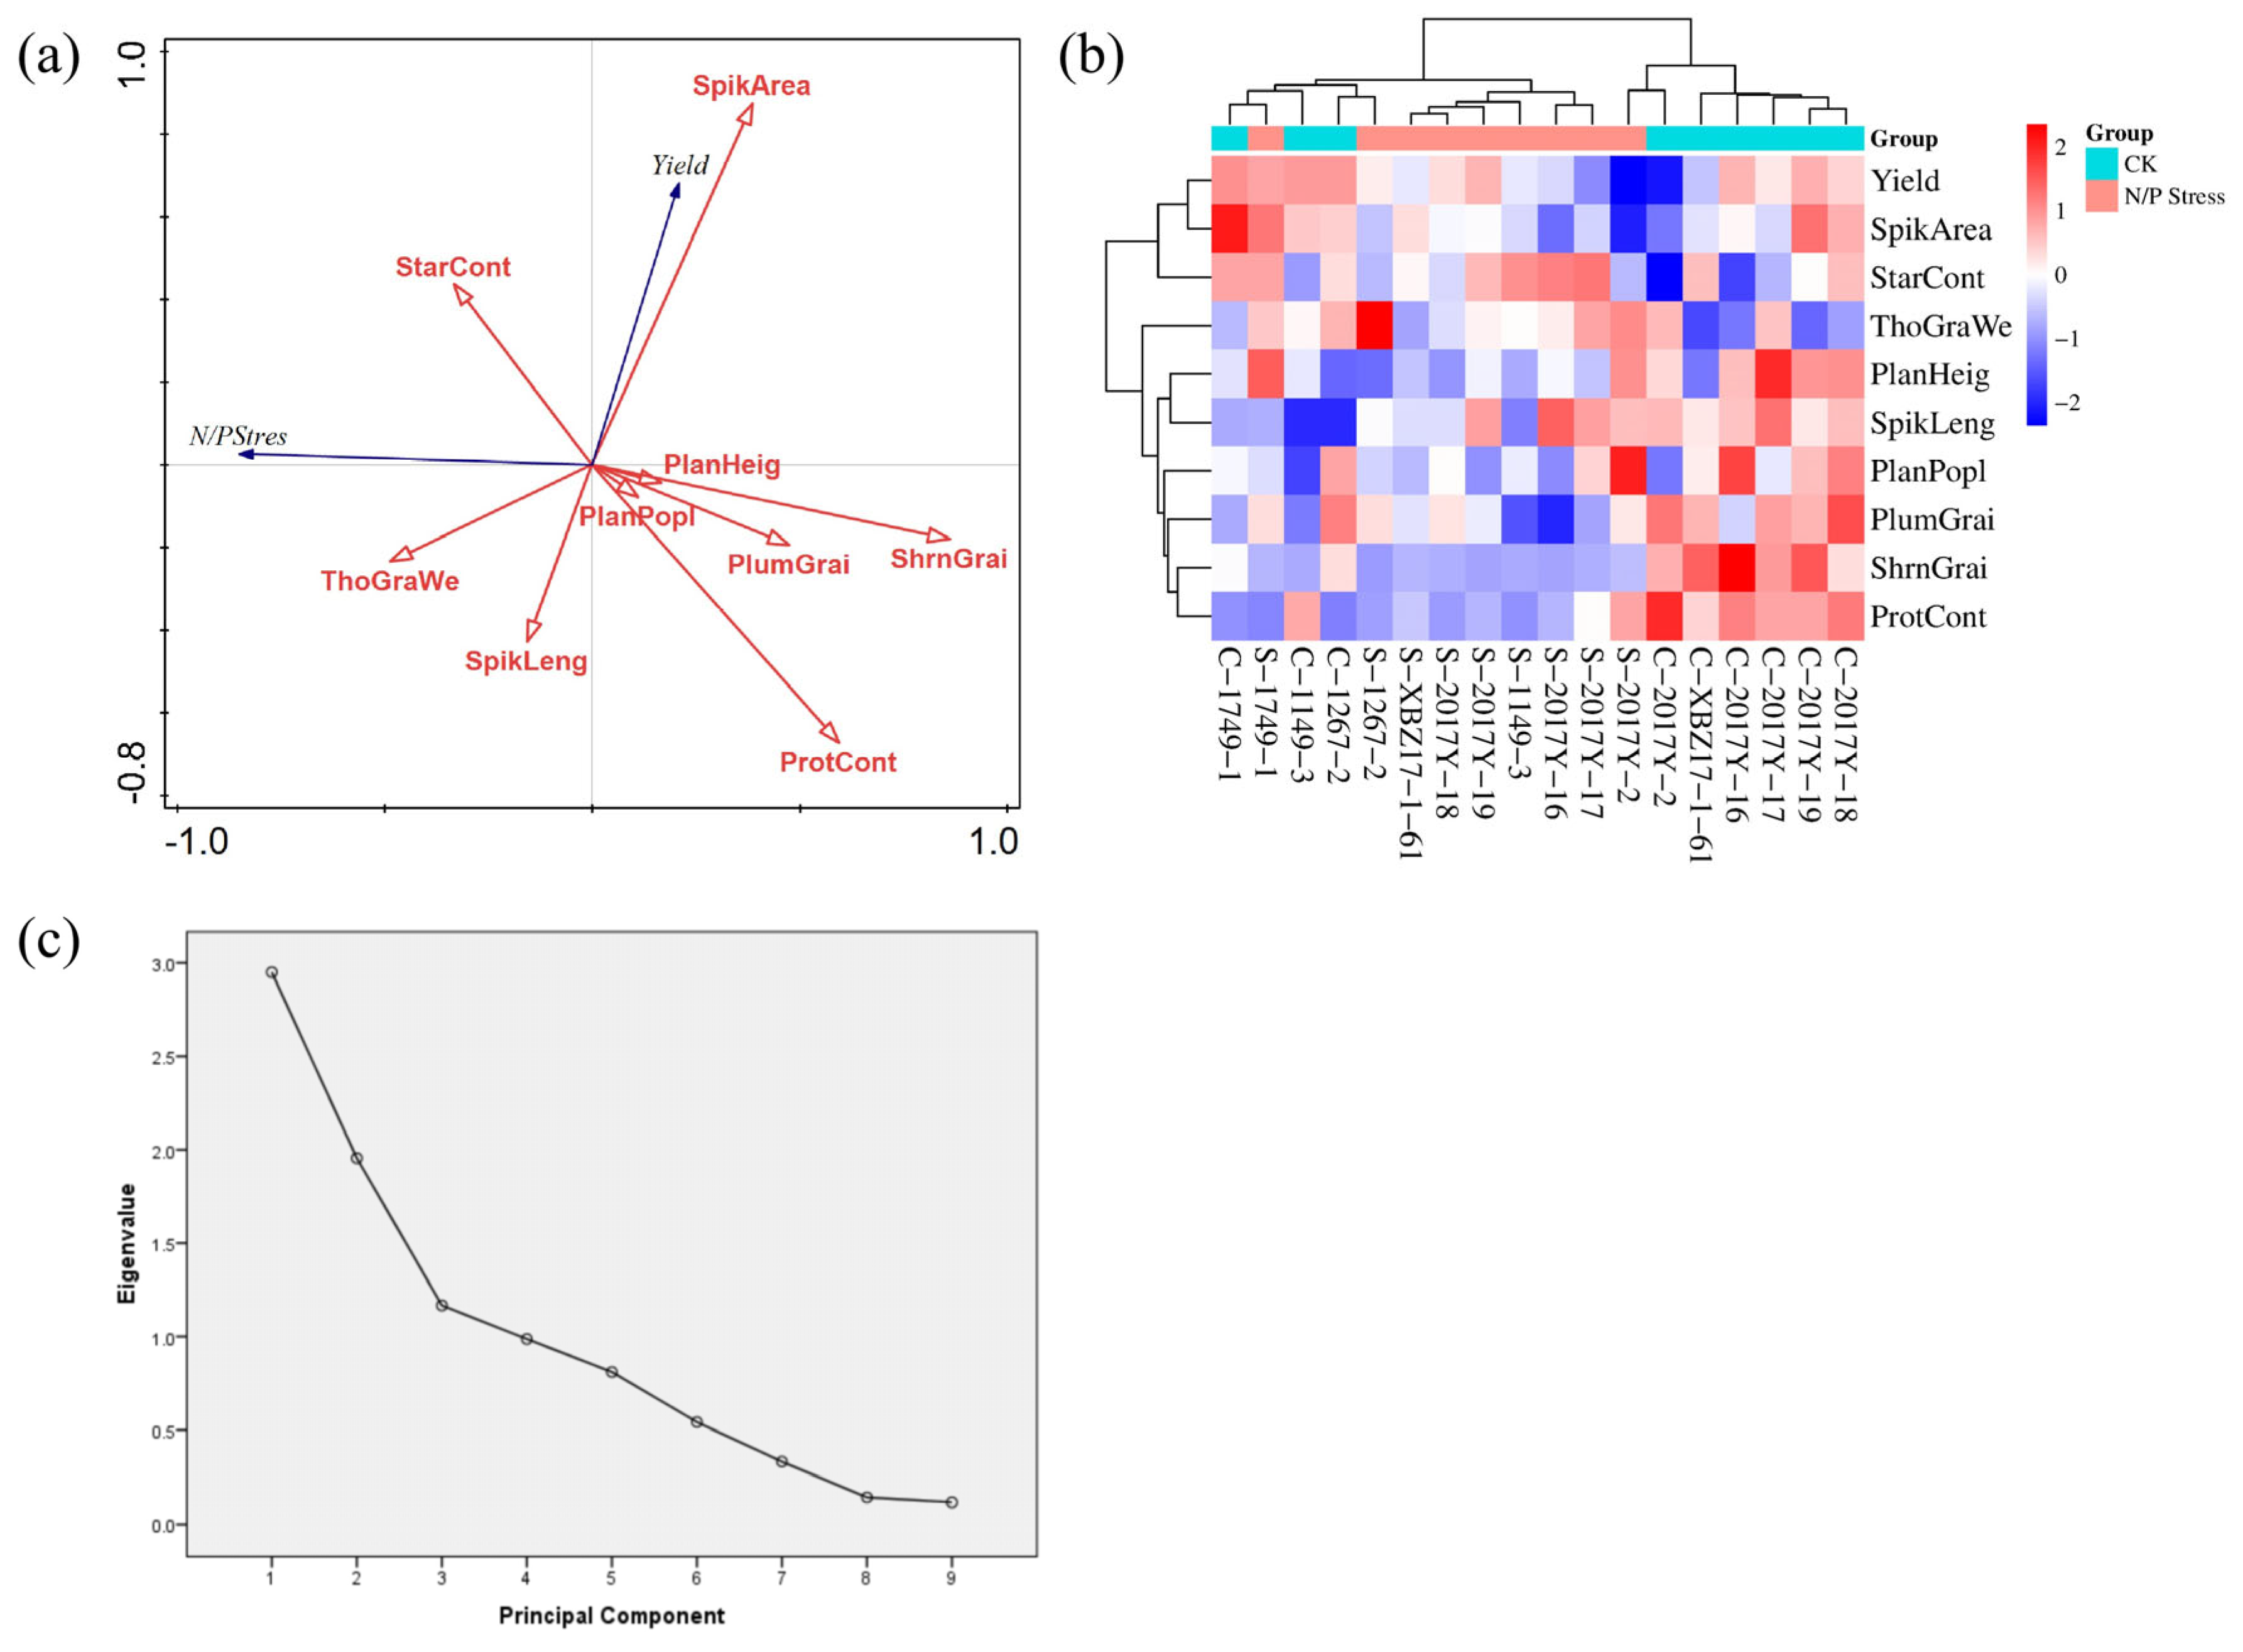
As
Figure 6a shows, redundancy analysis reveals profound correlations: the blue vectors represent low-nitrogen-and-phosphorus stress and yield, and the red vectors represent barley growth and quality indicators. An acute angle between vectors indicates a positive correlation, while an obtuse angle indicates a negative correlation. The smaller the angle and the longer the vector, the closer the relationship. It can be seen that the angle between Spikelets/unit area and yield is the smallest, meaning that the positive correlation between yield and Spikelets/unit area is the strongest, which is the same as the correlation analysis results mentioned above. Moreover, N/P Stress shows negative correlations with both Plump grains and Shrunken grains, further demonstrating that N/P Stress does not have an entirely negative impact on barley quality. In addition, the angle between N/P Stress and the Protein content indicator is obtuse, indicating that Protein content is also an important indicator for measuring barley’s resistance to nitrogen-and-phosphorus stress. Thousand-grain weight and Starch content, which form acute angles with the N/P Stress indicator, can also be used as stress resistance indicators for barley against nitrogen-and-phosphorus stress.
Through cluster analysis, as
Figure 6b shows, the various barley indicators are divided into two categories, namely Spikelets/unit area, StarCont, Yield and PlanPopl, PlanHeig, SpikLeng, PlumGrai, ShrnGrai, ThoGraWe, and ProtCont, indicating two groups of significantly different indicators. By clustering barley lines, the barley lines in the CK group can be divided into two categories. The lines 2017Y-2, 2017Y-16, 2017Y-17, 2017Y-18, 2017Y-19, and XBZ17-1-61 exhibit relatively excellent traits under normal fertilization. In contrast, the lines 1267-2, 1749-1, and 1149-3 perform poorly under normal fertilization. Through cluster analysis, the barley lines in the N/P Stress group can also be divided into two categories, among which only the 2017Y-2 line is grouped alone, indicating that the 2017Y-2 line has better stress resistance compared to other lines.
As
Table 1 shows, the first four principal components encompass 71.683% of the total variance and effectively summarize the core information of the initial ten barley growth and quality indicators. These four principal components are named Y1, Y2, Y3, and Y4, which can conduct a reliable and comprehensive assessment of barley growth conditions and ensure a concise and accurate reflection of the data.
Table 2 presents the principal component scores and the comprehensive scores derived from the principal component equations. The comprehensive scores are calculated by weighting the contribution of each component to the total variance of the four principal components. The CK treatment (NP180) is ranked in descending order according to the following scores: C-2017Y-16, C-2017Y-18, C-2017Y-19, C-2017Y-17, C-2017Y-2, C-XBZ17-1-61, C-1267-2, C-1749-1, and C-1149-3. It can be seen that, under the condition of conventional fertilization, the 2017Y-16 line has the best comprehensive indicators. Furthermore, the CK treatment (NP180) is ranked in descending order according to the following scores: S-2017Y-2, S-2017Y-17, S-1749-1, S-2017Y-18, S-XBZ17-1-61, S-2017Y-19, S-2017Y-16, S-1267-2, and S-1149-3.
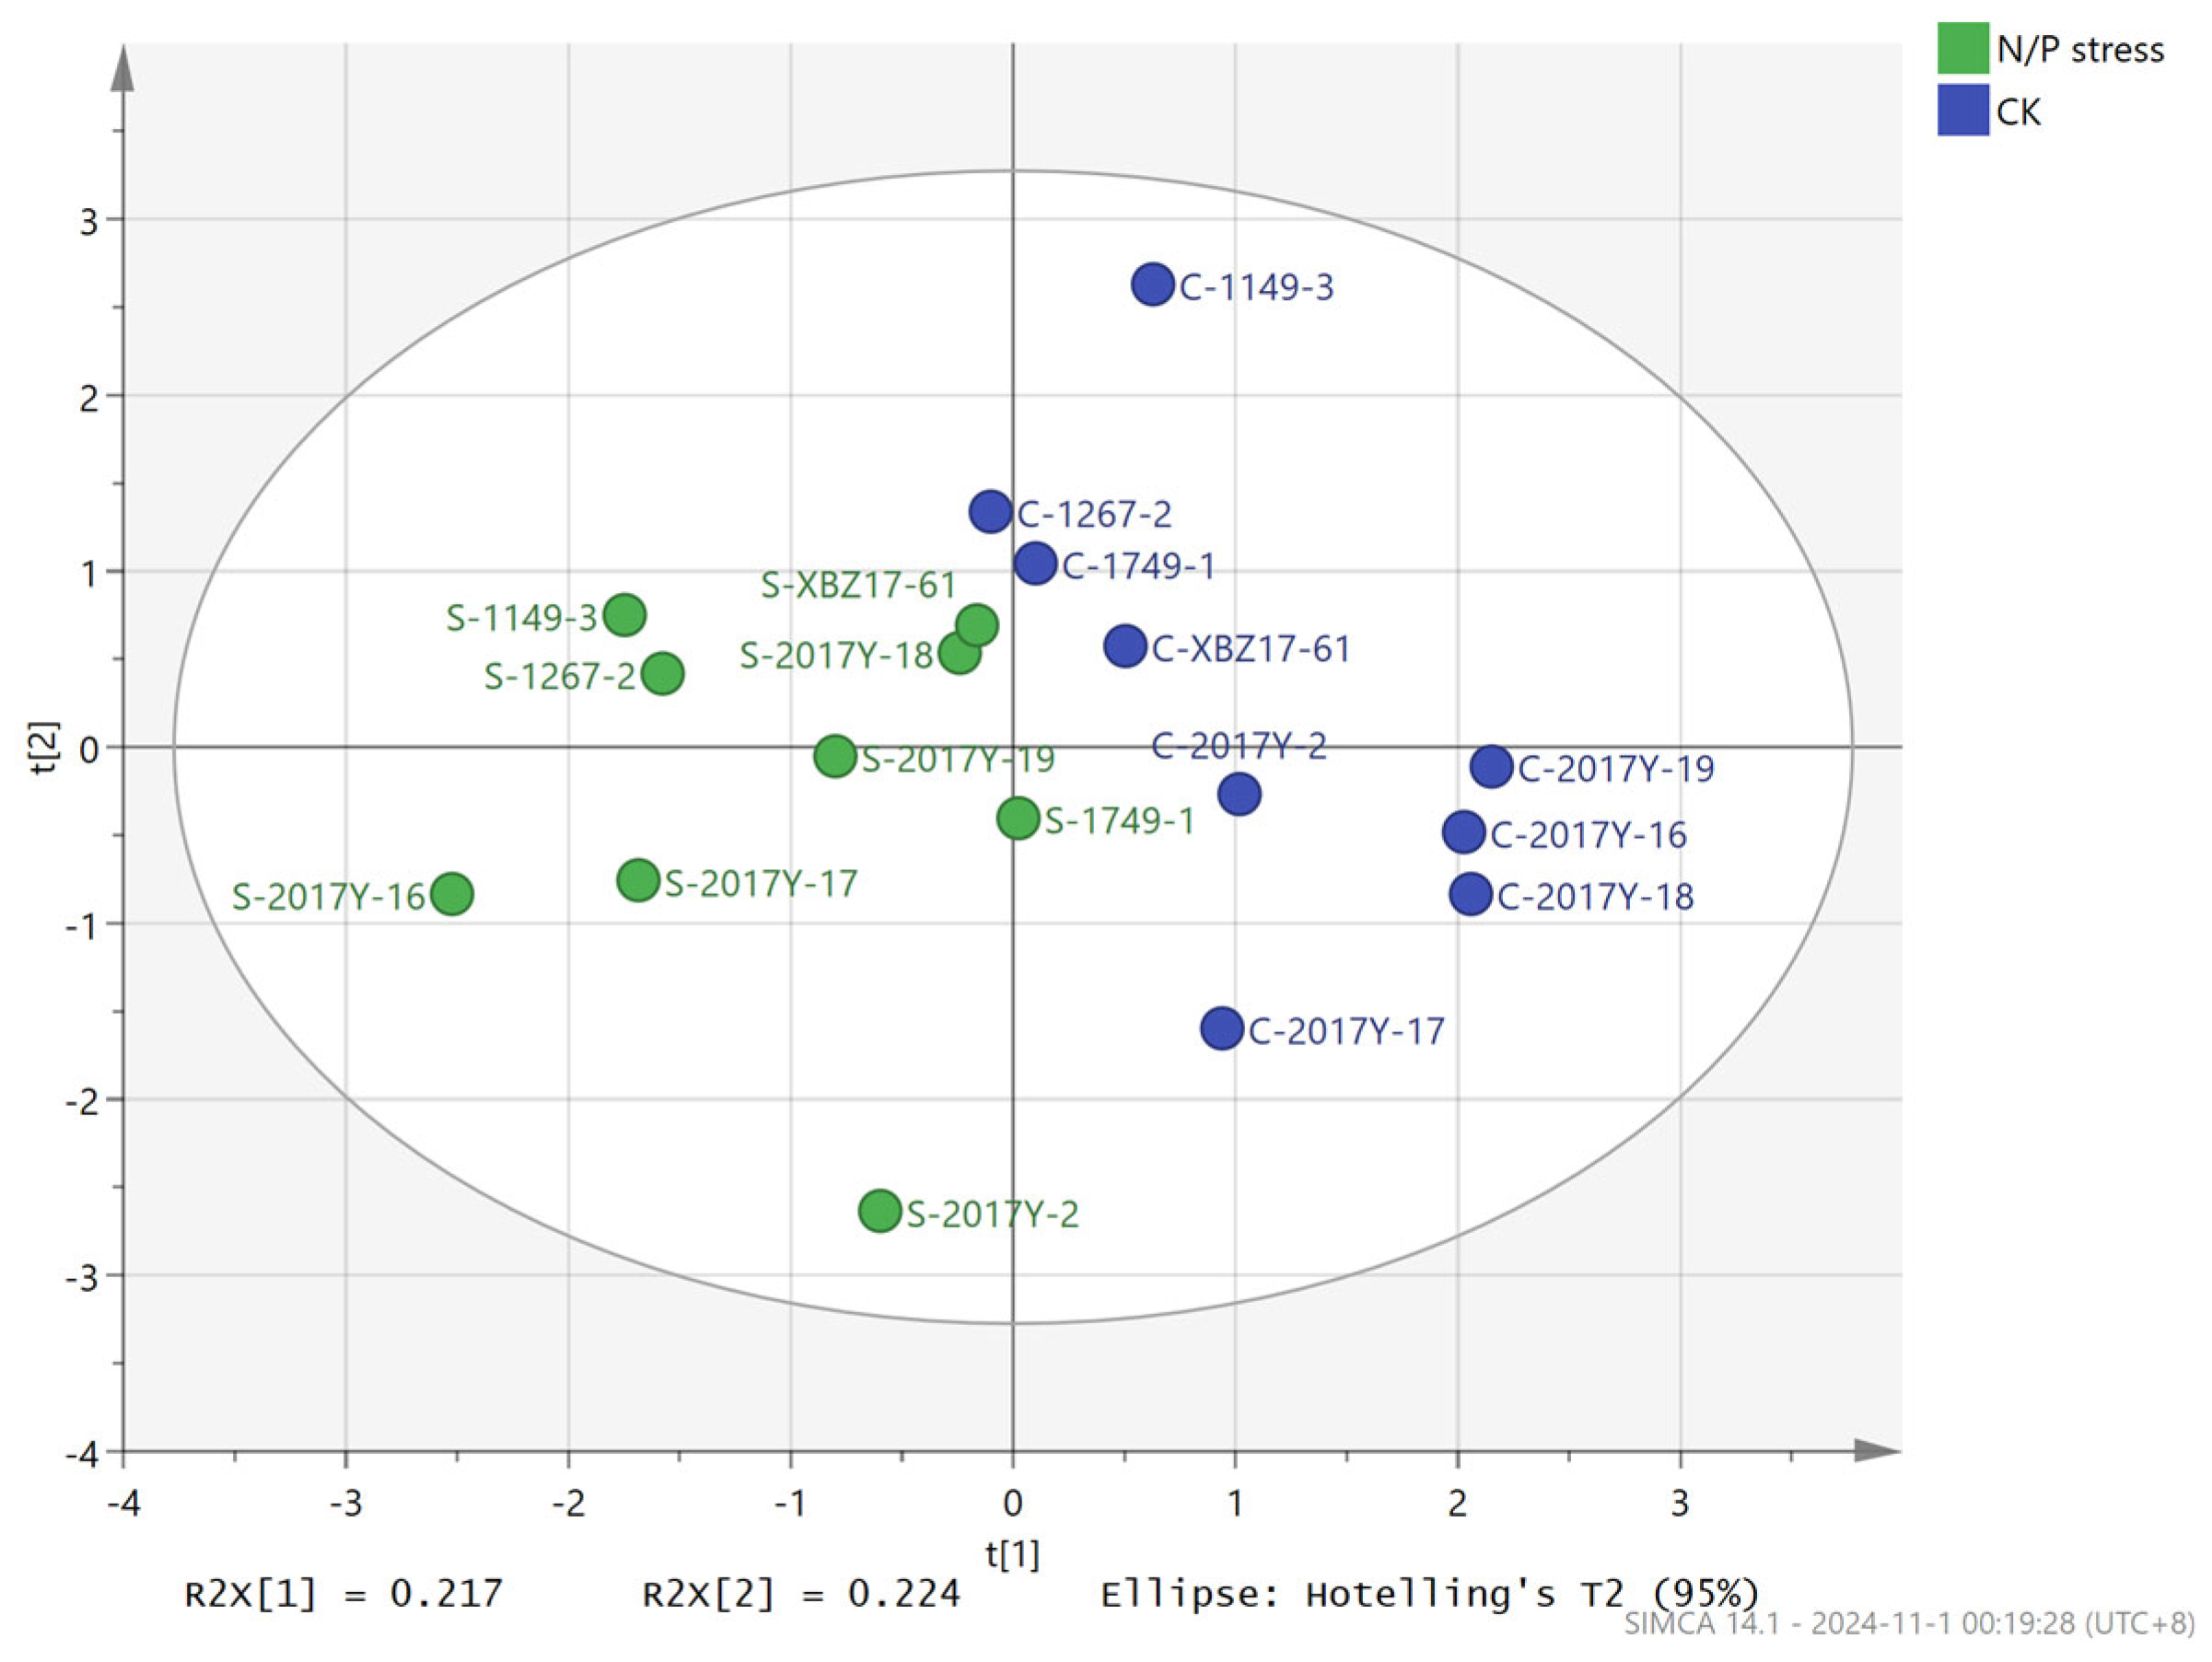
Through PLS-DA analysis (
Figure 7), by observing the abscissa, it can be found that there is little difference between the CK treatment group and the N/P Stress treatment group, indicating that the impact of low-nitrogen-and-phosphorus stress on barley is relatively weak. By observing the ordinate, the within-group difference in the CK treatment is slightly larger than that in the N/P Stress treatment, suggesting that the application of chemical fertilizers will expand the growth and quality differences among various lines.
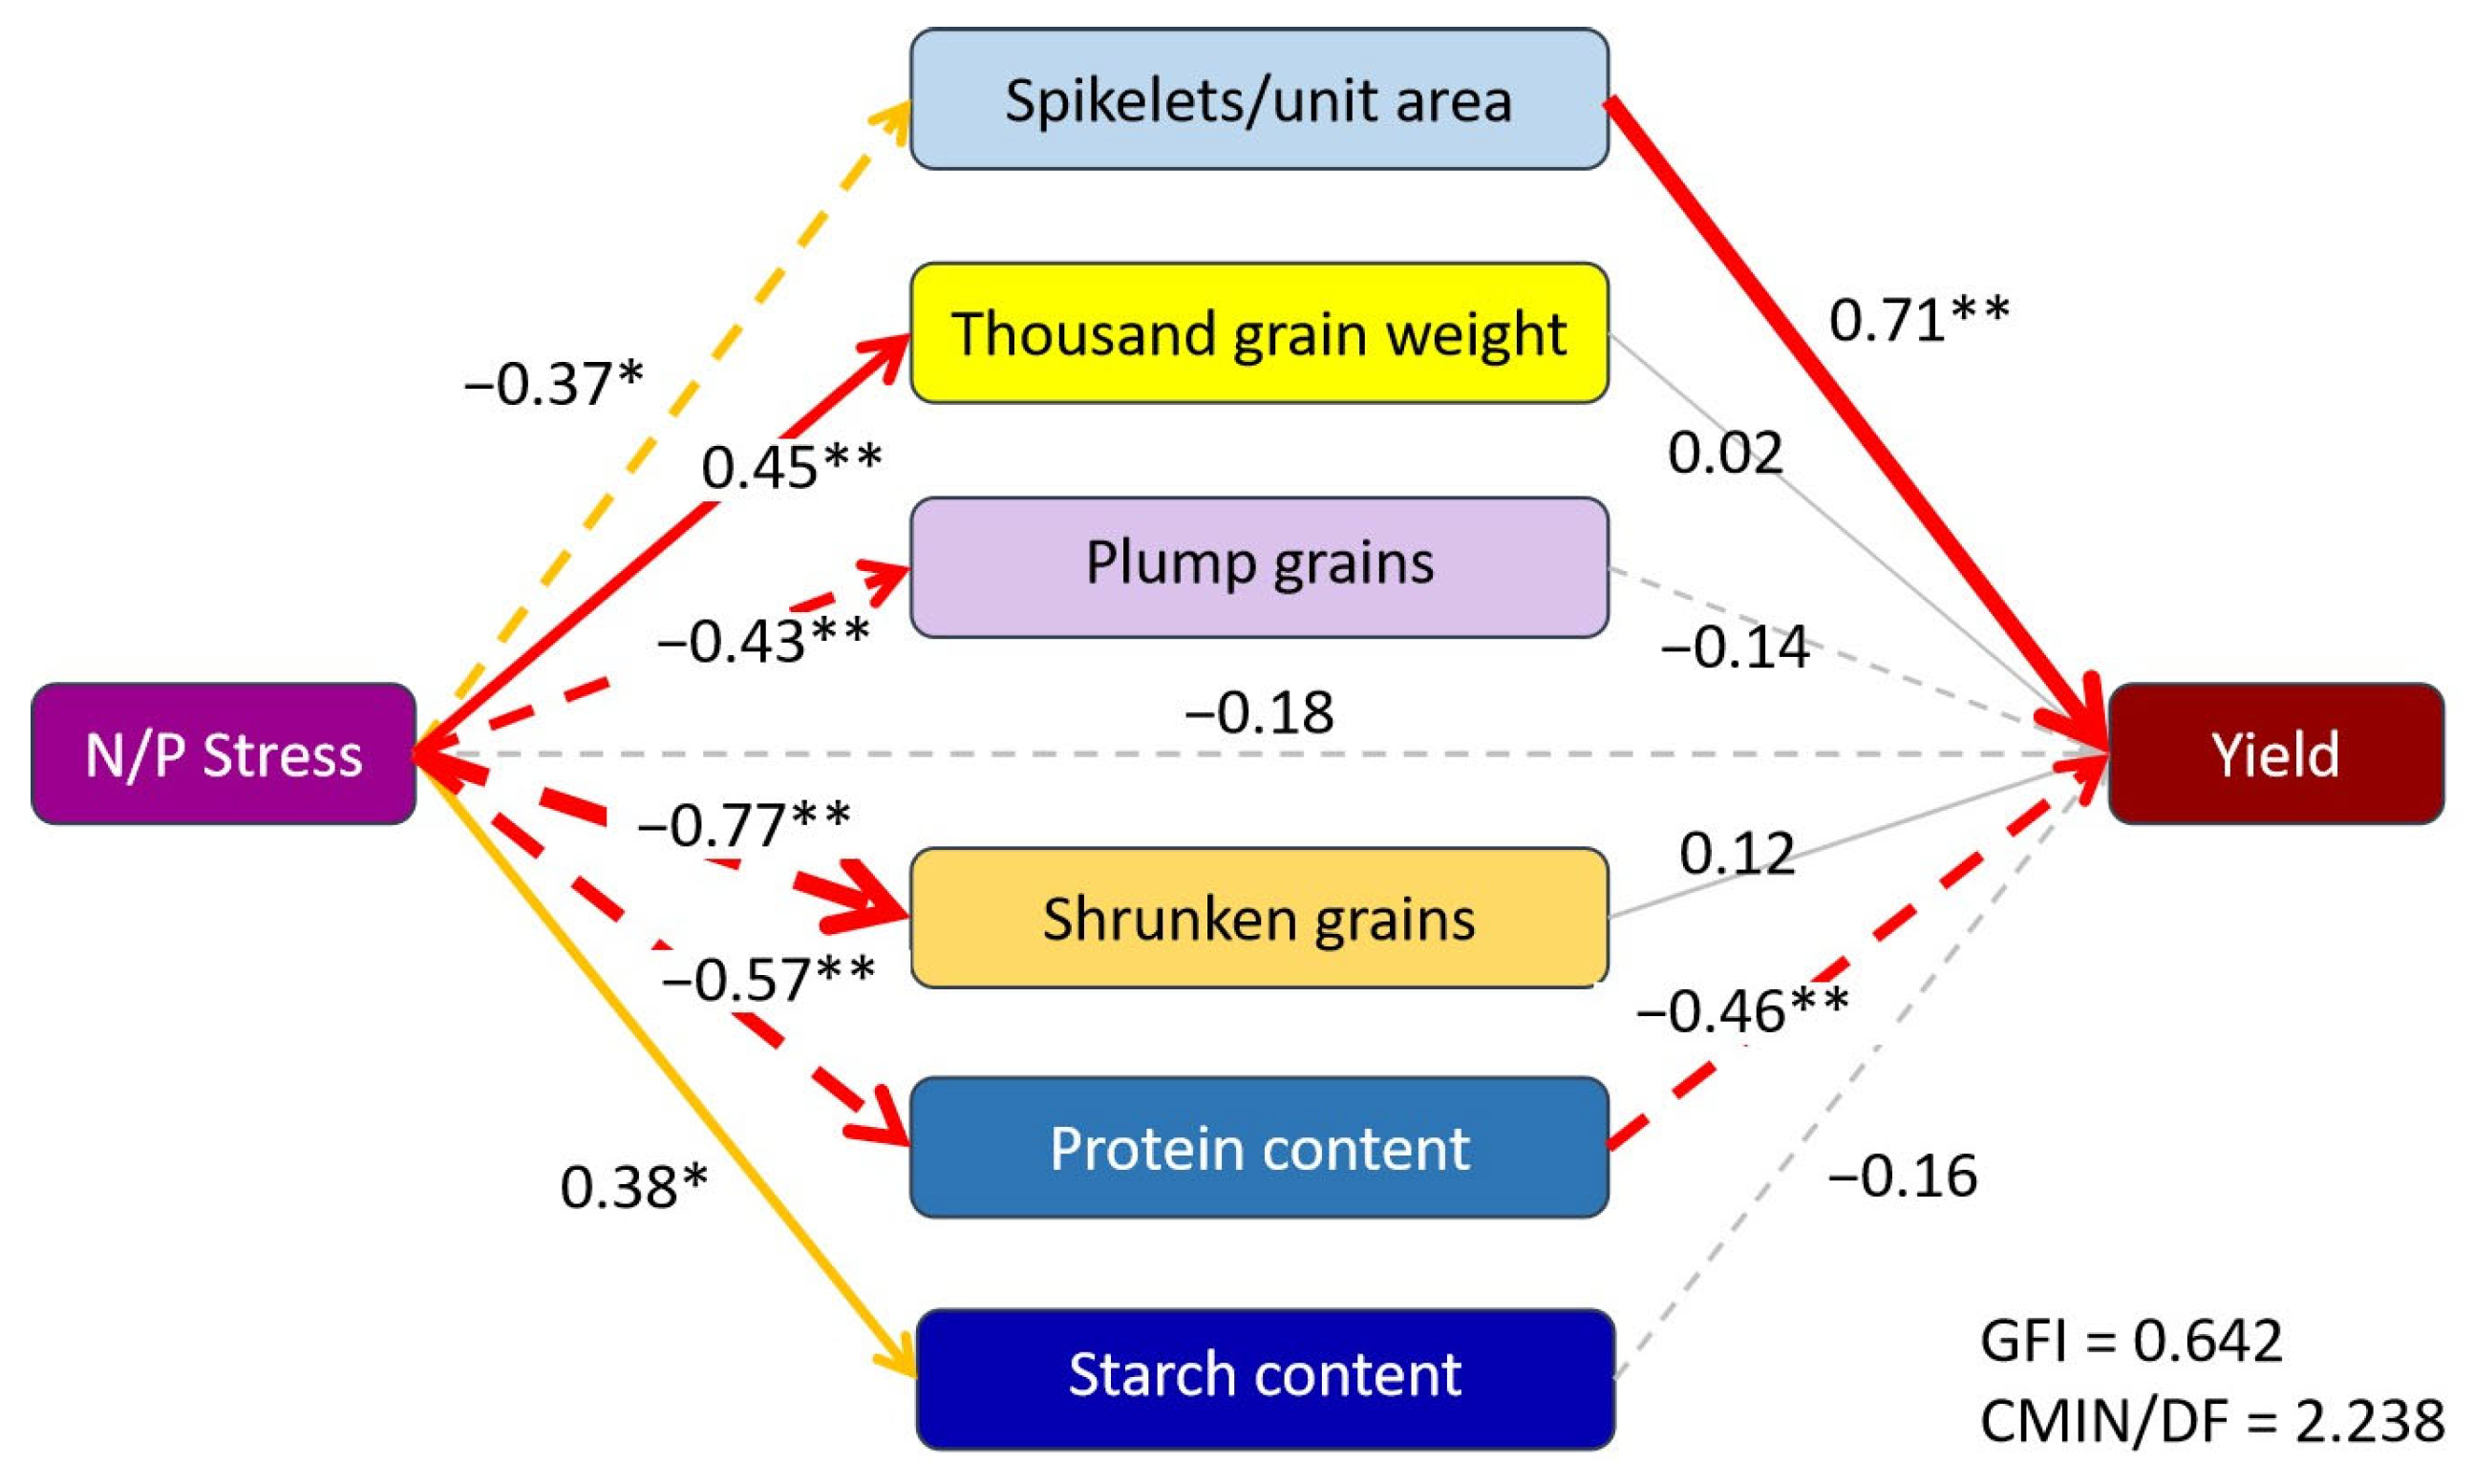
3.5. Structural Equation Modelling
Figure 8 shows a structural equation model constructed by selecting the indicators with significant effects, which describes the relationships between low-nitrogen-and-phosphorus stress, various barley indicators, and yield. The thickness of the lines represents the magnitude of the normalized coefficients. Solid lines indicate positive correlations, while dashed lines indicate negative correlations. The line colors represent the significance levels: red represents a significance level of 1%, yellow represents a significance level of 5%, and gray represents non-significance. The results show that low-nitrogen-and-phosphorus stress has a significantly positive impact on Thousand grain weight (
p < 0.01) and Starch content (
p < 0.05), and has a significantly negative impact on Spikelets/unit area (
p < 0.05), Plump grains (
p < 0.01), Shrunken grains (
p < 0.01), and Protein content (
p < 0.01). Only Spikelets/unit area (
p < 0.01) has a positive impact on yield, and Protein content (
p < 0.01) has a negative impact on yield. Low-nitrogen-and-phosphorus stress has no significant impact on yield.
3.6. Performance of Different Barley Lines Under Low N/P Stress to Maintain Logical Flow
In this study, the field traits and quality of barley were used as evaluation indicators for principal component analysis, and a principal component evaluation system was established. Through principal component analysis and the calculation of principal component scores, the comprehensive performance of different barley lines can be judged, thereby ranking different barley lines. It can be seen from the principal component scores that the 2017Y-2 line has the highest score in the low-nitrogen and low-phosphorus stress treatment, indicating that the 2017Y-2 line has less impact on its own quality under nitrogen and phosphorus stress. However, the yield of the 2017Y-2 line is the lowest among all lines. The 1749-1, 2017Y-16, 2017Y-17, 2017Y-18 and 2017Y-19 lines are relatively excellent in comprehensive performance under normal fertilization conditions and can be continuously cultivated as high-quality germplasm resources. The 1749-1, 1267-2, 1149-3, 2017Y-16, 2017Y-18, 2017Y-19, and XBZ17-1-61 lines have significantly higher yields than 2017Y-2 and 2017Y-17 under both normal fertilization and non-fertilization conditions, and can be continuously cultivated as high-yield germplasm resources. Among them, the 1749-1 line is more outstanding in both quality and yield among all lines, so the 1749-1 line has great market prospects.
5. Conclusions
Low nitrogen and phosphorus stress did not significantly affect barley yield, indicating that existing soil nutrients may suffice for growth. This highlights the need for rational fertilization practices to avoid unnecessary fertilizer application.
Spikelets per unit area was identified as a crucial factor positively correlating with yield, emphasizing its importance in future breeding efforts.
The line 1749-1 (designated as “Ganpi 10” and currently under non-crop variety registration) demonstrates the best comprehensive performance. Lines 1749-1, 1267-2, 1149-3, 2017Y-16, 2017Y-18, 2017Y-19, and XBZ17-1-61 are all high-yielding varieties, and ongoing regional trials are being conducted for these lines.
This research not only provides theoretical support for the selection and breeding of barley varieties with enhanced stress tolerance traits but also contributes to sustainable agricultural practices by optimizing resource utilization and minimizing environmental impact.


