Article

Cultivated Land Quality Evaluation and Constraint Factor Identification Under Different Cropping Systems in the Black Soil Region of Northeast China

1
College of Land Science and Technology, China Agricultural University, Beijing 100193, China
2
School of Humanities and Law, Northeastern University, Shenyang 110819, China
3
Key Laboratory of Arable Land Conservation in North China, Ministry of Agriculture and Rural Affairs, Beijing 100193, China
*
Author to whom correspondence should be addressed.
Agronomy 2025, 15(8), 1838; https://doi.org/10.3390/agronomy15081838
Submission received: 10 June 2025 / Revised: 22 July 2025 / Accepted: 28 July 2025 / Published: 29 July 2025
(This article belongs to the Section Innovative Cropping Systems)

Abstract

Cultivated land quality is a key factor in ensuring sustainable agricultural development. Exploring differences in cultivated land quality under distinct cropping systems is essential for developing targeted improvement strategies. This study takes place in Shenyang City—located in the typical black soil region of Northeast China—as a case area to construct a cultivated land quality evaluation system comprising 13 indicators, including organic matter, effective soil layer thickness, and texture configuration. A minimum data set (MDS) was separately extracted for paddy and upland fields using principal component analysis (PCA) to conduct a comprehensive evaluation of cultivated land quality. Additionally, an obstacle degree model was employed to identify the limiting factors and quantify their impact. The results indicated the following. (1) Both MDSs consisted of seven indicators, among which five were common: ≥10 °C accumulated temperature, available phosphorus, arable layer thickness, irrigation capacity, and organic matter. Parent material and effective soil layer thickness were unique to paddy fields, while landform type and soil texture were unique to upland fields. (2) The cultivated land quality index (CQI) values at the sampling point level showed no significant difference between paddy (0.603) and upland (0.608) fields. However, their spatial distributions diverged significantly; paddy fields were dominated by high-grade land (Grades I and II) clustered in southern areas, whereas uplands were primarily of medium quality (Grades III and IV), with broader spatial coverage. (3) Major constraint factors for paddy fields were effective soil layer thickness (21.07%) and arable layer thickness (22.29%). For upland fields, the dominant constraints were arable layer thickness (27.57%), organic matter (25.40%), and ≥10 °C accumulated temperature (23.28%). Available phosphorus and ≥10 °C accumulated temperature were identified as shared constraint factors affecting quality classification in both systems. In summary, cultivated land quality under different cropping systems is influenced by distinct limiting factors. The construction of cropping-system-specific MDSs effectively improves the efficiency and accuracy of cultivated land quality assessment, offering theoretical and methodological support for land resource management in the black soil regions of China.

1. Introduction

Cultivated land quality, a core subset of land quality, refers to the comprehensive capacity of cultivated land to support crop growth, maintain ecological functions, and ensure sustainable productivity under long-term management [1]. It integrates key soil, ecological, and environmental properties, and has evolved from a focus solely on productivity to a multidimensional framework that includes health, resilience, and sustainability [2,3]. The status of cultivated land quality is closely related to regional food security, sustainable agricultural development, and ecological stability [3,4]. Under the dual pressures of accelerating urbanization and population growth, cultivated land resources face simultaneous challenges of decreasing quantity and deteriorating quality. Enhancing cultivated land quality has become increasingly important for ensuring global food security [5,6]. In major grain-producing areas like the black soil region of Northeast China, periodic changes in cultivated land quality may have cumulative effects on regional agricultural production, potentially threatening yield stability and long-term sustainability [7]. Therefore, adopting scientifically sound, streamlined, and efficient approaches for evaluating cultivated land quality is of great significance for maintaining soil productivity and safeguarding food security.
Traditional approaches to cultivated land quality assessment have largely relied on empirical grading systems or single-indicator evaluations, which are insufficient to comprehensively reflect the multifunctional support capacity of land for agricultural production. In recent years, integrated evaluation methods have become increasingly mainstream. Among them, the Cultivated Land Quality Index (CQI) is a widely used frameworks that integrates multiple indicators into a composite model to reflect the overall quality of cultivated land [8,9]. However, the CQI approach is often constrained by indicator redundancy and subjectivity in weight assignment, limiting its scalability and efficiency at regional levels. To address these limitations, the Minimum Data Set (MDS) approach has been introduced into cultivated land quality assessment [10]. MDS typically employs multivariate statistical methods such as principal component analysis (PCA) and cluster analysis to extract a subset of key indicators from a full indicator pool—those with high informational value and strong representativeness. Compared to the traditional Total Data Set (TDS), the MDS framework significantly improves evaluation efficiency and operational feasibility while maintaining acceptable accuracy [11,12].
Although numerous studies have focused on soil quality assessment under different land use types—such as comparisons among forests, grasslands, and croplands [13,14,15]—less attention has been paid to the differences within cropland itself, particularly across distinct cropping systems. Paddy fields and uplands, as two dominant cultivation regimes, differ significantly in terms of water regulation, tillage practices, fertilization intensity, and frequency of soil disturbance, which in turn lead to notable differences in soil physicochemical properties, profile development, and functional structure [16,17]. Compared with upland soils, paddy soils have 52% higher organic matter content and 45% higher total nitrogen content [18]. Previous research has shown that long-term flooding in paddy fields enhances organic matter accumulation, suppresses oxidative decomposition, and results in a stratified soil profile with pronounced horizons [19]. In contrast, upland soils are more influenced by climatic and topographic variability, showing greater spatial heterogeneity and more complex nutrient distribution patterns [16,20]. Therefore, conducting classification-based assessments in mixed cropping regions is essential for elucidating the mechanisms by which land use practices affect soil quality and for improving the specificity and precision of land quality evaluation and management strategies. The obstacle factor diagnosis model, derived from the comprehensive evaluation framework, provides a solution for quantitatively analyzing the limiting factors of cultivated land quality [21]. Gao et al. identified the primary obstacle factors in Northeast China from the perspective of comprehensive land carrying capacity [22]. Similarly, Qian et al. applied the obstacle factor diagnosis model to analyze the constraints and their impacts on cultivated land quality at the county level [7]. Integrating the obstacle model into comprehensive evaluation offers a scientific basis for targeted land management and quality improvement strategies.
Shenyang City is located in the southern part of the black soil region in Northeast China, where paddy fields and upland fields are spatially interwoven, forming a complex mosaic of cropping systems. Accordingly, this study focuses on paddy and upland areas in Shenyang, and applies PCA to construct MDS separately for each cropping system. In addition, obstacle factor analysis is employed to identify key constraints on cultivated land quality. The objectives of this study are to (1) develop MDS-based indicator systems adapted to different cropping systems; (2) evaluate and analyze spatial differences in cultivated land quality between paddy and upland fields; and (3) identify the main obstacle factors affecting and limiting cultivated land quality under each system. The findings aim to provide theoretical support and technical guidance for improving cultivated land quality across diverse cropping regimes in the black soil region.

2. Materials and Methods

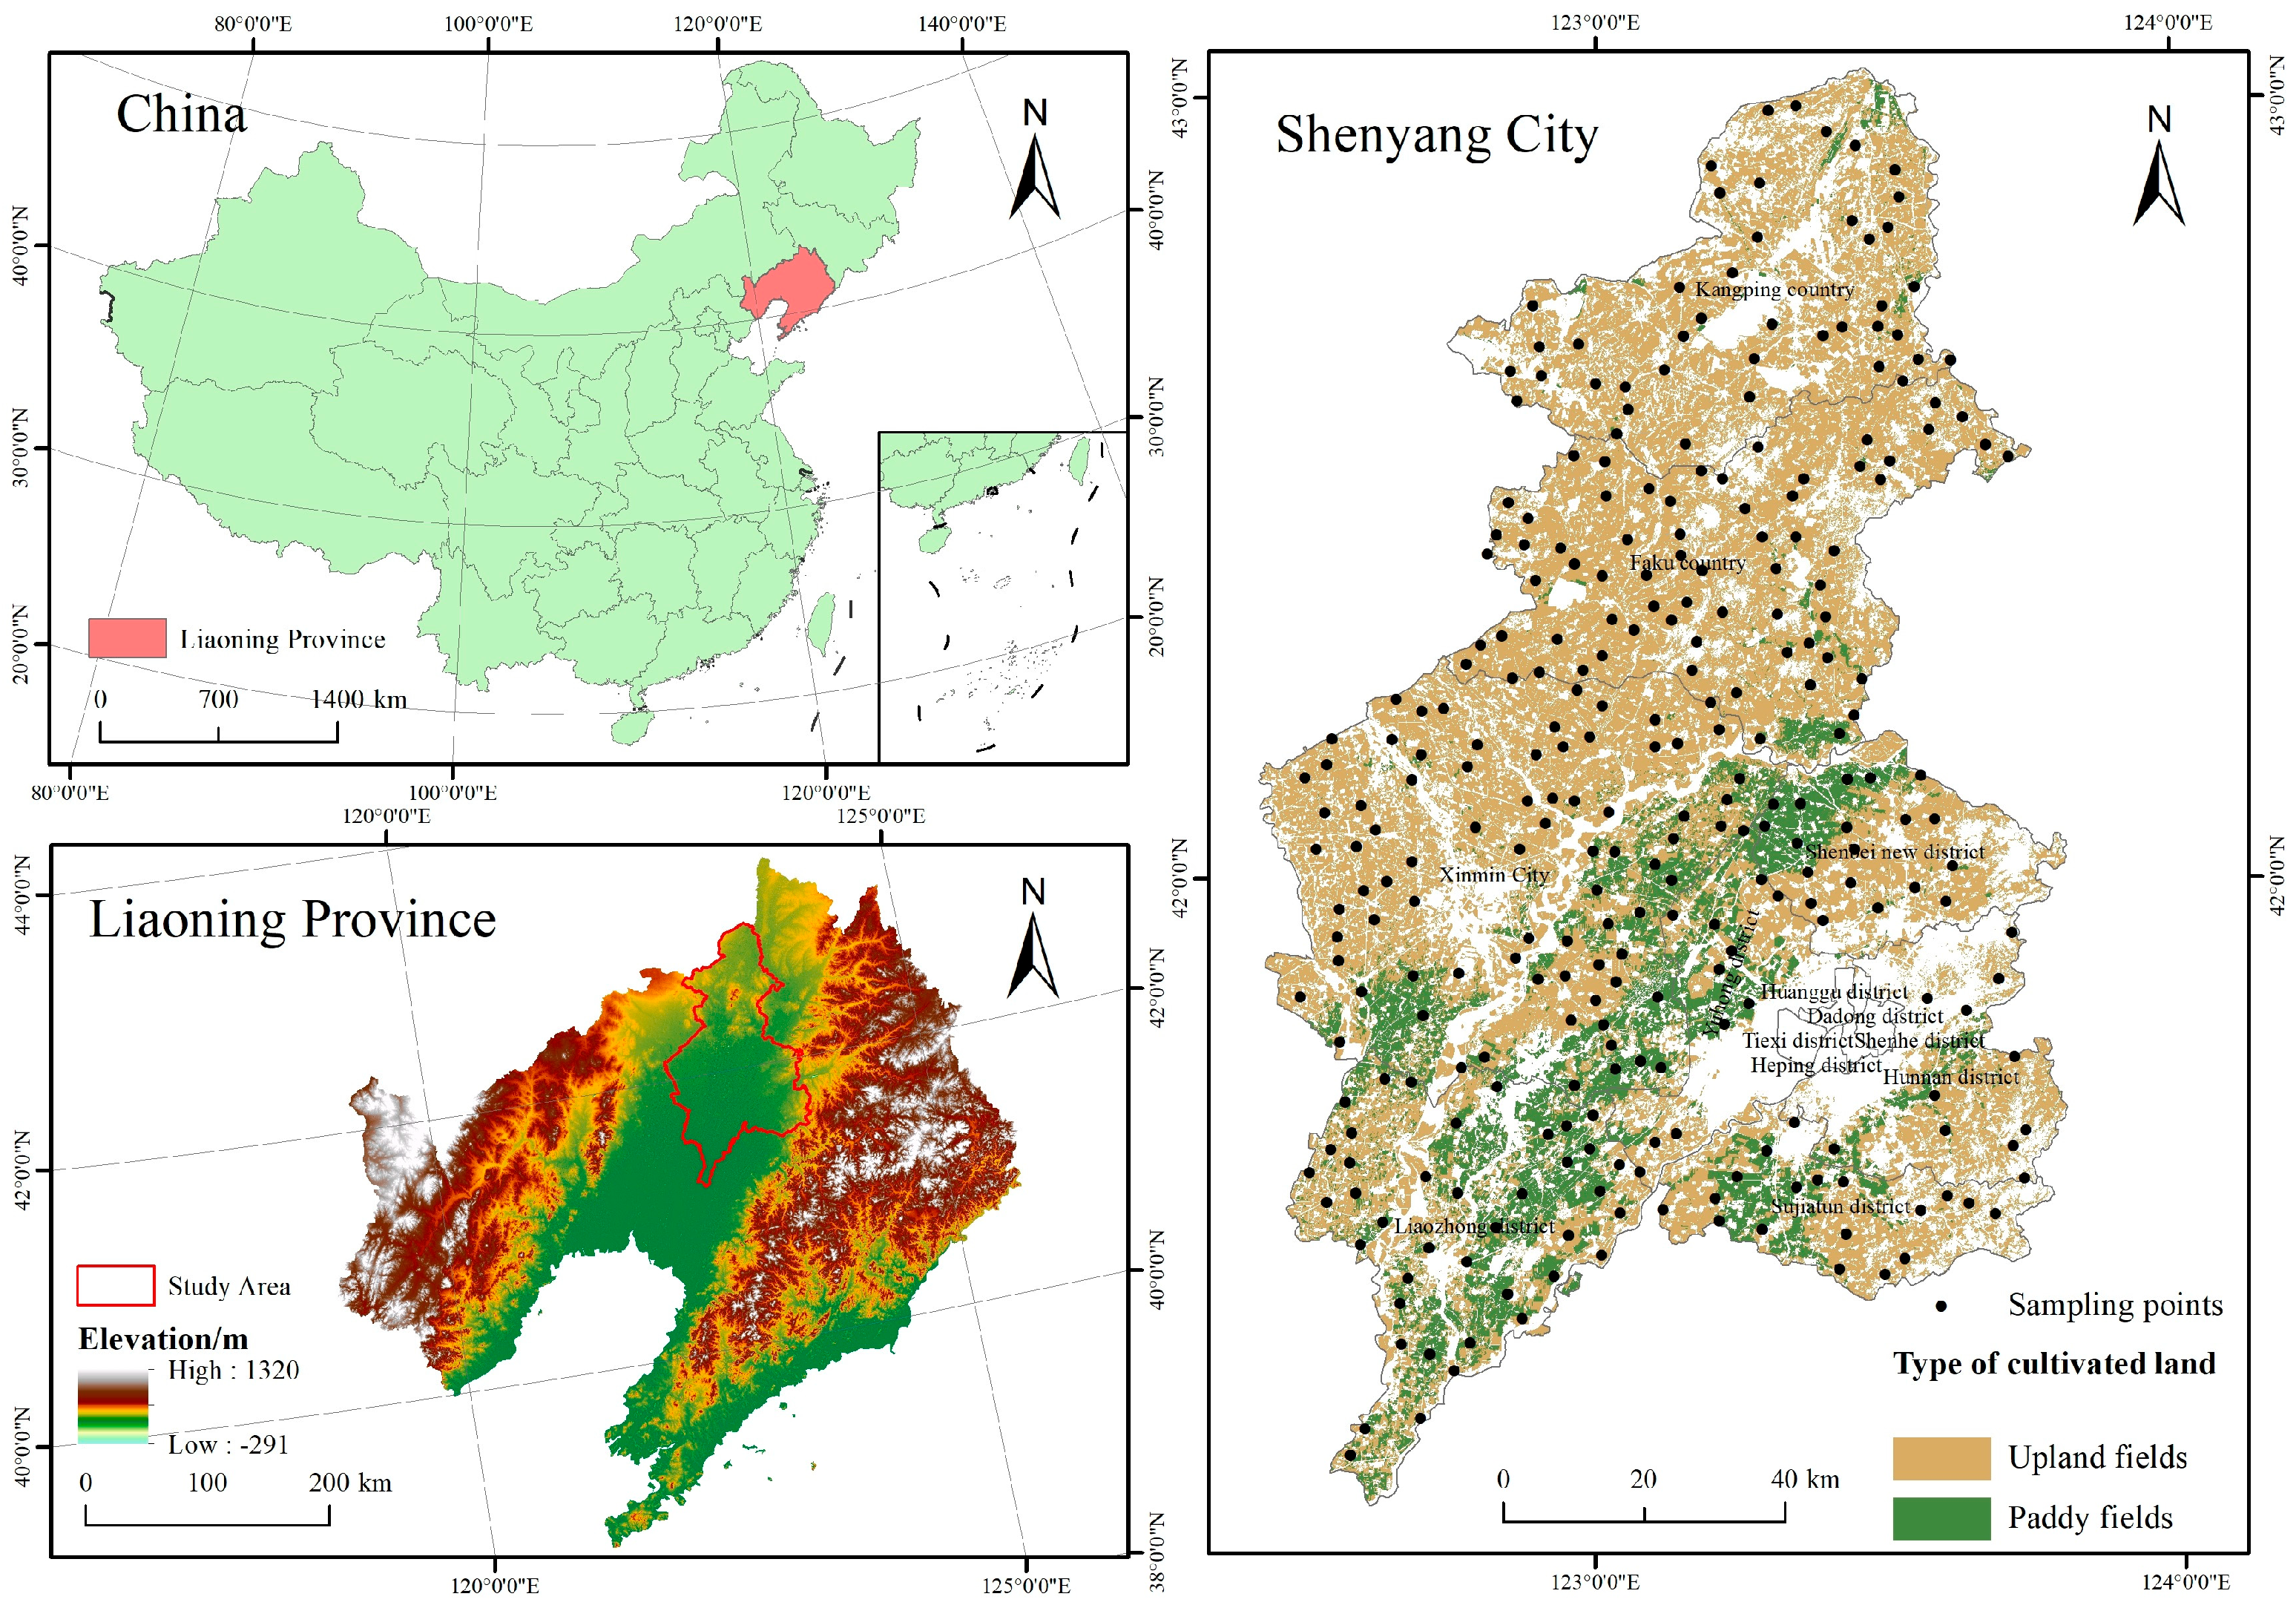
2.1. Study Area and Data Sources

As shown in Figure 1, Shenyang City is located in the southern part of Northeast China and central Liaoning Province (122°25′09′′ E–123°48′24′′ E, 41°11′51′′ N–43°02′13′′ N). The city administratively consists of 10 districts and 3 counties (including one county-level city). The terrain of Shenyang gradually opens from east to west and from north to south, with hilly and mountainous areas in the east and north, and the central region lying within the Liaohe Plain. The predominant soil type is meadow soil (a soil type classified under the Chinese Soil Taxonomy, typically formed under grassland vegetation with moderate to high groundwater influence). Shenyang has a temperate humid continental climate characterized by four distinct seasons, with cold, long winters and warm, rainy summers. Annual precipitation ranges from 600 to 800 mm. The total cultivated land area in Shenyang is approximately 8091.03 km2, of which 6498.11 km2 is upland—mainly used for maize cultivation—and 1592.96 km2 is paddy field, primarily used for rice production.
Sampling data were obtained from the 2021 Cultivated Land Quality Survey and Evaluation Program of Shenyang City, comprising 288 sampling points (including 237 upland and 51 paddy field sites). The sampling strategy adopted a stratified approach to ensure that the sampling points covered different landform regions, cultivated land use types, and soil types, thereby guaranteeing both representativeness and a sufficient sample size for statistical analysis. The data include information on soil classification, soil subgroup, landform type, arable layer thickness, soil pH, soil texture, texture configuration, and irrigation capacity. The spatial data include a current land use map of Shenyang, administrative boundary map, elevation map, and a 1:18 million national soil parent material type map of China. Climate data were collected from meteorological observation stations via relevant meteorological agencies.

2.2. Evaluation of Cultivated Land Quality

2.2.1. Indicator System and Membership Function Selection

Establishing a scientifically sound indicator system is fundamental to cultivated land quality evaluation. TDS should cover a wide range of cultivated land quality characteristics. In this study, 13 indicators were selected across 6 dimensions, including climatic conditions, profile characteristics, and site conditions, to construct a comprehensive cultivated land quality evaluation system (Table 1). These indicators include ≥10 °C accumulated temperature, annual precipitation, effective soil layer thickness, arable layer thickness, and others [23].
Calculating membership values using fuzzy mathematics is key to evaluating land quality. To ensure accurate computation of the cultivated land quality index and to better capture the difference between the actual and optimal indicator levels in the obstacle degree model, two types of membership functions were used for numerical indicators: the “more is better” function and “optimal range” function [12]. They are based on fuzzy set theory proposed by Zadeh [24], which offers a flexible mathematical framework to handle uncertainty and imprecision in environmental data. These functions are widely applied in soil and land quality evaluations as they allow for gradual transitions in suitability rather than rigid thresholds [25]. Recent studies have successfully adopted such fuzzy logic-based approaches to standardize indicators in cultivated land quality assessments [17,26]. Specifically, the indicators ≥10 °C accumulated temperature, annual precipitation, effective soil layer thickness, arable layer thickness, parent material, landform type, organic matter, and available phosphorus were evaluated using the “more is better” function (Equation (1)), while soil pH was assessed using the “optimal range” function (Equation (2)) [26]. The parameter settings for these functions are shown in Table 2.
f ( x ) = 0.1 x x m i n 0.9 × x x m i n x m a x x m i n + 0.1 x m i n x x m a x 1 x x m a x
f x = 0.1 x < x 1 0.9 × x x 1 r 1 x 1 + 0.1 x 1 < x < r 1 1 r 1 < x < r 2 1 0.9 × x r 2 x 2 r 2 r 2 < x < x 2 0.1 x > x 2
where f(x) represents the membership value of an indicator, ranging from 0.1 to 1, and x denotes the actual observed value of the indicator. r1 and r2 are the optimal lower and upper bounds, respectively. According to prior research in the region, the optimal soil pH value is 6.8, with a lower limit of 4.35 and an upper limit of 9.69 [23]. Therefore, both r1 and r2 are set at 6.8, while xmin and xmax are 4.35 and 9.69, respectively.
For conceptual or qualitative indicators (Table 3), such as texture configuration, parent material, landform type, soil texture, irrigation capacity, and drainage capacity, the relationship between the indicator level and cultivated land quality cannot be accurately described through mathematical functions. Therefore, their membership degrees were determined based on findings from previous studies [23].

2.2.2. MDS Selection and Weight Calculation

Based on the established comprehensive cultivated land quality indicator system, PCA was applied—together with standard value calculation and correlation analysis—to identify representative and independent indicators for constructing the MDS [13]. Statistical analyses of the full indicator dataset were conducted using SPSS 26.0 (IBM, Armonk, NY, USA). The suitability of the dataset for PCA was evaluated using the Kaiser–Meyer–Olkin (KMO) test and Bartlett’s test of sphericity [5,7].
Principal components (PCs) with eigenvalues greater than or equal to 1 and explaining at least 5% of total variance were extracted [27]. Indicators were assigned to the component on which they had a loading value ≥0.5. If an indicator had loadings <0.5 on all components, it was grouped with the component where it had the highest loading [13].
The composite loading value of each indicator across selected PCs was calculated using Equation (3). Within each component group, we retained indicators whose composite loadings were at least 90% of the maximum loading in that group. Correlation analysis was then performed. If the Pearson correlation coefficient between any two retained indicators exceeded 0.3, only the one with the higher composite loading was retained; otherwise, all were included in the MDS [17].
N orm   = k = 1 K   u i k 2 λ k  
where Norm represents the composite loading value of the ith indicator across the top k principal components with eigenvalues ≥1; u is the loading of the ith indicator on the kth principal component; and λk is the eigenvalue of the kth component.
The weight of each selected indicator was determined based on its communality value obtained from PCA. Communality reflects the proportion of an indicator’s total variance explained by the retained components, ranging from 0 to 1. A higher communality indicates a greater contribution of the indicator to the overall variance structure [28].

2.2.3. Calculation of the CQI

We further calculated the CQI for each evaluation unit based on the established indicator system and the derived membership values. The CQI is positively correlated with cultivated land quality; higher CQI values indicate better land quality, while lower values reflect poorer conditions. The calculation formula is as follows:
C Q I = C i × F i
where Ci represents the weight of the ith evaluation indicator, and Fi denotes its membership value. The CQI values were classified into five quality grades using the equal-interval method, where Grade I represents the highest land quality and Grade V the lowest.

2.2.4. Validation of MDS Evaluation Accuracy

The accuracy of the CQI derived from the MDS was evaluated using the Nash–Sutcliffe efficiency coefficient (Ef), relative error coefficient (ER), and the coefficient of determination (R2) between the MDS-based and TDS-based CQI values. Lower ER values (closer to 0), and higher Ef and R2 values (closer to 1), indicate stronger consistency and greater accuracy of the MDS-based evaluation results.
E f = 1 C Q I T C Q I S 2 C Q I T C Q I T ¯ 2
E R = n = 1 N   C Q I T n = 1 N   C Q I S n = 1 N   C Q I T
In the equations, C Q I T and C Q I T ¯ represent the cultivated land quality index and its mean value calculated based on the TDS, respectively, while C Q I S denotes the cultivated land quality index derived from the MDS.

2.3. Obstacle Factor Diagnosis

An obstacle degree model was introduced to identify the primary constraint factors limiting cultivated land quality and to quantify their relative influence [29], thereby providing targeted decision-making support for improving cultivated land quality. The calculation method is as follows:
B i j = 1 A i j
M i j = B i j V i j j = 1 n B i j V i j × 100 %
where Bij represents the deviation degree of indicator j under criterion layer i, and Aij is the corresponding membership degree. Mij denotes the obstacle degree of indicator j under criterion layer i, and Vij is its assigned weight. The obstacle degree was classified into five levels using the equal-interval method: non-apparent obstacle (0), mild obstacle (0–10%), moderate obstacle (10–20%), high obstacle (20–30%), and severe obstacle (30–40%).

2.4. Spatial Interpolation Analysis

Kriging is a geostatistical method used to perform optimal, linear, and unbiased estimation of regionalized variables at unsampled locations. Among the various kriging techniques, Ordinary Kriging is one of the most widely applied approaches due to its robustness and effectiveness in estimating values across continuous spatial domains using a limited number of sampling points [30]. In this study, four commonly used variogram models—linear, spherical, exponential, and Gaussian—were employed to fit the spatial variation of the cultivated land quality index. Ordinary Kriging interpolation was implemented using the best-fitting exponential model based on cross-validation results. The variogram models were selected based on the highest R2 and the lowest root mean square error (RMSE). Parameters such as nugget, sill, and range were estimated using GS + 7.0 software (Gamma Design Software, Plainwell, MI, USA), and isotropic conditions were assumed during model fitting.

2.5. Data Processing

Statistical analyses were performed using SPSS 26.0 (IBM, Armonk, NK, USA), including principal component analysis, correlation analysis, and normality tests. Geostatistical analysis was conducted using GS + 7.0 (Gamma Design Software, Plainwell, MI, USA), and spatial mapping was carried out with the spatial analysis tools in ArcGIS 10.8 (Esri, Redlands, CA, USA).

3. Results

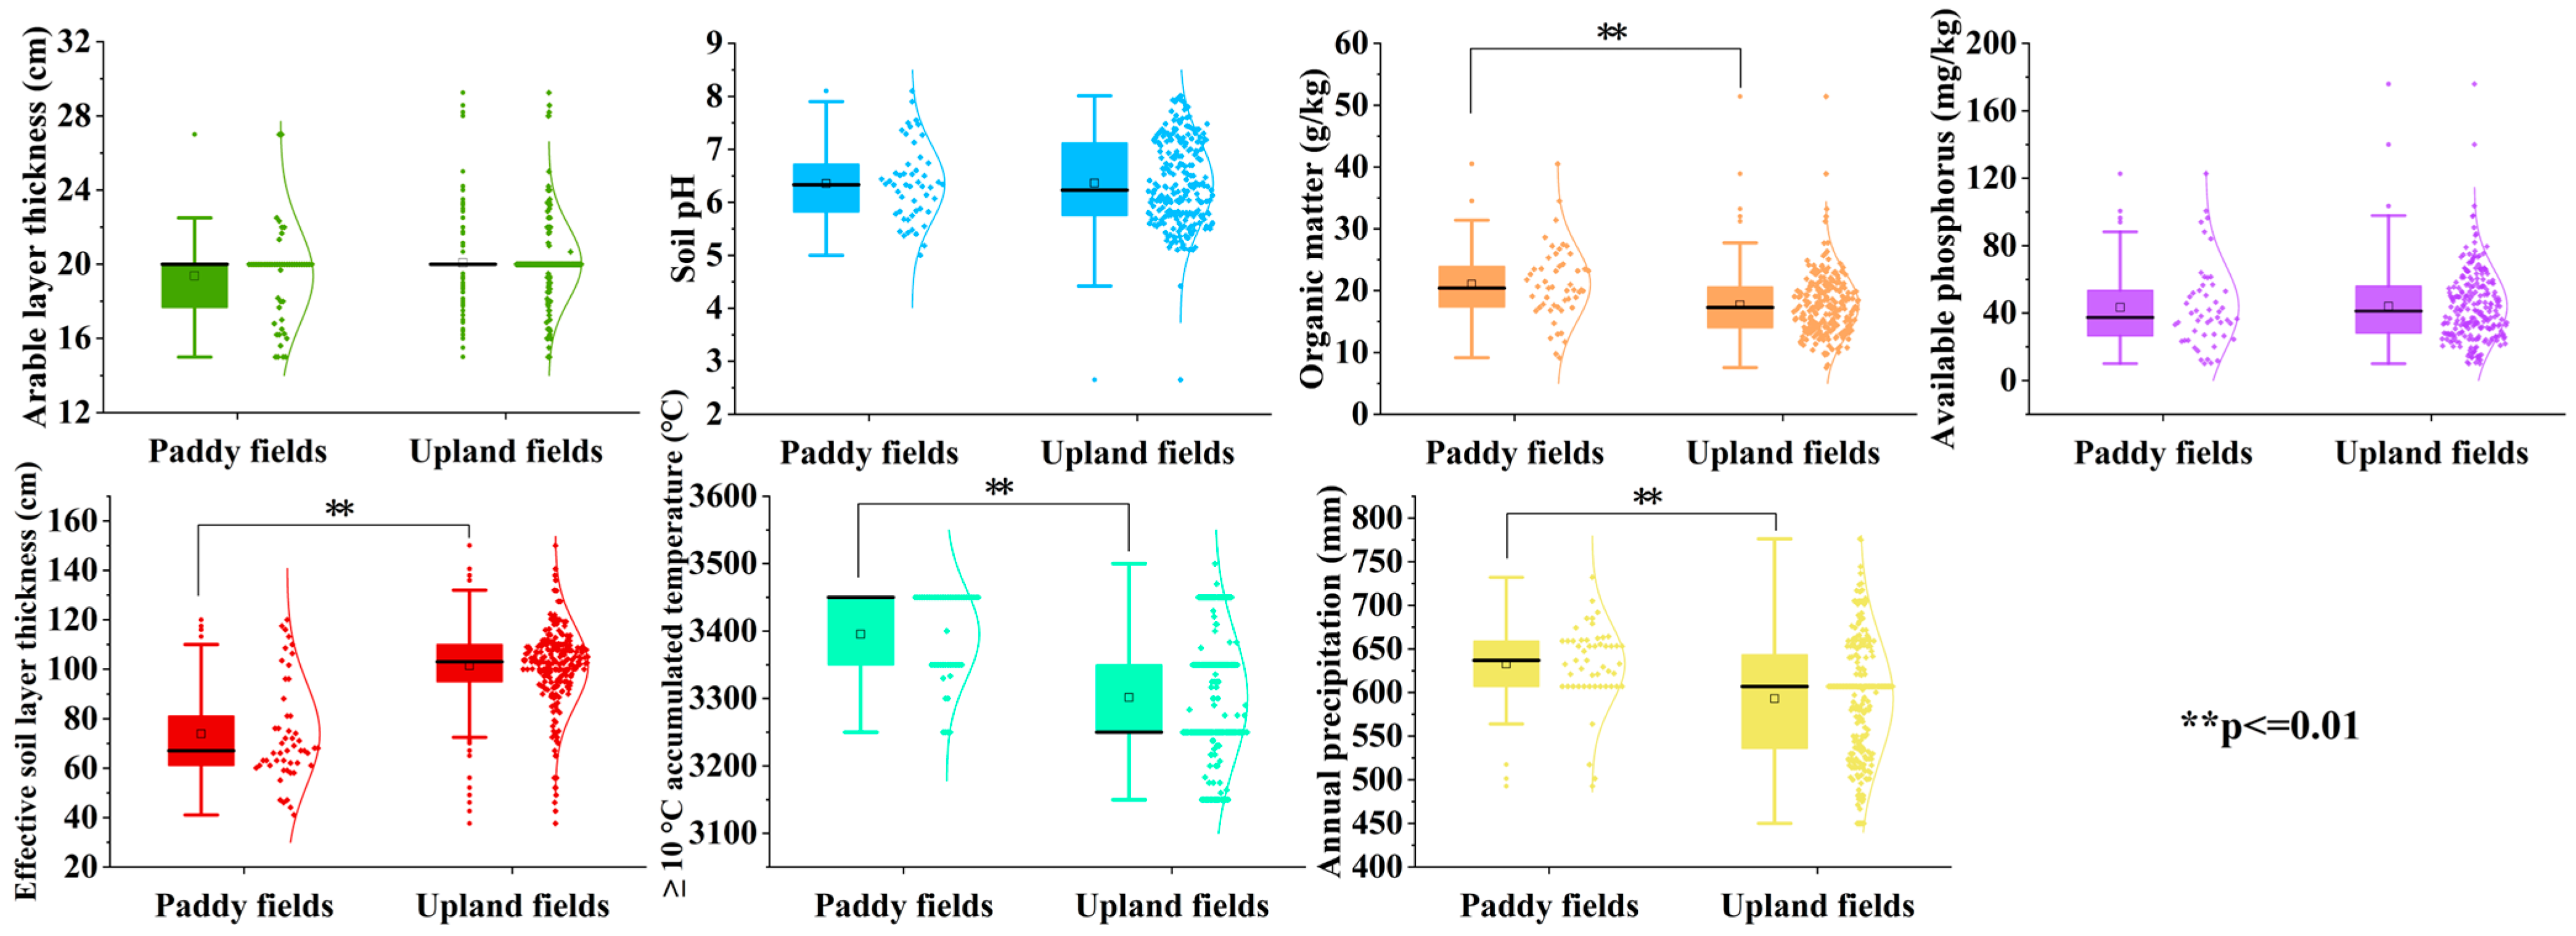
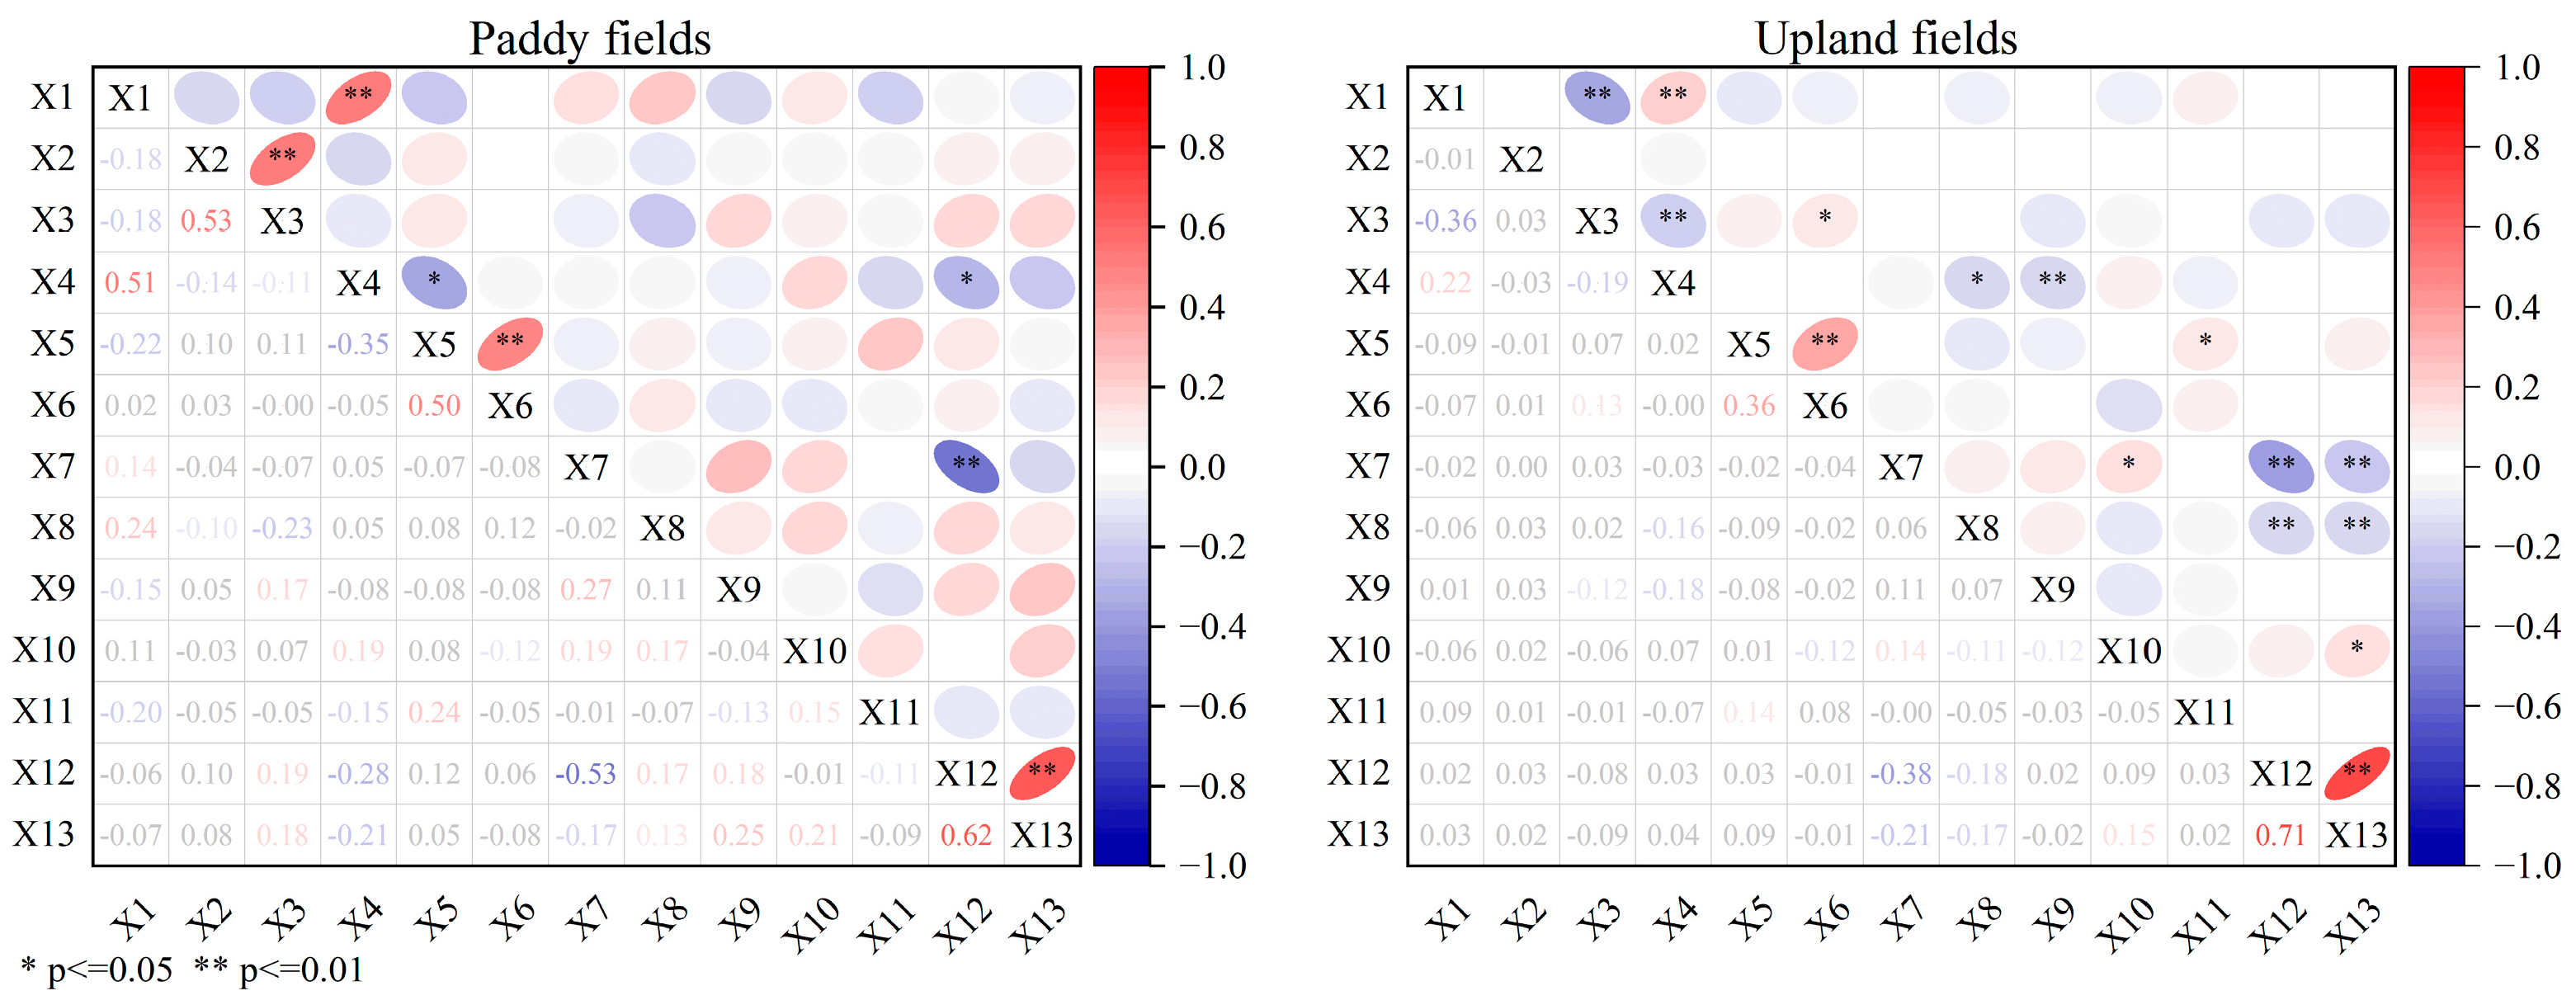
3.1. Descriptive Statistics

The distribution of numerical indicators for different types of cultivated land is shown in Figure 2. To assess the statistical significance of differences between paddy and upland fields, independent samples t-tests were performed for each numerical indicator. Results showed that under different cropping systems, the distributions of arable layer thickness, soil pH, and available phosphorus content were generally similar between paddy fields and upland fields, with no significant differences. Specifically, both paddy and upland arable layer thickness values were concentrated around 20 cm, which is approximately the optimal tillage depth for crop growth [31,32]. The average arable layer thickness in paddy fields was slightly lower than that in uplands. Soil pH values were mostly concentrated around 6.3, slightly below the regional optimal value of 6.8 [23], with paddy fields showing slightly higher pH than uplands. Available phosphorus was concentrated around 40 mg/kg, with upland fields showing slightly higher levels.
Significant differences were observed in organic matter content, effective soil layer thickness, ≥10 °C accumulated temperature, and annual precipitation (p < 0.01). The average organic matter content in paddy fields was 21.04 g/kg, significantly higher than that in uplands (17.67 g/kg). Upland fields had a notably greater effective soil layer thickness (101.41 cm) compared to paddy fields (73.84 cm). The mean ≥10 °C accumulated temperature was also significantly higher in paddy fields (3395.36 °C) than in uplands (3301.35 °C). Similarly, paddy fields received more annual precipitation (632.87 mm) than uplands (592.89 mm).

3.2. Construction of the MDS

The statistical results showed that the KMO value for upland fields was 0.58 (KMO > 0.5), and the Bartlett’s test of sphericity was significant (p < 0.05). Similarly, the KMO value for paddy fields was 0.50 with a Bartlett significance level of 0.00, indicating significant inter-variable correlations and suitability of the datasets for PCA [7].
Based on PCA and Pearson correlation analysis (Figure 3), six PCs with eigenvalues ≥1 and explaining at least 5% of the total variance were extracted for paddy fields, accounting for over 74% of the total information on cultivated land quality (Table 4). The indicators ≥10 °C accumulated temperature, annual precipitation, soil texture, landform type, texture configuration, and soil pH were grouped into the first component. Although ≥10 °C accumulated temperature and annual precipitation both exhibited high Norm values, they were significantly correlated; hence, ≥10 °C accumulated temperature was selected for inclusion in the MDS. Irrigation capacity and drainage capacity formed the second group; due to their high correlation, only irrigation capacity was retained. Arable layer thickness, which constituted a unique third group, was directly included in the MDS. Parent material and effective soil layer thickness formed the fourth group without significant correlation, and both were retained. Organic matter and available phosphorus were grouped into the fifth and sixth groups, respectively, and both were included. Ultimately, the MDS for paddy fields comprised seven indicators: ≥10 °C accumulated temperature, irrigation capacity, arable layer thickness, parent material, effective soil layer thickness, organic matter, and available phosphorus. Their weights were ranked as follows: ≥10 °C accumulated temperature (0.164) > arable layer thickness (0.163) > effective soil layer thickness (0.148) > parent material (0.147) > available phosphorus (0.131) > irrigation capacity (0.124) > organic matter (0.122).
As shown in Table 5, five PCs were extracted for upland fields, explaining over 58% of the total variance. Using the same method, seven indicators were selected for the upland MDS: ≥10 °C accumulated temperature, landform type, irrigation capacity, soil texture, arable layer thickness, available phosphorus, and organic matter. Their weights were ranked as follows: available phosphorus (0.180) > ≥10 °C accumulated temperature (0.163) > arable layer thickness (0.162) > soil texture (0.154) > organic matter (0.141) > landform type (0.140) > irrigation capacity (0.060). The full loading matrices of all indicators are provided in Supplementary Tables S1 and S2.
In this study, all TDS contained thirteen indicators, while both the paddy and upland MDSs retained seven indicators, yielding a selection rate of 46%, which effectively simplified the evaluation framework.

3.3. Cultivated Land Quality Evaluation

3.3.1. Quantitative Characteristics of Sampled Points CQI

As shown in Figure 4, the cultivated land quality evaluation results for paddy and upland fields exhibit similar quantitative characteristics. The cultivated land quality index for paddy fields (CQIp) ranged from 0.323 to 0.801, with a mean value of 0.603. For upland fields, the CQI (CQIu) ranged from 0.288 to 0.808, with a mean of 0.608. Further statistical analysis revealed that the standard deviation (0.095) and variance (0.009) of CQI in paddy fields were higher than those in upland fields (0.084 and 0.007, respectively), indicating that cultivated land quality in paddy fields exhibited greater variability. Analysis of skewness and kurtosis indicated that both types of land exhibited left-skewed distributions, suggesting a higher proportion of high-quality cultivated land. The kurtosis of paddy fields was 0.830, notably higher than that of upland fields (0.551), indicating that the quality values in paddy fields were more concentrated around the mean.

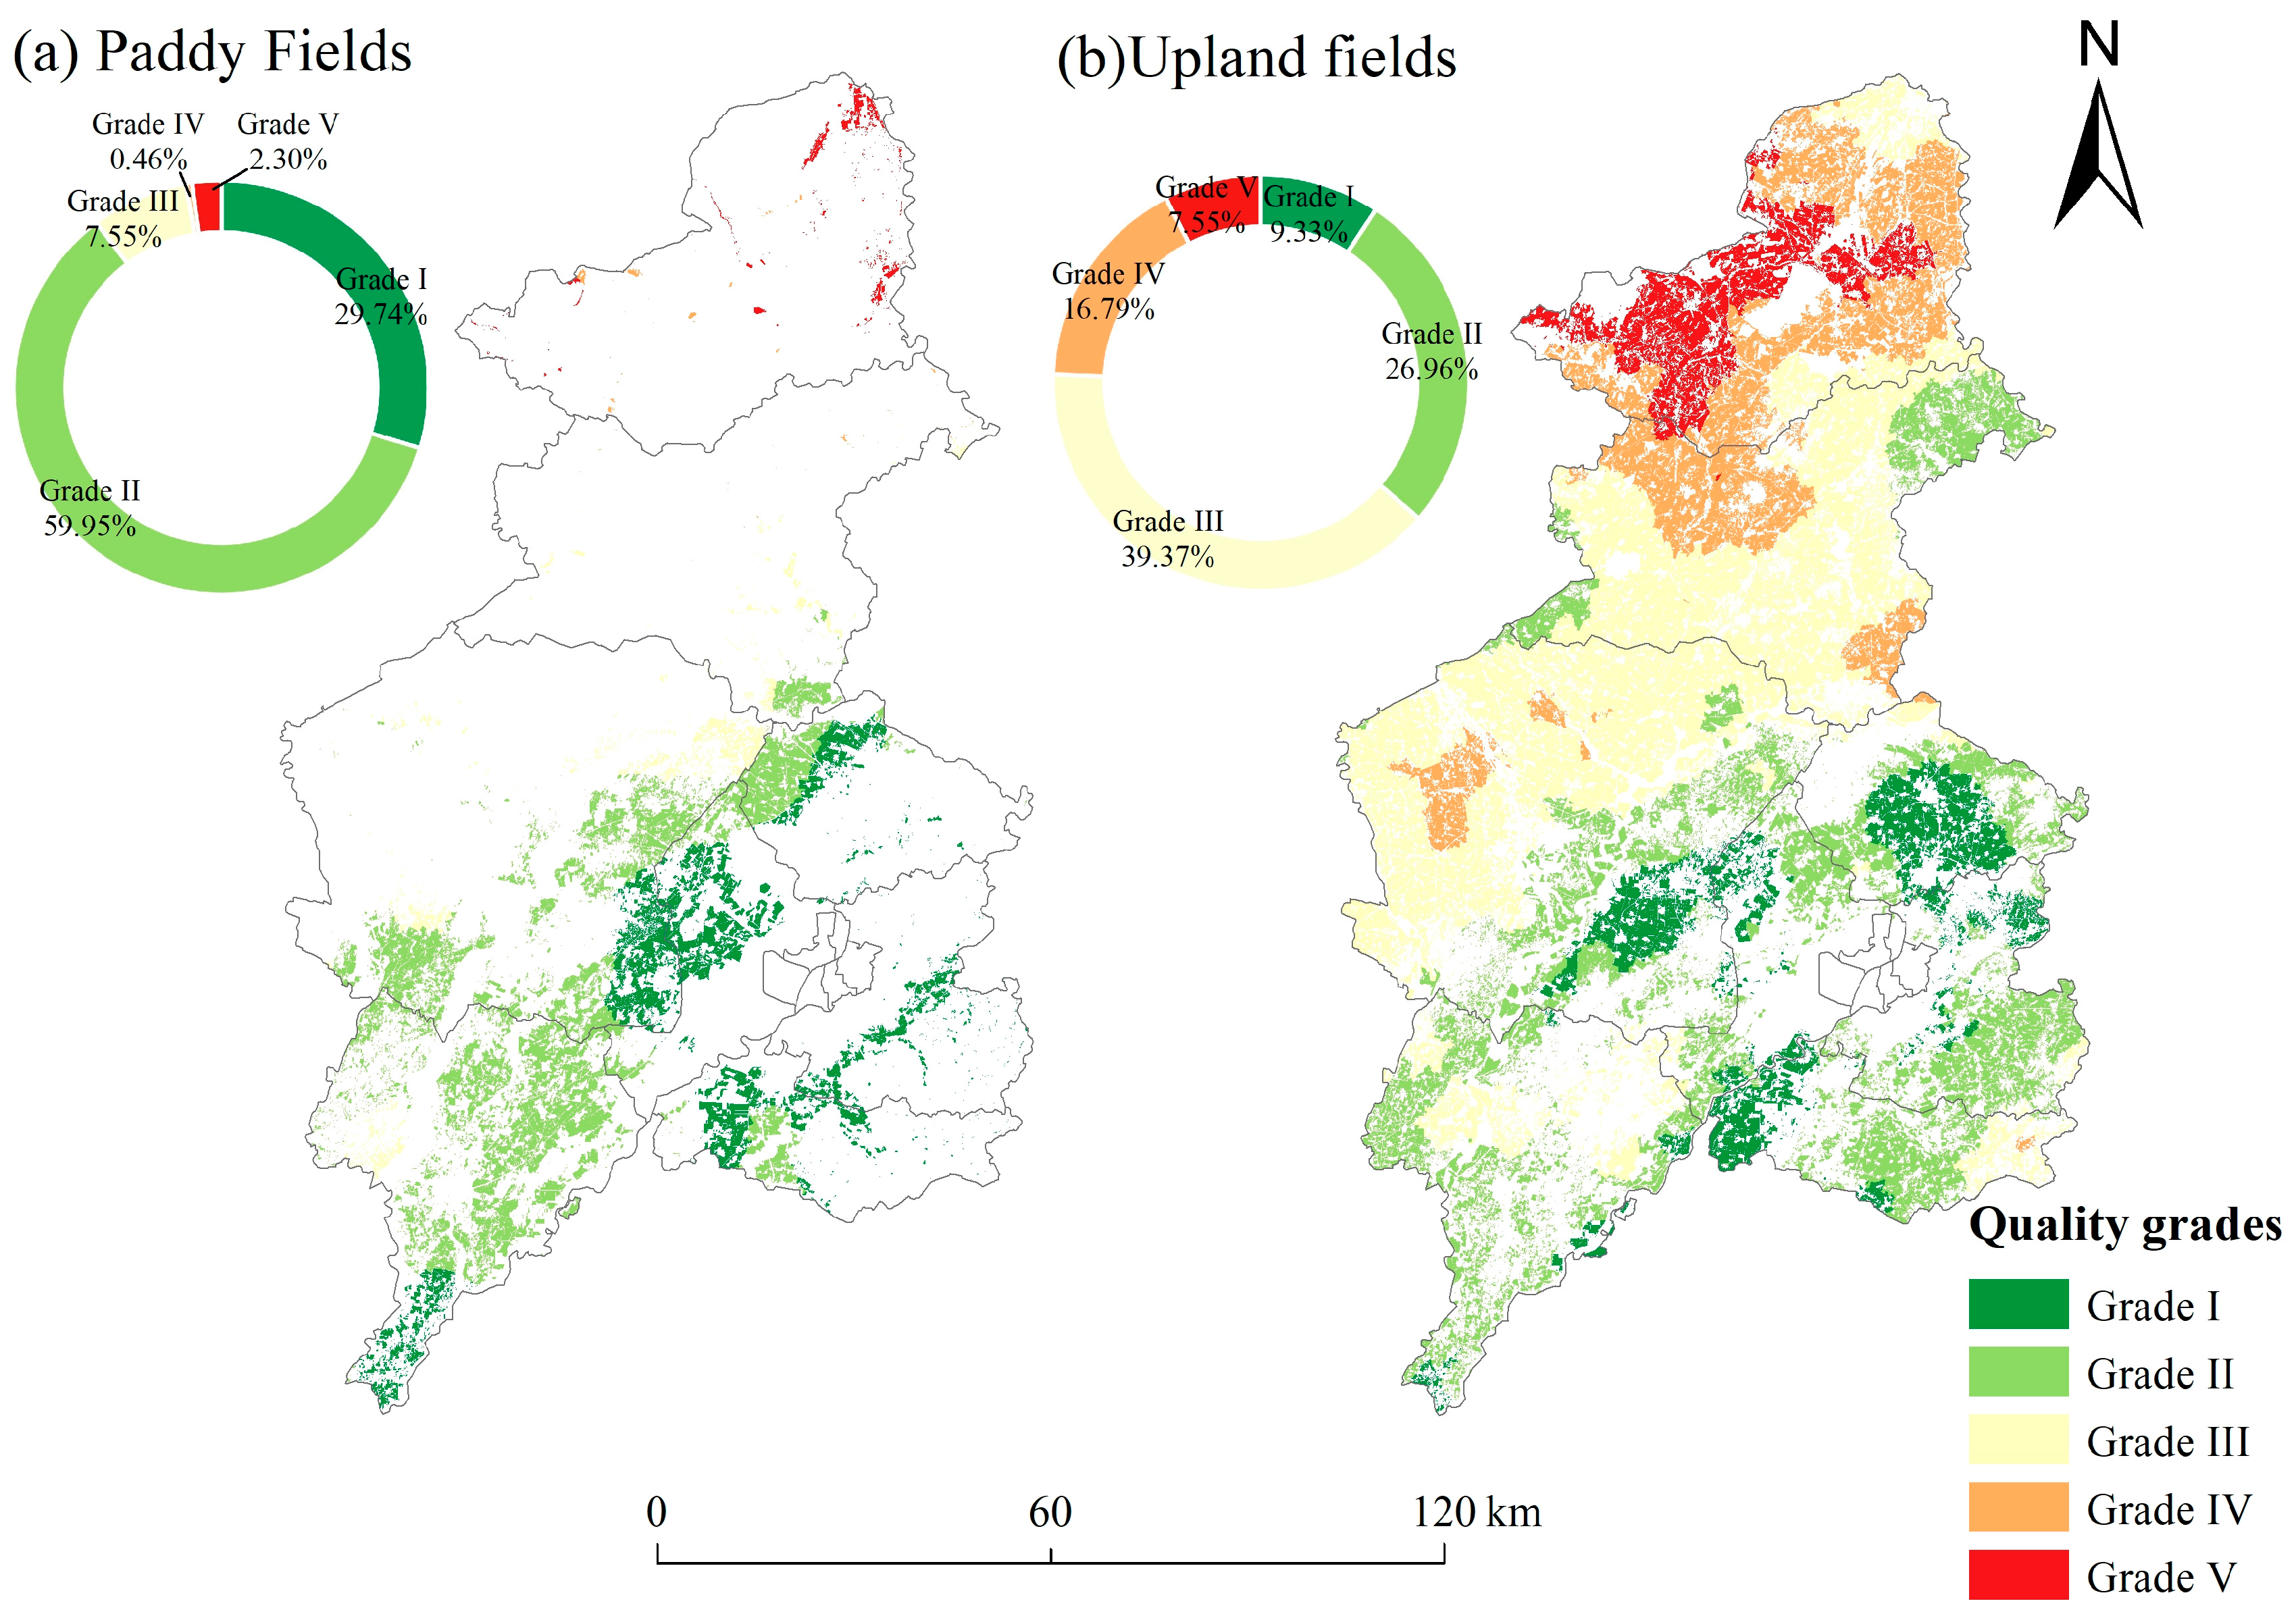
3.3.2. Spatial Distribution Characteristics of Cultivated Land Quality

The variogram models and their fitted parameters indicated that the exponential model provided the best fit for both paddy and upland fields. For paddy fields, the model yielded an R2 of 0.55, nugget value of 0.00453, sill value of 0.01136, and a nugget-to-sill ratio of 0.60. For upland fields, the exponential model showed a superior fit with an R2 of 0.98, nugget value of 0.00346, sill value of 0.01274, and a nugget-to-sill ratio of 0.73. As both nugget-to-sill ratios fall between 0.25 and 0.75, the CQI in both systems exhibit moderate spatial heterogeneity [33].
The interpolation results demonstrated high prediction accuracy. The mean prediction errors were 0.0008 for paddy fields and 0.0006 for uplands. The root mean square errors were 0.0808 and 0.0690, and the mean standardized errors were 0.0038 and 0.0109, respectively, all values close to zero, indicating reliable model performance.
The spatial distribution of paddy field quality levels in Shenyang is shown in Figure 5a. Grades I and II are dominant, primarily located in the southern part of the region. Grade I land accounts for 29.74% and is mainly distributed in suburban areas and the southern part of Liaozhong District, where favorable soil conditions support high-quality rice production. Grade II land makes up 59.95%, widely distributed in Liaozhong District, Xinmin City, and the western part of Shenbei New District, benefiting from advantageous hydrothermal conditions. Grade III land accounts for 7.55%, scattered across Faku County, Xinmin City, and Liaozhong District, with moderate soil conditions dominated by light loam and sandy loam. Grades IV and V, which represent 0.46% and 2.30%, respectively, are mainly found in Kangping County, where soils are relatively infertile, pH levels are high, and hydrothermal conditions are poor.
Upland land quality levels exhibit greater variability (Figure 5b), generally showing a south-high to north-low spatial gradient. Grade I land accounts for 9.33%, mainly located in Shenbei New District, Sujiatun District, and Xinmin City, where both soil quality and land management practices are favorable. Grade II land covers 26.97%, mostly surrounding Grade I areas and characterized by medium loam textures. Grade III land accounts for 39.37%, widely distributed across the city with predominant medium and sandy loam textures. Grade IV land comprises 16.79%, mainly in northern Kangping and Faku Counties, with sporadic patches in western Xinmin and eastern Sujiatun. These areas often experience soil acidity or alkalinity issues. Grade V land makes up 7.55%, mainly located in the western part of Kangping County, where soils are relatively poor in fertility.

3.3.3. Rationality Validation of the MDS

To evaluate the applicability of the MDS, cultivated land quality indices for paddy fields (CQIP-MDS) and upland fields (CQIU-MDS) were calculated using the MDS, and then compared with the corresponding indices derived from the TDS (CQIP-TDS and CQIU-TDS). As shown in Figure 6, the MDS- and TDS-based indices demonstrated strong linear correlations. The coefficient of determination (R2) was 0.79 for paddy fields and 0.71 for upland fields. The Nash efficiency coefficients (Ef) were 0.97 and 0.82, respectively, and the relative error coefficients (ER) were 0.11 and 0.02.
These results indicate that although the MDS contains fewer indicators, it yields cultivated land quality indices closely aligned with those of the full dataset, with minimal relative deviation. Therefore, the MDS can be reliably used as a substitute for the TDS in evaluating cultivated land quality in the study area.

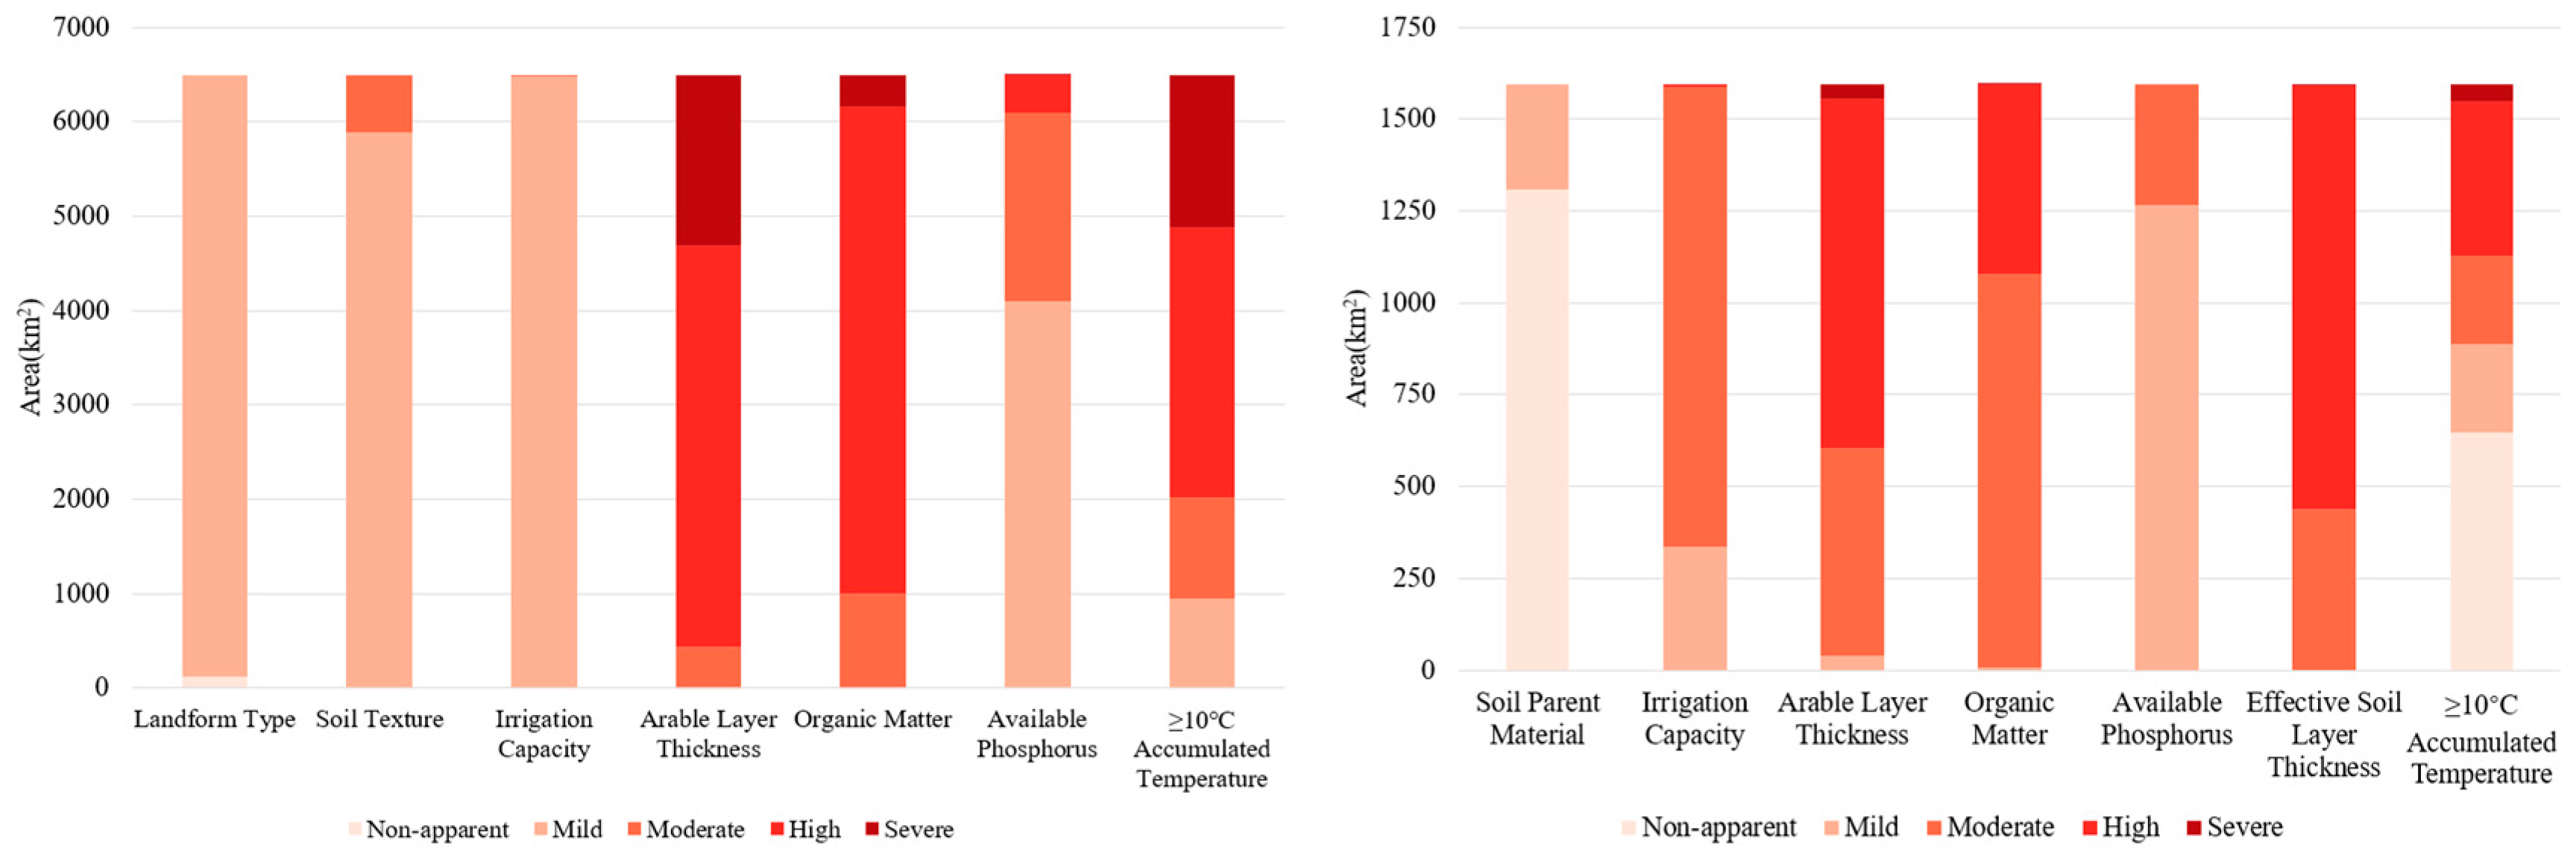
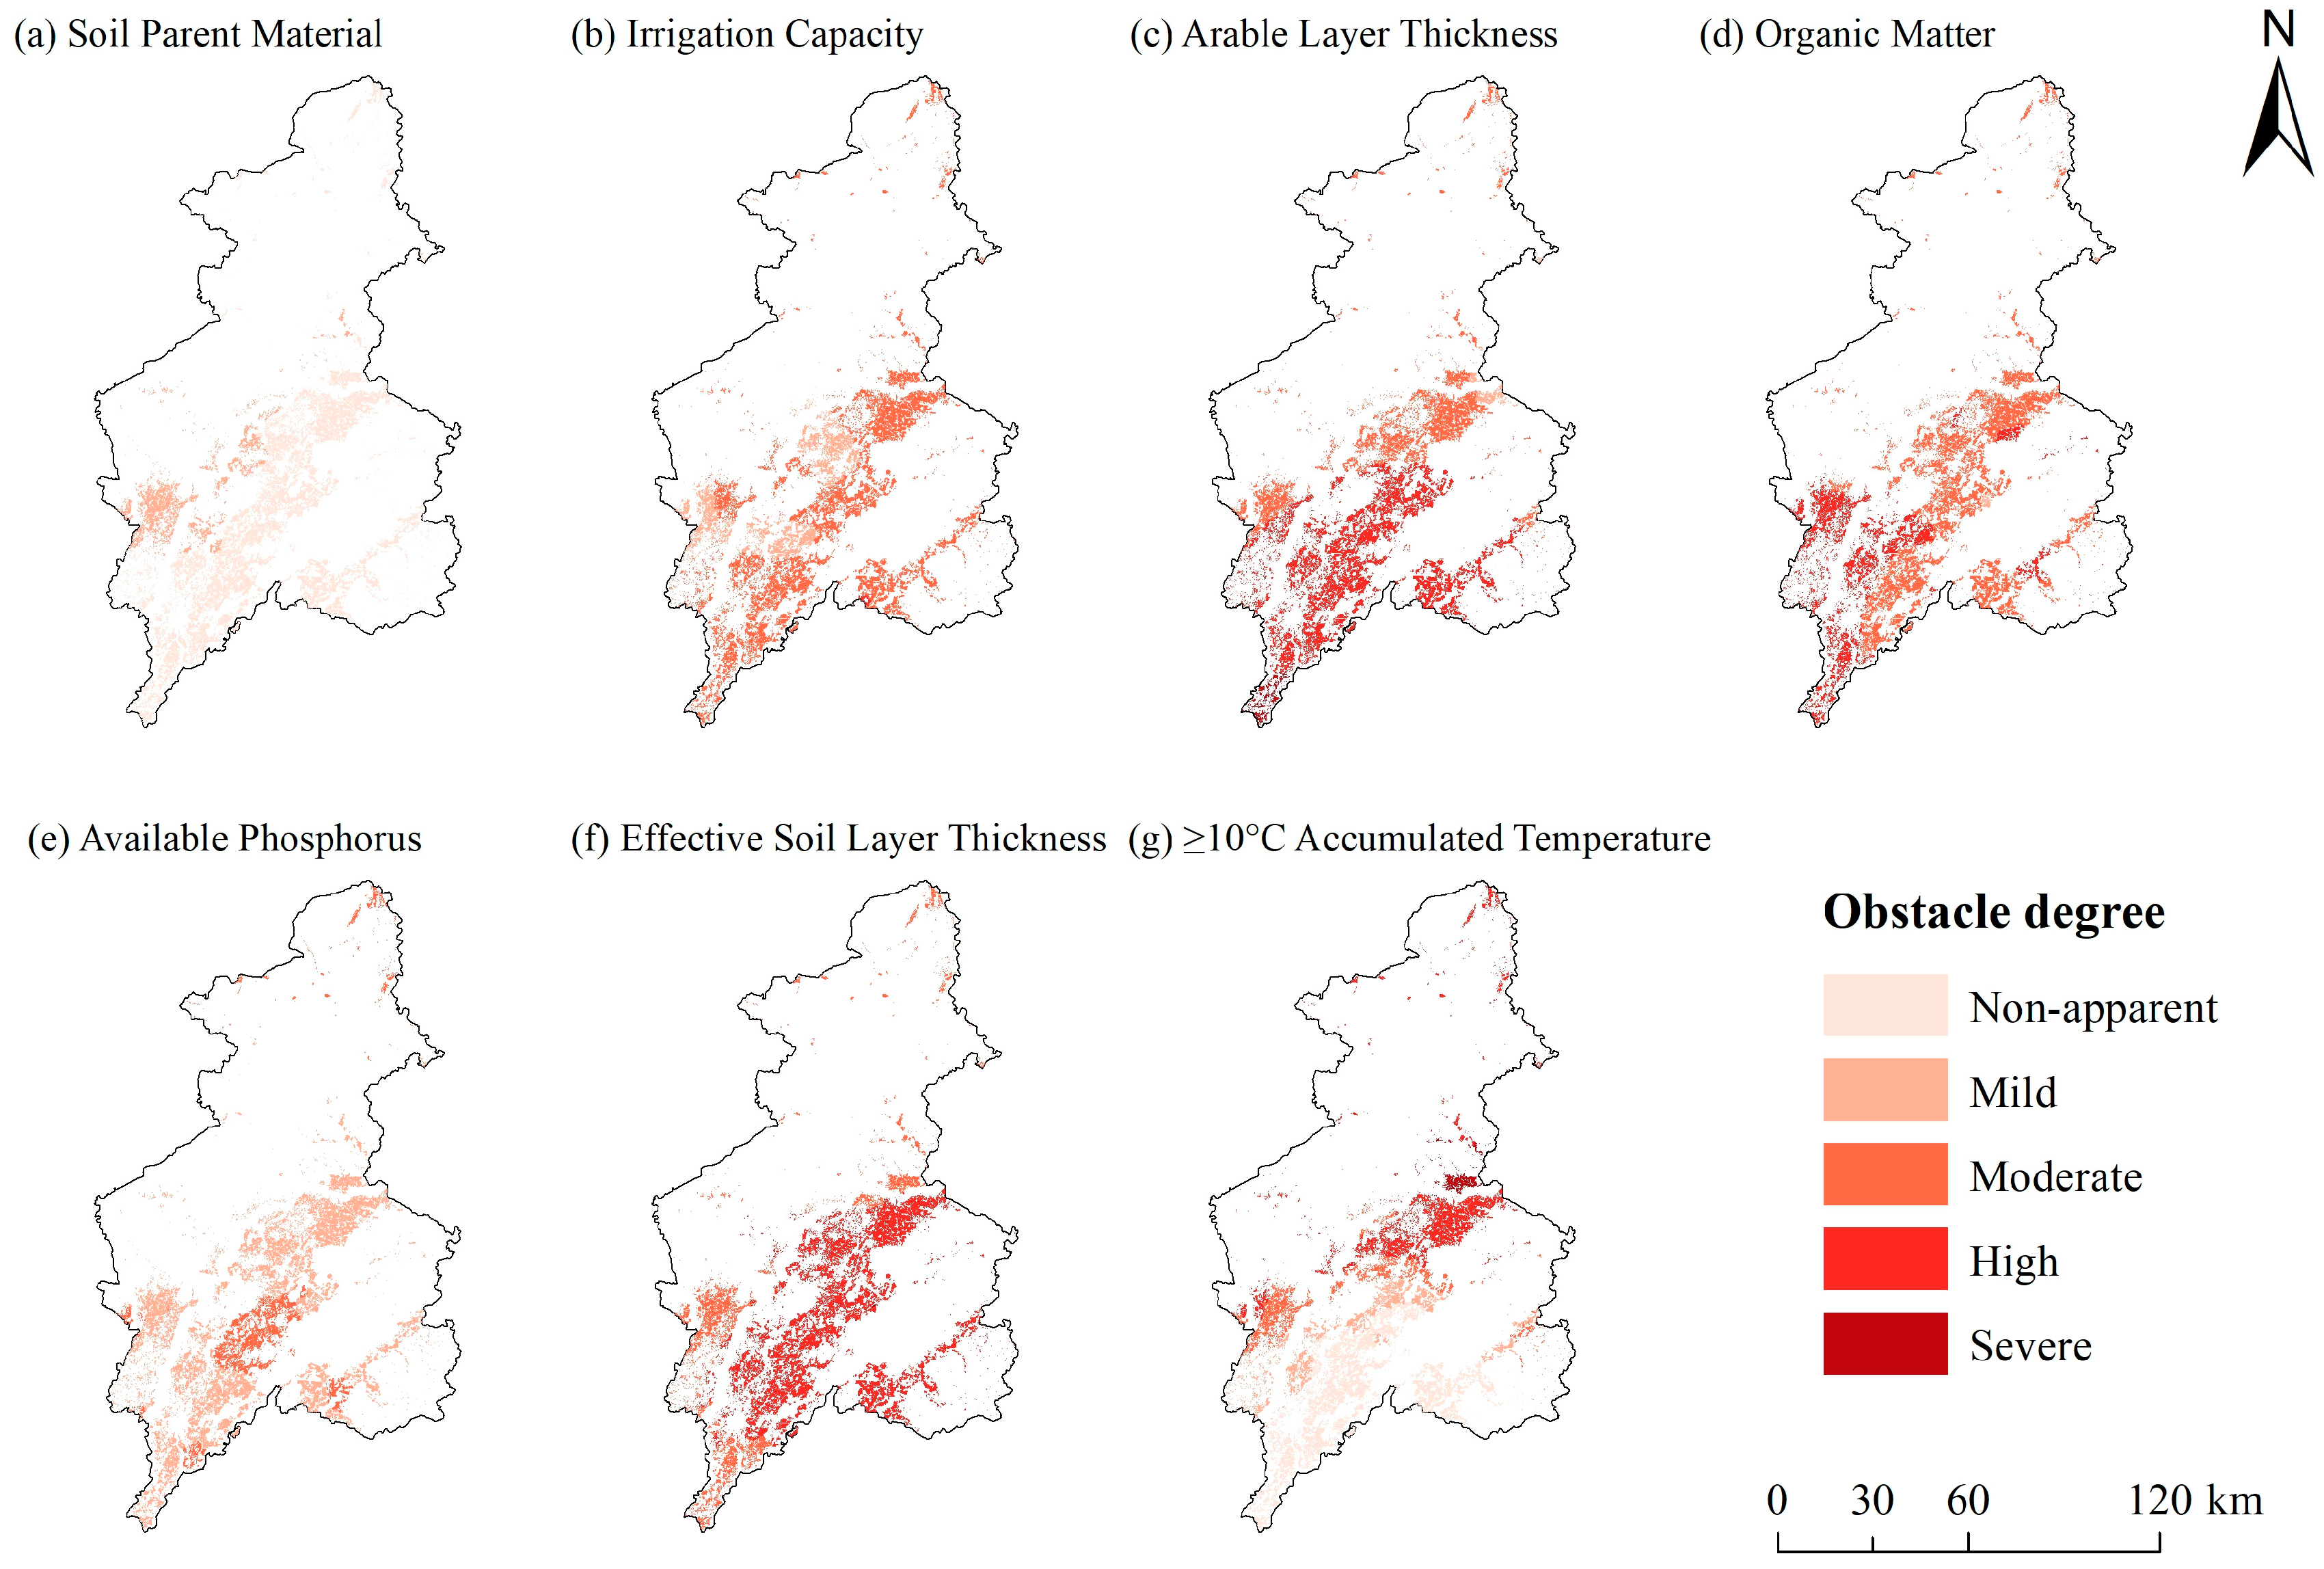
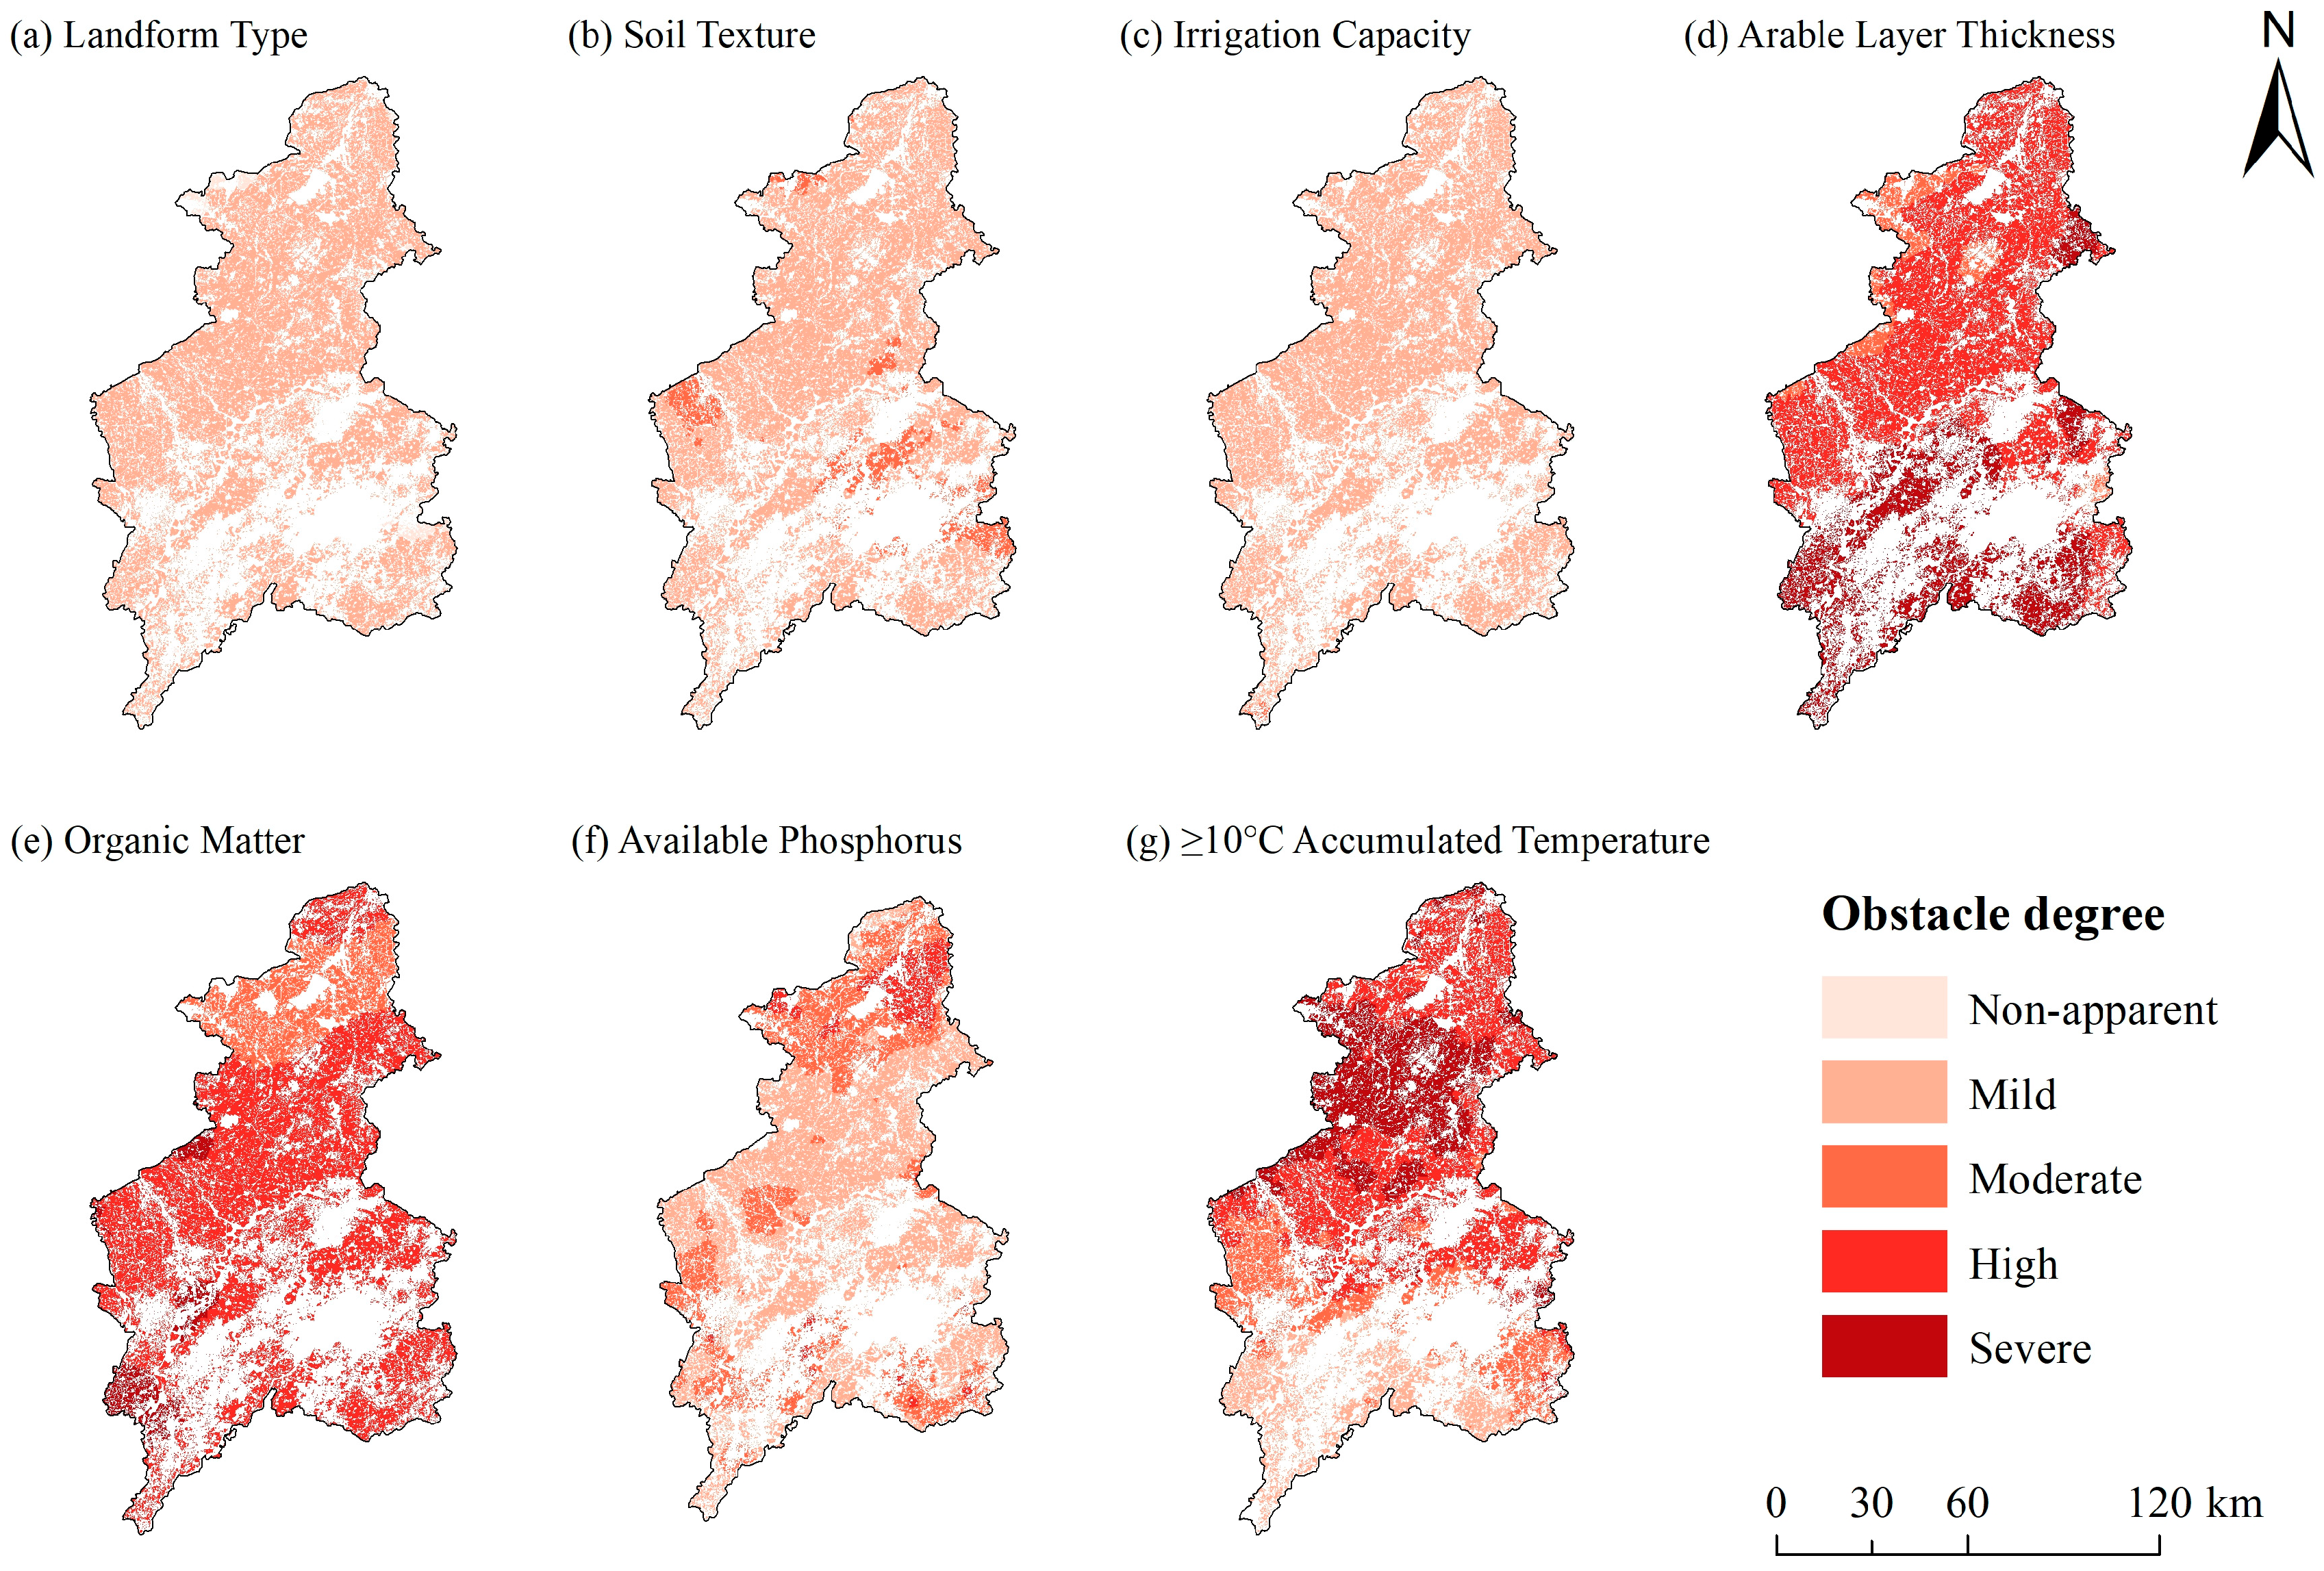
3.4. Obstacle Factors

3.4.1. Distribution Characteristics of Obstacle Factors

Figure 7, Figure 8 and Figure 9 illustrate the quantitative and spatial distribution of obstacle factors. In paddy fields, arable layer thickness and effective soil layer thickness exhibited the highest obstacle degrees, at 21.07% and 22.29%, respectively, both predominantly at the high level. The area with a high or severe obstacle level for arable layer thickness was 987.15 km2, mainly concentrated in the southern part of the study area (Figure 8c). For effective soil layer thickness, the high level and above constrained area reached 1154.89 km2 and had a broader distribution, covering both southern and central regions (Figure 8f). The obstacle degree of organic matter was 19.35%, with moderate and high obstacle levels covering 1070.47 km2 and 514.19 km2, respectively, while other severity levels occupied relatively smaller areas. The obstacle degree of ≥10 °C accumulated temperature was 10.16%, with evident grading differences; the high and severe levels covered 464.21 km2, mainly in southern Faku County and western Shenbei New District (Figure 8g). Irrigation capacity had an obstacle degree of 12.81%, mainly at the moderate level, covering 1252.61 km2 and showing widespread distribution (Figure 8b). The obstacle degrees of available phosphorus and parent material were 7.29% and 0.28%, respectively, primarily at the mild or non-apparent level.
In upland fields, arable layer thickness, organic matter, and ≥10 °C accumulated temperature were the most serious constraint factors, with obstacle degrees of 27.57%, 25.40%, and 23.28%, respectively. The area with a high or severe obstacle for arable layer thickness reached 6062.14 km2, mainly distributed in the southern part of the city and eastern Faku County (Figure 9d). For organic matter, the high level and above constrained area reached 5495.04 km2, widely distributed, with moderate constraints dominating in Kangping County (Figure 9e). The obstacle degree for ≥10 °C accumulated temperature showed strong grading differentiation, with high or severe covering 4475.84 km2, mainly in southern Kangping and northern Faku counties (Figure 9g). Available phosphorus had an obstacle degree of 8.59%, mainly at the mild level, while moderate and high levels accounted for 2397.07 km2, predominantly in the northern region (Figure 9f). Landform type, soil texture, and irrigation capacity were generally at the mild level, with obstacle degrees of 1.73%, 6.78%, and 6.65%, respectively.

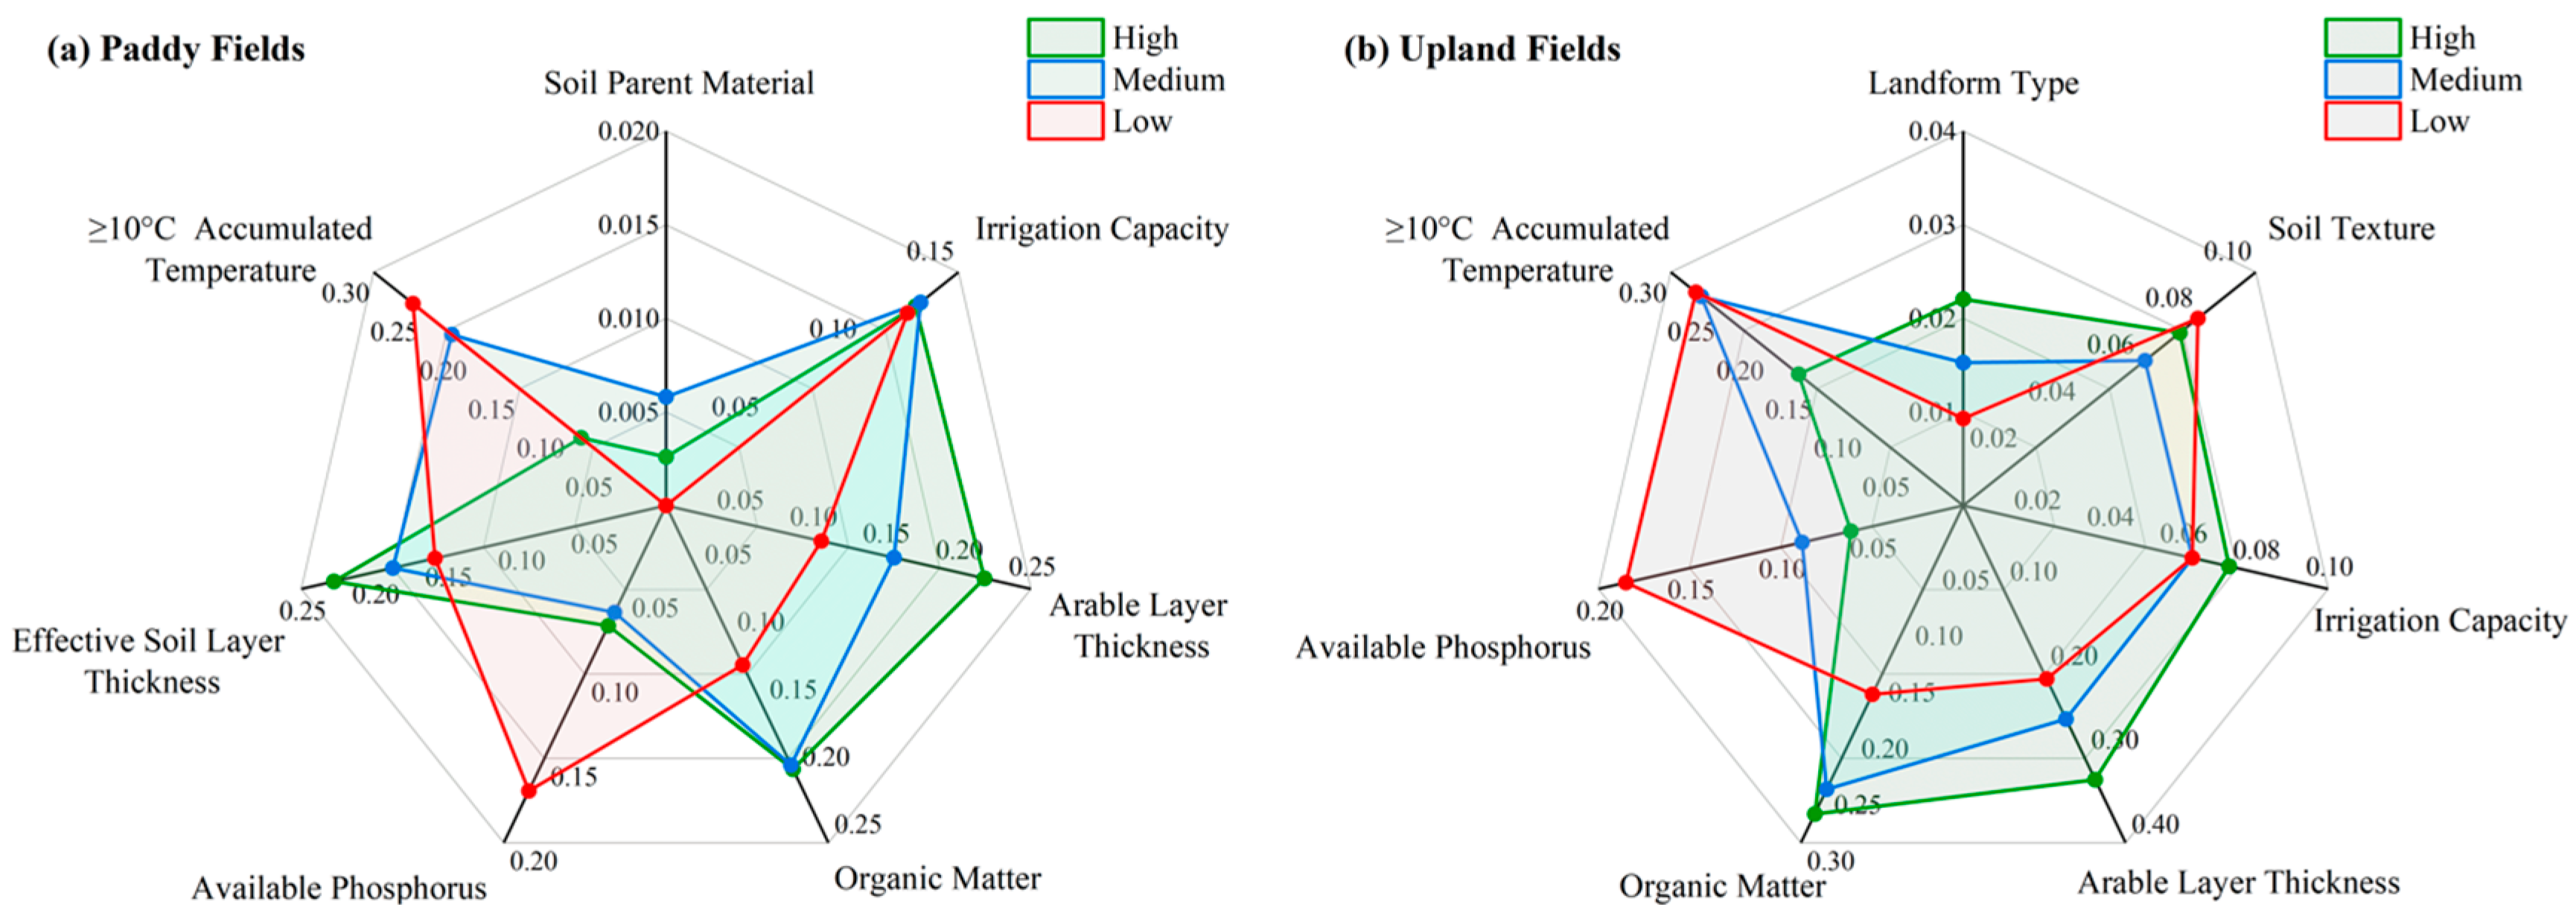
3.4.2. Identification of Major Obstacle Factors

Radar plots were generated to visualize the obstacle factor profiles across different land quality levels (Figure 10). In paddy fields, the obstacle degrees of effective soil layer thickness and arable layer thickness decreased as cultivated land quality level declined, indicating that these two indicators are the main limiting factors for high-quality cultivated land. The obstacle degree of organic matter was significantly higher in high- and medium-quality cultivated land compared to low-quality cultivated land, suggesting it is also a critical factor restricting top-grade cultivated land quality. The obstacle degree of ≥10 °C accumulated temperature decreased with increasing cultivated land quality level, while that of available phosphorus was notably higher in low-quality cultivated land, demonstrating their important roles in cultivated land quality classification. Obstacle degrees for parent material and irrigation capacity were consistently low across different cultivated quality levels, showing no significant differences.
In upland fields, arable layer thickness and organic matter were identified as the primary limiting factors for high-quality cultivated land, as their obstacle degrees decreased with declining cultivated land quality. The obstacle degree of available phosphorus also decreased with higher cultivated land quality levels. Notably, ≥10 °C accumulated temperature showed significantly lower obstacle levels in high-quality cultivated land compared to medium- and low-quality cultivated land, highlighting its importance in determining land quality classes. Obstacle degrees for landform type, soil texture, and irrigation capacity remained at low levels across all cultivated land quality categories, with no apparent variation.

4. Discussion

4.1. Effects of Cropping Systems on Cultivated Land Quality Indicators

Significant differences were observed in several soil attributes between paddy and upland fields (Figure 2). The organic matter content in paddy fields was significantly higher than that in uplands, consistent with the findings of Chen et al. [34], and primarily attributed to differences in carbon sequestration pathways and efficiencies. Biomass input from aboveground vegetation in paddy fields is typically 1.6 to 2 times higher than that of wheat or maize in upland fields [35,36]. During the growing season, paddy soils are regularly flooded and irrigated intermittently. Flooding reduces oxygen availability in the soil, thereby inhibiting microbial activity and the secretion of oxidative enzymes necessary for plant residue decomposition [37], which results in slower SOM degradation [38,39]. Under anaerobic conditions, rice roots enhance oxygen diffusion to the root tips, promoting the formation of iron oxides/hydroxides, which bind with SOM to form more stable mineral-associated organic matter (MAOM) [40,41]. The effective soil layer thickness in upland fields was significantly greater than that in paddy fields, primarily due to differences in tillage practices. Long-term flooding in paddy fields leads to particle dispersion and the formation of a compact plow pan, increasing bulk density, reducing vertical infiltration, and limiting both water percolation and root penetration. In contrast, upland fields often adopt conservation tillage methods such as no-tillage and deep loosening, which help maintain or restore soil structure, promote aggregate formation, improve aeration and infiltration, and increase the depth of the active root zone [42]. Shinoto et al. found that in former paddy fields converted to upland use, hardpan layers restricted maize root penetration, forcing horizontal root expansion within the loosened surface layers [43]. Additionally, paddy fields exhibited significantly more favorable hydrothermal conditions compared to uplands. This is largely due to their advantageous geographic location; paddy fields are primarily distributed in the lower-latitude southern regions of Shenyang, where summer monsoon circulation from the Pacific brings abundant precipitation. Furthermore, the urban core of Shenyang—located in the central–southern part of the region—has a high degree of urbanization, and the heat released by buildings and industrial activity raises annual average temperatures by 1–2 °C compared to surrounding rural areas [44].
The selected MDSs for paddy and upland fields each contained seven indicators. Five were shared between both systems: ≥10 °C accumulated temperature, arable layer thickness, organic matter, available phosphorus, and irrigation capacity. The two paddy-specific indicators were parent material and effective soil layer thickness, while the upland-specific indicators were landform type and soil texture. Parent material plays a particularly critical role in rice soils, influencing not only clay content but also the presence and reactivity of iron oxides [19]. Research has shown that alternating redox conditions under long-term flooding in paddy fields facilitate iron mobility and redistribution, creating distinct profile stratification patterns, which are strongly affected by the type and abundance of iron minerals in the parent material [45]. Rice cultivation requires stable water conditions and benefits from deeper, well-structured effective soil layers that facilitate root growth and enhance drought resistance and yield stability [46]. In contrast, upland cultivation relies on natural rainfall, requiring soils with strong water retention, aeration, and nutrient-holding capacities. Different landforms, through elevation and slope, shape the spatial distribution of hydrothermal regimes and erosion processes in uplands, ultimately influencing the spatial variability of soil organic carbon, nitrogen, and other nutrients [47,48]. Soil texture directly determines water retention and aeration capacity and significantly regulates the soil’s response to moisture stress. Extremely coarse or fine textures may limit root development and nutrient uptake in dryland systems [49,50].
In summary, the differences in MDS indicators between paddy and upland fields reflect divergent constraints arising from cropping systems, water management, and soil formation processes. Paddy fields rely more heavily on artificial water regulation and require soil profile stability and favorable formation conditions, while uplands depend on inherent landform features and the soil’s natural buffering capacity. These differences highlight the importance of constructing cropping-system-specific MDSs to enhance the precision and effectiveness of cultivated land quality evaluations.

4.2. Impacts of Cropping Systems on Cultivated Land Quality and Obstacle Factors

Previous studies have shown that Ordinary Kriging is an effective method for predicting values of spatially continuous variables based on a limited number of sampling points [51]. In this study, the Ordinary Kriging method was employed with an optimized exponential variogram model to predict the spatial distribution of cultivated land quality in paddy and upland fields across Shenyang. The results indicated that although the CQI for paddy and upland fields were similar at the sampling-point level, they exhibited distinct differences at the spatial level. As shown in Figure 4, the CQI values of both systems displayed comparable distribution patterns and average values, suggesting that constructing separate MDSs for different cropping systems enables a unified measurement framework for land quality evaluation.
However, spatial distribution maps based on kriging interpolation (Figure 5) revealed significant geographic differences between the two systems. Paddy fields showed generally higher land quality, with Grades I and II accounting for over 85% of the area, primarily located in the flat, well-irrigated, and deep-soil southern and southeastern regions, reflecting strong spatial aggregation. In contrast, upland fields exhibited greater spatial heterogeneity, with Grades II, III, and IV widely distributed. In northern and northeastern regions with rugged terrain and harsher natural conditions, land quality was notably lower. This pattern is closely linked to the spatial clustering of high-quality sampling points in paddy areas. Scudiero et al. noted that kriging interpolation may underestimate or overestimate soil properties in regions with spatial trends and heterogeneity, especially when sample density is low or unevenly distributed [52]. Performing separate interpolations for different cropping systems can help eliminate intra-regional land use effects on soil attribute values but places higher demands on sampling density in spatially fragmented zones [53].
Obstacle factor analysis further revealed that arable layer thickness is a common limiting factor for both paddy and upland fields. Effective soil layer thickness was identified as a paddy-specific obstacle, while organic matter and ≥10 °C accumulated temperature were more significant in limiting upland land quality. In addition, both available phosphorus and accumulated temperature exerted notable influence on the classification of land quality across both systems. For paddy fields, long-term flooding necessitates adequate soil aeration, water retention, and subsoil impermeability to support rice root development and nutrient supply [19]. Shallow plow layers or compacted plow pans can restrict root penetration and nutrient uptake, thereby reducing overall soil quality. In upland fields, which rely mainly on natural precipitation, productivity is more directly constrained by the soil’s water retention and nutrient-supplying capacity—functions closely regulated by organic matter. Low organic matter content weakens aggregate stability and moisture retention, while also reducing nutrient availability in the rhizosphere [54].
Moreover, ≥10 °C accumulated temperature reflects regional heat availability and is a critical determinant of crop growth duration, grain filling period, and maturity. In high-latitude or high-altitude areas of central and northern Liaoning, heat deficiency is a primary bottleneck limiting upland productivity and cultivated land quality. Notably, available phosphorus and accumulated temperature were found to significantly influence land quality classifications in both paddy and upland fields, indicating their cross-system importance. Phosphorus is an essential macronutrient for plant growth, and phosphorus deficiency severely limits photosynthetic efficiency and root development. In northern China, phosphorus availability in soils is generally low, and its agronomic responsiveness to fertilization is high [55]. Meanwhile, accumulated temperature remains a fundamental climatic constraint for crop development and yield potential in the temperate agricultural zones of Northeast China.

4.3. Recommendations for Improving Cultivated Land Quality Under Different Cropping Systems

Based on the identified obstacle factors under different cropping systems, targeted improvement strategies should be formulated for paddy and upland fields, respectively. In paddy fields, the primary limitations are arable layer thickness and effective soil layer thickness, reflecting a strong dependence on profile continuity and water-holding capacity. It is recommended to improve profile structure by subsoiling and breaking up plow pans, while adopting straw return and intermittent irrigation practices to increase organic matter content and enhance soil aeration. These measures collectively promote deeper root growth and more efficient nutrient uptake [56].
In contrast, upland field quality is mainly constrained by low organic matter content, insufficient arable layer thickness, and inadequate ≥10 °C accumulated temperature, indicating high sensitivity to the soil’s water and nutrient retention functions as well as regional thermal resources. Improvement strategies should focus on organic matter enrichment and conservation tillage practices, such as straw mulching, green manure rotation, and deep tillage, to improve soil structure, stabilize aggregates, and enhance moisture retention [54,57]. In areas with limited thermal resources, optimizing crop varieties and adjusting cropping systems to align with local temperature conditions is essential.
Furthermore, available phosphorus and ≥10 °C accumulated temperature were identified as key limiting factors across both cropping systems. This suggests the need for regional-scale strategies that enhance phosphorus management and optimize heat resource allocation. Technologies such as remote sensing and geographic information systems (GIS) can be employed to monitor thermal accumulation dynamics and improve crop layout planning, thereby increasing overall resource use efficiency [55,58].
In summary, the distinct structures and mechanisms of obstacle factors in paddy and upland fields underscore the need for differentiated and precise improvement strategies. Future efforts should consider soil type, climatic background, and land management practices to develop context-specific land amelioration plans, thus promoting the sustainable utilization and high-quality development of cultivated land resources.

4.4. Implications and Limitations

This study provides both methodological and practical implications for cultivated land quality assessment in regions characterized by the coexistence of paddy and upland cropping systems. By constructing a differentiated evaluation framework based on MDS and identifying system-specific constraint factors, this approach improves the relevance and efficiency of land quality diagnosis under diversified land use conditions. Such a framework is particularly relevant in Southeast Asian countries such as India, as well as in other regions with black soil distribution worldwide, where both paddy and upland cultivation systems coexist and require tailored land quality assessment approaches [59]. Similar strategies have been demonstrated to be effective in other black soil regions. For example, Sulaeman et al. used soil survey data across Indonesia to show that home gardens and paddy fields exert less pressure on tropical black soil properties than monocropping or dryland cultivation, supporting better conservation outcomes [60]. Moreover, Uthappa et al. emphasized the importance of context-specific indicator selection in MDS frameworks, which can increase diagnostic sensitivity in regions with diverse cropping systems [61]. These insights suggest that the evaluation model proposed in this study is adaptable and transferable to other regions facing similar challenges in balancing paddy and upland cultivation.
Nevertheless, certain limitations should be acknowledged. First, the analysis is based on a single-year, cross-sectional dataset, which limits the ability to capture interannual variability or long-term trends in soil properties. Second, although the method is transferable, the specific indicators and weights used are regionally calibrated and may require contextual adjustment when applied elsewhere. Future research should incorporate multi-year datasets and test the framework across diverse agroecological zones to enhance its generalizability and robustness.

5. Conclusions

This study constructed a comprehensive cultivated land quality evaluation system comprising 13 indicators for Shenyang, a representative area in Northeast China. PCA was used to develop MDS separately for paddy and upland fields, and an obstacle degree model was introduced to identify major constraint factors affecting land quality. The results yielded the following key conclusions. Significant differences were observed between paddy and upland fields in terms of organic matter, ≥10 °C accumulated temperature, annual precipitation, and effective soil layer thickness, highlighting the influence of cropping systems on cultivated land quality attributes. Seven core indicators were selected for each cropping system to construct their respective MDS. Five indicators—≥10 °C accumulated temperature, available phosphorus, arable layer thickness, irrigation capacity, and organic matter—were common to both systems. Paddy-specific indicators included parent material and effective soil layer thickness, while landform type and soil texture were unique to upland fields. Although the average CQI values of paddy and upland fields were similar at the sampling point level, their spatial distributions differed considerably. Paddy fields exhibited higher cultivated land quality and stronger spatial clustering, whereas upland fields showed greater spatial heterogeneity. Obstacle factor diagnosis revealed that arable layer thickness was a common limiting factor for both systems. In paddy fields, effective soil layer thickness was a specific constraint, while in upland fields, organic matter and ≥10 °C accumulated temperature were the primary limitations. Moreover, available phosphorus and accumulated temperature significantly influenced land quality classification in both systems. In conclusion, this study established a differentiated evaluation framework and obstacle factor diagnosis method tailored to distinct cropping systems, offering a scientific foundation and technical support for improving cultivated land quality at the regional scale.

Supplementary Materials

The following supporting information can be downloaded at: https://www.mdpi.com/article/10.3390/agronomy15081838/s1, Table S1. PCA Results and Weight Allocation for Paddy Fields. Table S2. PCA Results and Weight Allocation for Upland Fields.

Author Contributions

Conceptualization, Y.H. and F.Q.; methodology, C.L. and Y.S.; software, C.L.; validation, S.X., W.Z., Y.S. and X.L.; formal analysis, C.L. and Y.S.; resources, S.X., W.Z., and Y.H.; investigation C.L., and F.Q.; data curation, C.L. and Y.S.; writing—original draft preparation, C.L.; writing—review and editing, Y.L., H.T. and Y.H.; visualization, C.L. and X.L.; supervision, Y.H.; project administration, Y.H.; funding acquisition, Y.H. All authors have read and agreed to the published version of the manuscript.

Funding

This research was funded by the National Key Research and Development Program of China (Grant No. 2021YFD1500201).

Data Availability Statement

The data in this study are available from the corresponding authors upon request. Due to the sensitivity of the study area, some data cannot be made public.

Conflicts of Interest

The authors declare that they have no known competing financial interests or personal relationships that could have appeared to influence the work reported in this paper.

References

  1. Bindraban, P.S.; Stoorvogel, J.J.; Jansen, D.M.; Vlaming, J.; Groot, J.J.R. Land Quality Indicators for Sustainable Land Management: Proposed Method for Yield Gap and Soil Nutrient Balance. Agric. Ecosyst. Environ. 2000, 81, 103–112. [Google Scholar] [CrossRef]
  2. Xue, P.; Shen, C.; Tang, H.; Liu, Y.; Huang, Y. Knowledge Atlas of Cultivated Land Quality Evaluation Based on Web of Science Since the 21st Century (2000–2023). Land 2024, 13, 1697. [Google Scholar] [CrossRef]
  3. Song, W.; Zhang, H.; Zhao, R.; Wu, K.; Li, X.; Niu, B.; Li, J. Study on Cultivated Land Quality Evaluation from the Perspective of Farmland Ecosystems. Ecol. Indic. 2022, 139, 108959. [Google Scholar] [CrossRef]
  4. Karlen, D.L.; Mausbach, M.J.; Doran, J.W.; Cline, R.G.; Harris, R.F.; Schuman, G.E. Soil Quality: A Concept, Definition, and Framework for Evaluation (A Guest Editorial). Soil Sci. Soc. Am. J. 1997, 61, 4–10. [Google Scholar] [CrossRef]
  5. Abuzaid, A.S.; Mazrou, Y.S.A.; El Baroudy, A.A.; Ding, Z.; Shokr, M.S. Multi-Indicator and Geospatial Based Approaches for Assessing Variation of Land Quality in Arid Agroecosystems. Sustainability 2022, 14, 5840. [Google Scholar] [CrossRef]
  6. Chase, J.M.; Blowes, S.A.; Knight, T.M.; Gerstner, K.; May, F. Ecosystem Decay Exacerbates Biodiversity Loss with Habitat Loss. Nature 2020, 584, 238–243. [Google Scholar] [CrossRef]
  7. Qian, F.; Jiao, S.; Yu, Y.; Wang, X.; Shao, T. Cultivated Land Quality Assessment and Obstacle Factors Diagnosis in Changtu County, Northeast China. Land Degrad. Dev. 2024, 35, 5065–5077. [Google Scholar] [CrossRef]
  8. Vasu, D.; Tiwary, P.; Chandran, P. A Novel and Comprehensive Soil Quality Index Integrating Soil Morphological, Physical, Chemical, and Biological Properties. Soil Tillage Res. 2024, 244, 106246. [Google Scholar] [CrossRef]
  9. Liu, J.; Wu, L.; Chen, D.; Li, M.; Wei, C. Soil Quality Assessment of Different Camellia Oleifera Stands in Mid-Subtropical China. Appl. Soil Ecol. 2017, 113, 29–35. [Google Scholar] [CrossRef]
  10. Chen, Y.-D.; Wang, H.-Y.; Zhou, J.-M.; Xing, L.; Zhu, B.-S.; Zhao, Y.-C.; Chen, X.-Q. Minimum Data Set for Assessing Soil Quality in Farmland of Northeast China. Pedosphere 2013, 23, 564–576. [Google Scholar] [CrossRef]
  11. Gao, M.; Hu, W.; Li, M.; Wang, S.; Chu, L. Network Analysis Was Effective in Establishing the Soil Quality Index and Differentiated among Changes in Land-Use Type. Soil Tillage Res. 2025, 246, 106352. [Google Scholar] [CrossRef]
  12. Guo, L.; Sun, Z.; Ouyang, Z.; Han, D.; Li, F. A Comparison of Soil Quality Evaluation Methods for Fluvisol along the Lower Yellow River. CATENA 2017, 152, 135–143. [Google Scholar] [CrossRef]
  13. Zhu, Z.; Chen, J.; Hu, H.; Zhou, M.; Zhu, Y.; Wu, C.; Zhu, L.; Jiang, X.; Wang, J. Soil Quality Evaluation of Different Land Use Modes in Small Watersheds in the Hilly Region of Southern Jiangsu. Ecol. Indic. 2024, 160, 111895. [Google Scholar] [CrossRef]
  14. Cui, Q.; Li, Z.; Feng, Q.; Zhang, B.; Gui, J. A Comprehensive Evaluation of Soil Quality in the Three River Headwaters Region, China. Glob. Ecol. Conserv. 2024, 54, e03155. [Google Scholar] [CrossRef]
  15. Yu, P.; Liu, S.; Zhang, L.; Li, Q.; Zhou, D. Selecting the Minimum Data Set and Quantitative Soil Quality Indexing of Alkaline Soils under Different Land Uses in Northeastern China. Sci. Total Environ. 2018, 616–617, 564–571. [Google Scholar] [CrossRef]
  16. Li, X.; Zhang, H.; Sun, M.; Xu, N.; Sun, G.; Zhao, M. Land Use Change from Upland to Paddy Field in Mollisols Drives Soil Aggregation and Associated Microbial Communities. Appl. Soil Ecol. 2020, 146, 103351. [Google Scholar] [CrossRef]
  17. Wu, C.; Liu, G.; Huang, C.; Liu, Q. Soil Quality Assessment in Yellow River Delta: Establishing a Minimum Data Set and Fuzzy Logic Model. Geoderma 2019, 334, 82–89. [Google Scholar] [CrossRef]
  18. Wei, L.; Ge, T.; Zhu, Z.; Luo, Y.; Yang, Y.; Xiao, M.; Yan, Z.; Li, Y.; Wu, J.; Kuzyakov, Y. Comparing Carbon and Nitrogen Stocks in Paddy and Upland Soils: Accumulation, Stabilization Mechanisms, and Environmental Drivers. Geoderma 2021, 398, 115121. [Google Scholar] [CrossRef]
  19. Zhang, G.-L.; Gong, Z.-T. Pedogenic Evolution of Paddy Soils in Different Soil Landscapes. Geoderma 2003, 115, 15–29. [Google Scholar] [CrossRef]
  20. Wang, L.; Jiao, W.; MacBean, N.; Rulli, M.C.; Manzoni, S.; Vico, G.; D’Odorico, P. Dryland Productivity under a Changing Climate. Nat. Clim. Change 2022, 12, 981–994. [Google Scholar] [CrossRef]
  21. Tang, M.; Wang, C.; Ying, C.; Mei, S.; Tong, T.; Ma, Y.; Wang, Q. Research on Cultivated Land Quality Restriction Factors Based on Cultivated Land Quality Level Evaluation. Sustainability 2023, 15, 7567. [Google Scholar] [CrossRef]
  22. Gao, J.; Zhao, R.; Zhan, Y. Land Comprehensive Carrying Capacity of Major Grain-Producing Areas in Northeast China: Spatial–Temporal Evolution, Obstacle Factors and Regulatory Policies. Sustainability 2022, 14, 11322. [Google Scholar] [CrossRef]
  23. Yao, D.; Pei, J.; Wang, J. Temporal-spatial changes in cultivated land quality in a black soil region of Northeast China. Chin. J. Eco-Agric. 2020, 28, 104–114. [Google Scholar] [CrossRef]
  24. Zadeh, L.A. Fuzzy Sets. Inf. Control 1965, 8, 338–353. [Google Scholar] [CrossRef]
  25. Doran, J.W.; Parkin, T.B. Defining and Assessing Soil Quality. In Defining Soil Quality for a Sustainable Environment; John Wiley & Sons, Ltd.: New York, NY, USA, 1994; pp. 1–21. ISBN 978-0-89118-930-5. [Google Scholar]
  26. Zhao, X.; Tong, M.; He, Y.; Han, X.; Wang, L. A Comprehensive, Locally Adapted Soil Quality Indexing under Different Land Uses in a Typical Watershed of the Eastern Qinghai-Tibet Plateau. Ecol. Indic. 2021, 125, 107445. [Google Scholar] [CrossRef]
  27. Jahin, H.S.; Abuzaid, A.S.; Abdellatif, A.D. Using Multivariate Analysis to Develop Irrigation Water Quality Index for Surface Water in Kafr El-Sheikh Governorate, Egypt. Environ. Technol. Innov. 2020, 17, 100532. [Google Scholar] [CrossRef]
  28. Yu, P.; Liu, J.; Tang, H.; Sun, X.; Liu, S.; Tang, X.; Ding, Z.; Ma, M.; Ci, E. Establishing a Soil Quality Index to Evaluate Soil Quality after Afforestation in a Karst Region of Southwest China. CATENA 2023, 230, 107237. [Google Scholar] [CrossRef]
  29. Chen, Y.; Zhu, M.; Lu, J.; Zhou, Q.; Ma, W. Evaluation of Ecological City and Analysis of Obstacle Factors under the Background of High-Quality Development: Taking Cities in the Yellow River Basin as Examples. Ecol. Indic. 2020, 118, 106771. [Google Scholar] [CrossRef]
  30. Wackernagel, H. Ordinary Kriging. In Multivariate Geostatistics: An Introduction with Applications; Wackernagel, H., Ed.; Springer: Berlin/Heidelberg, Germany, 2003; pp. 79–88. ISBN 978-3-662-05294-5. [Google Scholar]
  31. Huang, S.; Islam, M.U.; Jiang, F. The Effect of Deep-Tillage Depths on Crop Yield: A Global Meta-Analysis. Plant Soil Environ. 2023, 69, 105–117. [Google Scholar] [CrossRef]
  32. Gong, D.; Dai, G.; Chen, Y.; Yu, G. Optimal Tillage Depths for Enhancing Rice Yield, Quality and Lodging Resistance in the Rice Production Systems of Northeast China. PeerJ 2023, 11, e15739. [Google Scholar] [CrossRef]
  33. Koutsos, T.M.; Menexes, G.C.; Eleftherohorinos, I.G.; Alexandridis, T.K. Using Block Kriging as a Spatial Smooth Interpolator to Address Missing Values and Reduce Variability in Maize Field Yield Data. Agronomy 2023, 13, 1685. [Google Scholar] [CrossRef]
  34. Chen, X.; Hu, Y.; Xia, Y.; Zheng, S.; Ma, C.; Rui, Y.; He, H.; Huang, D.; Zhang, Z.; Ge, T.; et al. Contrasting Pathways of Carbon Sequestration in Paddy and Upland Soils. Glob. Change Biol. 2021, 27, 2478–2490. [Google Scholar] [CrossRef]
  35. Chen, X. Economic Potential of Biomass Supply from Crop Residues in China. Appl. Energy 2016, 166, 141–149. [Google Scholar] [CrossRef]
  36. Liu, Y.; Ge, T.; Zhu, Z.; Liu, S.; Luo, Y.; Li, Y.; Wang, P.; Gavrichkova, O.; Xu, X.; Wang, J.; et al. Carbon Input and Allocation by Rice into Paddy Soils: A Review. Soil Biol. Biochem. 2019, 133, 97–107. [Google Scholar] [CrossRef]
  37. Huang, W.; Hall, S.J. Elevated Moisture Stimulates Carbon Loss from Mineral Soils by Releasing Protected Organic Matter. Nat. Commun. 2017, 8, 1774. [Google Scholar] [CrossRef] [PubMed]
  38. Keiluweit, M.; Nico, P.S.; Kleber, M.; Fendorf, S. Are Oxygen Limitations under Recognized Regulators of Organic Carbon Turnover in Upland Soils? Biogeochemistry 2016, 127, 157–171. [Google Scholar] [CrossRef]
  39. Qiu, H.; Ge, T.; Liu, J.; Chen, X.; Hu, Y.; Wu, J.; Su, Y.; Kuzyakov, Y. Effects of Biotic and Abiotic Factors on Soil Organic Matter Mineralization: Experiments and Structural Modeling Analysis. Eur. J. Soil Biol. 2018, 84, 27–34. [Google Scholar] [CrossRef]
  40. Angelico, R.; Ceglie, A.; He, J.-Z.; Liu, Y.-R.; Palumbo, G.; Colombo, C. Particle Size, Charge and Colloidal Stability of Humic Acids Coprecipitated with Ferrihydrite. Chemosphere 2014, 99, 239–247. [Google Scholar] [CrossRef] [PubMed]
  41. Duan, X.; Yu, X.; Li, Z.; Wang, Q.; Liu, Z.; Zou, Y. Iron-Bound Organic Carbon Is Conserved in the Rhizosphere Soil of Freshwater Wetlands. Soil Biol. Biochem. 2020, 149, 107949. [Google Scholar] [CrossRef]
  42. Zhou, W.; Lv, T.-F.; Chen, Y.; Westby, A.P.; Ren, W.-J. Soil Physicochemical and Biological Properties of Paddy-Upland Rotation: A Review. Sci. World J. 2014, 2014, 856352. [Google Scholar] [CrossRef]
  43. Shinoto, Y.; Otani, R.; Matsunami, T.; Maruyama, S. Analysis of the Shallow Root System of Maize Grown by Plowing Upland Fields Converted from Paddy Fields: Effects of Soil Hardness and Fertilization. Plant Prod. Sci. 2021, 24, 297–305. [Google Scholar] [CrossRef]
  44. Zhou, D.; Zhang, L.; Hao, L.; Sun, G.; Liu, Y.; Zhu, C. Spatiotemporal Trends of Urban Heat Island Effect along the Urban Development Intensity Gradient in China. Sci. Total Environ. 2016, 544, 617–626. [Google Scholar] [CrossRef]
  45. Huang, L.; Jia, X.; Shao, M.; Chen, L.; Han, G.; Zhang, G. Phases and Rates of Iron and Magnetism Changes during Paddy Soil Development on Calcareous Marine Sediment and Acid Quaternary Red-Clay. Sci. Rep. 2018, 8, 444. [Google Scholar] [CrossRef]
  46. Uga, Y.; Sugimoto, K.; Ogawa, S.; Rane, J.; Ishitani, M.; Hara, N.; Kitomi, Y.; Inukai, Y.; Ono, K.; Kanno, N.; et al. Control of Root System Architecture by DEEPER ROOTING 1 Increases Rice Yield under Drought Conditions. Nat. Genet. 2013, 45, 1097–1102. [Google Scholar] [CrossRef]
  47. Kumhálová, J.; Kumhála, F.; Kroulík, M.; Matějková, Š. The Impact of Topography on Soil Properties and Yield and the Effects of Weather Conditions. Precis. Agric. 2011, 12, 813–830. [Google Scholar] [CrossRef]
  48. Dai, L.; Ge, J.; Wang, L.; Zhang, Q.; Liang, T.; Bolan, N.; Lischeid, G.; Rinklebe, J. Influence of Soil Properties, Topography, and Land Cover on Soil Organic Carbon and Total Nitrogen Concentration: A Case Study in Qinghai-Tibet Plateau Based on Random Forest Regression and Structural Equation Modeling. Sci. Total Environ. 2022, 821, 153440. [Google Scholar] [CrossRef]
  49. Wankmüller, F.J.P.; Delval, L.; Lehmann, P.; Baur, M.J.; Cecere, A.; Wolf, S.; Or, D.; Javaux, M.; Carminati, A. Global Influence of Soil Texture on Ecosystem Water Limitation. Nature 2024, 635, 631–638. [Google Scholar] [CrossRef]
  50. Patel, K.F.; Fansler, S.J.; Campbell, T.P.; Bond-Lamberty, B.; Smith, A.P.; RoyChowdhury, T.; McCue, L.A.; Varga, T.; Bailey, V.L. Soil Texture and Environmental Conditions Influence the Biogeochemical Responses of Soils to Drought and Flooding. Commun. Earth Environ. 2021, 2, 127. [Google Scholar] [CrossRef]
  51. Yang, Y.; Ji, C.; Ma, W.; Wang, S.; Wang, S.; Han, W.; Mohammat, A.; Robinson, D.; Smith, P. Significant Soil Acidification across Northern China’s Grasslands during 1980s–2000s. Glob. Change Biol. 2012, 18, 2292–2300. [Google Scholar] [CrossRef]
  52. Scudiero, E.; Corwin, D.L.; Morari, F.; Anderson, R.G.; Skaggs, T.H. Spatial Interpolation Quality Assessment for Soil Sensor Transect Datasets. Comput. Electron. Agric. 2016, 123, 74–79. [Google Scholar] [CrossRef]
  53. Wu, Q.; Li, Q.; Gao, J.; Lin, Q.; Xu, Q.; Groffman, P.M.; Yu, S. Non-Algorithmically Integrating Land Use Type with Spatial Interpolation of Surface Soil Nutrients in an Urbanizing Watershed. Pedosphere 2017, 27, 147–154. [Google Scholar] [CrossRef]
  54. Lal, R. Soil Carbon Sequestration Impacts on Global Climate Change and Food Security. Science 2004, 304, 1623–1627. [Google Scholar] [CrossRef]
  55. Shen, J.; Yuan, L.; Zhang, J.; Li, H.; Bai, Z.; Chen, X.; Zhang, W.; Zhang, F. Phosphorus Dynamics: From Soil to Plant. Plant Physiol. 2011, 156, 997–1005. [Google Scholar] [CrossRef] [PubMed]
  56. Blanco-Canqui, H.; Lal, R. Crop Residue Removal Impacts on Soil Productivity and Environmental Quality. Crit. Rev. Plant Sci. 2009, 28, 139–163. [Google Scholar] [CrossRef]
  57. Six, J.; Conant, R.T.; Paul, E.A.; Paustian, K. Stabilization Mechanisms of Soil Organic Matter: Implications for C-Saturation of Soils. Plant Soil 2002, 241, 155–176. [Google Scholar] [CrossRef]
  58. Wu, Z.; Liu, Y.; Han, Y.; Zhou, J.; Liu, J.; Wu, J. Mapping Farmland Soil Organic Carbon Density in Plains with Combined Cropping System Extracted from NDVI Time-Series Data. Sci. Total Environ. 2021, 754, 142120. [Google Scholar] [CrossRef]
  59. Ghosh, T.; Das, B.; Chakraborty, D.; Singh, V.K.; Das, D.; Aggarwal, P. Development and Evaluation of a Novel Soil Quality Analysis Framework for Rice-Wheat Cropping System in the Indo-Gangetic Plains of India 2023. SSRN Electron. J. 2023. [Google Scholar] [CrossRef]
  60. Sulaeman, Y.; Maftuáh, E.; Sukarman, S.; Neswati, R.; Nurdin, N.; Basuki, T.; Suriadi, A.; Vasenev, I. Influence of Land-Use Type on Black Soil Features in Indonesia Based on Soil Survey Data. Land 2025, 14, 599. [Google Scholar] [CrossRef]
  61. Uthappa, A.R.; Devakumar, A.S.; Das, B.; Mahajan, G.R.; Chavan, S.B.; Jinger, D.; Jha, P.K.; Kumar, P.; Kokila, A.; Krishnamurthy, R.; et al. Comparative Analysis of Soil Quality Indexing Techniques for Various Tree Based Land Use Systems in Semi-Arid India. Front. For. Glob. Change 2024, 6, 1322660. [Google Scholar] [CrossRef]
Figure 1. Spatial distribution of sampling points in the study area.
Agronomy 15 01838 g001
Figure 2. Distribution of numerical indicators.
Agronomy 15 01838 g002
Figure 3. Pearson correlation matrix of cultivated land quality evaluation indicators. Note: X1 is texture configuration, X2 is parent material, X3 is landform type, X4 is soil texture, X5 is irrigation capacity, X6 is drainage capacity, X7 is arable layer thickness, X8 is soil pH, X9 is organic matter, X10 is available phosphorus, X11 is effective soil layer thickness, X12 is ≥10 °C accumulated temperature and X13 is annual precipitation.
Agronomy 15 01838 g003
Figure 4. Comparison of cultivated land quality index (CQI) values derived from minimum data sets (MDS) between paddy and upland fields. Box plots show median, interquartile range, and outliers for each cropping system.
Agronomy 15 01838 g004
Figure 5. Spatial distribution and proportion of cultivated land quality grades under different cropping systems.
Agronomy 15 01838 g005
Figure 6. Correlation between cultivated land quality index (CQI) values derived from minimum data sets (MDS) and total data sets (TDS). Note: CQIp = Cultivated Land Quality Index for paddy fields; CQIu = Cultivated Land Quality Index for upland fields.
Agronomy 15 01838 g006
Figure 7. Quantitative distribution of obstacle factors under different cropping systems.
Agronomy 15 01838 g007
Figure 8. Spatial distribution of obstacle factors in paddy fields.
Agronomy 15 01838 g008
Figure 9. Spatial distribution of obstacle factors in upland fields.
Agronomy 15 01838 g009
Figure 10. Obstacle degree of each indicator across different cultivated land quality grades. Note: The high category included Grade I and Grade II, the medium category included Grade III and Grade IV, and the low category included Grade V.
Agronomy 15 01838 g010
Table 1. Index system for comprehensive evaluation of cultivated land quality.
ObjectiveCriterionIndex
Cultivated land qualityclimatic conditions≥10 °C accumulated temperature
Annual precipitation
Profile characteristicsEffective soil layer thickness
Arable layer thickness
Site conditionTexture configuration
Parent material
Landform type
Nutrient statusOrganic matter
Available phosphorus
Soil physical and chemical propertySoil pH
Soil texture
Soil managementIrrigation capacity
Drainage capacity
Table 2. Membership function parameters for numerical indicators.
Function TypeIndexUpland Fields Function ParametersPaddy Fields Function Parameters
xminr1r2xmaxxminr1r2xmax
more is better≥10 °C accumulated temperature3150 35003250 3450
Annual precipitation450 776492.67 732
Effective soil layer thickness37.65 15041.1 120
Arable layer thickness15 29.2515 27
Organic matter7.55 409.15 40
Available phosphorus10 4010.03 40
optimal rangeSoil pH4.356.86.89.694.356.86.89.69
Note: r1 and r2 are the standard indicators, and xmin and xmax are the upper and lower limit values of the index, respectively.
Table 3. Membership degrees for conceptual indicators.
IndexAttributeMembership DegreeIndexAttributeMembership Degree
Texture configurationUpper loose lower tight1.00Soil textureMedium loam1.00
Spongy0.90 Light loam0.88
Sandwich0.80 Heavy loam0.84
Compact0.70 Sandy loam0.71
Upper tight lower loose0.60 Clay soil0.60
Thin layer0.50 Sandy soil0.48
Loose0.40Irrigation capacityFully satisfy1.00
Parent materialAlluvium, loess and loess-like parent material1.00 Satisfy0.90
Sediments, fluvial and lacustrine alluvium0.80 Basically satisfy0.80
Glacial deposits and colluvium0.70 Not satisfy0.40
Residual deposits, aeolian deposits, crystalline salts and laterite0.50Drainage capacityFully satisfy1.00
Landform typeAlluvial plain, diluvial plain, alluvial-diluvial plain, and alluvial fan plain1.00 Satisfy0.90
Erosional plain0.80 Basically satisfy0.70
Hilly land0.70 Not satisfy0.30
Low-relief mountains0.60
Table 4. Final indicators included in the minimum data set (MDS) for paddy fields, with corresponding principal components and assigned weights.
IndexGroup NormTDSMDS
PC-1PC-2PC-3PC-4PC-5PC-6WeightWeight
≥10 °C accumulated temperature10.7230.245−0.498−0.0390.155−0.0571.3870.0890.164
Irrigation capacity20.358−0.6580.0210.0750.3780.3121.2030.0830.124
Arable layer thickness3−0.3970.1340.673−0.0610.2870.1671.1320.0770.163
Parent material40.4450.0140.3980.567−0.2650.0311.1310.0770.147
Effective soil layer thickness40.078−0.3820.198−0.523−0.2780.4671.0190.0780.148
Organic matter50.2100.4200.424−0.0900.565−0.2161.0870.0800.122
Available phosphorus60.1730.5220.150−0.1920.0940.6041.0410.0760.131
Eigenvalues2.6801.8761.5171.3001.2431.090
Variance/%20.61414.42811.66710.0029.5608.385
Cumulative variance/%20.61435.04346.71056.71266.27274.658
Table 5. Final indicators included in the minimum data set (MDS) for upland fields, with corresponding principal components and assigned weights.
IndexGroup NormTDSMDS
PC-1PC-2PC-3PC-4PC-5WeightWeight
≥10 °C accumulated temperature10.8340.077−0.288−0.1760.0121.2990.1070.163
Landform type2−0.2220.620−0.2400.247−0.3001.0010.0840.140
Irrigation capacity20.1380.5700.4610.0130.2180.9590.0790.060
Soil texture30.222−0.3250.5610.059−0.3890.9420.0820.154
Arable layer thickness4−0.427−0.1540.1130.6190.3011.0200.0910.162
Available phosphorus40.381−0.189−0.0220.7140.0861.0110.0920.180
Organic matter5−0.129−0.165−0.365−0.1440.6780.9070.0860.141
Eigenvalues2.1981.6481.3521.2481.166
Variance/%16.90612.67610.4029.5988.968
Cumulative variance/%16.90629.58239.98449.58258.550
Disclaimer/Publisher’s Note: The statements, opinions and data contained in all publications are solely those of the individual author(s) and contributor(s) and not of MDPI and/or the editor(s). MDPI and/or the editor(s) disclaim responsibility for any injury to people or property resulting from any ideas, methods, instructions or products referred to in the content.

