Article

Assessment of Genetic Diversity in Elite Stevia Genotypes Utilizing Distinguishability, Homogeneity and Stability (DHS) Through Morphological Descriptors

by
Fellipe Celestino de Castro
1,†,
Fábio Gelape Faleiro
2,
Renato Fernando Amabile
2,
Jamile da Silva Oliveira
2,
Adriana Lopes da Luz
2,
João Victor Pinheiro Melo
1,
Arlini Rodrigues Fialho
1,
Kelly Cristina dos Santos Soares
3,*,
Gustavo Barbosa Cobalchini Santos
1 and
Lorena Portilho Bruno
1
1
Faculdade de Agronomia e Medicina Veterinária (FAV), Campus Darcy Ribeiro, University of Brasília (UnB), ICC-Sul, Asa Norte, Brasília CEP 70910-900, DF, Brazil
2
Embrapa Cerrados, Rodovia BR-020, Km 18, Caixa Postal 08233, Planaltina CEP 73301-970, DF, Brazil
3
União Pioneira de Integração Social (UPIS), Campus II, Fazenda Lagoa Bonita, BR-020, Km 12, Planaltina CEP 73310-970, DF, Brazil
*
Author to whom correspondence should be addressed.
This paper is a part of the Master’s Thesis of Fellipe Celestino de Castro, presented at University of Brasília (UnB) in February 2020.
Agronomy 2025, 15(8), 1836; https://doi.org/10.3390/agronomy15081836
Submission received: 25 March 2025 / Revised: 29 May 2025 / Accepted: 17 June 2025 / Published: 29 July 2025
(This article belongs to the Section Crop Breeding and Genetics)

Abstract

Stevia rebaudiana Bertoni, a semi-perennial herb from the Asteraceae family, is native to the Paraguay–Brazil border region. The growing industrial interest in this species is due to its natural sweetening properties, such as steviol and its derivatives, which offer sweetness without adding calories. Morphological traits are crucial for assessing genetic variability and ensuring distinctness, homogeneity, and stability (DHS) for cultivar protection. This study characterized 19 elite Stevia genotypes from Embrapa Cerrados’ Active Germplasm Bank (BAG) using 21 morphological descriptors from Brazil’s Ministry of Agriculture, Livestock, and Supply (MAPA). Genetic distances were calculated using the simple coincidence index complement method, and clustering was performed via the Unweighted Pair-Group Method with Arithmetic Mean (UPGMA). The results showed that 17 of the 21 descriptors (>80%) effectively differentiated the genotypes, revealing significant genetic variability. Dendrogram analysis identified at least four major similarity groups, highlighting the potential of these genotypes for Stevia breeding programs. These findings underscore the suitability of these elite genotypes for developing superior varieties adapted to Cerrado conditions, supporting future cultivation and genetic improvement efforts.

1. Introduction

The Stevia genus (Asteraceae) was studied for its organoleptic properties, and only 2 of the 110 species analyzed have levels of sweetening components, namely Stevia rebaudiana Bertoni (the best-known species) and S. phlebophylla A. Gray (the rarest species, found in Mexico). Firstly, Stevia rebaudiana Bertoni is characterized as a semi-evergreen herbaceous plant found in the wild, mainly in the region bordering Paraguay and Brazil [1,2]. The global Stevia market size was valued at USD 513.4 million in 2023 and is projected to grow at a Compound Annual Growth Rate (CAGR) of 11.9% from 2024 to 2030 [3]. The revenue forecast in 2030 is USD 1.12 billion [3]. To meet this demand, genetic improvement programs and genetic diversity studies are crucial to enhance desirable traits such as sweet steviol glycoside content [4].
It is universally acknowledged that there is a high demand for Stevia in the industry, primarily due to its calorie-free natural sweetening properties (steviol and its variations). Moreover, steviol is therefore a substitute for sucrose all over the world. This industrial shortage is associated with the constant global increase in metabolic disorders, such as the prevalence of type II diabetes and obesity [5,6].
These substances have a sweetening power between 300 and 400 times greater than sucrose, such as the maintenance of a low glycemic index, heat stability, and the lack of fermentation, which are important attributes for the food industry [7,8].
Nonetheless, plant characterization is an essential practice in active germplasm banks and genetic improvement programs as well, which integrates information on the identification, description, and differentiation of accessions and genotypes. Morphological characteristics assessed qualitatively and/or quantitatively are very useful in genetic variability studies and for carrying out distinguishability, homogeneity, and stability (DHS) trials to protect cultivars [8,9].
According to Burle and Oliveira [8], morphological descriptors are characteristics that are generally regulated by a few genes, are strongly heritable, and exhibit a low genotype-versus-environment interaction. This allows for the discrimination of phenotypes, which should provide the first estimates of genetic variability within the germplasm bank or the working collection of the plant breeder.
There are around 90 varieties of Stevia developed around the world [10]. However, in Brazil, there are only two cultivars (AKH L1 and CPQBA T6) registered in the National Register of Cultivars—RNC, and two cultivars protected by the National System for the Protection of Cultivars—NSPC (CPQBA T6 and Morita III) [11]. According to Tavarini et al. [5] and Wölwer-Rieck [6], the Morita III variety, derived from Morita II, is one of the best-known and most studied varieties and is characterized by its low water requirement.
However, under Brazilian Law No. 9.456, cultivars that need to be protected must undergo the distinguishability, homogeneity, and stability (DHS) test. This test is based on the analysis of various morphological descriptors, referred to in the legislation as the minimum descriptors recommended by Brazil’s Ministry of Agriculture and Livestock (MAPA), which, in turn, prove the distinction from other varieties of the same species [12].
The Cerrado Biome has been recognized as a promising region for growing Stevia. It features a tropical, semi-humid climate with two well-defined seasons: a rainy summer and a dry winter [13,14]. Consequently, the average annual temperature is around 22 °C, and the average annual rainfall ranges between 1200 and 1800 mm [15]. Moreover, characterization studies of elite Stevia genotypes developed in this biome could provide valuable information and lead to the development of varieties highly adapted to Cerrado conditions, enabling large-scale cultivation and offering an alternative for producers in this important region of Brazil.
Embrapa Cerrados, through public–private partnerships, began a Stevia breeding program in 2004, which peaked in the development of promising elite genotypes for crops in the Cerrado region. This study aimed to apply the morphological descriptors published by the Ministry of Agriculture and Livestock, under the standards and indications of the National Service for the Protection of Cultivars (NSPC), to the Stevia cultivar Stevia rebaudiana (Bert.) Bertoni in order to analyze the descriptors, characterize the genotypes, and evaluate the genetic variability of elite genotypes in the Cerrado region of the Brazil Central Plateau.

2. Materials and Methods

This study was conducted at Embrapa Cerrados, in Planaltina-DF (latitude 15°36′19″ South, longitude 47°42′56″ West and altitude 1024 m), analyzing 19 elite genotypes of Stevia rebaudiana Bertoni from the Stevia breeding program led at Embrapa Cerrados (Table 1) [16]. The 19 elite genotypes were selected from 230 genotypes evaluated in 2018 and 2019 to evaluate the production of green phytomass from the aerial part, the height, and the tillering of each plant. During this period, six cuts were made to evaluate the production of green phytomass from the aerial part, the height, and the tillering of each plant in the period from 2018 to 2019. The 19 best-performing genotypes (Table 1) were cloned using vegetative propagation by the cutting technique. This type of vegetative propagation through cuttings was chosen to maintain the genetic identity of the genotypes selected in the previous experimental stage. For this purpose, herbaceous cuttings ranging from 5 to 8 cm with 3 or 4 nodes were obtained from the 19 best-performing plants.
The cuttings were immediately placed in cell trays (expanded polystyrene trays, with 50 cells each with a volume of 90 cm3). The cuttings were packaged and kept in a greenhouse for 60 days. After this period, 12 plants of each genotype were placed in 60 L pots, filled with moist substrate at field capacity. The substrate used was a commercial one known as Carolina Soil®. This substrate has the following basic characteristics: composition of sphagnum peat, expanded vermiculite, dolomitic limestone, agricultural gypsum, and NPK fertilizer (trace); hydrogen potential (pH) of 5.5 ± 0.5; electrical conductivity (EC) of 0.7 ± 0.3; density of 145 kg/m³; and water retention capacity (WRC) of 55%.
The plants were cultivated and maintained in an open area (under full sun). The region has the following climate according to the Köppen AW classification: seasonal tropical megathermal savannah with an average temperature of the coldest month above 18.0 °C. The average maximum and minimum temperatures are 26.4 °C and 15.9 °C, respectively. The frequency and volume of irrigation were measured based on evapotranspiration, and the soil water content was always kept close to the field capacity. No pest or disease control was used, and no additional fertilization was performed either. For each genotype, 21 morphoagronomic descriptors (categorical) were evaluated (Table 2), as recommended by the NSPC-MAPA [11].
All assessments on the plant, stem, leaves, and flowers were carried out during full bloom, specifically, when at least 50% of the plants had at least one flower. The leaf assessments were always carried out on the largest leaves on the main culm, and the stem assessments were carried out on the main stem. Assessments on the achenes were conducted at the mature seed stage.
The definition of the phenotypic class for each descriptor was based on the evaluation of 10 plants and three plant parts (stem, leaf, and achene) from each genotype.
Based on the frequency distribution of the different phenotypic classes of the 19 elite genotypes of Stevia rebaudiana Bertoni, the level of entropy of the characteristics (H), proposed by Renyi [17], was calculated according to the following model:
H = N l n l n   N I 1 S n   l n l n   n i N
In which
H’ = Shannon–Weaver index.
ni = number of individuals sampled of the i-th species.
N = total number of individuals sampled.
S = total number of species sampled.
ln = Neperian base logarithm.
The entropy value was estimated using the Multiv v.2.3 program [18]. The genetic distances between the 19 elite Stevia genotypes were calculated based on all 21 morphoagronomic descriptors. The estimates were based on the complement of the simple coincidence index of the phenotypic classes (categories) using the computer program Genes [19]. Two-dimensional graphs of the data matrix using a color scale were established using the program PAST v.3.26 [20].
Based on the matrix of genetic distances, cluster analyses of the elite genotypes were carried out via dendrogram, using the UPGMA (Unweighted Pair-Group Method using Arithmetic Averages) average linkage method as a criterion. In the dendrogram, the cut-off point for establishment was defined based on the average distance between the genotypes. Graphical dispersion was also carried out based on multidimensional scales using the principal coordinate method, with the aid of the SAS (SAS Institute Inc., 1989) [21,22] and Statistica (Statsoft Inc., 1999) [23,24] programs.

3. Results

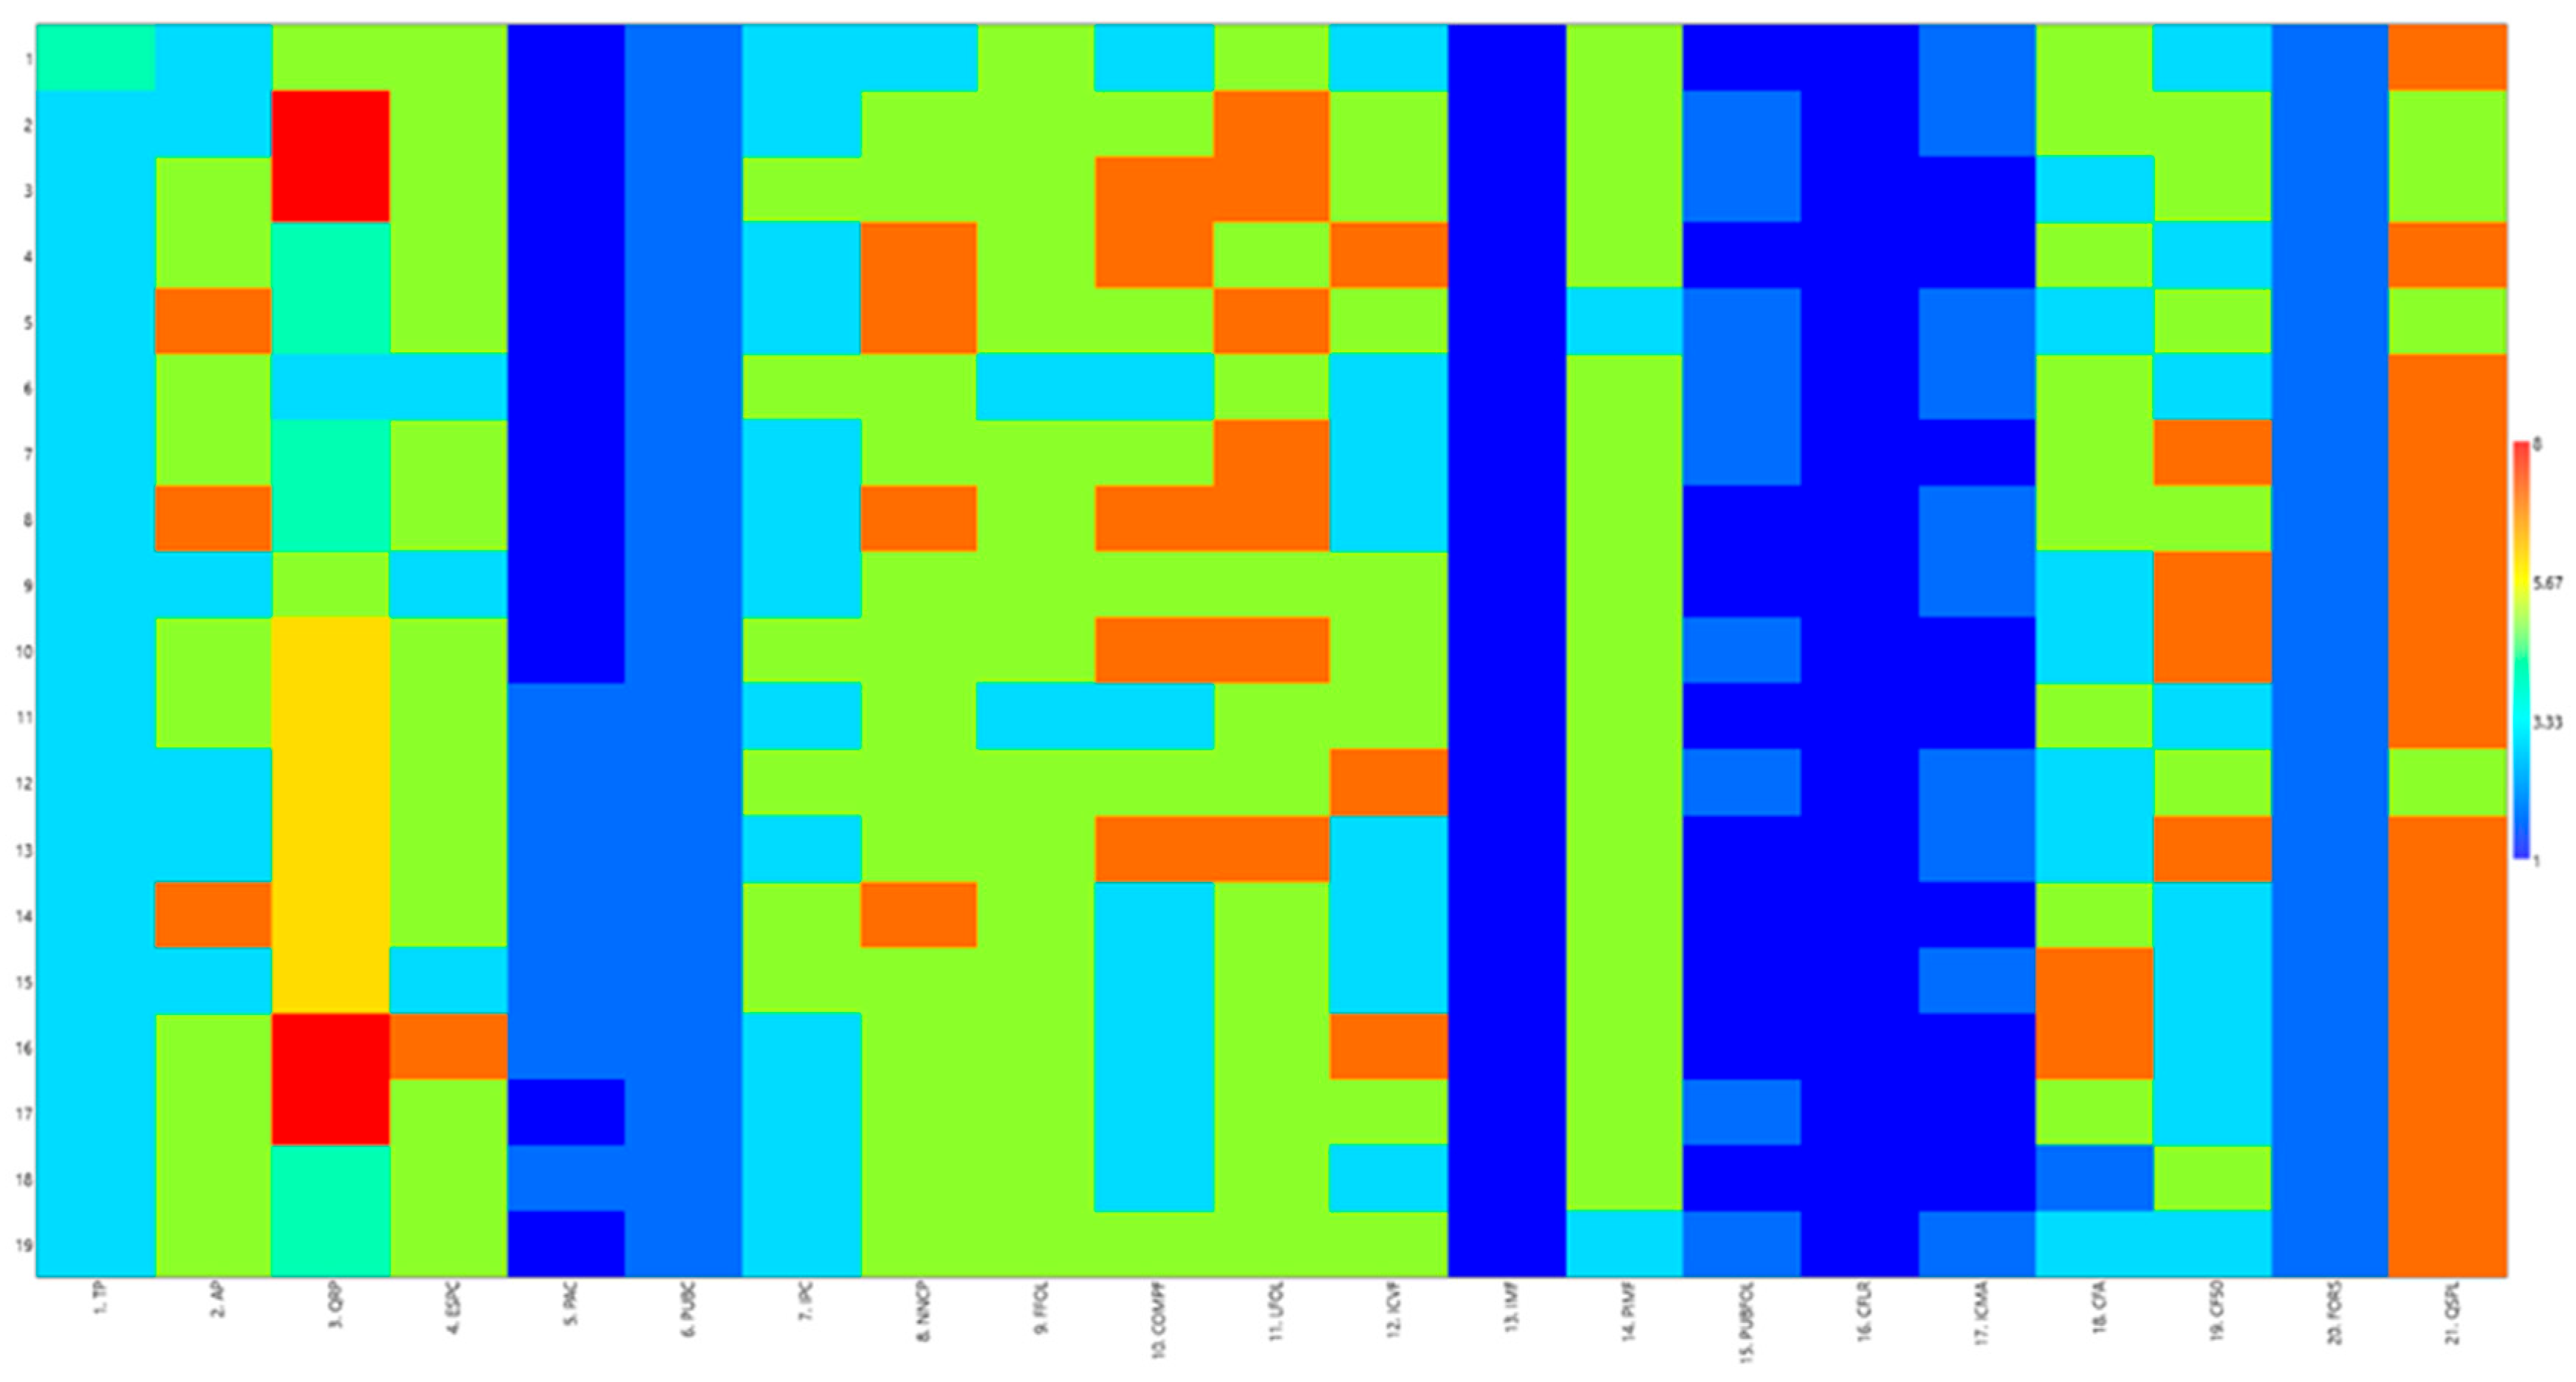
3.1. Characterization of the Descriptors

According to the characterization of the descriptors in Table 2, it was found that only four (19%) of the descriptors showed no variation or polymorphism. In other words, the entropy was zero (H = 0) for the following characteristics: 6. stem—pubescence (in the middle third); 13. leaf—incisions on the margin; 16. flower—coloration (in the center of the corolla); and 20. seeds—formation (Table 2). All the other descriptors allowed the 19 elite Stevia genotypes to be differentiated.
The characteristics that stood out for their high level of entropy and high variability were 3. stem—number of primary branches (1.44); 18. achene—spindle length (1.11); 10. leaf—length (1.07); 19. flowering cycle (1.04); 12. leaf—intensity of green color (adaxial part) (1.01); 2. plant—height (0.99); and 8. stem—number of nodes on the main stem (0.70) (Table 2).
The feature description and description code can be found at the NSPC-MAPA [11].
The following characteristics had an entropy of 0.69: 15. leaf—pubescence and 17. achene—intensity of brown coloration. The following characteristics had an entropy between 0.65 and 0.62: 4. stem—thickness (diameter at the average height of the main stem); 5. stem—anthocyanin pigmentation; 7. stem—pubescence intensity (in the middle third); and 11. leaf—width. The following characteristics showed entropy below 0.60 and above 0.00: 14. leaf—depth of incisions on the margin; 21. seeds—number of seeds per plant; 1. plant—type; and 9. leaf—shape (Table 2).
An overview of the variability of the 19 genotypes, through their evaluated characteristics and phenotypic classes, is presented in Figure 1. The following characteristics were not useful in differentiating the 19 elite genotypes selected and analyzed: 6. stem—pubescence (in the middle third) (PUBC); 13. leaf—incisions on the margin (IMF); 16. flower—coloration (in the center of the corolla) (CFLR); and 20. seeds—formation (FORS) (Figure 1).

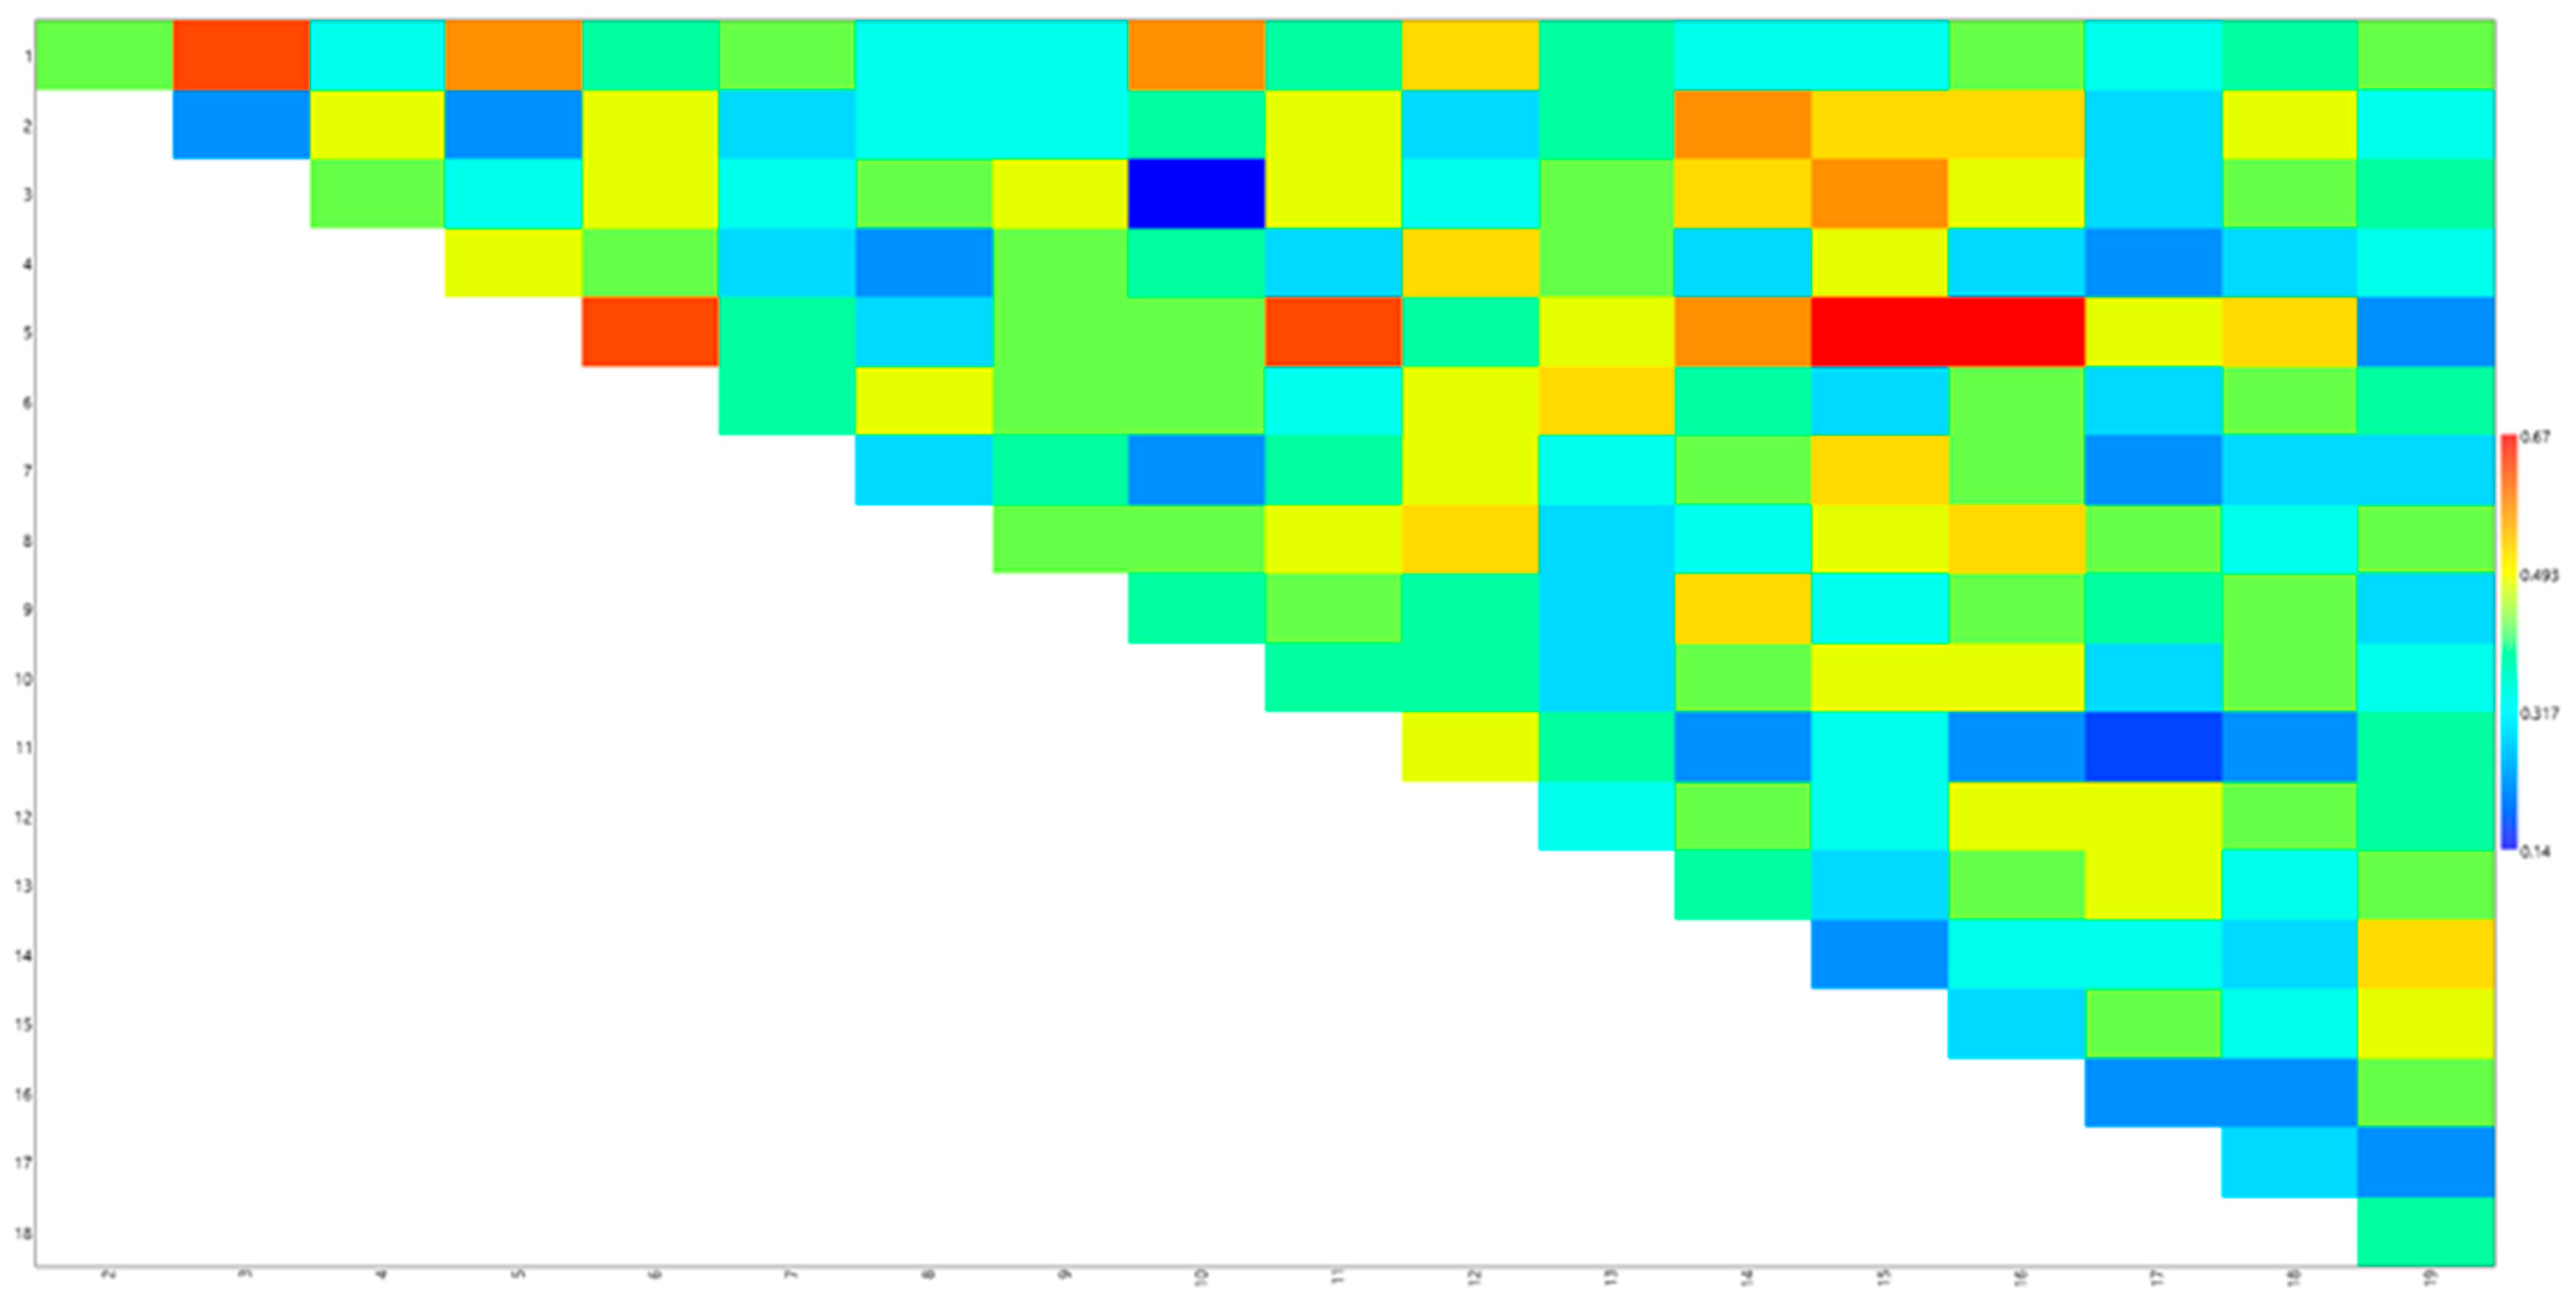
3.2. Genetic Distance Matrix

The matrix of the genetic distances between the 19 elite genotypes of Stevia rebaudiana Bertoni (Table 3) shows the highest values between elite genotypes 5 and 15 and between 5 and 16, both with a distance of 0.67. Elite genotype 5 has a distance of 0.62 from genotypes 6 and 11, followed by the same distance between genotypes 1 and 3. Genotype 1 has a high distance of 0.57 from genotypes 5 and 10. Genotypes 2 and 14, 3 and 15, and 5 and 14 also have a high distance of 0.57 from each other. Genotypes 1 and 12, 2 and 15, 2 and 16, 3 and 14, 4 and 12, 5 and 18, 6 and 13, 7 and 15, 8 and 12, 8 and 16, 9 and 14, and 14 and 19 achieved the same distance of 0.52. In turn, the other genotypes obtained distances ranging from 0.14 to 0.48 from blue to green, as shown (Figure 2).

3.3. UPGMA Method

In Figure 3, the cluster analysis, carried out using a dendrogram and the UPGMA method as a criterion, defined the cut-off point based on the average genetic distance. This approach resulted in the formation of four large similarity groups.
The four groups formed by similarity, through cluster analysis via dendrograms, were group I, including seven (6, 11, 17, 18, 14, and 15) elite genotypes; group II, including six (2, 5, 19, 3, 10, and 7) elite genotypes; group III, including three (9, 13, and 12) elite genotypes; and finally, group IV, including three (1, 4, and 8) elite genotypes (Figure 3).

3.4. Dispersion Analysis

To complement the cluster analysis via dendrogram, the dispersion analysis (Figure 4) showed the high variability of the genotypes with a distribution along the two coordinates of the graph, with a certain correspondence between the similarity groups defined in the dendrogram and the grouping seen in the dispersion graph (Figure 4). The four groups in the dispersion analysis (blue, red, green, and yellow) correspond to the four groups defined in the dendrogram on the cut-off point based on the average genetic distance. The variability of the elite genotypes evaluated highlights the potential of using these genotypes in selection and recombination programs aimed at the genetic improvement of the species.
In addition to the morphological characteristics analyzed, the elite genotypes will be evaluated for agronomic characteristics such as phytomass productivity, long juvenile period, and regrowth capacity to develop cultivars adapted to the conditions of the Cerrado of the Central Plateau.

4. Discussion

According to the characterization of the descriptors in Table 2, it was found that only 19% of the descriptors showed no variation or polymorphism. All the other descriptors allowed the 19 elite Stevia genotypes to be differentiated.
Based on the descriptors that did not exhibit polymorphism, the elite genotypes predominantly displayed the following traits: seed formation, stems with pubescence in the middle third, and incisions on the leaf margins. Regarding the flowers, the center of the corolla was exclusively white, consistent with findings reported by Othman, Osman, and Zainuddin [25].
The characteristics with a high level of entropy (Table 2) are in line with studies by Yadav et al. [26]; Haida, Asikin and Hakiman [27]; Monteiro [28]; Meza and Peraçta [29]; De Souza et al. [30]; and Oliveira et al. (2004) [31], in which genetic and morphological variability was observed for the characteristics of plant height, flowering period, leaf yield, and stevioside content [5,6].
The entropy value was estimated using the Multiv v.2.3 program [18]. According to Vieira et al. [32] and Ogbonna et al. [33], the entropy of any descriptor tends to be higher for a greater number of phenotypic classes and a more balanced distribution of genotype frequencies between these classes.
According to Tavarini, Passera, and Angelini [5] and Wölwer-Rieck [6], genetic divergence among Stevia genotypes plays a significant role in selecting parent plants with greater variability for traits of interest in plant breeding. Stevia rebaudiana naturally exhibits phenotypic variations in both quantitative and qualitative leaf characteristics [26]. This variability has been attributed, in part, to the species’ largely self-incompatible flowers, as noted by Mahdi, Meena, and Tholakabavi [34], Yadav et al. [26], and Miyagawa et al. [35]. Additionally, Benelli et al. [36] linked the high phenotypic variability of Stevia. rebaudiana to its open pollination nature.
Yadav et al. [26] highlighted considerable variation in chromosome numbers within the genus Stevia. Specifically, Masand et al. [37] and Monteiro [28] reported that Stevia rebaudiana has a chromosome number of 2n = 22. However, triploid (2n = 33) and tetraploid (2n = 44) species have also been documented [26].

4.1. Features of Similarity Groups

4.1.1. Group I

This group is predominantly characterized by type 3 plants [11], exhibiting medium height and a high number of primary branches on the stem. The stems have an average diameter, anthocyanin pigmentation, and low pubescence intensity in the middle third. The main stem contains a medium number of nodes. The leaves are primarily lanceolate, short in length, and medium in width, with a light green coloration on the adaxial side. The leaf margins feature medium-depth incisions and lack pubescence. The achenes are mostly light brown, with a medium to high spindle length. The flowering cycle is early, and plants produce a high number of seeds per individual.

4.1.2. Group II

This group includes six elite genotypes (2, 5, 19, 3, 10, and 7) and is characterized by type 3 plants [11] of intermediate height. The stems have half the number of low primary branches, medium thickness, no anthocyanin pigmentation, medium pubescence intensity in the middle third, and a medium number of nodes. The leaves are lanceolate and mostly medium in length and width, with medium green coloration on the adaxial side. The leaf margins predominantly feature medium-depth incisions and pubescence. The achenes are medium-light brown, with medium spindle length. The flowering cycle is medium to late, and seed production per plant ranges from medium to high.

4.1.3. Group III

This group comprises three elite genotypes (9, 13, and 12) and is characterized by type 3 plants [11] of low height. The stems have a predominance of tall primary branches, medium thickness, anthocyanin pigmentation, low pubescence intensity in the middle third, and a medium number of nodes. The leaves are lanceolate and mostly medium in length and width, with varying green coloration on the adaxial side (light, medium, and dark). The leaf margins predominantly feature medium-depth incisions and lack pubescence. The achenes are medium brown, with medium spindle length. The flowering cycle is mostly late, and seed production per plant is high.

4.1.4. Group IV

This group includes three elite genotypes (1, 4, and 8) and stands out for its variation in plant type, with one genotype being type IV and the others type III. Plant height varies widely, including short, medium, and tall individuals. The stems have a low number of primary branches, medium thickness, no anthocyanin pigmentation, low pubescence intensity in the middle third, and a prevalent number of nodes. The leaves are lanceolate, mostly long, and medium in width, with light green coloration on the adaxial side. The leaf margins predominantly feature medium-depth incisions and lack pubescence. The achenes are medium brown, with medium spindle length. The flowering cycle is mostly early, and seed production per plant is high.

4.1.5. Common Traits Across Groups

All groups exhibit pubescence in the middle third of the stem, incisions on the leaf margins, white flowers, and seed formation.

5. Conclusions

The application of 17 (>80%) of the 21 morphological descriptors published by the Ministry of Agriculture, Livestock and Supply is efficient for differentiating and analyzing the variability of the 19 elite genotypes.
Among the materials analyzed and based on the results of the genetic distance matrix, genotype 5 is shown to be highly divergent in relation to genotypes 15 and 16, making it a potential genitor in breeding programs aimed at maximizing variability and heterosis in Stevia rebaudiana. The formation of hybrids is a viable strategy, especially considering the ease of vegetative propagation of the species.
In addition, other pairs of genotypes, such as 1 and 3, 5 and 6, and 5 and 11, also have significant genetic distances, which reinforces their potential to form promising crosses in hybridization programs aimed at genetic gain and germplasm diversification
Given the above, based on the morphological characteristics, high genetic variability was observed in the elite genotypes, highlighting the high potential for using these genotypes in Stevia breeding programs to develop genetically superior varieties for cultivation in Cerrado conditions.

Author Contributions

Conceptualization, F.C.d.C., F.G.F. and R.F.A.; methodology, F.G.F. and R.F.A.; software, F.C.d.C.; validation, F.G.F. and R.F.A.; formal analysis, F.C.d.C., F.G.F., R.F.A. and K.C.d.S.S.; investigation, F.C.d.C., F.G.F., R.F.A., J.d.S.O., A.L.d.L., J.V.P.M., A.R.F., K.C.d.S.S., G.B.C.S. and L.P.B.; resources, F.G.F. and R.F.A.; data curation, F.G.F., R.F.A., J.d.S.O., A.L.d.L., J.V.P.M., A.R.F., K.C.d.S.S., G.B.C.S. and L.P.B.; writing—original draft preparation, F.C.d.C.; writing—review and editing, J.d.S.O., A.L.d.L., K.C.d.S.S., G.B.C.S., L.P.B., J.V.P.M. and A.R.F.; visualization, F.C.d.C., F.G.F., R.F.A., J.d.S.O., A.L.d.L., J.V.P.M., A.R.F., K.C.d.S.S., G.B.C.S. and L.P.B.; supervision, F.G.F. and R.F.A.; project administration, K.C.d.S.S., F.G.F. and R.F.A.; funding acquisition, K.C.d.S.S., F.G.F. and R.F.A. All authors have read and agreed to the published version of the manuscript.

Funding

This research was funded by Fundação de Apoio à Pesquisa do Distrito Federal (FAP-DF), grant number 02/2024.

Data Availability Statement

The original contributions presented in the study are included in the article; further inquiries can be directed to the corresponding author.

Acknowledgments

The authors would like to acknowledge the technical support provided by Embrapa Cerrados, which was essential to the success of this research. We would also like to thank FAPDF for the financial support for the publication of the article in the journal. We are grateful to the entire Embrapa Cerrados team for their valuable contributions, expertise and collaboration throughout the study.

Conflicts of Interest

The remaining authors declare that the research was conducted in the absence of any commercial or financial relationships that could be construed as potential conflicts of interest.

References

  1. Wu, X.; Yang, P.; Dai, S.; Wen, Z. Effect of Dietary Stevioside Supplementation on Growth Performance, Nutrient Digestibility, Serum Parameters, and Intestinal Microflora in Broilers. Food Funct. 2019, 10, 2340–2346. [Google Scholar] [CrossRef]
  2. Gunasena, M.; Senarath, R.; Senarath, W. A Review on Chemical Composition, Biosynthesis of Steviol Glycosides, Application, Cultivation, and Phytochemical Screening of Stevia rebaudiana (Bert.) Bertoni. J. Pharm. Res. Int. 2021, 33, 85–104. [Google Scholar] [CrossRef]
  3. GVR Grand View Reserach. Stevia Market Size, Share & Trends Analysis Report By Application (Beverages, Food, Pharmaceutical, Tabletop Sweeteners), By Region (North America, Asia Pacific, Europe, Latin America, Middle East and Africa), and Segment Forecasts, 2024–2030. 2025. Available online: https://www.grandviewresearch.com/industry-analysis/stevia-market (accessed on 9 May 2025).
  4. Cosson, P.; Hastoy, C.; Errazzu, L.E.; Budeger, C.J.; Boutié, P.; Rolin, D.; Schurd-Levraud, V. Genetic diversity and population structure of the sweet leaf herb, Stevia rebaudiana B., cultivated and landraces germplasm assessed by EST-SSRs genotyping and steviol glycosides phenotyping. BMC Plant Biol. 2019, 19, 436. [Google Scholar] [CrossRef]
  5. Tavarini, S.; Passera, B.; Angelini, L.G. Chapter 1: Crop and Steviol Glycoside Improvement in Stevia by Breeding. In Food Chemistry, Function and Analysis; Royal Society of Chemistry: London, UK, 2018; pp. 1–31. [Google Scholar]
  6. Wölwer-Rieck, U. Steviol Glycosides. In Food Chemistry, Function and Analysis; Royal Society of Chemistry: London, UK, 2018; pp. 1–32. [Google Scholar]
  7. Santos, M.G.A. Adaptação da Stevia rebaudiana Bertoni em Modo de Produção Biológico em Ponte de Lima. Master’s Thesis, Instituto Politécnico de Viana do Castelo, Viana do Castelo, Portugal, 2016. [Google Scholar]
  8. Burle, M.L.; Oliveira, M. Manual de Curadores de Germoplasma-Vegetal: Caracterização Morfológica; Embrapa Recursos Genéticos e Biotecnologia Documentos (INFOTECA-E): Brasília, Brazil, 2010. [Google Scholar]
  9. Faleiro, F.G.; da Silva Oliveira, J.; de Jesus, O.N.; da Fonseca, K.G.; Junqueira, N.T.V. Importância da Caracterização dos Recursos Genéticos do Maracujazeiro. In Descritores Morfoagronômicos Ilustrados para Passiflora spp.; Jesus, O.N., Oliveira, E.J., Faleiro, F.G., Soares, T.L., Girardi, E.A., Eds.; Embrapa: Brasília, Brazil, 2016; pp. 8–17. [Google Scholar]
  10. Karimi, M.; Ahmadi, A.; Hashemi, J.; Abbasi, A.; Tavarini, S.; Pompeiano, A.; Angelini, L.G. The Positive Role of Steviol Glycosides in Stevia (Stevia rebaudiana Bertoni) under Drought Stress Condition. Plant Biosyst. 2015, 150, 1323–1331. [Google Scholar] [CrossRef]
  11. MAPA (Ministério da Agricultura, Pecuária e Abastecimento). Proteção de Cultivares, 2019. Available online: http://www.agricultura.gov.br (accessed on 24 March 2019).
  12. Brasil Ministério da Agricultura, Pecuária e Abastecimento. Ato n. 1, de 13 de janeiro de 2009. Diário Oficial da União, Brasília, 16 January 2009. Available online: http://www.agricultura.gov.br/assuntos/insumos-agropecuarios/insumos-agricolas/protecao-de-cultivar/arquivos-medicinais-e-aromaticas/estevia_18dez2008p.doc (accessed on 19 October 2024).
  13. Machado, I.; Ramalho, W.P.; Batista, V.G.; Ferraz, D.; Filho, J.A.F.D. Desvendando as Lacunas de Conhecimento sobre a Anurofauna do Cerrado: Diagnósticos, Diretrizes e Perspectivas. CBH 2019, 2, 105504. [Google Scholar]
  14. Dutra, R.; Souza, M. Cerrado, Revolução Verde e Evolução do Consumo de Agrotóxicos. Soc. Nat. 2022, 29, 473–488. [Google Scholar]
  15. Ferreira, F.; Rodrigues, L.; Silva, F. Performance Evaluation of Climate Models in the Simulation of Precipitation and Average Temperature in the Brazilian Cerrado. Theor. Appl. Climatol. 2024, 155, 845–857. [Google Scholar] [CrossRef]
  16. Castro, F.C.d. Variabilidade Genética, Morfológica e Agronômica e Seleção de Genótipos Elite de Stevia Rebaudiana Visando ao Desenvolvimento de Cultivares Adaptadas para o Cerrado. Dissertação Mestrado em Agronomia, Universidade de Brasília, Brasília-DF, Brazil, 14 February 2020. Available online: http://repositorio.unb.br/handle/10482/38576 (accessed on 14 January 2022).
  17. Renyi, A. On Measures of Entropy and Information. In Fourth Berkeley Symposium; University of California Press: Berkeley, CA, USA, 1960; pp. 547–561. [Google Scholar]
  18. Pillar, V.P. Multivariate Exploratory Analysis and Randomization Testing Using Multiv. Coenoses 1997, 12, 145–148. [Google Scholar]
  19. Cruz, C.D. GENES—A Software Package for Analysis in Experimental Statistics and Quantitative Genetics. Acta Sci. Agron. 2013, 35, 271–276. [Google Scholar] [CrossRef]
  20. Hammer, Ø.; Harper, D. Paleontological Data Analysis, 2nd ed.; Wiley: Hoboken, NJ, USA, 2024. [Google Scholar]
  21. SAS Institute. SAS/STAT User’s Guide, 4th ed.; SAS Institute: Cary, NC, USA, 1989; Volume 6, p. 846. [Google Scholar]
  22. Dziak, J.J.; Li, R.; Wagner, A.T. Weighted TVEM SAS Macro Users’ Guide (Version 2.6); The Methodology Center, Penn State: University Park, PA, USA, 2017. [Google Scholar]
  23. StatSoft Inc. Statistica for Windows [Computer Program Manual]; StatSoft Inc.: Tulsa, OK, USA, 1999. [Google Scholar]
  24. Morgan, G.A.; Barrett, K.C.; Leech, N.L.; Gloeckner, G.W. IBM SPSS for Introductory Statistics: Use and Interpretation; Routledge: New York, NY, USA, 2019. [Google Scholar]
  25. Othman, H.S.; Osman, M.; Zainuddin, Z. Genetic Variabilities of Stevia rebaudiana Bertoni Cultivated in Malaysia as Revealed by Morphological, Chemical and Molecular Characterisations. AGRIVITA J. Agric. Sci. 2018, 40, 267–283. [Google Scholar] [CrossRef]
  26. Yadav, A.K.; Singh, S.; Dhyani, D.; Ahuja, P.S. A Review on the Improvement of Stevia [Stevia rebaudiana (Bertoni)]. Can. J. Plant Sci. 2011, 91, 1–27. [Google Scholar] [CrossRef]
  27. Haida, Z.; Asikin, A.; Hakiman, M. Health Benefits of Stevia rebaudiana Bertoni as Zero Calorie Natural Sweetener: A Review. Int. Food Res. J. 2020, 27, 783–789. [Google Scholar]
  28. Monteiro, R. Taxonomia e Biologia da Reprodução de Stevia Rebaudiana (Bert.) Bertoni; Dissertação (Mestrado), Universidade Estadual de Campinas, Campinas, 1980. Available online: https://repositorio.unicamp.br/Acervo/Detalhe/48636 (accessed on 2 January 2025).
  29. Meza, B.E.; Peralta, J.M. Moisture Sorption Isotherms of Reduced-Sugar Confectionery Coatings Elaborated with Stevia: Mathematical Modeling and Thermodynamic Analysis. Food Process. Eng. 2023, 46, e14402. [Google Scholar] [CrossRef]
  30. De Souza, L.M.; Barbosa, M.R.; Nascimento, K.; Fonseca, P.; Houllou, L. Cultivo Fotoautotrófico e Fotomixotrófico de Plantas In Vitro: Uma Revisão Sistemática sobre o Uso da Técnica e Suas Implicações na Produção de Mudas de Espécies Arbóreas. Multidiscip. Sci. Rep. 2023, 3, 1–20. [Google Scholar] [CrossRef]
  31. Oliveira, V.M.; Forni-Martins, E.R.; Magalhães, P.M.; Alves, M.N. Chromosomal and morphological studies of diploid and polyploid cytotypes of Stevia rebaudiana (Bertoni) Bertoni (Eupatorieae, Asteraceae). Genet. Mol. Biol. 2004, 27, 215–222. [Google Scholar] [CrossRef]
  32. Vieira, E.A.; de Freitas Fialho, J.; Silva, M.S.; Fukuda, W.M.G.; Faleiro, F.G. Variabilidade Genética do Banco de Germoplasma de Mandioca da Embrapa Cerrados Acessada por Meio de Descritores Morfológicos. Científica 2009, 36, 56–67. [Google Scholar]
  33. Ogbonna, A.C.; de Andrade, L.R.B.; Mueller, L.A.; de Oliveira, E.J.; Bauchet, G.J. Comprehensive Genotyping of a Brazilian Cassava (Manihot esculenta Crantz) Germplasm Bank: Insights into Diversification and Domestication. Theor. Appl. Genet. 2021, 134, 1343–1362. [Google Scholar] [CrossRef]
  34. Mahdi, S.A.; Meena, C.M.; Tholakabavi, A. Induction of Genetic Variability by Colchicine Treatment in Stevia rebaudiana Bertoni. Al-Qadisiyah J. Pure Sci. 2018, 23, 161. [Google Scholar]
  35. Miyagawa, H.; Fujioka, N.; Kohda, H.; Yamasaki, K.; Taniguchi, K.; Tanaka, R. Studies on the Tissue Culture of Stevia rebaudiana and Its Components; (II) 1. Induction of Shoot Primordia. Planta Med. 1986, 52, 321–323. [Google Scholar] [CrossRef]
  36. Benelli, G.; Canale, A.; Romano, D.; Flamini, G. Flower Scent Bouquet Variation and Bee Pollinator Visits in Stevia rebaudiana Bertoni (Asteraceae), a Source of Natural Sweeteners. Arthropod-Plant Interact. 2017, 11, 381–388. [Google Scholar] [CrossRef]
  37. Masand, M.; Sharma, S.; Kumari, S.; Pal, P.; Majeed, A.; Singh, G.; Sharma, R.M. High-Quality Haplotype-Resolved Chromosome Assembly Provides Evolutionary Insights and Targeted Steviol Glycosides (SGs) Biosynthesis in Stevia rebaudiana Bertoni. Plant Biotechnol. J. 2024, 22, 3262–3277. [Google Scholar] [CrossRef] [PubMed]
Figure 1. A two-dimensional graph of the data matrix, using a color scale with heat map representation, projecting an overview of the variability of the 19 genotypes through their evaluated characteristics and phenotypic classes according to Table 2. The x-axis indicates the 21 descriptors evaluated (Table 2), while the y-axis lists the 19 elite Stevia genotypes’ numbers corresponding to those presented in Table 1. The colors of the square “boxes” specify the phenotypic classes of each characteristic among the genotypes on a scale of 1 to 8. Embrapa Cerrados, Planaltina, DF, 2019.
Agronomy 15 01836 g001
Figure 2. A two-dimensional graph of the distance matrix, using a color scale with heat map representation, projects an overview of the distance of the 19 genotypes according to Table 3. The colors of the square “boxes” specify the distance matrix with a rating from 0.14 to 0.67. The genotype numbers correspond to those presented in Table 1. Embrapa Cerrados, Planaltina, DF, 2019.
Agronomy 15 01836 g002
Figure 3. Cluster analysis of 19 elite genotypes of Stevia rebaudiana Bertoni, based on the genetic dissimilarity matrix calculated using 21 qualitative descriptors recommended by the SNPC-MAPA. The UPGMA method was used as the grouping criterion. The value of the Cohen correlation coefficient (r) was 0.87. The genotype numbers correspond to those presented in Table 1. Embrapa Cerrados, Planaltina, DF, 2019.
Agronomy 15 01836 g003
Figure 4. Dispersion analysis of 19 Stevia rebaudiana Bertoni genotypes. The principal coordinate method was used. The genotype numbers correspond to those presented in Table 1. Embrapa Cerrados, Planaltina, DF, 2019.
Agronomy 15 01836 g004
Table 1. Description of the 19 elite Stevia rebaudiana (Bert.) Bertoni genotypes characterized: Embrapa Cerrados, Planaltina, DF, 2019.
LocalGenotypesCode
LA1111
LA2213
LA333016
LA441102
LA557
LA663002
LA773015
LA88CPAC1
LA99CPAC2
LA1010CPAC3
LB1113004
LB3123024
LB4133 _ 12
LB5143 _ 25
LB61512
LB7161
LB8173 = 6
LB918CPAC4
LB1019CPAC5
Local: this represents the place where each 60 L pot was positioned in the area. Genotype: ordinal number. Code: code of each genotype analyzed.
Table 2. Characteristics evaluated, description of the characteristics, description code of the morphoagronomic descriptors (phenotypic classes) with their respective frequencies, and the entropy coefficient of the characteristics (H), considering 19 elite genotypes of Stevia rebaudiana Bertoni Embrapa Cerrados, Planaltina, DF, 2019.
FeaturesFeature DescriptionDescription CodeFrequency (%)Entropy (H)
1. Floor plan: type (TP) VS (+)type I1-0.20
type II2-
type III394.74%
type IV45.26%
type V5-
type VI6-
2. Plant: height (AP) MSlow (<40 cm)331.58%0.99
medium (40–50 cm)552.63%
high (> 50 cm)715.79%
3. Stem: number of primary branches (QRP) MS (+)very low (<3)35.26%1.44
low (3)431.58%
average (4 to 7)510.53%
high (8)631.58
very high (>8)821.05
4. Stem: thickness (diameter at average height of main stem) (ESPC) DM (+)thin (<0.20 cm)315.79%0.63
medium (0.20 to 0.35 cm)578.95%
thick (>0.35 cm)75.26%
5. Stem: anthocyanin pigmentation (PAC) VS/VGabsent163.16%0.65
present236.84%
6. Stem: pubescence (in the middle third) (PUBC) VSabsent1-0.00
present2100%
7. Stem: intensity of pubescence (IPC) (in the middle third) VSlow368.42%0.62
average531.58%
high7-
8. Stem: number of nodes on the main stem (NNCP) MSfew (<6)35.26%0.70
medium (6 to 9)573.68%
many (>9)721.05%
9. Leaf: shape (FFOL) VS (+)elliptical1-0.33
rhomboid2-
obovada310.53%
oval4-
lanceolate589.47%
10. Leaf: length (COMPF) MSshort (<4.0 cm)342.11%1.07
medium (4.0 to 5.0 cm)531.58%
long (>5.0 cm)726.32%
11. Leaf: width (LFOL) MSnarrow (<1.0 cm)3-0.65
medium (1.0 cm to 1.5 cm)563.16%
wide (>1.5 cm)736.84%
12. Leaf: intensity of green coloration (adaxial part) (ICVF) VG (+)clear342.11%1.01
average542.11%
dark715.79%
13. Leaf: incisions on the margin (IMF) VSabsent1-0.00
gifts2100%
14. Leaf: depth of incisions at the margin (PIMF) VSshallow310.53%0.33
average589.47%
deep7-
15. Leaf: pubescence (PUBFOL) VSabsent152.63%0.69
present247.37%
16. Flower: coloration (in the center of the corolla) (CFLR) VSwhite1100%0.00
light reddish purple3-
dark reddish purple5
17. Aquenium: intensity of brown coloration (ICMA) VS/VGclear147.37%0.69
average252.63%
dark3-
18. Aquenium: spindle length (CFA) VS (+)very short25.26%1.11
short336.84%
medium547.37%
long710.53%
19. Flowering cycle (when at least 50% of the plants have at least one flower) (CF50) MG/MSearly347.37%1.04
medium531.58%
late721.05%
20. Seeds: formation (FORS) VSabsent1-0.00
present2100%
21. Seeds: number of seeds per plant (QSPL) MSlow3-0.51
average521.05%
high778.95%
Table 3. Matrix of distances between 19 genotypes of Stevia rebaudiana Bertoni, calculated using the complement of the simple coincidence index based on 21 descriptors recommended by the NSPC-MAPA. The genotype numbers correspond to those presented in Table 1. Embrapa Cerrados, Planaltina, DF, 2019.
GenotypesAgronomy 15 01836 i001Agronomy 15 01836 i002Agronomy 15 01836 i003Agronomy 15 01836 i004Agronomy 15 01836 i005Agronomy 15 01836 i006Agronomy 15 01836 i007Agronomy 15 01836 i008Agronomy 15 01836 i009Agronomy 15 01836 i010Agronomy 15 01836 i011Agronomy 15 01836 i012Agronomy 15 01836 i013Agronomy 15 01836 i014Agronomy 15 01836 i015Agronomy 15 01836 i016Agronomy 15 01836 i017Agronomy 15 01836 i018
Agronomy 15 01836 i0190.430.620.330.570.380.430.330.330.570.380.520.380.330.330.430.330.380.43
Agronomy 15 01836 i020 0.240.480.240.480.290.330.330.380.480.290.380.570.520.520.290.480.33
Agronomy 15 01836 i021 0.430.330.480.330.430.480.140.480.330.430.520.570.480.290.430.38
Agronomy 15 01836 i022 0.480.430.290.240.430.380.290.520.430.290.480.290.240.290.33
Agronomy 15 01836 i023 0.620.380.290.430.430.620.380.480.570.670.670.480.520.24
Agronomy 15 01836 i024 0.380.480.430.430.330.480.520.380.290.430.290.430.38
Agronomy 15 01836 i025 0.290.380.240.380.480.330.430.520.430.240.290.29
Agronomy 15 01836 i026 0.430.430.480.520.290.330.480.520.430.330.43
Agronomy 15 01836 i027 0.380.430.380.290.520.330.430.380.430.29
Agronomy 15 01836 i028 0.380.380.290.430.480.480.290.430.33
Agronomy 15 01836 i029 0.480.380.240.330.240.190.240.38
Agronomy 15 01836 i030 0.330.430.330.480.480.430.38
Agronomy 15 01836 i031 0.380.290.430.480.330.43
Agronomy 15 01836 i032 0.240.330.330.290.52
Agronomy 15 01836 i033 0.290.430.330.48
Agronomy 15 01836 i034 0.240.240.43
Agronomy 15 01836 i035 0.290.24
Agronomy 15 01836 i036 0.38
Disclaimer/Publisher’s Note: The statements, opinions and data contained in all publications are solely those of the individual author(s) and contributor(s) and not of MDPI and/or the editor(s). MDPI and/or the editor(s) disclaim responsibility for any injury to people or property resulting from any ideas, methods, instructions or products referred to in the content.

