
Comparison of Soil Organic Carbon Measurement Methods

 ,
,  , , ,
, , , 
Abstract
1. Introduction
2. Materials and Methods
2.1. Field Data
2.2. Soil Sampling and Preparation
2.3. Near Infrared Spectroscopy (NIRS) Method
2.4. Dumas Method
2.5. Loss-on-Ignition (LOI) Method
2.6. Statistical Analysis
3. Results
4. Discussion
4.1. Estimates of SOC
4.2. Measurement Methods of SOC
4.3. Sample Size and Land Types of Soil Samples
4.4. Recommendations on Alternative Method for SOC Measurement
5. Conclusions
Author Contributions
Funding
Data Availability Statement
Acknowledgments
Conflicts of Interest
Abbreviations
| SOC | Soil organic carbon |
| LOI | Loss-on-ignition |
| Dumas | Automated high temperature dry combustion |
| NIRS | Real-time near-infrared spectroscopy |
| r | Pearson correlation coefficient |
| % | Percentage |
| SOM | Soil organic matter |
| WB | Walkley-Black |
| pH | Potential of hydrogen |
| n | Number of collected and analysed soil samples |
| Cr | Chromium |
| CO2 | Carbon dioxide |
| ha | Hectares |
| mm | Millimetres |
| MAFF | Ministry of Agriculture, Fisheries and Food |
| cm | Centimetres |
| °C | Degree Celsius |
| nm | Nanometres |
| µg | Micrograms |
| g | Grams |
| Al2O3 | Aluminium oxide |
| Cu2O | Copper oxide |
| SIC | Soil inorganic carbon |
| HCI | Hydrochloric acid |
| mL | Millilitres |
| Yijk | Dependent variable of percentage soil organic carbon |
| Mi | Fixed effect of method |
| i | LOI, NIRS and Dumas |
| LTj | Fixed effect of land type |
| j | Arable, temporary ley or permanent grass |
| Fk | Random effect of farm |
| k | Farms A to E |
| eijk | Random error term |
| P | Probability |
| S.E. | Standard error for each mean |
| HM | Humic matter colorimetry |
| H2SO3 | Sulfurous acid (sulfuric (IV) acid) |
| NA | Not applicable |
References
- Wotherspoon, A.; Voroney, R.P.; Thevathasan, N.V.; Gordon, A.M. Comparison of Three Methods for Measurement of Soil Organic Carbon. Commun. Soil Sci. Plant Anal. 2015, 46, 362–374. [Google Scholar] [CrossRef]
- van der Voort, T.S.; Verweij, S.; Fujita, Y.; Ros, G.H. Enabling soil carbon farming: Presentation of a robust, affordable, and scalable method for soil carbon stock assessment. Agron. Sustain. Dev. 2023, 43, 22. [Google Scholar] [CrossRef]
- Bell, M.J.; Mereu, L.; Davis, J. The Use of Mobile Near-Infrared Spectroscopy for Real-Time Pasture Management. Front. Sustain. Food Syst. 2018, 2, 76. [Google Scholar] [CrossRef]
- MacLaren, C.; Mead, A.; van Balen, D.; Claessens, L.; Etana, A.; de Haan, J.; Haagsma, W.; Jäck, O.; Keller, T.; Labuschagne, J.; et al. Long-term evidence for ecological intensification as a pathway to sustainable agriculture. Nat. Sustain. 2022, 5, 770–779. [Google Scholar] [CrossRef]
- El Mouridi, Z.; Ziri, R.; Douaik, A.; Bennani, S.; Lembaid, I.; Bouharou, L.; Brahadda, B.; Moussadek, R. Comparison between Walkley-Black and Loss on Ignition Methods for Organic Matter Estimation in Different Moroccan Soils. Ecol. Eng. Environ. Technol. 2023, 24, 253–259. [Google Scholar] [CrossRef]
- Maxwell, G.S. Mangroves are assets to the many but a curse to the few—Polarised perceptions in New Zealand. ISME/GLOMIS Electron. J. 2018, 16, 19–24. Available online: https://glomis.com/ej/pdf/EJ_16-4.pdf (accessed on 11 November 2022).
- Nave, L.E.; Gough, C.M.; Clay, C.; Santos, F.; Atkins, J.W.; Benjamins-Carey, S.E.; Bohrer, G.; Castillo, B.T.; Fahey, R.T.; Hardiman, B.S.; et al. Carbon cycling across ecosystem succession in a north temperate forest: Controls and management implications. Ecol. Appl. 2025, 35, e70001. [Google Scholar] [CrossRef]
- Santasup, N.; Theanjumpol, P.; Santasup, C.; Kittiwachana, S.; Mawan, N.; Prantong, L.; Khongdee, N. Development of near-infrared spectroscopy (NIRS) for estimating organic matter, total carbon, and total nitrogen in agricultural soil. MethodsX 2024, 13, 102798. [Google Scholar] [CrossRef]
- Hernández, T.D.B.; Slater, B.K.; Shaffer, J.M.; Basta, N. Comparison of methods for determining organic carbon content of urban soils in Central Ohio. Geoderma Reg. 2023, 34, e00680. [Google Scholar] [CrossRef]
- Chatterjee, A.; Lal, R.; Wielopolski, L.; Martin, M.Z.; Ebinger, M.H. Evaluation of Different Soil Carbon Determination Methods. Crit. Rev. Plant Sci. 2009, 28, 164–178. [Google Scholar] [CrossRef]
- Sleutel, S.; De Neve, S.; Singier, B.; Hofman, G. Quantification of Organic Carbon in Soils: A Comparison of Methodologies and Assessment of the Carbon Content of Organic Matter. Commun. Soil Sci. Plant Anal. 2007, 38, 2647–2657. [Google Scholar] [CrossRef]
- Roper, W.R.; Robarge, W.P.; Osmond, D.L.; Heitman, O.J. Comparing Four Methods of Measuring Soil Organic Matter in North Carolina Soils. Soil Sci. Soc. Am. J. 2019, 83, 466–474. [Google Scholar] [CrossRef]
- Wang, X.; Wang, J.; Zhang, J. Comparisons of three methods for organic and inorganic carbon in calcareous soils of northwestern China. PLoS ONE 2012, 7, e44334. [Google Scholar] [CrossRef]
- Salehi, M.H.; Hashemi-Beni, O.; Beigi-Harchegani, H.; Esfandiarpour-Borujeni, I.; Motaghian, H.R. Refining soil organic matter determination by loss-on-ignition. Pedosphere 2011, 21, 473–482. [Google Scholar] [CrossRef]
- Bojko, C.; Kabała, C. Loss-On-Ignition as an estimate of Total Organic Carbon in the mountain soils. Pol. J. Soil Sci. 2014, 47, 71–79. Available online: https://www.reshistorica.journals.umcs.pl/pjss/article/view/519 (accessed on 30 November 2024).
- Ng, W.; Darmawan, H.; Anggria, L.; Siregar, A.F.; Hartatik, W.; Sulaeman, Y.; Jones, E.; Minasny, B. Developing a soil spectral library using a low-cost NIR spectrometer for precision fertilization in Indonesia. Geoderma Reg. 2020, 22, e00319. [Google Scholar] [CrossRef]
- Feeney, C.J.; Robinson, D.A.; Keith, A.M.; Vigier, A.; Bentley, L.; Smith, R.P.; Garbutt, A.; Maskell, L.C.; Norton, L.; Wood, C.M.; et al. Development of soil health benchmarks for managed and semi-natural landscapes. Sci. Total Environ. 2023, 886, 163973. [Google Scholar] [CrossRef]
- Ministry of Agriculture, Fisheries and Food (MAFF). Agricultural Land Classification of England and Wales: Revised Guidelines and Criteria for Grading the Quality of Agricultural Land (ALC011). In Natural England; Ministry of Agriculture, Fisheries and Food (MAFF): London, UK, 1988. Available online: https://webarchive.nationalarchives.gov.uk/ukgwa/20130402151656/http%3A/archive.defra.gov.uk/foodfarm/landmanage/land-use/documents/alc-guidelines-1988.pdf (accessed on 23 November 2023).
- Toupet, R.; Gibbons, A.T.; Goodacre, S.L.; Bell, M.J. Effect of Herbage Density, Height and Age on Nutrient and Invertebrate Generalist Predator Abundance in Permanent and Temporary Pastures. Land 2020, 9, 164. [Google Scholar] [CrossRef]
- Kok, M.; Sarjant, S.; Verweij, S.; Vaessen, S.F.C.; Ros, G.H. On-site soil analysis: A novel approach combining NIR spectroscopy, remote sensing and deep learning. Geoderma 2024, 446, 116903. [Google Scholar] [CrossRef]
- Yang, L.; Qi, F.; Zhu, A.; Shi, J.; An, Y. Evaluation of Integrative Hierarchical Stepwise Sampling for Digital Soil Mapping. Soil Sci. Soc. Am. J. 2016, 80, 637–651. [Google Scholar] [CrossRef]
- Elementar Enviro TOC Analyzer Analytical Specifications. Available online: https://www.elementar.com/en/products/toc-analyzers/enviro-toc (accessed on 30 November 2024).
- Yagi, M.; Managi, S. Soil organic carbon credits from turf and clover planting beneath solar panels. Environ. Chall. 2025, 19, 101153. [Google Scholar] [CrossRef]
- Cargua Catagña, F.E.; Rodríguez Llerena, M.V.; Damián Carrión, D.A.; Recalde Moreno, C.G.; Santillán Lima, G.P. Analytical methods comparison for soil organic carbon determination in Andean Forest of Sangay National Park-Ecuador. Acta Agron. 2017, 66, 408–413. [Google Scholar] [CrossRef]
- Mozaffari, H.; Moosavi, A.A.; Cornelis, W. Vis-NIR-spectroscopy- and loss-on-ignition-based functions to estimate organic matter content of calcareous soils. Arch. Agron. Soil Sci. 2022, 69, 962–980. [Google Scholar] [CrossRef]
- Hoogsteen, M.J.J.; Lantinga, E.A.; Bakker, E.J.; Groot, J.C.; Tittonell, P.A. Estimating soil organic carbon through loss on ignition: Effects of ignition conditions and structural water loss. Eur. J. Soil Sci. 2015, 66, 320–328. [Google Scholar] [CrossRef]
- Farmer, J.; Matthews, R.; Smith, P.; Langan, C.; Hergoualc’h, K.; Verchot, L.; Smith, J.U. Comparison of methods for quantifying soil carbon in tropical peats. Geoderma 2014, 214–215, 177–183. [Google Scholar] [CrossRef]
- Foster, E.J.; Yeasmin, S.; Zuniga, L.; Brecheisen, Z.; Tomasek, A.; Castañeda, M.E.J.; Leon-Salas, W.D.; Bolívar, J.A.L.; Schulze, D.G.; Villalta Soto, M.J.C.; et al. Establishing Visible–Near Infrared Spectroscopy for the Prediction of Soil Organic Carbon in Arid Croplands of Arequipa, Peru. Commun. Soil Sci. Plant Anal. 2025, 56, 1908–1929. [Google Scholar] [CrossRef]
- Pribyl, D.W. A critical review of the conventional SOC to SOM conversion factor. Geoderma 2010, 156, 75–83. [Google Scholar] [CrossRef]
- Stuth, J.; Jama, A.; Tolleson, D. Direct and indirect means of predicting forage quality through near infrared reflectance spectroscopy. Field Crops Res. 2003, 84, 45–56. [Google Scholar] [CrossRef]
- da Paz, C.C.; e Silva, A.G.M.; do Rêgo, A.C. Use of near infrared spectroscopy for the evaluation of forage for ruminants. Amazon. J. Agric. Environ. Sci. 2019, 62. Available online: https://www.periodicos.capes.gov.br/index.php/acervo/buscador.html?task=detalhes&source=all&id=W2922473324 (accessed on 30 November 2024).
- Piccini, C.; Metzger, K.; Debaene, G.; Stenberg, B.; Götzinger, S.; Borůvka, L.; Sandén, T.; Bragazza, L.; Liebisch, F. In-field soil spectroscopy in Vis–NIR range for fast and reliable soil analysis: A review. Eur. J. Soil Sci. 2024, 75, e13481. [Google Scholar] [CrossRef]
- Wetterlind, J.; Stenberg, B.; Rossel, R.A.V. Soil analysis using visible and near infrared spectroscopy. Methods Mol. Biol. 2013, 953, 95–107. [Google Scholar] [PubMed]
- Dexter, A.R.; Richard, G.; Arrouays, D.; Czyż, E.A.; Jolivet, C.; Duval, O. Complexed organic matter controls soil physical properties. Geoderma 2008, 144, 620–627. [Google Scholar] [CrossRef]
- Poeplau, C.; Don, A. A simple soil organic carbon level metric beyond the organic carbon-to-clay ratio. Soil Use Manag. 2023, 39, 1057–1067. [Google Scholar] [CrossRef]

| Location | Land Type | n * | pH ** | Soil Type [17] | Soil Texture [17] | Description [17] |
|---|---|---|---|---|---|---|
| Hartpury | Arable | 7 | 6.7 | Luvisol | Clayey sandy loams | Slightly acid loams ≥ 15% clay with impeded drainage |
| Temporary ley | 24 | 6.8 | ||||
| Permanent grass | 16 | 6.7 | ||||
| Cotswolds | Arable | 16 | 7.6 | Leptosol | Calcareous loams | Shallow and limestone or chalk-like soils ≥ 25% clay with freely draining |
| Temporary ley | 16 | 7.7 | ||||
| Permanent grass | 16 | 7.5 |
| Effect | Mean (%) | S.E. ** | |
|---|---|---|---|
| Land type * | Arable | 4.6 a | ±0.390 |
| Temporary ley | 4.5 a | ±0.379 | |
| Permanent grass | 6.6 b | ±0.375 | |
| p value | <0.001 | ||
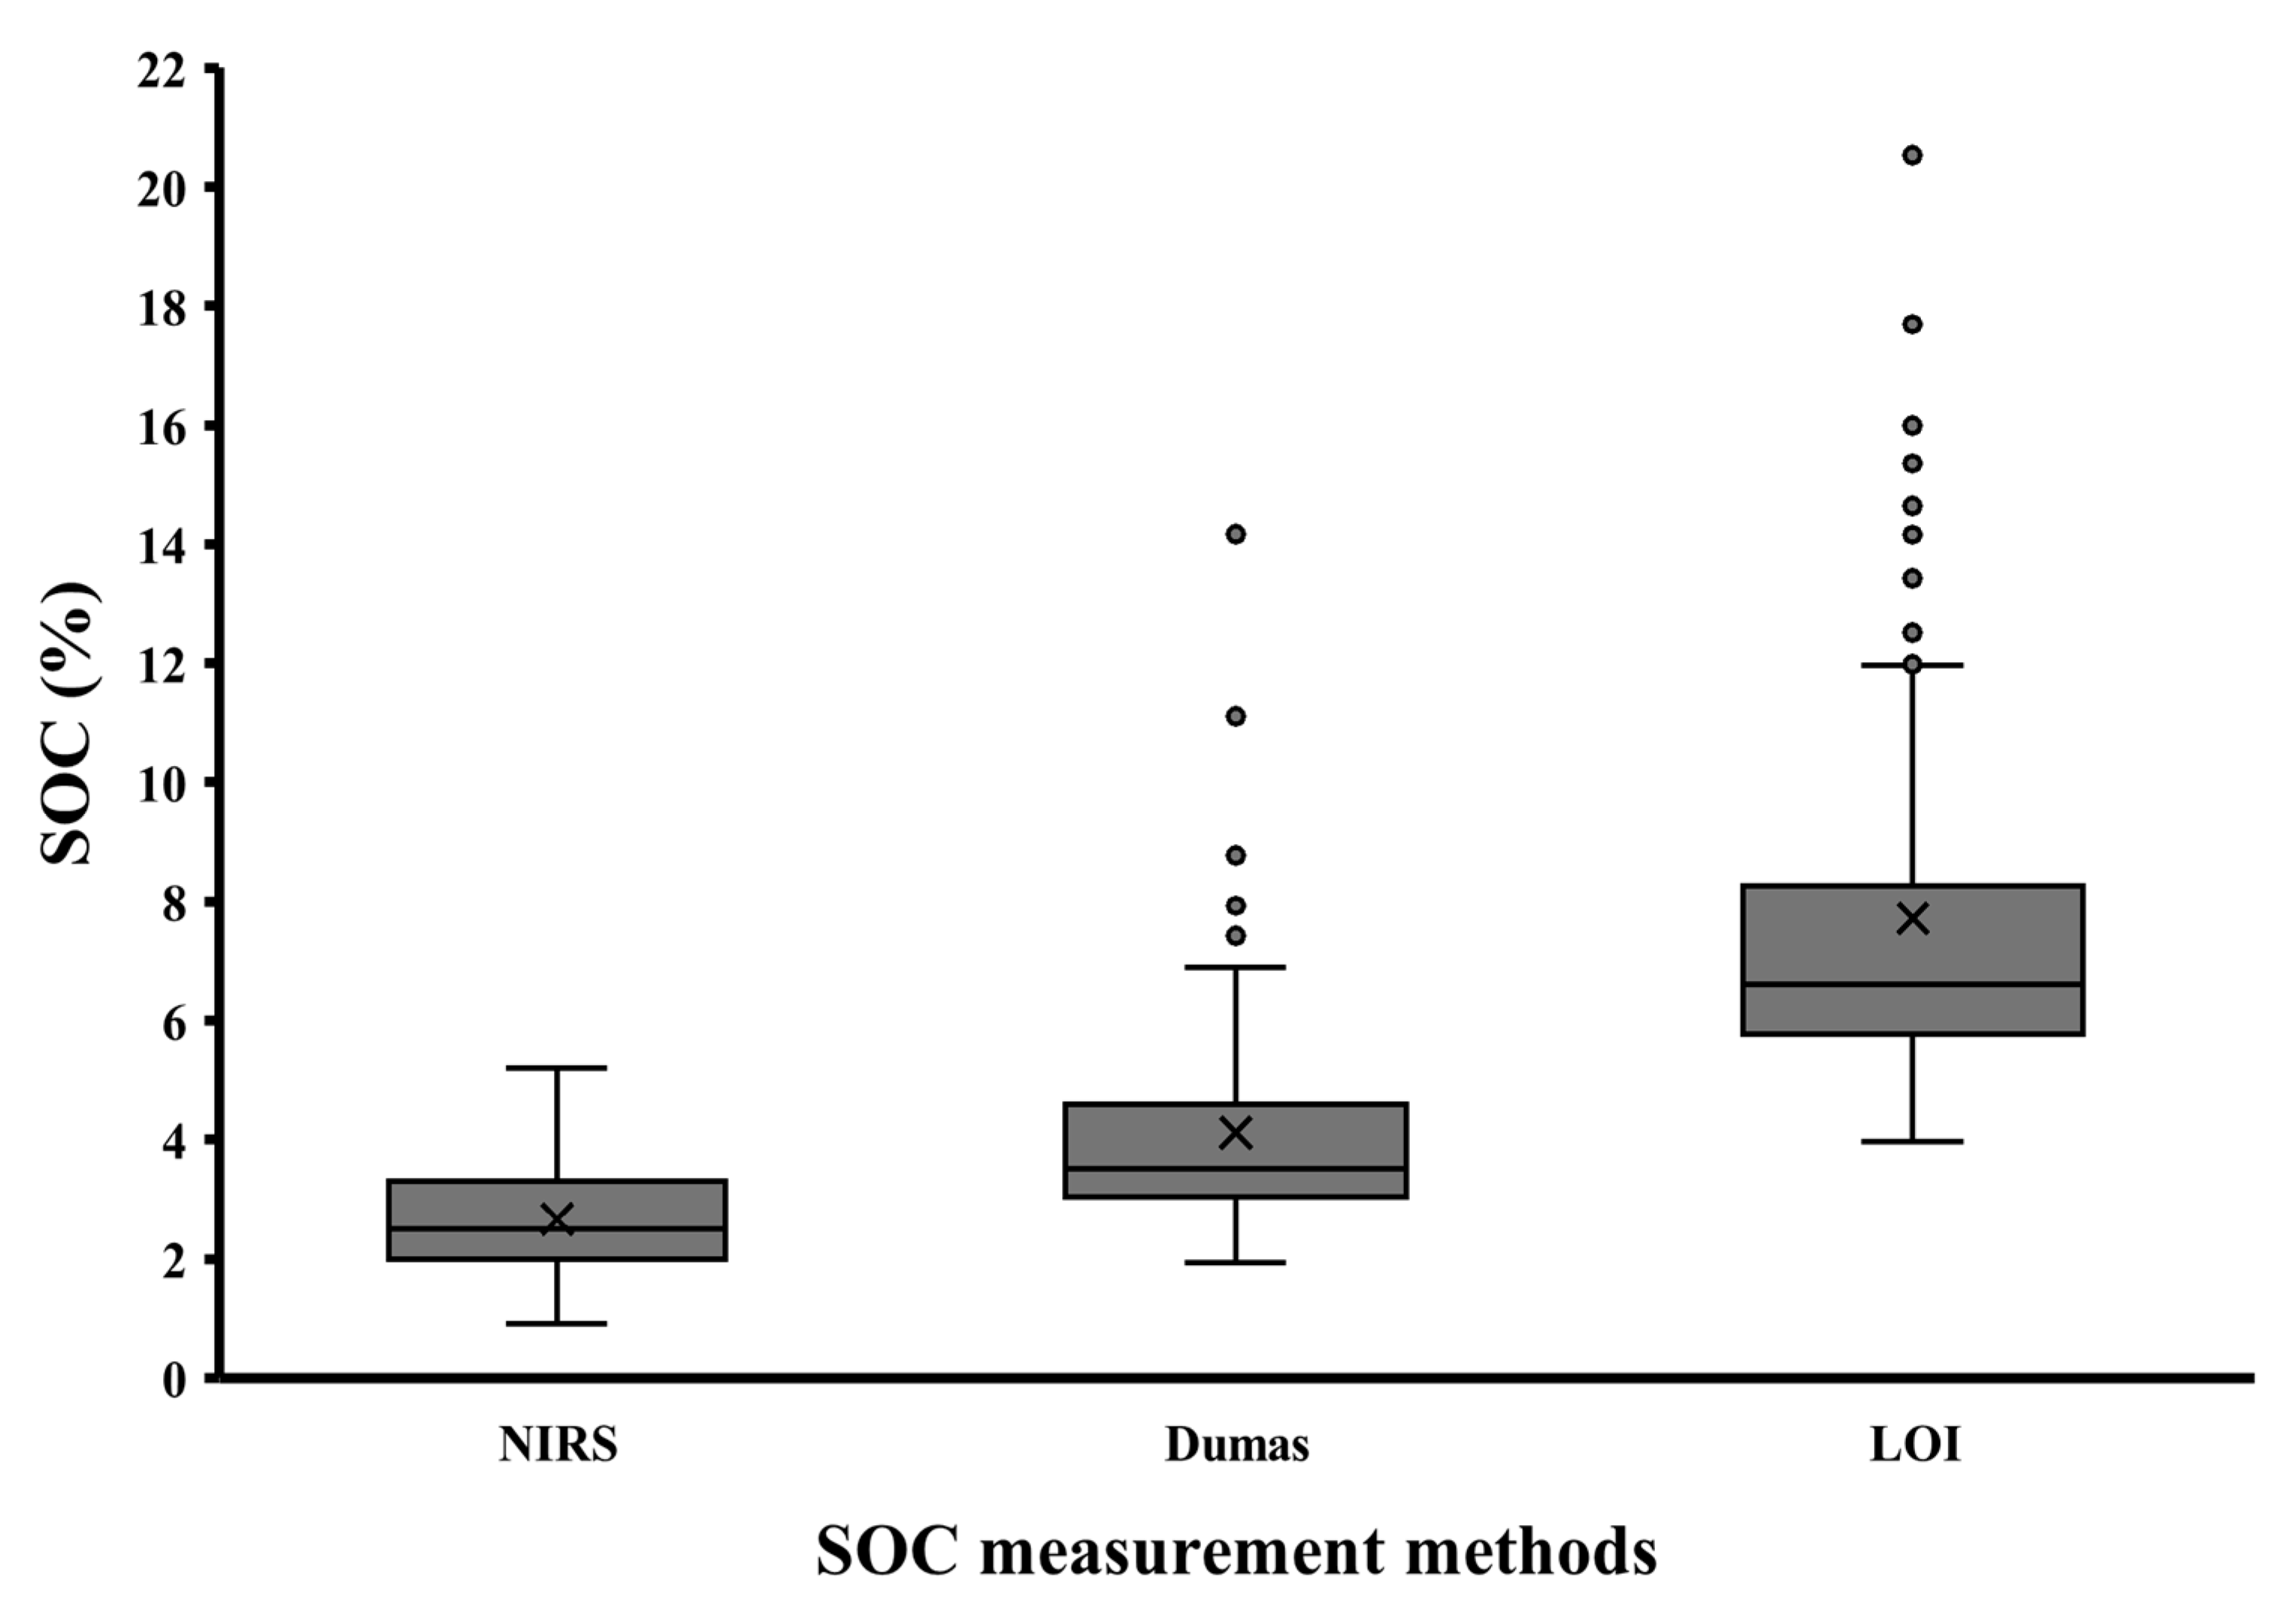
| Method | LOI | 8.1 a | ±0.380 |
| NIRS | 3.1 b | ±0.380 | |
| Dumas | 4.6 c | ±0.380 | |
| p value | <0.001 | ||
| Land type × method | |||
| Arable | LOI | 6.8 a | ±0.483 |
| NIRS | 3.1 b | ±0.483 | |
| Dumas | 4.0 bc | ±0.483 | |
| Temporary ley | LOI | 6.9 a | ±0.433 |
| NIRS | 2.8 b | ±0.433 | |
| Dumas | 3.8 c | ±0.433 | |
| Permanent grass | LOI | 10.6 a | ±0.450 |
| NIRS | 3.4 b | ±0.450 | |
| Dumas | 5.9 c | ±0.450 | |
| p value | <0.001 | ||
| Method Comparison | n * | Land Type | Regression Equations | p Value |
|---|---|---|---|---|
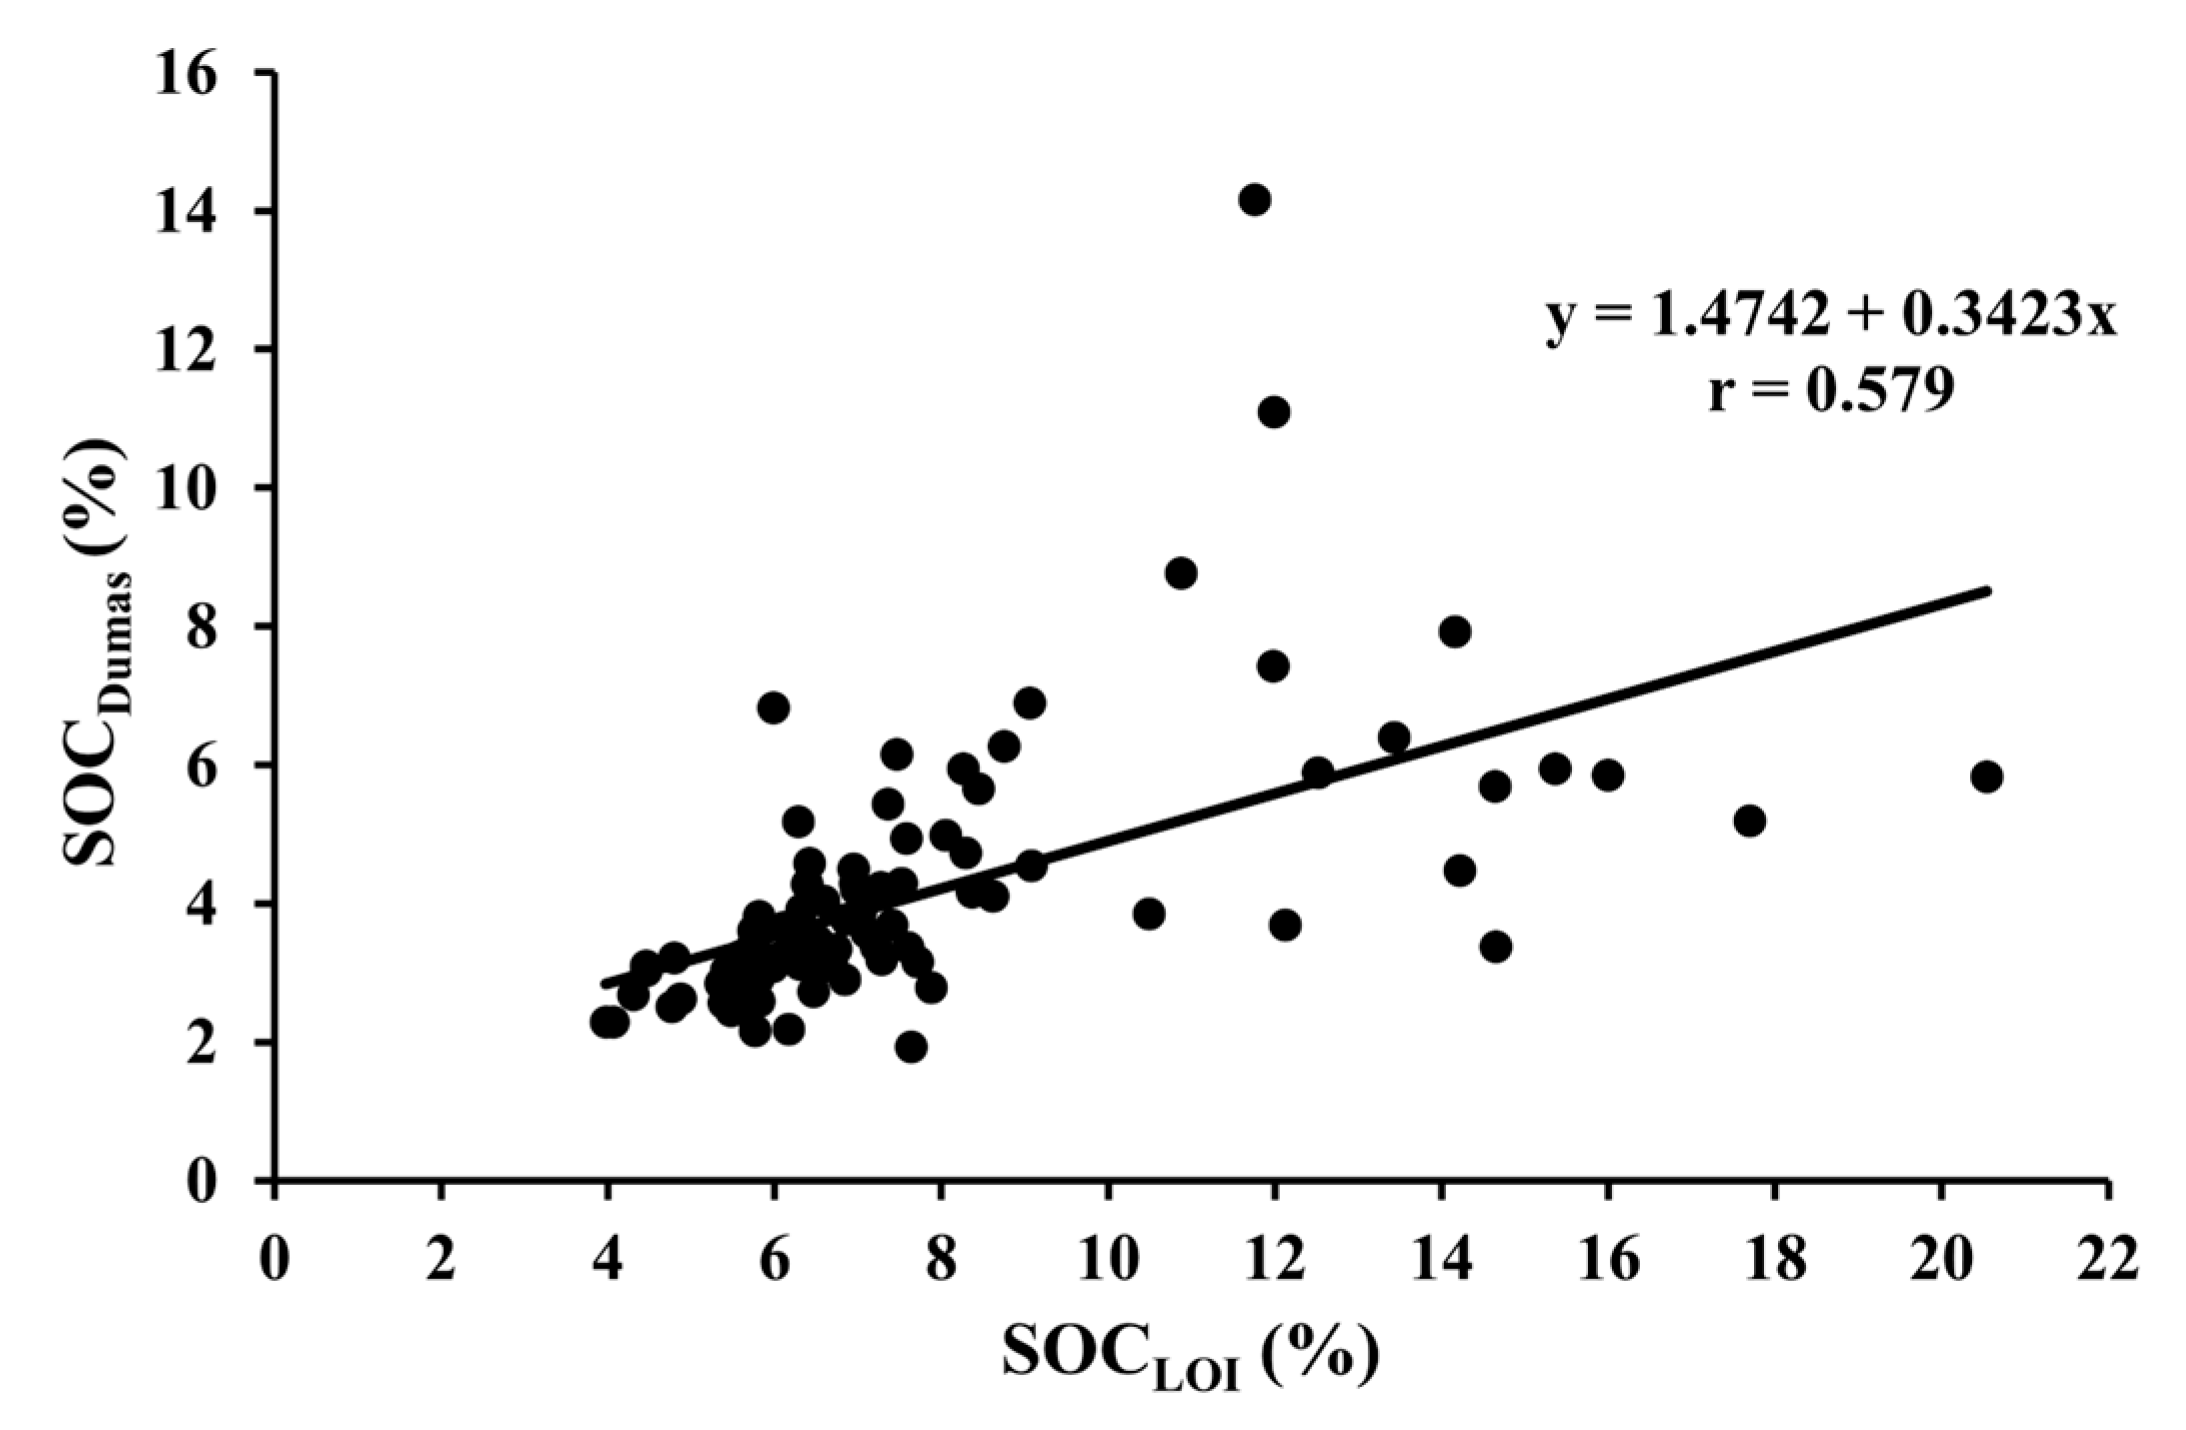
| SOCDumas vs. SOCLOI | 95 | All fields | Y = 1.4742 + 0.3423x | <0.001 |
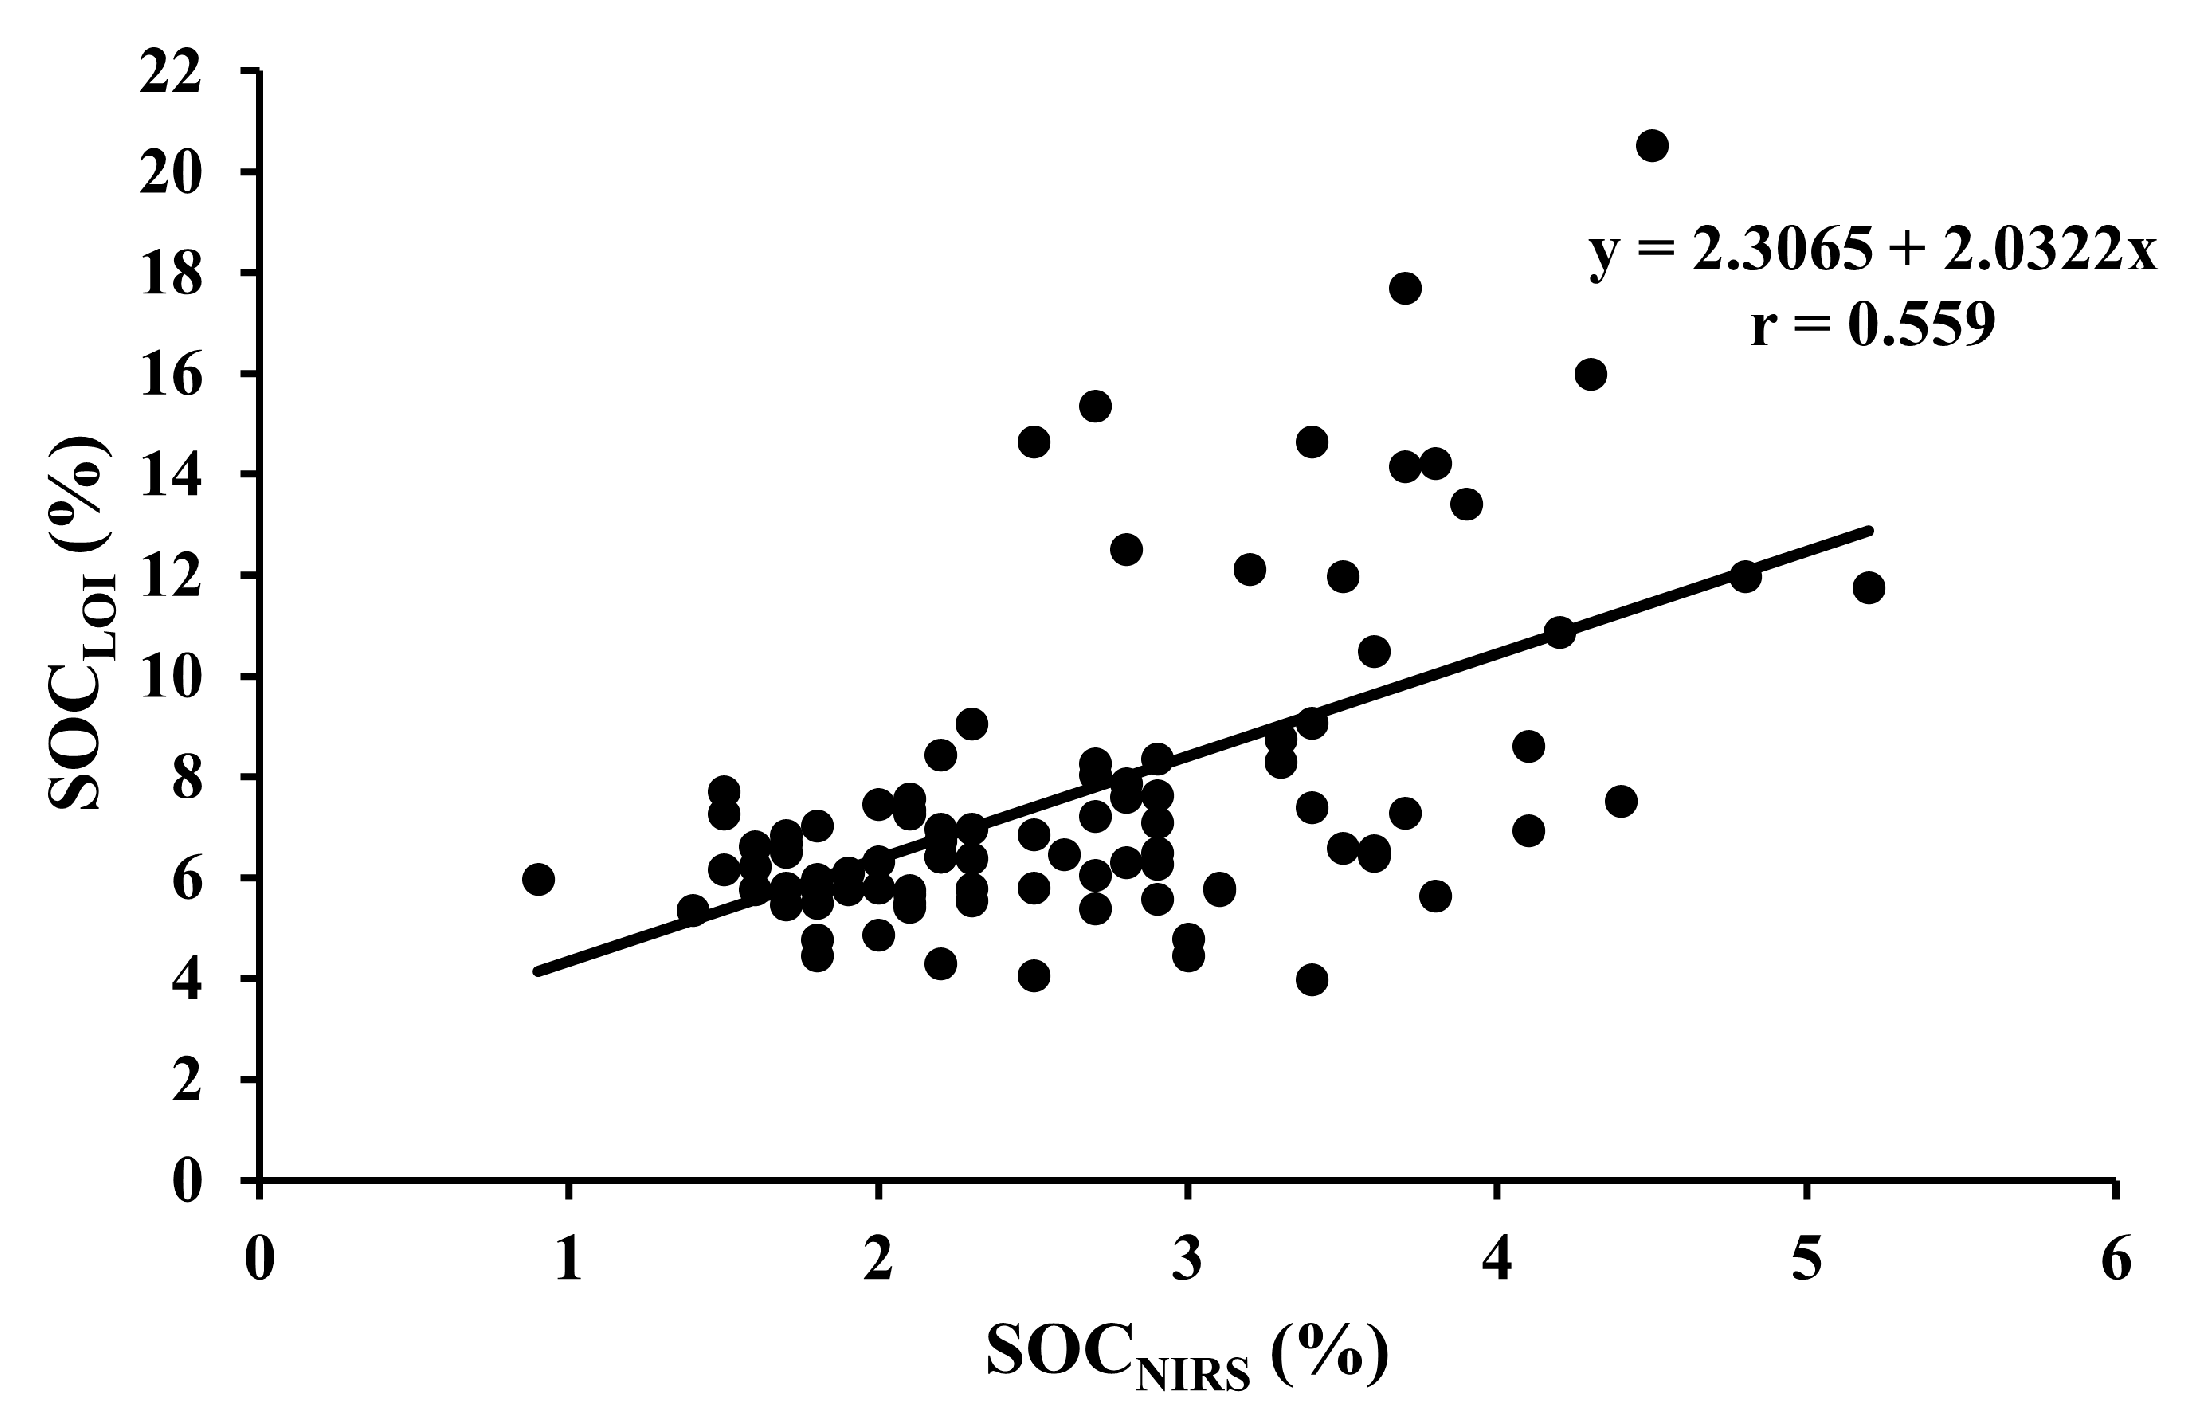
| SOCLOI vs. SOCNIRS | 95 | All fields | Y = 2.3065 + 2.0322x | <0.001 |
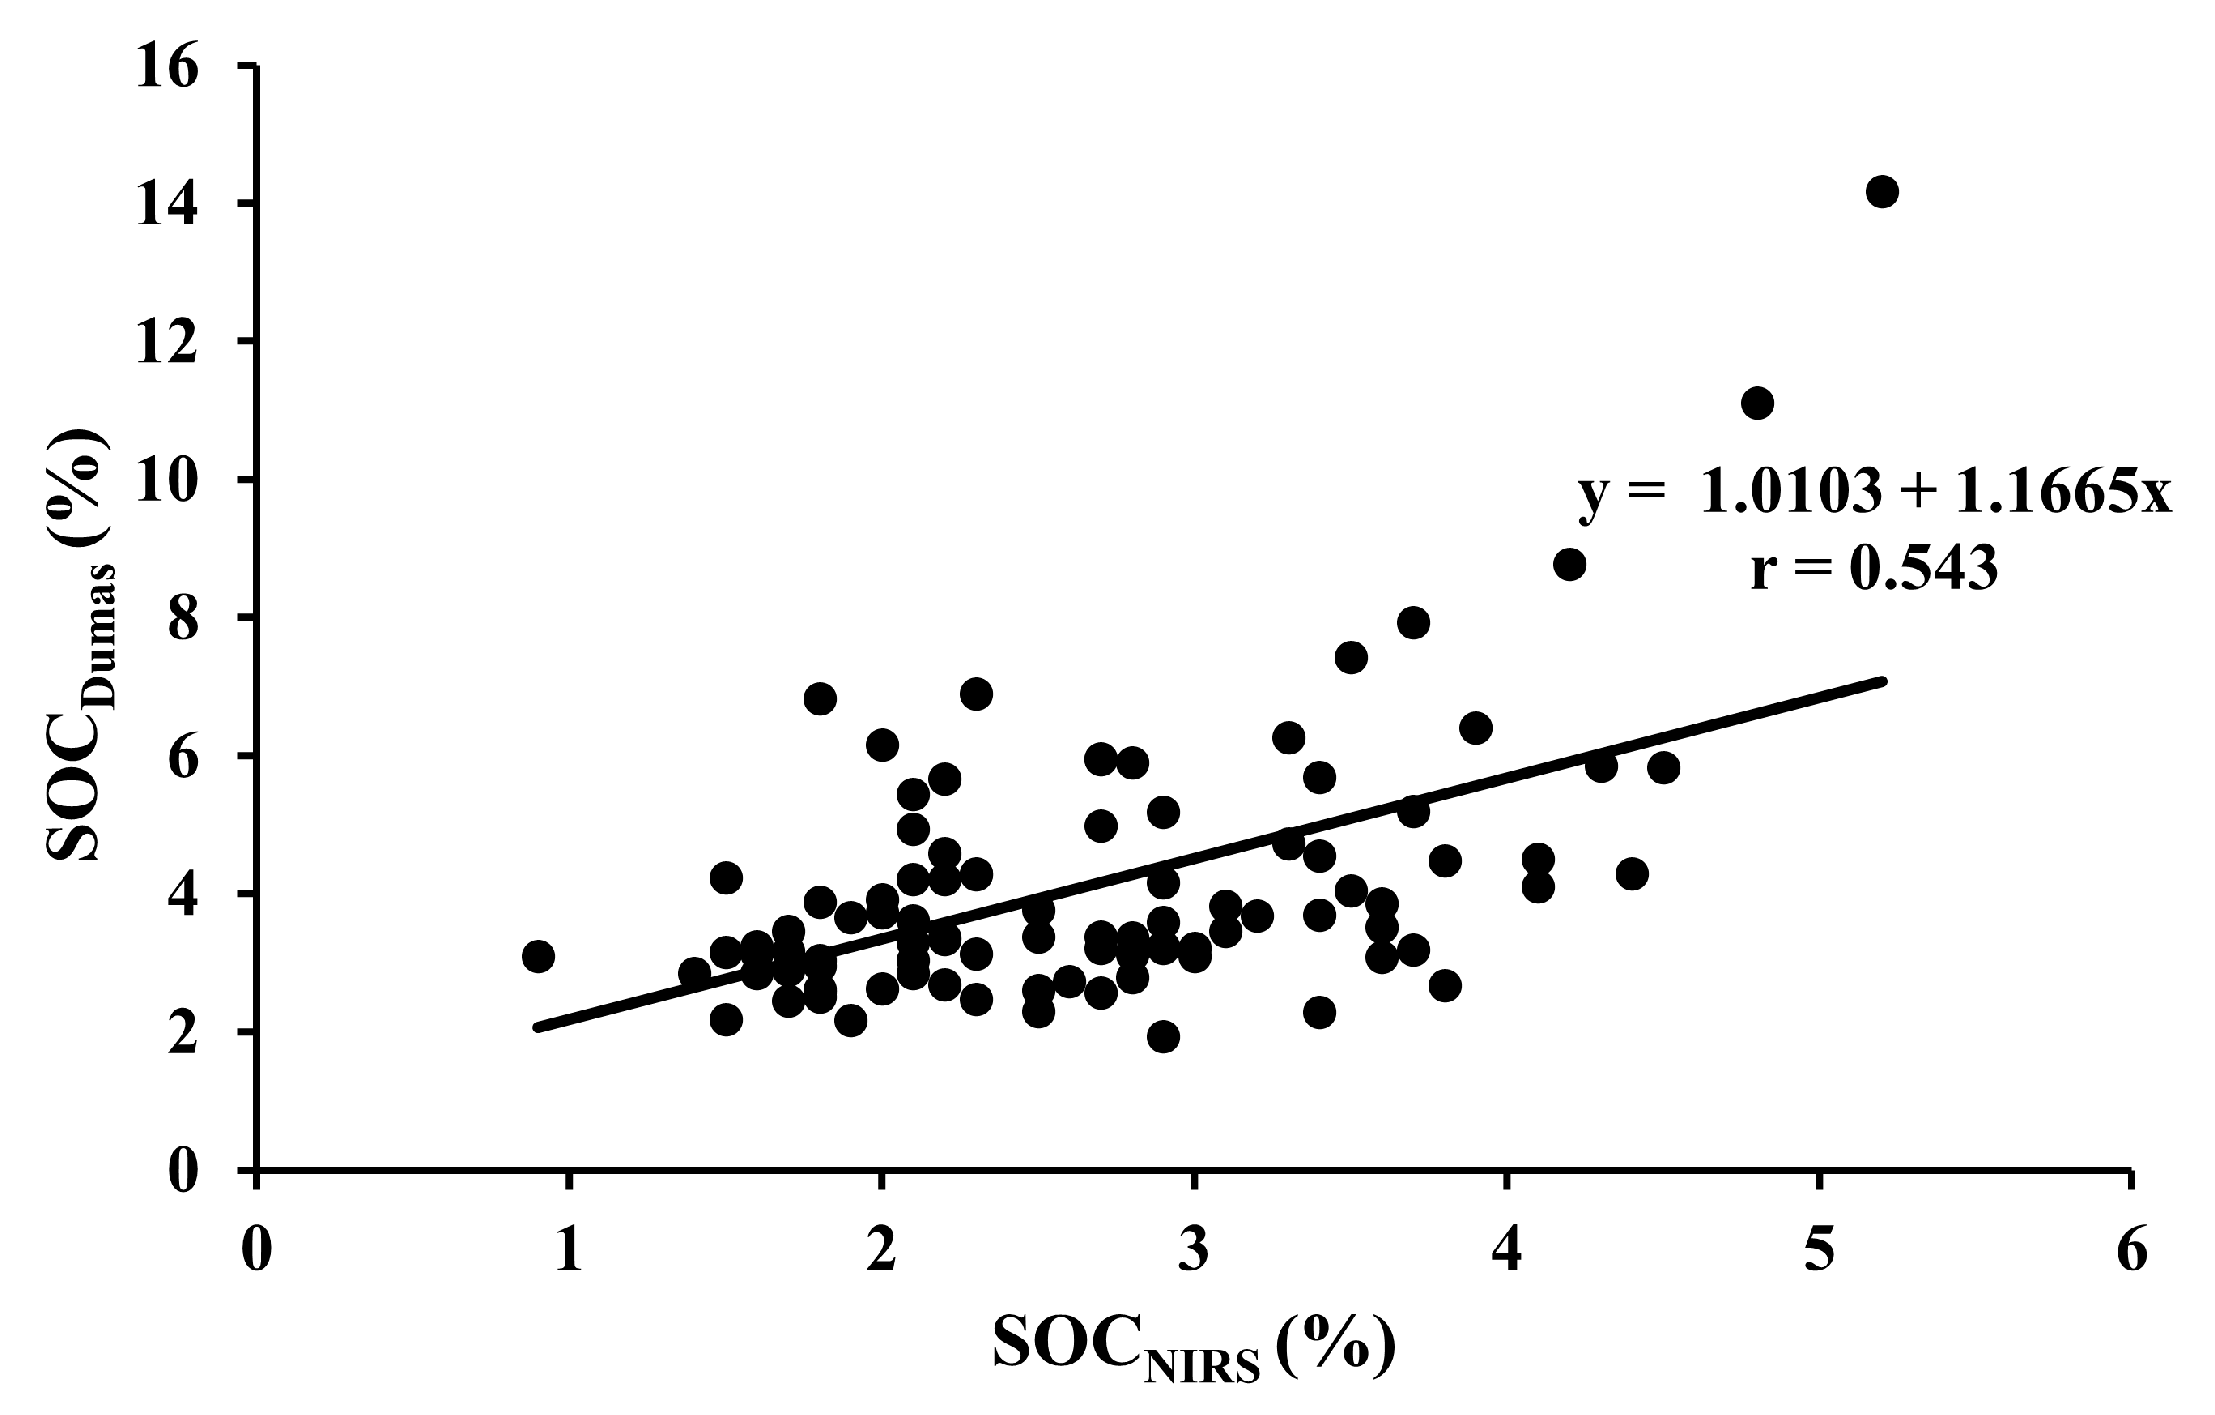
| SOCDumas vs. SOCNIRS | 95 | All fields | Y = 1.0103 + 1.1665x | <0.001 |
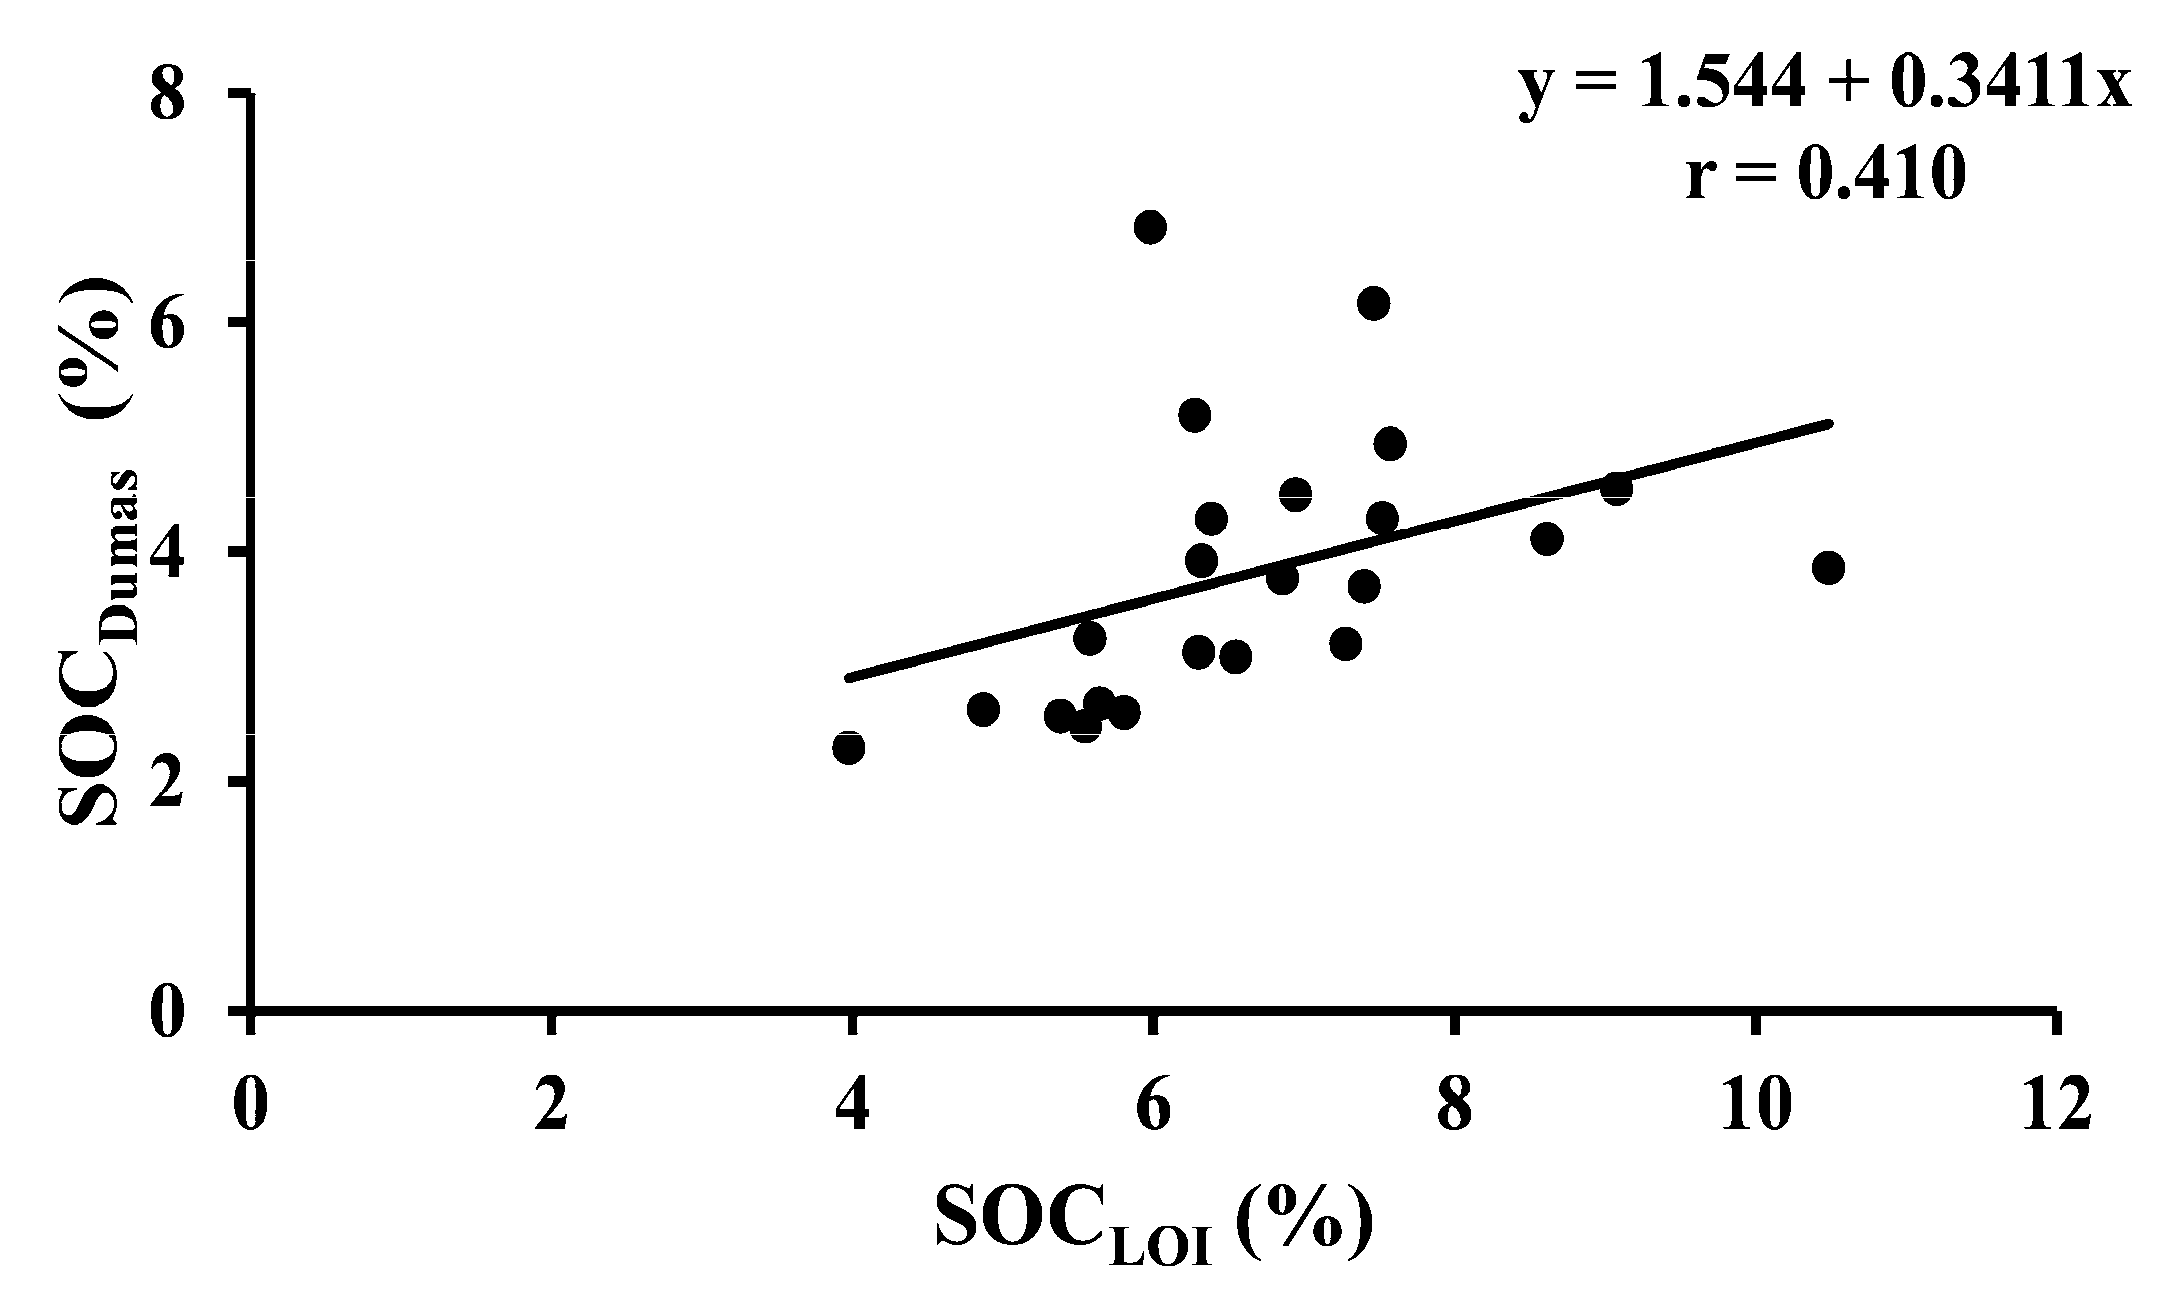
| SOCDumas vs. SOCLOI | 23 | Arable | Y = 1.544 + 0.3411x | <0.001 |
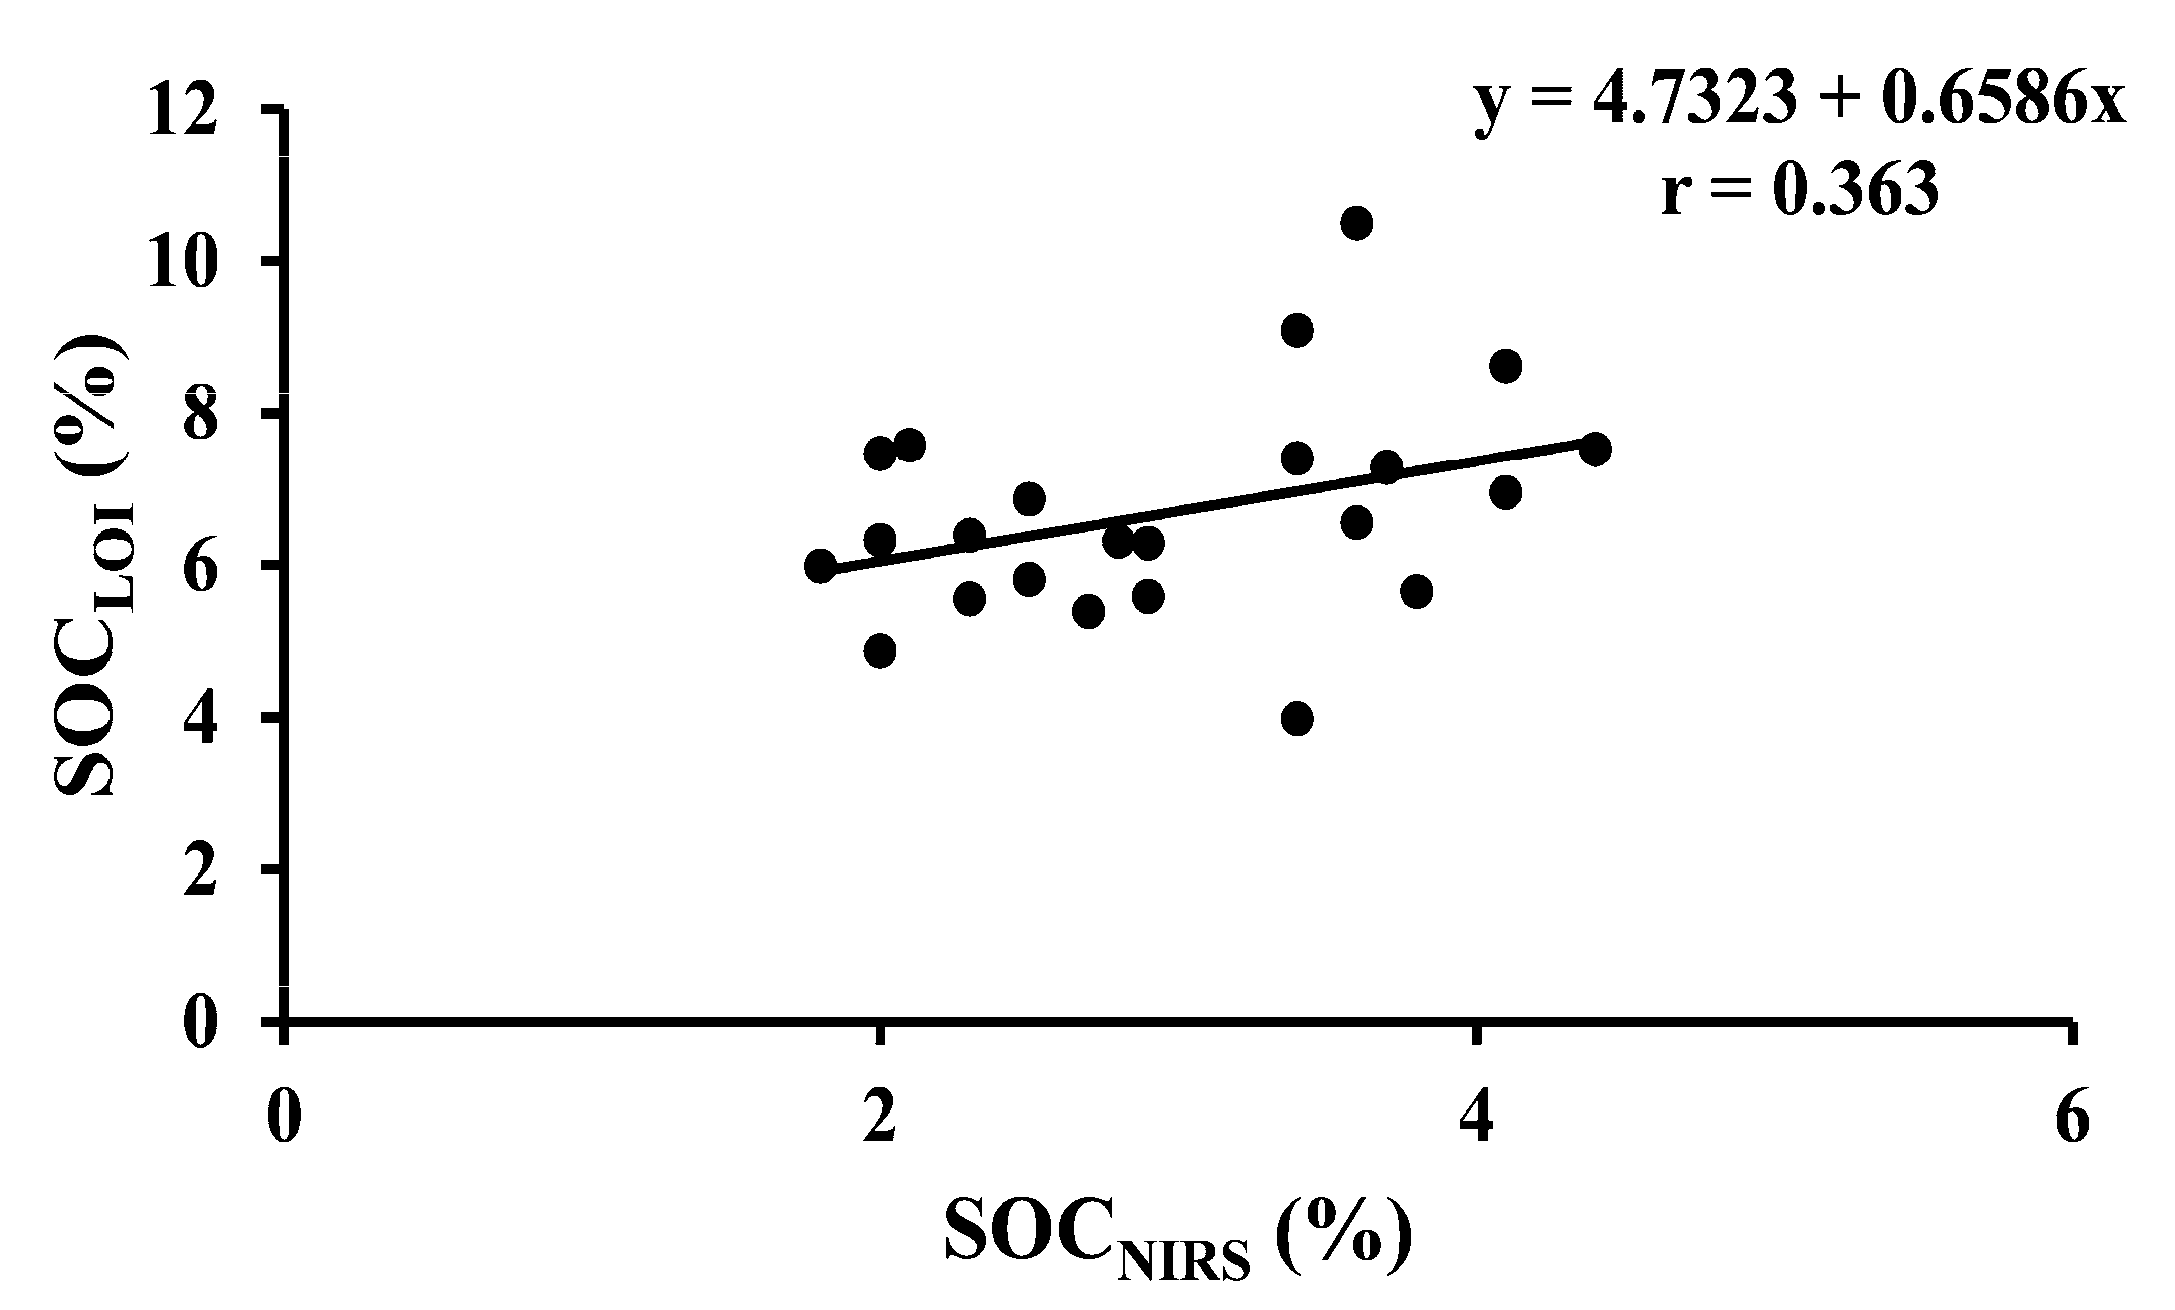
| SOCLOI vs. SOCNIRS | 23 | Arable | Y = 4.7323 + 0.6586x | <0.001 |
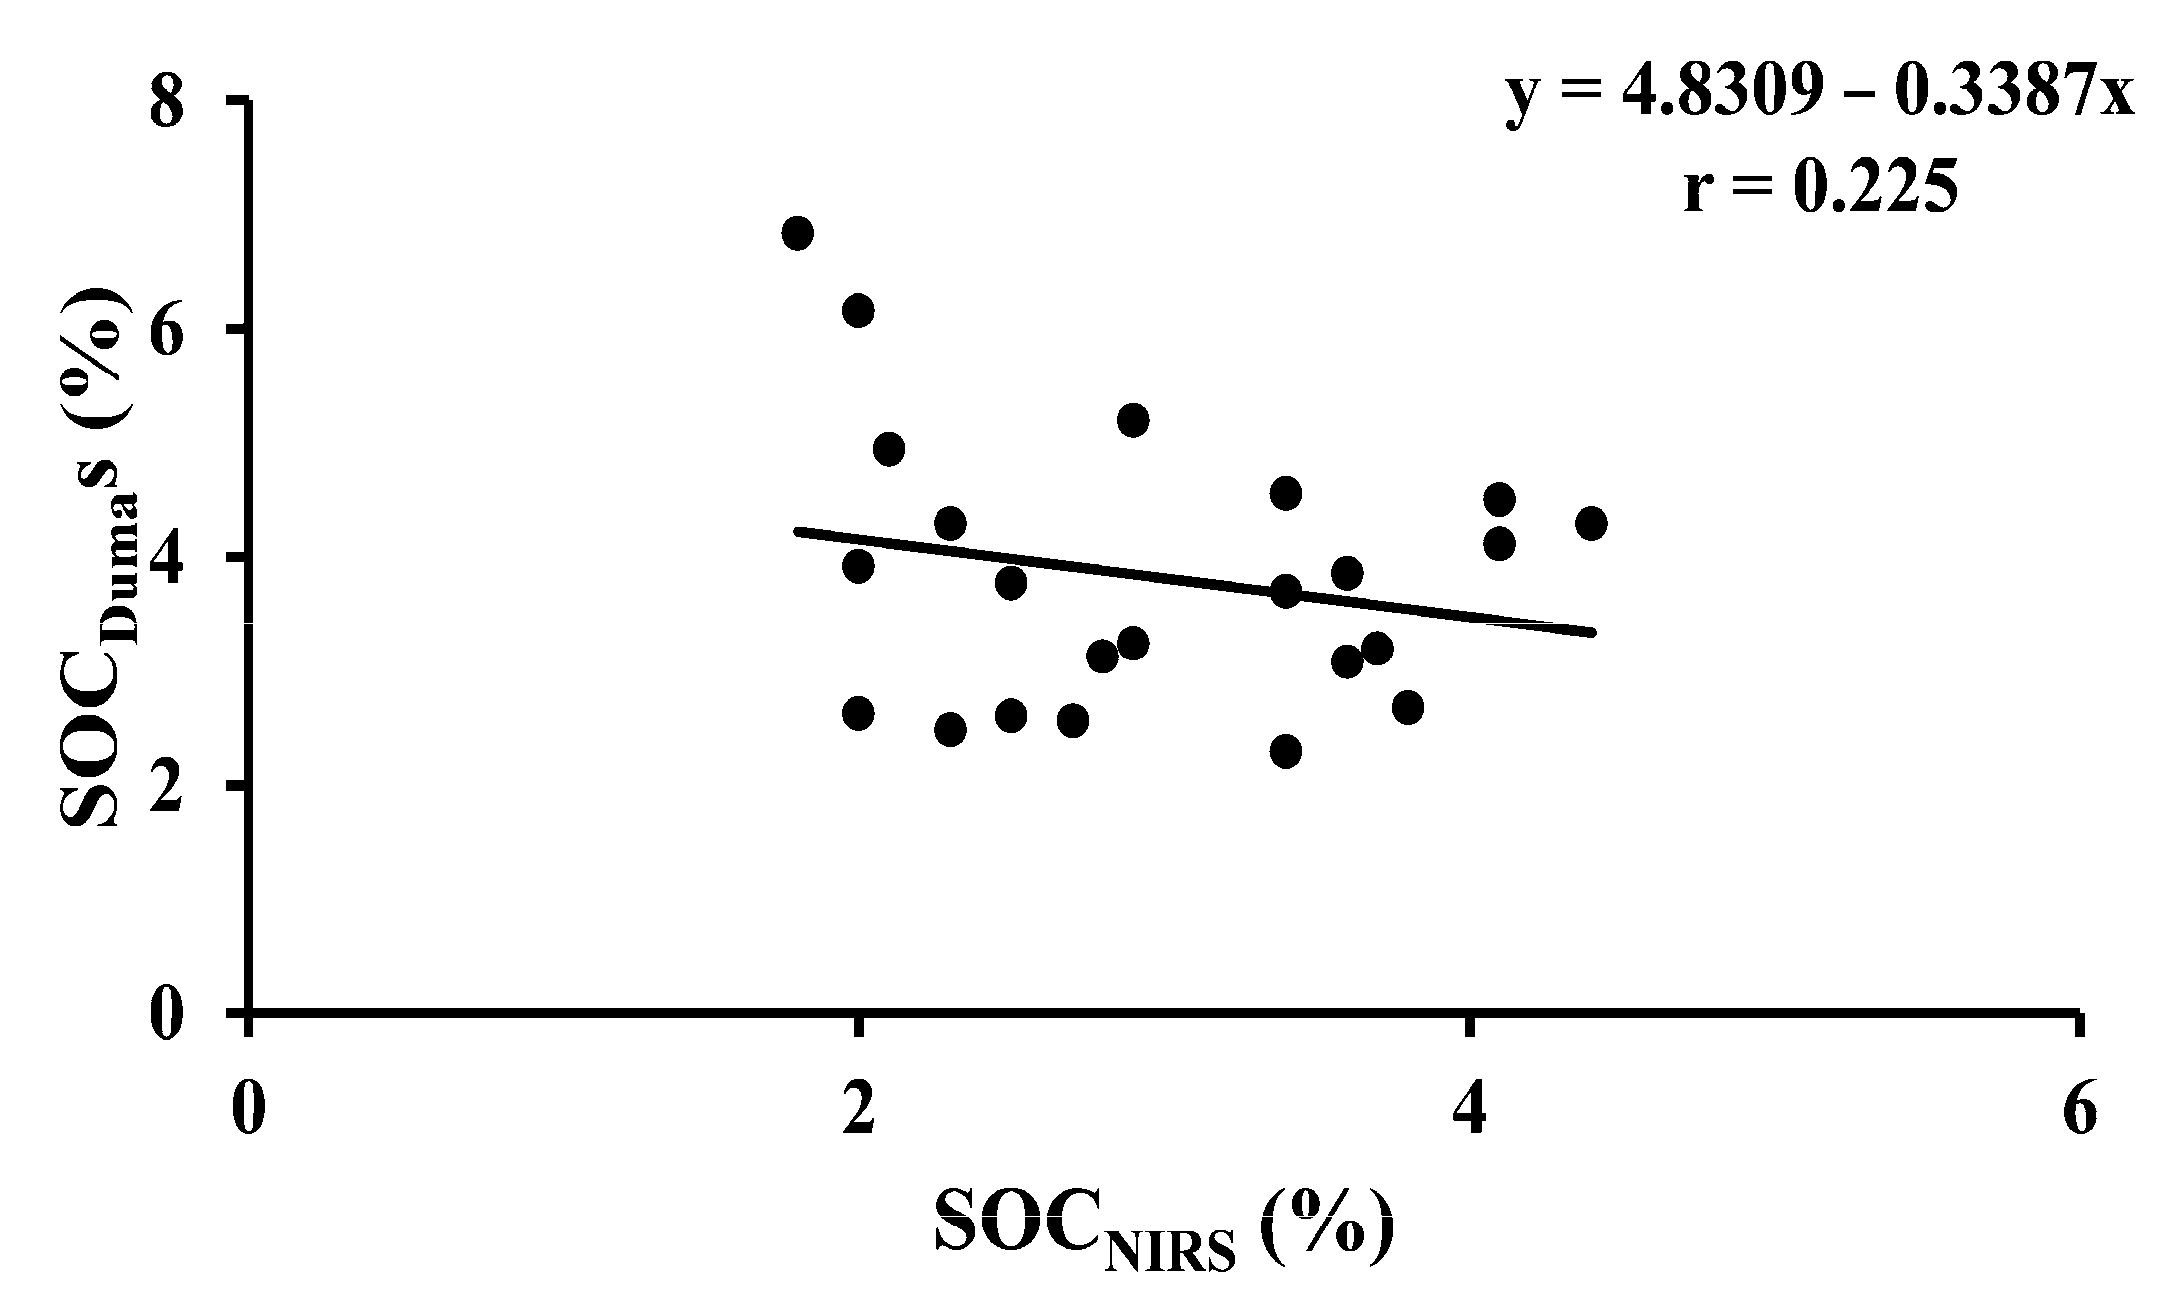
| SOCDumas vs. SOCNIRS | 23 | Arable | Y = 4.8309 − 0.3387x | <0.001 |
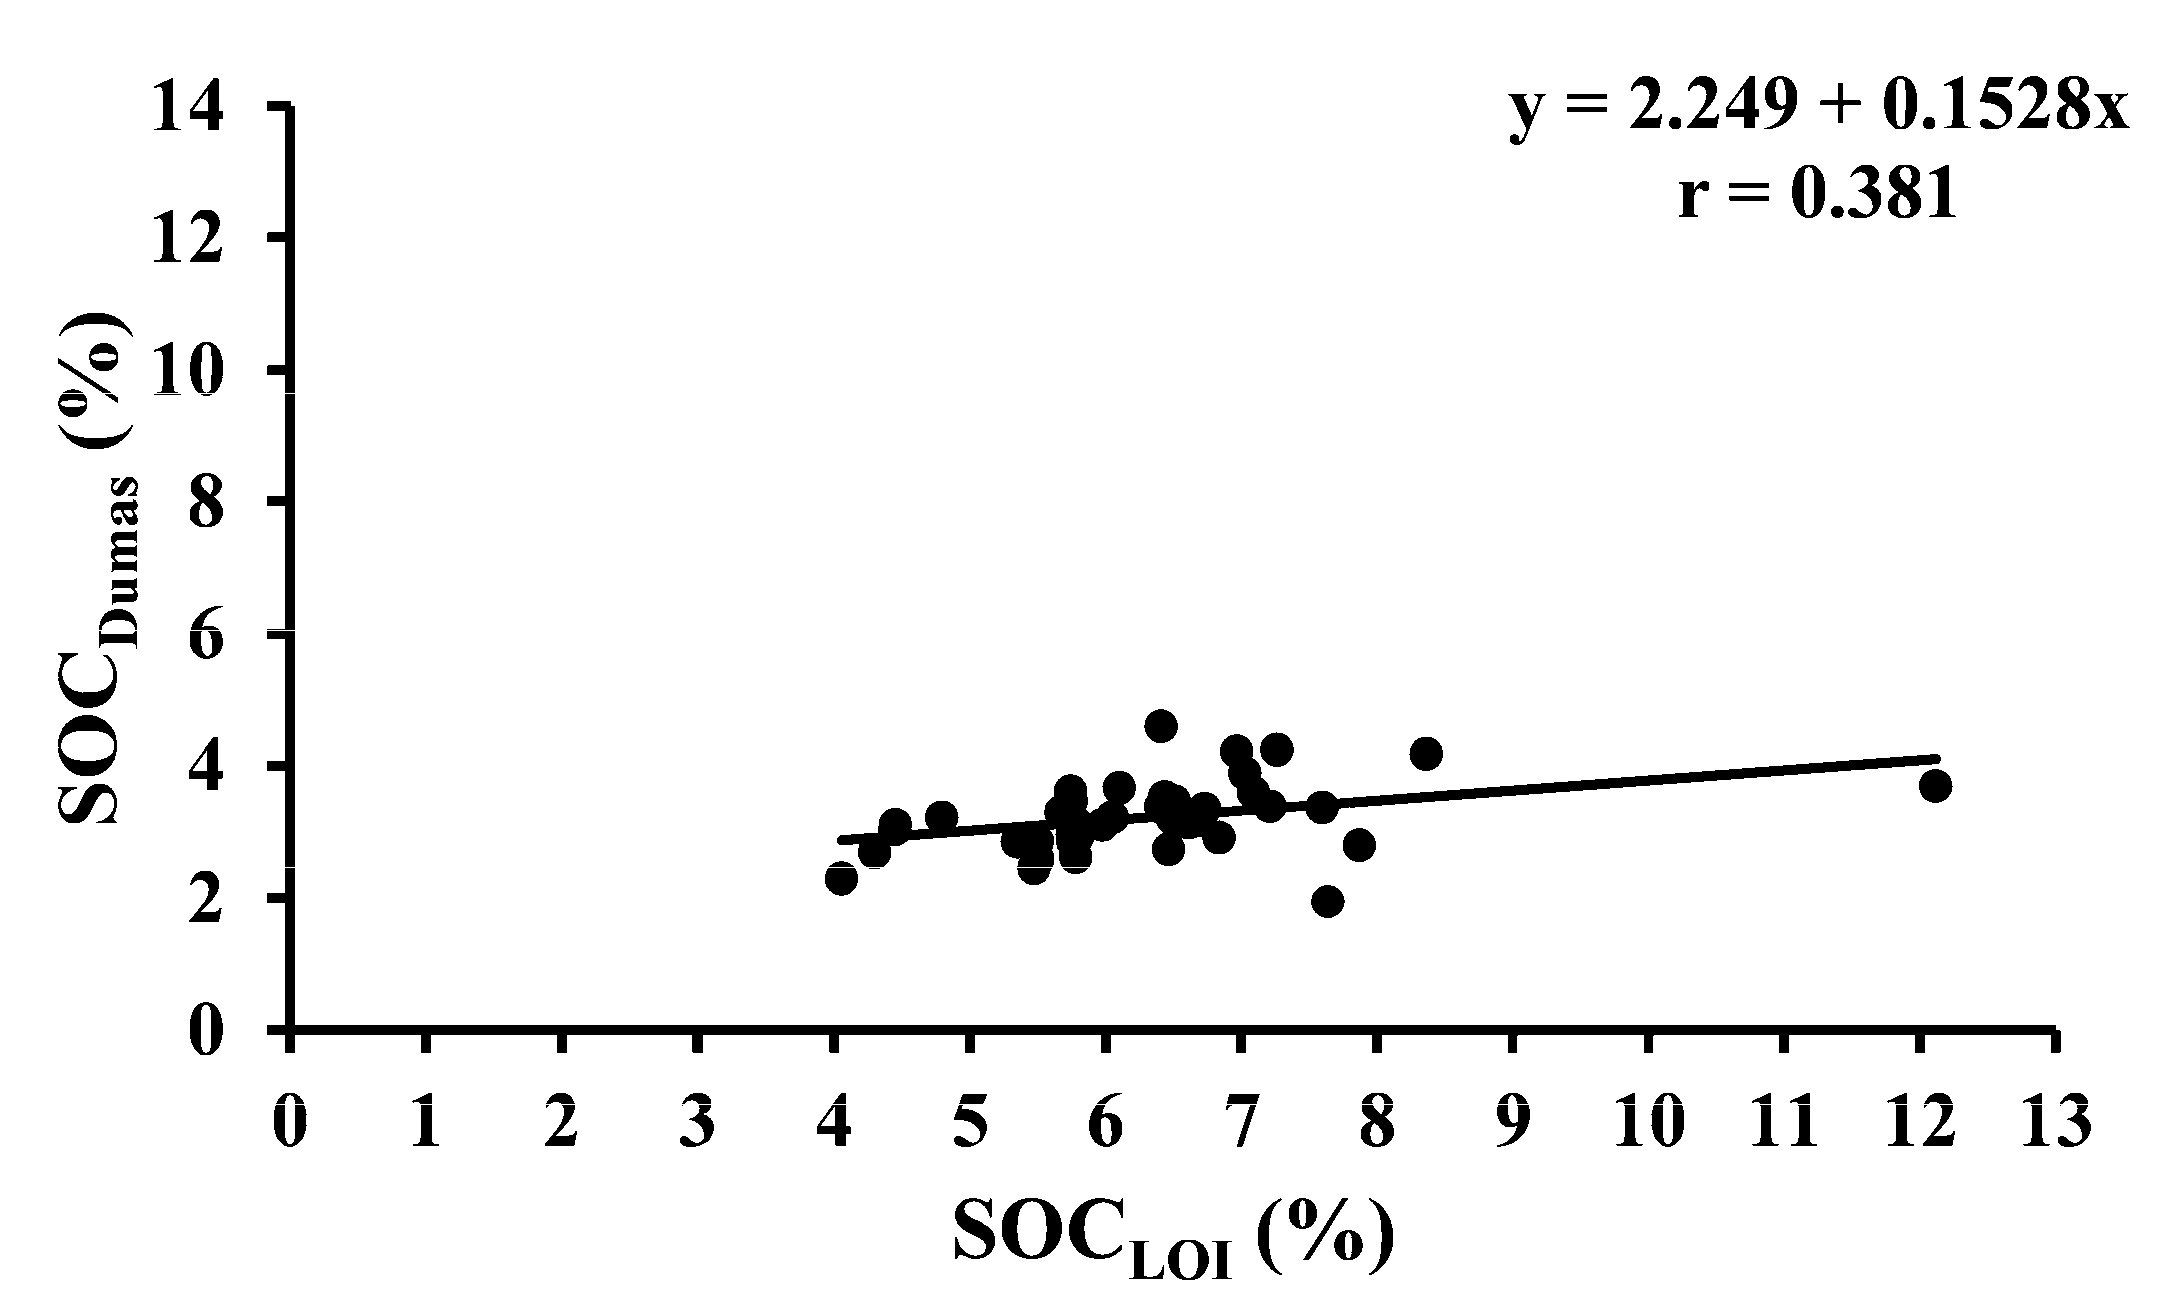
| SOCDumas vs. SOCLOI | 40 | Temporary ley | Y = 2.249 + 0.1528x | <0.001 |
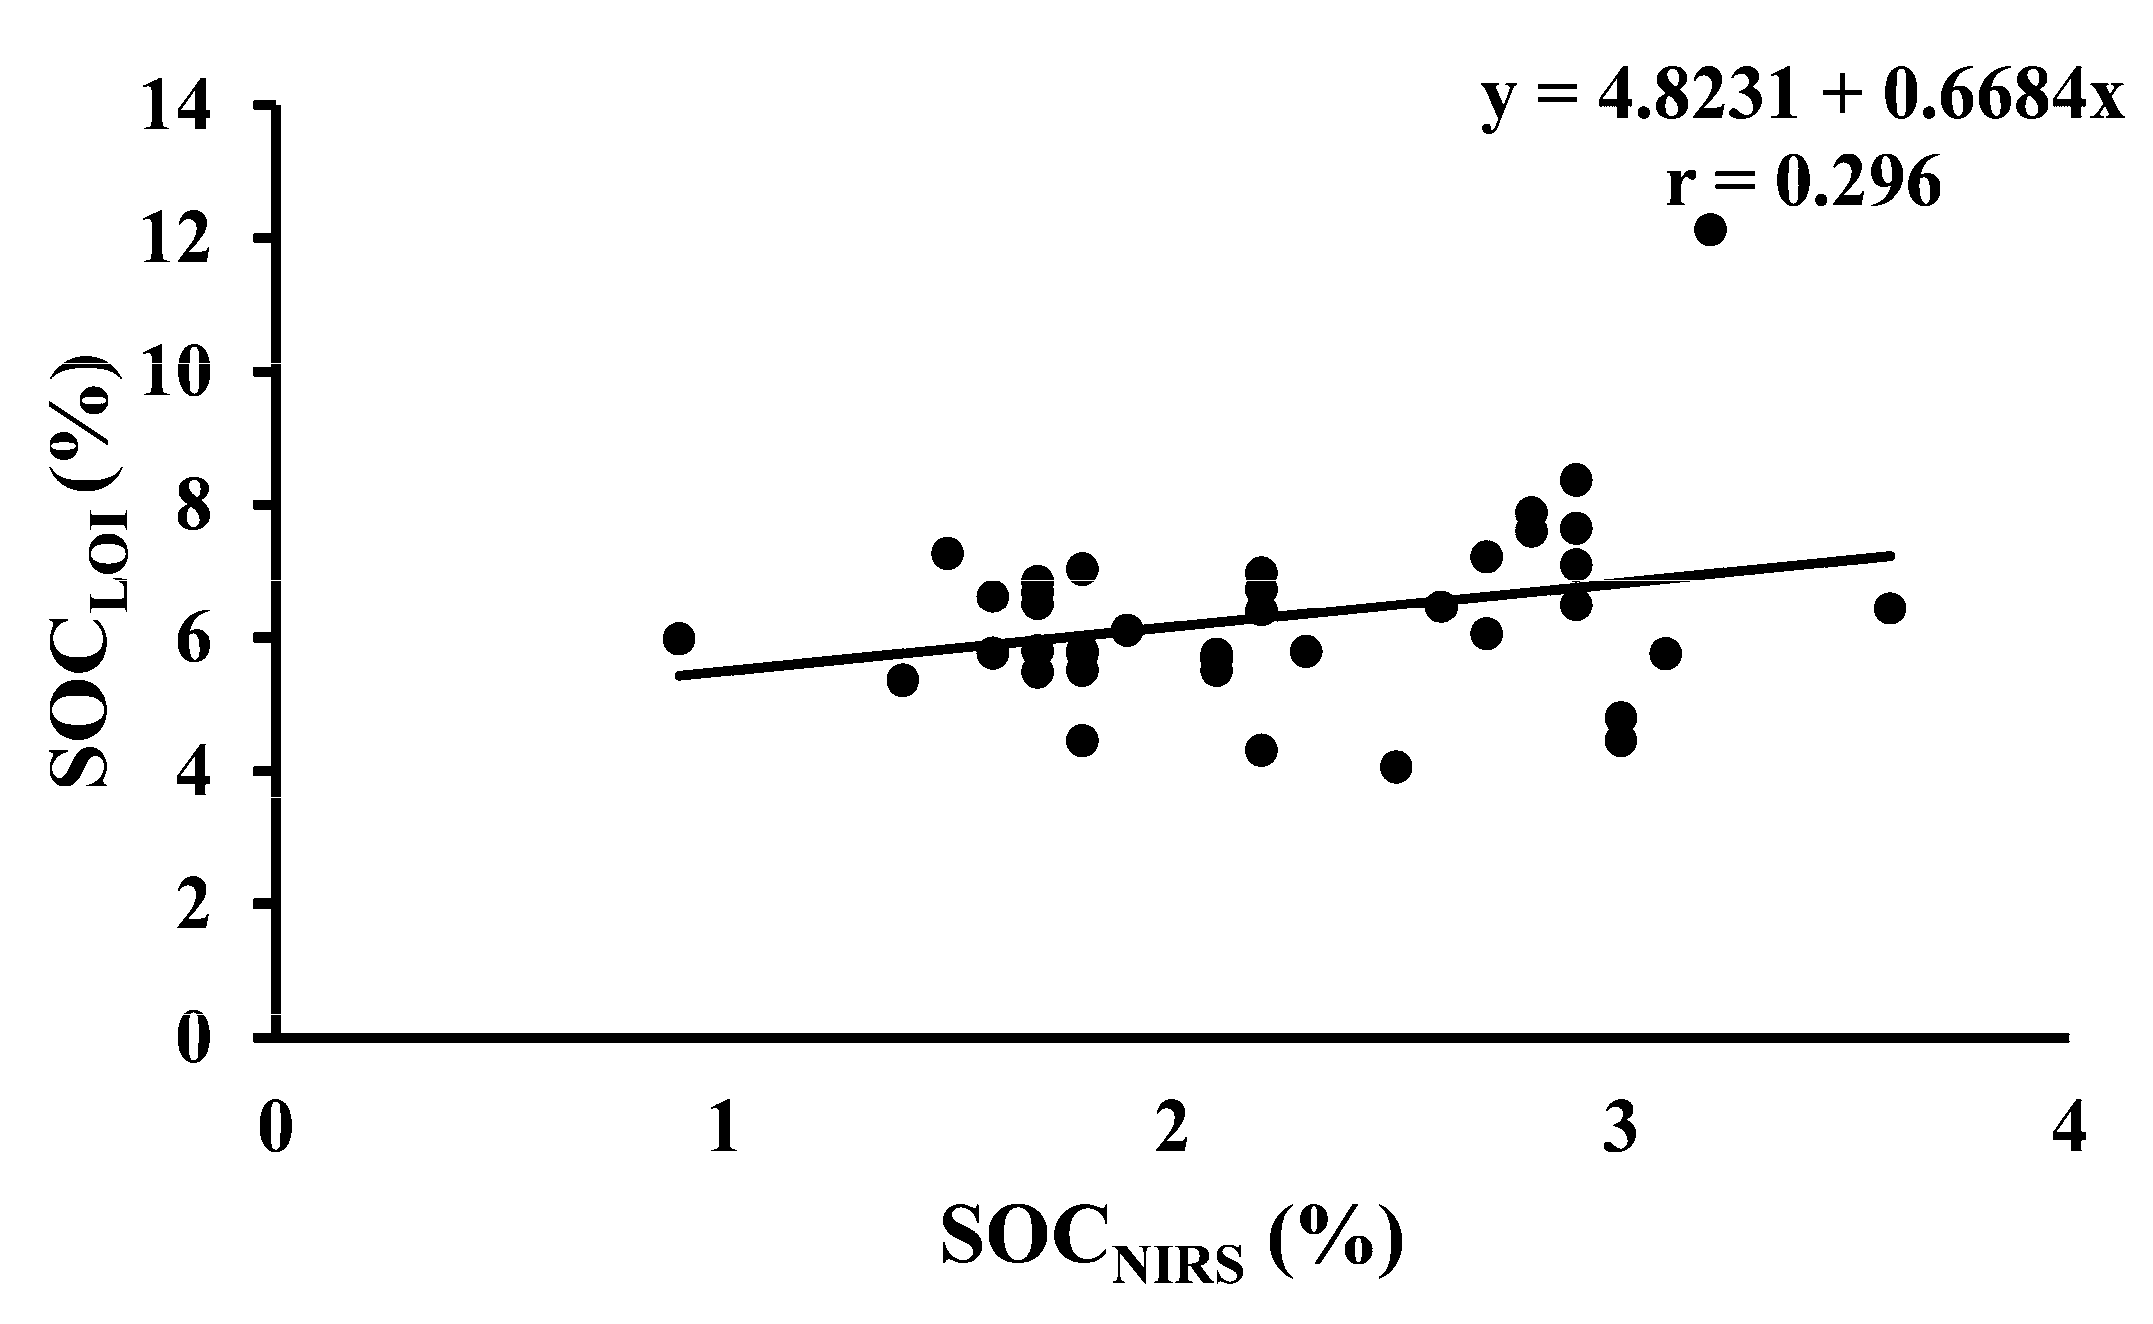
| SOCLOI vs. SOCNIRS | 40 | Temporary ley | Y = 4.8231 + 0.6684x | <0.001 |
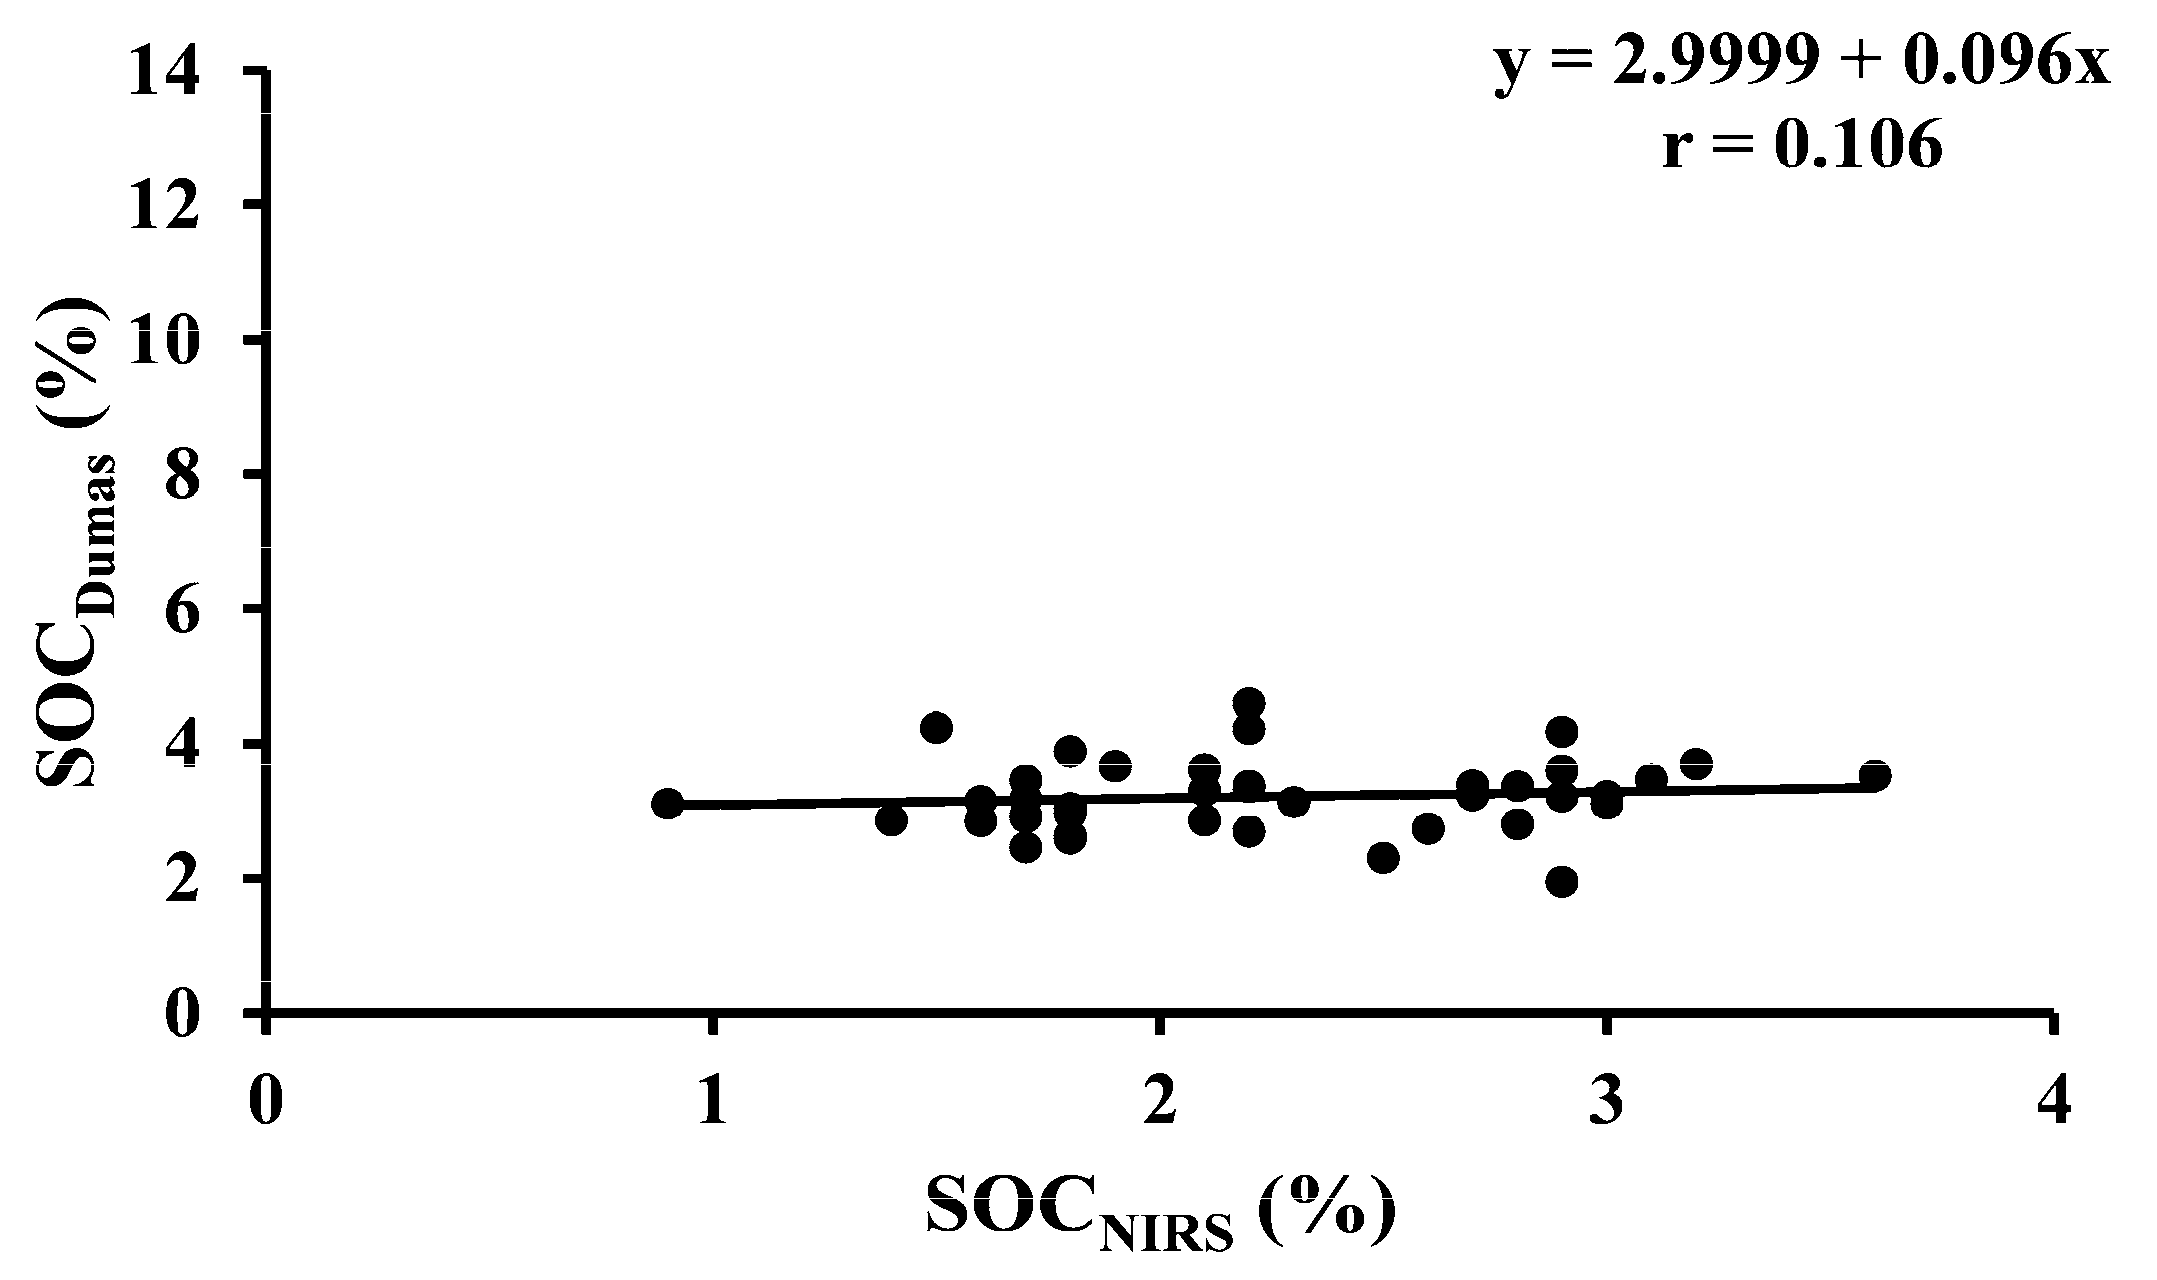
| SOCDumas vs. SOCNIRS | 40 | Temporary ley | Y = 2.9999 + 0.096x | <0.001 |
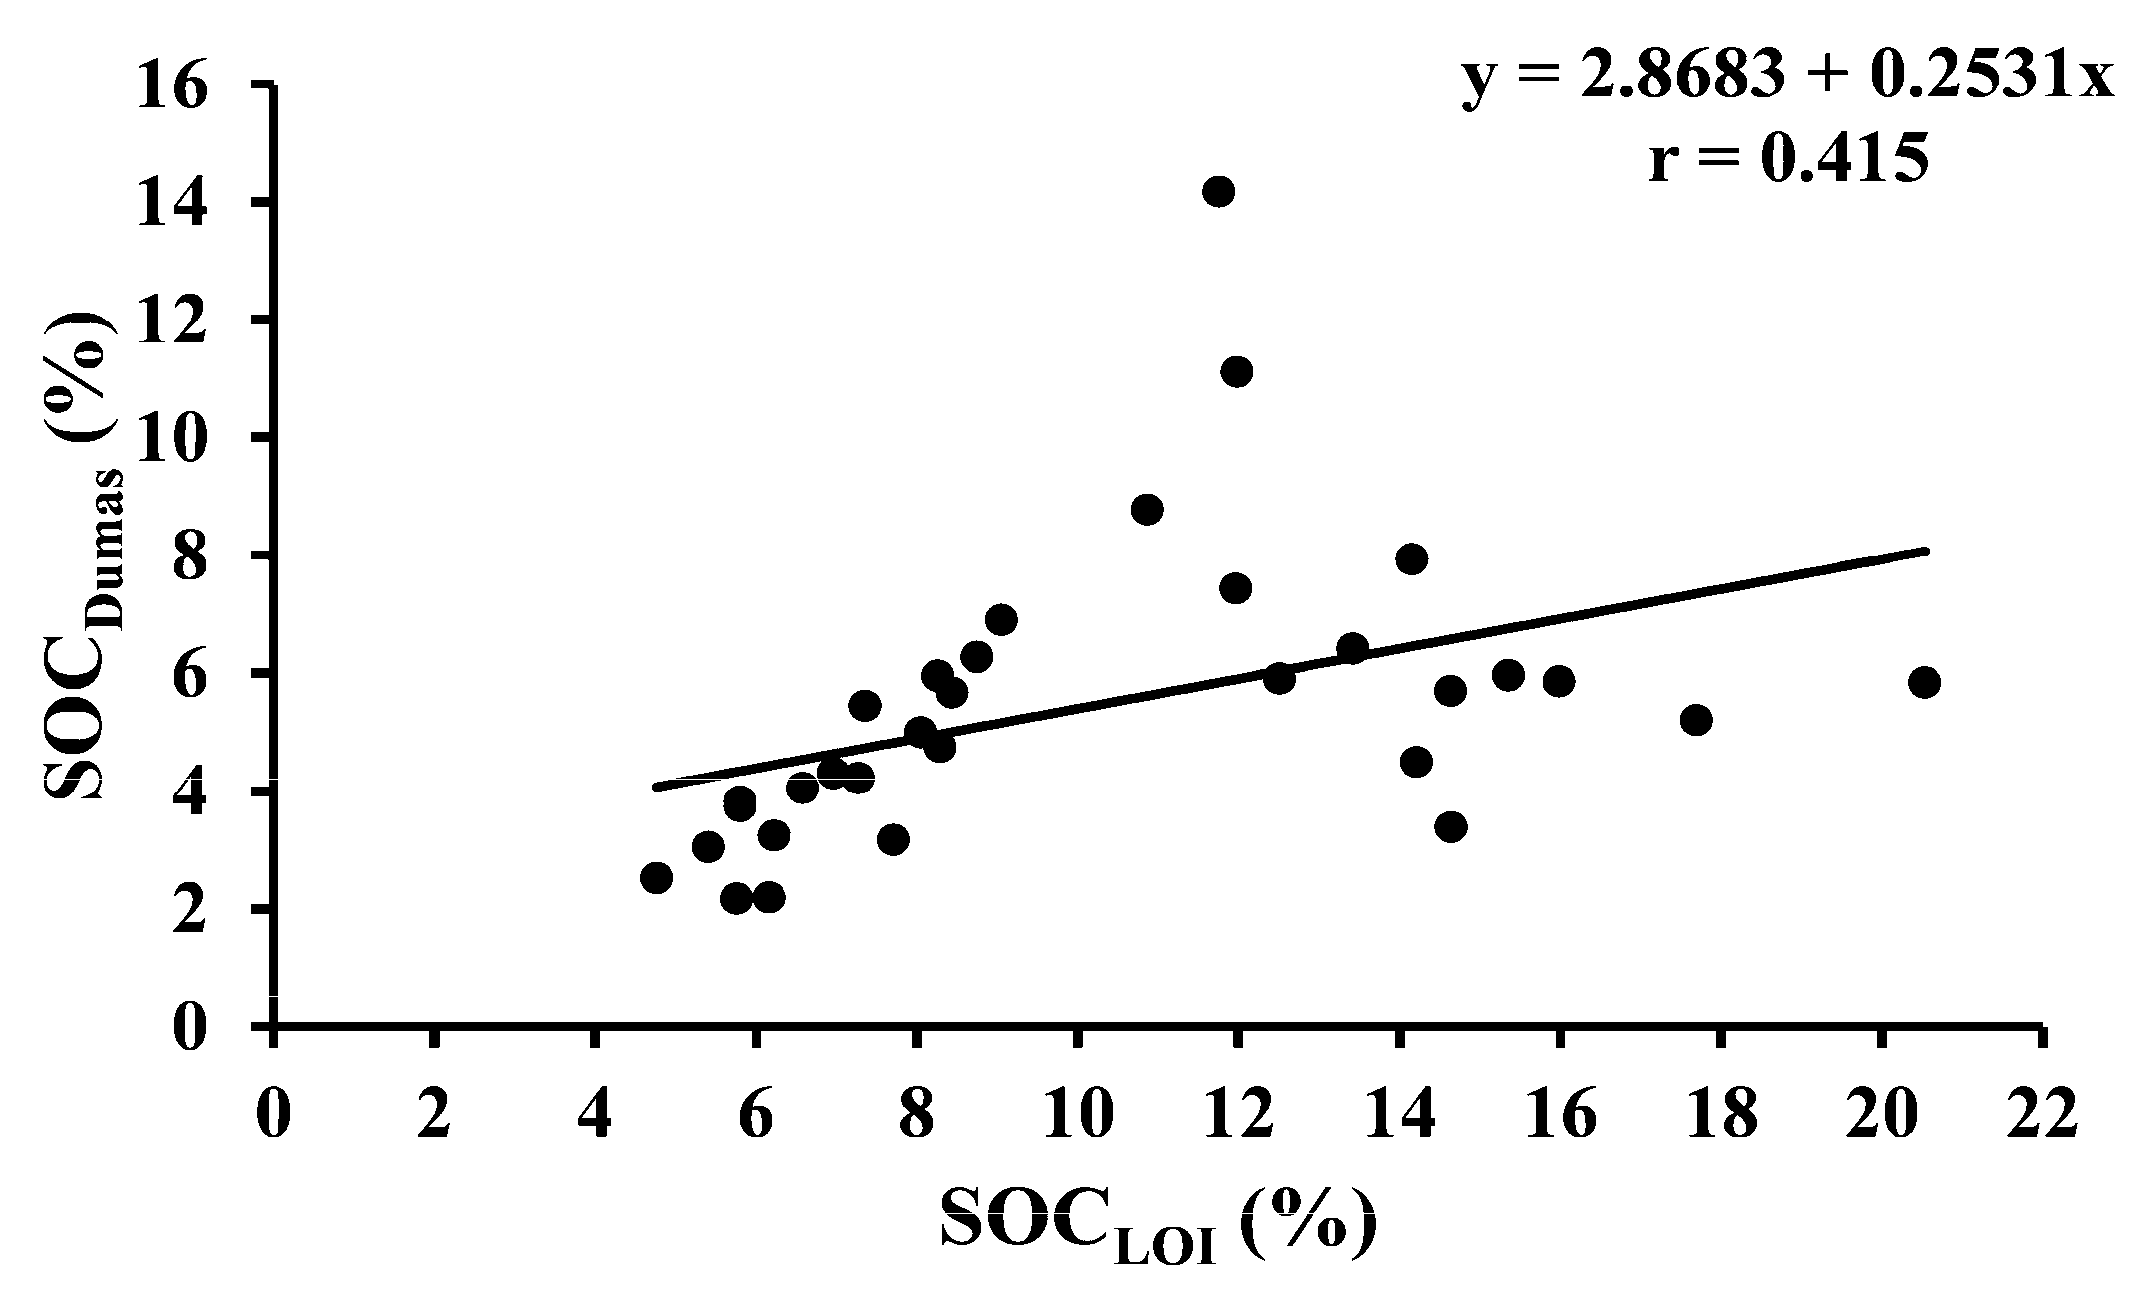
| SOCDumas vs. SOCLOI | 32 | Permanent grass | Y = 2.8683 + 0.2531x | <0.001 |
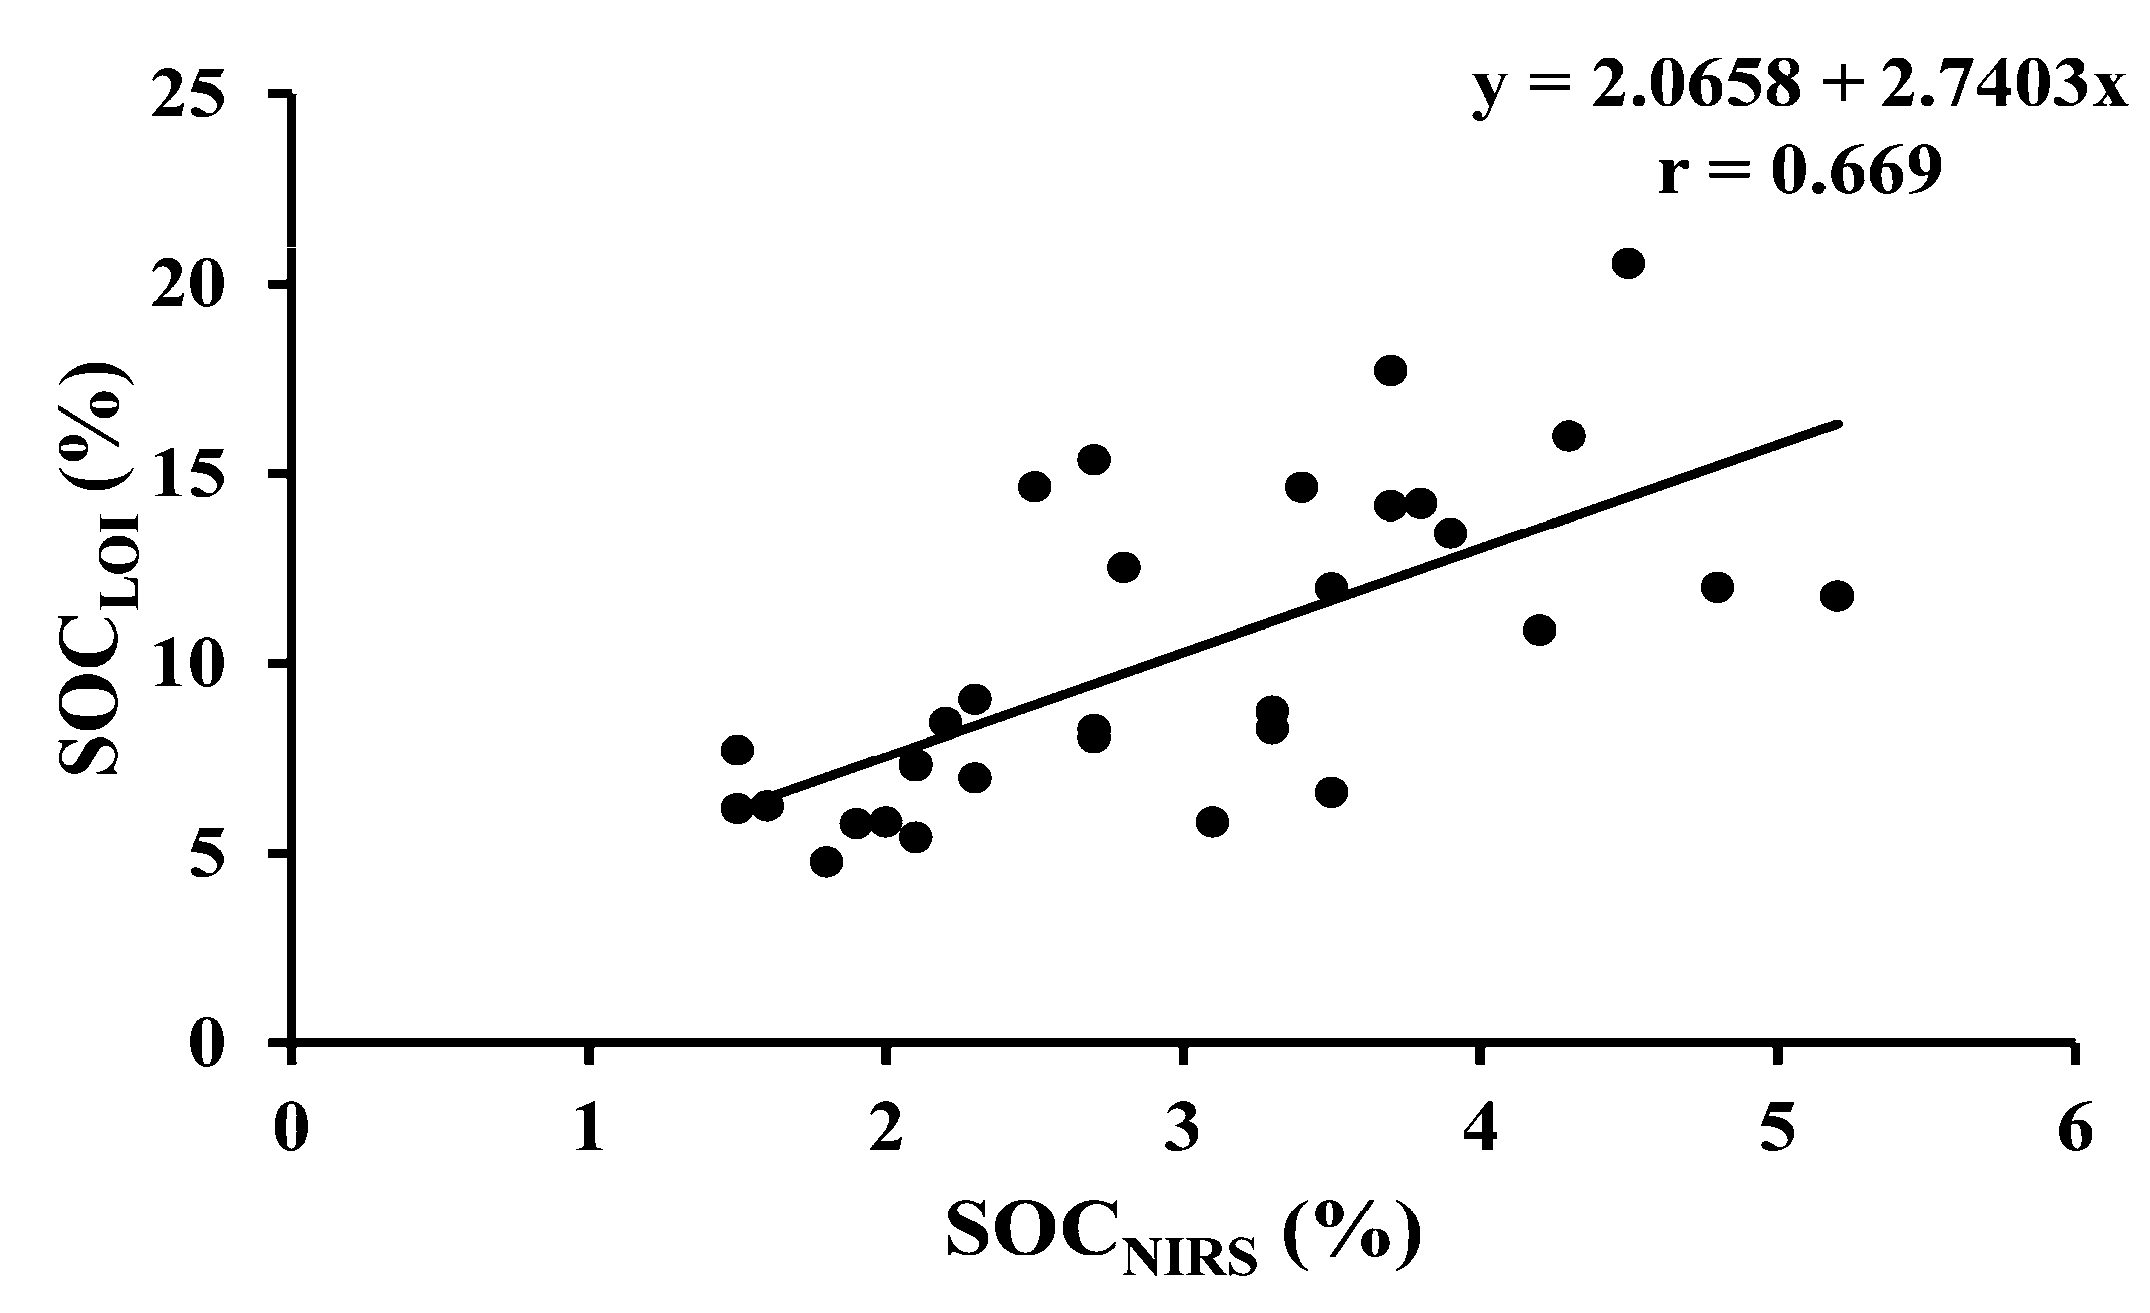
| SOCLOI vs. SOCNIRS | 32 | Permanent grass | Y = 2.0658 + 2.7403x | <0.001 |
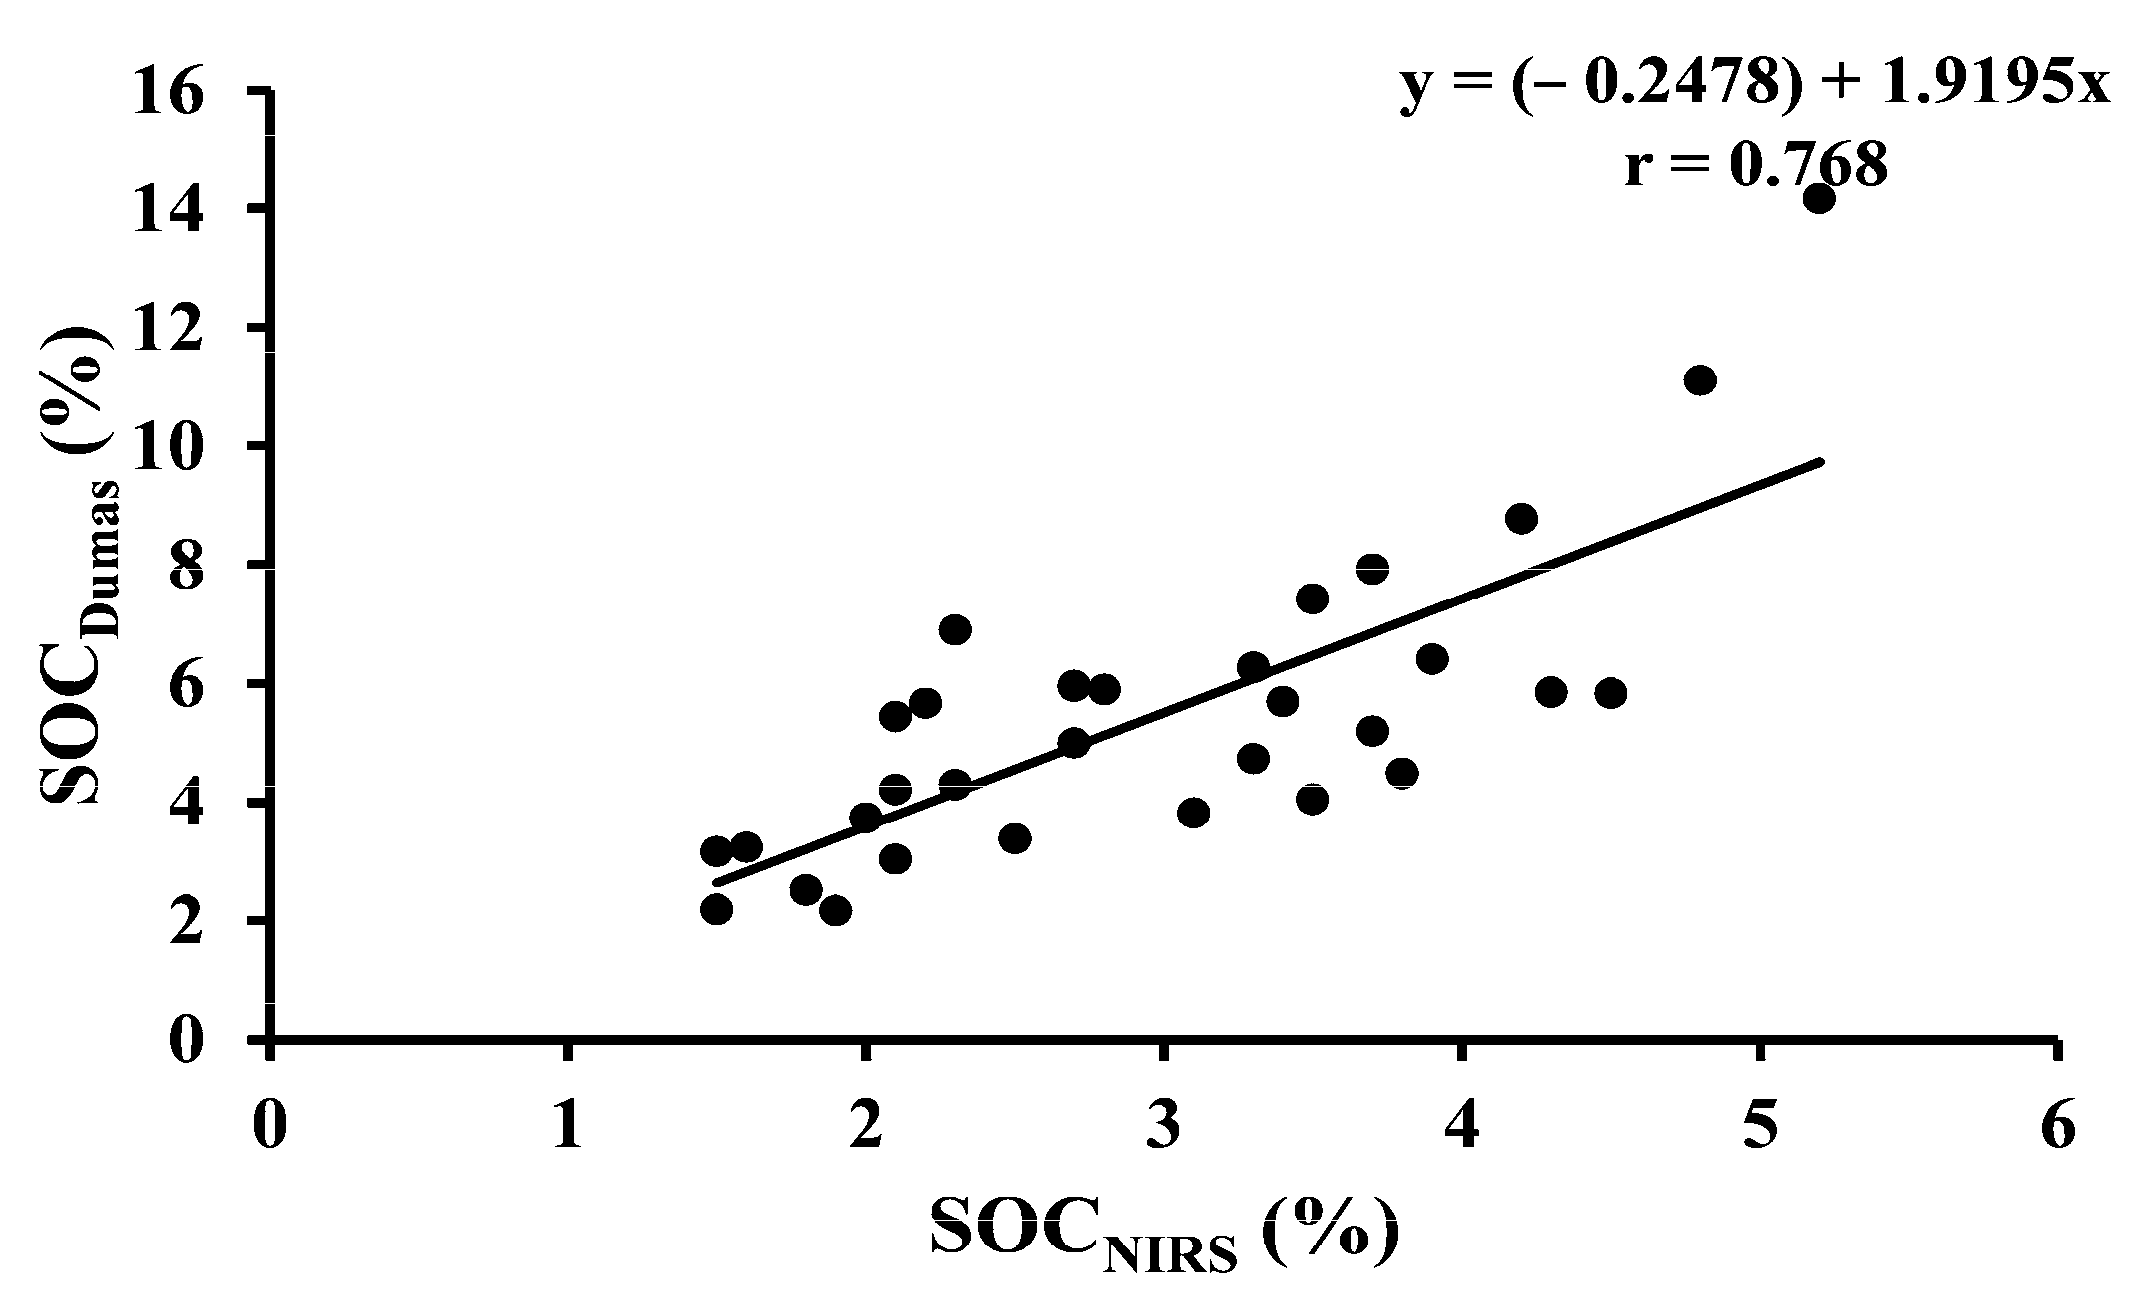
| SOCDumas vs. SOCNIRS | 32 | Permanent grass | Y = (−0.2478) + 1.9195x | <0.001 |
| Area | Land Type | Soil Type | Method | Mean SOC (%) | Source |
|---|---|---|---|---|---|
| Canada | Intercropping land | Sandy loams | LOI 575 °C HCI ** fumigation H2SO3 *** digestion | 2.0 NA ## NA ## | [1] |
| USA | Lawn, turf and parklands | Hapludalfs and Udorthents | LOI 400 °C LOI 550 °C Dumas | 3.3 4.0 3.2 | [9] |
| USA | Agronomic trials | Tarboro loamy sand | WB HM * LOI 360 °C Dumas | NA ## NA ## 1.4 0.8 | [12] |
| Xinjiang | Desert land, shrub land, cropland, grassland | Brown soils | WB LOI 375 °C Dumas | NA ## 2.7 <1.5 | [13] |
| Poland | Arable and a wide range of grasslands | Stagnic luvisols, Dystric Skeletic Cambisols, Folic Albic Podzols, and Histic Albic Podzols | LOI 550 °C Dumas | 13.4 6.4 | [15] |
| Ecuador | Forest | Volcanic origin soils | LOI 430 °C Dumas | 6.3 6.2 | [24] |
| Iran | Cultivated fields of crops, fallow fields, rangelands, and forests | Inceptisols, Entisols, and Aridisols (mostly calcareous soils) | LOI 550 °C LOI 375 °C LOI 360 °C WB Visible-NIRS | 2.5 # 1.8 # 1.2 # NA ## NA ## | [25] |
Disclaimer/Publisher’s Note: The statements, opinions and data contained in all publications are solely those of the individual author(s) and contributor(s) and not of MDPI and/or the editor(s). MDPI and/or the editor(s) disclaim responsibility for any injury to people or property resulting from any ideas, methods, instructions or products referred to in the content. |
© 2025 by the authors. Licensee MDPI, Basel, Switzerland. This article is an open access article distributed under the terms and conditions of the Creative Commons Attribution (CC BY) license (https://creativecommons.org/licenses/by/4.0/).
Share and Cite
Ng, W.K.P.; Maxfield, P.J.; Crew, A.P.; Teixeira, D.L.; Bevan, T.; Bell, M.J. Comparison of Soil Organic Carbon Measurement Methods. Agronomy 2025, 15, 1826. https://doi.org/10.3390/agronomy15081826
Ng WKP, Maxfield PJ, Crew AP, Teixeira DL, Bevan T, Bell MJ. Comparison of Soil Organic Carbon Measurement Methods. Agronomy. 2025; 15(8):1826. https://doi.org/10.3390/agronomy15081826
Chicago/Turabian StyleNg, Wing K. P., Pete J. Maxfield, Adrian P. Crew, Dayane L. Teixeira, Tim Bevan, and Matt J. Bell. 2025. "Comparison of Soil Organic Carbon Measurement Methods" Agronomy 15, no. 8: 1826. https://doi.org/10.3390/agronomy15081826
APA StyleNg, W. K. P., Maxfield, P. J., Crew, A. P., Teixeira, D. L., Bevan, T., & Bell, M. J. (2025). Comparison of Soil Organic Carbon Measurement Methods. Agronomy, 15(8), 1826. https://doi.org/10.3390/agronomy15081826