Article

Effects of Conservation Tillage and Nitrogen Inhibitors on Yield and N2O Emissions for Spring Maize in Northeast China

by
Fanchao Meng
1,2,
Guozhong Feng
1,
Lingchun Zhang
1,
Yin Wang
1,
Qiang Gao
1,
Kelin Hu
3,* and
Shaojie Wang
1,*
1
Key Laboratory of Straw Comprehensive Utilization and Black Soil Conservation, College of Resources and Environmental Sciences, Jilin Agricultural University, Changchun 130118, China
2
Jilin Academy of Agricultural Sciences, Changchun 130033, China
3
College of Land Science and Technology, China Agricultural University, Key Laboratory of Arable Land Conservation (North China), Ministry of Agriculture and Rural Affairs, Beijing 100193, China
*
Authors to whom correspondence should be addressed.
Agronomy 2025, 15(8), 1818; https://doi.org/10.3390/agronomy15081818 (registering DOI)
Submission received: 27 June 2025 / Revised: 25 July 2025 / Accepted: 25 July 2025 / Published: 27 July 2025

Abstract

Conservation tillage can improve soil health and carbon sequestration and is helpful for sustainable agricultural development. However, its effect on crop yields and nitrous oxide (N2O) emissions is still controversial. In this study, a two-year field experiment of spring maize was conducted from 2019 to 2020 in the Phaeozems region of Northeast China, involving two tillage practices (strip tillage and conventional tillage) and two nitrogen inhibitors (N-butylthiophosphorotriamine, NBPT and 3,4-Dimethylpyrazole phosphate, DMPP). The WHCNS (Soil Water Heat Carbon Nitrogen Simulator) model was calibrated and validated with field observations, and the effects of different tillage practices and nitrification inhibitors on spring maize yield, N2O emissions, water use efficiency (WUE), and nitrogen use efficiency (NUE) were simulated using the WHCNS model. Precipitation scenarios were set up to simulate and analyze the changes in patterns of crop yield and N2O emissions under long-term conservation tillage for 30 years (1991–2020). The results showed that concerning maize yield, under conservation tillage, the type of straw and nitrogen fertilizer inhibitor could explain 72.1% and 7.1%, respectively, of the total variance in maize yield, while precipitation explained only 14.1% of the total variance, with a 28.5% increase in crop yield in a humid year compared to a dry year. N2O emissions were principally influenced by precipitation, which could explain 46.4% of the total variance in N2O emissions. Furthermore, N2O emissions were 385% higher in humid years than in dry years. Straw under conservation tillage and inhibitor type explained 8.1% and 19.4% of the total variance in N2O emissions, respectively. Conservation tillage with nitrification inhibitors is recommended to increase crop yields, improve soil quality and reduce greenhouse gas emissions in the Phaeozems region of Northeast China, thus ensuring sustainable agricultural development in the region.

1. Introduction

With the continuous growth of the global population and the corresponding increase in food demand, it is estimated that world food production needs to increase by 60% by 2050 to meet the growing needs of the population. Additionally, nitrous oxide (N2O) emissions from agricultural ecosystems are projected to increase by 20% [1]. Due to factors such as urbanization and limitations on land resources, the expansion of cultivated land areas is challenging. To meet the increasing demand for food, intensive cultivation practices, including excessive application of nitrogen fertilizers and improper timing and methods of fertilization, have been adopted in the past three decades [2]. However, these practices have resulted in soil fertility degradation and increased environmental pollution risks due to nitrogen loss [3]. Traditional cultivation methods in the black soil region of Northeast China frequently involve the burning or removal of crop residues after maize harvest, resulting in soil erosion that affects 34% of the total area covered by black soil [4]. The annual loss of black soil can range from 100 to 200 million cubic meters, equivalent to the nutrient content found in millions of tons of chemical fertilizers [5]. To tackle these challenges effectively, it is imperative to develop customized cultivation methods and nitrogen fertilizer management strategies that consider the specific soil and climatic conditions of each planting area. This approach is pivotal for ensuring stable, environmentally friendly, and sustainable agricultural production.
Conservation agriculture, advocated as one of the core crop management principles by the Food and Agriculture Organization and a prominent component of climate-smart agriculture [6,7], yields numerous benefits. Extensive research demonstrates that it minimizes soil disturbance and preserves crop residues on the soil surface, effectively reducing soil water evaporation and facilitating increased water infiltration [8]. Consequently, it substantially mitigates soil erosion while enhancing water use efficiency (WUE) [9,10]. In contrast to conventional cultivation methods, conservation agriculture modifies soil characteristics and fosters the accumulation of organic matter, thereby mitigating the risk of erosion-induced soil degradation and fostering crop growth [11,12]. Moreover, various studies indicate that conservation agriculture significantly enhances rainfed crop yields in arid climates [13,14]. Additionally, conservation agriculture proves advantageous in retaining soil moisture in regions with limited rainfall and inadequate irrigation [15].
Additionally, greenhouse gas emissions and reactive nitrogen losses significantly contribute to global climate change, with agricultural activities playing a substantial role as sources of these emissions. Among the greenhouse gases, N2O holds particular significance due to its long lifespan and high warming potential, acting as a major contributor to reactive nitrogen losses in agricultural fields [16]. Agricultural activities alone account for 60% to 75% of the total N2O emissions [17]. Field management practices, including straw returning, may affect soil N2O emissions. During the decomposition process after straw return to the field, O2 consumption is accelerated in the short term, forming an anaerobic environment, which promotes the activity of denitrifying bacteria and accelerates the production of N2O. However, the long-term return of straw to the field improves the soil structure, increases the porosity of the soil, enhances the gas diffusion capacity, inhibits denitrification, and promotes the further reduction of N2O to N2 [18]. Thus, properly assessing the effects of straw incorporation and conservation agriculture on soil N2O emissions in agricultural fields and identifying key influencing factors become crucial. Such an analysis is vital for a scientific approach in managing crop residues and effectively mitigating climate change. Optimizing cultivation practices, straw incorporation, balanced fertilization, and the use of nitrification or urease inhibitors not only has the potential to maintain or increase crop yields but also to enhance nitrogen fertilizer utilization efficiency and mitigate greenhouse gas emissions [19]. Additionally, the application of urease inhibitors (such as N-butylthiophosphorotriamine (NBPT)) and nitrification inhibitors (such as 3,4-Dimethylpyrazole phosphate (DMPP)) offers an alternative strategy to reduce the use of chemical fertilizers while optimizing nutrient utilization. NBPT inhibits the hydrolysis of urea, while DMPP prevents the oxidation of ammonium [20]. Numerous research studies have confirmed the substantial impact of nitrification inhibitors in reducing N2O emissions, outperforming urease inhibitors in this regard [21,22]. Furthermore, including DMPP or NBPT in nitrogen fertilizer application effectively increases crop yield and improves nitrogen use efficiency (NUE) [23]. Therefore, addressing the rational use of crop straw and nitrogen fertilizer with efficiency enhancers in the black soil region of Northeast China is a pressing issue, crucial for achieving crop yield optimization and maintaining soil environmental quality.
The use of model simulation methods is prevalent in evaluating the influence of diverse agricultural management practices and environmental factors on crop yield and soil conditions. Liu et al. [24] employed the CSM-CERES-Maize crop module in conjunction with the CENTURY tillage module within the DASSAT model to simulate and verify maize yield and soil temperature in the Northeast China black soil region under traditional cultivation, reduced tillage, and no-tillage treatments. Feng et al. [25] utilized the APSIM crop model combined with machine learning techniques to assess the impact of climate factors on wheat yield, revealing the interconnectedness of climate and soil on crop productivity in the context of climate change. Thiault et al. [26] examined changes in average yield across four major crop types (maize, rice, soybean, and wheat) using multiple models (GCM; GFDL-ESM0M, HadGEM5-ES, IPSL-CM2ALR, MIROC-ESM-CHEM, and NorESM2-M), demonstrating that if the current carbon dioxide (CO2) emission scenario remains unchanged, approximately 90% of global regions could face a decline in food production by 2100. Zhang et al. [27] employed the DNDC model to simulate the impact of future climate change on wheat and maize yield, organic carbon levels, and N2O emissions under conservation tillage. The study recommended adopting a low-nitrogen fertilizer–high straw addition no-tillage system in the SSP245 and SSP585 scenarios, as it effectively increases crop yield and significantly enhances soil organic carbon levels. Liang et al. [28] quantitatively analyzed the effects of water-saving and traditional rice production systems on yield, WUE, and NUE by reducing water and fertilizer application using the Soil Water Heat Carbon Nitrogen Simulator (WHCNS) model. The results indicated that combining irrigation control with nitrogen management systems can reduce water consumption and N2O emissions while simultaneously improving WUE and NUE. Prior studies on WUE and NUE in spring maize fields have primarily focused on comparing different cultivation practices, with limited emphasis on the impact of combining conservation tillage with nitrogen inhibitors and other measures on WUE and NUE in farmland, particularly under diverse precipitation patterns. Thus, additional research is needed to investigate the effects of integrating conservation tillage practices with nitrogen inhibitors on spring maize yield and N2O emissions under varying precipitation patterns.
This aims of this study are (i) to test the feasibility of the WHCNS model in simulating soil water dynamics, N fates and crop yield in the Northeast Black Soil region; (ii) to assess the response of maize yield and N2O emissions to combined conservation tillage with urease/nitrification inhibitors using the WHCNS model; and (iii) to evaluate the effects of combining conservation tillage with urease/nitrification inhibitors on N2O emissions under long term varied rainfall patterns, and subsequently propose appropriate management practices for the sustainable development of agriculture in the region.
The structure of this paper is as follows: Firstly, we described the experimental design (two kinds of tillage systems and two the types of nitrogen inhibitor) and the obtained methods of dataset for model inputs. Secondly, the WHCNS model was calibrated and validated by experimental dataset. Then, the tested model was used to analyze 30-year (1991–2020) yield and N2O flux trends under different management practices. Finally, the best combination of tillage with inhibitor was recommended to increase crop yields, improve soil quality and reduce greenhouse gas emissions for the local farmers.

2. Materials and Methods

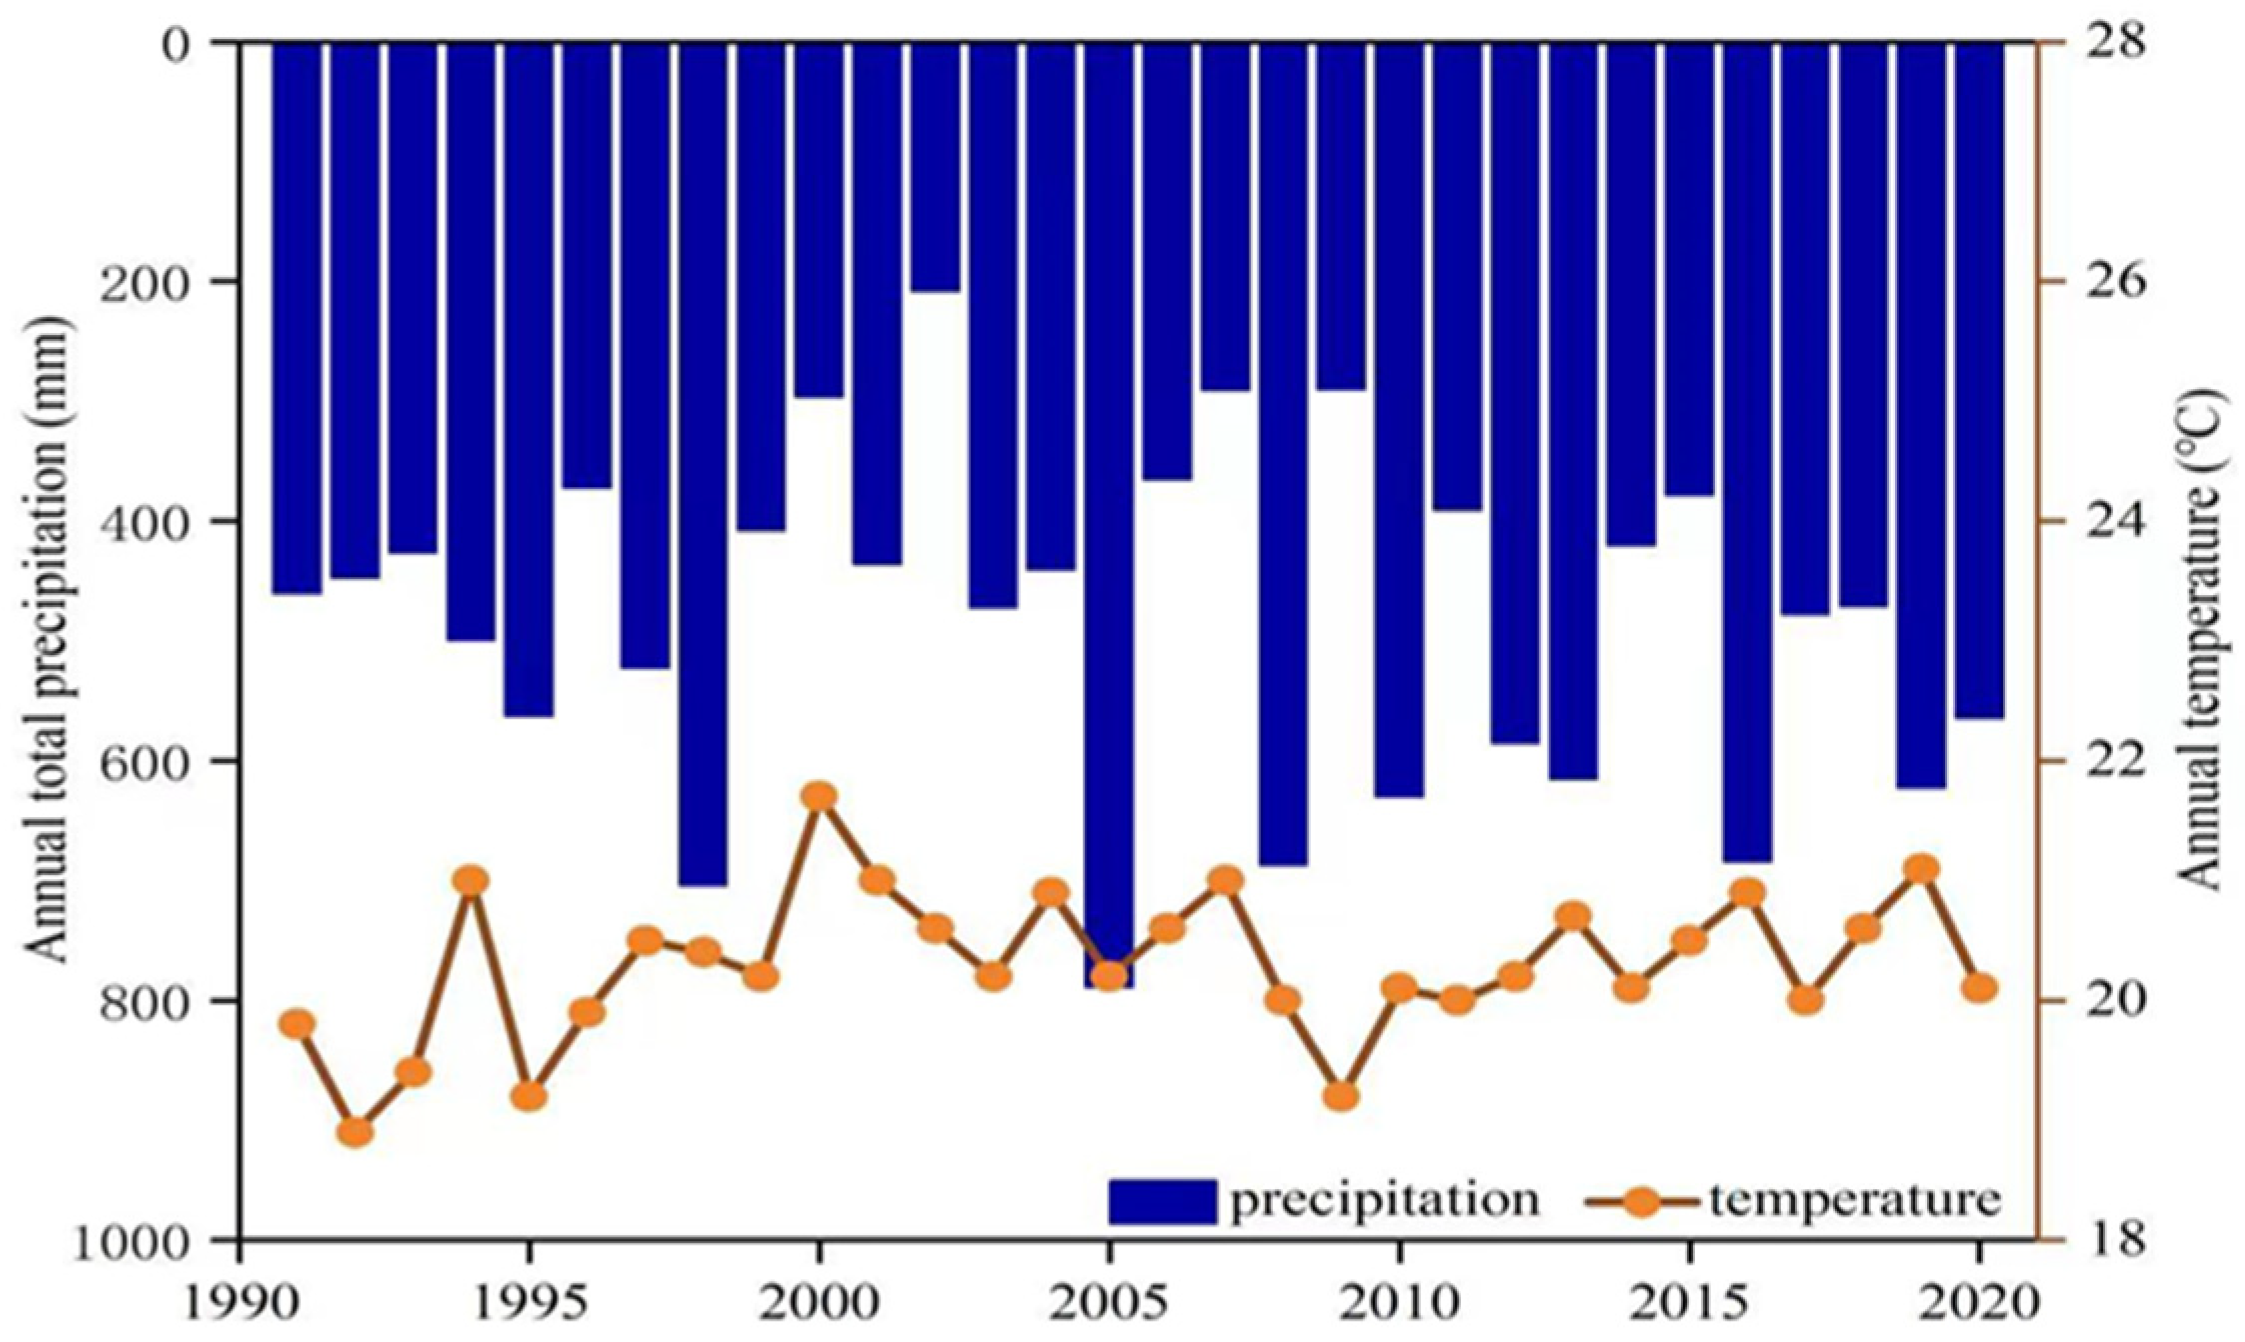
2.1. Experimental Site Description

The experimental site is situated in Sishu Township, Lishu County, Siping City, Jilin Province, China (43°10′ N, 124°00′ E), at an elevation of 170 m. It experiences a temperate, semi-humid continental monsoon climate with abundant rainfall during the rainy season, averaging 548 mm. The site possesses ample solar radiation resources, with an annual average sunshine duration of 2644 h. Throughout the crop-growing season (April to October), the sunshine duration is 1435 h, and the average annual temperature is 18.0 °C. Average temperature and rainfall data during the growing period of each year from 1991 to 2020 are displayed in Figure 1. The accumulated annual temperature above 0 °C is 3255 °C, and above 10 °C, it is 3032 °C, resulting in a frost-free period lasting approximately 156 days. Meteorological data were obtained from the local small meteorological station, mainly recording daily rainfall, maximum temperature, minimum temperature, average temperature, relative humidity, daily average wind speed, etc. The soil at the experimental site is classified as black soil [29].

2.2. Experimental Design

A field experiment was conducted in the study area from May 2019 to October 2020, with a duration of 2 years. The experiment utilized a two-factor design, with the main factor being the tillage system: strip tillage (ST) and conventional tillage (CT). In the ST system, the land was leveled, and complete straw crushing and returning were performed. Tillage strip width is 0.25 m and the width of the non-tilled strips is 0.4 m. Fertilizer strips are deeply applied to the tillage zone (depth of 12 cm). In the CT system, the land was cultivated in ridges without returning the straw. After fertilizer application, it was plowed and incorporated into the soil (depth of 15 cm). The secondary factor was the type of nitrogen inhibitor, consisting of three treatments: (1) conventional urea (U), (2) urea + urease inhibitor (U + NBPT), and (3) urea + nitrification inhibitor (U + DMPP). The nitrogen application rate for all treatments was 180 kg N ha−1, with P applied at a rate of 90 kg P2O5 ha−1 as Ca(H2PO4)2 and K applied at a rate of 90 kg K2O ha−1 as K2SO4. All fertilizers were applied as a basal fertilizer before maize sowing. The spring maize variety, Liangyu 99, was planted at a density of approximately 65,000 plants per hectare. The experiment followed a split-plot design within a randomized complete block with three replications. There was a total of 18 sub-plots, with each sub-plot measuring 108 m2. The experimental site did not receive irrigation throughout the year and adhered to other management practices consistent with those commonly employed by local farmers.

2.3. Field Sampling and Laboratory Analysis
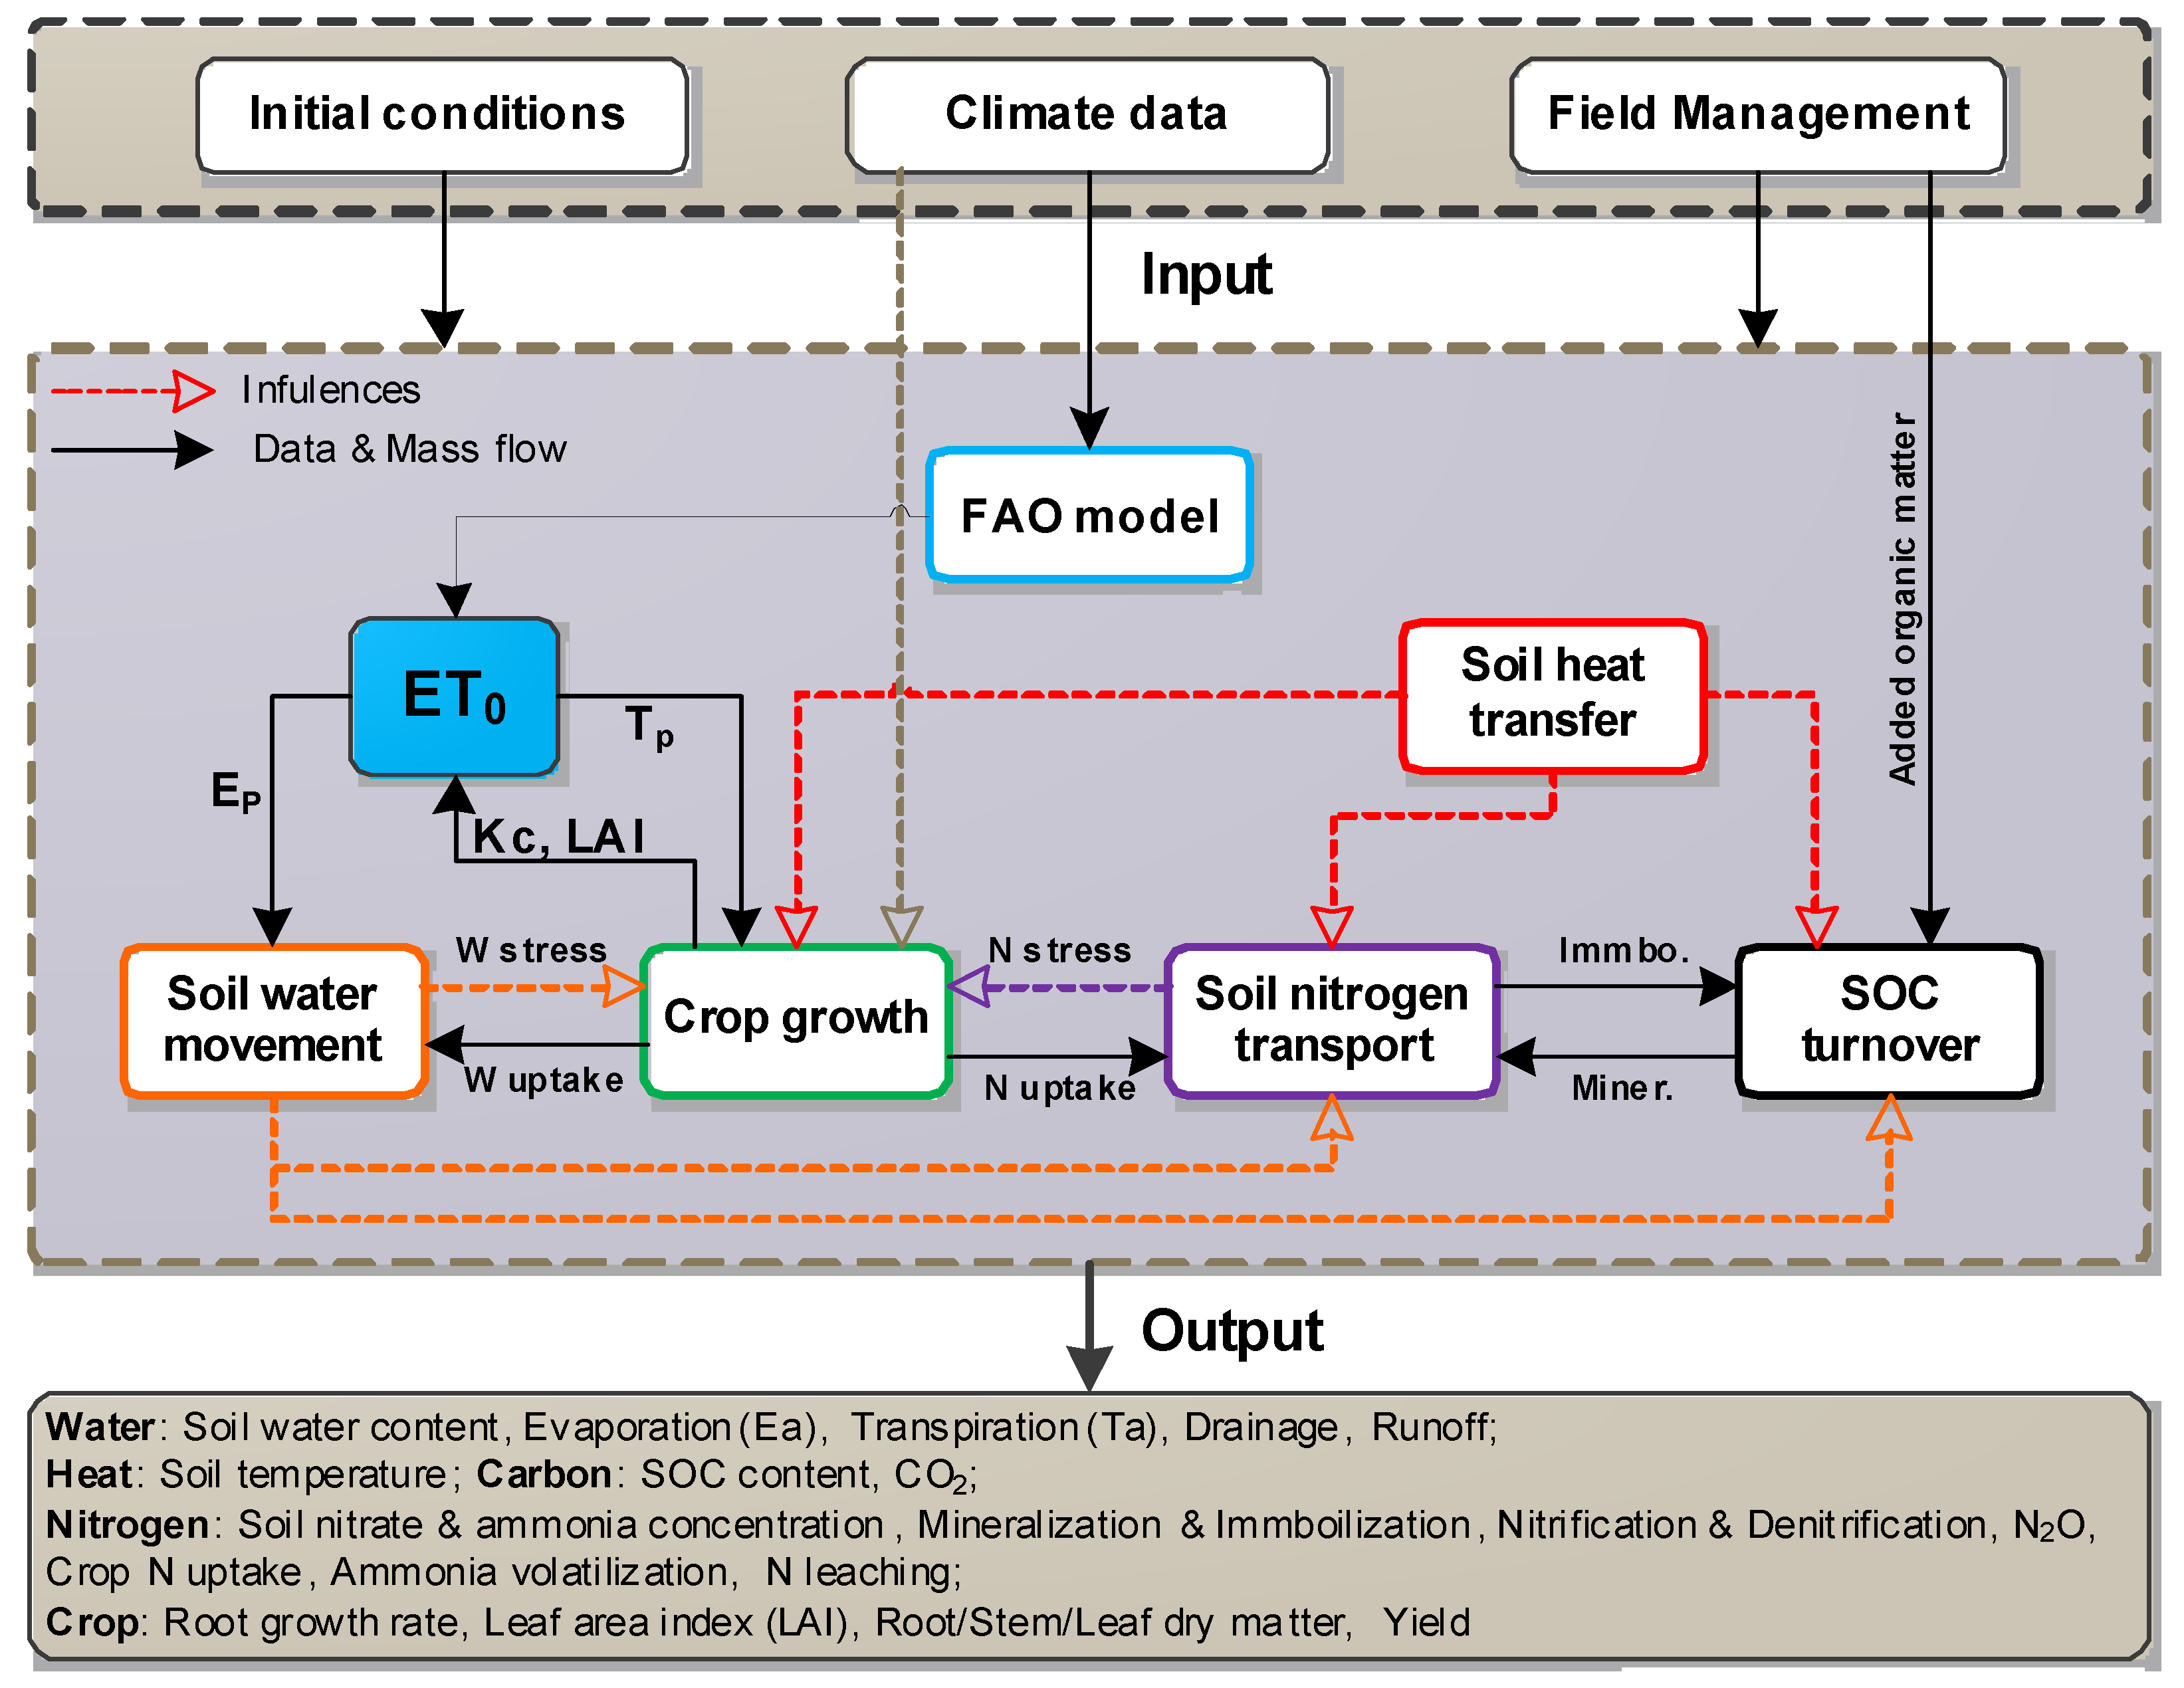
N2O emissions were manually measured using the closed static chamber method [30]. Each chamber consisted of a top chamber (50 cm × 30 cm × 10 cm) and a stainless-steel base frame (50 cm × 30 cm × 30 cm). The frames were inserted 10 cm deep into the soil before maize sowing and fertilization. Fertilizer was then separately added to the base frame for seeding purposes. Gas samples were collected from 08:00 a.m. to 11:00 a.m. according to a sampling schedule of 0, 10, 20, and 30 min. Following fertilizer applications and precipitation events, gas samples were collected at intervals of 1–2 days for approximately 10 and 5 days, respectively, depending on when the gas fluxes returned to normal levels. For sampling, gas was injected into a 10 mL vacuum tube and stored in a dark environment. The tubes were transported to the laboratory for N2O determination using gas chromatography (Agilent 7890A, Shanghai, China). N2O fluxes were determined by calculating the linear increase in chamber concentrations during the sampling period, while cumulative emissions were estimated through linear interpolation.
During the critical reproductive period of spring maize, three representative plants were selected in each plot and their leaf width and leaf length were measured to calculate the leaf area index (LAI). At harvest time, 30 plants from three rows in the center of each plot were chosen for determining the yield of maize.
Soil profile pits were dug to a depth of 100 cm in strip tillage plot, and soil samples were collected at 20 cm intervals before spring maize sowing. Soil texture was tested using a Laser Particle Size Analyzers (mastersizer2000) and soil bulk density was determined by the cutting-ring method [31,32]. The soil hydraulic parameters were estimated using the pedo-transfer function (PTF) method [33]. Soil samples were collected from the 0–100 cm soil profile at the key growth stages of spring maize (jointing stage, silking stage, filling stage, and maturity stage) for each plot. The soil moisture content was determined using the drying method at 105–110 °C. Fresh soil samples were extracted with 1 mol L−1 KCl and analyzed for the concentrations of NH4+-N and NO3-N using a continuous-flow analyzer (AA3, Bran + Luebbe, Norderstedt, Germany) [34].

2.4. WHCNS Model

The model is driven by daily meteorological data and crop biological parameters. It includes modules for meteorological soil water movement, soil heat transfer, nitrogen transport and transformation, organic matter turnover, crop growth, and field management. The potential evapotranspiration (ET) is calculated using the Penman–Monteith method [35]. Water infiltration and redistribution in the soil profile are described by the Green–Ampt method [36] and the Richards equation [37], respectively. The soil heat transfer is simulated using the convection–dispersion equation. The soil nitrogen transport process is described by the convection–dispersion equation. Concepts of soil carbon and nitrogen cycling are derived directly from the Daisy model [38]. The general PS123 crop model is applied to simulate annual crop growth processes, including crop development stages, LAI, photosynthate accumulation and allocation, maintenance and growth respiration, and crop yield formation [39]. Simulation of crop yield under water and nitrogen limitation is achieved through calibration factors for water and nitrogen stress. The model can be used to simulate and analyze the effects of various field management practices such as irrigation, fertilization, mulching, tillage, and straw returning on farmland water consumption, nitrogen fate, organic matter turnover, and crop growth. For more details on the model, refer to [40]. Some of the parameters are shown in Table S1. The inputs and outputs of WHCNS model are shown in Figure 2.
The model inputs include the following data: site location (latitude, altitude), basic soil physical–chemical properties, crop data (planting time and harvest time, planting density, planting depth), field management, soil initial water content and mineral nitrogen content, and meteorological data (maximum temperature, minimum temperature, humidity, solar radiation, wind speed and precipitation).

2.5. Evaluation of Model Simulation Effect

In this study, three statistical indices were used to assess the agreement between the predicted and observed values:
(i)
The normalized root mean squared error (nRMSE):
n R M S E = 1 n i = 1 n ( P i O i ) 2 × 100 x ¯
(ii)
Nash–Sutcliffe efficiency (NSE):
E = 1 i = 1 n P i O i 2 i = 1 n O i O 2
(iii)
Agreement index (d):
d = 1 i = 1 n O i P i 2 i = 1 n P i O + O i O 2
where n is the number of data pairs. Pi and Oi are the predicted and observed values, respectively. O is the mean of the observed data. nRMSE represents the percentage of the average deviation to the measured mean. nRMSE < 15%, nRMSE = 15–30%, and nRMSE > 30% are considered “good,” “moderate,” and “poor” agreement, respectively [41]. E ranges between −∞ and 1 and allows for a negative error. The d value is a descriptive measure that ranges from 0 to 1, wherein a value close to 1 indicates satisfactory model performance. According to a previous study [42], it is recommended that quantities of d ≥ 0.75 and E ≥ 0 are the minimum threshold values for crop growth. Quantities of d ≥ 0.60 and E ≥ −1 are the minimum threshold values for N output evaluation.

2.6. Simulation Scenarios

To assess the impact of tillage practices with an N fertilizer inhibitor on maize yields and N2O emissions across varying annual precipitation levels, we employed the validated WHCNS model. Meteorological data spanning the period from 1991 to 2020 were inputted into the model. Subsequently, we simulated crop yield and N2O emissions under climate change conditions over a 30-year timeframe. The rainfall assurance rate was determined using the empirical frequency method, considering the annual precipitation patterns during the growing season.
p = m n + 1 100 %
where n represents the total number of years in the dataset, which is 30 in this study, m represents the position of a year in the newly arranged sequence, m ranges from 1 to n, and p presents the assurance rate in percentage (%).
Three precipitation patterns were identified based on the frequency distribution of rainfall during the growing season. The threshold for classification was set at rainfall assurance rates of 25% and 75%. Years experiencing rainfall below the 25% assurance rate during the growing season were classified as drought years (1996; 2000; 2002; 2006; 2007; 2009; 2015). Years with rainfall between the 25% and 75% assurance rates during the growing season were categorized as normal years (1991; 1994; 1995; 1997; 2003; 2004; 2012; 2017; 2018; 2020). Finally, years with rainfall equal to or exceeding the 75% assurance rate during the growing season were classified as wet years (1998; 2005;2008; 2010; 2016; 2019).

2.7. Data Analysis

The data were analyzed using the analysis of variance (ANOVA) in DPS 7.05 statistical software provided by Ruifeng Information Technology Co., Ltd., Yangzhou China. Mean values were compared using the least significant difference (LSD) method and the Tukey test at a significance level of 5%. Multiple stepwise regression analysis was conducted in JMP Pro 14 software developed by SAS Institute in Cary, NC, USA. In the multiple stepwise regression analysis, the variables “straw return amount,” “rainfall,” “minimum temperature,” and “maximum temperature” were modeled as continuous, whereas the variables “cultivation practices” and “nitrogen inhibitor types” were modeled as categorical. The model selection was based on the lowest Bayesian Information Criterion (BIC) value, with a threshold for collinearity determined using variance inflation factor (VIF) values during the simulation [43].

3. Results

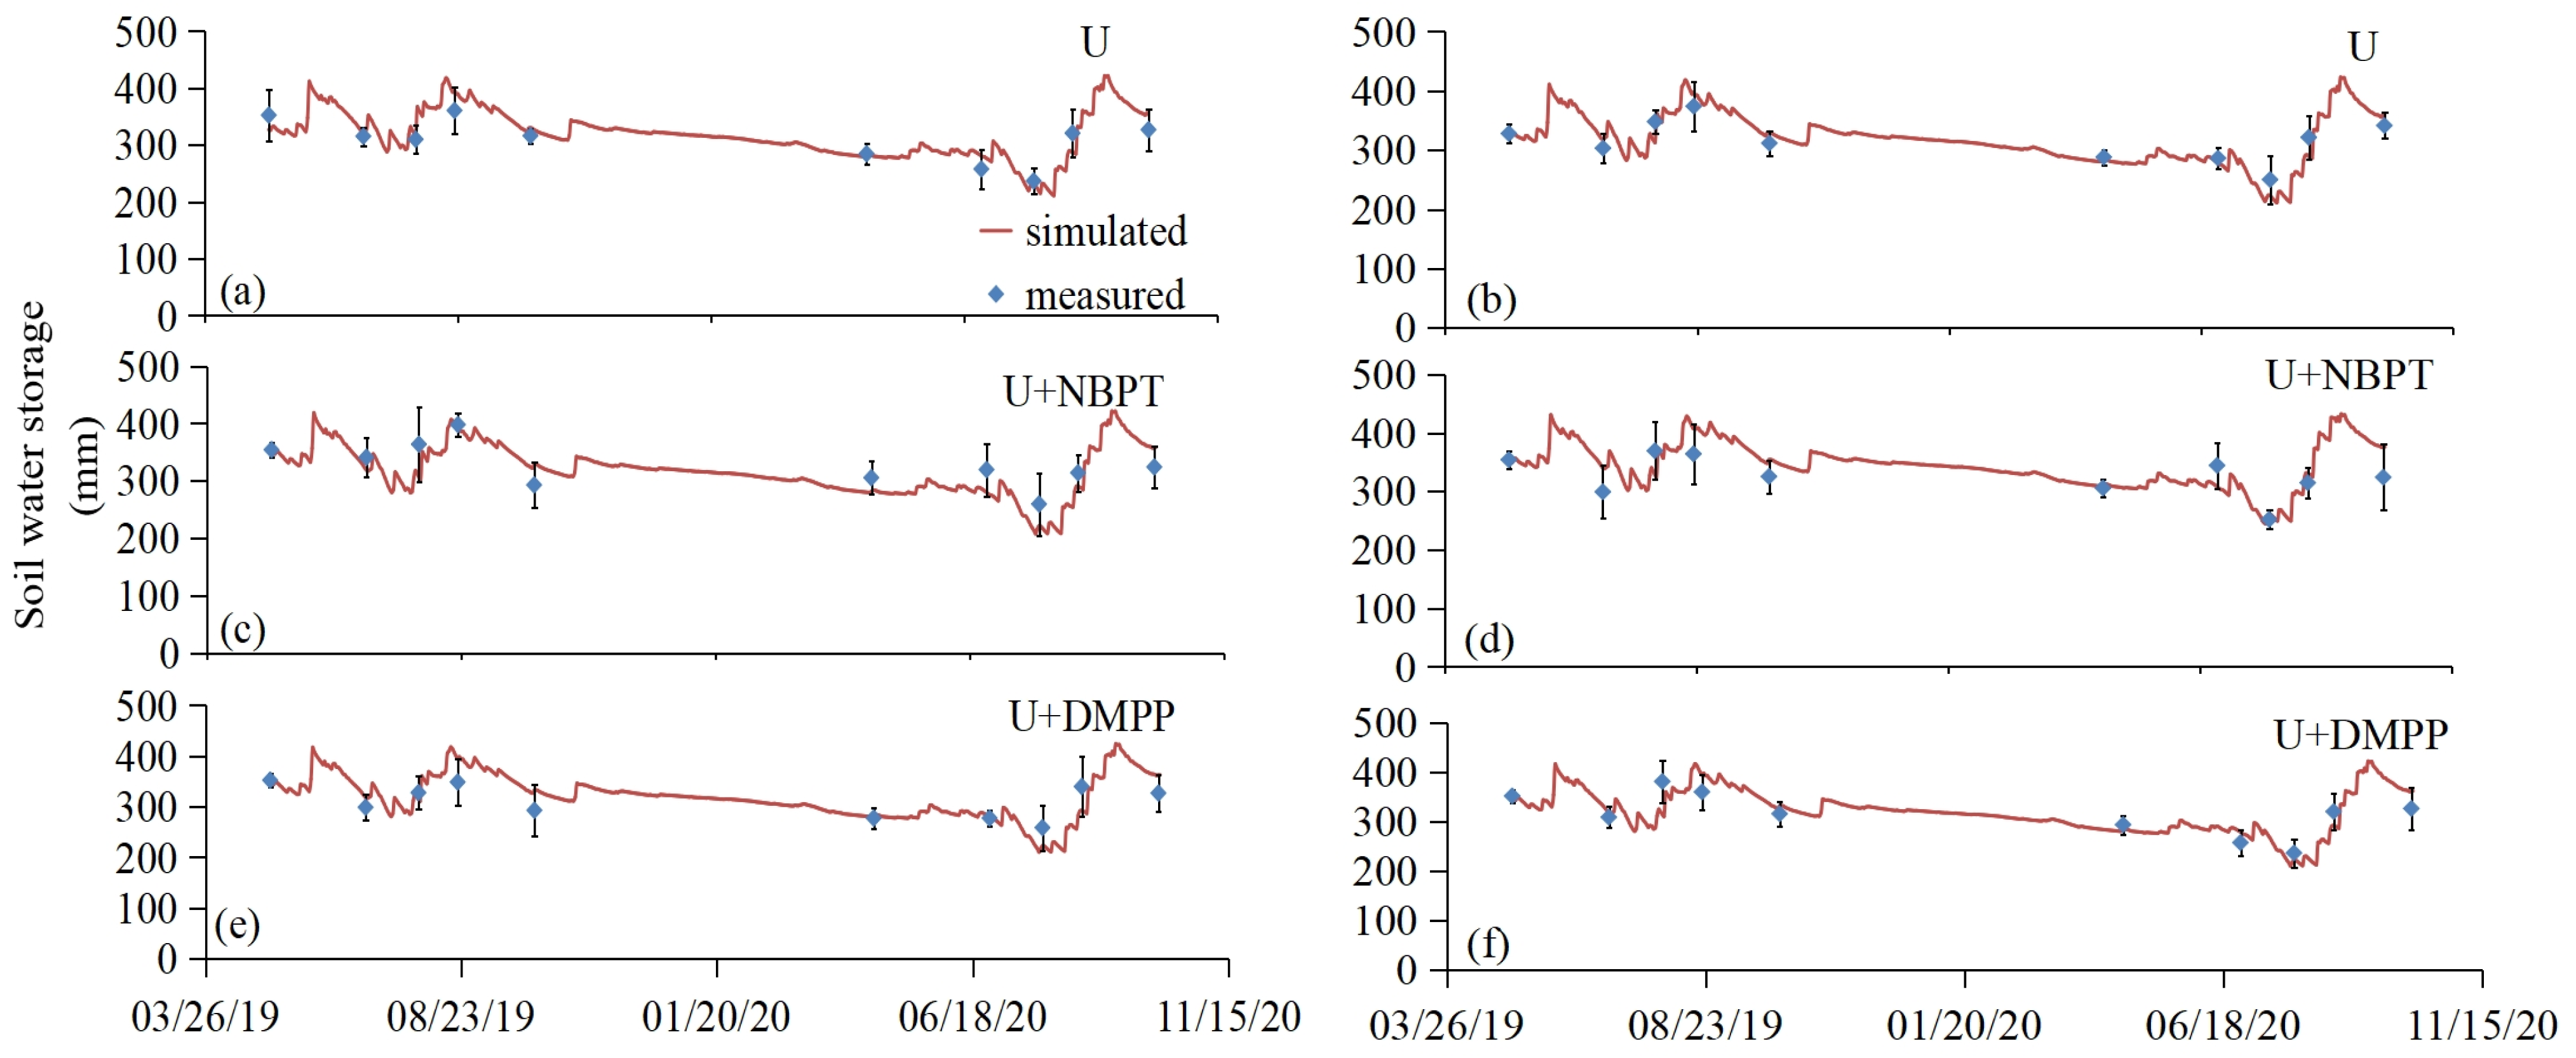
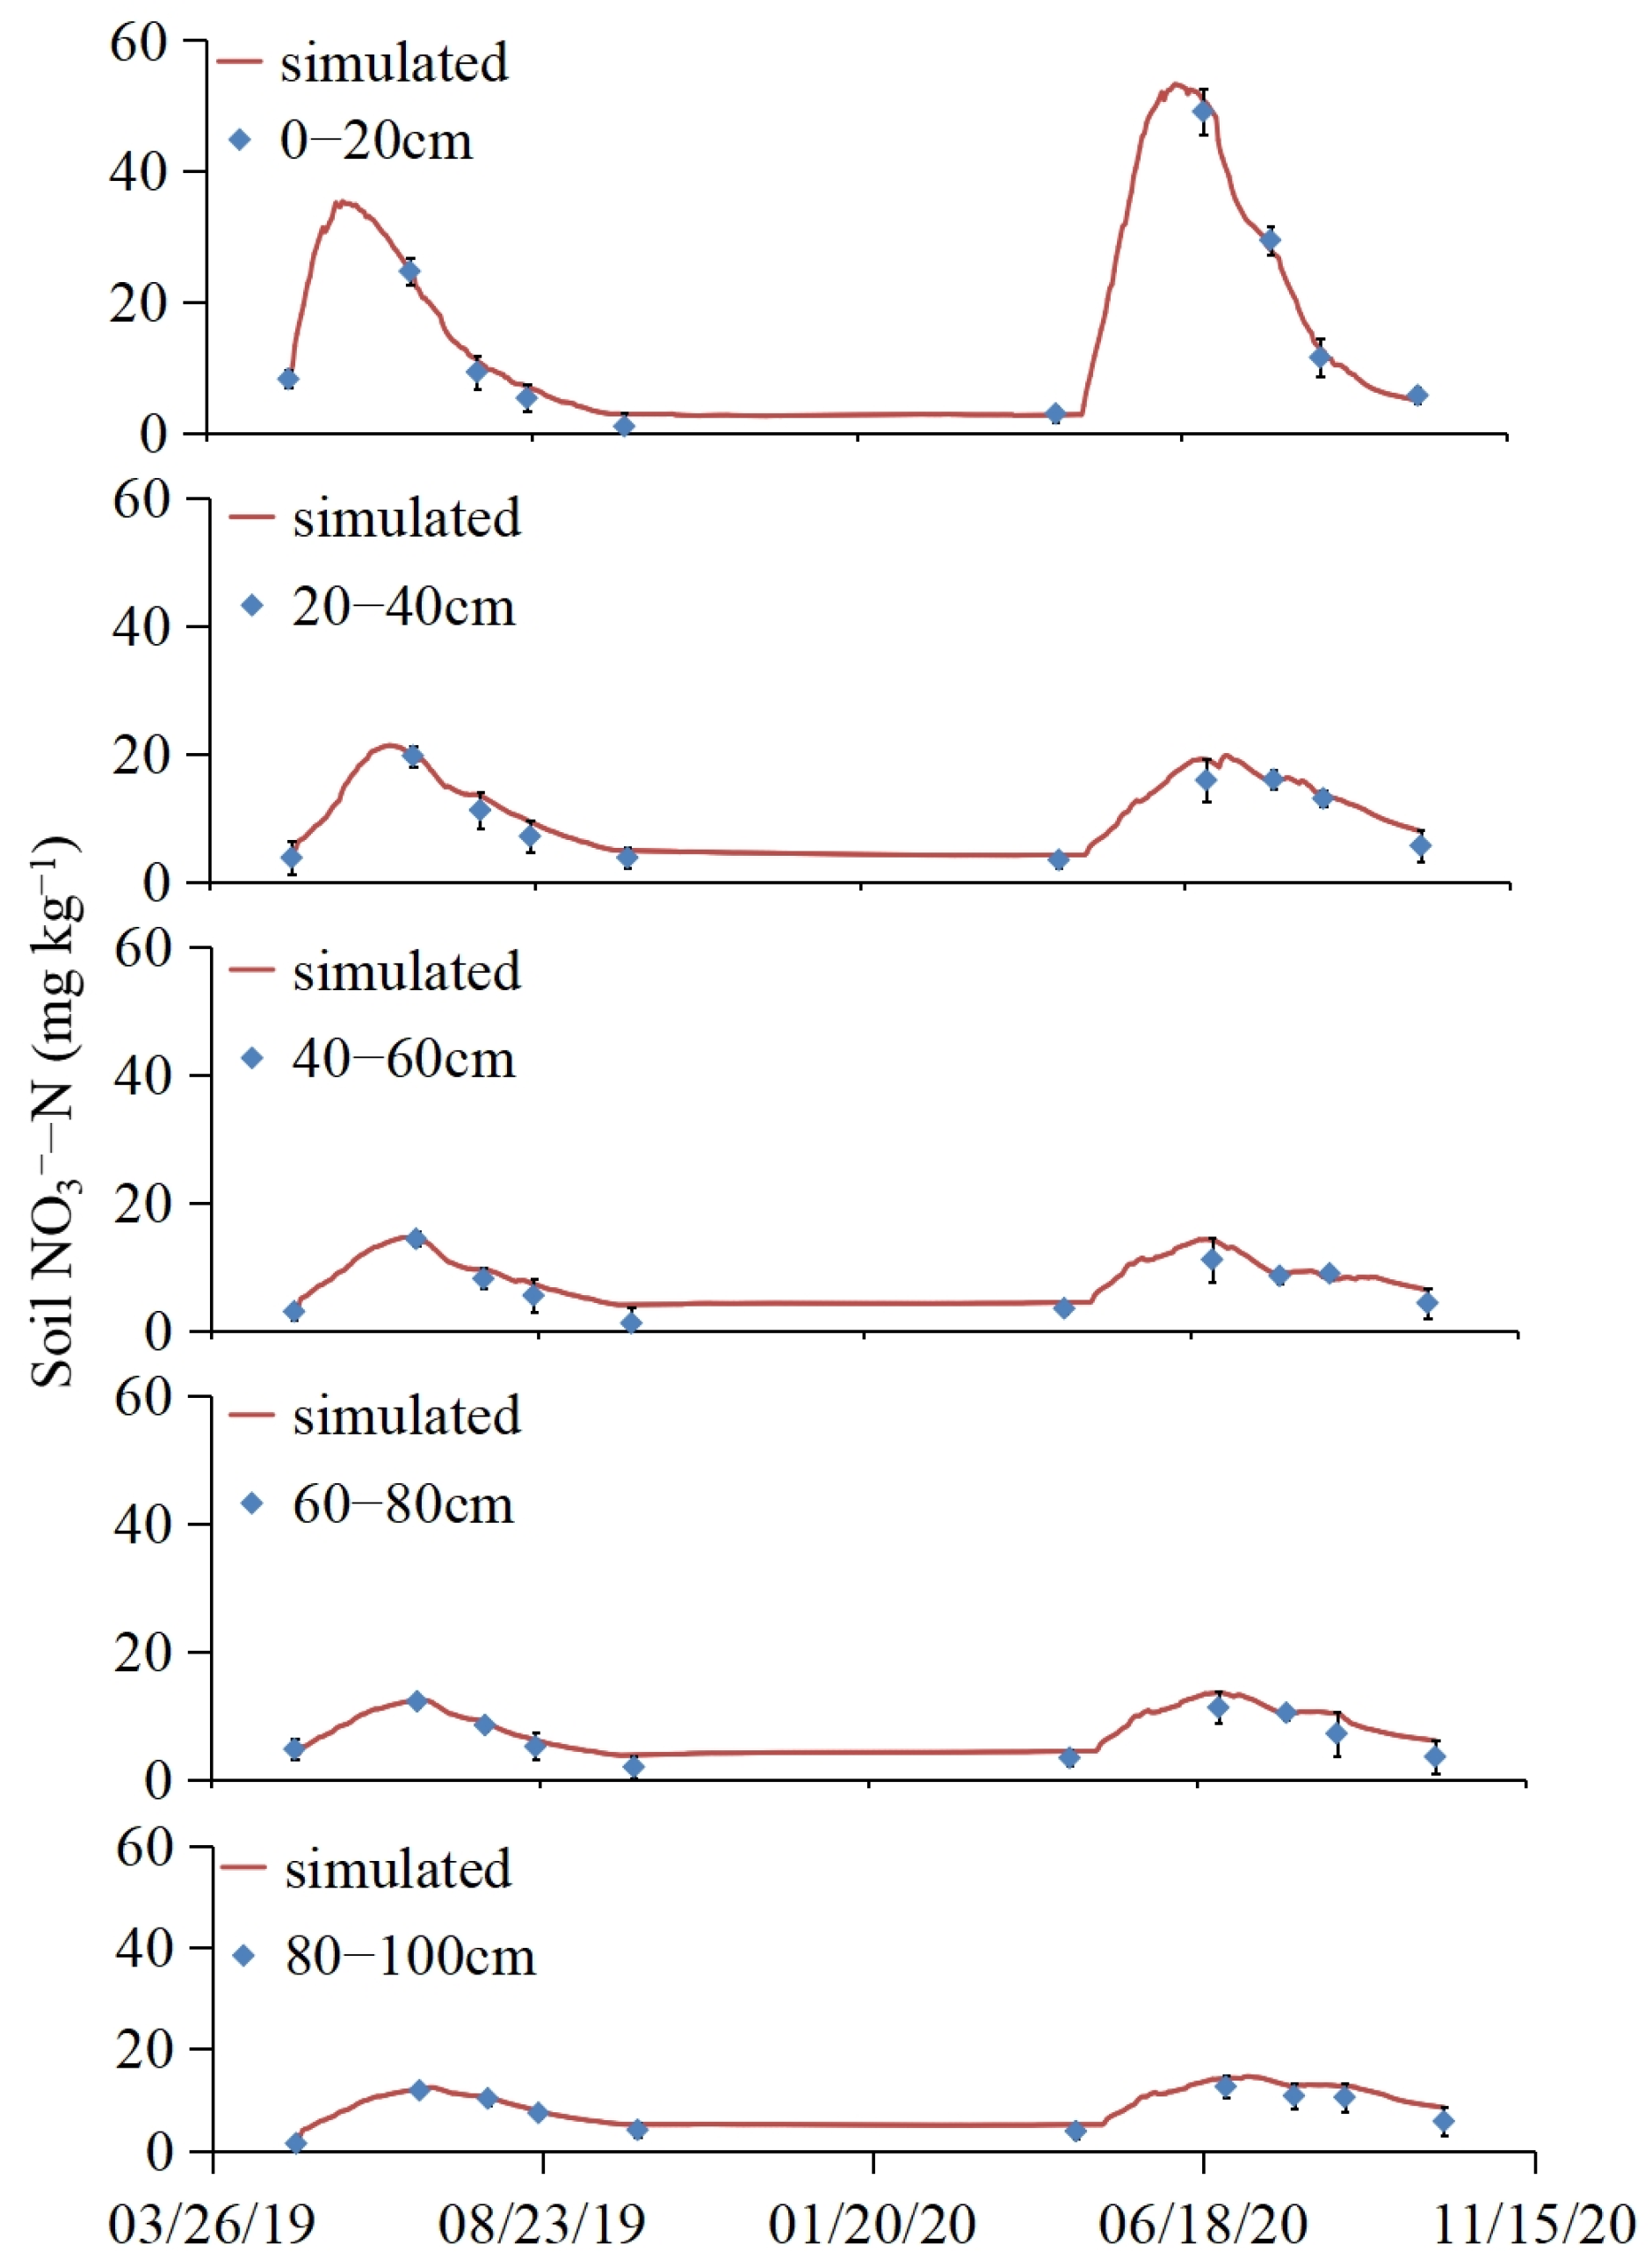
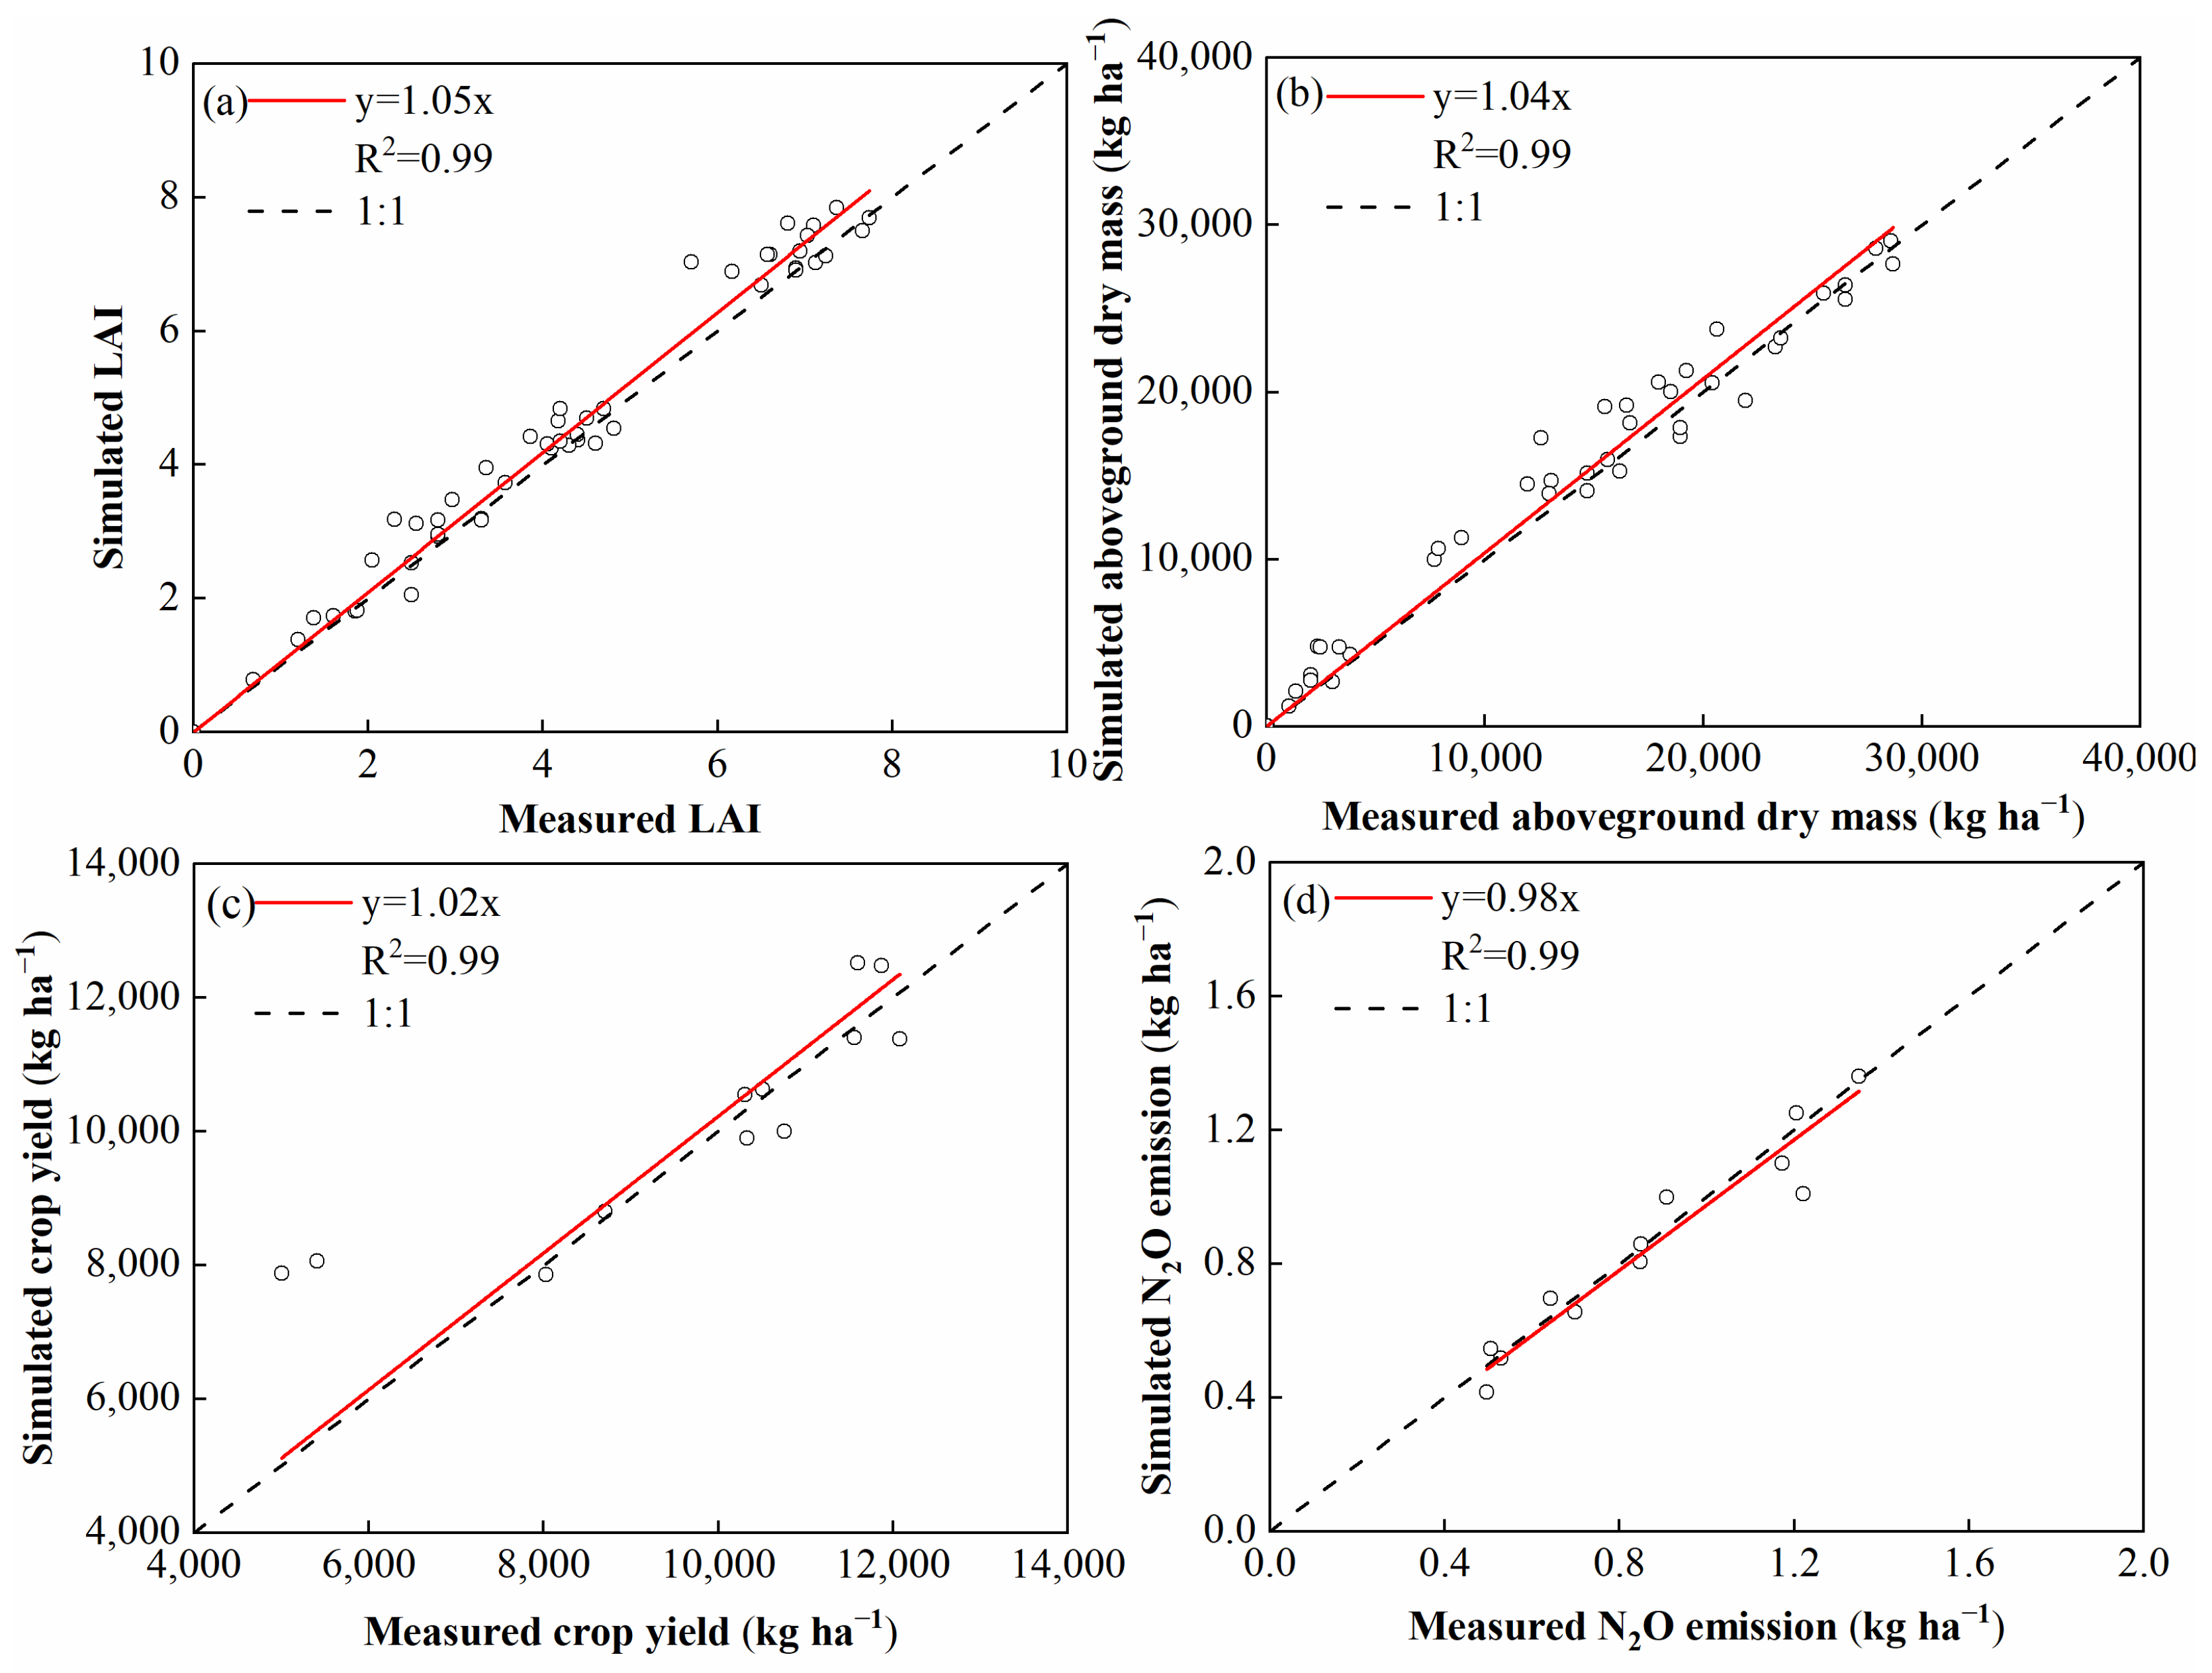
3.1. Model Calibration and Validation

The model was calibrated using measured data on soil water storage (0–100 cm), nitrogen concentration, LAI, ADM, and yield for each treatment in 2019. The model parameters, including hydrodynamic parameters (Table 1), nitrogen transformation, and crop parameters, were adjusted using a trial-and-error method until the simulated values closely matched the measured values. Once the model calibration was completed, the parameters were fixed, and the model was then validated using observations from each treatment in 2020.
The comparison results between the simulated and measured values of soil water storage are presented in Figure 3. The simulated values of soil water storage for each treatment in the calibration year of 2019 and the validation year of 2020 showed good agreement with the measured values. These values increased with the occurrence of rainfall events and decreased as crop water consumption increased. However, there were differences in the dynamics of soil water storage between the two spring maize-growing seasons. In the early stage of maize growth in May 2019, which had lower crop water demand, there were more frequent and heavier rainfall events, totaling 154 mm and accounting for 25% of the total precipitation during the growing season. This excess rainfall replenished the soil, leading to a rapid increase in soil water storage. In the mid-stage of maize growth (June–July), although rainfall accounted for 41% of the total precipitation during the growing season, soil water storage gradually declined due to the increased demand from the growing crop and rising temperatures. During the late growth stage (August–September) of spring maize, soil water storage gradually increased with continuous rainfall replenishment, but it decreased gradually as the crop’s water demand continued to increase.
During the initial stage of maize growth in 2020, a drought occurred, resulting in rainfall being 98 mm less than that in 2019. The soil water storage demonstrated an initial increase, followed by a subsequent decrease during the mid- to late-growth stages. Throughout all growth stages, the soil water storage of the ST system consistently exceeded that of the CT system. There were no significant differences observed in the dynamic variation in soil water storage among the different treatments.
Based on Figure 4 and Figures S1–S5, the soil nitrate nitrogen content in the 0–20 cm soil layer reached its peak during the maize elongation stage and gradually decreased with increasing soil depth. However, the variation in soil nitrate nitrogen content in the 60–100 cm soil layer remained relatively stable. This stability can be attributed to multiple factors, such as precipitation and fertilization effects on the surface layer, as well as the mineralization of organic matter and microbial activity primarily occurring within the 0–30 cm surface soil layer. Overall, the soil nitrate nitrogen content was higher in the ST system than in the CT system across all growth stages. Furthermore, the conventional fertilization treatment (U) exhibited a higher growth rate of nitrate nitrogen content compared to the U + NBPT and U + DMPP treatments.
The simulation results for soil water storage, LAI, and ADM are presented in Table 2. The nRMSE, d, and NSE values for the simulated and measured soil water storage under the two tillage practices ranged from 8.1% to 10.8%, 0.94 to 0.98, and 0.68 to 0.76, respectively. Additionally, the nRMSE, d, and NSE values for the simulated and measured aboveground dry matter mass ranged from 14.5% to 20.2%, 0.88 to 0.92, and 0.66 to 0.88, respectively. These results indicate that the simulation outcomes were acceptable, aligning with prior research [44], given that all nRMSE values were below 30%, d values were above 0.88, and NSE values were above 0.66.
The linear regression relationships between the simulated and measured values of LAI, ADM, crop yield, and quarterly N2O emissions for all treatments are presented in Figure 5. The slopes of the regression equations for the simulated and measured values range from 0.98 to 1.05, all closely approximating 1, and the coefficient of determination (R2) reaches 0.99, indicating a strong agreement between the simulated and measured values. Overall, the model consistently aligns with the measured values across multiple indicators. Hence, the model is suitable for simulating and analyzing the dynamics of soil water and nitrogen, as well as the growth process of crops, under different tillage practices and combinations of nitrogen inhibitors in the study area.

3.2. Effect of Conservation Tillage with Nitrogen Fertilizer Inhibitors on Maize Yield, WUE, and NUE

The results of maize yield and NUE under different treatments in 2019–2020 simulated by the model are presented in Table 3. No significant difference in yield was observed between the CT and ST systems over the two years, indicating that the effect of nitrogen fertilizer inhibitors on yield increase was unaffected by tillage system (p > 0.05). However, the yield of maize under the conventional nitrogen fertilizer treatment (U) experienced a significant decrease in 2020 due to the impact of typhoons. In comparison to the U treatment, the average yield increase for the U + NBPT treatment and the U + DMPP treatment was 63.1% and 64.7%, respectively (p < 0.05). The precipitation levels were 623 mm and 573 mm in 2019 and 2020, respectively. Leaching and runoff amounts in 2019 were considerably higher, primarily due to the absence of irrigation and reliance on rainfall as the main water source. As rainfall increased, water leaching and runoff also increased accordingly. The variations in ET ranged from 345–480 mm, while WUE ranged from 1.4–2.9 kg m−3. In both years, the order of ET magnitude was U + NBPT > U > U + DMPP, with treatments U and U + DMPP exhibiting 1.2% and 3.1% lower ET compared to U + NBPT, respectively. When comparing different tillage systems, the average ET over the two years was 1.7% higher in CT than in ST. The order of WUE was U + DMPP > U + NBPT > U. Comparatively, U + NBPT and U + DMPP showed a 64.6% and 70.8% increase, respectively, in WUE compared to treatment U. The average WUE over the two years was 2.1% higher under the ST system than under the CT system.
N leaching and gaseous N release were two significant pathways contributing to N loss, as shown in Table 4. Over the two-year period, the ST system averaged a 59.2% higher drenching volume compared to the CT system for each treatment. In terms of the impact of nitrogen fertilizer inhibitors on N leaching, the U treatment exhibited the highest N leaching at 28.2 kg N ha−1, followed by the U + NBPT and U + DMPP treatments at 21.7 kg N ha−1 and 15.1 kg N ha−1, respectively. Gaseous nitrogen release primarily consisted of N2O emissions and NH3 volatilization. The N2O emission results revealed that the average N2O emission under the ST system was 12.5% higher than that under the CT system (p < 0.05).
Concerning the impact of nitrogen fertilizer inhibitors on N2O emissions, the highest N2O emissions were observed in the two-year average of the U treatment at 0.98 kg N ha−1. The N2O emissions from the U + NBPT and U + DMPP treatments were 0.90 kg N ha−1 and 0.68 kg N ha−1, respectively, representing a 7.7% and 30.7% reduction compared to the U treatment (p < 0.05). In the ST and CT systems, the total gaseous N losses accounted for 15.9% and 23.7% of the N application rate, respectively (p < 0.05). In terms of the effect of tillage patterns on NUE, the average NUE in the CT system reached 46.2%, surpassing that in the ST system (40.3%). Concerning the effect of N fertilizer inhibitors on NUE, both the U + NBPT and U + DMPP treatments exhibited a 15.4% increase in NUE compared to the U treatment.

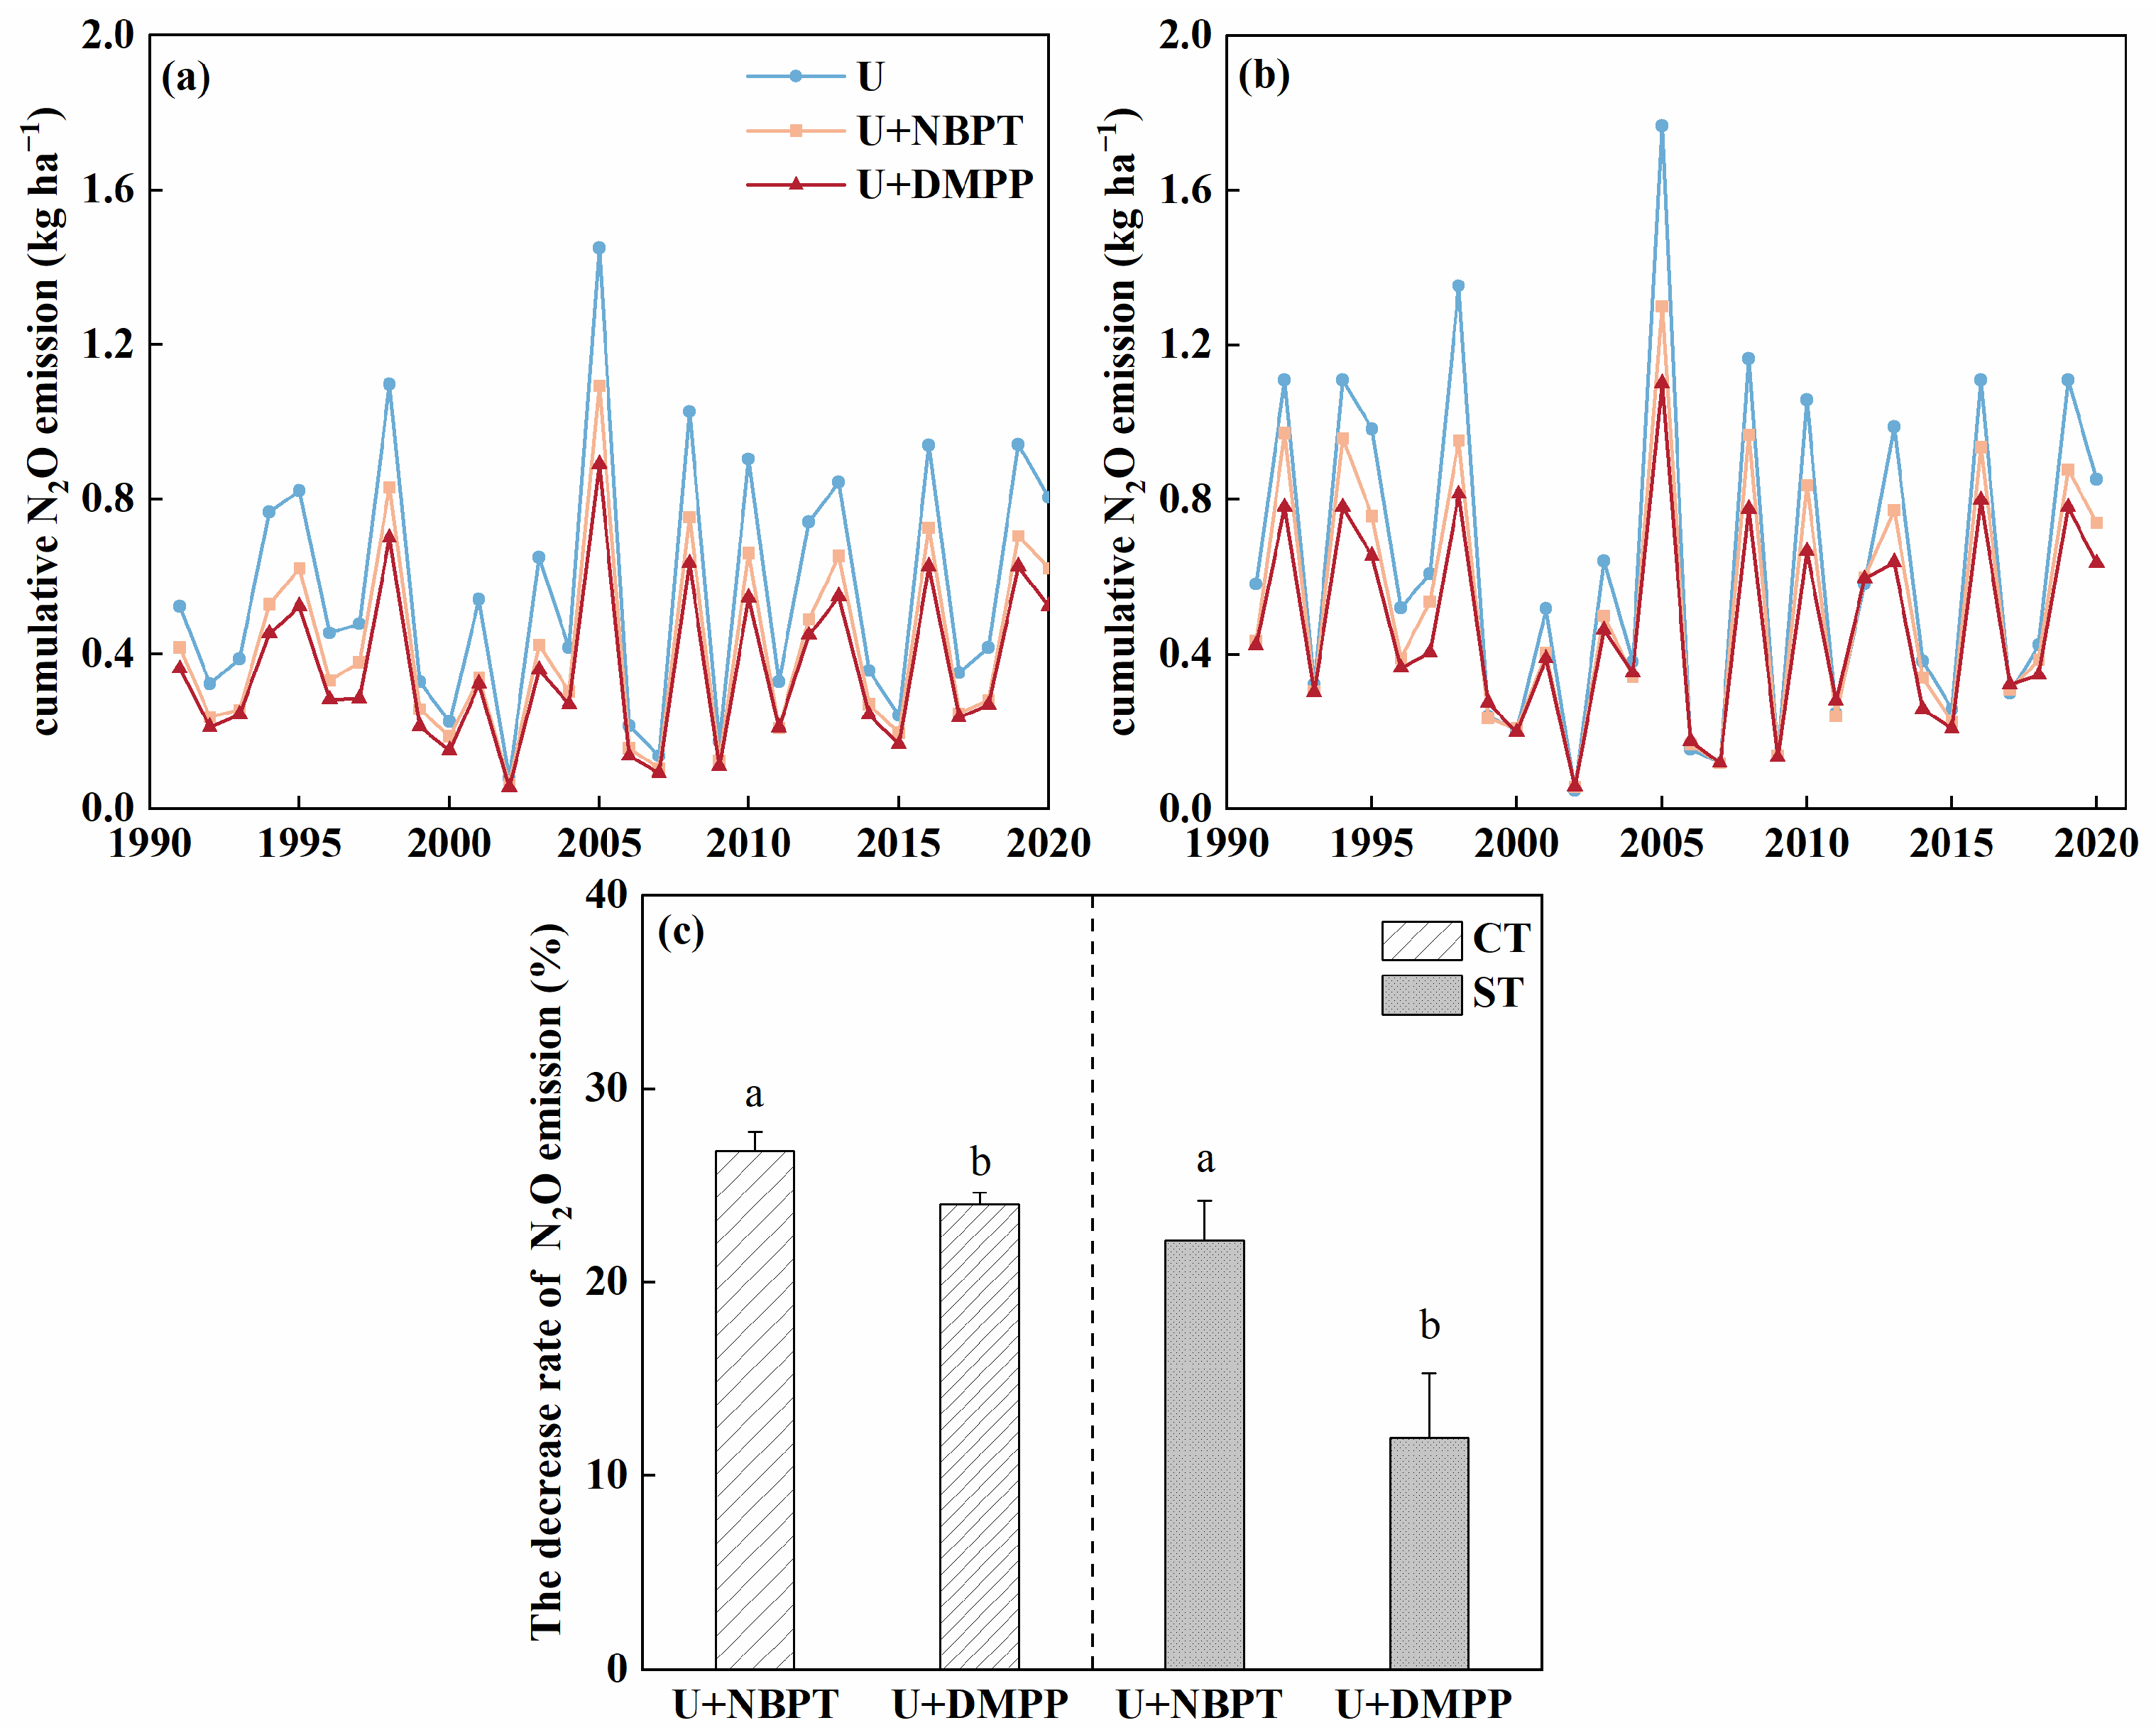
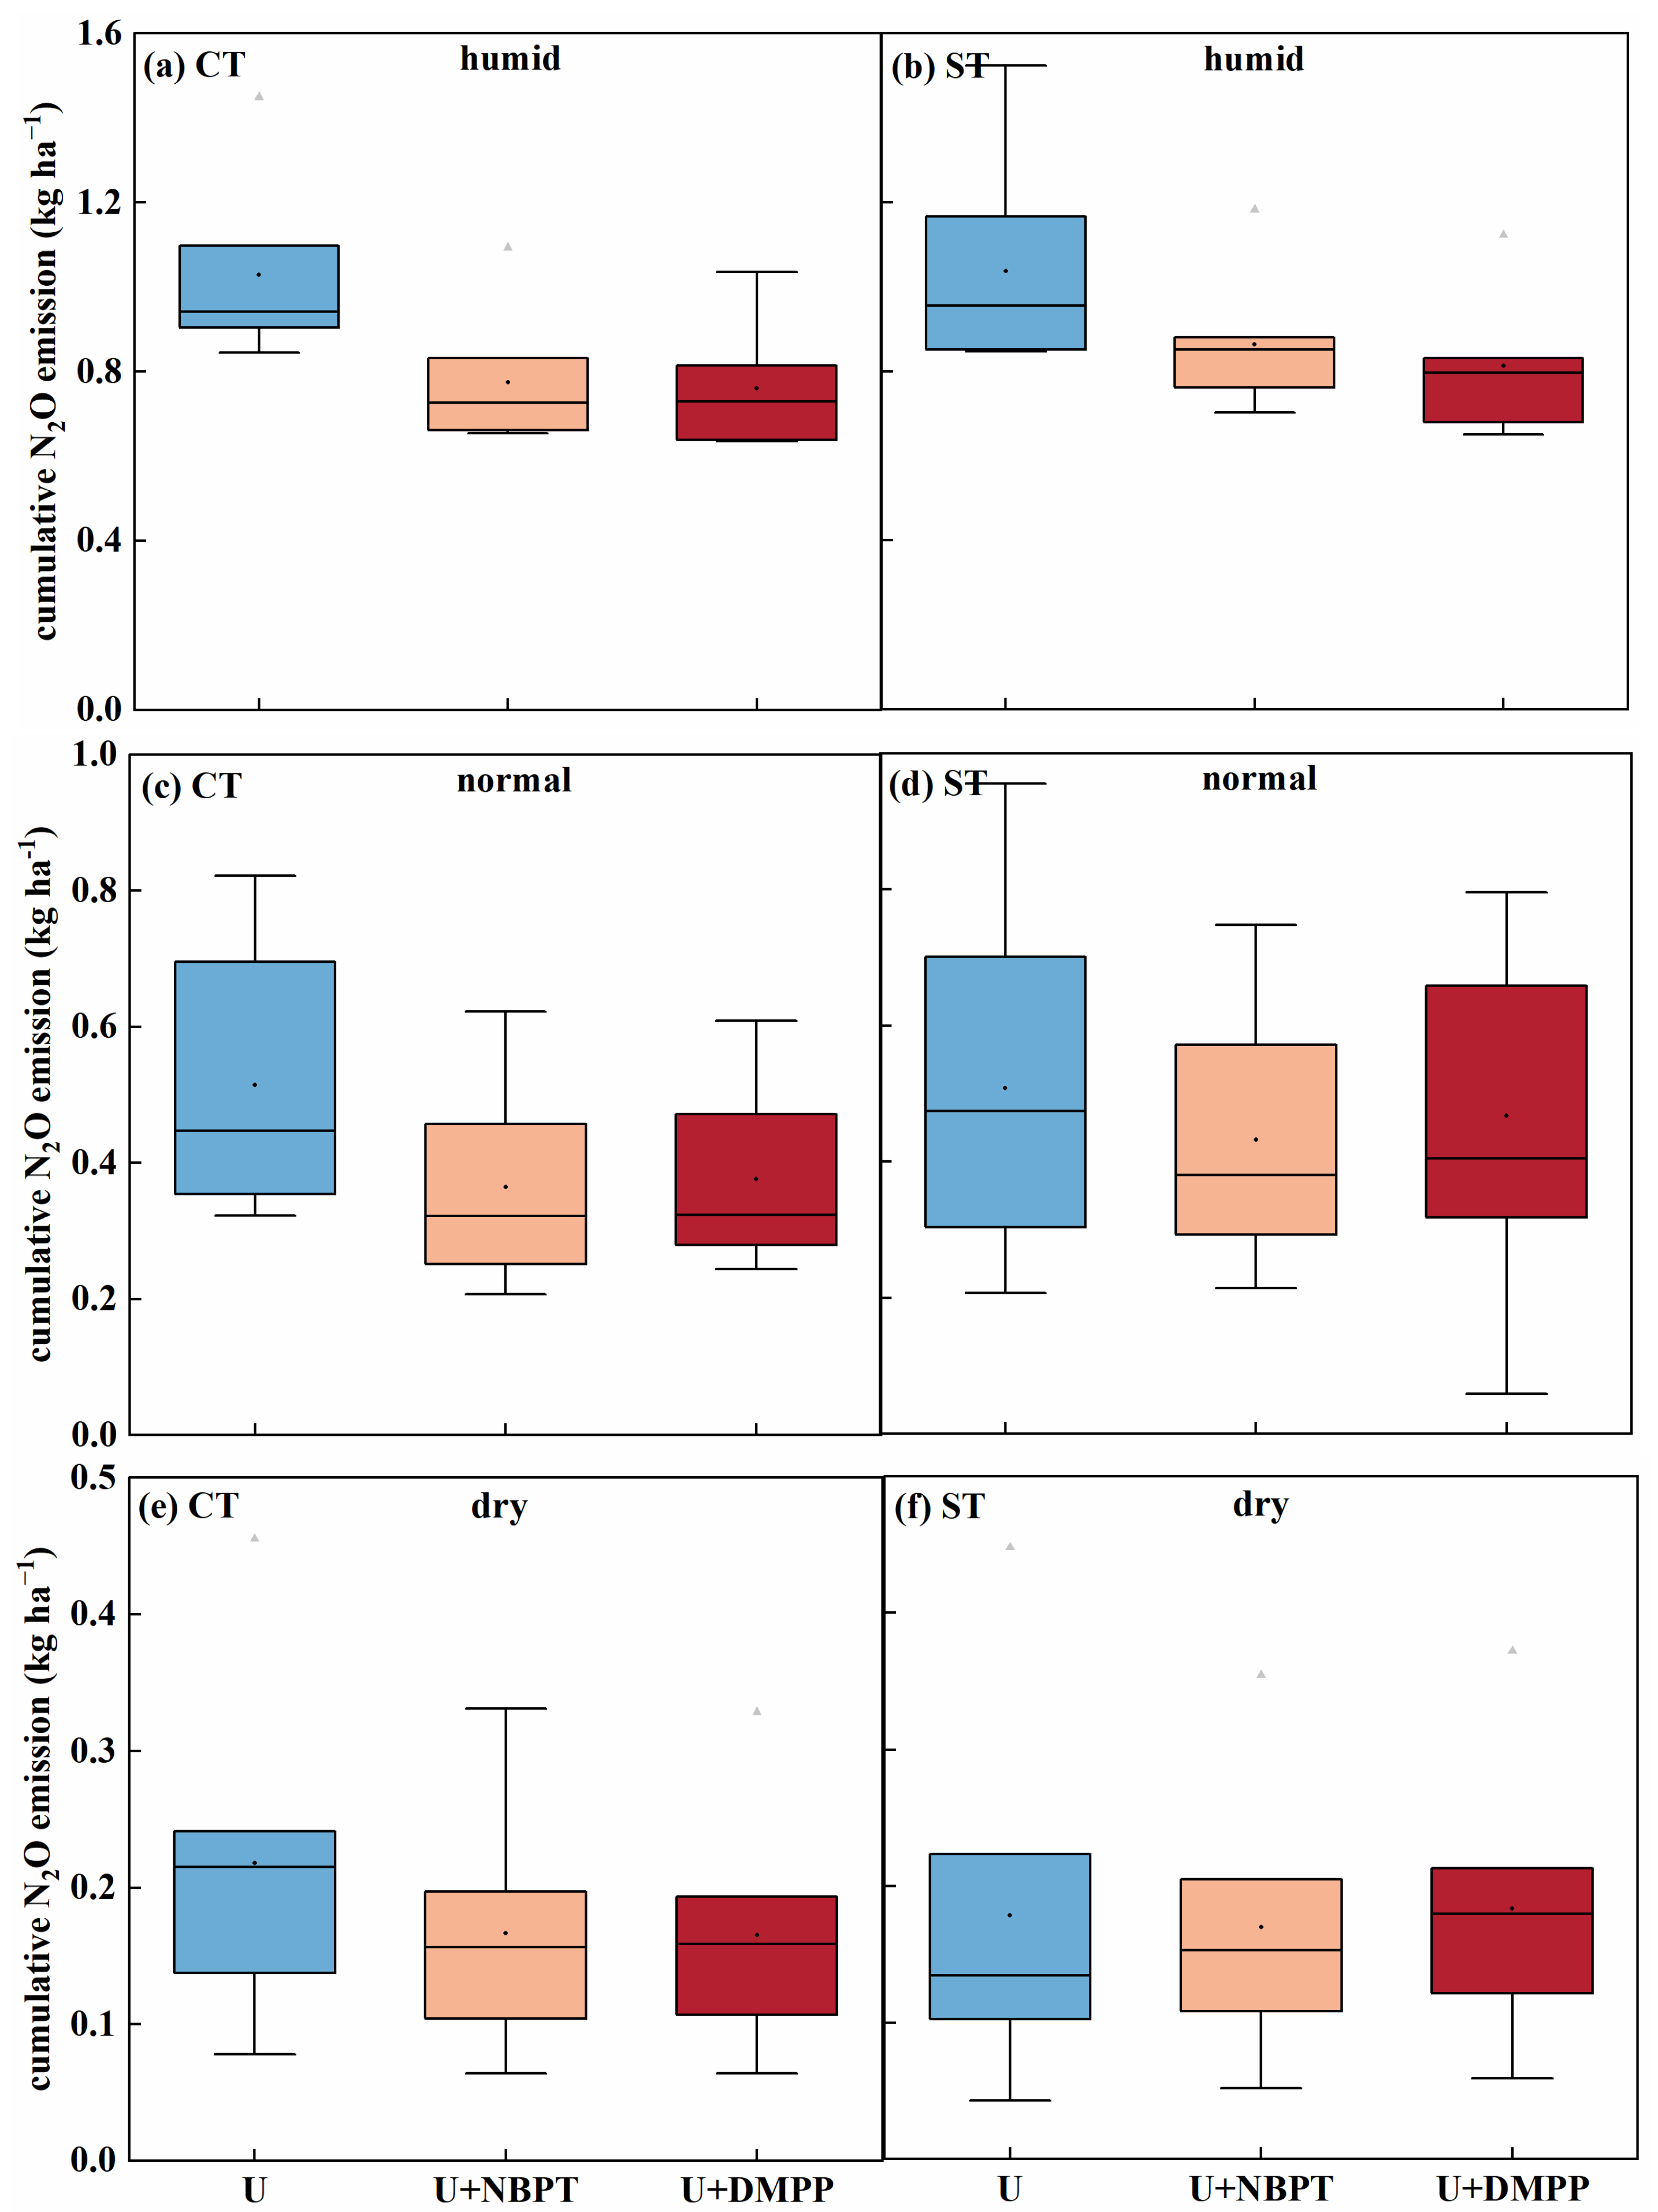
3.3. Changes in N2O Emissions Under Long-Term Conservation Tillage

Compared to the CT system, the ST system exhibited an increase in N2O emissions ranging from 13.6% to 35.8%. The use of N fertilizer inhibitors had a significant impact on the cumulative N2O emissions. Among all treatments, the application of conventional N fertilizer (U) resulted in the highest cumulative N2O emissions, with a recorded value of 0.60 kg N ha−1. The U + NBPT and U + DMPP treatments exhibited cumulative N2O emissions of 0.47 kg N ha−1 and 0.42 kg N ha−1, respectively, indicating a reduction of 21.7% and 30.5% compared to the application of conventional N fertilizer (U). While the ST system exhibited an average increase of 25% in cumulative N2O emissions compared to the CT system, this did not interfere with the effectiveness of N fertilizer inhibitors in reducing N2O emissions. In comparison to the application of conventional N fertilizer (U), the inclusion of NBPT and DMPP led to a notable decrease in the cumulative N2O emissions, with DMPP demonstrating a more effective reduction effect (Figure 6).
The contribution of each factor was analyzed by using a multiple stepwise regression model. Table 5 showed the stepwise multiple stepwise regression model for N2O emissions (adjusted r2 = 0.82, n = 180, p < 0.0001). Precipitation accounts for the largest proportion (46.4%) in explaining the variance in N2O emissions. Under conservation tillage, straw incorporation has a smaller impact on N2O emissions compared to the type of N fertilizer inhibitors (NBPT and DMPP). Treatments with N fertilizer inhibitors showed higher N2O emissions in the ST system compared to the CT system.
The results of the stepwise multiple regression analysis demonstrate that precipitation has a greater impact on N2O emissions compared to other factors. Consequently, it is imperative to conduct a more comprehensive investigation into the N2O emissions of various treatments under conservation tillage across different rainfall years. The findings from the scenario simulation are presented in Figure 7, which reveals that during a dry year, there is minimal disparity in the average N2O emissions between the CT system (0.18 kg N ha−1) and the ST system (0.18 kg N ha−1). However, in a normal year and a wet year, the cumulative N2O emissions in the ST system were 12.2% and 5.7% higher, respectively, in comparison to the CT system. In a normal year and wet year, the N2O emissions from U were the highest. However, in a dry year, the highest N2O emissions in the CT system were observed with U, reaching 0.22 kg N ha−1, while in the ST system, the highest N2O emissions were observed with the U + DMPP treatment, at 0.18 kg N ha−1. In the normal year, the N2O emissions from the U + NBPT and U + DMPP treatments were reduced by 25.2% and 23.4%, respectively, compared to U. In the wet year, the N2O emissions from the U + NBPT and U + DMPP treatments were on average reduced by 20.7% and 30.2%, respectively, compared to U (Figure 7).

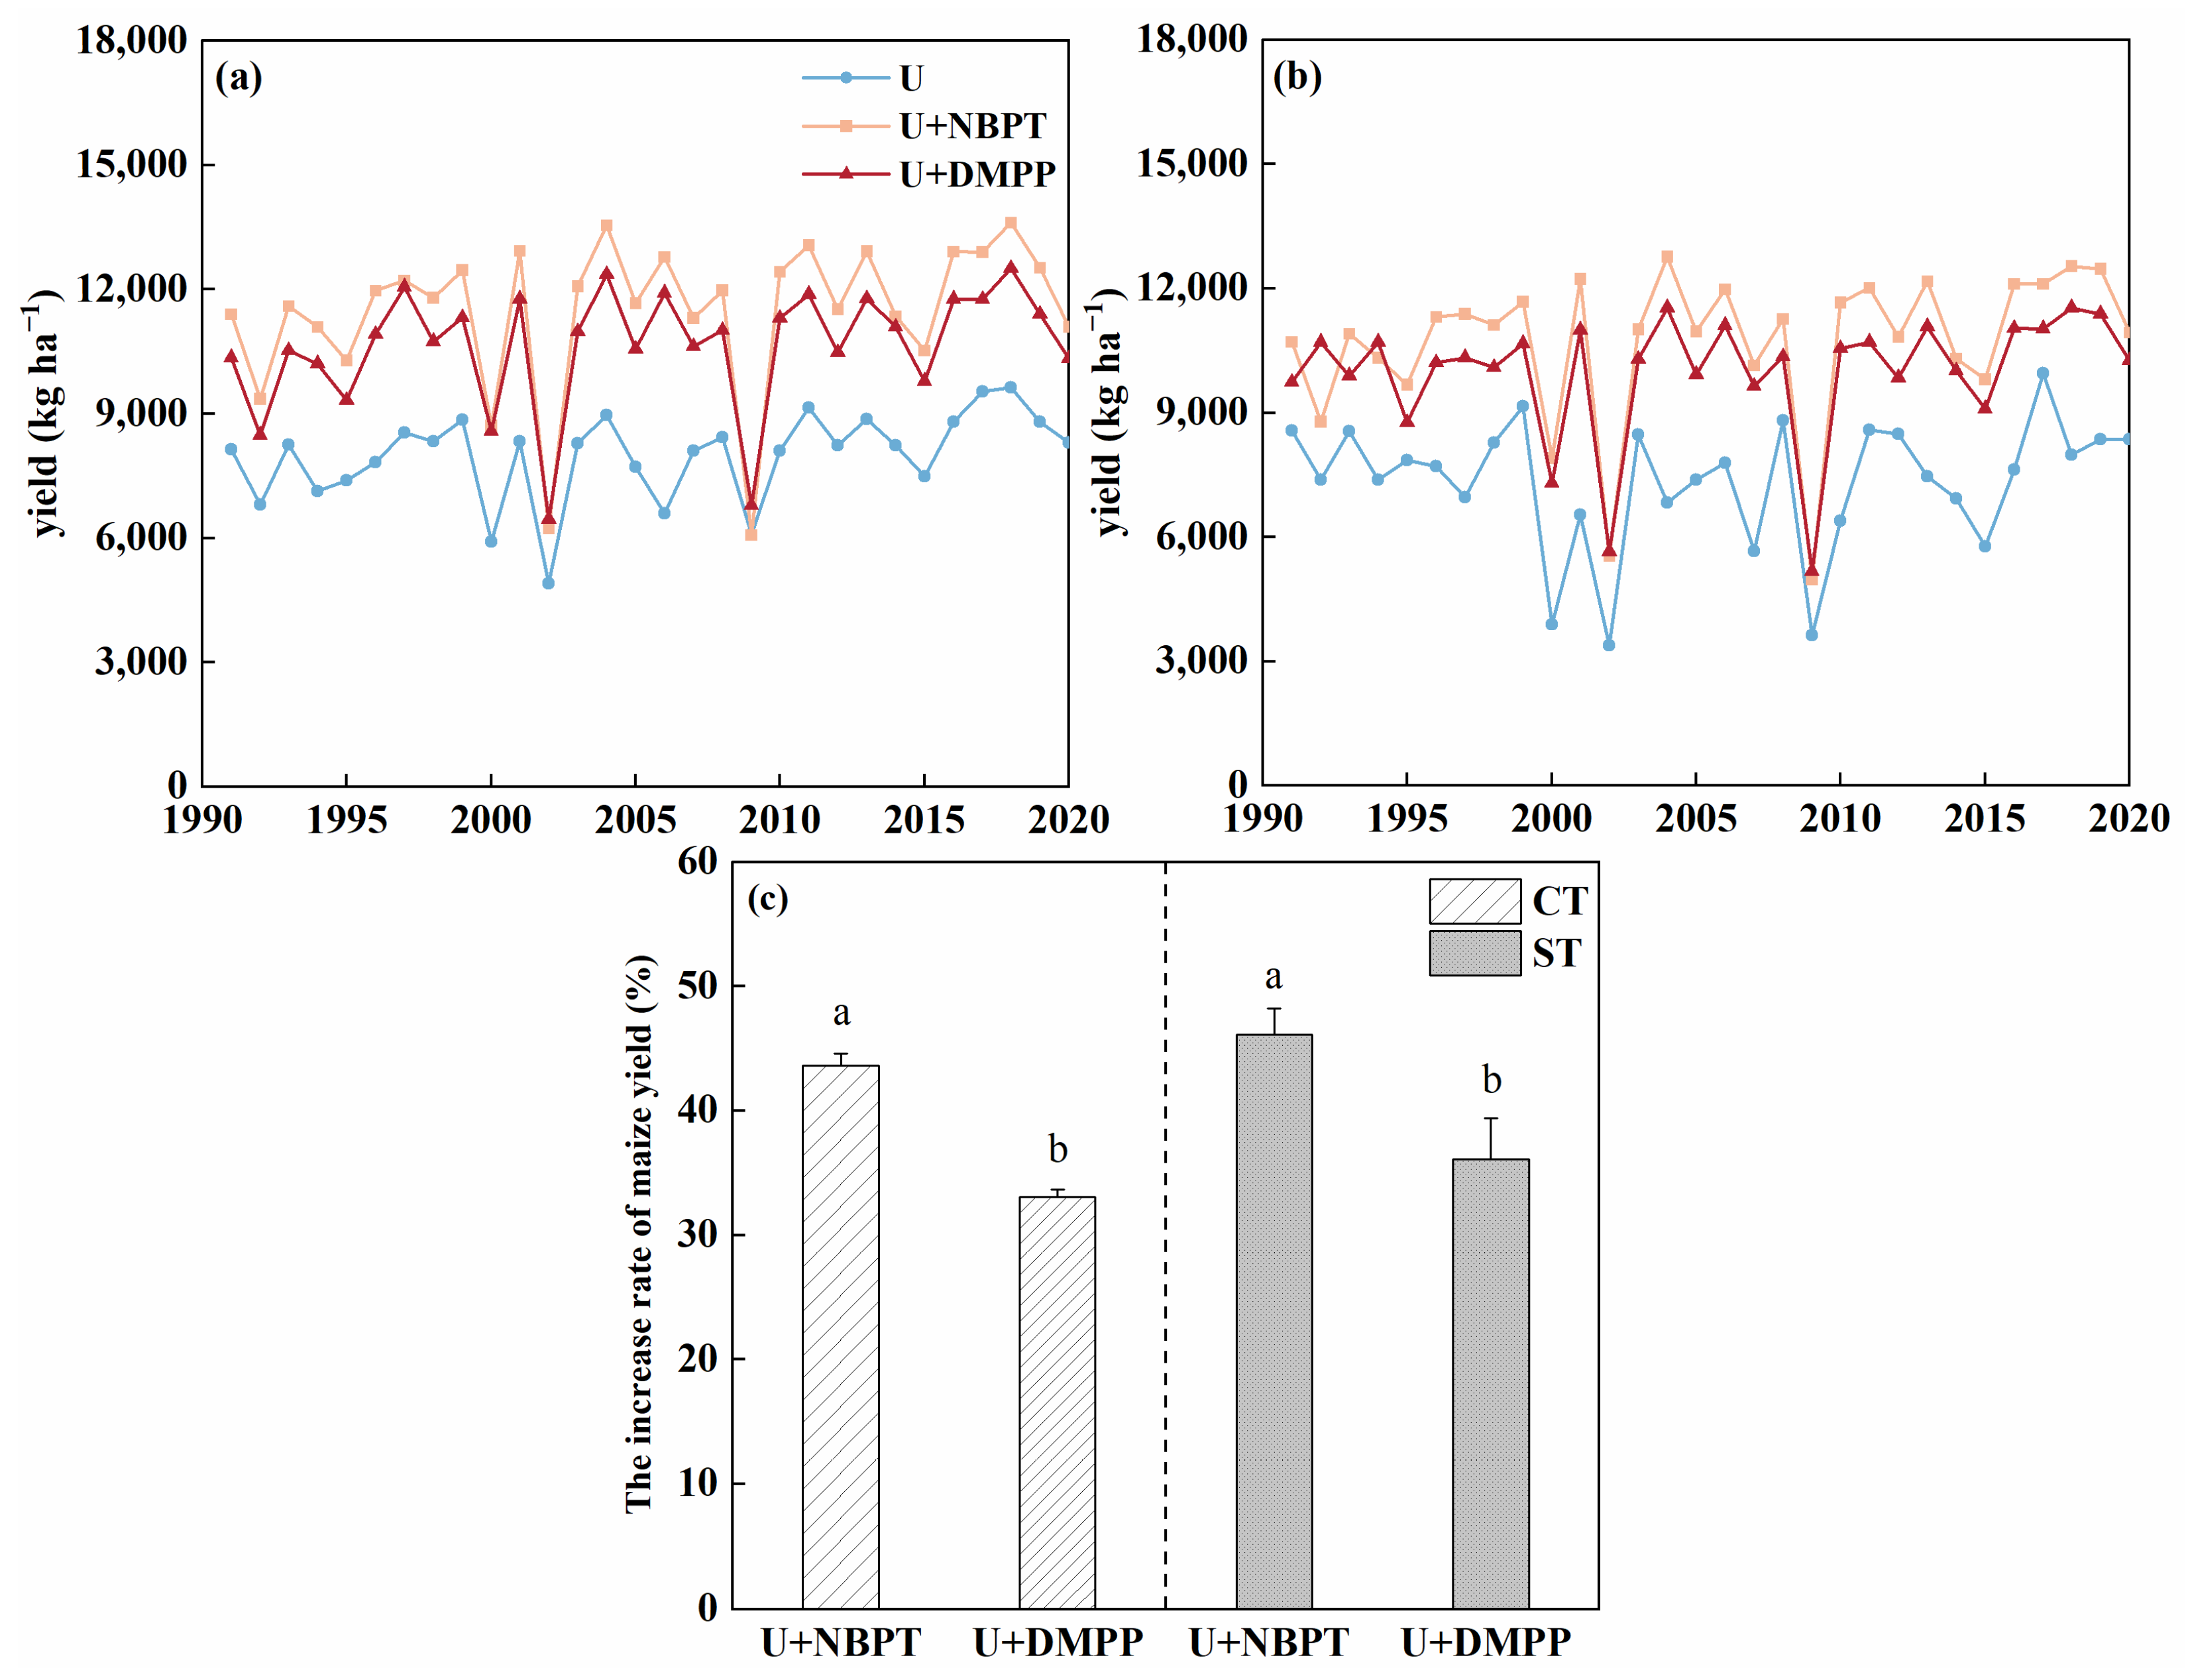
3.4. Changes in Crop Yield Under Long-Term Conservation Tillage

The trends in maize yield for different treatments over a 30-year period (1991–2020) are depicted in Figure 8. The U + NBPT treatment exhibited the highest yield, with an average of 11,099 kg ha−1, while the U yielded 7664 kg ha−1. Both the U + NBPT and U + DMPP treatments remained unaffected by the tillage system and showcased significant increases in yield, surpassing the U treatment (p < 0.01). Compared to the U treatment, the average yield increase for the U + NBPT and U + DMPP treatments was 44.9% and 34.6%, respectively. All treatments demonstrated a consistent upward trend in yield throughout the years. However, notable decreases in maize yield were observed in 2002 and 2009, likely attributed to adverse weather conditions that encompassed drought. Furthermore, the maize yield in the ST system slightly lagged behind that of the CT system. Specifically, the maize yield in CT system reached 10,034 kg ha−1, significantly surpassing the yield in the ST system (9347 kg ha−1).
Table 6 presented the stepwise multiple linear regression model for maize yield (adjusted r2 = 0.57, n = 180, p < 0.0001). It can be observed that the addition of NBPT and DMPP contributed the most to explaining the variance in maize yield, accounting for 39.8% and 32.3%, respectively. Rainfall, minimum temperature, and straw incorporation were the next significant contributors, accounting for 14.1%, 7.1%, and 6.6%, respectively. Maize yield was significantly increased by the inhibitor types (NBPT and DMPP), with coefficients of 3808 ± 280 kg ha−1 and 3807 ± 280 kg ha−1, respectively. On the other hand, straw incorporation and minimum temperature had a negative effect on maize yield, with coefficients of −0.3 ± 0.1 kg ha−1 and −143 ± 55 kg ha−1, respectively.

4. Discussion

4.1. Effect of Conservation Tillage and NBPT/DMPP on Spring Maize Yield

The growth of maize is strongly influenced by soil conditions, and tillage practices play a crucial role in regulating the soil environment. However, current research results on the effects of tillage practices on crop yield inconsistent outcomes. In the Northeast black soil region, the overall impact of conservation tillage on increasing yields is not statistically significant [45]. This suggests that the suitability of conservation tillage in this region may vary depending on factors such as climate, topography, and soil physical and chemical properties at different locations [46]. The findings of this study reveal no significant difference in the average yield between the ST and CT systems; however, the results of the 30-year simulation indicate that the average maize yield in the ST system is 6.8% lower than that in the CT system (Figure 8). This disparity may be attributed to the compaction of surface soil in the ST system, which occurs after rainfall and hinders the downward growth of maize roots. Consequently, this reduces crop root length density, delays crop development and maturity, increases weed and plant diseases, and diminishes crop yield potential [47]. Furthermore, these findings suggest that implementing conservation tillage in the low-temperature and cool–wet regions of the Northeast black soil can exacerbate localized waterlogging and result in reduced yields [48]. Additionally, Pittelkow et al. [13] conducted an extensive analysis of yield data from 63 countries, encompassing 5463 datasets. They found that conservation tillage in humid regions led to significant yield reductions, with a maximum reduction of 10%. This underscores the fact that maize yield is influenced by multiple factors, and different regions should adopt tailored tillage practices based on local conditions.
Furthermore, the type of inhibitor is a crucial factor that significantly impacts crop yield, explaining 72.1% of the total explained variance (Table 6). The 30-year simulation results (Figure 8) demonstrate that, over a span of 12 years, the conventional nitrogen fertilizer treatment U in the ST system led to increased yields when compared to the CT system. However, the U + NBPT and U + DMPP treatments in the ST system resulted in decreased yields compared to the CT system, further emphasizing the substantial influence of inhibitor type on maize yield compared to tillage practices. This study revealed that the U + NBPT and U + DMPP treatments significantly increased yields compared to the U treatment, with average yield increases ranging from 23% to 46.1%. Numerous domestic and international studies have consistently confirmed the efficacy of DMPP and NBPT inhibitors in promoting maize yield and improving nitrogen fertilizer utilization efficiency. In black soil, the addition of DMPP + NBPT to nitrogen fertilizer successfully suppresses the conversion of ammonium nitrogen to nitrate nitrogen, thus enhancing maize nitrogen uptake and increasing maize grain yield by a factor of 1.64 and 2.18, respectively, in comparison to conventional urea application [49]. Martins et al. [50] observed that the combined use of NBPT and urea at different stages significantly increased maize grain yield by 23% when compared to urea application alone. Zhang et al. [51] suggested that reducing nitrogen fertilizer application by 30% and incorporating DMPP and NBPT can not only increase maize yield and improve its quality but also enhance soil fertility, preserve fertilizer, and protect the environment.
In addition to the inhibitory effects of nitrogen fertilizer, multiple factors influence crop yield, including temperature and precipitation fluctuations caused by climate change. These fluctuations impact soil evaporation and plant transpiration, thereby altering the soil moisture balance and ultimately affecting crop yield. It is noteworthy that crop yield is more sensitive to changes in precipitation than to changes in temperature, which aligns with the findings of Kang et al. [52]. Consistent with our study, maize yields during drought years, moderate rainfall years, and abundant rainfall years were 8029 kg ha−1, 9806 kg ha−1, and 10,341 kg ha−1, respectively (Figure S6). Moreover, an increase in total rainfall during the growing season corresponds to an increase in crop yield.

4.2. Effect of Conservation Tillage and NBPT/DMPP on WUE and NUE

Conservation tillage exerts a beneficial regulatory effect on soil moisture, ensuring the water requirements for crop growth and development. It directly alters soil physical properties and surface cover conditions, thereby influencing soil water movement and crop growth processes, ultimately impacting crop yield and WUE. Additionally, conservation tillage, when combined with straw cover, hinders soil water evaporation to the atmosphere, reducing surface evaporation. This helps to retain soil moisture and ensure an adequate water supply for crops [53]. Research conducted by Su et al. [9] in the Loess Plateau revealed that no-tillage and reduced tillage combined with rice straw incorporation significantly increased soil moisture content and improved wheat’s soil WUE. In a 12-year experiment carried out by Wang et al. [10] in northeastern saline–alkali soil, the results indicated that long-term conservation tillage significantly enhanced WUE compared to CT. Wang’s study also demonstrated that conservation tillage improved WUE compared to CT, with improvements ranging from 5.7% to 36.4% [8]. The findings of this study for the period 2019–2020 showed that ET in CT was 1.7% higher than in ST. Moreover, except for the conventional nitrogen fertilizer treatment in 2019, the WUE of the ST treatments exceeded that of the corresponding CT treatments by 1.4–9.3% (Table 2). These results are consistent with previous research findings. Due to its vast territory, diverse climatic conditions, and a variety of planting systems, China experiences variations in the dominant factors influencing crop growth, changes in soil nitrogen content, and transformation losses across different regions. Li et al. [49] discovered that conservation tillage increased nitrogen utilization efficiency by 26.7%, 8.7%, and 6.0% compared to traditional tillage in drought, normal water, and abundant water years, respectively. On the other hand, Giacomini et al. [54] observed no significant effects of conservation tillage practices, such as no-tillage and reduced tillage, on nitrogen fertilizer utilization efficiency in comparison to traditional tillage. Contrarily, Ruisi et al. [55] reported a significant reduction in fertilizer utilization efficiency with long-term no-tillage. In our study, the NUE of ST was 5.9% lower than that of CT. The varied effects of conservation tillage on NUE could be attributed to factors such as experimental conditions, crop types, and planting systems, which warrant further investigation and analysis.
Urease is the primary enzyme responsible for urea hydrolysis. NBPT can reduce the activity of soil urease, thereby delaying the hydrolysis of urea and significantly improving nitrogen fertilizer efficiency. DMPP primarily inhibits the activity of ammonia-oxidizing bacteria and nitrite-oxidizing bacteria, preventing the conversion of ammonium nitrogen to nitrate nitrogen. This inhibition reduces the accumulation of nitrate nitrogen and leads to a notable improvement in nitrogen fertilizer efficiency [56,57]. In this study, the use of U + NBPT treatment and U + DMPP treatment resulted in a 15.4% improvement in nitrogen fertilizer use efficiency compared to conventional nitrogen fertilizer U. These findings align with previous research results.

4.3. Effects of Conservation Tillage and NBPT/DMPP on N2O Emissions

It is widely accepted that conservation tillage can decrease CO2 emissions from farmland, although it does increase soil N2O emissions [58,59]. Conservation tillage modifies soil moisture, thermal conditions, and physicochemical properties by minimizing the frequency and intensity of tillage and increasing straw residue incorporation, thereby impacting soil greenhouse gas emissions. Studies have shown that in years with higher post-fertilization rainfall, reduced tillage practices result in higher N2O emissions compared to CT [60]. In our study, the cumulative N2O emissions from the ST system were 12.5% higher than those from the CT system. The 30-year simulation results also indicated consistently higher cumulative N2O emissions from the ST system relative to the CT system, with values of 0.48 kg N ha−1 and 0.47 kg N ha−1, respectively. The primary reason behind this difference is that conservation tillage increases soil macroaggregate content [58], fostering anaerobic conditions within the aggregates that facilitate denitrification [61], consequently leading to higher N2O emissions. Strip tillage, in comparison to traditional tillage, enhances soil bulk density while reducing soil aeration, thereby promoting denitrifying microbial activity [62]. Additionally, strip tillage increases soil moisture through straw cover, suppressing soil nitrification and ultimately raising N2O emissions [63]. Optimal nitrogen application plays a significant role in reducing N2O emissions from farmland soils. Numerous studies have demonstrated that DMPP and NBPT additives with urea significantly reduce N2O emissions [64,65]. Reports from major maize-producing regions in China indicate a range of N2O emission reductions from urea combined with NBPT and DMPP between 1.3% and 93.9% [66], consistent with our experimental findings. In this study, the addition of NBPT and DMPP reduced cumulative N2O emissions by 20.9% and 28%, respectively, compared to conventional nitrogen fertilizer treatment. DMPP exhibited a more effective N2O mitigation capability. This improvement stems from the application of nitrogen fertilizers, which initiates nitrification in the soil, where NH4 + is converted to NO2 by nitrifying microorganisms and subsequently transformed into NO3. The inclusion of nitrification inhibitors effectively suppresses the activity of nitrifying bacteria, thereby reducing N2O emissions [67].
Precipitation indirectly influences N2O emissions by impacting soil moisture content. Current research consistently demonstrates that increased precipitation leads to higher soil moisture levels, reducing the speed of O2 diffusion. This, in turn, stimulates residual organic matter decomposition, provides substrates for denitrification, and promotes N2O emissions [68]. Conversely, decreased precipitation increases soil O2 content, but it does not significantly raise N2O emissions through nitrification. In contrast, lower soil moisture content diminishes the supply of substrates for nitrifying microorganisms, suppresses microbial activity, and reduces N2O emissions. In this study, precipitation is identified as the primary driving factor of N2O, accounting for 46.4% of the total variance (Table 5). Specifically, N2O emissions during wet, normal, and dry years were measured at 0.88 kg ha−1, 0.44 kg ha−1, and 0.18 kg ha−1, respectively. Another factor influencing N2O emissions is the minimum temperature, explaining 6.1% of the total variance. This finding aligns with the previously mentioned research.

5. Conclusions

The WHCNS model underwent validation using field measurements of spring maize under conservation tillage in Lishu County, Jilin Province. The results demonstrate that the model is suitable for simulating and analyzing maize yield and N2O emissions in this study area. From 1991 to 2020, tillage systems and inhibitor types significantly influenced maize yield and N2O emissions. Conservation tillage, in combination with straw incorporation and nitrogen fertilizer inhibition, accounted for 7.1% and 72.1% of the total variance in maize yield, respectively. Rainfall and temperature contributed 14.1% and 6.6% of the total variance in maize yield, respectively. Soil N2O emissions were primarily influenced by rainfall and exhibit an increasing trend with higher rainfall levels. Conservation tillage, combined with straw returning and nitrogen inhibitors, accounted for 8.1% and 19.4% of the total variance in N2O emissions, respectively. In conclusion, implementing conservation tillage along with DMPP was the best management practice in the study area, which not only increased maize yield, but also effectively reduced N2O emissions. The findings are helpful to improving and promoting of conservation tillage techniques in the Northeast black soil region.

Supplementary Materials

The following supporting information can be downloaded at: https://www.mdpi.com/article/10.3390/agronomy15081818/s1, Figure S1: Comparison of simulated and measured soil nitrate N concentration at different depths under U + NBPT treatment on CT system from 2019 to 2020; Figure S2: Comparison of simulated and measured soil nitrate N concentration at different depths under U + DMPP treatment on CT system from 2019 to 2020; Figure S3: Comparison of simulated and measured soil nitrate N concentration at different depths under U treatment on ST system from 2019 to 2020; Figure S4: Comparison of simulated and measured soil nitrate N concentration at different depths under U + NBPT treatment on ST system from 2019 to 2020; Figure S5: Comparison of simulated and measured soil nitrate N concentration at different depths under U + DMPP treatment on ST system from 2019 to 2020; Figure S6: Simulated maize yield under different N fertilizer application treatments in different rainfall years in the growing season from 1991 to 2020. (a)and (b) are in humid years; (c) and (d) are in normal years; (e) and (f) are in dry years. The box is the interquartile range (IQR), the upper, middle and lower three black solid lines inside the box represent the 75%, 50%, and 25% quartile, respectively; the two vertical lines outside the box represent the 1.5IQR that extends upward and downward. The black point inside the box is the mean value. The gray dots outside the box are outliers; Table S1. Parameters for soil organic matter transformations.

Author Contributions

Conceptualization and writing—review and editing, K.H.; formal analysis, S.W.; methodology and writing—original draft, F.M.; data curation, G.F.; software, L.Z.; validation, Y.W.; funding acquisition and supervision, Q.G. All authors have read and agreed to the published version of the manuscript.

Funding

This research was funded by the National Key Research and Development Program of China, grant number 2022YFD1500703.

Data Availability Statement

The data presented in this study are available on request from the corresponding author.

Acknowledgments

We thank the anonymous reviewers and editors for their constructive comments on this manuscript.

Conflicts of Interest

The authors declare no conflicts of interest.

References

  1. FAO. FAOSTAT; Food and agriculture organization of the United Nations: Rome, Italy, 2015. [Google Scholar]
  2. Zhang, X.; Davidson, E.A.; Mauzerall, D.L.; Searchinger, T.D.; Dumas, P.; Shen, Y. Managing nitrogen for sustainable development. Nature 2015, 528, 51–59. [Google Scholar] [CrossRef]
  3. Heikkinen, J.; Ketoja, E.; Nuutinen, V.; Regina, K. Declining trend of carbon in Finnish cropland soils in 1974–2009. Glob. Chang. Biol. 2013, 19, 1456–1469. [Google Scholar] [CrossRef]
  4. Xie, Y.; Tang, J.; Li, R.F.; Chen, P.Y. Redistribution of SOC driven by erosion and deposition in cultivated black soils of Northeast China. Catena 2025, 258, 109268. [Google Scholar] [CrossRef]
  5. Yan, B.X.; Yang, Y.H.; Liu, X.T.; Zhang, S.W.; Liu, B.Y.; Shen, B.; Wang, Y.X.; Zheng, G.X. Status and evolution of soil erosion in the black soil region of Northeast China. Soil Water Conserv. China 2008, 12, 26–30, (In Chinese with English abstract). [Google Scholar]
  6. FAO. Save and Grow. In A policymaker’s Guide to the Sustainable Intensification of Smallholder Crop Production; FAO: Rome, Italy, 2011. [Google Scholar]
  7. Lipper, L.; Thornton, P.; Campbell, B.M.; Baedeker, T.; Braimoh, A.; Bwalya, M.; Caron, P.; Cattaneo, A.; Garrity, D.; Henry, K. Climate-smart agriculture for food security. Nat. Clim. Change 2014, 4, 1068–1072. [Google Scholar] [CrossRef]
  8. Wang, M.; Ma, L.; Strokal, M.; Ma, W.; Liu, X.; Kroeze, C. Hotspots for nitrogen and phosphorus losses from food production in China: A county-scale Analysis. Environ. Sci. Technol. 2018, 52, 5782–5791. [Google Scholar] [CrossRef]
  9. Su, Z.Y.; Zhang, J.S.; Wu, W.L.; Cai, D.X.; Lv, J.J.; Jiang, G.H.; Huang, J.; Gao, J.; Hartmann, R.; Gabriels, D. Effects of conservation tillage practices on winter wheat water-use efficiency and crop yield on the Loess Plateau, China. Agric. Water Manag. 2007, 87, 307–314. [Google Scholar] [CrossRef]
  10. Wang, Q.J.; Lu, C.Y.; Li, H.W.; He, J.; Khokan, K.S.; Rabi, G.R.; Liang, Z.H.; Qiao, X.D.; Allen, D.J.M. The effects of no-tillage with subsoiling on soil properties and maize yield: 12-Year experiment on alkaline soils of northeast China. Soil Tillage Res. 2014, 137, 43–49. [Google Scholar] [CrossRef]
  11. Blanco-Canqui, H.; Ruis, S.J. No-tillage and soil physical environment. Geoderma 2018, 326, 164–200. [Google Scholar] [CrossRef]
  12. Skaalsveen, K.; Ingram, J.; Clarke, L.E. The effect of no-till farming on the soil functions of water purification and retention in North-Western Europe: A literature review. Soil Tillage Res. 2019, 189, 98–109. [Google Scholar] [CrossRef]
  13. Pittelkow, C.M.; Liang, X.Q.; Linquist, B.A.; Groenigen, K.J.V.; Kessel, C.V. Productivity limits and potentials of the principles of conservation agriculture. Nature 2015, 517, 365–368. [Google Scholar] [CrossRef]
  14. Huang, Y.; Ren, W.; Wang, L.; Hui, D.; Grove, J.H.; Yang, X.; Tao, B.; Goff, B. Greenhouse gas emissions and crop yield in no-tillage systems: A meta-analysis. Agric. Ecosyst. Environ. 2018, 268, 144–153. [Google Scholar] [CrossRef]
  15. Farooq, M.; Flower, K.; Jabran, K.; Wahid, A.; Siddique, K. Crop yield and weed management in rainfed conservation agriculture. Soil Tillage Res. 2011, 117, 172–183. [Google Scholar] [CrossRef]
  16. Xia, L.L.; Li, X.B.; Ma, Q.Q.; Lam, S.K.; Wolf, B.; Kiese, R.; Butterbach-Bahl, K.; Chen, D.L.; Li, Z.A.; Yan, X.Y. Simultaneous quantification of N2, NH3 and N2O emissions from a flooded paddy field under different N fertilization regimes. Glob. Change Biol. 2020, 26, 2292–2303. [Google Scholar] [CrossRef]
  17. Benjamin, T.; Annette, P.; Michael, B.; Andreas, M.A.; Katrin, D.; Frank, E. Effects of nitrogen fertilization and irrigation on N2O emissions from a sandy soil in Germany. Arch. Agron. Soil Sci. 2015, 61, 569–580. [Google Scholar]
  18. Bai, J.Z.; Liu, Z.Y.; Song, J.J.; Li, N.; Yu, Q.; Hao, J.Q.; Xu, H.W.; Cheng, B.H.; Wang, X.; Feng, Y.Z. Effects of straw returning and biochar application on summer maize yield and soil N2O emission in Guanzhong Plain. Environ. Sci. 2022, 43, 4379–4386, (In Chinese with English abstract). [Google Scholar]
  19. Wang, B.; Li, Y.E.; Wan, Y.F.; Qiao, X.B.; Gao, Q.Z.; Liu, S.; Li, J.L. Modifying nitrogen fertilizer practices can reduce greenhouse gas emissions from a Chinese double rice cropping system. Agric. Ecosyst. Environ. 2016, 215, 100–109. [Google Scholar] [CrossRef]
  20. Dawar, K.; Zaman, M.; Rowarth, J.S.; Blennerhassett, J.; Turnbull, M.H. Urease inhibitor reduces N losses and improves plant-bioavailability of urea applied in fine particle and granular forms under field conditions. Agric. Ecosyst. Environ. 2011, 144, 41–50. [Google Scholar] [CrossRef]
  21. Misselbrook, T.H.; Cardenas, L.M.; Camp, V.; Thorman, R.E.; Williams, J.R.; Rollett, A.J.; Chambers, B.J. An assessment of nitrification inhibitors to reduce nitrous oxide emissions from UK agriculture. Environ. Res. Lett. 2014, 9, 115006. [Google Scholar] [CrossRef]
  22. Gilsanz, C.; Bae, Z.D.; Misselbrook, T.H.; Dhanoa, M.S.; Cardenas, L.M. Development of emission factors and efficiency of two nitrification inhibitors, DCD and DMPP. Agric. Ecosyst. Environ. 2016, 216, 1–8. [Google Scholar] [CrossRef]
  23. Qiao, C.L.; Liu, L.L.; Hu, S.J.; Compoton, J.E.; Greaver, T.L.; Li, Q.L. How inhibiting nitrification affects nitrogen cycle and reduces environmental impacts of anthropogenic nitrogen input. Glob. Chang. Biol. 2015, 21, 1249–1257. [Google Scholar] [CrossRef]
  24. Liu, J.G.; Chu, Q.Q.; Wang, G.Y.; Chen, F.; Zhang, Y.Y. Simulating yield gap of winter wheat in response to nitrogen management in North China Plain based on DSSAT model. Trans. Chin. Soc. Agric. Eng. 2013, 29, 124–129, (In Chinese with English abstract). [Google Scholar]
  25. Feng, P.Y.; Wang, B.; Macadam, I.; Taschetto, A.S.; Abram, N.J.; Luo, J.J.; King, A.D.; Chen, Y.; Li, Y.; Liu, D.L.; et al. Increasing dominance of Indian Ocean variability impacts Australian wheat yields. Nat. Food 2022, 3, 862–870. [Google Scholar] [CrossRef]
  26. Thiault, L.; Mora, C.; Cinner, J.E.; Cheung, W.W.L.; Graham, N.A.J.; Januchowski-Hartley, F.A.; Mouillot, D.; Sumaila, U.R.; Claudet, J. Escaping the perfect storm of simultaneous climate change impacts on agriculture and marine fisheries. Sci. Adv. 2019, 5, eaaw9976. [Google Scholar] [CrossRef]
  27. Zhang, H.Y.; Hobbie, E.A.; Feng, P.Y.; Niu, L.A.; Hu, K.L. Can conservation agriculture mitigate climate change and reduce environmental impacts for intensive cropping systems in North China Plain? Sci. Total Environ. 2022, 806, 151194. [Google Scholar] [CrossRef]
  28. Liang, H.; Yang, S.H.; Xu, J.Z.; Hu, K.L. Modeling water consumption, N fates, and rice yield for water-saving and conventional rice production systems. Soil Tillage Res. 2021, 209, 104944. [Google Scholar] [CrossRef]
  29. Tong, Y.X.; Marcos, E.A.; Yusuf, Y.; Isabel, L. Global black soil distribution. Front. Agricu. Sci. Eng. 2024, 11, 271. [Google Scholar] [CrossRef]
  30. Zheng, X.; Mei, B.; Wang, Y.; Xie, B.; Wang, Y.; Dong, H.; Xu, H.; Chen, G.; Cai, Z.; Yue, J. Quantification of N2O fluxes from soil–plant systems may be biased by the applied gas chromatograph methodology. Plant Soil 2008, 311, 211–234. [Google Scholar] [CrossRef]
  31. Liu, X.M.; Huang, Y.F. An experimental study on the application of laser particle sizer to analyze the mechanical composition of soil. Chin. J. Soil Sci. 2005, 4, 579–582, (In Chinese with English abstract). [Google Scholar]
  32. Liu, D.S.; Li, W.B. Simple method for the determination of soil bulk weight and porosity. Chin. J. Soil Sci. 1983, 4, 44–47, (In Chinese with English abstract). [Google Scholar]
  33. Schaap, M.G. Rosetta (1.0). 1999. Available online: https://www.handbook60.org/rosetta/ (accessed on 17 May 2022).
  34. Zelazny, L.W.; He, L.; Vanwormhoudt, A.M. Methods of Soil Analysis, Part 3: Chemical Methods; SSSA Book Series: Madison, WI, USA, 1996. [Google Scholar]
  35. Allen, R.G.; Pereira, L.S.; Raes, D.; Smith, M. Crop evapotranspiration guidelines for computing crop water requirements. In FAO Irrigation and Drainage Paper; FAO: Rome, Italy, 1998. [Google Scholar]
  36. Hachum, A.Y.; Alfaro, J.F. Rain infiltration into layered soils: Prediction. J. Irrig. Drain. Div. 1980, 106, 311–319. [Google Scholar] [CrossRef]
  37. Pachepsky, Y.; Timlin, D.; Rawls, W. Generalized richards’ equation to simulate water transport in unsaturated soils. J. Hydrol. 2003, 272, 3–13. [Google Scholar] [CrossRef]
  38. Hansen, S.; Abrahamsen, P.; Petersen, C.T.; Styczen, M.E. Daisy: Model use, calibration and validation. Trans. ASABE 2012, 55, 1315–1333. [Google Scholar] [CrossRef]
  39. Driessen, P.M.; Konijn, N.T. Land use System Analysis; Wageningen Agricultural University: Wageningen, The Netherlands, 1992. [Google Scholar]
  40. Liang, H.; Hu, K.L.; Batchelor, W.D.; Qi, Z.M.; Li, B.G. An integrated soil-crop system model for water and N management in North China. Sci. Rep. 2016, 6, 25755. [Google Scholar] [CrossRef]
  41. Liu, S.; Yang, J.Y.; Zhang, X.Y.; Drury, C.F.; Reynolds, W.D.; Hoogenboom, G. Modelling crop yield, soil water content and soil temperature for a soybean-maize under conventional and conservation tillage systems in Northeast China. Agric. Water Manag. 2013, 123, 32–44. [Google Scholar] [CrossRef]
  42. Yang, J.M.; Yang, J.Y.; Liu, S.; Hoogenboom, G. An evaluation of the statistical methods for testing the performance of crop models with observed data. Agr. Syst. 2014, 127, 81–89. [Google Scholar] [CrossRef]
  43. Hobbie, E.A.; Grandy, A.S.; Harmon, M.E. Isotopic and compositional evidence for carbon and nitrogen dynamics during wood decomposition by saprotrophic fungi. Fungal Ecol. 2020, 45, 100915. [Google Scholar] [CrossRef]
  44. Shi, X.R.; Batchelor, W.D.; Liang, H.; Li, S.E.; Li, B.G.; Hu, K.L. Determining optimal water and nitrogen management under different initial soil mineral nitrogen levels in northwest China based on a model approach. Agric. Water Manag. 2020, 234, 106110. [Google Scholar] [CrossRef]
  45. He, C.; Niu, J.R.; Xu, C.T.; Han, S.W.; Zhang, H.L. Effects of conservation tillage on crop yield and soil organic carbon in Northeast China. Soil Use Manage. 2022, 38, 1146–1161. [Google Scholar] [CrossRef]
  46. Zheng, K.; He, J.; Li, H.W.; Wang, Q.J.; Li, W.Y. Meta-analysis on maize and wheat yield under subsoiling in Northern China. Trans. Chin. Soc. Agric. Eng. 2015, 31, 7–15, (In Chinese with English abstract). [Google Scholar]
  47. Liu, Z.; Sun, K.; Liu, W.; Gao, T.; Li, G.; Han, H.; Ning, T. Responses of soil carbon, nitrogen, and wheat and maize productivity to 10 years of decreased nitrogen fertilizer under contrasting tillage systems. Soil Tillage Res. 2020, 196, 104444. [Google Scholar] [CrossRef]
  48. Cao, L.G.; Zhou, Z.C. Variations of the reference evapotranspiration and aridity index over Northeast China: Changing properties and possible causes. Adv. Meteorol. 2019, 2019, 7692871. [Google Scholar] [CrossRef]
  49. Li, X.H.; Li, D.P.; Wu, Z.J.; Cui, L.; Xiao, F.R.; Zhang, K.; Li, Y.H.; Zheng, Y.; Zhang, J.M.; Cui, Y.K. Effects of stabilized urea containing NBPT/DMPP/CP on nitrogen use efficiency and maize yield in black and cinnamon soil. Plant Nutr. Fert. Sci. 2021, 27, 957–968, (In Chinese with English abstract). [Google Scholar]
  50. Martins, M.R.; Sant’Anna, S.A.C.; Zaman, M.; Santos, R.C.; Monteiro, R.C.; Alves, B.J.R.; Jantalia, C.P.; Boddey, R.M.; Urquiaga, S. Strategies for the use of urease and nitrification inhibitors with urea: Impact on N2O and NH3 emissions, fertilizer-15N recovery and maize yield in a tropical soil. Agric. Ecosyst. Environ. 2017, 247, 54–62. [Google Scholar] [CrossRef]
  51. Zhang, L.; Wu, Z.; Jiang, Y.; Chen, X.; Ma, L. Fate of applied urea 15N in a soil-maize system as affected by urease inhibitor and nitrification inhibitor. Plant Soil Environ. 2010, 56, 8–15. [Google Scholar] [CrossRef]
  52. Kang, Y.; Khan, S.; Ma, X. Climate change impacts on crop yield, crop water productivity and food security—A review. Prog. Nat. Sci. 2009, 19, 1665–1674. [Google Scholar] [CrossRef]
  53. Al- Kaisi, M.M.; Douelle, A.; Kwaw- Mensah, D. Soil microaggregate and macroaggregate decay over time and soil carbon change as influenced by different tillage systems. J. Soil Water Conserv. 2014, 69, 574–580. [Google Scholar] [CrossRef]
  54. Giacomini, S.J.; Machet, J.M.; Boizard, H.; Recous, S. Dynamics and recovery of fertilizer 15N in soil and winter wheat crop under minimum versus conventional tillage. Soil Tillage Res. 2010, 108, 5158. [Google Scholar] [CrossRef]
  55. Ruisi, P.; Giambalvo, D.; Saia, S.; Giuseppe, D.M.; Alfonso, S.F.; Antonella, P.; Gaetano, A. Conservation tillage in a semiarid Mediterranean environment: Results of 20 years of research. Ital. J. Agron. 2014, 9, 1. [Google Scholar] [CrossRef]
  56. Grant, C.A.; Derksen, D.A.; McLaren, D.; Irvine, R.B. Nitrogen fertilizer and urease inhibitor effects on canola emergence and yield in a one-pass seeding and fertilizing system. Agron. J. 2010, 102, 875–884. [Google Scholar] [CrossRef]
  57. Corrochano-Monsalve, M.; Gonzalez-Murua, C.; Bozal-Leorri, A.; Lezama, L.; Artetxe, B. Mechanism of action of nitrification inhibitors based on dimethylpyrazole: A matter of chelation. Sci. Total Environ. 2020, 752, 141885. [Google Scholar] [CrossRef]
  58. Forte, A.; Fiorentino, N.; Fagnano, M.; Fierro, A. Mitigation impact of minimum tillage on CO2 and N2O emissions from a Mediterranean maize cropped soil under low-water input management. Soil Tillage Res. 2017, 166, 167–178. [Google Scholar] [CrossRef]
  59. Rochette, P. No-till only increases N2O emissions in poorly- aerated soils. Soil Tillage Res. 2008, 101, 97–100. [Google Scholar] [CrossRef]
  60. Gregorich, E.G.; Rochette, P.; St-Georges, P.; McKim, U.F.; Chan, C. Tillage effects on N2O emission from soils under corn and soybeans in Eastern Canada. Can. J. Soil Sci. 2008, 88, 153–161. [Google Scholar] [CrossRef]
  61. Liu, X.J.; Mosier, A.R.; Halvorson, A.D.; Zhang, F.S. The impact of nitrogen placement and tillage on NO, N2O, CH4 and CO2 fluxes from a clay loam soil. Plant Soil 2006, 280, 177–188. [Google Scholar] [CrossRef]
  62. Ussiri, D.A.; Lal, R.; Jarecki, M.K. Nitrous oxide and methane emissions from long-term tillage under a continuous corn cropping system in Ohio. Soil Tillage Res. 2009, 104, 247–255. [Google Scholar] [CrossRef]
  63. Venterea, R.T.; Bijesh, M.; Dolan, M.S. Fertilizer source and tillage effects on yield-scaled nitrous oxide emissions in a corn cropping system. J. Environ. Qual. 2011, 40, 1521–1531. [Google Scholar] [CrossRef]
  64. Zhu, K.; Bruun, S.; Jensen, L.S. Nitrogen transformations in and N2O emissions from soil amended with manure solid and nitrification inhibitor. Eur. J. Soil Sci. 2016, 67, 792–803. [Google Scholar] [CrossRef]
  65. Mcgeough, K.L.; Watson, C.J.; Müller, C.; Laughlin, J.R.; Chadwick, R.D.; Watson, J.C. Evidence that the efficacy of the nitrification inhibitor dicyandiamide (DCD) is affected by soil properties in UK soils. Soil Biol. Biochem. 2016, 94, 222–232. [Google Scholar] [CrossRef]
  66. Liu, C.R.; Liu, H.R.; Liu, X.Q.; Zhang, Y.S.; Zang, H.D.; Li, G.; Pan, B.R.; Zhang, M.C.; Li, Z.H. Nitrogen stabilizers mitigate nitrous oxide emissions across maize production areas of China: A multi-agroecosystems evaluation. Eur. J. Agron. 2023, 143, 126692. [Google Scholar] [CrossRef]
  67. Bremner, J.M.; Mccarty, G.W. Inhibition of Nitrification in Soil by Allelochemicals Derived from Plants and Plant Residues; CRC Press: Boca Raton, FL, USA, 1993. [Google Scholar]
  68. Chen, W.W.; Zheng, X.H.; Chen, Q.; Wolf, B.; Butterbach-Bahl, K.; Brüggemann, N.; Lin, S. Effects of increasing precipitation and nitrogen deposition on CH4 and N2O fluxes and ecosystem respiration in a degraded steppe in Inner Mongolia, China. Geoderma 2013, 192, 335–340. [Google Scholar] [CrossRef]
Figure 1. Annual precipitation and air temperature during crop growing period over 30 years during 1991–2020.
Agronomy 15 01818 g001
Figure 2. The conception framework of the WHCNS model.
Agronomy 15 01818 g002
Figure 3. Comparison of simulated and measured soil water storage in 0–100 cm soil profile. (a,c,e) are under CT system and (b,d,f) are under ST system.
Agronomy 15 01818 g003
Figure 4. Comparison of simulated and measured soil nitrate N concentration at different depths under U treatment on CT system from 2019 to 2020.
Agronomy 15 01818 g004
Figure 5. Relationships between simulated and measured (a) LAI, (b) aboveground dry mass, (c) yield, and (d) N2O emission.
Agronomy 15 01818 g005
Figure 6. Interannual variation in N2O emission under different fertilizer treatments and tillage system from 1991 to 2020. (a) CT, (b) ST, and (c) the increased rate of N2O emission (%)relative to control (CT-U and ST-U) treatments. The sample number n = 30. In the same tillage system, different letters in the figure indicate that U + NBPT and U + DMPP were significantly different from U at the p < 0.05 level.
Agronomy 15 01818 g006
Figure 7. Simulated cumulative N2O emission under different N fertilizer application treatments in different rainfall year types in the growing season from 1991 to 2020. (a,b) are in humid years; (c,d) are in normal years; (e,f) are in dry years. The box is the interquartile range (IQR), and the upper, middle and lower three black solid lines inside the box represent the 75%, 50%, and 25% quartile, respectively; the two vertical lines outside the box represent the 1.5 IQR that extends upward and downward. The black point inside the box is the mean value. The gray dots outside the box are outliers.
Agronomy 15 01818 g007
Figure 8. Interannual variation in maize yields under different fertilizer treatments and tillage system from 1991 to 2020. (a) CT, (b) ST, and (c) the increased ratio of maize yield (%) relative to control (CT-U and ST-U) treatments. The sample number n = 30. In the same tillage system, different letters in the figure indicate that U + NBPT and U + DMPP were significantly different from U at the p < 0.05 level.
Agronomy 15 01818 g008
Table 1. Basic physical and hydraulic properties of soil profile in the experiment site.
Soil Layer (cm)Particle Fraction (%)Texture (USDA)BD
(g cm−3)
θfc
(cm3 cm−3)
θwp
(cm3 cm−3)
θs
(cm3 cm−3)
Ks
(cm d−1)
SandSiltClay
0–2032.824.143.1Loamy clay1.580.420.160.4632.24
20–4031.537.230.3Loamy clay1.580.420.180.4714.91
40–6033.030.936.1Loamy clay1.520.400.190.4574.52
60–8021.751.127.2Clay loam1.540.380.180.40622.7
80–10022.051.526.5Clay loam1.600.390.190.42620.9
Note: BD, bulk density; θfc, field capacity; θwp, soil wilting point; θs, soil saturated water content; ks, soil saturated hydraulic conductivity.
Table 2. Model performance for soil water storage, LAI and ADM.
TreatmentsIndexsCalibrationValidation
Soil Water Storage LAIADMSoil Water StorageLAI ADM
STnRMSE% 8.113.515.69.219.418.8
NSE0.720.850.880.760.730.66
d 0.960.940.880.940.920.9
CTnRMSE% 9.822.814.510.820.720.2
NSE0.680.750.780.690.760.68
d 0.980.930.910.940.940.92
Note: nRMSE is the normalized root mean squared error; d is the agreement index; NSE is the Nash–Sutcliffe efficiency.
Table 3. Water balance and WUE in 100 cm soil profile under different treatments from 2019 to 2020.
YearTillagePattern P ETDRWbalYieldWUE
(mm)(mm)(mm)(mm)(mm)(kg ha−1)(kg m−3)
2019STU623 449 a 142 a19 a8 a8025 a1.8 a
U + NBPT623 475 b124 b19 a5 b11,865 b2.5 b
U + DMPP623467 b 152 a19 a−15 c12,075 b2.6 b
CTU623454 a 145 a19 a5 a8705 a1.9 a
U + NBPT623490 b 136 b19 a−22 b11,598 b2.4 b
U + DMPP623468 a 152 a19 a−16 c11,556 b2.5 b
2020STU573365 a 104 a11 a98 a5412 a1.5 a
U + NBPT573361 a122 b11 a86 b10,305 b2.9 b
U + DMPP573366 a 134 b11 a82 b10,326 b3.0 b
CTU573365 a 111 a11 a86 a5003 a1.4 a
U + NBPT573372 a102 a11 a89 a10,508 b2.8 b
U + DMPP573365 a108 a11 a89 a10,753 b2.9 b
Note: The values in brackets are measured yields. P is precipitation; ET is evapotranspiration; D is drainage. R is run off; water balance (Wbal) = P − ET − D − R; WUE = measured yield/ET/10. Different lowercase letters indicate significant differences between treatments at the p < 0.05 level.
Table 4. Nitrogen budgets, and N use efficiencies under different treatments from 2019 to 2020.
TillagePatternNferNnetNden(N2O)NvolNleaNupNbalNUE
(kg N ha−1)(kg N ha−1)(kg N ha−1)(kg N ha−1)(kg N ha−1)(kg N ha−1)(kg N ha−1)(kg kg−1)
2019STU180148.0 a2.3(0.8) a24.0 a41.0 a147.1 a115.0 a37.7 a
U + NBPT180152.9 a2.0(0.7) a13.9 b37.1 a185.8 b95.4 b50.0 b
U + DMPP180132.0 b1.4(0.5) b19.1 c33.9 b188.7 b69.9 c49.9 b
2019CTU180109.8 a1.7(0.6) a19.3 a22.1 a156.6 a91.2 a43.8 a
U + NBPT180111.2 a1.4(0.5) a11.2 a28.9 b202.0 b48.5 b47.8 a
U + DMPP180113.2 a1.4(0.5) a16.7 c24.3 a205.8 b45.9 b46.7 a
2020STU18098.3 a3.7(1.3) a37.1 a34.4 a128.8 a76.7 a26.8 a
U + NBPT18099.7 a3.4(1.2) a29.8 b11.2 b165.5 b72.0 a49.6 b
U + DMPP18060.6 b2.6(0.9) b32.7 b2.3 c169.4 b35.4 b50.3 b
2020CTU18014.2 a3.4(1.2) a32.2 a15.1 a134.9 a10.9 a27.3 a
U + NBPT18014.8 a3.4(1.2) a21.8 b9.8 b177.8 b−15.8 b49.9 b
U + DMPP18013.7 a2.3(0.8) b27.3 c0.2 c184.7 b−19.4 c50.5 b
Note: Nfer: N fertilizer; Nnet: net mineralization; Nden: denitrification; N2O: N2O emission; Nvol ammonia volatilization; Nup: crop N uptake; Nlea: nitrate leaching; Nbal = Nfer + Nnet − Nvol− Nden − Nup − Nlea; NUE = grain yield/(Nvol + Nden + Nup + Nlea). Different lowercase letters indicate significant differences between treatments at the p < 0.05 level.
Table 5. Stepwise multiple regression on N2O emission (g ha−1).
Term% VarianceEstimate ± SE p-Value VIF
Intercept-−0.464 ± 0.043<0.0001-
Precipitation(mm)46.4(209 ± 7.6) × 10−5<0.00011.0
N (NBPT)11.2−0.15 ± 0.03<0.00011.0
N(DMPP)8.2−0.11 ± 0.03<0.00011.3
Straw8.1(5.0 ± 1.0) × 10−5<0.00011.3
Tmin(°C)6.1(11.0 ± 5.1) × 10−30.0031.0
Note: Adjusted r2 = 0.82, p < 0.0001, n = 180. Factors included fertilizer, tillage and climate. VIF is the variance inflation factor.
Table 6. Stepwise multiple regression on yields (kg ha−1).
Term% VarianceEstimate ± SE p-Value VIF
Intercept-5413 ± 476<0.0001-
N (NBPT)39.83808 ± 280<0.00011.3
N (DMPP)32.33807 ± 280<0.00011.3
Precipitation (mm)14.14.6 ± 0.8<0.00011.0
Straw7.1−0.3 ± 0.10.0061.0
Tmin (°C)6.6−143 ± 550.0111.0
Disclaimer/Publisher’s Note: The statements, opinions and data contained in all publications are solely those of the individual author(s) and contributor(s) and not of MDPI and/or the editor(s). MDPI and/or the editor(s) disclaim responsibility for any injury to people or property resulting from any ideas, methods, instructions or products referred to in the content.

