Article

Potato Productivity Response to Potassium Fertilizer Source and Rate in Oregon’s Columbia Basin

1
Hermiston Agricultural Research and Extension Center, Oregon State University, Hermiston, OR 97838, USA
2
Agricultural Research Station, Virginia State University, Petersburg, VA 23806, USA
3
Institute of Industrial and Forage Crops, Hellenic Agricultural Organization—“DIMITRA”, 41335 Larissa, Greece
4
Klamath Basin Research and Extension Center, Oregon State University, Klamath Falls, OR 97603, USA
5
North Willamette Research and Extension Center, Oregon State University, Aurora, OR 97002, USA
6
Aberdeen Research & Extension Center, University of Idaho, Aberdeen, ID 83210, USA
*
Author to whom correspondence should be addressed.
Agronomy 2025, 15(8), 1795; https://doi.org/10.3390/agronomy15081795
Submission received: 17 June 2025 / Revised: 17 July 2025 / Accepted: 21 July 2025 / Published: 25 July 2025
(This article belongs to the Section Soil and Plant Nutrition)

Abstract

Potatoes require high potassium (K) fertilization for good yields, especially in Oregon’s Columbia Basin, but little is known about how K rate and source affect potatoes. This study aimed to evaluate the effects of different K fertilizer rates and sources on the yield and quality of various potato cultivars. Two-year trials (2020 and 2022) were conducted as a split-plot, randomized complete block design with four replications in a producer’s field near Boardman, Oregon. The study tested two K fertilizer sources (potassium sulfate—K2SO4 and potassium chloride—KCl, at five application rates from 0 to 896 kg K2O ha−1, on three potato cultivars: Clearwater Russet, Russet Burbank, and Umatilla Russet. Among cultivars, Umatilla Russet, with 56.5 t ha−1, had the highest total yield. Potassium fertilizer application, regardless of the rate, significantly increased tuber yield, resulting in an average 10% increase in total yield and a 12% increase in US No. 1 yield compared to the control. Although total yield differences among K application rates from 224 to 896 kg K2O ha−1 were generally not significant, the linear-plateau model identified a breakpoint at 251 kg K2O ha−1, indicating that applying rates beyond this level does not result in a significant yield increase. Additionally, higher K application rates were linked to a reduction in tuber-specific gravity. In terms of K sources, both K2SO4 and KCl produced similar yields. Further studies in diverse environments are needed to better understand how K fertilization affects potato yield and quality and to develop best practices for maximizing productivity.

1. Introduction

Potato (Solanum tuberosum L.) is a key crop across agrifood systems globally and a significant cash crop for U.S. growers due to its high nutritional value. The United Nations declared 2008 as the International Year of the Potato, emphasizing its significance as a staple food for global food security [1]. Among the cultivation practices, nutrient management practice is crucial for increasing potato tuber yield and quality.
Potassium (K), an essential macronutrient, plays a critical role in potato production by affecting yield, quality, and physiological functions. It is the most abundant cation in plant cells and second only to nitrogen (N) in leaf biomass, underscoring its importance in plant metabolism, stress adaptation, and growth [2,3]. K is essential for processes such as enzyme activation, starch synthesis, and regulating stomatal activity, which impact tuber-specific gravity, dry matter content, and post-harvest quality, including reduced bruising and darkening [4,5,6]. Accurate K application to the root zone during peak demand ensures efficient uptake and maximizes its benefits on potato growth.
In the Columbia Basin of Oregon, the sandy soils with low clay content pose challenges for K management due to limited buffering capacity and the risk of leaching [7]. Deficiencies in N, phosphorus (P), and K are among the primary constraints for potato production in the region. After analyzing 62 studies from the literature, Torabian et al. [8] highlighted that optimal tuber yields are achieved at an exchangeable soil K+ concentration of approximately 200 mg kg−1, with application rates of 200 kg ha−1 for potassium sulfate (K2SO4) and potassium chloride (KCl) and 100 kg ha−1 for KNO3. These findings emphasize the importance of tailored K management strategies to balance productivity with environmental sustainability, making K fertilization critical for achieving high yields and maintaining soil health in the Columbia Basin. A well-defined fertilization program is essential for maximizing potato growth and yield in these challenging conditions.
Under the pedoclimatic conditions of the Columbia Basin, relatively high rates of K are generally recommended. Lang et al. [9] noted that harvesting potatoes removes 89 to 190 kg K ha−1 from the soil, emphasizing the need for sufficient K replenishment. Furthermore, K recommendations should account for specific cultivar requirements, as nutrient uptake and response to K fertilizer may vary among cultivars. Aligning K application rates with cultivar-specific needs is critical for optimizing yield and quality while minimizing costs and environmental impacts.
The choice of K fertilizer source also plays a pivotal role in fertilization management. KCl is the most widely used K fertilizer globally due to its high K content and cost-effectiveness [10,11]. However, its use may influence plant physiology, as KCl can increase osmotic potential, enhancing water uptake and vegetative growth, which might shift assimilate allocation towards shoots rather than tubers [12]. In contrast, K2SO4 is recommended for chloride-sensitive crops, including some potato cultivars, despite its higher cost due to a more complex manufacturing process [13]. In potato production fields with soil test K of 50 to over 300 ppm in the Columbia Basin, growers apply a high amount of K, ranging from 100 to 450 kg K ha−1, to produce 78 to 90 MT ha−1 of potatoes. In some cases, growers even apply up to 900 kg K ha−1 to secure the potato production and/or quality. Both KCl and K2SO4 are often applied in field practices. Currently, the nutrient management guidelines are mainly based on studies on the traditional varieties, Russet Burbank, of Washington and Idaho [9,14], in addition to the growers’ own experience. However, the specific selection of K fertilizer source and application rate should be guided by cultivar-specific requirements and soil conditions. Field research focusing on these dynamics is necessary to refine K fertilization strategies tailored to the Columbia Basin’s unique conditions and the specific requirements of potato cultivars.
In 2020 and 2022, two field trials were carried out to investigate the effects of K fertilizer rate (ranging from 0 to 896 kg K2O ha−1) and source (KCl and K2SO4) on irrigated potato tuber yield and quality under the specific pedoclimatic conditions of the Columbia Basin. The study aimed to address critical knowledge gaps to optimize K fertilization for sustainable potato production while considering cultivar-specific nutrient requirements. This study was designed to test the hypothesis that K fertilizer source and rate regulate yield and quality by affecting tuber development and starch metabolism.

2. Materials and Methods

2.1. Experimental Site and Growing Conditions

In the 2020 and 2022 growing seasons, field experiments were conducted on commercial producer fields near Boardman, Oregon (45°42′57″ N, 119°53′24″ W, 100 m above sea level). The trials took place within a 50 ha field under center-pivot irrigation. The soil type in the field experiments was Quincy fine sand, which consists of very deep, excessively drained soils formed in sands on dunes and terraces. Soils in the study were classified according to the World Reference Base (WRB) system, with predominant soil groups including Calcisols, Fluvisols, and Cambisols, reflecting the semi-arid climate and loess-derived parent materials. The field preparation followed standard practices of growers in the Columbia Basin. After the soil was tilled and disked, hills and furrows were formed to enhance drainage, promote uniform soil warming, and provide optimal conditions for tuber initiation and growth. Soil samples were collected before field preparation to establish baseline soil fertility levels. These samples were analyzed by a commercial lab (Kuo Testing Labs, Othello, WA, United States), where standard soil testing methods were employed [15]. In brief, soil NO3-N and soil NH4-N were extracted by KCl solutions, soil P was extracted by the Sodium Bicarbonate Method, soil K was determined by the Ammonium Acetate Method—Buffer 8.5, soil S was determined by the DTPA extraction, soil pH was run at a 1:2 soil-to-water ratio, and soil organic matter was determined by the Walkley-Black method. The basic characteristics of the soil are shown in Table 1.
The Columbia Basin’s climate is semi-arid, with hot, dry summers and cool, wet winters, and the mean annual precipitation is 254 mm. Table 2 provides the average maximum and minimum monthly air temperature and rainfall for the 2020 and 2022 growing seasons.
Generally, the region is characterized by low annual precipitation; therefore, irrigation is critical for the production of high-quality potatoes. Irrigation was applied by a central pivot sprinkler irrigation system and scheduled based on the evapotranspiration method from data provided by the local weather station (AgriMet, https://www.usbr.gov/pn/agrimet/graphs.html; accessed on 21 November 2024).

2.2. Experimental Design

The experiment was arranged based on a split-plot, randomized complete block design with three factors and four replications. Cultivar was designated as the main factor, while fertilizer rate and source were the subfactors. Each replication was divided into three equal sections, corresponding to the three cultivars. Within each section, 10 fertilizer treatments, representing specific rates and sources, were randomly assigned to individual plots. Three cultivars were included in this study: Russet Burbank, Umatilla Russet, and Clearwater Russet. The seed tubers were obtained from commercial farms (i.e., Threemile Canyon Farms, Boardman, OR, United States, and AgriNorthwest, Plymouth, WA, USA). The tubers were cut into pieces weighing approximately 43 to 57 g each, and the pieces were treated with fludioxonil (Maxim® 4FS) and allowed to suberize for two weeks at 13 °C with approximately 95% relative humidity. Seed tubers were planted on 11 April 2020, using a 6-row planter (Lockwood Mfg, West Fargo, ND, USA), and on 21 April 2022, using a 2-row planter (John Deere, Moline, IL, USA) with 23 cm in-row spacing (seed-to-seed spacing within the row) and 81 cm between-row spacing. Although different planters were used in 2020 and 2022 due to equipment availability, both were calibrated to ensure consistent planting depth and spacing, resulting in uniform plant density across both years.
For each replication, 40 plots of each cultivar were planted, resulting in a total of 120 plots across the experiment. Each plot consisted of three rows, measuring 7.6 m in length and 2.4 m in width. The fertilizer treatments included five K rates: 0 (control), 224, 448, 672, and 896 kg K2O ha−1, and two K sources: KCl and K2SO4. Potassium fertilizers were manually applied following soil preparation and prior to planting. Nitrogen (N) and phosphorus (P) were applied throughout the growing season, both in liquid and dry forms. The specific fertilizers used included urea (46-0-0), monoammonium phosphate (MAP, 11-52-0), urea ammonium nitrate (UAN, 32-0-0), and thiosol (12-0-0-26), as detailed in Table 3. The rates of fertilizer applications, which were decided based on the residual soil nutrient analysis and the yield target, are outlined in Table 1. The preceding crops were onion (Allium cepa) in 2020 and corn (Zea mays) in 2022. Right after the crop harvest, cover crop wheat was planted and then terminated a few weeks before potato planting. Throughout the crop season, the irrigation and pest management practices were carried out by the commercial farm.
Before harvest, potato vines had been mowed to facilitate harvester operation. Potatoes were harvested by a commercial potato digger (BTR Double L, LLC., Heyburn, ID, USA), with three rows being harvested at the same time on 19 September 2020, and a single-row custom-made potato digger on 14–15 September 2022, respectively. The different planters and diggers between the two years were due to the limitation of COVID-19 in 2020, when we were not allowed to transport the equipment out of the Hermiston Agricultural Research and Extension Center (HAREC, Hermiston, OR, USA) (45.8404° N latitude and 119.2895° W longitude), so the equipment from the commercial farm was used.
Harvested potatoes were then transported to the sorting shed at the HAREC for grading and quality measurements. Tuber yield was determined for individual size profiles, including <113 g, 113–170 g, 171–283 g, >283 g, and culls. Tuber weight under each category was recorded, and the total weight was determined. The tuber weight (≥113 g) was calculated and classified as US No. 1 grade and marketable. All grading was according to USDA-AMS (Agricultural Marketing Service) standards. Ten randomly selected tubers from the >170 g category were measured for specific gravity following the weight-in-air, weight-in-water procedure, according to the following equation:
Specific Gravity = (Weight in air)/(Weight in air − Weight in water)
After sorting, ten tubers weighing >170 g from each plot were placed into plastic storage bags and stored in a cool room maintained at 8 °C. Then, tubers were evaluated for French fry quality after harvest. A 5 cm strip was cut from the center of an 8 mm-thick central longitudinal slice from each of the tubers in the sample. The strips were fried at 190 °C in canola oil (Maple Leaf Foods, Moncton, NB, Canada) for 3.5 min. Fry color was measured using a reflectance colorimeter (Photovolt-577, Photovolt Instruments, St. Louis Park, MN, USA), which indicates the level of lightness or darkness of the French fries. The reflectance values range from 0 to 100, with higher numbers indicating lighter-colored fries and lower numbers corresponding to darker fries.

2.3. Statistical Analysis

Data were analyzed using the SAS statistical software package (SAS Institute, Cary, NC, USA, Version 9.4) following a randomized complete block design with a split-plot arrangement and four replications. The two-year data were pooled for analysis, treating year and its interaction effects as random factors to account for variability across years, while cultivar, K rate, and K source were treated as fixed factors. An analysis of variance (ANOVA) was conducted to evaluate the main effects and interactions among the factors. Statistical significance was determined at an F-test p-value of ≤0.05. When significant differences were detected, treatment means were separated using Fisher’s Least Significant Difference (LSD) test. A linear-plateau model was developed using R Studio software (version 4.4.1), incorporating data from all cultivars, both K fertilizer sources, and both years to evaluate the effect of K fertilizer rates on total potato tuber yield.

3. Results

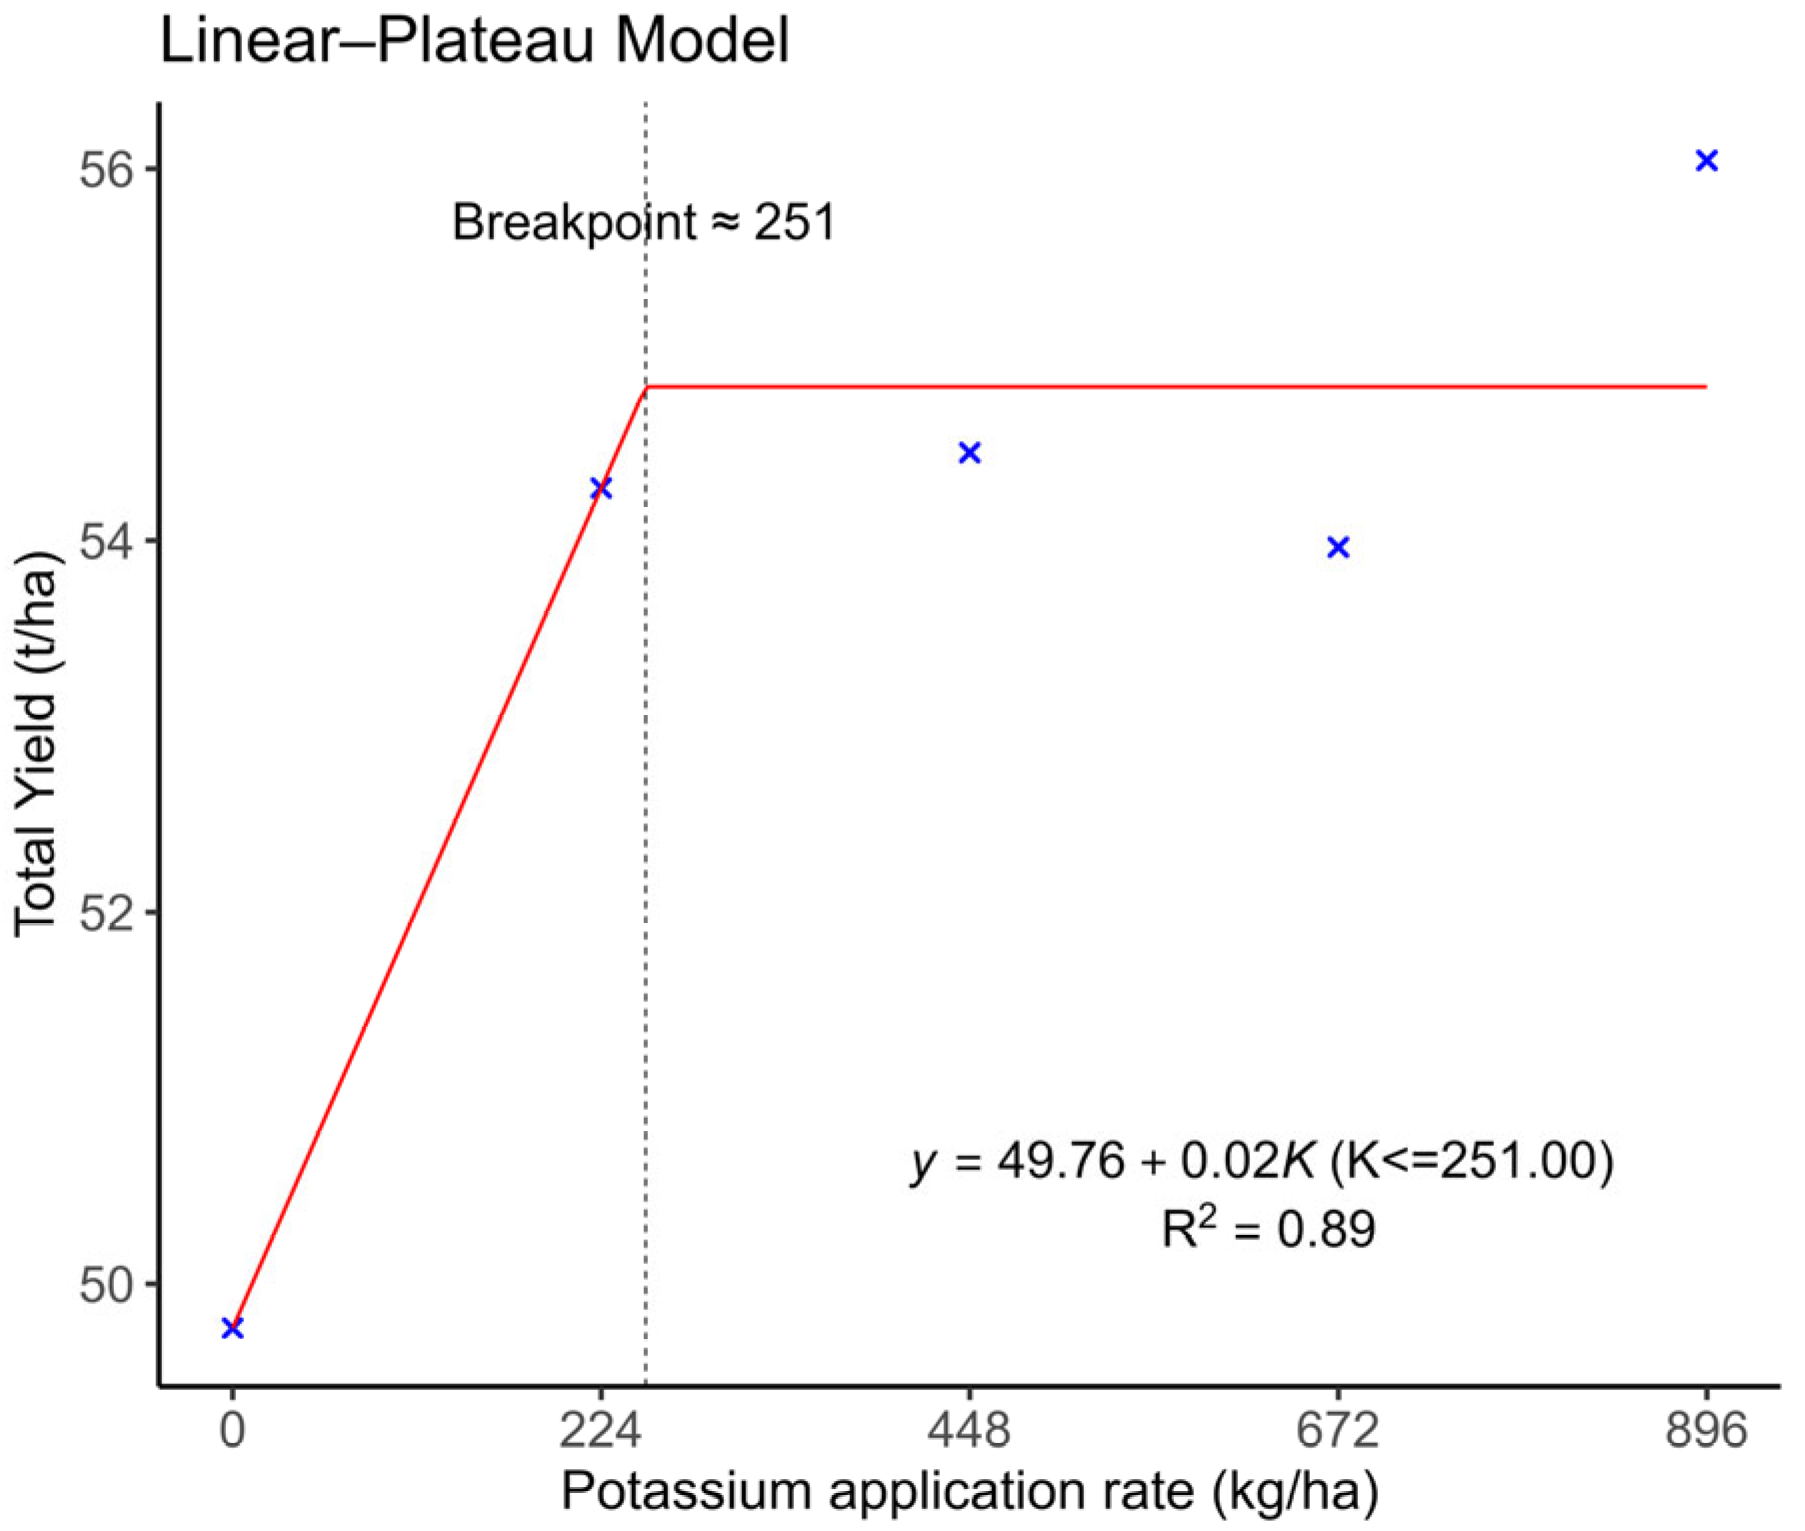
3.1. Total Tuber Yield

Total tuber yield was significantly affected by year, cultivar, and fertilizer rate and three-way interactions of fertilizer rate, source, and year (Table 4).
Applying K increased the total yield compared to the control, but the effect varied with the year, K rate, and K source; the difference between the application of KCl and K2SO4 was limited in most cases, with a few exceptions, which did not show a consistent pattern (Figure 1).
Across fertilizer rate, fertilizer source, and year, Umatilla Russet showed the highest (56.5 t ha−1) total tuber yield, whereas the lowest was recorded for Russet Burbank with 51.0 t ha−1 (Table 4). The linear-plateau model analysis indicated that total tuber yield increased with K application rates up to the breakpoint of 251 kg K2O ha−1. Beyond this rate, no statistically significant yield increase was observed, as the response trend plateaued (Figure 2).

3.2. US No. 1 Tubers

The yield of US No. 1 potatoes was significantly affected by fertilizer rate, cultivar, and year, but no interactions were observed (Table 4). Across fertilizer rate and cultivar, the yield of US No. 1 potatoes was 73% higher in 2020 (52.1 t ha−1) compared to 2022 (30.0 t ha−1). Clearwater Russet and Umatilla Russet exhibited significantly higher yields of US No. 1 potatoes than Russet Burbank (Table 4). The yield of US No. 1 tubers was maximized at a rate of 896 kg K2O ha−1, and followed by 448 and 224 kg K2O ha−1. On average, the K application increased the yield of US No. 1 by ~12% compared to the control (Table 4).

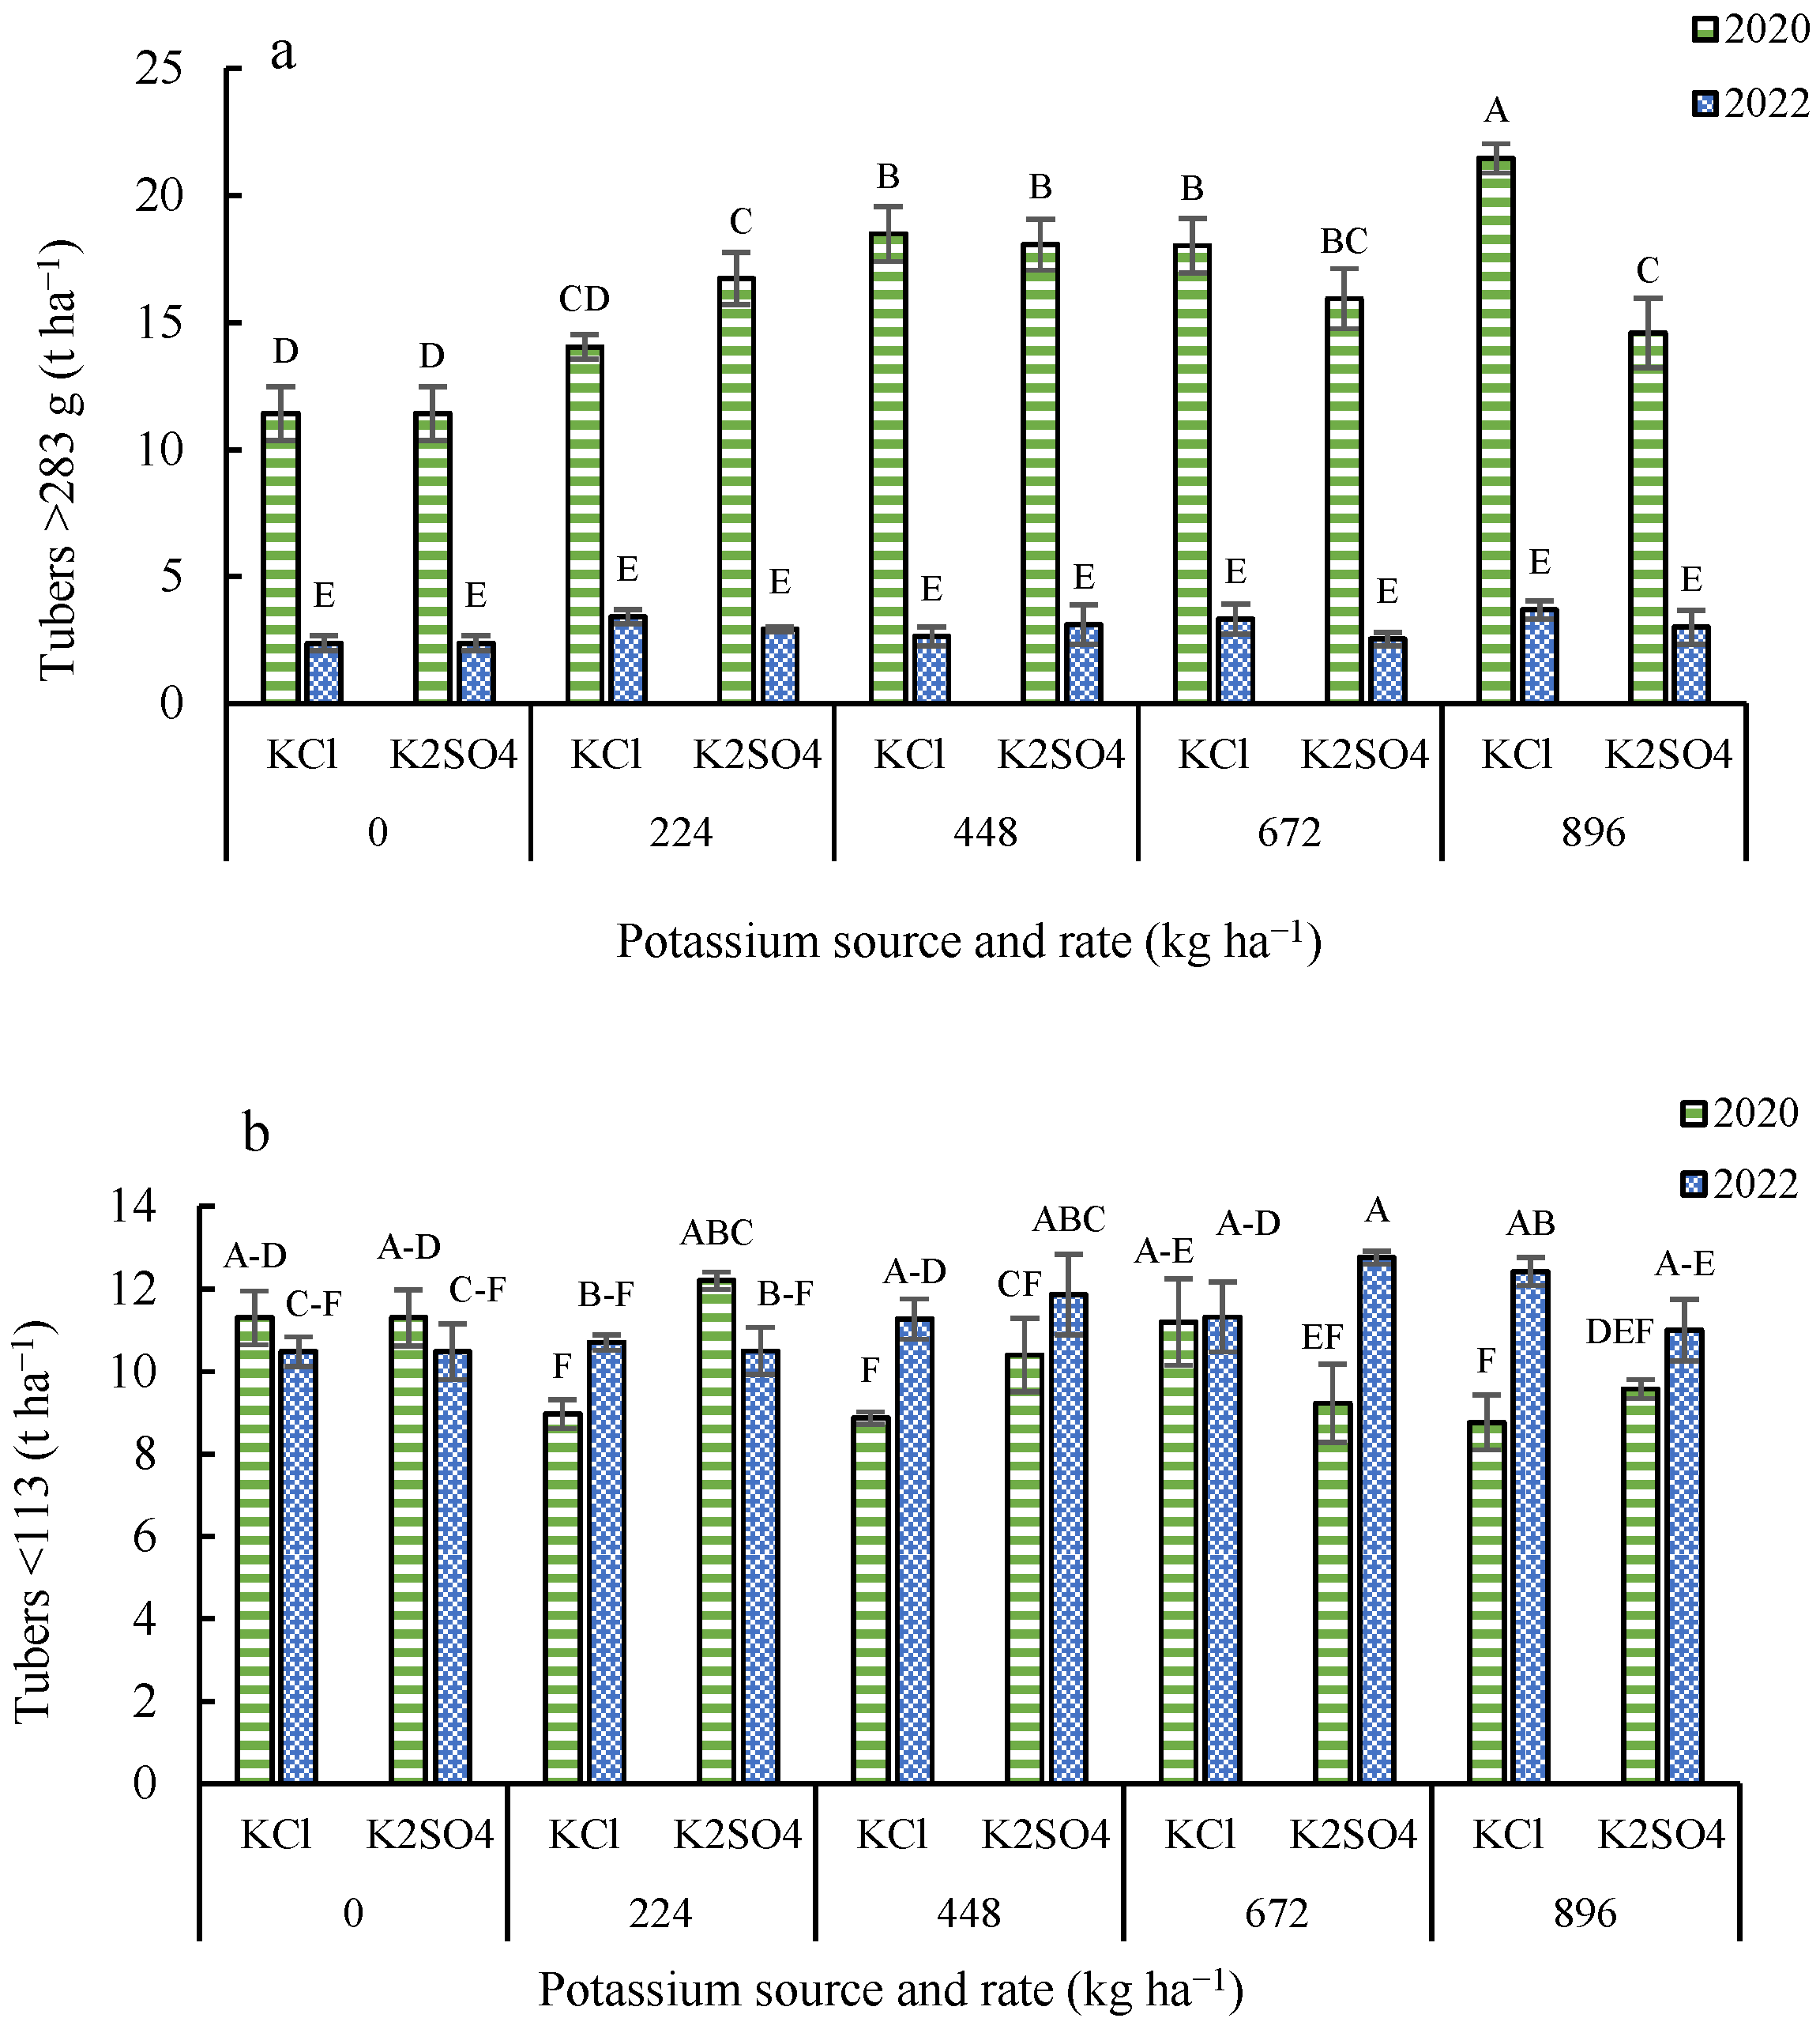
3.3. Tuber Yield by Size Distribution

According to Table 4, yields of all tuber categories were affected by year and cultivars (p < 0.01). In 2020, the yield of tubers in sizes ≥ 113 g was higher than in 2022, while the yield of tubers with size ≤ 113 g and the mean yield of culls were higher in 2022. Within the tuber size category, Clearwater Russet had the lowest tuber yield in the size category ≤ 113 g and in culls and the highest tuber yield in the size category >283 g in comparison to other cultivars. Umatilla Russet showed the highest tuber yield (15.5 t ha−1) with 113–170 g size, followed by Russet Burbank. The highest tuber yields in the size category 171–283 g were recorded for the Umatilla Russet and Clearwater Russet (Table 4). Fertilizer rates influenced tuber yields in size categories 171–283 g and >283 g (Table 4). The tuber yield with sizes 171–283 g and >283 g increased (10% and 40%, respectively) by application of K compared to the control. Only tuber yields in sizes > 283 g were affected by the K source.
There were significant two-way interactions between year and rate, as well as fertilizer source and rate, along with a three-way interaction between year, rate, and source on the yield of tubers > 283 g (Table 4). In 2020, higher K rates generally resulted in increased tuber yields, with KCl at 896 kg K2O ha−1 showing the highest yield, while in 2022, yields were consistently lower across all treatments. In 2020, KCl outperformed K2SO4 at higher K rates (Figure 3a). There was no significant difference between tuber yield under different fertilizer sources and rates in 2022 (Figure 3a).
Significant two-way interactions between year and rate and a three-way interaction between year, rate, and source were observed for tuber yields < 113 g (Table 4). Tuber yield in 2022 was higher than in 2020, with K2SO4 as a fertilizer source generally producing higher yields than KCl in many cases (Figure 3b). The statistical groupings indicated that K2SO4 at 672 kg K2O ha−1 in 2022 shows a significantly higher yield compared to other treatments (Figure 3b).

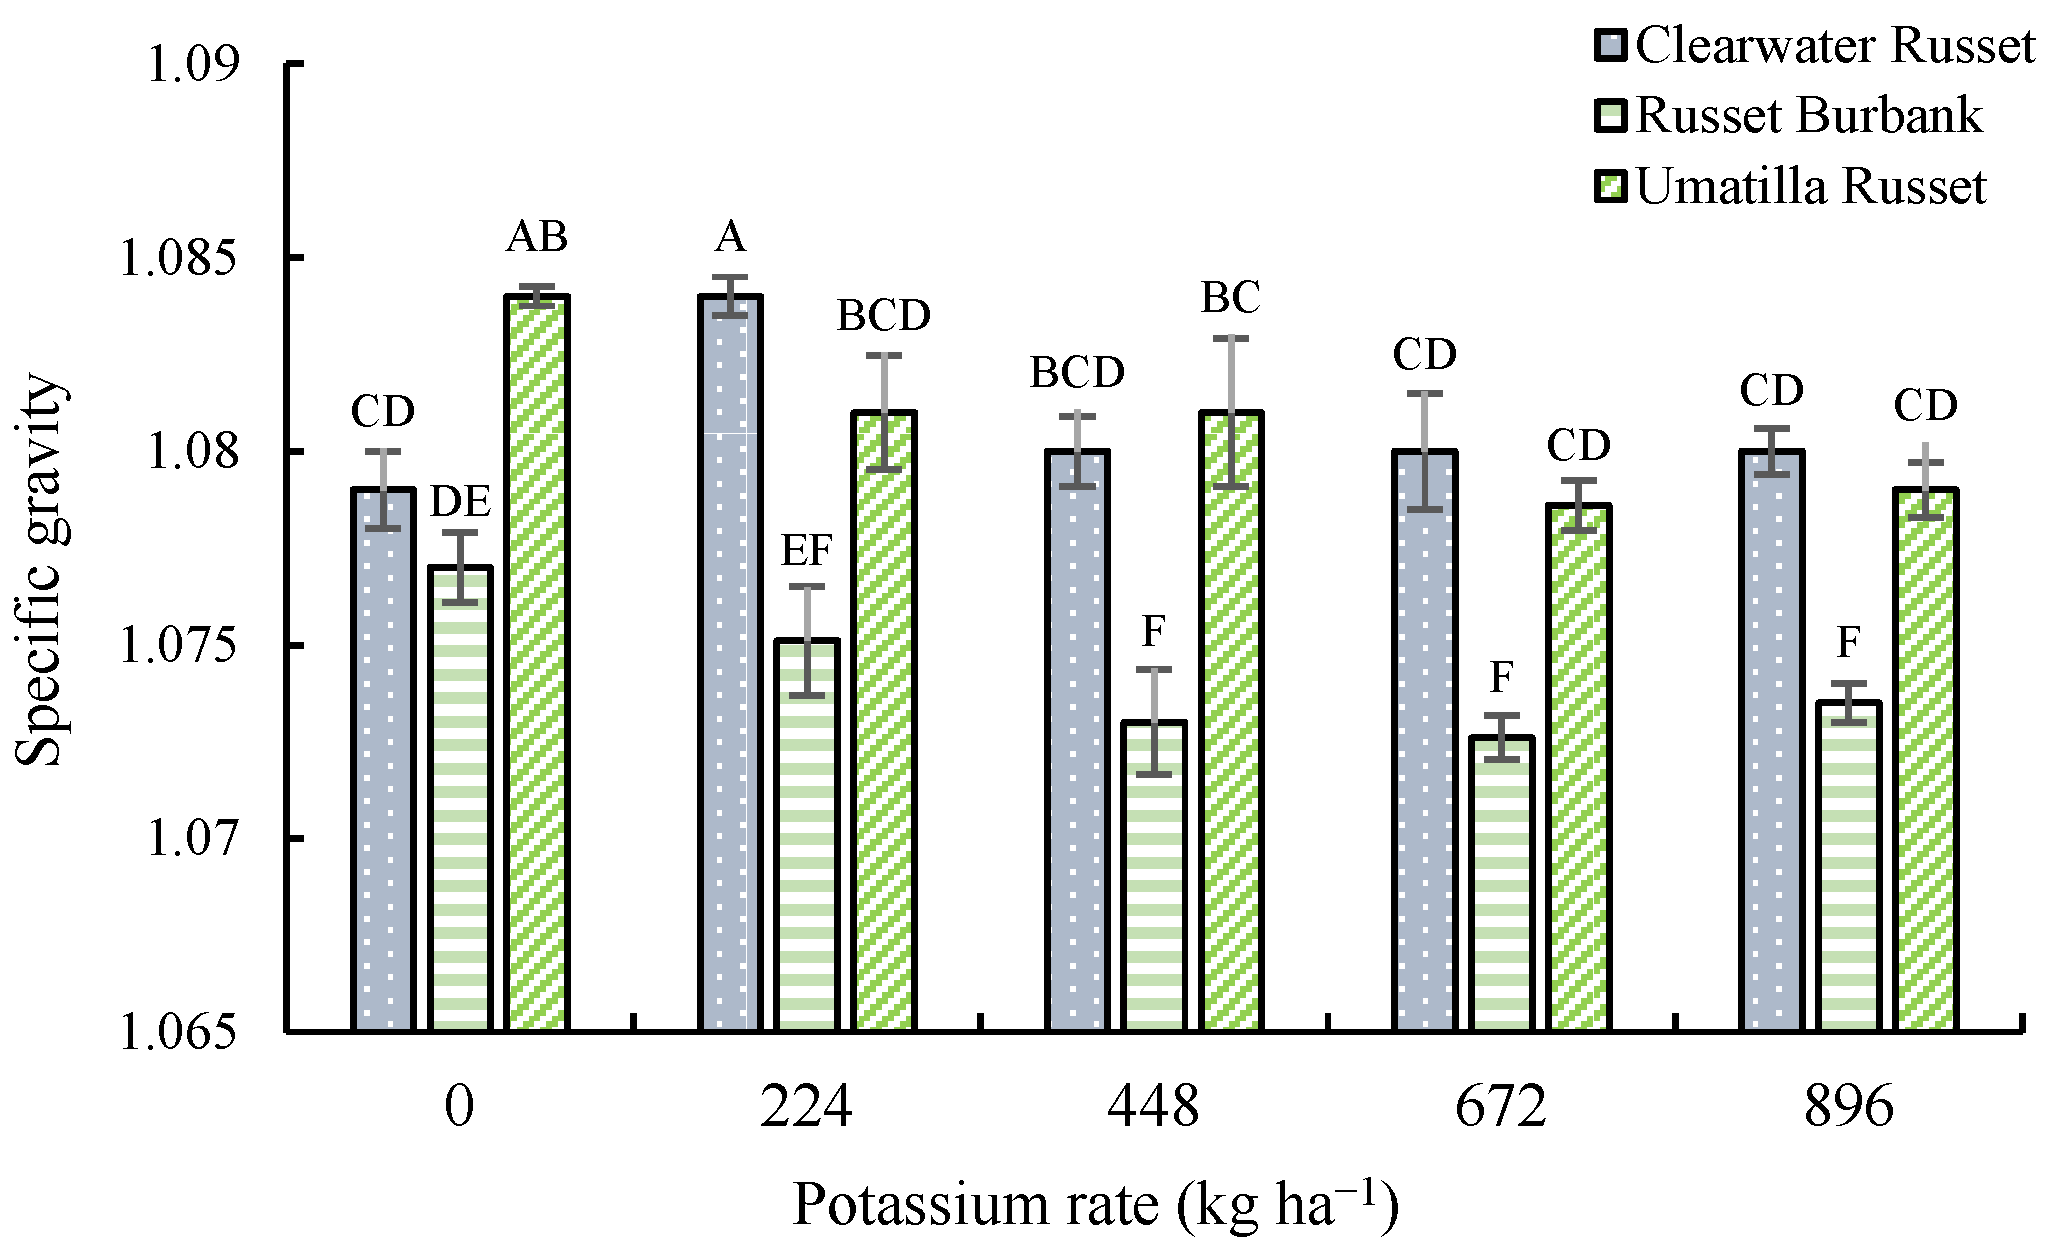
3.4. Specific Gravity and French Fry Color

Specific gravity was affected by fertilizer rate, year, cultivar, and an interaction between fertilizer rate and cultivar (Table 4). The highest specific gravity was found for the 224 kg K2O ha−1 rate for Clearwater Russet (1.084), followed by Umatilla Russet under control (Figure 4). However, the lowest was found in the 448, 672, and 896 kg K2O ha−1 rates for Russet Burbank (Figure 4). Russet Burbank and Umatilla Russet display a clear trend in specific gravity decrease for every additional 224 kg K2O ha−1 of fertilizer. There was an increase in specific gravity for Clearwater Russet, receiving 224 kg K2O ha−1 compared to the no-K control; afterward, it tended to decrease and remained similar to the control. Across other factors, in 2020, specific gravity was 1.086 compared to 1.070 in 2022 (Table 4). Among the cultivars, Clearwater Russet and Umatilla Russet were higher than Russet Burbank, while with the increase in K rate, the specific gravity declined (Table 4).
Potato fry color was affected by the main effects of year, cultivar, and fertilizer rate, but no significant effect of fertilizer source was found (Table 4). A significant interaction between K fertilizer rate and year was observed for French fry color (Table 4). In 2020, additional K fertilizer resulted in lighter-colored French fries (Figure 5). By contrast, the lightest French fries in the 2022 growing season were observed in the no-K control (Figure 5). For cultivars, Clearwater Russet and Umatilla Russet were 15 and 17% lighter than Russet Burbank, respectively (Table 4).

4. Discussion

Total tuber yield in 2020 and 2022 displayed a varietal effect. This could be due to genetic differences that result in different responses to the growing environment. Both Umatilla Russet and Clearwater Russet are newer cultivars compared to Russet Burbank. These new varieties tend to be higher-yielding and better adapted to the semi-arid climate typical of Northeastern Oregon and Eastern Washington. Tuber yields were significantly higher in the 2020 field trial compared to the 2022 field trial, potentially due to heat stress. As shown in Table 2, the maximum and minimum average air temperatures in July and August 2022 increased sharply compared to those in 2020 (Table 2). Late July, around 100 days after planting, is a critical period for potato growth and development because tuber bulking and maturation occur at this time. Heat stress during this period slows tuber bulking, leading to yield loss [16,17]. The optimal temperature for potato tuber production is between 15 °C and 20 °C, and temperatures above this range can significantly inhibit photosynthesis. A 5 °C increase above the optimum can reduce the photosynthetic rate by 25% [18]. When photosynthesis is inhibited, the plant’s source capacity for producing sugars is diminished, which directly affects the sink demand of the developing tubers [18,19].
The results showed that tuber yield increased with K rate. The positive yield response suggests that the available soil K level in the trial plots was insufficient for optimal potato production. The data showed that from the K rate of 224 to 896 kg ha−1, the total yields and marketable yield generally do not change significantly, suggesting that the low rate of K fertilizer is enough for securing an optimal yield. The linear plateau model analysis showed that total tuber yield increased with K rates up to 251 kg K2O ha−1, beyond which no significant yield increase was observed, also indicating this application rate may be sufficient for optimal potato production. In this study, soil test K was about 120 mg kg−1 before planting in both years. After the addition of 224 kg K2O ha−1, the calculated soil available K level could be as high as 170 ppm; this could be used as a critical K level for optimal yield. In a similarly designed study conducted in the Columbia Basin, tuber yields increased by 2% and 4% with the application of 448 kg K2O ha−1 granular KCl and K2SO4, respectively, compared to a no-K fertilizer application control [20]. In that study, soil K levels were 86 ppm at planting; after amendment with K at the indicated rate, the calculated available K level would be 186 ppm, like the levels in our studies. Another study conducted in Manitoba, Canada [21] found both total yield and the yield of >171 g tubers increased with increasing KCl rates. The positive response in this study was observed in soils with <200 ppm of NH4OAc-extractable K. A field trial conducted in the potato-growing areas of Wisconsin found tuber yields in sandy soils with soil test K levels at or below 104 ppm for soils will display a positive K fertilizer response [22]. To achieve maximum yields, Lang et al. [9] suggested the application of K fertilizer if soil test K was 240 ppm or less. In a review of sixty-two studies, Torabian et al. [8] found that a soil K level of 200 ppm may be the critical level to obtain the highest tuber yields. Overall, the results from our study and others indicate that soil test K levels should be assessed before planting potatoes. Soil test results will inform data-based decision-making regarding K fertilization.
In the study, only tuber yields for sizes greater than 283 g were affected by the K sources, with the yield of tubers 11% higher under KCl than K2SO4. KCl fertilization creates a higher osmotic potential than K2SO4, which can enhance water uptake and promote faster growth in potato plants. This improved water uptake might contribute to higher yields but could also result in lower starch concentrations due to a dilution effect in KCl tubers [23]. Different from our findings, Perrenoud [24] found a higher tuber yield under KCl than K2SO4 at the fertilizer rates up to 200 kg K2O ha−1; however, when the K rate was above 250 kg K2O ha−1, K2SO4 led to higher yields than KCl. Potato farmers, particularly those focusing on production for processing, have increasingly adopted K sources without chlorine; this shift is particularly common among large-scale operations, as chloride-containing fertilizers can negatively affect tuber quality in some processing applications [25]. KCl application increases transport and distribution of Cl ions within the plant, from the subcellular level to the entire plant system [26]. However, the sulfate-containing K means higher costs. Therefore, farmers who have traditionally used chloride-based K fertilizers are now incorporating sulfate-based K fertilizers to maintain tuber quality, despite the relatively higher costs [27]. It is important to consider the potential impact of chloride and sulfur on potatoes, as they are components of the K fertilizer sources. Chloride, in particular, can influence plant water relations and osmotic balance, while sulfur plays a critical role in amino acid and protein synthesis [2]. However, no toxic symptoms were observed from tuber germination to maturity or during tuber sorting and evaluation in the trials, regardless of the K fertilizer types and rates. Additionally, in the 2020 trial, the soil analytical results after Russet Burbank harvest showed that sulfur content was 29–48 mg kg−1 under SOP and 28–41 mg kg−1 under MOP, while the chloride was 26–41 mg kg−1 under SOP and 37–71 mg kg−1 under MOP, suggesting that MOP may increase soil chloride level more than SOP. However, neither soil sulfur nor chloride was accumulated significantly; frequent irrigation might be the main reason for reducing the accumulation of chemicals in the fields. In the field practices, potatoes typically rotate with other crops (e.g., wheat, corn, etc.) every 3 or 4 years. Different from potatoes, the rotational crops usually do not receive K input. As a result, it is difficult to have chloride or sulfur accumulate over the years. Nonetheless, future research might be needed to evaluate the effect of chloride and sulfur on tuber yield and quality by creating a scenario of continuously applying KCl or K2SO4 throughout the cropping system over the years. Although Cl levels are not immediately toxic to crops, long-term application of KCl can contribute to soil acidification and nutrient leaching, posing a gradual but significant risk over time [28]. Continuous use of KCl can lead to salt accumulation in both soil and plants, potentially acting as a biocide. Studies have shown that higher KCl doses reduce microbial activity and N mineralization, highlighting the risk of accumulation and its negative ecological impacts [29].
There was a significant interaction between K rate and cultivar on specific gravity. Our study found that the application of K fertilizer significantly reduced tuber-specific gravity, consistent with earlier findings by Mohr and Tomasiewicz [21] and Silva and Fontes [30]. This reduction in specific gravity may result from an increased tissue salt concentration in the tuber, leading to greater water absorption [31]. Since water and dry matter have an inverse relationship in tubers, higher water content contributes to lower specific gravity. Reduced tuber-specific gravity has important implications for processing quality, as it is strongly correlated with dry matter and starch content, which are critical for products like chips and fries [6]. Considering the interaction of K rate and cultivar in this study, the highest average specific gravity was observed for the 224 kg K2O ha−1 applied to Clearwater Russet, and the lowest was observed for 672 kg K2O ha−1 applied to Russet Burbank. The highest specific gravity measured for Clearwater Russet is within the range to attract a premium price. Our data showed that growers would receive less return from the processing industry for Russet Burbank compared to Umatilla Russet and Clearwater Russet; most of the Russet Burbank specific gravity ratings fall outside the acceptable range (1.070–1.089) for processing [32]. The highest specific gravity for Umatilla Russet was found in the control treatment and would attract the premium without the added cost of K fertilizer. The K source did not affect the specific gravity in our study. Variations in soil type, climate, irrigation practices, and other environmental factors, as well as the amount and timing of K application, can significantly impact how K sources affect specific gravity.
Clearwater Russet and Umatilla Russet produced lighter-colored French fries than Russet Burbank. Tubers that produce lighter-colored French fries produce reduced acrylamide, which can be cancerous to humans [33]. Lighter-colored French fries as produced by Clearwater Russet and Umatilla Russet are more attractive to the French fry processing industry. For the main effect of year on fry color, tubers produced in 2020 were significantly lighter than French fries (44.3) compared to 2022 (43.1). The added heat stress in 2022 may have impacted fry color and acrylamide formation. We are not aware of any study analyzing the relationship between air temperature during the growing season and acrylamide formation; however, research has shown temperature’s effects on sugar concentration in tubers. Higher sugar concentration in tubers has been correlated with increased acrylamide formation, with R2 values ranging from 0.73 to 0.98 [34,35]. Potatoes grown at high temperatures (27–30 °C) had higher tuber sugar concentrations compared to potatoes grown at more moderate temperatures (16–23 °C) [36,37]. Average minimum and maximum air temperatures for July and August were about 3 °C warmer in 2022 than in 2020. July and August are the months when tuber formation and bulking occur. Therefore, the higher air temperature seen in the 2022 production season may have increased sugar concentration in the tubers during formation and bulking, contributing to the buildup of acrylamide and darker fry color.
In addition, some studies have analyzed the association between K fertility and acrylamide formation in processing tubers [38,39]. Our study found a significant effect for the interaction between K fertilizer rate and year on fry color (Figure 5). In 2020, lighter-colored French fries were associated with increased K fertilizer rates. By contrast, in 2022, the lightest-colored French fries were observed in the control treatment with no added K fertilizer. An outdoor pot experiment conducted by Gerendás et al. [39] found that low K fertility and high N fertility increased acrylamide levels in processing potatoes compared to high K fertility and high N fertility. Although the growing conditions for the Gerendás et al. [39] pot experiment and our field study are quite different, similar results were seen in the 2020 growing season, where low K rate treatments were associated with darker-colored French fries. However, Gause [38] found no association between K fertilizer and acrylamide formation. Additional field studies are needed to clarify the relationship between K fertility and acrylamide formation in processing potatoes.

5. Conclusions

In this study, the yield of tubers of different sizes was significantly impacted by the rate of K. Within the tuber size categories, tuber yield tended to increase for all K rates compared to the control. No significant differences in tuber yield and quality were found due to the K source. These findings suggest that the grower may choose the less expensive K source, in this case, KCl, without sacrificing tuber yield. Tuber yield differences among K application rates from 224 to 896 kg K2O ha−1 were not statistically significant, and increasing the rate beyond 251 kg K2O ha−1, as indicated by the linear-plateau model, is unlikely to further enhance potato tuber yield. However, this rate should not be considered universally optimal, as appropriate K application levels may vary depending on soil test K levels. Therefore, site adjustments based on soil K status are recommended. It should be particularly important because the fertilizer costs have increased dramatically over recent years. Reduced specific gravity was associated with the application of K fertilizer. Unlike Russet Burbank, specific gravity ratings for Umatilla Russet and Clearwater Russet stayed within the range accepted by the Columbia Basin processing industry. Our results will help potato growers choose the appropriate K fertilizer rate and source for maximizing tuber yield and optimizing specific gravity of the specific potato cultivars based on the recommendations of soil tests and the prevailing soil types and climatic conditions. A comprehensive budget analysis should also be conducted by considering the fertilizer costs, potato yield, and specific gravity to help growers make informed decisions. Further on-farm studies are needed to identify the optimal K rate, type, and application methods across the whole region.

Author Contributions

Conceptualization, R.Q.; methodology, R.Q. and S.T.; formal analysis, S.T., R.Q. and J.P.; writing—original draft preparation, S.T. and J.P.; writing—review and editing, R.Q., C.N., V.S., B.C., S.K.D. and R.S. All authors have read and agreed to the published version of the manuscript.

Funding

This study was supported by funding from the Northwest Potato Research Consortium and the Oregon Potato Commission.

Data Availability Statement

The data that support the findings of this study are available from the corresponding author upon reasonable request.

Acknowledgments

The authors thank the Agronomy Lab of Oregon State University personnel: Yanyan Lu, Yan Yan, Hunter Dyer, and Greg Anderson for helping conduct the daily tasks needed to complete this project. Dan Childs and Tim Weinke of the OSU-HAREC farm crew provided technical support for planting and harvesting. Moises Aguilar of the Potato Breeding Lab helped prepare planting, harvesting, and sorting potatoes. Nick Benavides and Greg Harris of Threemile Canyon Farms provide fields, consultation, and technical support. The farm crew of Threemile Canyon Farms and HAREC provided technical support for planting, harvesting, and field management.

Conflicts of Interest

The authors declare no conflicts of interest.

Abbreviations

The following abbreviations are used in this manuscript:
KClpotassium chloride
K2SO4potassium sulfate
MAPmonoammonium phosphate
UANurea ammonium nitrate

References

  1. Lutaladio, N.; Castaldi, L. Potato: The hidden treasure. J. Food Compos. Anal. 2009, 22, 491–493. [Google Scholar] [CrossRef]
  2. Marschner, H. Marschner’s Mineral Nutrition of Higher Plants, 3rd ed.; Academic Press: London, UK, 2012. [Google Scholar]
  3. Sardans, J.; Peñuelas, J. Potassium stoichiometry and global change. Glob. Ecol. Biogeogr. 2015, 24, 261–275. [Google Scholar] [CrossRef]
  4. Tränkner, M.; Tavakol, E.; Jákli, B. Functioning of potassium and magnesium in photosynthesis, photosynthate translocation and photoprotection. Physiol. Plant. 2018, 163, 414–431. [Google Scholar] [CrossRef]
  5. Gao, Y.; Tang, Z.; Xia, H.; Sheng, M.; Liu, M.; Pan, S.; Li, Z.; Liu, J. Potassium fertilization stimulates sucrose-to-starch conversion and root formation in sweet potato (Ipomoea batatas (L.) Lam.). Int. J. Mol. Sci. 2021, 22, 4826. [Google Scholar] [CrossRef]
  6. Wang, Y.; Snodgrass, L.B.; Bethke, P.C.; Bussan, A.J.; Holm, D.G.; Novy, R.G.; Pavek, M.J.; Porter, G.A.; Rosen, C.J.; Sathuvalli, V.; et al. Reliability of measurement and genotype × environment interaction for potato specific gravity. Crop Sci. 2017, 57, 1966–1972. [Google Scholar] [CrossRef]
  7. Kolahchi, Z.; Jalali, M. Effect of water quality on the leaching of potassium from sandy soil. J. Arid Environ. 2007, 68, 624–639. [Google Scholar] [CrossRef]
  8. Torabian, S.; Farhangi-Abriz, S.; Qin, R.; Noulas, C.; Sathuvalli, V.; Charlton, B.; Loka, D.A. Potassium: A vital macronutrient in potato production—A review. Agronomy 2021, 11, 543. [Google Scholar] [CrossRef]
  9. Lang, N.S.; Stevens, R.G.; Thornton, R.E.; Victory, S.; Pan, W.L. Potato Nutrient Management for Central Washington; Washington State University Cooperative Extension: Pullman, WA, USA, 1999. [Google Scholar]
  10. Mikkelsen, R.L.; Roberts, T.L. Inputs: Potassium Sources for Agricultural Systems. In Improving Potassium Recommendations for Agricultural Crops; Springer: Cham, Switzerland, 2021; pp. 47–74. [Google Scholar]
  11. Prakash, S.; Verma, J.P. Global Perspective of Potash for Fertilizer Production. In Potassium Solubilizing Microorganisms for Sustainable Agriculture; Springer: Singapore, 2016; pp. 327–331. [Google Scholar]
  12. Koch, M.; Naumann, M.; Thiel, H.; Gransee, A.; Pawelzik, E. The importance of nutrient management for potato production. Part II: Plant nutrition and tuber quality. Potato Res. 2020, 63, 121–137. [Google Scholar] [CrossRef]
  13. Zörb, C.; Senbayram, M.; Peiter, E. Potassium in agriculture—Status and perspectives. J. Plant Physiol. 2014, 171, 656–669. [Google Scholar] [CrossRef]
  14. Stark, J.C.; Westermann, D.T.; Hopkins, B. Nutrient Management Guidelines for Russet Burbank Potatoes; College of Agricultural and Life Sciences, University of Idaho: Moscow, ID, USA, 2004. [Google Scholar]
  15. Miller, R.O.; Gavlak, R.; Horneck, D. Soil, Plant and Water Reference Methods for the Western Region, 4th ed.; WREP 125; Western Region Extension Publication; Colorado State University: Fort Collins, CO, USA, 2013. [Google Scholar]
  16. Chen, C.T.; Setter, T.L. Role of tuber developmental processes in response of potato to high temperature and elevated CO2. Plants 2021, 10, 871. [Google Scholar] [CrossRef]
  17. Ávila-Valdés, A.; Quinet, M.; Lutts, S.; Martínez, J.P.; Lizana, X.C. Tuber yield and quality responses of potato to moderate temperature increase during tuber bulking under two water availability scenarios. Field Crops Res. 2020, 251, 107786. [Google Scholar] [CrossRef]
  18. Lal, M.K.; Tiwari, R.K.; Kumar, A.; Dey, A.; Kumar, R.; Kumar, D.; Jaiswal, A.; Changan, S.S.; Raigond, P.; Dutt, S.; et al. Mechanistic concept of physiological, biochemical, and molecular responses of the potato crop to heat and drought stress. Plants 2022, 11, 2857. [Google Scholar] [CrossRef] [PubMed]
  19. Kim, Y.U.; Lee, B.W. Differential mechanisms of potato yield loss induced by high day and night temperatures during tuber initiation and bulking: Photosynthesis and tuber growth. Front. Plant Sci. 2019, 10, 300. [Google Scholar] [CrossRef] [PubMed]
  20. Davenport, J.R.; Bentley, E.M. Does potassium fertilizer form, source, and time of application influence potato yield and quality in the Columbia Basin? Am. J. Potato Res. 2001, 78, 311–318. [Google Scholar] [CrossRef]
  21. Mohr, R.M.; Tomasiewicz, D.J. Effect of rate and timing of potassium chloride application on the yield and quality of potato (Solanum tuberosum L. ‘Russet Burbank’). Can. J. Plant Sci. 2012, 92, 783–794. [Google Scholar] [CrossRef]
  22. Panique, E.; Kelling, K.A.; Schulte, E.E.; Hero, D.E.; Stevenson, W.R.; James, R.V. Potassium rate and source effects on potato yield, quality, and disease interaction. Am. Potato J. 1997, 74, 379–398. [Google Scholar] [CrossRef]
  23. Wilmer, L.; Pawelzik, E.; Naumann, M. Comparison of the effects of potassium sulphate and potassium chloride fertilisation on quality parameters, including volatile compounds, of potato tubers after harvest and storage. Front. Plant Sci. 2022, 13, 920212. [Google Scholar] [CrossRef]
  24. Perrenoud, S. Fertilizing for High Yield of Potato. IPI Bulletin 8; International Potash Institute: Berne, Switzerland, 1993. [Google Scholar]
  25. Koch, M.T.; Pawelzik, E.; Kautz, T. Chloride changes soil–plant water relations in potato (Solanum tuberosum L.). Agronomy 2021, 11, 736. [Google Scholar] [CrossRef]
  26. Colmenero-Flores, J.M.; Franco-Navarro, J.D.; Cubero-Font, P.; Peinado-Torrubia, P.; Rosales, M.A. Chloride as a beneficial macronutrient in higher plants: New roles and regulation. Int. J. Mol. Sci. 2019, 20, 4686. [Google Scholar] [CrossRef]
  27. Oliveira, R.C.; Luz, J.M.Q.; Lana, R.M.Q.; Melo, C.M.T.; Campo, D.R.O. Sources of potassic fertilizers in the quality of potato tubers. Rev. Latinoam. Papa 2020, 24, 3–15. [Google Scholar]
  28. Wang, Y.; Liu, X.; Wang, L.; Li, H.; Zhang, S.; Yang, J.; Liu, N.; Han, X. Effects of long-term application of Cl-containing fertilizers on chloride content and acidification in brown soil. Sustainability 2023, 15, 8801. [Google Scholar] [CrossRef]
  29. Pereira, D.G.C.; Santana, I.A.; Megda, M.M.; Megda, M.X.V. Potassium chloride: Impacts on soil microbial activity and nitrogen mineralization. Ciênc. Rural 2018. [Google Scholar] [CrossRef]
  30. Silva, H.R.F.; Fontes, P.C.R. Potassium fertilization and its residual effect on productivity and quality of potato tubers. Pesqui. Agropecu. Bras. 2016, 51, 842–848. [Google Scholar] [CrossRef]
  31. Chourasia, K.N.; Lal, M.K.; Tiwari, R.K.; Dev, D.; Kardile, H.B.; Patil, V.U.; Kumar, A.; Vanishree, G.; Kumar, D.; Bhardwaj, V.; et al. Salinity stress in potato: Understanding physiological, biochemical and molecular responses. Life 2021, 11, 545. [Google Scholar] [CrossRef]
  32. Sun, N.; Rosen, C.J.; Thompson, A.L. Nitrogen response of French fry and chip cultivars selected for low tuber reducing sugars. Am. J. Potato Res. 2017, 94, 606–616. [Google Scholar] [CrossRef]
  33. Blauer, J.M.; Sathuvalli, V.; Charlton, B.A.; Yilma, S.; Shock, C.C.; Baley, N.; Qin, R.; Feibert, E.; Novy, R.G.; Whitworth, J.L.; et al. Rainier Russet: A dual use Russet potato with long tuber dormancy, excellent process quality, and high early harvest packaging efficiency. Am. J. Potato Res. 2024, 101, 17–33. [Google Scholar] [CrossRef]
  34. Amrein, T.M.; Bachmann, S.; Noti, A.; Biedermann, M.; Barbosa, M.F.; Biedermann-Brem, S.; Grob, K.; Keiser, A.; Realini, P.; Escher, F.; et al. Potential of acrylamide formation, sugars, and free asparagine in potatoes: A comparison of cultivars and farming systems. J. Agric. Food Chem. 2003, 51, 5556–5560. [Google Scholar] [CrossRef]
  35. De Wilde, T.; De Meulenaer, B.; Mestdagh, F.; Govaert, Y.; Vandeburie, S.; Ooghe, W.; Fraselle, S.; Demeulemeester, K.; Van Peteghem, C.; Calus, A.; et al. Influence of storage practices on acrylamide formation during potato frying. J. Agric. Food Chem. 2005, 53, 6550–6557. [Google Scholar] [CrossRef]
  36. Thornton, M.; Buhrig, W.; Olsen, N. The relationship between soil temperature and sugar ends in potato. Potato Res. 2010, 53, 289–296. [Google Scholar] [CrossRef]
  37. Timm, H.; Yamaguchi, M.; Clegg, M.D.; Bishop, J.C. Influence of high-temperature exposure on sugar content and chipping quality of potatoes. Am. Potato J. 1968, 45, 359–365. [Google Scholar] [CrossRef]
  38. Gause, K. Effect of Nitrogen and Potassium on Potato Yield, Quality and Acrylamide Forming Potential. Master’s Thesis, University of Maine, Orono, ME, USA, 2014. [Google Scholar]
  39. Gerendás, J.; Heuser, F.; Sattelmacher, B. Influence of nitrogen and potassium supply on contents of acrylamide precursors in potato tubers and on acrylamide accumulation in French fries. J. Plant Nutr. 2007, 30, 1499–1516. [Google Scholar] [CrossRef]
Figure 1. Interaction of fertilizer rate and source and year on total tuber yield. Different capital letters above columns indicate significance between treatments at p < 0.05. Data represent averages ± standard error.
Agronomy 15 01795 g001
Figure 2. The linear plateau model shows the relationship between total yield of tubers and different potassium application rates. The × symbols indicate the mean total yield corresponding to each K fertilizer rate. The dotted line indicates the breakpoint.
Agronomy 15 01795 g002
Figure 3. Interaction of fertilizer rate, source, and year on tuber yield > 283 g (a) and <113 g (b). Different capital letters above columns indicate significance between treatments at p < 0.05. Data represent averages ± standard error.
Agronomy 15 01795 g003
Figure 4. Interaction of fertilizer rate and cultivar on tuber specific gravity. Different capital letters above columns indicate significance between treatments at p < 0.05. Data represent averages ± standard error.
Agronomy 15 01795 g004
Figure 5. Interaction of fertilizer rate and year on tuber fry color. Different capital letters above columns indicate significance between treatments at p < 0.05. Data represent averages ± standard error.
Agronomy 15 01795 g005
Table 1. Soil nutrients and pH in the potassium fertilization trial before planting in the 2020 and 2022 growing seasons.
Organic MatterNO3-NNH4-NPKSpH
(%)(kg ha−1)(kg ha−1)(mg kg−1)(mg kg−1)(mg kg−1)
20200.85501865119356.6
20220.797016221206.96.6
Table 2. Maximum and minimum monthly air temperature and rainfall during the growing season. Data source: AgriMet Columbia-Pacific Northwest Region automated weather station located near Boardman, Oregon.
2020 2022
MonthMax. Air Temp. (°C)Min. Air Temp. (°C)Rainfall (mm)Max. Air Temp. (°C)Min. Air Temp. (°C)Rainfall (mm)
May238.523.8207.227.9
June261211.9261139.1
July3214034150
August32140.235150
September27102.528116.8
Table 3. Nitrogen and phosphorus rates applied during the 2020 and 2022 growing seasons.
N FertilizersP Fertilizers
Fertilizer typeUrea
(46-0-0)
Urea Ammonium Nitrate (32-0-0), Ammonium thiosulfate (12-0-0-26)Monoammonium phosphate (11-52-0)P Liquid
kg N ha−1kg P2O5 ha−1
202012538020075
20221322751220
Table 4. Analysis of variance (p values) on the effects of potato cultivar, fertilizer rate, fertilizer source, and year and their interactions on potato tuber yield and quality.
Main EffectSize CategoryUS No. 1Total YieldSpecific GravityFry Color
<113 g113–170 g171–283 g>283 gCulls
Year<0.01<0.01<0.01<0.01<0.01<0.01<0.01<0.010.02
Cultivar<0.01<0.01<0.01<0.010.02<0.01<0.01<0.01<0.01
Source0.200.160.860.050.230.790.890.140.97
Rate0.660.220.03<0.010.41<0.01<0.01<0.010.05
year * rate<0.010.880.75<0.010.690.350.500.07<0.01
year * cultivar0.160.290.420.210.080.130.110.100.27
year * source0.310.240.740.250.110.780.990.220.79
cultivar * rate0.570.960.720.400.430.930.880.030.10
cultivar * source0.070.810.370.900.220.370.140.170.58
source * rate0.240.110.690.010.730.940.760.680.17
year * cultivar * rate0.230.820.830.920.300.800.610.470.29
year * cultivar * source0.510.430.120.870.650.410.230.530.55
year * source *rate0.010.360.450.030.120.090.020.660.34
cultivar * source * rate0.540.670.910.670.940.950.960.670.66
year * cultivar * source * rate0.570.940.760.700.280.590.870.730.09
-------------------------- (t ha−1) ------------------------%
Year
202010.2 B14.2 A22.3 A15.5 A0.30 B52.1 A65.2 A1.086 A44.3 A
202211.2 A11.6 B14.1 B2.8 B1.30 A30.0 B42.8 B1.070 B43.1 B
Cultivar
Clearwater Russet8.69 B10.8 C18.1 A14.1 A0.60 B43.1 A53.3 B1.080 A45.5 A
Russet Burbank11.8 A14.3 B16.5 B6.4 B0.90 AB37.3 B51.0 C1.074 B39.4 B
Umatilla Russet11.7 A15.5 A19.6 A6.6 B1.0 A41.7 A56.5 A1.081 A46.1 A
K Source
KCl10.513.218.19.4 A0.8041.053.71.07843.7
K2SO411.013.918.08.5 B0.9040.453.51.07943.7
K rate (kg ha−1)
010.813.616.7 B6.8 C0.7037.1 C49.7 B1.080 A44.6 A
22410.614.018.8 A8.8 B0.7041.7 AB54.2 A1.079 AB42.8 B
44810.613.217.4 AB10.4 A0.9041.1 AB54.4 A1.078 BC42.8 B
67211.212.818.4 AB9.2 B1.040.3 B53.9 A1.076 D44.1 AB
89610.614.219.2 A9.9 AB0.8043.4 A56.0 A1.077 CD44.1 AB
* Different letters within columns in each parameter indicate significant differences by the least significant difference (LSD) test at p  <  0.05.
Disclaimer/Publisher’s Note: The statements, opinions and data contained in all publications are solely those of the individual author(s) and contributor(s) and not of MDPI and/or the editor(s). MDPI and/or the editor(s) disclaim responsibility for any injury to people or property resulting from any ideas, methods, instructions or products referred to in the content.

