Article

Metabolome and Transcriptome Analyses Revealing the Molecular Mechanisms of Precarious Fertility in Quinoa Cultivars

1
Fujian Key Laboratory of Subtropical Plant Physiology and Biochemistry, Fujian Institute of Subtropical Botany, Xiamen 361006, China
2
Kunpeng Institute of Modern Agriculture at Foshan, Shenzhen Branch, Guangdong Laboratory of Lingnan Modern Agriculture, Agricultural Genomics Institute at Shenzhen, Chinese Academy of Agricultural Sciences, Shenzhen 518124, China
3
Chongqing Key Laboratory for Germplasm Innovation of Special Aromatic Spice Plants, College of Smart Agriculture, Chongqing University of Arts and Sciences, Chongqing 402160, China
4
Institute of Gene Science for Bamboo and Rattan Resources, International Centre for Bamboo and Rattan, Beijing 100102, China
5
Landscape Architecture and Landscape Research Branch, China Academy of Urban Planning and Design, Beijing 100044, China
6
Shenzhen Branch, Guangdong Laboratory of Lingnan Modern Agriculture, Key Laboratory of Synthetic Biology, Ministry of Agriculture and Rural Affairs, Agricultural Genomics Institute at Shenzhen, Chinese Academy of Agricultural Sciences, Shenzhen 518120, China
*
Authors to whom correspondence should be addressed.
These authors contributed equally to this work.
Agronomy 2025, 15(7), 1694; https://doi.org/10.3390/agronomy15071694
Submission received: 5 June 2025 / Revised: 30 June 2025 / Accepted: 9 July 2025 / Published: 13 July 2025
(This article belongs to the Section Crop Breeding and Genetics)

Abstract

Quinoa (Chenopodium quinoa Willd) is a tetraploid crop that has provided vital subsistence, nutrition, and medicine for Andean indigenous cultures. In recent years, quinoa has gained global importance all over the world. However, variations in fertility have been frequently observed during the flower development of quinoa, severely affecting quinoa production. To comprehend the fundamental causes of fertility variation in quinoa, this research examined hormonal metabolism and gene expression across three ecotypes: normal fertility (F), absent stamens (S1), and abnormal stamens (S3). S1 and S3 presented absent and abnormal stamens, respectively, compared with F. Phytohormone profiling yielded 60 metabolites and revealed the clear separation between different ecotypes at different developmental stages according to principal component analysis (PCA). The results of transcriptomics showed more DEGs (differentially expressed genes) identified between F and S1 ecotypes (8002 and 10,716 for earlier and later stages, respectively) than F vs. S3 (4500 and 9882 for earlier and later stages, respectively) and S1 vs. S3 (4203 and 5052 for earlier and later stages, respectively). Zeatin biosynthesis and hormone signal transduction pathways were enriched among 19 KEGG (Kyoto Encyclopedia of Genes and Genomes) terms, indicating their potential roles in quinoa flower fertility regulation. The correlation-based network presented the associations between selected hormones and genes, possibly regulating fertile ecotypes. Furthermore, we explored the expression of flower development-related genes in three ecotypes using RT-PCR, showing the higher expressions of AP1, AP3, and FLS in sterile ecotypes than fertile ecotypes at both stages. These findings reveal new insights into the hormonal and genetic regulations of floral fertility in quinoa, which may have consequences for developing high-yielding cultivars.

1. Introduction

Quinoa (Chenopodium quinoa Willd., 2n = 4x = 36) is a tetraploid Andean crop that has sustained indigenous communities for 8000 years as a source of food, nutrition, and traditional medicine [1,2]. Quinoa contains outstanding protein content and a balanced amino acid profile, compared to common cereal grains, similar to the biological value of protein in milk. It is superior to other cereals in the level of lipids, proteins, dietary fibers, vitamins B1, B2, B6, C, E, and minerals [3,4,5]. It is also noteworthy that quinoa is a gluten-free and suitable food product for people with celiac disease [5,6]. The richness of quinoa in nutritional content has led to its worldwide popularity [7,8,9]. Besides the benefits above, it has unique potential as a crop for marginal soils worldwide with its excellent adaptation [10,11].
Quinoa’s ability to produce high-protein grains under ecologically extreme conditions makes it important for the diversification of future agricultural systems [12]. These characteristics have increased the demand for quinoa considerably in recent years. However, quinoa is an underutilized crop, especially for food-scarcity countries. Despite its wide adaptability, rusticity, and nutritional superiority, its commercial potential has remained untapped. It might enhance global food security for a growing world population [13,14]. However, quinoa from South American countries is still the main supply but is insufficient, although quinoa is grown in more than 120 countries worldwide [1]. During the process of breeding new quinoa cultivars, researchers observed the presence of cytoplasmic male sterility in different quinoa cultivars, presenting no anthers or no pollen production [15,16]. The proportion of male sterility plants in offspring varied depending on the methodology used to produce progeny. The male sterile plant can produce progenies that are all male sterile, while the fertility of the progeny is restorable, depending on the pollen donor [16]. In one respect, male sterility provides a significant advantage for hybridization, and the fertility variation during field practice largely promotes utilization [17]. On the other hand, the unstable fertility and great proportion of sterile flowers in the field could severely affect quinoa production [12]. The cytoplasmic male sterility involves mitochondrial genomes interacting with the nuclear genome, and the non-coding RNAs, such as microRNAs (miRNAs) and long non-coding RNAs (lncRNAs), have been proven to be critical elements regulating male sterility [18]. Plant hormones serve as pivotal regulators of reproductive development, and their compromised synthesis or signaling leads to male sterility. It has been found that miRNAs, targeting ARF, AP2, AFB2, and HD-ZIP, can regulate hormone metabolism and alter the expression of genes related to pollen development, leading to the cytoplasmic male sterility in cotton and pigeonpea [19,20]. These results indicate that plant hormones are directly associated with male sterility. However, to our best understanding, the reports on fertility variation in quinoa are still lacking, and the possible mechanisms in regulating sterile flowers remain unknown. Therefore, investigating the possible mechanisms in quinoa fertility variation can help us promote knowledge and understanding on how molecular and metabolic features regulate the formation of ecotypes with different fertilities.
During the cultivation of quinoa ‘Pasan Ralle’, originating from Bolivia (PI 470932 coded by USDA), we observed three ecotypes, segregated after sewing: the fertile ecotype (F) and the completely sterile ecotypes S1 with absent stamens and S3 with abnormal stamens. This phenomenon aroused our interest, leading us to investigate the resulting phenotype during segregation. Phytohormone is closely related with fertility during one plant life [21]. The regulation mechanisms of phytohormones and related genes in the fertility variations in quinoa could be complicated. To shed light on the roles of phytohormones and genes in quinoa fertility, we performed metabolite profiling on phytohormones and transcriptomic analysis to reveal the potential involvement of specific hormones or genes in fertility variations in quinoa. The findings of this study will lay the knowledge foundation of phytohormones and gene regulation in quinoa fertility and provide genetic assistance in the breeding of new quinoa cultivars with improved and stable yields.

2. Materials and Methods

2.1. Materials

The quinoa accession PI 470932 with red seeds, named ‘Pasan Ralle’, was collected from Plant Germplasm Quarantine Center, USDA (Washington DC, USA). The red seeds were grown at the Fujian Institute of Subtropical Botany’s Quinoa Garden, located in Xiamen, China (118°04′04″ E, 24°26′46″ N, annual average temperature of 22 °C), at an elevation of 63 m above sea level, and the site receives an average rainfall of 1200 mm/year. The offsprings of red seeds from USDA were characterized with black colors and used in this study for further investigation. Then, these black seeds were sowed on 26 November 2021 (day 0) and eared one month later. During inflorescence development, three ecotypes of inflorescences were observed and collected as the materials tested: the inflorescences of the fertile ecotype (F) with normal stamens, sterile ecotype S1 with absent stamens, and another sterile ecotype S3 with abnormal stamens. Two developmental stages of the three ecotypes were investigated: the earlier stage (Fe, S1e, and S3e) on day 55 (20 January 2022) after planting and the later stage (Fa, S1a, and S3a) on day 76 (10 February 2022), one month before harvest. At least 15 plants were randomly selected for each ecotype and developmental stage. The morphological traits, including growth habits, plant color, shape and density of the panicle, and grain color, were continuously recorded. Each assay was tested in triplicate (at least 45 quinoa plants for each stage). The observations on flower morphology were recorded using a Leica TCS SP5 photomicroscope (Leica, Wetzlar, Germany). To obtain the proportion of each ecotype in the field, we counted the plants of each ecotype in 1 m2 and repeated that 10 times randomly in 10 × 10 m fields.

2.2. Sample Preparation for Liquid Chromatography–Mass Spectrometry (LC/MS) Analysis

Flowers from the top, middle, and bottom positions of the inflorescence were collected for metabolite profiling. Fresh flowers were immediately frozen in liquid nitrogen and ground into powder using a pre-cooled mixer mill (MM400, Retsch, Haan, Germany) with two metal beads at 30 Hz for 1 min. A total of 50 mg of the powder sample was weighed and extracted in 1 mL of pre-cooled extraction mixture containing methanol: water: formic acid (15:4:1, v/v). The mixture was incubated in an orbital shaker (MIX-200, Jingxin, Shanghai, China) at 25 °C at 800 rpm for 10 min, followed by centrifugation at 4 °C at 12,000 rpm for 5 min (5424R, Eppendorf, Leipzig, Germany). The supernatant was transferred to a new 2 mL Eppendorf tube, followed by evaporation to dryness. Then, it was re-dissolved in 100 μL of 80% methanol (v/v). The extract was filtered through a 0.22 μm membrane filter for further UPLC-MS/MS analysis.

2.3. Metabolite Profiling on Phytohormones Using UPLC-MS/MS

The metabolite profiling on phytohormones was performed using a UPLC-ESI-MS/MS system (UPLC, ExionLC™ AD, Applied Biosystems 6500 Triple Quadrupole), AB Sciex Pte. Ltd., Marlborough, USA). The analytical conditions were summarized and modified based on previous reports [22,23]. Briefly, separation was performed by using a C18 column (Waters Quantity, Manchester UK), maintained at 40 °C. The mobile phase was composed of water with 0.04% acetic acid (phase A) and acetonitrile with 0.04% acetic acid (phase B). The gradient transition was programed as: 5% phase B (0–1 min), 5%–95% phase B (1–8 min), 95% phase B (8–9 min), and 95%–5% phase B (9.1–12 min). An amount of 2 μL of extract was injected for analysis, with a flow rate at 0.35 mL/min.
Data acquisitions were performed using Analyst 1.6.3 software (Sciex), and metabolites were quantified using Multiquant 3.0.3 software (Sciex), based on the standard curve of each metabolite. To comprehensively obtain an overview of the phytohormone in quinoa flowers, the hormone metabolites appearing in at least three replications of one ecotype and developmental stage were kept, and the zero values were replaced by the 1% of the minimum non-zero value for further analysis. The significantly changed metabolites were obtained between different ecotypes at two developmental stages using t-test, followed by p-value adjustment with the false discovery rate (FDR) algorithm.

2.4. Sample Preparation for RNA-Seq Analysis

The same samples (three replications) for metabolite profiling were used for transcriptomic analysis. Total RNA was isolated using a Quick RNA isolation kit (Bioteke Corporation, Beijing, China) based on the manufacturer’s instructions. The quality and quantity of isolated RNA were evaluated by 1% agarose gel and examined with a NanoDrop ND1000 spectrophotometer (Thermo Fisher Scientific, Wilmington, DE, USA). The construction of the libraries and the RNA-Seq were performed by Biomarker Biotechnology Co., Ltd. (Beijing, China). The purified mRNA was concentrated using the Reasy RNA cleaning kit (Qiagen, Hilden, Germany) according to the manufacturer’s protocol and then broken into short fragments. The first- and second-strand cDNAs were synthesized and ligated to Illumina paired-end Solexa adaptors. The products of the ligation reaction were purified and selected on a 2% agarose gel. The quality of cDNA was evaluated using the Agilent 2100 Bioanalyzer (Agilent, Palo Alto, CA, USA). The constructed libraries were sequenced using Illumina HiSeq 2500 (Illumina, San Diego, CA, USA).

2.5. RNA-Seq Analysis

The raw data was evaluated and cleaned using the fastp package [24]. The HISAT2 (v2.2.1) [25] software was employed to align the clean reads to the reference genome [26]. The read counts and fragments per kilobase per million (FPKM) were calculated as gene expression levels using the featureCounts software (v2.0.6) [27]. The low-expression genes with average FPKM < 0.5 across all samples were filtered out. The criteria of |log2 (fold change)| > 1 and q < 0.05 were used to estimate differentially expressed genes (DEGs) with DESeq2 software (v1.42.1) [28]. The selected DEGs were fed into pathway enrichment analysis based on the Kyoto Encyclopedia of Genes and Genomes (KEGG) database (http://www.kegg.jp/, accessed on 13 May 2024).

2.6. Quantitative Real-Time PCR (qRT-PCR) Analysis

A total of 13 genes associated with flower development were selected for qRT-PCR analysis, and the primers are listed in Table S1, including flower development (AP1, AP2, AP3, AG, KANs, NAC-LIKE, SOC1, CUP-SHAPED, and LEAFY), pigment synthesis (CYP76AD and FLS), and the recognition of female and male gametophytes in self-recognition (SRK and SP11). Total RNA was extracted from quinoa inflorescence (0.2 g) at different developmental stages with 1 mL of Trizol reagent (TaKaRa, Dalian, China) following the manufacturer’s protocol. The Moloney murine leukemia virus reverse transcriptase from TaKaRa was used for the synthesis of first-strand cDNA. The expression levels of the selected genes were detected using the gene-specific primers (Table S1) on the BioRad CFX96 Touch (Bio-Rad, Hercules, CA, USA) detection system. The TUB-6 gene was used as an internal reference gene, and the comparative 2−ΔΔCt method was used to calculate the relative quantification values of each gene. Three independent biological replications were used for the estimation of each gene.

2.7. Data Analysis

Principal component analysis (PCA) was performed using the pca function implemented in the “factoextra” package (v1.0.7) [29] with platform R 4.3.2. The metabolite contents and gene expression levels were log2-transformed prior to PCA. The UpSet plot on DEGs and KEGG terms was constructed with the UpSet plot provided in the Tbtools software (v2.041) [30]. The clustered heatmap with significant annotations was created based on metabolite contents and correlation coefficients using the Heatmap function within the “Complexheatmap” package [31]. Correlation analyses were performed using the corr.test function with the “Pearson” algorithm provided in the “psych” package (v2.4.1) [32]. Visualization of the correlation-based network between selected metabolites and DEGs was achieved using Cytoscape 3.10.1 [33].

3. Results

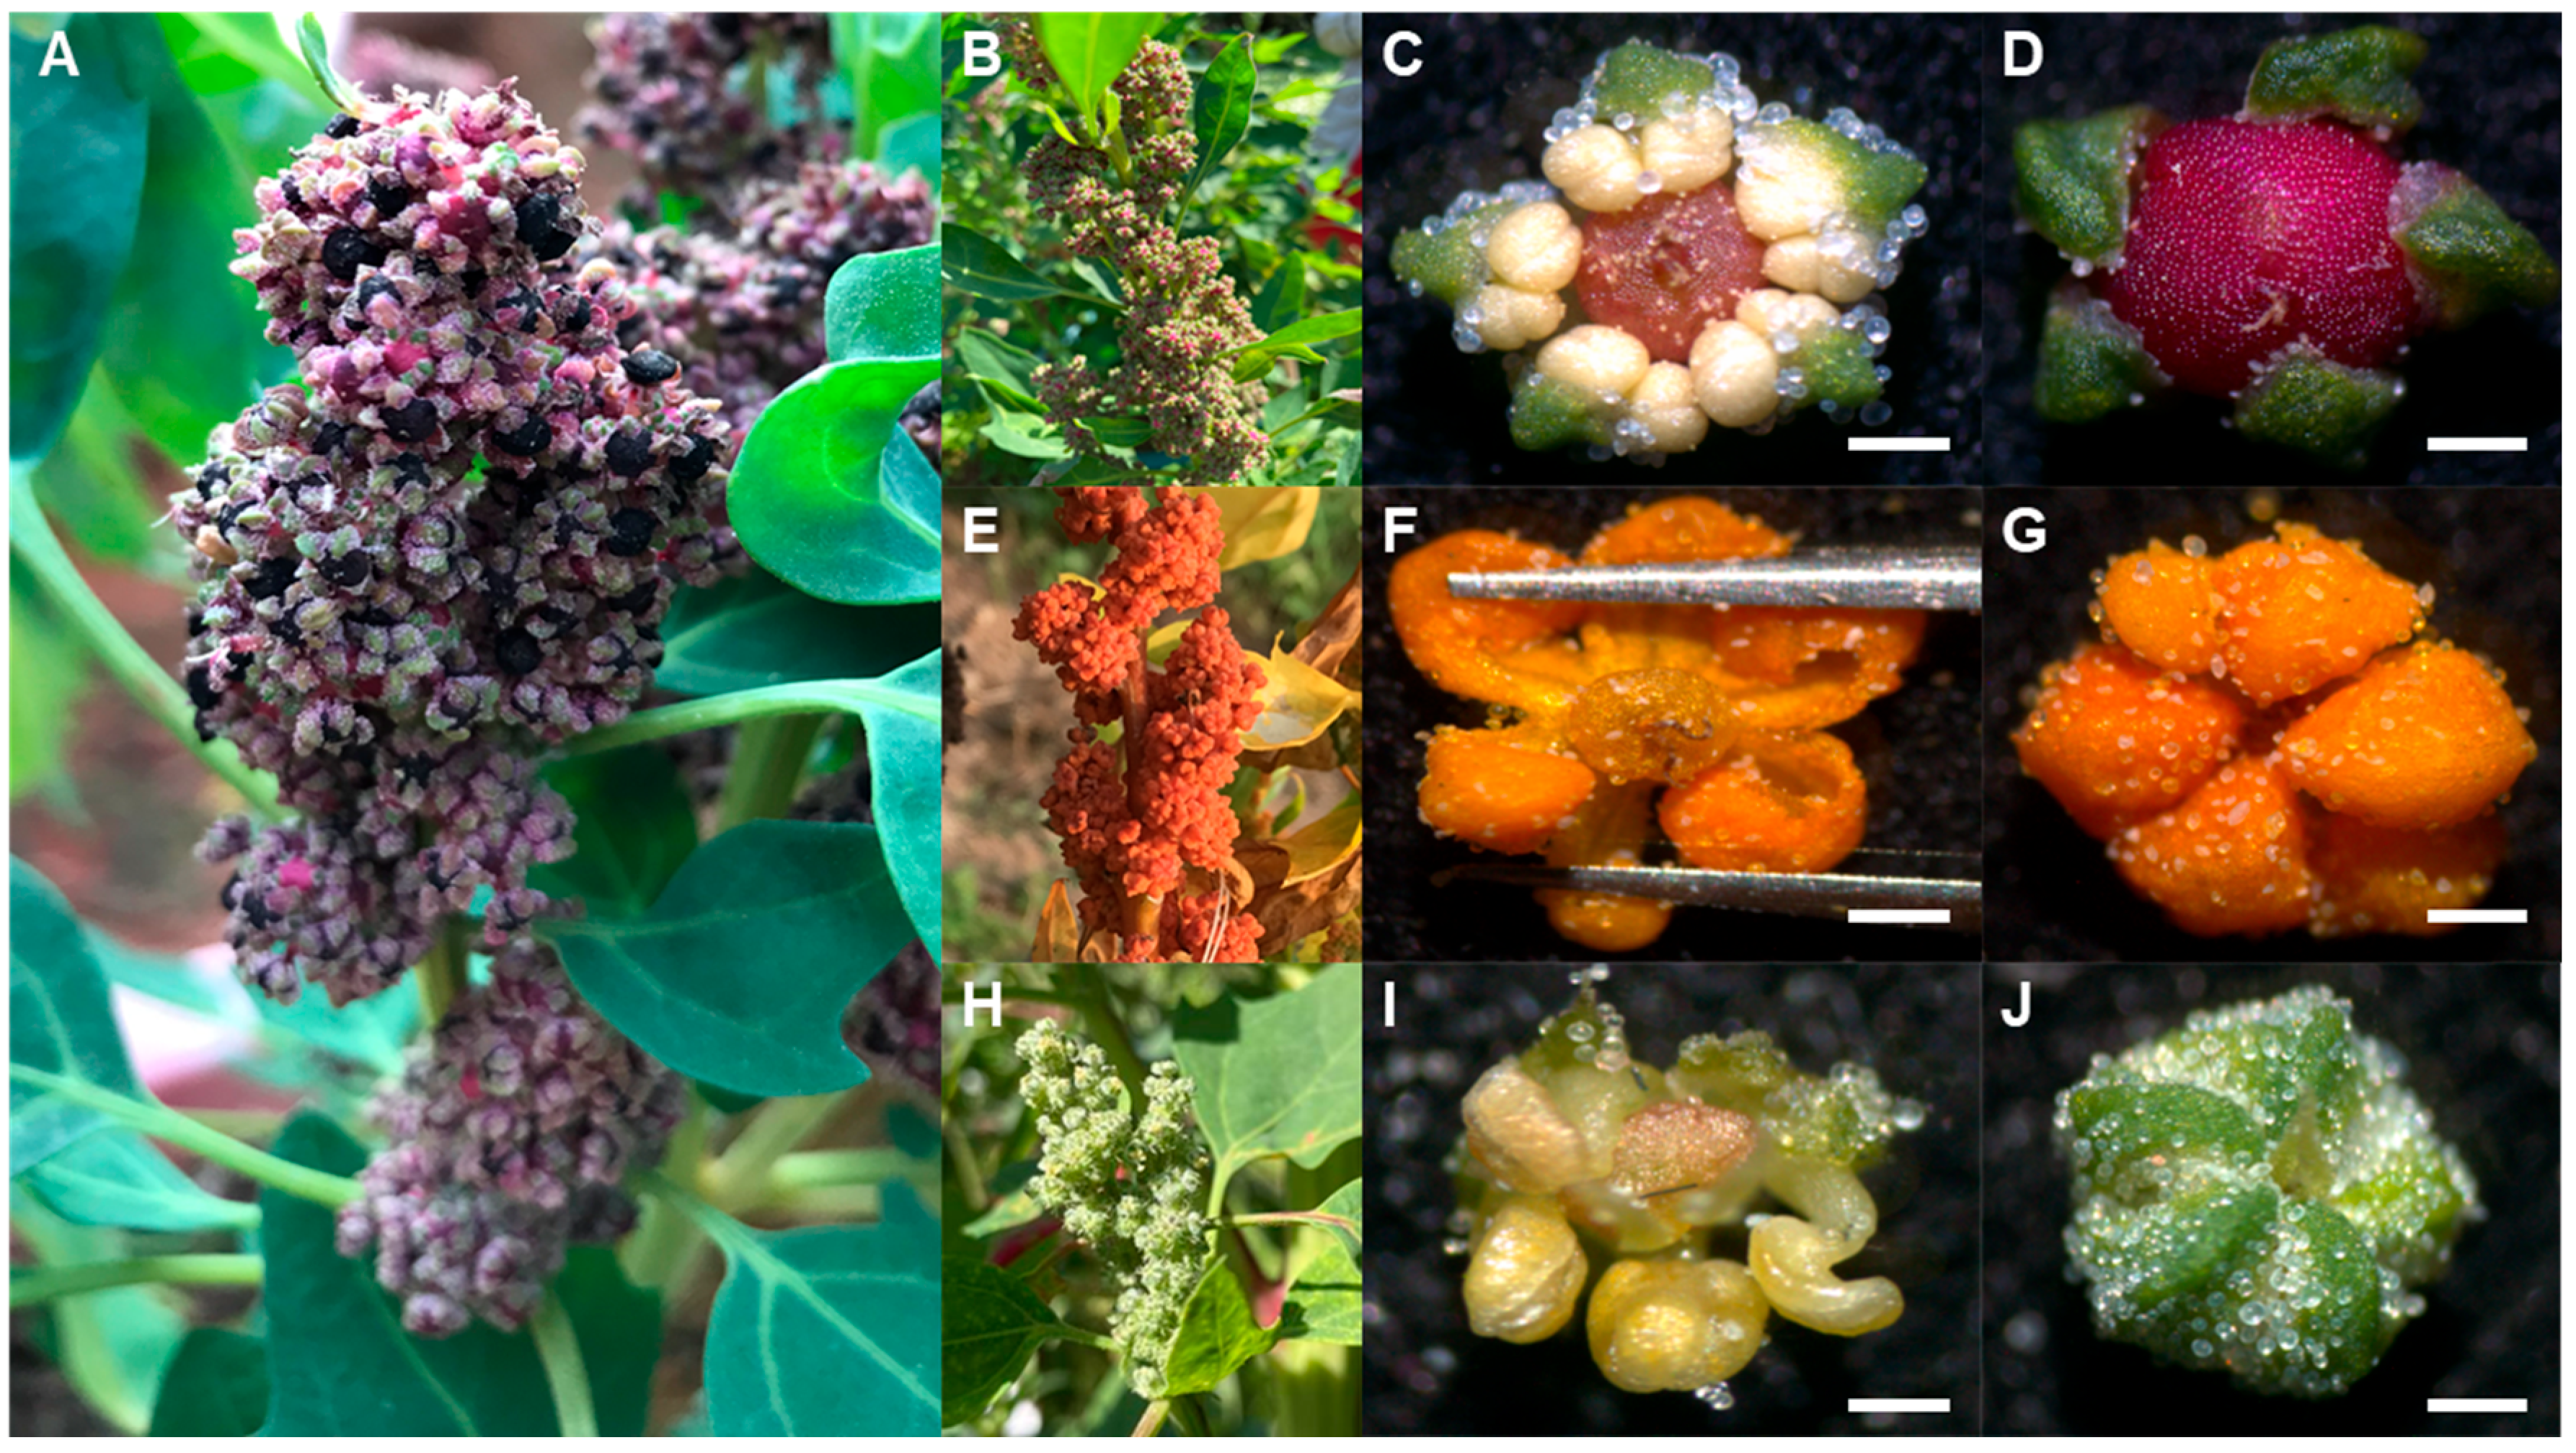
3.1. Morphological Characters of Three Ecotypes with Different Sterile Abilities

During growing and flower development of quinoa, different growth habits and morphological changes in flower organs, plant color, shape and density of the panicles, and grain shapes/color were continuously observed (Table S2). The morphological traits of offsprings resembled that of the maternal parent, showing a branched growth habit. However, the phenotypes of flower inflorescences varied greatly, compared with their paternal generation, forming three different ecotypes based on their fertility: the fertile F, the sterile S1, and the sterile S3. The F ecotype accounted for 20% of offspring plants and possessed regular flower tissue, with more than 95–98% of normal flowers in a compact amaranth-form inflorescence (Figure 1A,B). In flowers of the F ecotype, the hermaphrodite ones were located at the distal end and bore five perianth lobes, five dominant anthers, and a superior ovary with two or three stigmatic branches. The remaining offspring plants (80%) were composed of S1 and S3 ecotypes. The S1 and S3 both presented a loose, glomerular inflorescence and six sepals. However, the stamens were completely absent throughout the whole inflorescence in the S1 ecotype, which only showed bifurcate or trifurcate stigma (Figure 1F). The S3 ecotype still possessed exserted and bifurcate stigmas, of which few stigmas were aborted. In addition, all anthers in the flowers of the S3 ecotype were aborted across the whole inflorescence (Figure 1I). Incomplete filaments were found in some inflorescences of S3 plants.

3.2. The Phytohormones in the Three Ecotypes of Quinoa Flowers

The metabolite profiling on phytohormones in different ecotypes and developmental stages of quinoa flower yielded 60 metabolites, including 23 auxins, 21 cytokinins (CKs), 9 jasmonic acids (JAs), 3 gibberellins (GAs), 2 abscisic acids (ABAs), and 2 salicylic acids (SAs) (Table S3). Based on the accumulation of hormones, the PCA explaining 55.5% of the total variation revealed the clear separation between different ecotypes and developmental stages of quinoa flowers (Figure 2A). During the early development of quinoa flowers, the fertile ecotype (F) was clearly separate from the cluster of the other two sterile ecotypes (S1 and S3). The great metabolite variation between fertile and both sterile ecotypes was verified by the accumulation pattern of phytohormones (Figure 2B) and the number of differentially accumulated hormones (DAHs, Figure 2C). In contrast, three ecotypes presented greater metabolite variations in the later developmental stage, showing wide distributions from each other. The metabolite variation can be further confirmed by their different patterns of metabolite contents and greater number of DAHs than that in the earlier developmental stage (Figure 2C,D).

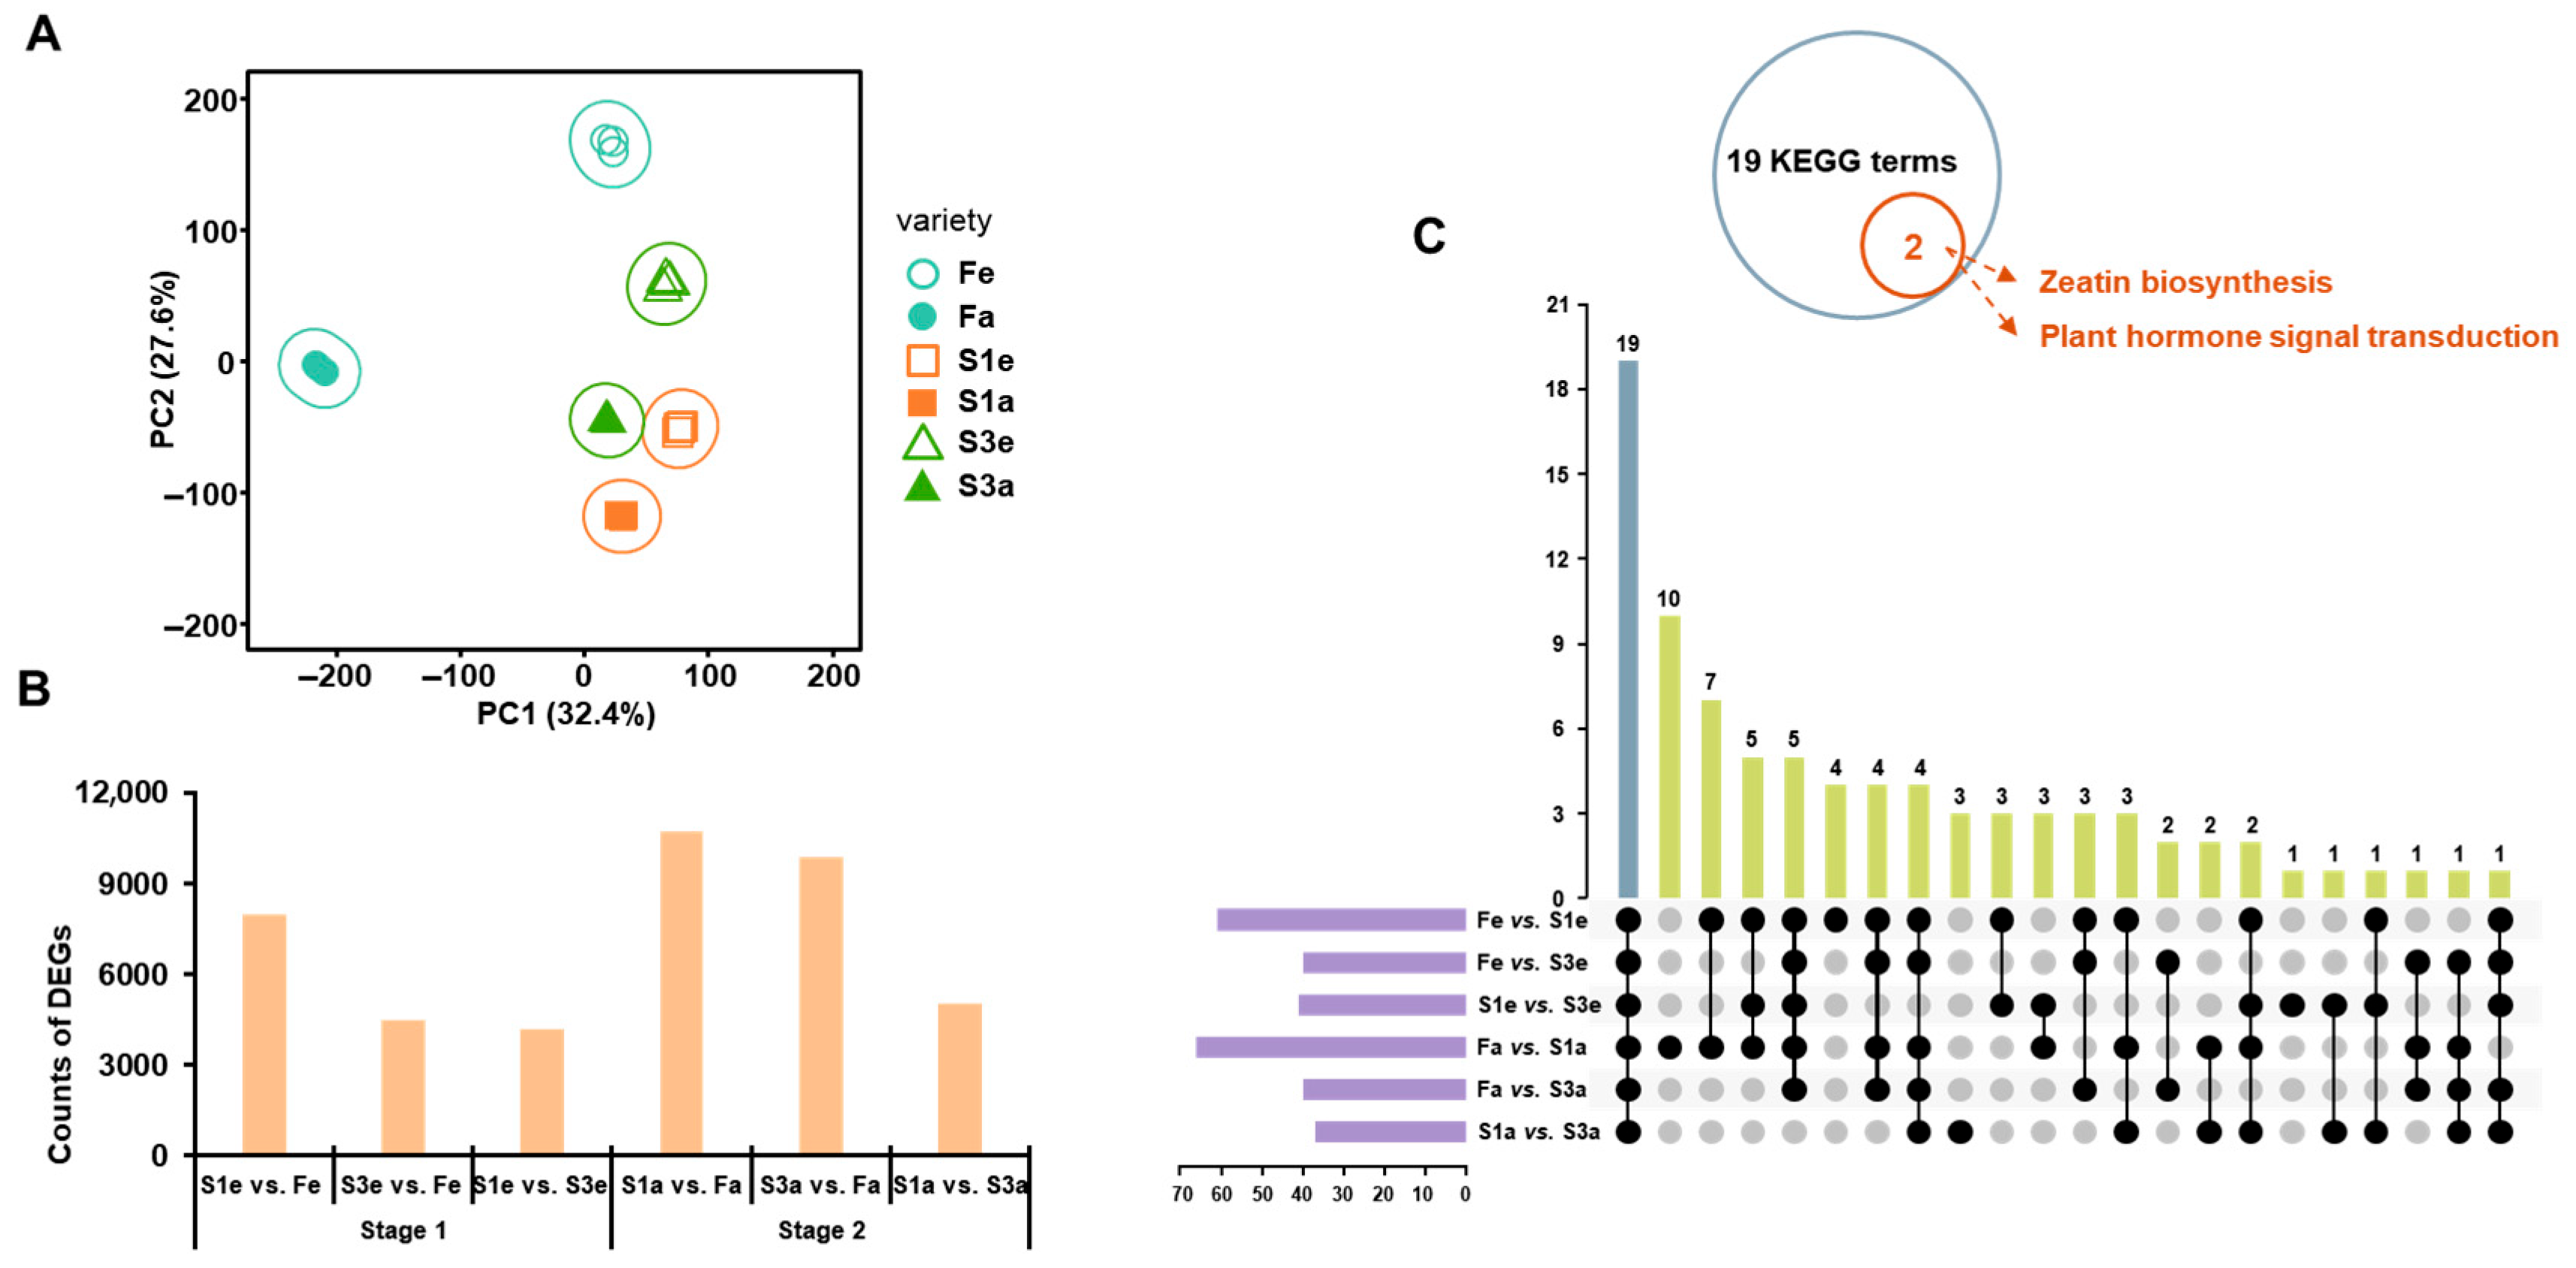
3.3. The Transcriptomic Analysis in the Three Ecotypes

The high-quality reads (Q20 > 97.6% and Q30 > 93%) (Table S4) were mapped to the reference genome. The genes with a threshold of 0.5 in the average FPKM across all samples were defined as expressed genes, yielding 29,687 genes in the present research. The PCA of gene expression, representing 60.0% of the total variation, distinguished three ecotypes clearly (Figure 3A). In contrast to hormones, the gene expressions of the three ecotypes were distributed widely (Figure 3A), indicating the great variation in gene expression among ecotypes at two stages. In detail, 8002 and 10,716 DEGs were identified between fertile F and S1 ecotypes at the earlier and later stages, respectively. In addition, 4500 and 9882 DEGs were identified between the fertile F and S3 ecotypes at the earlier and later stages, respectively. These numbers of DEGs between sterile F and the other two sterile ecotypes, compared to that between S1 and S3 at both developmental stages (4203 for S1e vs. S3e and 5052 for S1a and S3a, accordingly) (Figure 3B), indicate that there could be more comprehensive regulations in determining the fertility of quinoa. To obtain the possible regulators distinguishing three ecotypes based on floral organs during their development, the KEGG enrichment analysis was performed on their DEGs, showing extensive gene regulations (Figure 3C). Interestingly, the most regulated pathways between the F and S1 ecotypes at two developmental stages were observed, showing 62 and 61 significantly changed pathways. A total of 19 KEGG terms were identified based on the comparisons between two stages of three ecotypes (Figure 3C). Among these KEGG terms, zeatin biosynthesis and plant hormone signal transduction were identified and associated with fertility (Table S5), suggesting the potential role of phytohormones in regulating flower ecotypes.

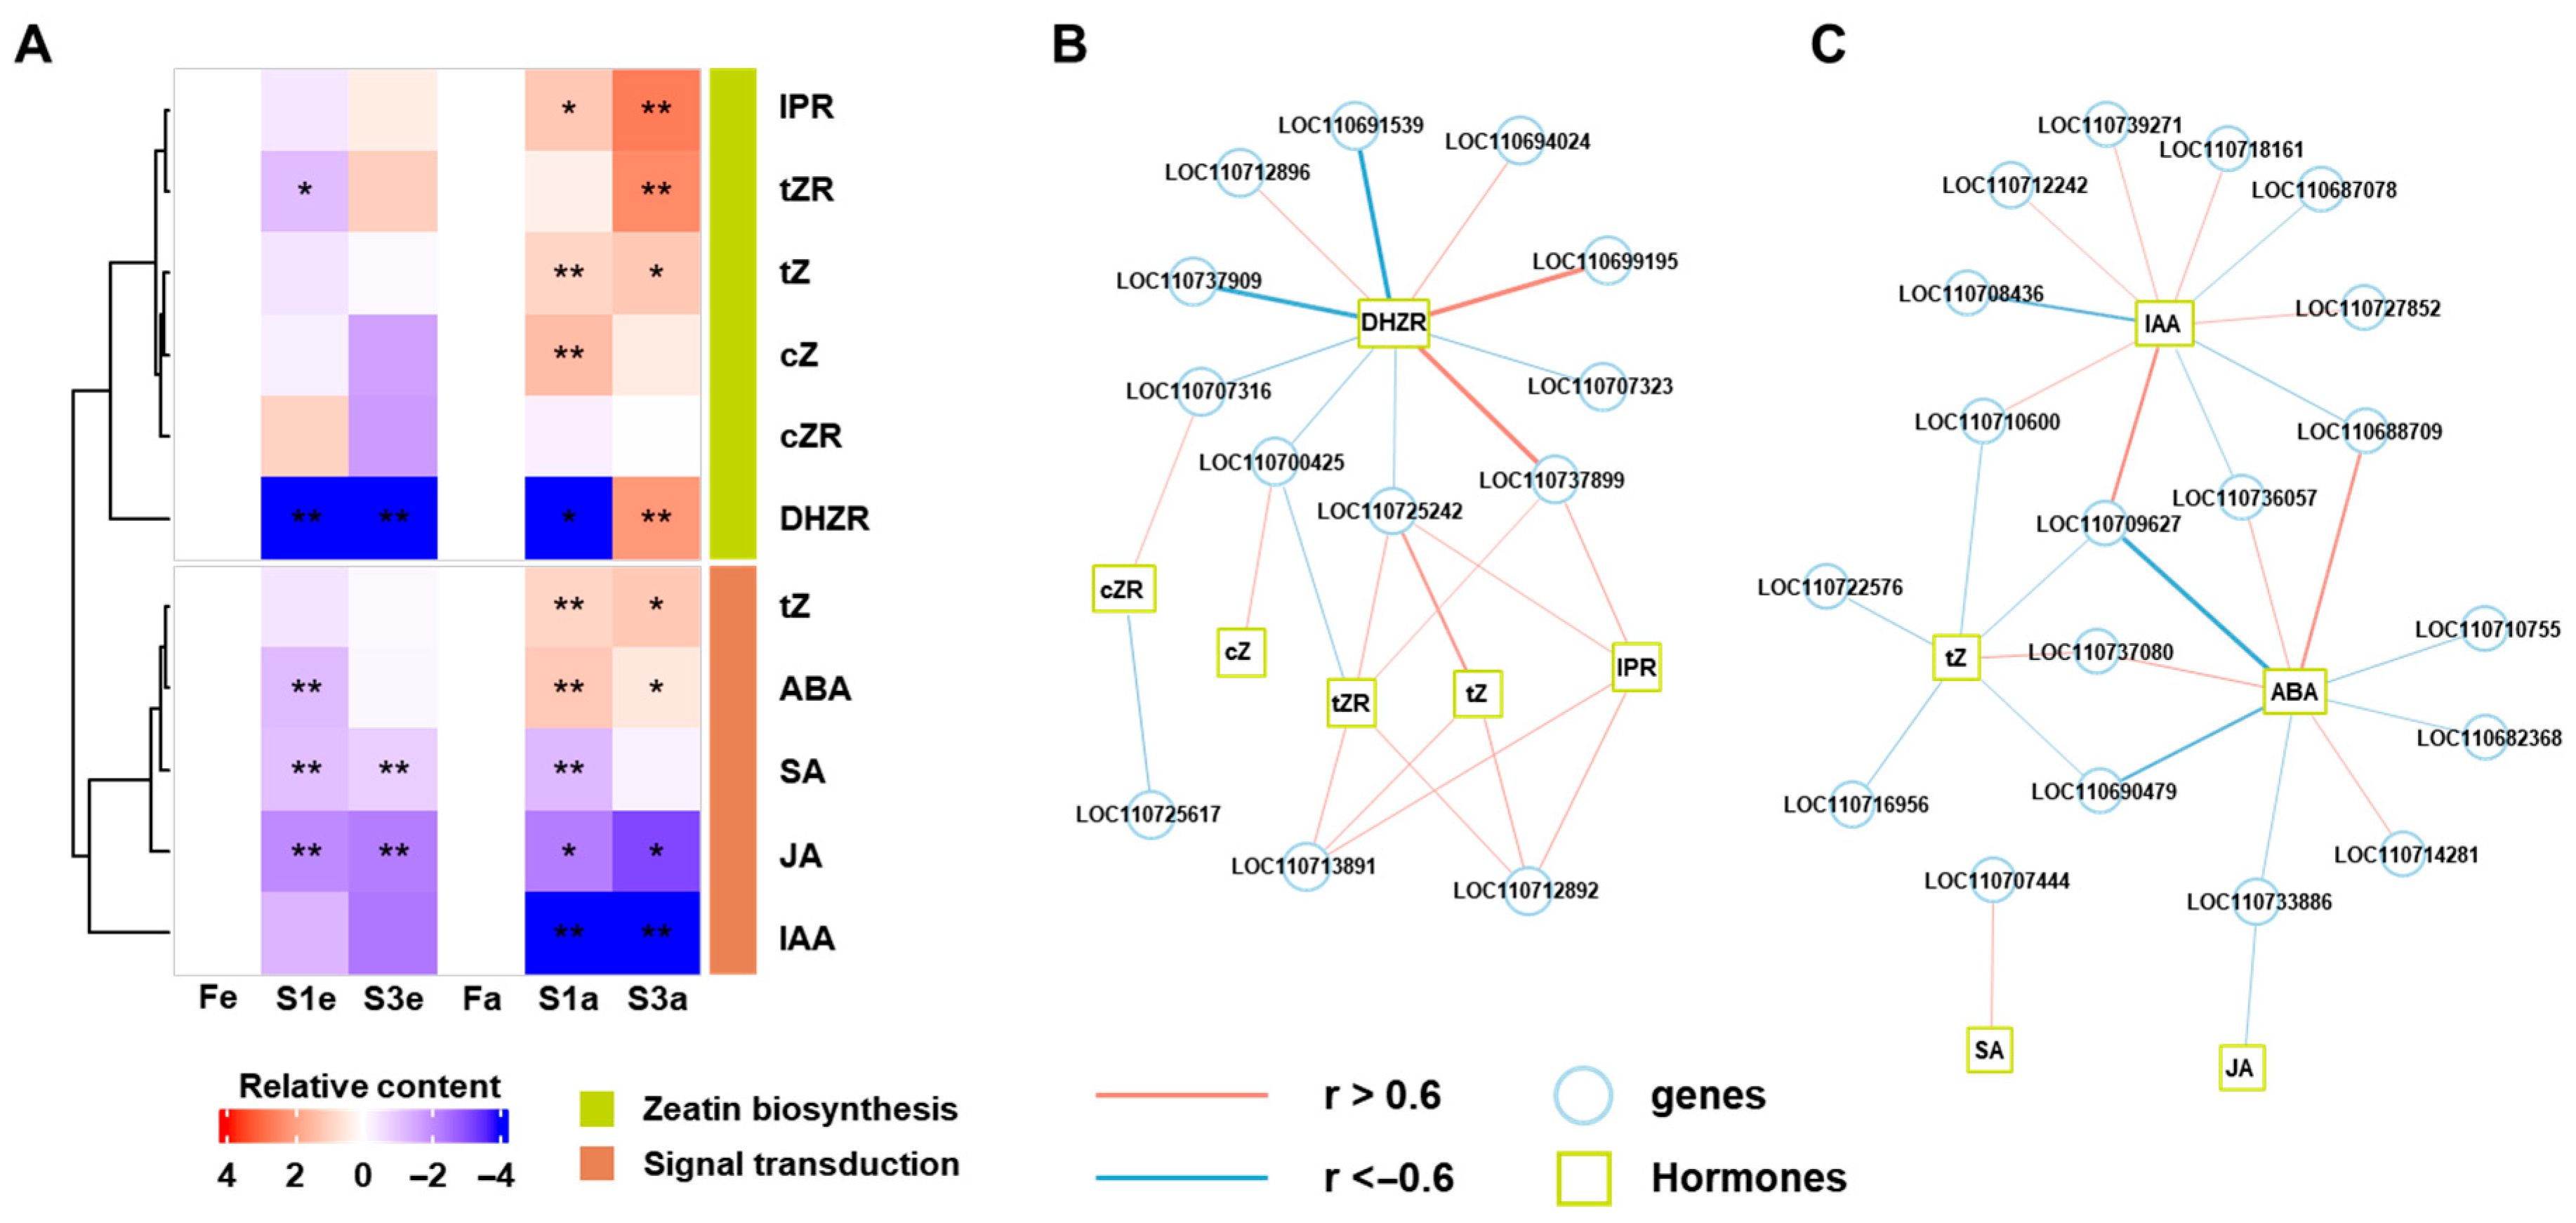
3.4. The Combined Analysis of Gene Expression and Hormone Accumulation

We identified two hormones related to KEGG terms, “zeatin biosynthesis” and “plant hormone signal transduction”, significantly changed between different flower ecotypes (Figure 3). To obtain the association between hormones and related genes, we isolated the genes and hormones that related to “zeatin biosynthesis” and “plant hormone signal transduction”. We extracted the DEGs enriched in “zeatin biosynthesis” and “plant hormone signal transduction” between different comparisons of flower ecotypes in two stages, respectively (Figure S1A,B,D,E). Eventually, 18 and 52 DEGs were isolated for “zeatin biosynthesis” and “plant hormone signal transduction”, respectively (Figure S1C,E). Furthermore, we searched for the detected hormones related to “zeatin biosynthesis” (ko00908) and “plant hormone signal transduction” (ko04075) and isolated six and five hormones for “zeatin biosynthesis” and “plant hormone signal transduction”, respectively (Figure 4A). Among the hormones of plant hormone signal transduction, SA, JA, and IAA were generally lower in sterile ecotypes than the fertile ecotype at both stages. In contrast, tZ and ABA showed significant (p < 0.05) increases in S1a and S3a. The hormones of zeatin were not greatly changed between different fertility ecotypes at the early stage, while a general increase in metabolites was observed in sterile types (S1a and S3a), compared to the fertility type (Fa) at later stages, except for cZR.
Then, the associations between identified genes and hormones were addressed using correlation analysis across the samples of different ecotypes, and the correlation-based network highlighted the potential associations of the “gene-hormone” in regulating the flower ecotypes (Figure 4B,C). For instance, in zeatin biosynthesis, the tZR, IPR, and tZ were mostly and positively correlated with four genes (LOC110725242, LOC110737899, LOC110713891, and LOC110712892). DHZR showed a more negative association with gene expression, such as LOC110691539 and LOC110737909 (Figure 4B). When focusing on the associations in plant hormone signal transduction, IAA presented a contrary pattern of correlations, in comparison with ABA, on three genes (LOC110709627, LOC110736057, and LOC110688709), while the latter showed similar correlation connections with tZ, including LOC110709627, LOC110737080, and LOC110690479 (Figure 4C).

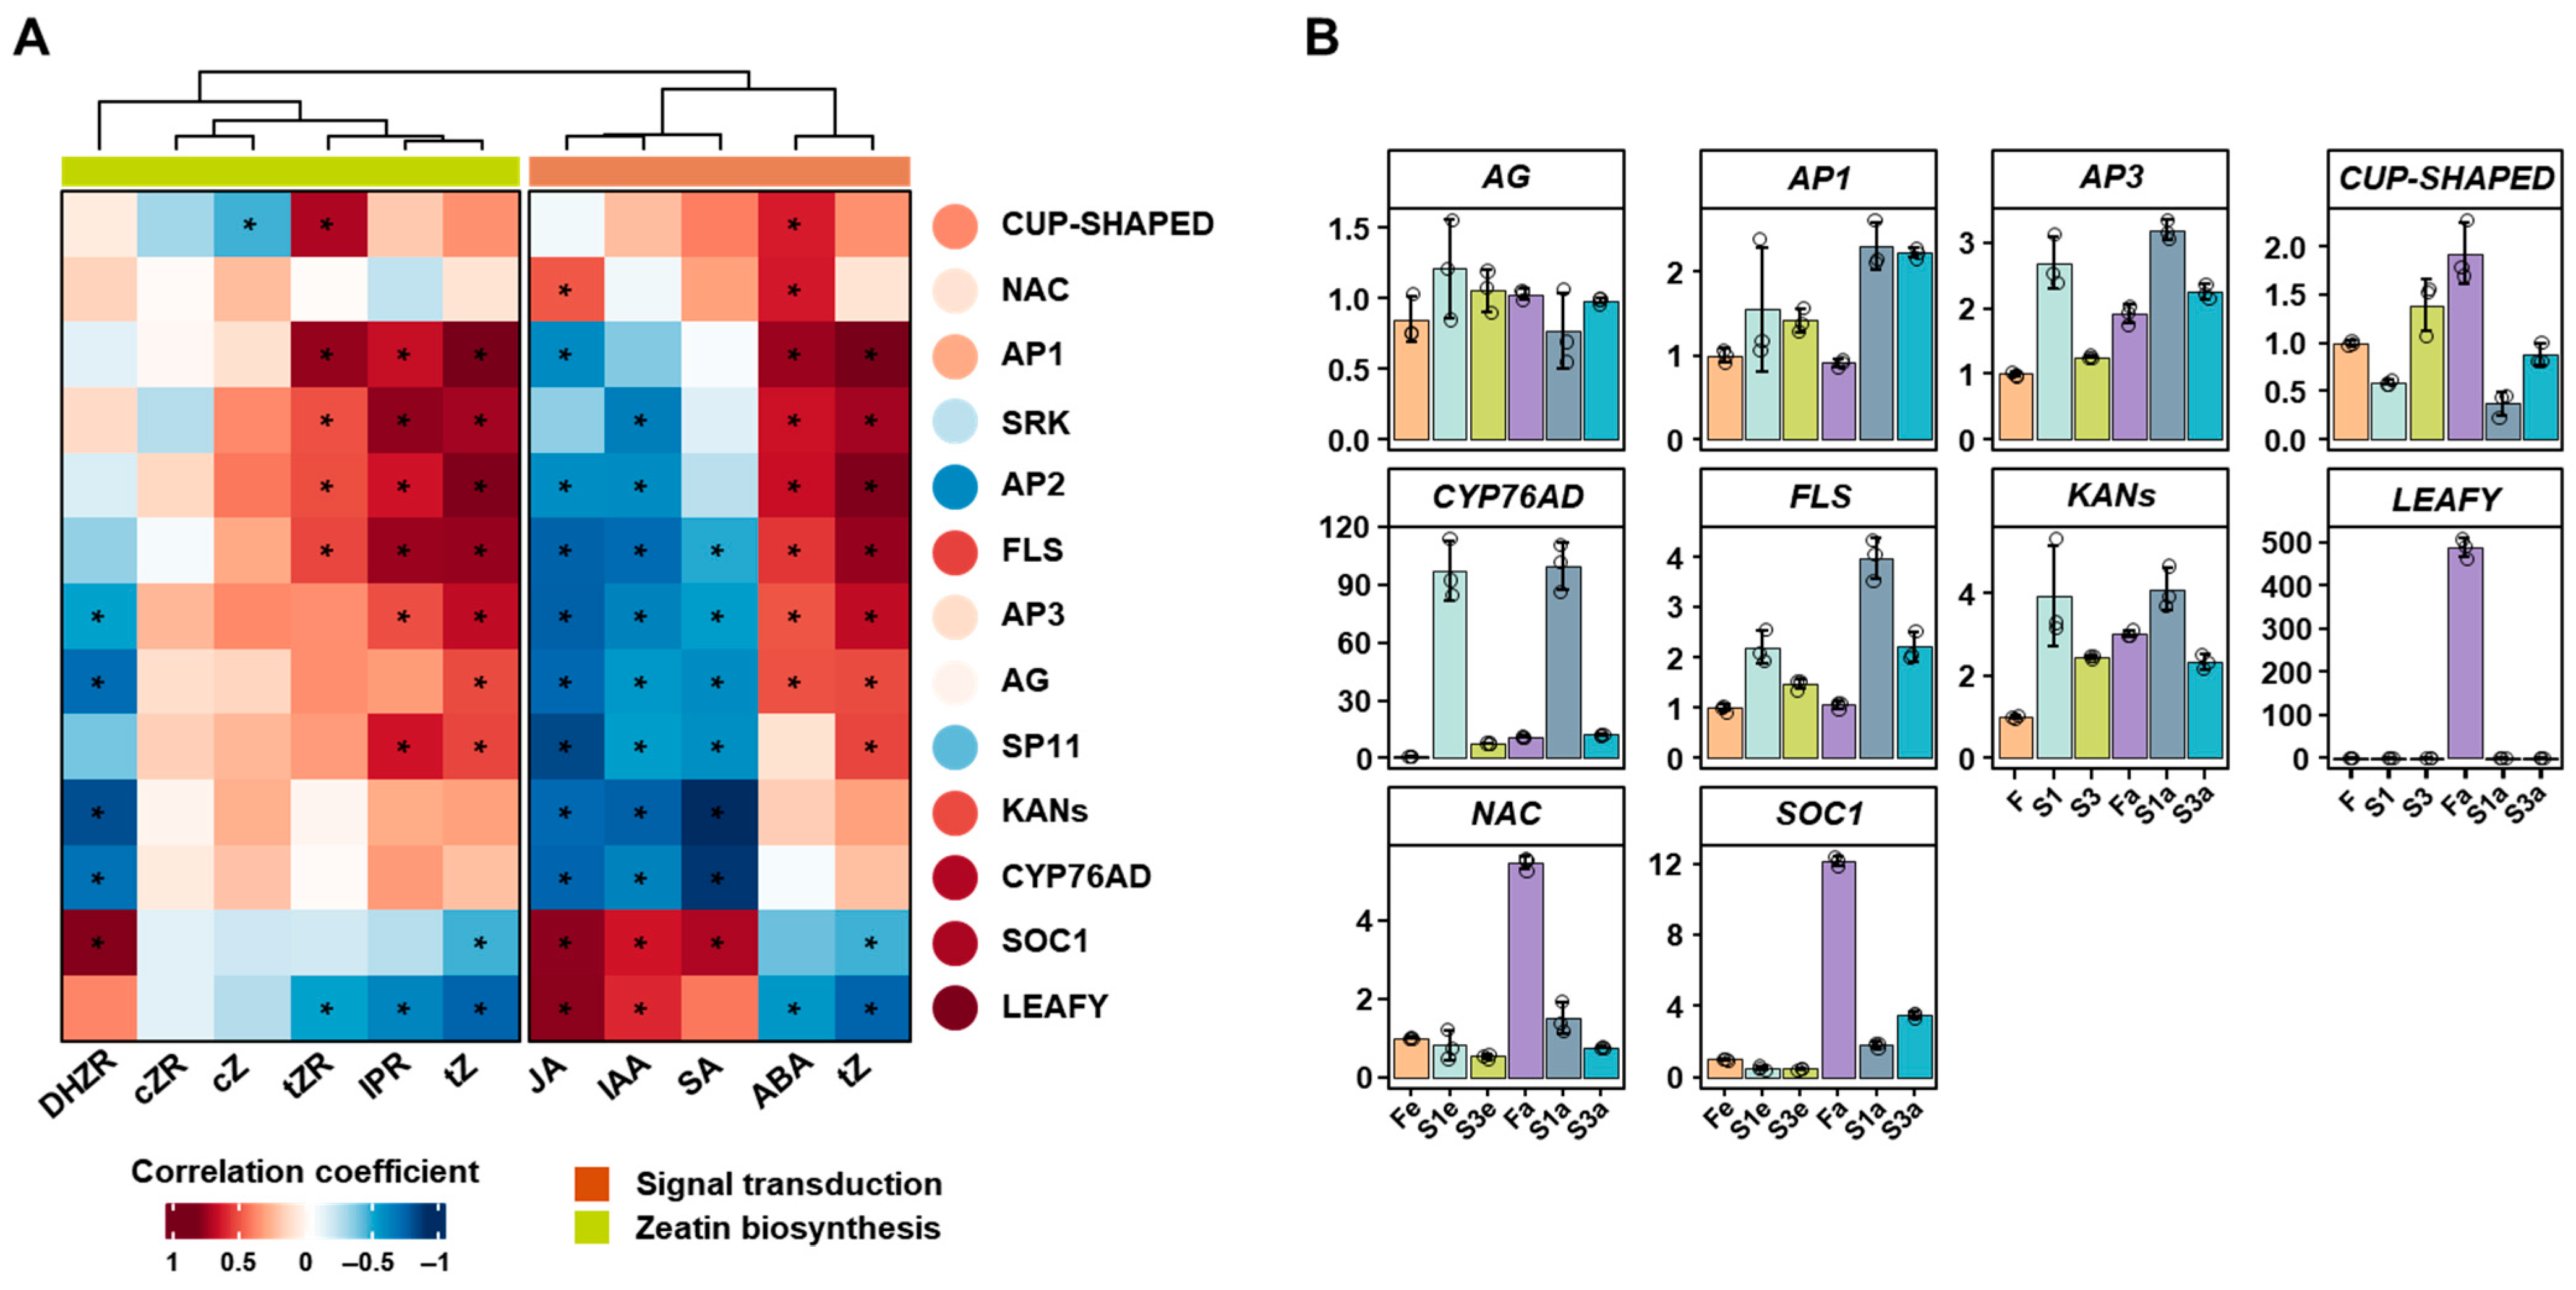
3.5. The Gene Expression Related to Flower Development

The knowledge about the unstable fertility of quinoa is lacking; thus, we explored some genes related to flower development. In total, we isolated 13 genes that were significantly changed in at least one comparison between different fertilities (Table S1), including flower development (AP1, AP2, AP3, AG, KANs, NAC-LIKE, SOC1, CUP-SHAPED, and LEAFY), pigment synthesis (CYP76AD and FLS), and the recognition of female and male gametophytes in self-recognition (SRK and SP11). First, we investigated the association between the hormones related to “zeatin biosynthesis” and “plant hormone signal transduction” (Figure 4A and Figure 5A). The expression of selected genes presented general positive correlations with the ABA and tZ of “plant hormone signal transduction” and cZR, cZ, tZR, IPR, and tZ of “zeatin biosynthesis”, except for the genes SOC1 and LEAFY. In contrast, the above-mentioned genes, excluding NAC and CUP-SHAPED, were negatively associated with JAA, IAA, and DHZR. Then, we examined the expressions of selected genes by performing RT-PCR, and the expressions of selected genes from RT-PCR were correlated with their FPKMs (Figure 5A, right circles). Ten genes displayed similar trends between RT-PCR expression and FPKMs, and their RT-PCR values varied between fertile and sterile ecotypes at different stages (Figure 5B). For instance, the expressions of AP1, AP3, and FLS were higher in sterile ecotypes than fertile ecotypes at both stages. NAC and SOC1 were expressed lower in sterile ecotypes than fertile ecotypes at both stages. In contrast, KANs showed a higher level in sterile ecotypes (S1 and S3) than the fertile ecotype at an early stage, while the expression patterns changed at a later stage.

4. Discussion

4.1. Seed Coat Color and Inflorescence Color

Quinoa is an agriculturally important crop species, and the seed appearance of quinoa is diverse, with various shapes, sizes, colors, and patterns [17]. One of its most important agricultural traits is seed color, while the genetic basis of quinoa seed color remains yet poorly understood like other corns [34]. Therefore, quinoa breeders develop cultivars with morphological characteristics that meet market demands in their target regions. In our research, the parental cultivar, the offspring of ‘Pasan Ralle’, had purple and green inflorescences and black cylindrical seeds, while the fertile filial generation had green inflorescences and red ellipsoidal seeds (Figure 1B–D). Compared with the bright and red seed coat of ecotype F, the ecotype S1 had a good ornamental value of golden inflorescence (Figure 1B,E). The color appearance in quinoa resulted from betalain synthesis, instead of anthocyanins [35]. In addition, flavonoids and phenolic acids were found to be co-pigments with betanin in quinoa grains [36,37]. These pigments fulfill similar functions to anthocyanins and are mutually exclusive in plants so far [38,39,40]. Quinoa is affiliated with the family Amaranthaceae, one of ten betalain-synthesis families in the order of Caryophyllales [41]. The CqCYP76AD gene was identified with a vital role in betalain biosynthesis in quinoa [42,43]. We estimated the expression of CqCYP76AD, as well as of CqFLS, responsible for flavonol synthesis, in the flowers of different ecotypes. Our RT-PCR results revealed the significantly higher expressions of both genes in the ecotype S1, with long, golden inflorescence (Figure 5B). The bright-colored inflorescence and outstanding expression of CqCYP76AD indicated the great abundance of betalains in the flower of ecotype S1, compared to the other two ecotypes (Figure 1E and Figure 5B). Betalains are important natural pigments that can be used as a food supplement and cosmetic colorant and has antioxidant, antitumor, liver protection, and other healthcare medical values [38]. The bright color of inflorescence and possible high accumulation could make ecotype S1 possible for ornamental purposes with health benefits.

4.2. Potential of Male Sterility in Quinoa Breeding

The perfect quinoa flowers are tiny (3 to 4 mm in diameter) and clustered together in large numbers to form the inflorescence. Hybridization techniques involving manual emasculation and pollen transfer are, therefore, extremely/quite difficult in the cross-fertilization of quinoa flowers [44,45]. Male sterility plants have been proven to be useful and crucial breeding tools to harness heterosis and to guarantee the outcrossing of naturally autogamic plant lines that could be helpful to increasing crop productivity [46,47,48]. Male sterility mutations can cause the abnormal development of either the sporophytic or gametophytic anther tissues, leading to pollenless sterility [46]. It has been found that quinoa carries both normal and male sterile cytoplasm, with the latter ecotype showing the complete absence of anthers and the prominent exsertion of stigmas [16]. In our study, we observed two male sterile ecotypes, S1 (Figure 1E–G) and S3 (Figure 1H–J), with different phenotypes on flower structures. Both S1 and S3 cannot provide functional pollen grains, due to the absence of anthers or aborted anthers, and the two ecotypes could be potential providers of the male sterile line (Figure 1F,I). Ecotype S1 may be more useful than S3 to be used as the male sterility line to facilitate the breeding and variety development of quinoa because of the advantage of completely absent stamens [44,49]. Well-characterized male sterile systems have already been used to create hybrids in many crop species, such as maize, wheat, and sorghum [50,51,52]. Such a system may also prove valuable in quinoa in the future.

4.3. The Possible Roles of Phytohormones in Flower Fertility of Quinoa

Despite the considerable progress in the flowering field in higher plants over recent years, we are far from a systems-wide understanding of the gene regulatory networks underlying this key developmental process in quinoa [53]. The male sterility of quinoa flowers in this study resulted from the absent or abnormal development of stamens (Figure 1C,F,I), tightly associated with quinoa flower development. Particularly, phytohormones, such as cytokinins (CKs), gibberellins (GAs), and jasmonic acid (JA), interacted with each other and contributed with essential roles to flower development [54,55,56]. Moreover, tremendous reports documented that GA is required for stamen development at earlier stages of flower development, whereas other phytohormones, including JA, auxin, and CK, participated in the late stamen development [57]. In the current study, the stamens were established at an earlier stage of F and S3 ecotypes (Fe and S3e); the contents of GAs (GA15, GA 19, and GA 53) were not consistently higher in the flower of Fe and S3e ecotypes (Figure 1 and Figure 2B). In contrast, the contents of JA and some auxins (such as IAA, IPA, and TRA) were consistently higher in fertile Fe than in sterile types S1e and S3e (Figure 4A). JA and auxin have been thought to play an important role in regulating stamen development [21,57,58]. Mutations in genes that participate in JA biosynthesis cause a failure or delay in anther dehiscence and can result in male sterility [59]. Sterile Arabidopsis thaliana flowers accumulated lower levels of endogenous auxin and JA than normal flowers [60]. Taken together, our results on the changes in GAs, JA, and auxin indicate their potential roles in the formation and development of quinoa stamens, resulting in male sterility.
In addition to the above-mentioned regulation of phytohormones in flower development, the initiation of anther genesis required a certain threshold level of ABA. A crucial prerequisite for high anther genesis effectiveness was the specific homeostasis of plant growth regulators of IAA, CKs, and ABA in ascending required contents [61]. In our study, only the fertile ecotype F showed the same trend in the contents of IAA, CKs, and ABA (Table S3), with the other two sterile types showing an incongruent order in the contents of IAA, CKs, and ABA. The floral meristem initiation and termination were preceded by the formation of local maxima of the phytohormone auxin through polar auxin transport [62,63]. The mutations within the genes encoding AUXs/IAAs affected stamen development. However, the crosstalk between these phytohormones makes it still unclear how they regulate the development of stamens in quinoa.

4.4. The Transcriptome and RT-PCR Reveal the Interaction Between Phytohormones and Gene Expression in Flower Fertility of Quinoa

The current study explored the association between phytohormones and gene expression to estimate how their interactions contribute to the flower fertility of quinoa. At both developmental stages, greater variations in gene expression were observed between F and S1 ecotypes, as compared with the other two comparisons, S3e vs. Fe and S1e vs. S3e (Figure 3B). Considering the abnormal development of stamens in flowers at the S1e and S3e stages (Figure 1F,I), the more obvious changes in gene expression may be associated with complex regulations in stamen development. Flower development was induced by phytochromes, as discussed above, and was involved in comprehensive genetic regulation [53,58]. We identified some genes associated with zeatin biosynthesis (18 DEGs) and phytohormone signal transduction (52 DEGs). The KEGG enrichments on these DEGs helped us uncover the interesting interaction between phytohormones and genes involving pathways of zeatin biosynthesis and phytohormone signal transduction (Figure 3C and Figure 4B,C). JA, ABA, and IAA, etc., were tightly associated with flower development, for instance, in regulating stamen development and anther dehiscence [21,57,58,59]. Our correlation-based networks highlighted DHZR, tZR, IAA, and ABA as the hub-connecting genes, suggesting their possible roles in regulating fertile/sterile ecotypes in quinoa flowers. However, more investigations need to be conducted to uncover the regulation mechanisms that lead to the sterile quinoa flowers.
In addition to addressing the hormone-related regulation in the fertility of quinoa, we explored the possible crosstalk between hormones and genes controlling flower development (Figure 5). For instance, AP1, AP3, AG, LFY, and SOC1 were tightly associated with the regulation of flower development [53,64,65]. The SOC1 gene expressed in the shoot apex activated the flower meristem identity gene LFY [66,67,68,69]. Subsequently, LFY initiated the development of flower organs, including sepals, petals, stamen, and carpel, by activating AP1, AP3, and AG [66,67,68,69]. In our study, the higher expressions of AP1 and AP3 were noticed in two sterile ecotypes at two developmental stages, and they were significantly correlated with zeatin biosynthesis. LFY was extremely expressed in Fa samples, showing contrary correlation patterns with hormones within zeatin biosynthesis, as compared with AP1 and AP3 (Figure 5). These results indicated that the genes related to flower development and some hormone within zeatin biosynthesis are possibly co-worked in regulating the fertile/sterile ecotype of quinoa flowers. However, the detailed mechanism remains unknown and needs to be investigated in a future study.

5. Conclusions

This work sheds new light on the molecular causes of male sterility in quinoa by finding important phytohormones, such as tZR, IPR, tZ, IAA, and ABA, and genes that are involved in zeatin production and hormone signaling pathways. The fact that the contents of tZR, IPR, and tZ were varied across fertile and sterile ecotypes and were significantly correlated with flower development genes, such as AP1 and FLS, suggests that there is a regulatory network that controls how flowers grow. These results provide a basis for breeding plans that aim to increase the fertility and stability of quinoa yields. We need to perform more studies to confirm the functional role of these putative genes and to broaden metabolic profiling throughout embryonic stages in order to fully understand how sterility works.

Supplementary Materials

The following supporting information can be downloaded at: https://www.mdpi.com/article/10.3390/agronomy15071694/s1, Figure S1: The number of genes enriched in zeatin biosynthesis (A and B) and plant hormone signal transduction (D and E) at 30 (A and D) and 10 (B and E) days before harvest; Table S1: Primers used in the study; Table S2: Comparisons of agromorphological phenotype among materials; Table S3: Quantification of phytohormones; Table S4: The summary of transcriptomic data in this study; Table S5: The KEGG analysis on DEGs and two hormone-related terms were highlighted.

Author Contributions

Conceptualization, S.X. and Z.W.; methodology, Q.H.; software, C.S.; validation, C.L. and H.L.; formal analysis, C.S.; investigation, Q.H., Y.X., F.C. and X.Z.; resources, S.X.; data curation, C.L., H.L., Z.L., Y.X., F.C. and X.Z.; writing—original draft preparation, C.S.; writing—review and editing, C.S., Q.H., C.L., H.L., Z.L., Y.X., F.C., X.Z., Z.W. and S.X.; visualization, C.S. and S.X.; supervision, Z.W. and S.X.; project administration, S.X.; funding acquisition, S.X. All authors have read and agreed to the published version of the manuscript.

Funding

This research was funded by the National Natural Science Foundation of China (grant number 32071786), and the Xiamen Science and Technology Project (grant numbers 3502Z20172015, 3502Z20194503, and 3502Z20211006-20210915).

Data Availability Statement

The original contributions presented in the study are publicly available. The RNA-seq data can be found in China National GeneBank DataBase (CNGBdb, https://db.cngb.org/data_resources/) under project No. CNP0005815.

Conflicts of Interest

The authors declare no conflicts of interest.

References

  1. Alandia, G.; Rodriguez, J.P.; Jacobsen, S.E.; Bazile, D.; Condori, B. Global expansion of quinoa and challenges for the andean region. Glob. Food Secur. 2020, 26, 100429. [Google Scholar] [CrossRef]
  2. Bhargava, A.; Shukla, S.; Ohri, D. Chenopodium quinoa—An indian perspective. Ind. Crops Prod. 2006, 23, 73–87. [Google Scholar] [CrossRef]
  3. Beloshapka, A.N.; Buff, P.R.; Fahey, G.C.; Swanson, K.S. Compositional analysis of whole grains, processed grains, grain co-products, and other carbohydrate sources with applicability to pet animal nutrition. Foods 2016, 5, 23. [Google Scholar] [CrossRef]
  4. Burrieza, H.P.; Rizzo, A.J.; Moura Vale, E.; Silveira, V.; Maldonado, S. Shotgun Proteomic analysis of quinoa seeds reveals novel lysine-rich seed storage globulins. Food Chem. 2019, 293, 299–306. [Google Scholar] [CrossRef]
  5. Wu, G.Y.; Morris, C.F.; Murphy, K.M. Evaluation of texture differences among varieties of cooked quinoa. J. Food Sci. 2014, 79, S2337–S2345. [Google Scholar] [CrossRef]
  6. Zevallos, V.F.; Herencia, I.L.; Chang, F.; Donnelly, S.; Ellis, J.H.; Ciclitira, P.J. Gastrointestinal effects of eating quinoa (Chenopodium quinoa Willd.) in celiac patients. Off. J. Am. Coll. Gastroenterol. ACG 2014, 109, 270. [Google Scholar] [CrossRef] [PubMed]
  7. Bazile, D.; Pulvento, C.; Verniau, A.; Al-Nusairi, M.S.; Ba, D.; Breidy, J.; Hassan, L.; Mohammed, M.I.; Mambetov, O.; Otambekova, M.; et al. Worldwide evaluations of quinoa: Preliminary results from post international year of quinoa FAO Projects in nine countries. Front. Plant Sci. 2016, 7, 850. [Google Scholar] [CrossRef]
  8. Murphy, K.M.; Bazile, D.; Kellogg, J.; Rahmanian, M. Development of a worldwide consortium on evolutionary participatory breeding in quinoa. Front. Plant Sci. 2016, 7, 608. [Google Scholar] [CrossRef]
  9. Ruiz, K.B.; Biondi, S.; Oses, R.; Acuña-Rodríguez, I.S.; Antognoni, F.; Martinez-Mosqueira, E.A.; Coulibaly, A.; Canahua-Murillo, A.; Pinto, M.; Zurita-Silva, A.; et al. Quinoa biodiversity and sustainability for food security under climate change. A review. Agron. Sustain. Dev. 2014, 34, 349–359. [Google Scholar] [CrossRef]
  10. Fuentes, F.F.; Bazile, D.; Bhargava, A.; Martínez, E.A. Implications of farmers’ seed exchanges for on-farm conservation of quinoa, as revealed by its genetic diversity in Chile. J. Agric. Sci. 2012, 150, 702–716. [Google Scholar] [CrossRef]
  11. Shen, Z.J.; Xu, S.X.; Huang, Q.Y.; Li, Z.Y.; Xu, Y.D.; Lin, C.S.; Huang, Y.J. TMT proteomics analysis of a pseudocereal crop, quinoa (Chenopodium Quinoa Willd.), during seed maturation. Front. Plant Sci. 2022, 13, 975073. [Google Scholar] [CrossRef] [PubMed]
  12. de Oliveira Lopes, C.; de Fátima Píccolo Barcelos, M.; de Goes Vieira, C.N.; de Abreu, W.C.; Ferreira, E.B.; Pereira, R.C.; de Angelis-Pereira, M.C. Effects of sprouted and fermented quinoa (Chenopodium quinoa) on glycemic index of diet and biochemical parameters of blood of wistar rats fed high carbohydrate diet. J. Food Sci. Technol. 2019, 56, 40–48. [Google Scholar] [CrossRef]
  13. Massawe, F.; Mayes, S.; Cheng, A. Crop Diversity: An unexploited treasure trove for food security. Trends Plant Sci. 2016, 21, 365–368. [Google Scholar] [CrossRef] [PubMed]
  14. Walters, H.; Carpenter-Boggs, L.; Desta, K.; Yan, L.; Matanguihan, J.; Murphy, K. Effect of irrigation, intercrop, and cultivar on agronomic and nutritional characteristics of quinoa. Agroecol. Sustain. Food Syst. 2016, 40, 783–803. [Google Scholar] [CrossRef]
  15. Risi, C.J.; Galwey, N.W.; Risi, C.J.; Galwey, N.W. The Chenopodium grains of the andes: Inca crops for modern agriculture. Adv. Appl. Biol. 1984, 10, 145–216. [Google Scholar]
  16. Ward, S.M.; Johnson, D.L. Cytoplasmic male sterility in quinoa. Euphytica 1993, 66, 217–223. [Google Scholar] [CrossRef]
  17. Escribano, J.; Cabanes, J.; Jiménez-Atiénzar, M.; Ibañez-Tremolada, M.; Gómez-Pando, L.R.; García-Carmona, F.; Gandía-Herrero, F. Characterization of betalains, saponins and antioxidant power in differently colored quinoa (Chenopodium quinoa) varieties. Food Chem. 2017, 234, 285–294. [Google Scholar] [CrossRef] [PubMed]
  18. Nie, H.S.; Cheng, C.; Kong, J.; Li, H.J.; Hua, J.P. Plant non-coding RNAs function in pollen development and male sterility. Front. Plant Sci. 2023, 14, 1109941. [Google Scholar] [CrossRef]
  19. Nie, H.S.; Wang, Y.M.; Su, Y.; Hua, J.P. Exploration of miRNAs and target genes of cytoplasmic male sterility line in cotton during flower bud development. Funct. Integr. Genomics. 2018, 18, 457–476. [Google Scholar] [CrossRef]
  20. Bohra, A.; Gandham, P.; Rathore, A.; Thakur, V.; Saxena, R.K.; Naik, S.J.S.; Varshney, R.K.; Singh, N.P. Identification of microRNAs and their gene targets in cytoplasmic male sterile and fertile maintainer lines of pigeonpea. Planta 2021, 253, 59. [Google Scholar] [CrossRef]
  21. Cucinotta, M.; Cavalleri, A.; Chandler, J.W.; Colombo, L. Auxin and flower development: A blossoming field. Cold Spring Harb. Perspect. Biol. 2021, 13, a039974. [Google Scholar] [CrossRef] [PubMed]
  22. Cai, B.D.; Zhu, J.X.; Gao, Q.; Luo, D.; Yuan, B.F.; Feng, Y.Q. Rapid and High-throughput determination of endogenous cytokinins in Oryza sativa by bare Fe3O4 nanoparticles-based magnetic solid-phase extraction. J. Chromatogr. A 2014, 1340, 146–150. [Google Scholar] [CrossRef] [PubMed]
  23. Xiao, H.M.; Cai, W.J.; Ye, T.T.; Ding, J.; Feng, Y.Q. Spatio-temporal profiling of abscisic acid, indoleacetic acid and jasmonic acid in single rice seed during seed germination. Anal. Chim. Acta 2018, 1031, 119–127. [Google Scholar] [CrossRef]
  24. Chen, S.F.; Zhou, Y.Q.; Chen, Y.R.; Gu, J. Fastp: An Ultra-Fast All-in-One FASTQ Preprocessor. Bioinformatics 2018, 34, i884–i890. [Google Scholar] [CrossRef]
  25. Kim, D.; Paggi, J.M.; Park, C.; Bennett, C.; Salzberg, S.L. Graph-based genome alignment and genotyping with HISAT2 and HISAT-Genotype. Nat. Biotechnol. 2019, 37, 907–915. [Google Scholar] [CrossRef]
  26. Jarvis, D.E.; Ho, Y.S.; Lightfoot, D.J.; Schmöckel, S.M.; Li, B.; Borm, T.J.A.; Ohyanagi, H.; Mineta, K.; Michell, C.T.; Saber, N.; et al. The genome of Chenopodium quinoa. Nature 2017, 542, 307–312. [Google Scholar] [CrossRef] [PubMed]
  27. Liao, Y.; Smyth, G.K.; Shi, W. featureCounts: An efficient general purpose program for assigning sequence reads to genomic features. Bioinformatics 2014, 30, 923–930. [Google Scholar] [CrossRef]
  28. Love, M.I.; Huber, W.; Anders, S. Moderated estimation of fold change and dispersion for RNA-Seq data with DESeq2. Genome Biol. 2014, 15, 550. [Google Scholar] [CrossRef]
  29. Kassambara, A.; Mundt, F. Factoextra: Extract and Visualize the Results of Multivariate Data Analyses. 13 May 2020. Available online: https://www.rdocumentation.org/packages/factoextra/versions/1.0.7 (accessed on 13 May 2024).
  30. Chen, C.J.; Wu, Y.; Li, J.W.; Wang, X.; Zeng, Z.H.; Xu, J.; Liu, Y.L.; Feng, J.T.; Chen, H.; He, Y.H.; et al. TBtools-II: A “One for All, All for One” Bioinformatics platform for biological big-data mining. Mol. Plant 2023, 16, 1733–1742. [Google Scholar] [CrossRef]
  31. Gu, Z.G.; Eils, R.; Schlesner, M. Complex heatmaps reveal patterns and correlations in multidimensional genomic data. Bioinformatics 2016, 32, 2847–2849. [Google Scholar] [CrossRef]
  32. Revelle, W. Psych: Procedures for Psychological, Psychometric, and Personality Research. 13 May 2022. Available online: https://www.rdocumentation.org/packages/psych/versions/2.4.1 (accessed on 13 May 2024).
  33. Shannon, P.; Markiel, A.; Ozier, O.; Baliga, N.S.; Wang, J.T.; Ramage, D.; Amin, N.D.; Schwikowski, B.; Ideker, T. Cytoscape: A software environment for integrated models of biomolecular interaction networks. Genome Res. 2003, 13, 2498–2504. [Google Scholar] [CrossRef] [PubMed]
  34. Cui, C.Q.; Liu, Y.Y.; Liu, Y.; Cui, X.H.; Sun, Z.Y.; Du, Z.W.; Wu, K.; Jiang, X.L.; Mei, H.X.; Zheng, Y.Z. Genome-wide association study of seed coat color in sesame (Sesamum indicum L.). PLoS ONE 2021, 16, e0251526. [Google Scholar] [CrossRef]
  35. Pereira, E.; Cadavez, V.; Barros, L.; Encina-Zelada, C.; Stojković, D.; Sokovic, M.; Calhelha, R.C.; Gonzales-Barron, U.; Ferreira, I.C.F.R. Chenopodium quinoa Willd. (Quinoa) grains: A good source of phenolic compounds. Food Res. Int. 2020, 137, 109574. [Google Scholar] [CrossRef]
  36. Qian, G.T.; Li, X.Y.; Zhang, H.; Zhang, H.L.; Zhou, J.W.; Ma, X.H.; Sun, W.; Yang, W.; He, R.K.; Wahab, A.; et al. Metabolomics analysis reveals the accumulation patterns of flavonoids and phenolic acids in quinoa (Chenopodium quinoa Willd.) grains of different colors. Food Chem. X 2023, 17, 100594. [Google Scholar] [CrossRef] [PubMed]
  37. Tang, Y.; Li, X.H.; Zhang, B.; Chen, P.X.; Liu, R.H.; Tsao, R. Characterisation of phenolics, betanins and antioxidant activities in seeds of three Chenopodium quinoa Willd. genotypes. Food Chem. 2015, 166, 380–388. [Google Scholar] [CrossRef] [PubMed]
  38. Calva-Estrada, S.J.; Jiménez-Fernández, M.; Lugo-Cervantes, E. Betalains and their applications in food: The current state of processing, stability and future opportunities in the industry. Food Chem. Mol. Sci. 2022, 4, 100089. [Google Scholar] [CrossRef] [PubMed]
  39. Calvi, P.; Terzo, S.; Amato, A. Betalains: Colours for human health. Nat. Prod. Res. 2023, 37, 1746–1765. [Google Scholar] [CrossRef]
  40. Timoneda, A.; Feng, T.; Sheehan, H.; Walker-Hale, N.; Pucker, B.; Lopez-Nieves, S.; Guo, R.; Brockington, S. The evolution of betalain biosynthesis in Caryophyllales. New Phytol. 2019, 224, 71–85. [Google Scholar] [CrossRef]
  41. Brockington, S.F.; Walker, R.H.; Glover, B.J.; Soltis, P.S.; Soltis, D.E. Complex pigment evolution in the Caryophyllales. New Phytol. 2011, 190, 854–864. [Google Scholar] [CrossRef]
  42. Feng, Y.; Yan, X.Z.; Guo, F.G.; Wang, S.Y.; Liu, Z.J.; Long, W.H. Identification, expression analysis of quinoa betalain biosynthesis genes and their role in seed germination and cold stress. Plant Signal. Behav. 2023, 18, e2250891. [Google Scholar] [CrossRef]
  43. Xu, S.X.; Huang, Q.Y.; Lin, C.S.; Lin, L.X.; Zhou, Q.; Lin, F.C.; He, E.M. Transcriptome comparison reveals candidate genes responsible for the betalain-/anthocyanidin-production in Bougainvilleas. Funct. Plant Biol. 2016, 43, 278–286. [Google Scholar] [CrossRef] [PubMed]
  44. Peterson, A.; Jacobsen, S.-E.; Bonifacio, A.; Murphy, K. A crossing method for quinoa. Sustainability 2015, 7, 3230–3243. [Google Scholar] [CrossRef]
  45. Zabaleta, E.; Mouras, A.; Hernould, M.; Suharsono, N.; Araya, A. Transgenic male-sterile plant induced by an unedited Atp9 gene is restored to fertility by inhibiting its expression with antisense RNA. Proc. Natl. Acad. Sci. U.S.A. 1996, 93, 11259–11263. [Google Scholar] [CrossRef]
  46. Chen, L.T.; Liu, Y.G. Male sterility and fertility restoration in crops. Annu. Rev. Plant Biol. 2014, 65, 579–606. [Google Scholar] [CrossRef]
  47. Kaul, M.L.H. Male Sterility in Higher Plants; Springer: Berlin, Heidelberg, 1988; Volume 10. [Google Scholar]
  48. Visarada, K.B.R.S.; Meena, K. Induction of male sterility: A boon for plant breeding. Int. J. Curr. Microbiol. Appl. Sci. 2021, 10, 1084–1101. [Google Scholar] [CrossRef]
  49. Zurita-Silva, A.; Fuentes, F.; Zamora, P.; Jacobsen, S.E.; Schwember, A.R. Breeding quinoa (Chenopodium quinoa Willd.): Potential and perspectives. Mol. Breed. 2014, 34, 13–30. [Google Scholar] [CrossRef]
  50. Chen, X.Y.; Li, Y.F.; Sun, H.Y.; An, X.L.; Tang, J.H. Molecular mechanisms of male sterility in maize. Plant Mol. Biol. Report. 2024, 42, 483–491. [Google Scholar] [CrossRef]
  51. Farinati, S.; Draga, S.; Betto, A.; Palumbo, F.; Vannozzi, A.; Lucchin, M.; Barcaccia, G. Current insights and advances into plant male sterility: New precision breeding technology based on genome editing applications. Front. Plant Sci. 2023, 14, 1223861. [Google Scholar] [CrossRef]
  52. Farooq, A.; Khan, U.M.; Khan, M.A.; Ali, Z.; Maqbool, R.; Sajjad, M. Male sterility systems and their applications in hybrid wheat breeding. Cereal Res. Commun. 2024, 52, 25–37. [Google Scholar] [CrossRef]
  53. Thomson, B.; Wellmer, F. Molecular regulation of flower development. In Current Topics in Developmental Biology; Academic Press: Cambridge, MA, USA, 2019; Volume 131, pp. 185–210. [Google Scholar]
  54. Chandler, J.W. The hormonal regulation of flower development. J. Plant Growth Regul. 2011, 30, 242–254. [Google Scholar] [CrossRef]
  55. Liu, X.T.; Wu, J.; Ji, F.F.; Cao, X.Q.; Zhao, Q.C.; Cheng, C.X.; Ma, N.; Zhou, X.F.; Zhang, Z. Transcriptomic profiling of rose flower under treatment of various phytohormones and plant growth regulators. Sci. Data 2022, 9, 669. [Google Scholar] [CrossRef]
  56. Malik, N.U.A.; Fajer, O.; Amin, L.B.; Khalid, A.R.; Khan, N.; Bhatti, M.F.; Munir, F.; Haider, G.; Amir, R.; Gul, A. Phytohormones, plant growth and development. In Phytohormones and Stress Responsive Secondary Metabolites; Ozturk, M., Bhat, R.A., Ashraf, M., Tonelli, F.M.P., Unal, B.T., Dar, G.H., Eds.; Academic Press: Cambridge, MA, USA, 2023; pp. 175–186. [Google Scholar]
  57. Song, S.S.; Qi, T.C.; Huang, H.; Xie, D.X. Regulation of stamen development by coordinated actions of jasmonate, auxin, and gibberellin in arabidopsis. Mol. Plant 2013, 6, 1065–1073. [Google Scholar] [CrossRef]
  58. Huang, H.; Chen, Y.; Wang, S.; Qi, T.; Song, S. Jasmonate action and crosstalk in flower development and fertility. J. Exp. Bot. 2023, 74, 1186–1197. [Google Scholar] [CrossRef]
  59. Sanders, P.M.; Lee, P.Y.; Biesgen, C.; Boone, J.D.; Beals, T.P.; Weiler, E.W.; Goldberg, R.B. The arabidopsis DELAYED DEHISCENCE1 gene encodes an enzyme in the jasmonic acid synthesis pathway. Plant Cell 2000, 12, 1041–1061. [Google Scholar] [CrossRef]
  60. Minato, N.; Himeno, M.; Hoshi, A.; Maejima, K.S.K.; Komatsu, K.; Takebayashi, Y.; Kasahara, H.; Yusa, A.; Yamaji, Y.; Oshima, K.; et al. The phytoplasmal virulence factor tengu causes plant sterility by downregulating of the jasmonic acid and auxin pathways. Sci. Rep. 2014, 4, 7399. [Google Scholar] [CrossRef] [PubMed]
  61. Żur, I.; Dubas, E.; Krzewska, M.; Waligórski, P.; Dziurka, M.; Janowiak, F. Hormonal requirements for effective induction of microspore embryogenesis in triticale (× Triticosecale Wittm.) anther cultures. Plant Cell Rep. 2015, 34, 47–62. [Google Scholar] [CrossRef] [PubMed]
  62. Bhatia, N.; Heisler, M.G. Self-Organizing periodicity in development: Organ positioning in plants. Development 2018, 145, dev149336. [Google Scholar] [CrossRef] [PubMed]
  63. Heisler, M.G.; Ohno, C.; Das, P.; Sieber, P.; Reddy, G.V.; Long, J.A.; Meyerowitz, E.M. Patterns of auxin transport and gene expression during primordium development revealed by live imaging of the arabidopsis inflorescence meristem. Curr. Biol. 2005, 15, 1899–1911. [Google Scholar] [CrossRef]
  64. Li, X.; Kuang, Y.; Ye, Y.; Chen, Z.; Zhang, M. Diverse function of the PISTILLATA, APETALA 3, and AGAMOUS-like MADS-Box genes involved in the floral development in Alpinia hainanensis (Zingiberaceae). Gene 2022, 839, 146732. [Google Scholar] [CrossRef]
  65. Wellmer, F.; Riechmann, J.L. Gene networks controlling the initiation of flower development. Trends Genet. 2010, 26, 519–527. [Google Scholar] [CrossRef]
  66. Lee, J.; Lee, I. Regulation and function of SOC1, a flowering pathway integrator. J. Exp. Bot. 2010, 61, 2247–2254. [Google Scholar] [CrossRef] [PubMed]
  67. Liu, C.; Xi, W.; Shen, L.; Tan, C.; Yu, H. Regulation of floral patterning by flowering time genes. Dev. Cell 2009, 16, 711–722. [Google Scholar] [CrossRef] [PubMed]
  68. Ng, M.; Yanofsky, M.F. Activation of the Arabidopsis B class homeotic genes by APETALA1. Plant Cell 2001, 13, 739–753. [Google Scholar] [CrossRef] [PubMed]
  69. Winter, C.M.; Austin, R.S.; Blanvillain-Baufumé, S.; Reback, M.A.; Monniaux, M.; Wu, M.-F.; Sang, Y.; Yamaguchi, A.; Yamaguchi, N.; Parker, J.E.; et al. LEAFY target genes reveal floral regulatory logic, Cis motifs, and a link to biotic stimulus response. Dev. Cell 2011, 20, 430–443. [Google Scholar] [CrossRef]
Figure 1. The photograph of the normal parent (A) and offsprings with different fertilities (BJ). (BD) The normal fertile ecotype. (EG) The sterile ecotype S1. (HJ) The sterile ecotype S3. Overview of the parental (A) and inflorescences of offsprings (B,E,H). The flowers at earlier (C,F,I) and later (D,G,J) developmental stages of three ecotypes. The white bar represents 1 mm.
Agronomy 15 01694 g001
Figure 2. The summary of metabolite profiling on phytohormones in different quinoa flowers. (A) Principal component analysis on detected phytohormones. (B) The relative contents of detected phytohormones in different quinoa flowers. The number of differentially accumulated hormones from the comparisons of different ecotypes at the early (C) and later stages (D). The up and down indicate the content in the latter ecotype were higher and lower than in former ecotypes, respectively, in each comparison.
Agronomy 15 01694 g002
Figure 3. Gene analysis and KEGG enrichment. PCA score plot on gene expression (A). Counts of DEG in different comparisons between normal and unstable fertility types (B). The UpSet graph shows the number of KEGG-enriched terms on DEGs between normal and unstable fertility types and the terms that existed between different comparisons (C).
Agronomy 15 01694 g003
Figure 4. The contents of phytohormones related to zeatin biosynthesis and plant hormone signal transduction (A) and their correlations with DEGs: (B) zeatin biosynthesis and (C) plant hormone signal transduction. The insignificant correlations (p > 0.05) were filtered out. * and ** represent significant differences at p < 0.05 and p < 0.01, respectively.
Agronomy 15 01694 g004
Figure 5. The expressions of 13 selected genes related to flower development. (A) The rectangle heatmap shows correlations between the levels of hormones and 13 selected genes from signal transduction and zeatin biosynthesis. The circle heatmap (right side) shows the correlations between the RT-PCR values and FPKMs of 13 selected genes. * represents significant correlation at p < 0.05. (B) The RT-PCR values of 10 genes, showing a positive trend with their FPKMs, in different fertile ecotypes and developmental stages.
Agronomy 15 01694 g005
Disclaimer/Publisher’s Note: The statements, opinions and data contained in all publications are solely those of the individual author(s) and contributor(s) and not of MDPI and/or the editor(s). MDPI and/or the editor(s) disclaim responsibility for any injury to people or property resulting from any ideas, methods, instructions or products referred to in the content.

