Article

Variety-Dependent Yield and Physiological Responses to Combined Inorganic and Organic Sources of Nitrogen in Wheat

1
Key Laboratory of Plant Nutrition and the Agri-Environment in Northwest China, Ministry of Agriculture, Collage of Resources and Environment, Northwest A&F University, Yangling 712100, China
2
Beijing Changping Soil Quality National Observation and Research Station, Changping, Beijing 102206, China
*
Author to whom correspondence should be addressed.
These authors contributed equally to this work.
Agronomy 2025, 15(7), 1679; https://doi.org/10.3390/agronomy15071679
Submission received: 30 May 2025 / Revised: 3 July 2025 / Accepted: 4 July 2025 / Published: 10 July 2025
(This article belongs to the Section Soil and Plant Nutrition)

Abstract

Integrated application of chemical fertilizers with organic manure might improve crop yields and N-use efficiency (NUE, grain yield per unit N uptake), but the underlying physiological mechanisms are unclear. In this study, we aimed to examine the effects of combined inorganic and organic fertilizers on wheat biomass allocation, root growth, water-soluble carbohydrates (WSCs) translocation, leaf senescence, N uptake, and their relationship with yield and NUE. We established a 2-year factorial field experiment with five nutrient treatments with ratios of inorganic: organic fertilizers from 0 to 1, and three varieties—two new: Weilong169 and Zhongmai578; and one reference: Xiaoyan22. The yield ranged from 3469 to 8095 kg ha−1, and it generally declined in response to a higher proportion of organic fertilizer. The NUE increased when there was a higher proportion of organic fertilizer. Weilong169 exhibited higher NUE than Zhongmai578, and both new cultivars outperformed the reference variety in the N harvest index. The yield correlated with leaf senescence traits and harvest index, and NUE was associated with WSC translocation and N uptake. The combination of fertilizers with a low portion of organic maintained yield and improved NUE; Weilong169 had the highest yield, NUE, and N harvest index. A low portion of organic manure substitution for chemical fertilizer suited all varieties. A new variety with a higher yield, N harvest index, and NUE highlights the importance of N traits in breeding programs.

1. Introduction

Wheat (Triticum aestivum L.) ranks second globally in both crop production for human consumption and use of N fertilizer, representing approximately 15% of global fertilizer usage [1]. Better agronomy, improved varieties, and their synergy drive yield improvement in farmers’ fields [2]. In China, variety contributed 38% to the increase in wheat grain yield during 1981–2015 [3]. Many studies have investigated the interaction between genetic gain in wheat and N application rates [4]. Global comparisons showed that the absolute (kg ha−1 y−1) and relative (% y−1) genetic gain in yield of wheat has been larger in higher-yielding environments, with higher supply of water and N [4,5].
Nitrogen supply is critical to crop yield and has to be managed to avoid both over-fertilization and the release of reactive N into the environment, as well as under-fertilization, which leads to soil mining and degradation [6,7]. The chemical N rate used for wheat is 278 kg ha−1 in Northern China and 213 kg ha−1 in the Yangtze river area, with a recovery efficiency of 18% and 27%, respectively [8]; this is much lower than in Europe [9]. On the other hand, China has become the world’s largest producer of livestock and poultry [10], generating around 4.6 billion tons of manure each year [11]. However, up to 78% of the N in this manure is lost to the environment [12]. Recycling manure by applying it to cropland as a source of N could reduce inorganic N application and environmental pollution. Manure application can also assist with maintaining soil nutrient balance, soil structure, and moisture-holding capacity [13,14,15]. However, the nutrients from manure that are gradually released during the process of mineralization may not be adequate during critical growth periods [16] and may require complementation with inorganic fertilizers. Substituting 25% of inorganic N with cow manure increased crop yields compared to chemical fertilizers alone in a wheat–rice rotation system in a silt loam soil in Anhui Province, China [17]. Yan et al. [18] found that 50% replacement of inorganic N with cattle manure compost resulted in a similar winter wheat yield to mineral fertilizers alone in a silty loam soil in the North China Plain. In a winter wheat–summer maize double-cropping system, a 7-year experiment demonstrated that substituting 50% of inorganic fertilizer with dairy manure resulted in a yield equivalent to that obtained when applying chemical fertilizer alone in a silty clay loam in Northwest China [19], but substituting 25% of the N from cow manure increased crop yields compared to NPK in a loam soil [20], and substituting 45% of inorganic fertilizer with sheep manure improved crop yields compared to chemical fertilizer in a sandy loam soil [21] in the North China Plain. These results reflect that the substitution ratio of inorganic fertilizer to organic manure might vary depending on the soil, manure type, climate, and other factors that influence the mineralization of manure.
Stay-green traits after anthesis may have beneficial effects on crop yield [22]. A sufficient supply of N during grain filling could support post-anthesis N uptake and reduce pre-anthesis N remobilization [23]. This effect is partially mediated by the maintenance of chlorophyll and leaf functionality [23,24]. Post-anthesis N uptake and N remobilization in both leaves and stems may correlate negatively, particularly under low N conditions [25]. It is documented that combining 70% inorganic and 30% organic fertilizers prolonged leaf greenness, thereby improving leaf photosynthetic capacity in rice grown in Guangxi, China [26]. In addition, WSC is a source of carbohydrate for grains [27]. A limited N supply is associated with higher WSC [28]. A combination of inorganic and organic N would impact N supply during the crop-growing season, which may affect WSC accumulation and translocation. Both stay-green and WSC traits also depend on the varieties employed [29]. Modern Australian wheat varieties maintained greener leaves until reaching maturity and accumulated higher amounts of WSC compared with older varieties [22].
Previous studies on combinations of inorganic and organic fertilizers have mainly focused on crop yield, nutrient utilization efficiency, environmental effects, and soil properties [20,30,31,32,33]. There is limited information on the impact of combined application of inorganic and organic fertilizer on the physiology of wheat and their relations to yield. The objective of the present study is to examine winter wheat’s responses to a combination of inorganic and organic fertilizer. Our focus is on the following: (1) yield and yield components; (2) WSC translocation (3) leaf senescence; and (4) NUE. To address these questions, we conducted a 2-year field experiment using different ratios of organic fertilizer to replace inorganic fertilizer in winter wheat varieties. We hypothesized that different substitution ratios of organic fertilizer for inorganic fertilizers would impact soil N availability, thereby modifying leaf traits, yield, and NUE.

2. Materials and Methods

2.1. Experimental Site

The field experiment was conducted in Yangling, on the Guanzhong Plain, near the southern edge of the Loess Plateau (34°17′51″ N, 108°00′48″ E; 525 m above sea level) during two seasons (2020–2022) (Figure S1). The experimental site has a warm temperate continental monsoon climate, with mean annual precipitation of 581 mm and mean annual temperature of 13 °C from 1957 to 2013. Seasonal precipitation and mean air temperature were 301 mm and 10.8 °C in 2020–2021 and 315 mm and 10.9 °C in 2021–2022. The monthly climatic conditions of the experimental site during the wheat growing season and the long-term period are shown in Table S1.
An ongoing fertilizer experiment established in October 2014 under a winter wheat-summer maize double cropping containing different organic manure substitution ratios for inorganic fertilizers at the cropping system level (Table S2), which have modified soil properties (Table S3), provided the background for this study. Total nitrogen was determined using the Kjeldahl method, organic matter using the Walkley–Black method, available phosphorus using the Olsen method, and available potassium using ammonium acetate extraction. Soil pH was measured in a 1:1 soil-to-water suspension. The soil used in the experiment was classified as having a texture of 24.7% sand, 43.7% silt, and 31.6% clay.
The current experiment was arranged in a split-plot design with three replications; the main plot was allocated to the original fertilizer treatment (Table S2) and the sub-plots to varieties. The original fertilizer treatments applied were: (1) 100% of inorganic N, P and K (NPK), (2) 75% NPK + 25% manure (25% M), (3) 50% NPK + 50% manure (50% M), (4) 25% NPK + 75% manure (75% M), and (5) 100% manure (100% M). Manure input was based on its N content. Three varieties were compared: Zhongmai578 released in 2019, Weilong169 released in 2018, and Xiaoyan22 released in 1998. Zhongmai578 flowers approximately 3 days earlier than Weilong169 and Xiaoyan22. The newer varieties, Zhongmai578 (ca. 80 cm) and Weilong169 (ca. 70 cm), are shorter than the old variety (ca. 88 cm). All three varieties differed in potential yield, with Zhongmai578 having, on average, the highest potential yield (12.62 t/ha), followed by Weilong169 (8.78 t/ha) and Xiaoyan22 (7.80 t/ha). The protein content of the three varieties was relatively similar, generally around 15%.
Urea (46% N), calcium superphosphate (16% P2O5), potassium sulfate (50% K2O), and dairy manure were applied as nitrogen, phosphorus, potassium, and manure sources. The chemical composition of the dairy manure was as follows: 17% C, 1.89% N, 1.25% P2O5, and 0.59% K2O in 2020–2021; and 24% C, 1.68% N, 1.05% P2O5, and 1.10% K2O in 2021–2022. All manure and inorganic P and K fertilizers for the double cropping system, and mineral nitrogen for winter wheat were broadcast on the soil surface, then incorporated into soil by rotary tillage to approximately 15–20 cm depth before wheat sowing; detailed quantities are in Table S3. The plot size was 30 m2 with a row spacing of 20 cm. The crops were sown on 10 October 2020, and 18 October 2021. The seeding rate was 417 seeds m2 for the two new varieties and 375 seeds m2 for the old one (based on breeder recommendation). Fungicides, herbicides, and pesticides were applied to reduce the impact of diseases, weeds, and pests. Irrigation (~90 mm) was applied once at tillering in February 2021, and there was no irrigation in the second season because of relatively high stored soil water and seasonal precipitation.

2.2. Sampling and Measurements

Phenology was periodically recorded using the scale detailed by Zadoks et al. [34]. Shoot samples were collected using a quadrat of 50 × 20 cm, with one sample taken per replicate, at anthesis and maturity. Shoot biomass was separated into leaf, stem, and spike components at anthesis. At maturity, it was partitioned into leaf, stem, spike, and grain. Samples were oven-dried to constant weight at 75 °C and weighed, then milled with a grinder and passed through a 200-mesh sieve for water-soluble carbohydrate and N content analysis.
Water-soluble carbohydrate (WSC) was measured using the anthrone colorimetric method in stem and spike at anthesis and maturity [35]. Nitrogen concentration was determined by Kjeldahl digestion method. Nitrogen uptake was calculated by multiplying the N concentration by dry matter at anthesis and maturity.
At maturity, a 1–2 m2 area was harvested for each replicate to determine grain yield and yield components. Ten plants were randomly selected from each sample and threshed by hand, and the number of grains was counted to determine the grain number per spike. Grain weight was measured in a sample of 1000 grains. The spike number was determined at grain filling (GS75). Harvest index was calculated as the ratio of grain yield to shoot biomass at maturity.
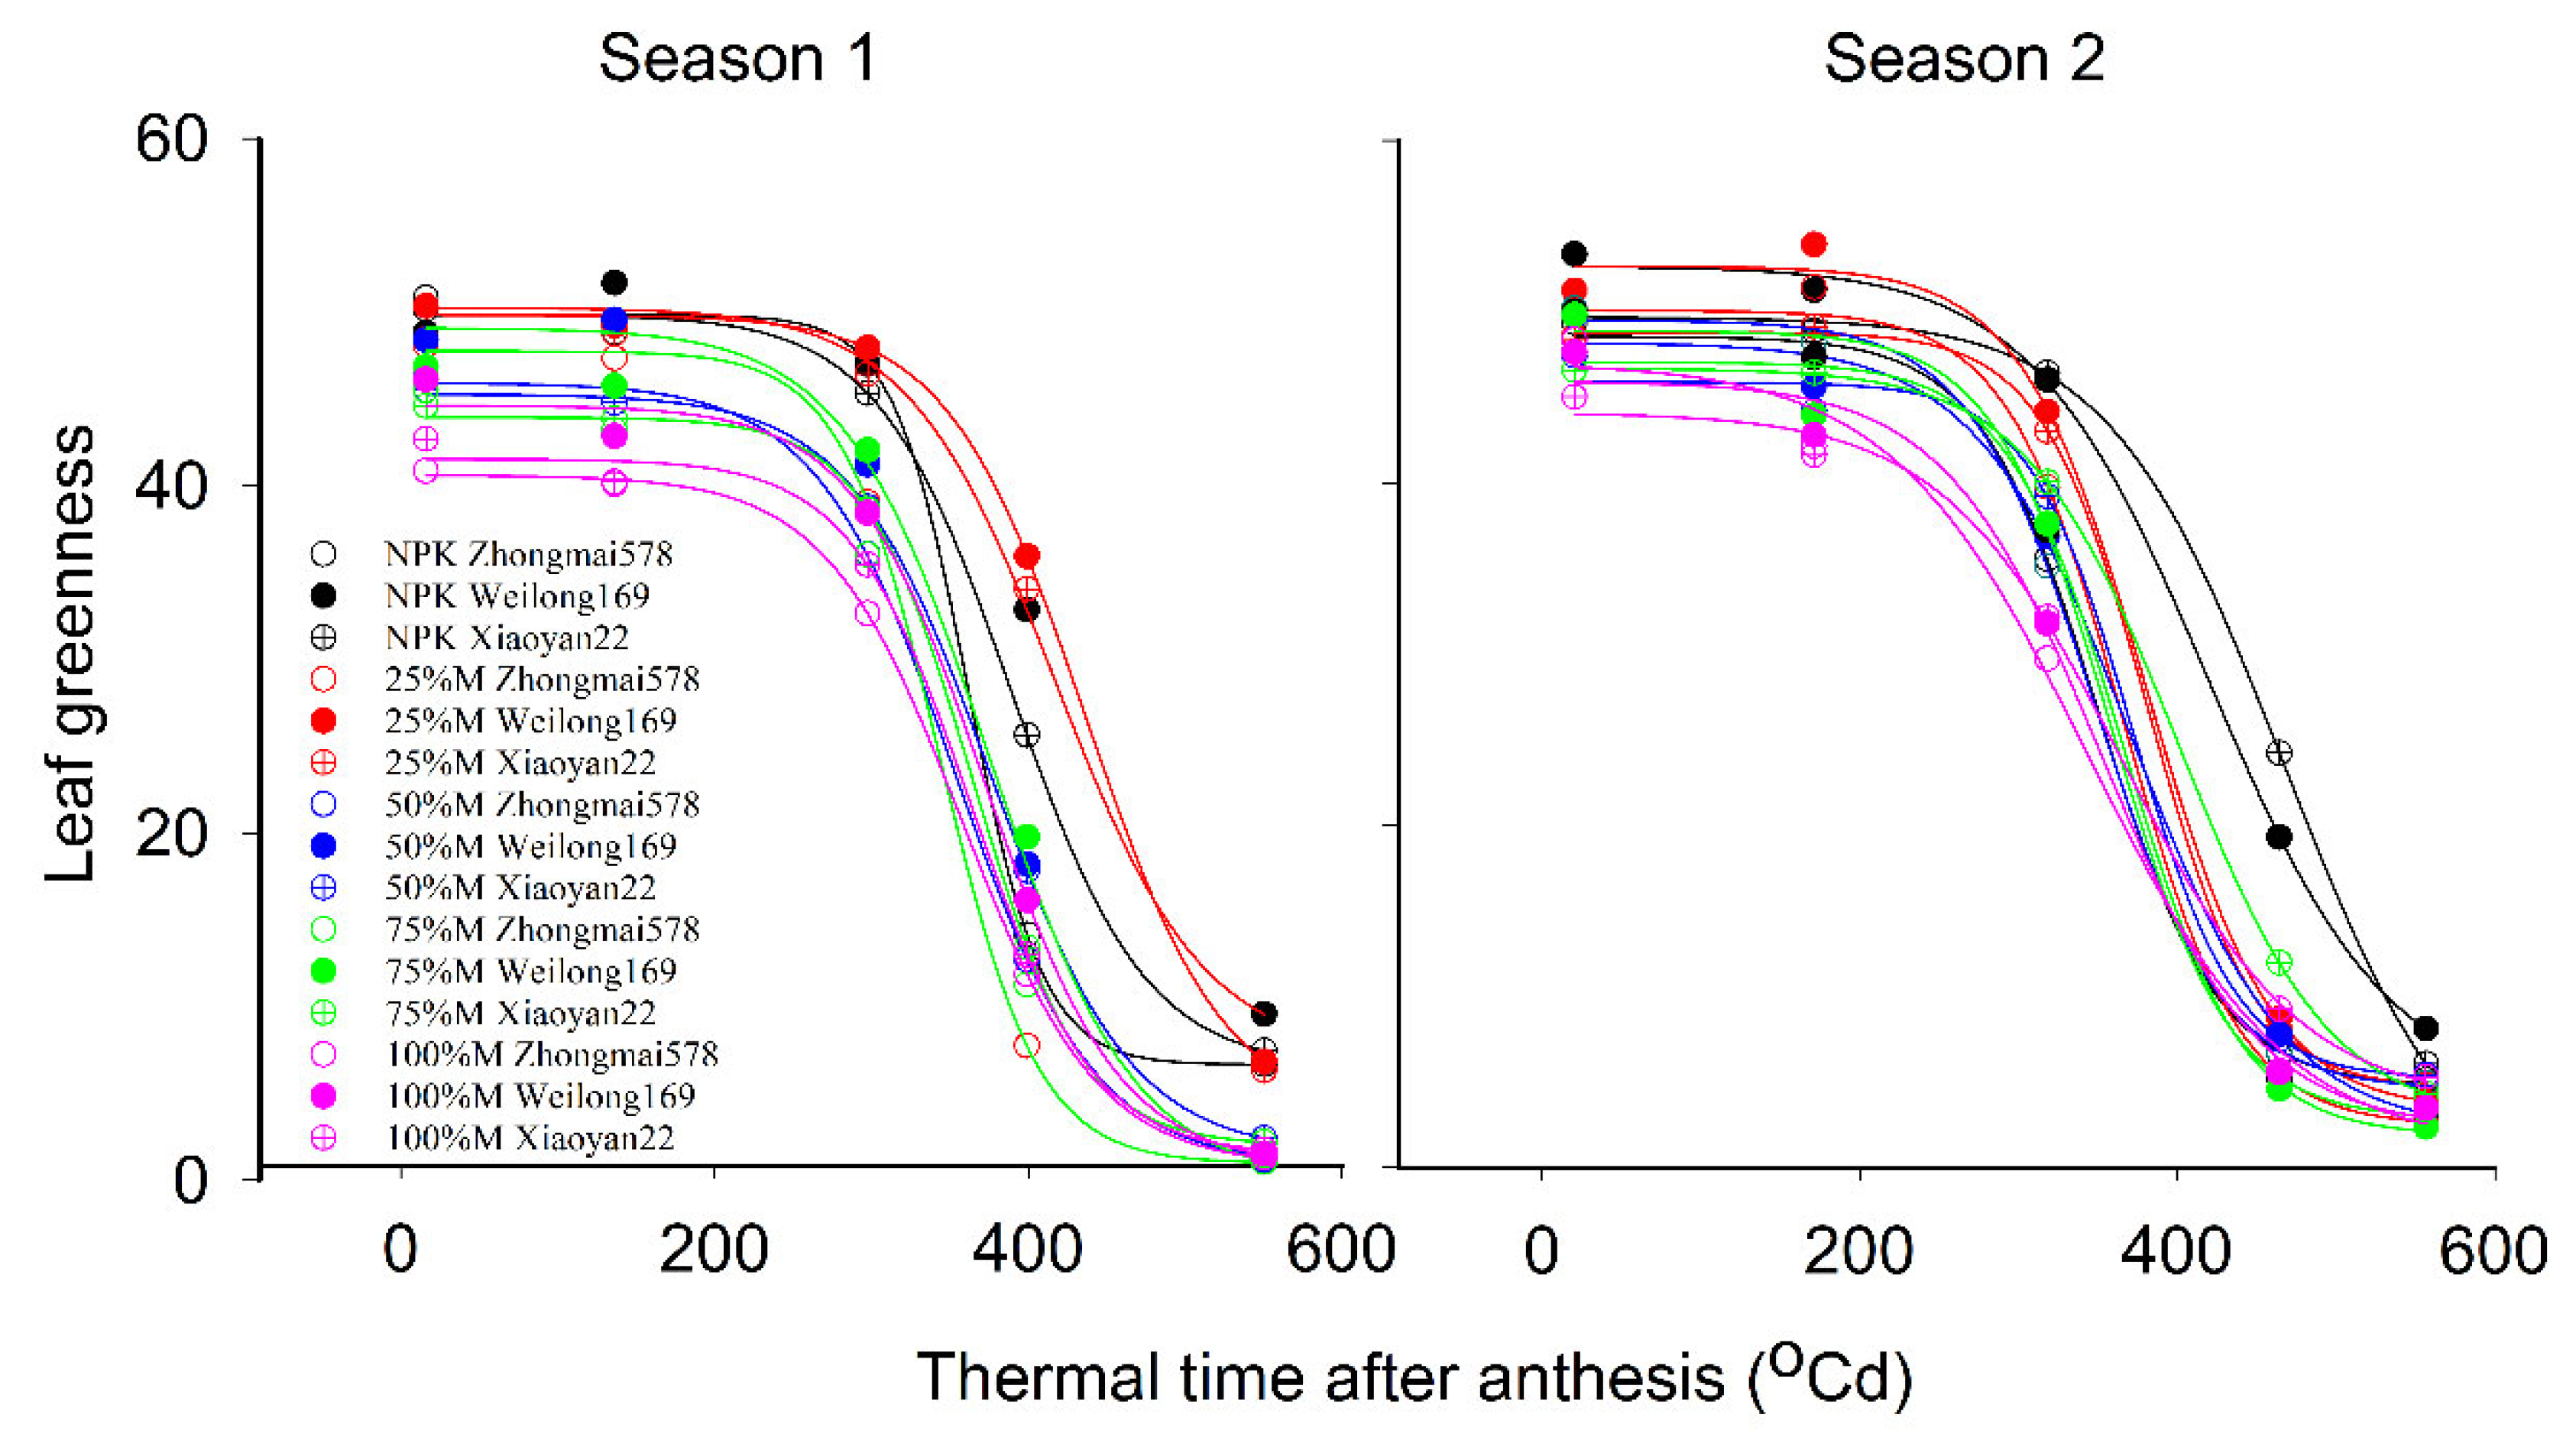
Leaf greenness (SPAD) was measured using a SPAD-502 chlorophyll meter (Model 502, Konica Minolta, Plainfield, IL, USA) at the center of the flag leaf every 5–7 days after anthesis. For each replicate, ten leaves were measured. The SPAD values have been widely used as a non-destructive indicator of chlorophyll content and leaf senescence in cereals, as leaf greenness closely reflects chlorophyll concentration [36,37]. Since chlorophyll degradation is a key physiological feature of senescence, SPAD readings were used in this study to monitor its progression after anthesis.
Roots were sampled at anthesis with an auger (8 cm diameter, 10 cm length) in three 20 cm sections down to 60 cm soil depth. Soil columns were soaked in a sodium hexametaphosphate solution and washed in running water to reveal the roots at each depth. Root length was measured using WinRHIZO software version v2013e (Regent Instruments, Quebec City, QC, Canada), and the root length density (RLD) was determined as the ratio of root length to soil volume [36].

2.3. Calculations and Statistical Analyses

For the estimation of the meteorological conditions, we used the hydrothermal coefficient (HTC), which is established as the ratio of the sum of rainfall during the period with average daily air temperatures above 10 °C to the sum of temperatures during the same period, reduced by 10 times [37].
Allometric relationships at anthesis and maturity were calculated for stem, leaf, and spike using log–log linear regression [38]:
log   Y = log   α + β   log   X
where X is the dry weight of the total shoot biomass minus the dry weight of the plant organ, Y is the dry weight of the plant organ, log α is the intercept coefficient, and β is the allometric exponent.
The SPAD data were fitted to the cumulative thermal time (x) following anthesis using a sigmoid function [39]:
S P A D = S P A D m i n + S P A D d i f 1 + e ( x x 50 r a t e
where SPADmin is the final SPAD, SPADdif is SPADmax − SPADmin, SPADmax is maximum leaf greenness, x50 is the thermal time from anthesis to 50% senescence, and rate is the rate of flag leaf senescence. From the fit of the SPAD curve, the area under the curve was calculated using AREA.XFM transform.
The WSC content (kg ha−1) was calculated as the product of dry weight and WSC concentration; WSC translocation amount (kg ha−1) is the difference in WSC content (kg ha−1) between anthesis and maturity. The WSC translocation ratio (%) is the ratio of WSC translocation amount to WSC content at anthesis [40]. Similarly, N translocation (kg ha−1) and N translocation efficiency (%) were calculated. Nitrogen utilization efficiency (NutE) is defined as grain yield per unit of shoot N uptake at maturity [41]. Nitrogen harvest index (NHI) is defined as the ratio of grain N uptake per unit aboveground N uptake at maturity [42]. Partial factor productivity (PFP) is defined as the ratio of grain yield to the amount of N fertilizer applied.
ANOVA was used to assess the response of crop traits to fertilizer treatments, varieties, seasons and their interactions. Comparisons among fertilizer treatments, varieties, and seasons were based on Duncan’s multiple range test at p < 0.05. Statistical analysis was conducted using SAS 9.00 software (SAS Institute Inc., Cary, NC, USA). Correlation matrices were generated using XLSTAT software 2019.2.2 (Addinsoft, Boston, MA, USA).

3. Results

3.1. Yield and Yield Components

Yield ranged from 3469 to 8095 kg ha−1 and varied with fertilization, variety, and the interactions of variety by season, variety by fertilization, and the three-way interaction between variety, fertilization, and season (Table 1, Figure 1). Compared to NPK, increasing the proportion of manure substitution gradually decreased the grain yield of Weilong169 in season 1, whereas in season 2, NPK and 25% M treatments produced similar yields for Weilong169 and Xiaoyan22, but Zhongmai578 showed lower grain yield.
Biomass ranged between 10,778 and 16,290 kg ha−1 and varied with fertilization, variety, and interactions of season by fertilization, variety by fertilization, and the three-way interaction between variety, fertilization, and season (Figure 1, Table 1). Compared to 100% M, NPK and manure substitutions up to 50% increased the biomass of all varieties in season 1, whereas NPK and manure substitutions up to 75% enhanced the biomass of all varieties in season 2.
The harvest index ranged from 0.3 to 0.5 and varied with all three sources of variation: season, fertilization, variety, and interactions of season by fertilization (Figure 1, Table 1). Compared to NPK under Weilong169, 50% M and 100% M decreased the harvest index in season 1, but only 75% M decreased the harvest index compared to NPK in season 2.
The yield components, grain number per square meter and thousand grain weight, varied with season, fertilization, and variety (Figure 1, Table 1). Compared to NPK under Weilong169, increasing the proportion of manure substitution gradually decreased the grain number in season 1, but in season 2, only the 100% M treatment decreased the grain number. Zhongmai578 showed higher grain weight under all fertilization regimes in both seasons.

3.2. Allometric Coefficients

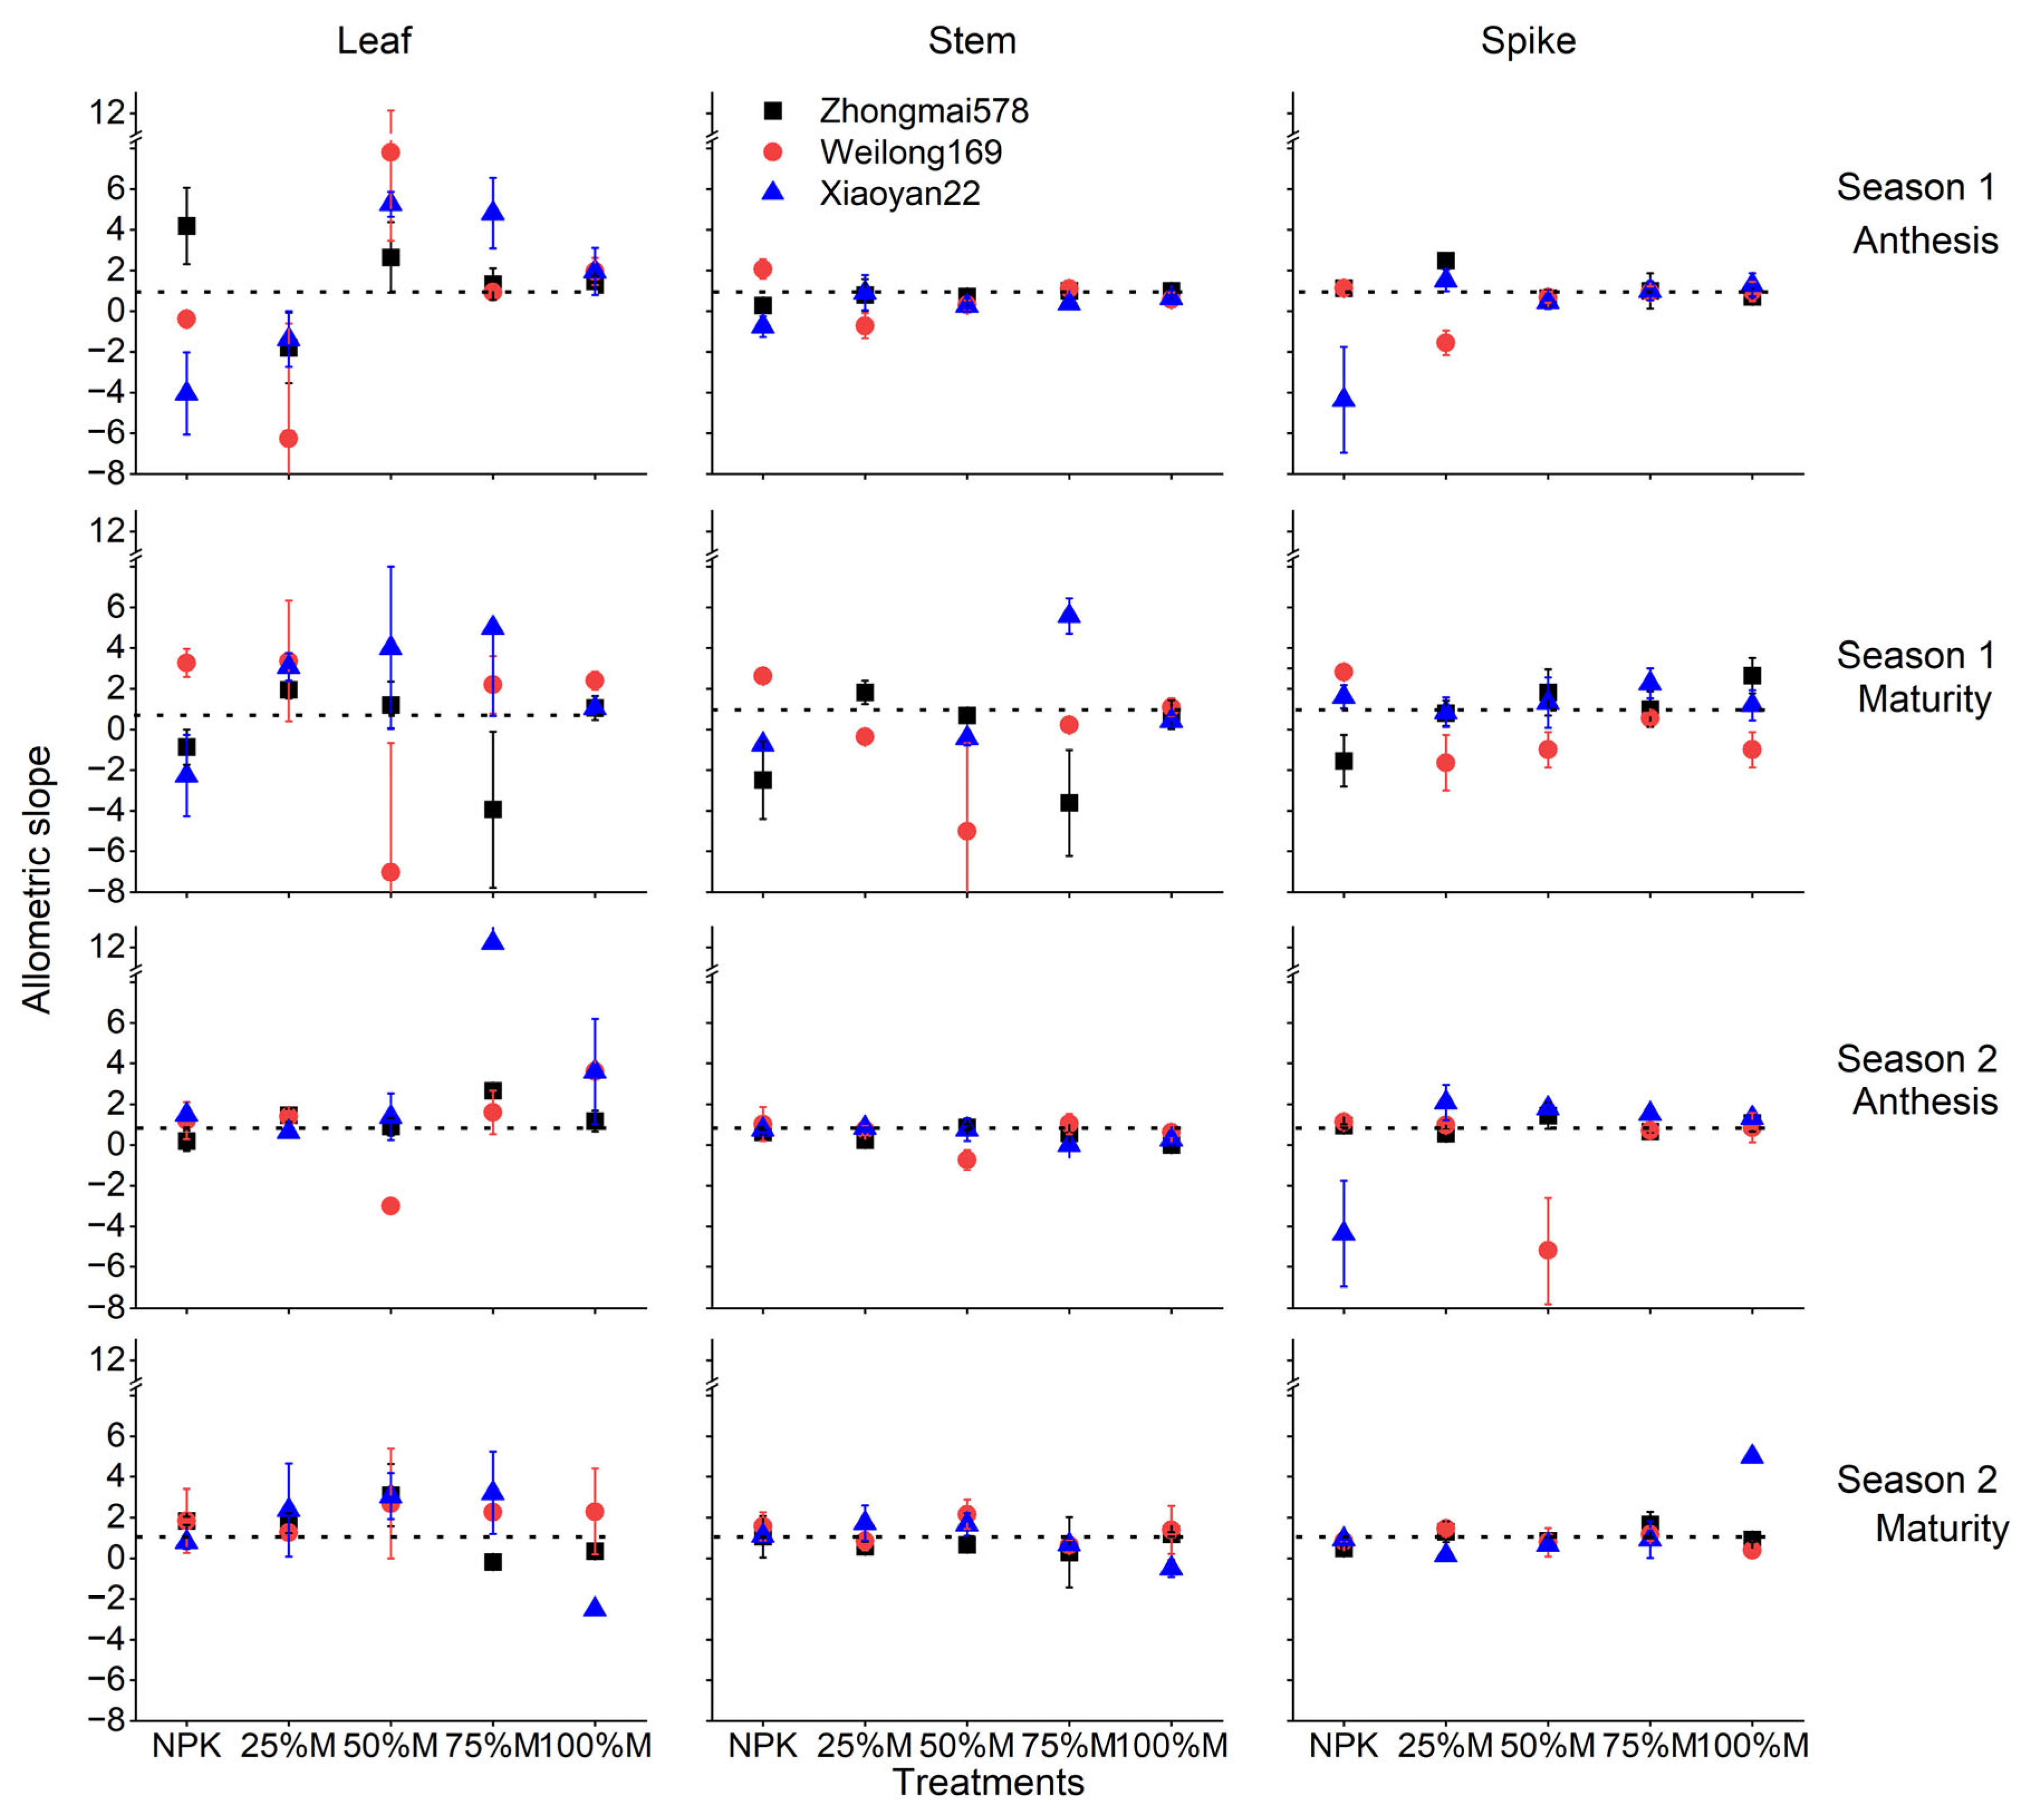
In the first season, the allometric slope for leaf versus shoot biomass varied compared with slopes for stem or spike versus shoot biomass at both anthesis and maturity (Figure 2). Generally, fertilization regimes presented similar slopes except that 25% M gave a lower slope for leaf versus shoot biomass than the other manure treatments at anthesis. Varieties also showed similar slopes under all fertilization treatments except that Weilong169 presented higher slopes for leaf and stem compared to the other two varieties under NPK and for spike under 25% M at both stages.
In the second season, fertilization had no effects on the allometric slopes for different organs at both stages (Figure 2). Varieties also yielded similar slopes for leaf, stem and spike versus shoot biomass at both stages, except that Weilong169 presented lower slopes for all organs at anthesis under 50% M.

3.3. Water-Soluble Carbohydrates

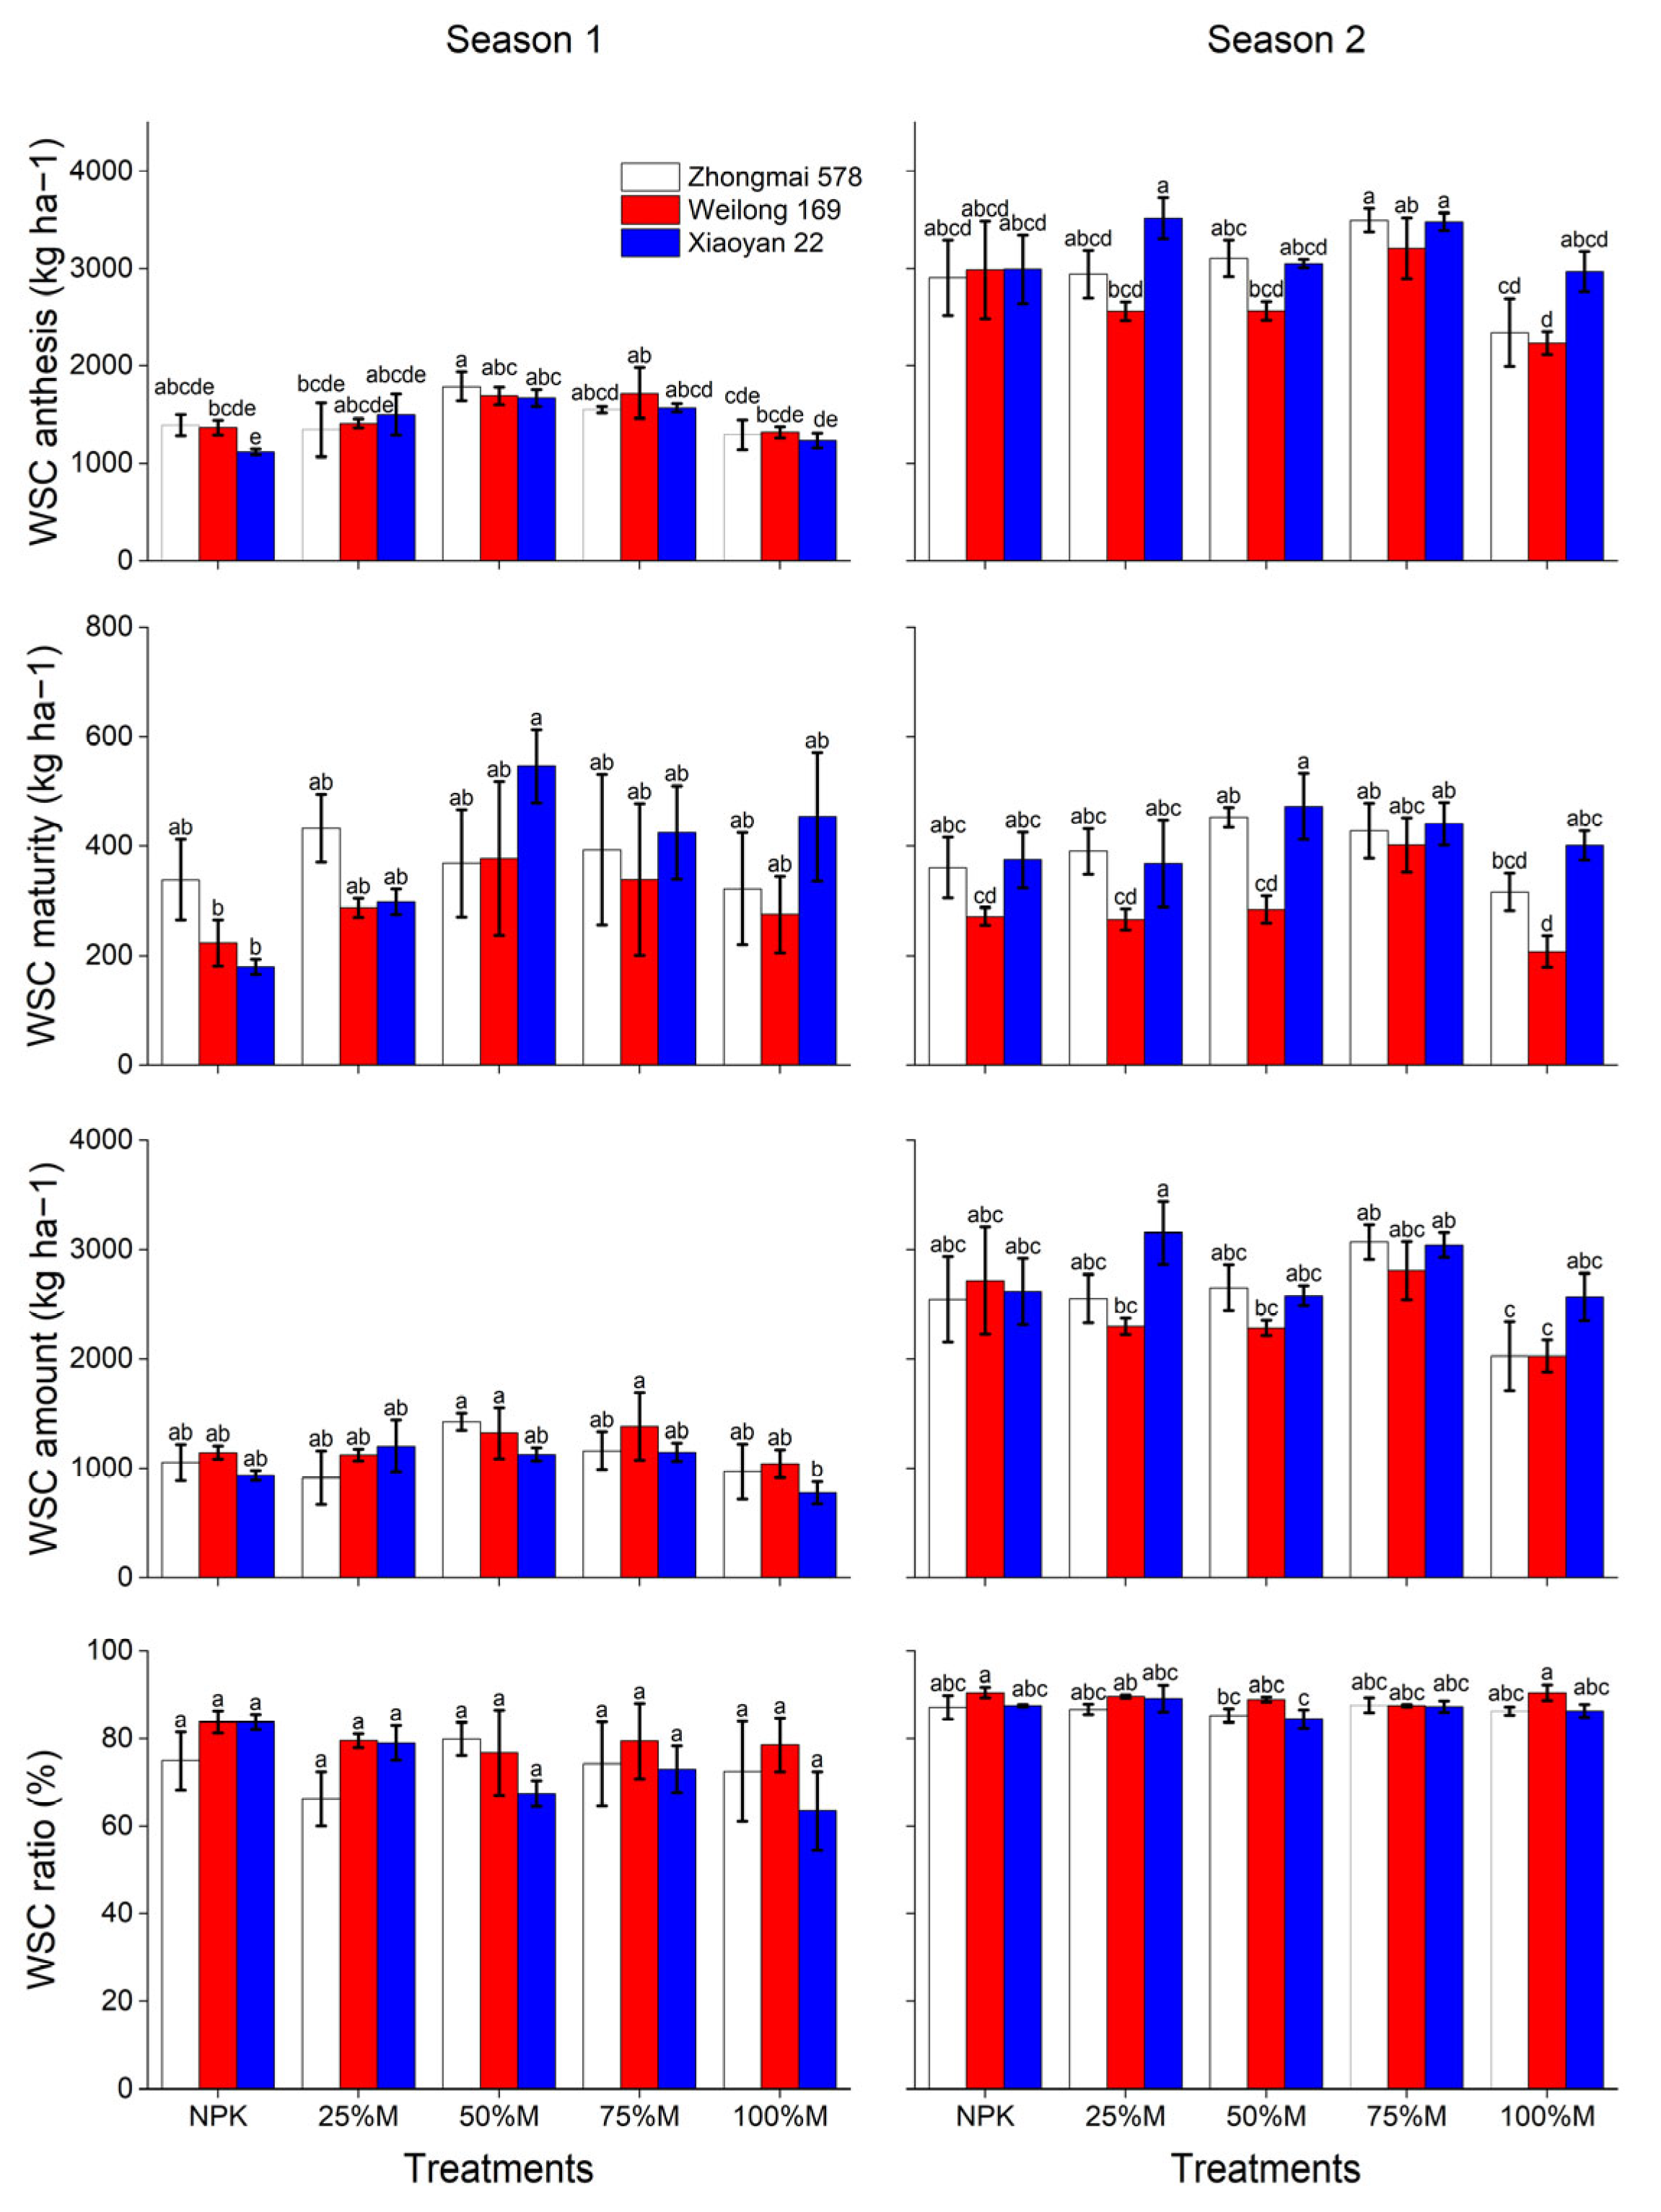
At anthesis, the amount of WSC ranged from 1429 to 2955 kg ha−1 and varied with season, fertilization and the interactions of fertilization by season, and variety by season (Figure 3, Table 1). In season 1, the 50% M treatment increased WSC in Zhongmai578 compared to NPK under Xiaoyan22. The 75% M treatment under Zhongmai578 resulted in higher WSC than the 100% M treatment under the same variety in season 2. At maturity, the amount of WSC ranged from 258 to 412 kg ha−1 and varied with fertilization and variety (Figure 3, Table 1). Compared to NPK, the 50% M treatment increased WSC, especially in Xiaoyan22, in season 1, but did not vary among fertilization regimes in season 2.
WSC translocation amount ranged from 1150 to 2579 kg ha−1 in response to season, fertilization, and interactions of season by variety (Figure 3, Table 1). The 100% M treatment under Xiaoyan22 showed a lower WSC translocation amount than the 50% M and 75% M treatments under Weilong169 in season 1, whereas in season 2, the 100% M treatment under Zhongmai578 showed a lower WSC translocation amount compared to the 75% M treatment. The range of WSC translocation ratio was 75.5–87.7% and varied with season (Figure 3, Table 1). There were no significant differences in WSC translocation ratio among fertilization regimes in season 1; however, the 50% M treatment under Xiaoyan22 showed a lower WSC translocation ratio than NPK under Weilong169.

3.4. Flag Leaf Senescence

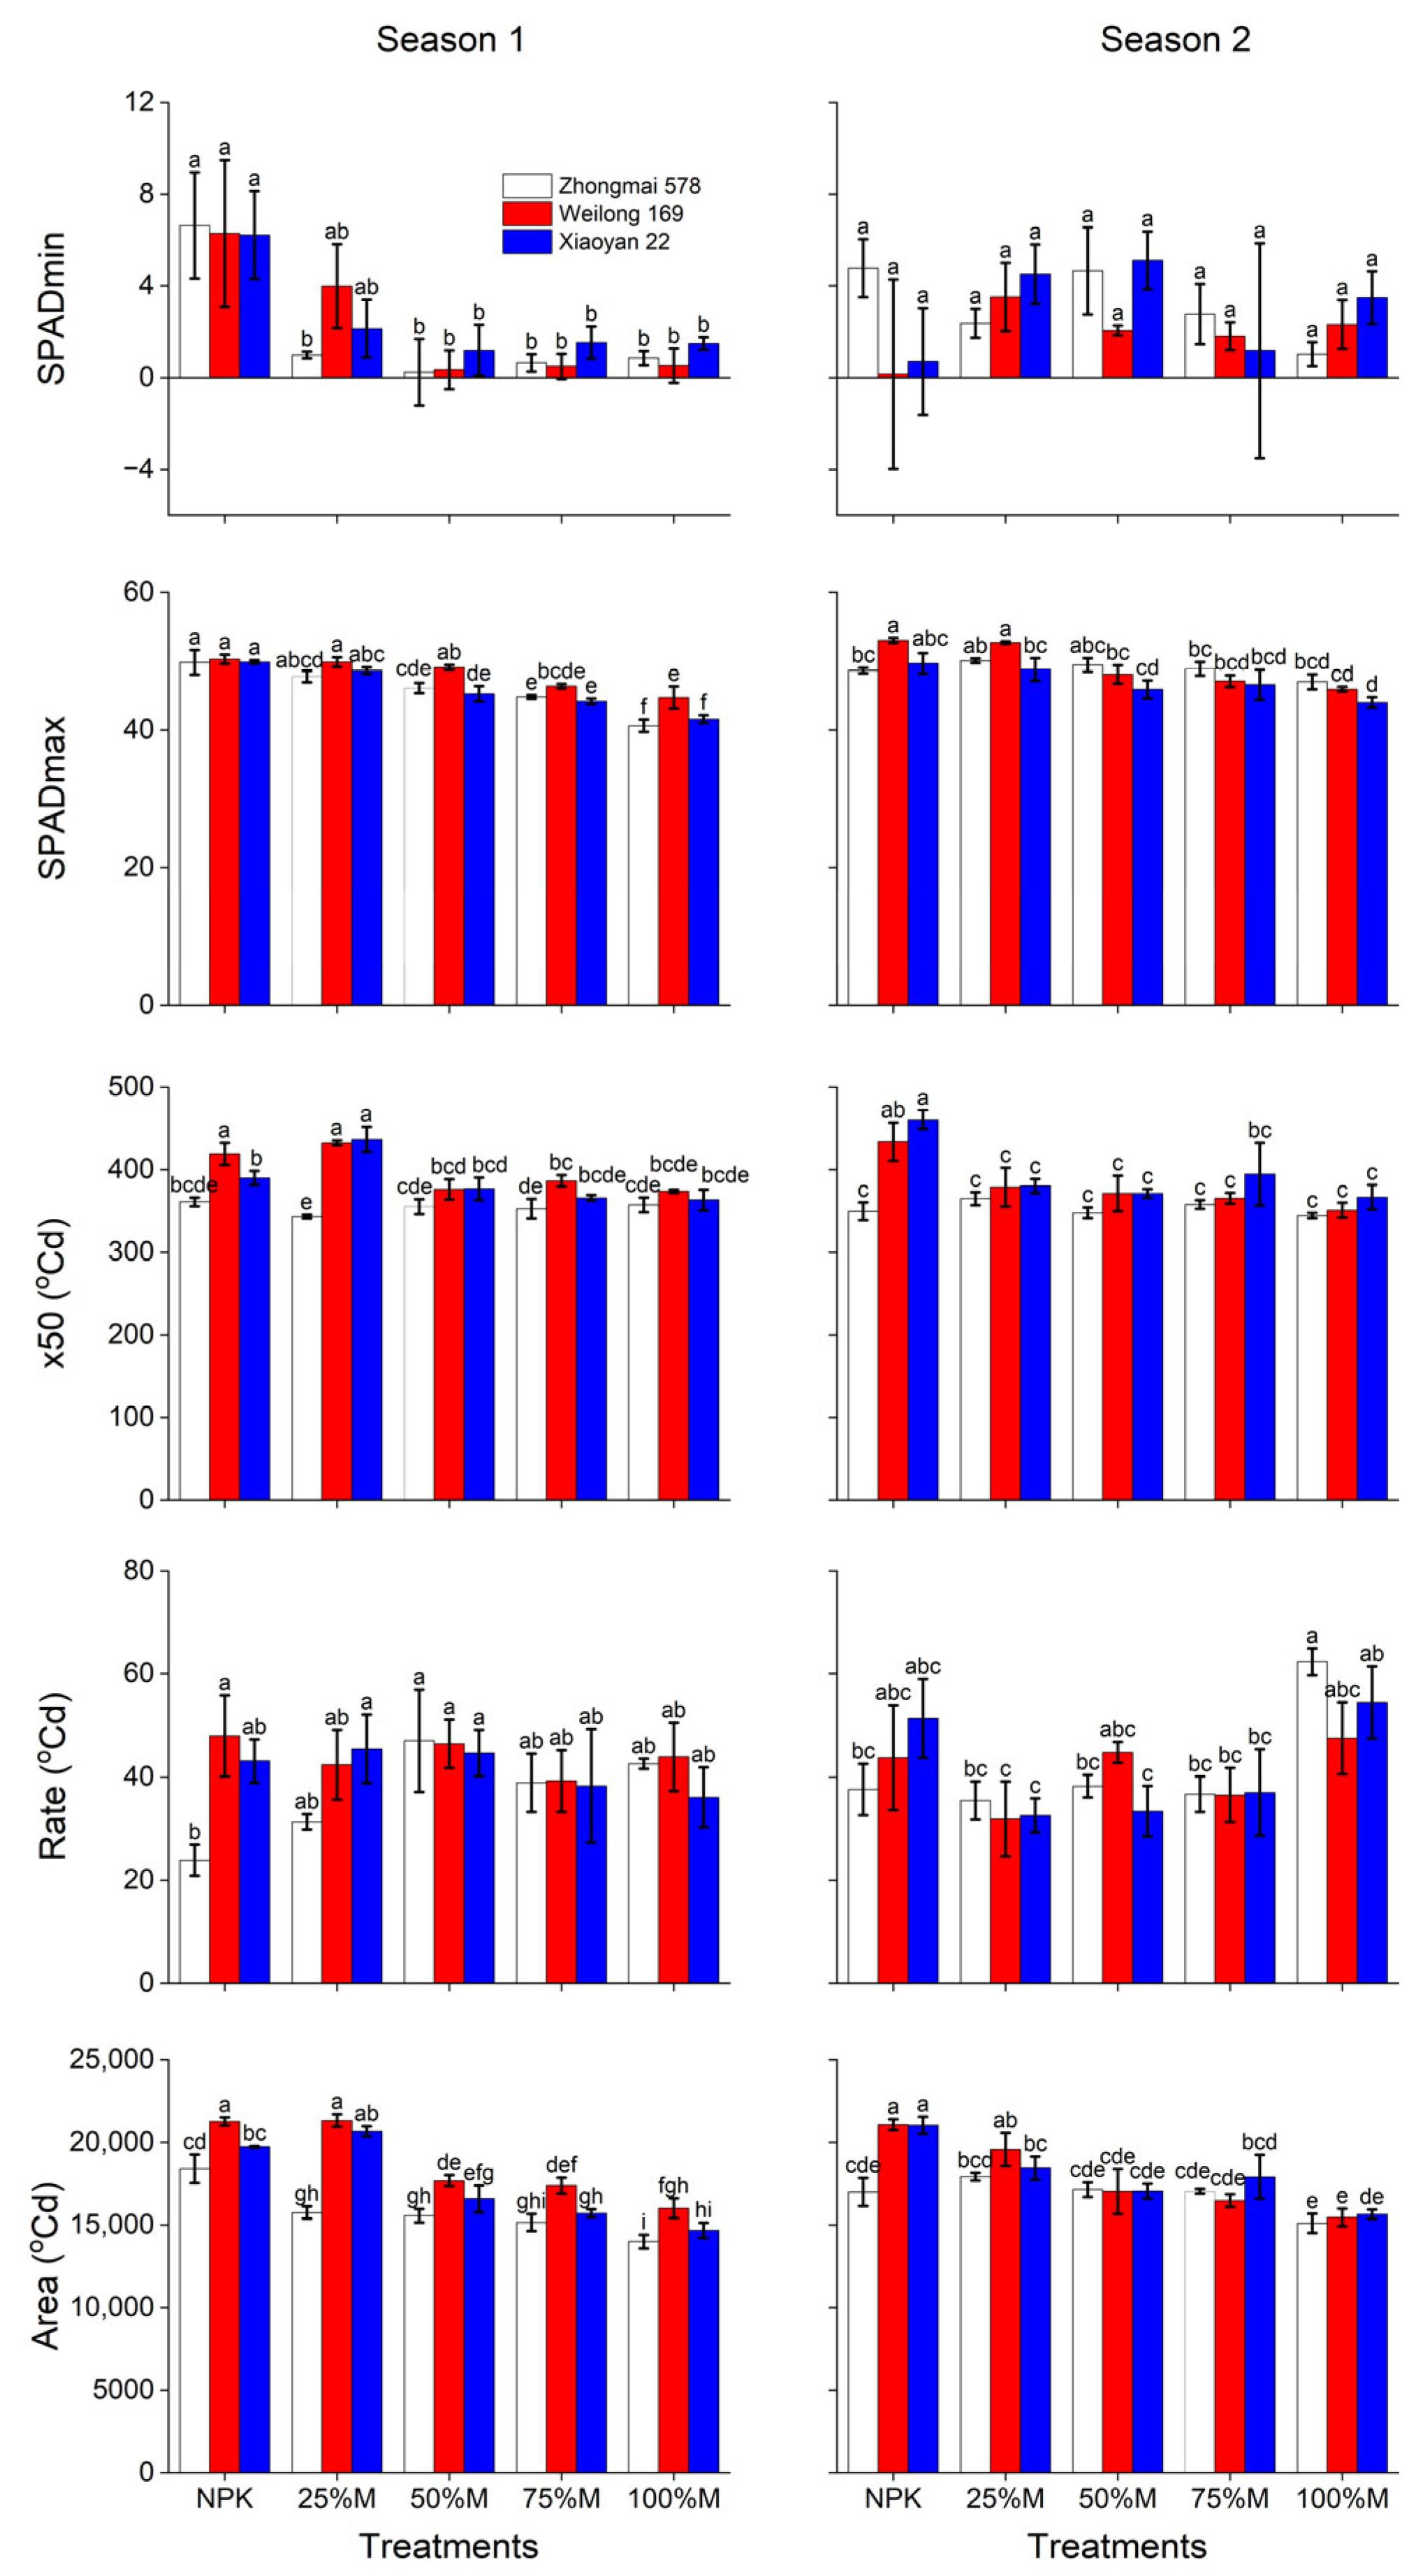
The SPADmin ranged from −0.7 to 6.6 and varied with the interaction between season and fertilization (Figure 4, Table 1). Compared to NPK, increasing the proportion of manure substitution gradually decreased SPADmin in all varieties in season 1, but did not vary among fertilization regimes in season 2.
The SPADmax ranged from 40.6 to 53.0 and varied with season, fertilization, and variety (Figure 4, Table 1). The NPK and 25% M treatments increased SPADmax in all varieties compared to 100% M in season 1, but in season 2, only Xiaoyan22 showed a lower value under 100% M.
The x50 ranged from 343 to 461 °Cd (Figure 4) and varied with fertilization, variety, and interactions between fertilization and variety, season and fertilization, and fertilization × variety × season (Table 1). The 25% M treatment resulted in a higher x50 in Weilong169 and Xiaoyan22 compared to other manure substitutions in season 1, whereas in season 2, NPK under Xiaoyan22 showed a higher x50 than other manure substitutions.
The rate of senescence significantly responded to the fertilization regimes, and interaction between season and fertilization (Table 1). In season 1, the NPK treatment resulted in slower senescence in Zhongmai578, whereas in season 2, 100% M under Zhongmai578 resulted in faster senescence compared with the other treatments (Figure 4). While the area under the SPAD curve was affected by fertilization, variety, and interactions between variety and season, fertilization and season, and fertilization × variety × season (Table 1). In season 1, the NPK and 25% M treatments increased the area under the SPAD curve in both Weilong169 and Xiaoyan22, but in season 2, the increase was observed only in Weilong169.

3.5. Nitrogen Traits

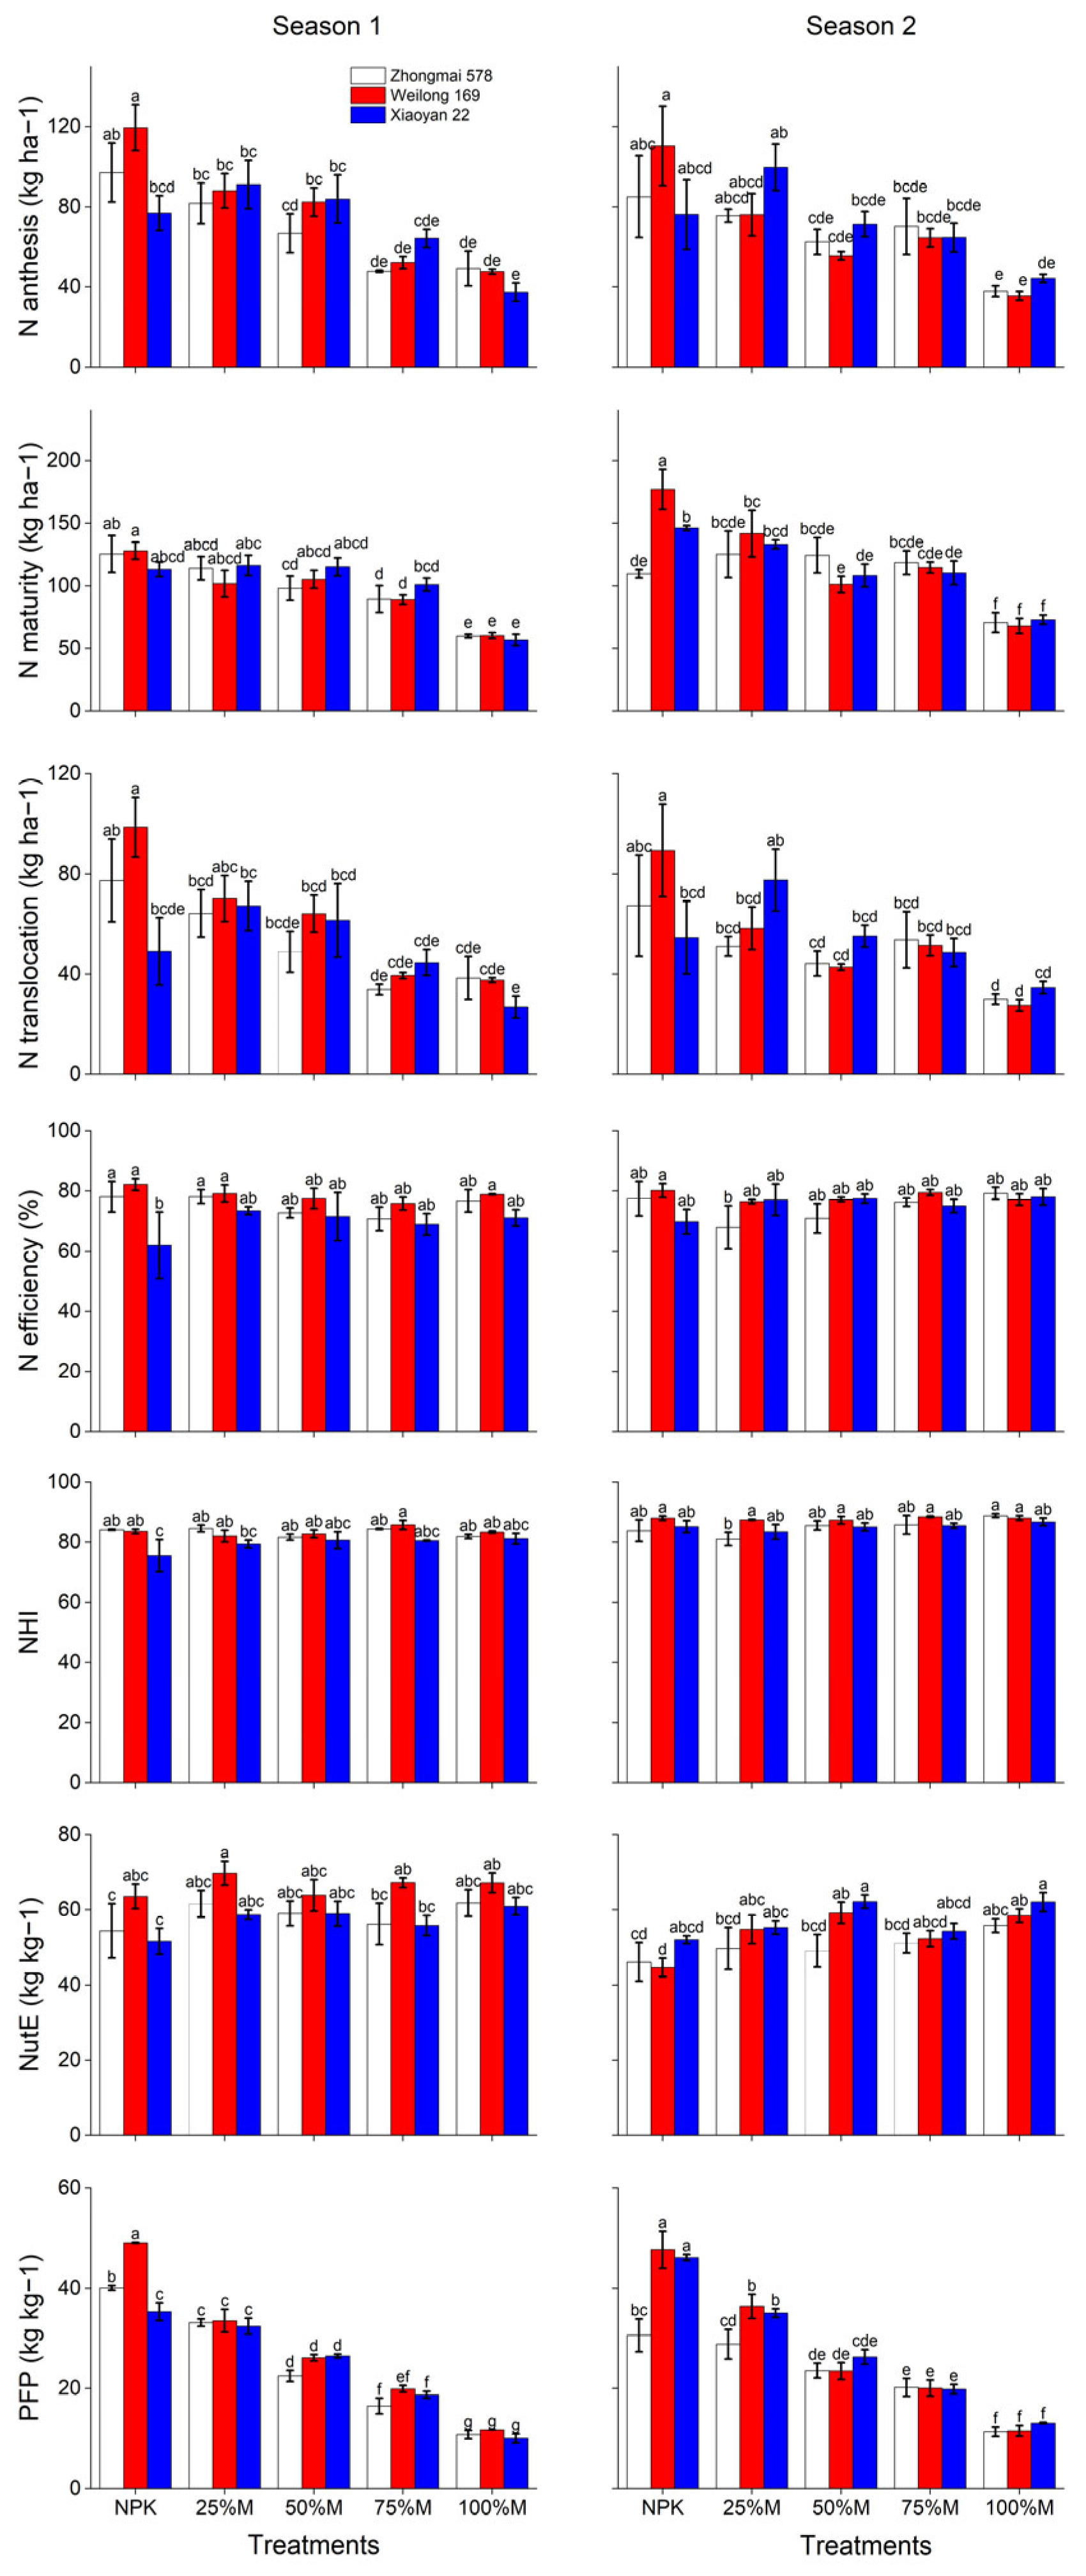
At anthesis, N uptake ranged from 36 to 120 kg ha−1 and varied with fertilization and the interaction of variety by fertilization (Figure 5, Table 1). Compared to NPK, increasing the proportion of manure substitution gradually decreased N uptake in Weilong169 in both seasons. At maturity, N uptake varied from 57 to 177 kg ha−1 and varied with season, fertilization, and the three-way interaction between variety, fertilization, and season (Figure 5, Table 1). The response of N uptake at maturity was similar to that of N uptake at anthesis.
Nitrogen translocation was affected by fertilization and interactions of variety by fertilization, but N translocation efficiency was only influenced by variety (Table 1). Compared to NPK, increasing the proportion of manure substitution gradually decreased N translocation in all varieties in both seasons. However, N translocation efficiency did not vary among fertilization regimes in either season.
Nitrogen harvest index responded to season, variety and interactions of season by variety (Table 1). Nitrogen harvest index did not vary among fertilization regimes in both seasons. Nitrogen utilization efficiency varied from 45 to 70 kg kg−1 (Figure 5) and was affected by season, fertilization, variety, and interactions of season by variety (Table 1). The NPK treatment had lower N utilization efficiency in Weilong169 than 100% M in season 2. Partial factor productivity responded to fertilization, variety, and interactions of season × variety, fertilization × variety, and the three-way interaction between variety, fertilization, and season. Increasing manure substitution gradually decreased partial factor productivity compared to NPK under Zhongmai578 and Weilong169 in season 1, and under Weilong169 and Xiaoyan22 in season 2.

3.6. Correlations Between Traits

Grain yield correlated with dry matter at anthesis and maturity, HI, SPADmax, x50, area, and N uptake at anthesis and maturity (Table 2). N uptake at anthesis and maturity was associated with all leaf senescence.

4. Discussion

4.1. Effect of Fertilization and Variety on Wheat Yield

Yield comparisons between farming systems require consideration of site-specific soil properties along with initial fertility, crop rotations, and nutrient inputs [43]. We found that 25% M, in which the N application rate was 210 kg N ha−1 with 41% from organic sources (Table S4), produced a similar yield to NPK, and both treatments outyielded other treatments (Figure 1). The comparable yield may be related to the better mineral N supply before anthesis under 25% M and NPK treatments (Figures S2 and S3) associated with growth and N uptake at anthesis (Figure 5) and stay-green traits (Figure 4), which correlated with yield (Table 2). In the North China Plain, substituting 50% of inorganic fertilizers with composted cattle manure resulted in a similar wheat yield to mineral fertilizers alone in silty loam soil [18], and substituting 45% of inorganic fertilizer with sheep manure resulted in similar crop yields to inorganic fertilization under a wheat–maize rotation system in a sandy loam soil [21]. However, other studies reported that substituting 25% of chemical fertilizer with cow manure increased crop yields compared to NPK under a winter wheat–summer maize double cropping system on a loam soil in the North China Plain [20] and a winter wheat–summer rice rotation system in a silt loam soil in Anhui Province, eastern China [17]. These variations in the substitution ratio of organic manure for chemical fertilizers can be attributed to several factors:
(1)
N mineralization tends to be higher in sandy and sandy clay loam soils compared to clay soil and loam soil due to better microbial activity [44,45];
(2)
N mineralization of different manure types varies with the content of N and lignin, C/N ratio, and lignin/N ratio [45], and the mineralized N from manure correlates negatively with C/N ratio. The amendments with C/N ratios > 19:1 immobilized N, whereas amendments with C/N ratios < 14:1 mineralized N [46]. In our study, we used manure with a C/N ratio of 17 and 24 over two seasons, which implied that mineralization was limited to a certain extent;
(3)
Temperature affects mineralization: N mineralization was minimal during the winter when the temperature was low (~10 °C) but likely increased in spring and summer with higher temperatures (25–30 °C) [47]. Mean daily air temperature from sowing to anthesis was −7.1 to 22.4 °C and −4.2 to 21.3 °C over two seasons in our study.
Overall, a higher substitution ratio of manure for chemical fertilizers may be feasible for sandy and sandy clay soils, particularly when organic manure has a lower C/N ratio (e.g., poultry manure); however, for clay soils, a lower substitution rate may be more suitable to ensure sufficient nutrient availability for crops, especially under cooler temperatures.
The poor yield in the other three treatments, especially 100% M, was mostly associated with N deficiency or mismatched supply between wheat requirement and N supply (Figures S2 and S3) that led to low N uptake at anthesis (Figure 5) and stay-green traits (Figure 4). Our previous study showed that wheat yield peaked with around 120–165 kg N ha−1 in the tested area [48]. In the North China Plain, the yield is reported to peak at 120 to 185 kg N ha−1 [49,50]. The N rates in 50% M, 75% M and 100% M treatments were 255, 300 and 345 kg N ha−1 in our current study (Table S4), but the expected N available for our winter wheat was 45, 108 and 128 kg N ha−1 based on the mineralization ratio of cattle manure alone (13%) and combined with chemical N (26%) during two wheat seasons in a 15N-labeled field study in winter wheat in our area [51]. This implies that higher manure substitutions, especially 100% M treatment, might cause N stress until anthesis compared with NPK and 25% M treatments, as indicated by mineral N measurements (Figures S2 and S3). Additionally, faster leaf senescence after anthesis, as reflected by a lower SPADmax, x50, and leaf area under 50% M, 75% M, and 100% M, was significantly associated with lower yield (Table 2). Since inadequate N supply did not sustain leaf greenness after anthesis, particularly maximum greenness and x50 (Figure 4), this resulted in a lower grain number m−2, harvest index, and yield (Figure 1). Previous studies have reported that sufficient N supply increased post-anthesis dry matter accumulation and delayed leaf senescence [24,52]. However, it should be acknowledged that total N inputs differed across treatments, which may confound the interpretation of fertilizer effects on physiological traits and yield performance. Accordingly, the observed differences may reflect not only the influence of the N source, but also the effect of the N application rate. This limitation should be taken into account when evaluating the efficiency and effectiveness of manure substitution.
Varieties differed in terms of grain yield; a higher yield was observed for Weilong169 and Xiaoyan22 compared with Zhongmai578. The yield difference between varieties was related to grain number m−2 (Figure 1, Table 2). However, there were different strategies between Weilong169 and Xiaoyan22 for achieving grain yield. For Weilong169, the high yield was due to a higher grain number and harvest index, not a higher biomass. Grain yield and HI can be increased without increasing aboveground biomass if the number of grains m−2 can be increased [53]. Moreover, the increase in yield was largely achieved after anthesis, in association with maximum SPAD and area under the SPAD curve (Figure 4), which might support greater radiation use efficiency, as reported by Sadras and Lawson [54] and Xiao et al. [55]. Other studies also showed that stay-green traits correlate with yield [22,56,57]. Xiaoyan22 produced a higher grain yield by increasing the grain number and biomass (Figure 1), which might be related to higher root length density (Figure S4) and sustained green leaf area after anthesis (Figure 6). Previous studies have reported that the increase in biomass with N fertilizer application contributed most to grain yield [24,58]. Our study also found that the new variety Weilong169 outyielded the old variety Xiaoyan22 under NPK but not manure treatments. This is possibly related to the smaller root length density of the new variety that might be due to poor access to nutrients such as N when the supply intensity is low under low temperatures in manure treatments [59]. In contrast, older cultivars are able to maintain growth under nutrient-limited and stressful conditions by sustaining higher nutrient uptake [60]. This capacity is likely linked to the greater allocation of resources toward root development [61]. Although root traits were only assessed under NPK and 25% M treatments, the observed differences in RLD indicate that root architecture plays a key role in modulating N uptake across genotypes and fertilization regimes. A more developed root system improves soil exploration and nutrient acquisition, particularly under conditions of limited nutrient availability. Moreover, improved N uptake may help maintain flag leaf photosynthetic function during grain filling, potentially supporting greater assimilate production and translocation. For example, genotypes with higher RLD, such as Xiaoyan22, tended to exhibit superior N uptake under manure substitution, which may have contributed to more stable yield performance under this treatment.

4.2. Effect of Fertilization and Variety on N Use Efficiency

The NHI partially accounts for the translocation of absorbed N from vegetative organs to grain [62]. The NHI in the current study (76–90%) was within the range of 43–93% reported by Gao et al. [63]. NHI was not affected by fertilizer treatments, which might be attributed to their similar N translocation efficiencies (Figure 5). Previous studies also documented the fact that combined manure and mineral fertilization showed comparable NHI to mineral fertilization alone [15,64]. The NHI in two new varieties were higher than that in old one (Xiaoyan22) (Figure 5). This difference is consistent with the change in NHI reported in previous decades in China [3,65].
The N utilization efficiency in this study was higher under manure substitution than under sole NPK application (Figure 5). Our results are in agreement with previous studies [15,41,66,67,68]. However, Yaduvanshi [69] found that the substitution of inorganic fertilizer by manure resulted in equivalent N utilization efficiency to inorganic fertilizer alone under a rice–wheat rotation on sodic soil. The higher N utilization efficiency under manure substitution in our study may be related to the lower N uptake maturity (Figure 5). Similarly, Caviglia et al. [70] reported that the lower N uptake resulted in increased N utilization efficiency. The variety Weilong169 showed higher N utilization efficiency than Zhongmai578, and similar efficiency to the old variety (Figure 5). This may be related to the fact that the wheat varieties already had high N absorption, or that breeding did not directly change N uptake [71]. Thus, increased N utilization efficiency was associated with increased yield through improvements in HI and biomass [72]. In our studies where inorganic nitrogen was fully or partially replaced by organic sources, PFP tended to decrease with increasing proportions of organic substitution (Figure 5). This reduction can be attributed to both the greater total N inputs across treatments and the relatively lower N availability from organic sources compared to inorganic forms, as previously discussed. It should be noted that differences in total N input among treatments may confound direct comparisons of NUE. Although PFP was included to account for this, the unequal N application rates across treatments remain a limitation. In addition, the absence of pre-sowing soil mineral N data (nitrate and ammonium) limits the extent to which treatment effects on NUE can be fully interpreted. Future research should include mineral N assessments before sowing to enhance the interpretation of N dynamics across fertilization treatments.

5. Conclusions

The two-year field study demonstrated that lower ratios (less than 50%) of organic manure substitution for chemical fertilizers achieved a comparable yield to chemical fertilizer alone but improved N utilization efficiency. Future studies should include an assessment of the feasibility of using manure, considering factors such as its source, availability, cost compared to inorganic options, and the additional land and resources required for manure production [73,74]. The new variety, Weilong169, generally had a higher yield, higher N harvest index, and higher N utilization efficiency, highlighting the importance of N traits for wheat yield.

Supplementary Materials

The following supporting information can be downloaded at: https://www.mdpi.com/article/10.3390/agronomy15071679/s1, Table S1: Average air temperature, monthly precipitation, and hydrothermal coefficient (HTC) during two growing seasons compared with long-term averages; Table S2: Details of treatments and fertilizer rates for the double cropping system (kg ha−1 y−1); Table S3: Soil chemical properties at 0–20 cm before experimental setup; Table S4: Details of fertilizer doses for winter wheat; Table S5: Analysis of variance (ANOVA) for NH4+-N (mg kg−1) across soil depths under different fertilization treatments in two growing seasons; Table S6: Analysis of variance (ANOVA) for NO3-N (mg kg−1) across soil depths under different fertilization treatments in two growing seasons; Table S7: Analysis of variance (ANOVA) for root length density (cm cm−3) across soil depths under different fertilization treatments (NPK and 25% M) in two growing seasons. Figure S1: Experimental site location; Figure S2: Effect of fertilization and varieties on NH4+-N concentration in 0–40 cm soil depth during two growing seasons. Vertical bars show standard error; Figure S3: Effect of fertilization and varieties on NO3−-N concentration in 0–40 cm soil depth during two growing seasons. Vertical bars show standard error; Figure S4: Effect of fertilization and varieties on root length density during two growing seasons. Horizontal bars are LSD values. The different letters represent significant differences between varieties at the same soil depth (p < 0.05).

Author Contributions

Conceptualization, S.Z.; data curation, E.H., X.L., M.Y. and C.H.; formal analysis, E.H., X.L., M.Y. and C.H.; investigation, E.H., X.L. and M.Y.; methodology, E.H., X.Y. and S.Z.; supervision, X.Y. and S.Z.; writing—original draft, E.H., X.L. and S.Z.; writing—review and editing, C.H., X.Y. and S.Z. All authors have read and agreed to the published version of the manuscript.

Funding

This research was funded by Beijing Changping Soil Quality National Observation and Research Station (grand No. G2025–07–2) and Shaanxi Provincial Field Scientific Observation and Research Station on Loessial Soil in Yangling.

Data Availability Statement

The original contributions presented in this study are included in the article and Supplementary Materials. Further inquiries can be directed to the corresponding author.

Acknowledgments

We are grateful to Fenglian Lv and Hu Xu for managing the field experiments.

Conflicts of Interest

The authors declare no conflicts of interest.

References

  1. IFA. Fertilizer Use by Crop and Country for the 2017–2018 Period; International Fertilizer Association (IFA): Paris, France, 2022; Available online: https://www.ifastat.org/consumption/fertilizeruse-by-crop (accessed on 14 September 2023).
  2. Fischer, R.A. Farming Systems of Australia. In Crop Physiology; Elsevier: Amsterdam, The Netherlands, 2009; pp. 22–54. ISBN 978-0-12-374431-9. [Google Scholar]
  3. Liu, H.; Xiong, W.; Mottaleb, K.A.; Krupnik, T.J.; Burgueño, J.; Pequeno, D.N.L.; Wu, W. Contrasting Contributions of Five Factors to Wheat Yield Growth in China by Process-Based and Statistical Models. Eur. J. Agron. 2021, 130, 126370. [Google Scholar] [CrossRef]
  4. Sadras, V.O.; Hayman, P.T.; Rodriguez, D.; Monjardino, M.; Bielich, M.; Unkovich, M.; Mudge, B.; Wang, E. Interactions between Water and Nitrogen in Australian Cropping Systems: Physiological, Agronomic, Economic, Breeding and Modelling Perspectives. Crop Pasture Sci. 2016, 67, 1019–1053. [Google Scholar] [CrossRef]
  5. Liu, L.; Sadras, V.O.; Xu, J.; Hu, C.; Yang, X.; Zhang, S. Genetic Improvement of Crop Yield, Grain Protein and Nitrogen Use Efficiency of Wheat, Rice and Maize in China. In Advances in Agronomy; Elsevier: Amsterdam, The Netherlands, 2021; Volume 168, pp. 203–252. ISBN 978-0-12-824589-7. [Google Scholar]
  6. Angus, J.F.; Grace, P.R. Nitrogen Balance in Australia and Nitrogen Use Efficiency on Australian Farms. Soil Res. 2017, 55, 435–450. [Google Scholar] [CrossRef]
  7. Zhang, X.; Davidson, E.A.; Mauzerall, D.L.; Searchinger, T.D.; Dumas, P.; Shen, Y. Managing Nitrogen for Sustainable Development. Nature 2015, 528, 51–59. [Google Scholar] [CrossRef]
  8. He, P.; Xu, X.; Zhou, W.; Smith, W.; He, W.; Grant, B.; Ding, W.; Qiu, S.; Zhao, S. Ensuring Future Agricultural Sustainability in China Utilizing an Observationally Validated Nutrient Recommendation Approach. Eur. J. Agron. 2022, 132, 126409. [Google Scholar] [CrossRef]
  9. Guo, J.; Li, C.; Xu, X.; Sun, M.; Zhang, L. Farmland Scale and Chemical Fertilizer Use in Rural China: New Evidence from the Perspective of Nutrient Elements. J. Clean. Prod. 2022, 376, 134278. [Google Scholar] [CrossRef]
  10. Zhang, Q.; Chu, Y.; Yin, Y.; Ying, H.; Zhang, F.; Cui, Z. Comprehensive Assessment of the Utilization of Manure in China’s Croplands Based on National Farmer Survey Data. Sci. Data 2023, 10, 223. [Google Scholar] [CrossRef]
  11. Du, Y.; Cui, B.; Zhang, Q.; Wang, Z.; Sun, J.; Niu, W. Effects of Manure Fertilizer on Crop Yield and Soil Properties in China: A Meta-Analysis. CATENA 2020, 193, 104617. [Google Scholar] [CrossRef]
  12. Bai, Z.; Ma, L.; Jin, S.; Ma, W.; Velthof, G.L.; Oenema, O.; Liu, L.; Chadwick, D.; Zhang, F. Nitrogen, Phosphorus, and Potassium Flows through the Manure Management Chain in China. Environ. Sci. Technol. 2016, 50, 13409–13418. [Google Scholar] [CrossRef]
  13. Dhaliwal, S.S.; Sharma, V.; Shukla, A.K.; Verma, V.; Kaur, M.; Singh, P.; Gaber, A.; Hossain, A. Effect of Addition of Organic Manures on Basmati Yield, Nutrient Content and Soil Fertility Status in North-Western India. Heliyon 2023, 9, e14514. [Google Scholar] [CrossRef]
  14. Fu, Y.; De Jonge, L.W.; Moldrup, P.; Paradelo, M.; Arthur, E. Improvements in Soil Physical Properties after Long-Term Manure Addition Depend on Soil and Crop Type. Geoderma 2022, 425, 116062. [Google Scholar] [CrossRef]
  15. Xie, J.; Shi, X.; Zhang, Y.; Wan, Y.; Hu, Q.; Zhang, Y.; Wang, J.; He, X.; Evgenia, B. Improved Nitrogen Use Efficiency, Carbon Sequestration and Reduced Environmental Contamination under a Gradient of Manure Application. Soil Tillage Res. 2022, 220, 105386. [Google Scholar] [CrossRef]
  16. Yang, Y.J.; Lei, T.; Du, W.; Liang, C.L.; Li, H.D.; Lv, J.L. Substituting Chemical Fertilizer Nitrogen with Organic Manure and Comparing Their Nitrogen Use Efficiency and Winter Wheat Yield. J. Agric. Sci. 2020, 158, 262–268. [Google Scholar] [CrossRef]
  17. Yu, J.; Zhang, C.; Wang, X.; Li, H.; Kalkhajeh, Y.K.; Hu, H. Partial Substitution of Chemical N with Solid Cow Manure Improved Soil Ecological Indicators and Crop Yield in a Wheat–Rice Rotation System. Agronomy 2024, 14, 700. [Google Scholar] [CrossRef]
  18. Yan, Z.; Zhang, W.; Liu, X.; Wang, Q.; Liu, B.; Mei, X. Grain Yield and Water Productivity of Winter Wheat Controlled by Irrigation Regime and Manure Substitution in the North China Plain. Agric. Water Manag. 2024, 295, 108731. [Google Scholar] [CrossRef]
  19. Niu, J.; Saeed, Q.; Wang, W.; Zhang, R.; Liu, L.; Lv, F.; Xu, J.; Han, Y.; Zhang, P.; Hu, C.; et al. Manure Replacing Synthetic Fertilizer Improves Crop Yield Sustainability and Reduces Carbon Footprint under Winter Wheat–Summer Maize Cropping System. J. Environ. Manag. 2024, 358, 120936. [Google Scholar] [CrossRef]
  20. Tong, B.; Hou, Y.; Wang, S.; Ma, W. Partial Substitution of Urea Fertilizers by Manure Increases Crop Yield and Nitrogen Use Efficiency of a Wheat–Maize Double Cropping System. Nutr. Cycl. Agroecosyst. 2022, 127, 11–21. [Google Scholar] [CrossRef]
  21. Wu, G.; Yang, S.; Luan, C.; Wu, Q.; Lin, L.; Li, X.; Che, Z.; Zhou, D.; Dong, Z.; Song, H. Partial Organic Substitution for Synthetic Fertilizer Improves Soil Fertility and Crop Yields While Mitigating N2O Emissions in Wheat-Maize Rotation System. Eur. J. Agron. 2024, 154, 127077. [Google Scholar] [CrossRef]
  22. Kitonyo, O.M.; Sadras, V.O.; Zhou, Y.; Denton, M.D. Evaluation of Historic Australian Wheat Varieties Reveals Increased Grain Yield and Changes in Senescence Patterns but Limited Adaptation to Tillage Systems. Field Crops Res. 2017, 206, 65–73. [Google Scholar] [CrossRef]
  23. Kong, L.; Xie, Y.; Hu, L.; Feng, B.; Li, S. Remobilization of Vegetative Nitrogen to Developing Grain in Wheat (Triticum aestivum L.). Field Crops Res. 2016, 196, 134–144. [Google Scholar] [CrossRef]
  24. Liu, M.; Wu, X.; Li, C.; Li, M.; Xiong, T.; Tang, Y. Dry Matter and Nitrogen Accumulation, Partitioning, and Translocation in Synthetic-Derived Wheat Cultivars under Nitrogen Deficiency at the Post-Jointing Stage. Field Crops Res. 2020, 248, 107720. [Google Scholar] [CrossRef]
  25. Gaju, O.; Allard, V.; Martre, P.; Le Gouis, J.; Moreau, D.; Bogard, M.; Hubbart, S.; Foulkes, M.J. Nitrogen Partitioning and Remobilization in Relation to Leaf Senescence, Grain Yield and Grain Nitrogen Concentration in Wheat Cultivars. Field Crops Res. 2014, 155, 213–223. [Google Scholar] [CrossRef]
  26. Iqbal, A.; He, L.; Ali, I.; Ullah, S.; Khan, A.; Akhtar, K.; Wei, S.; Fahad, S.; Khan, R.; Jiang, L. Co-Incorporation of Manure and Inorganic Fertilizer Improves Leaf Physiological Traits, Rice Production and Soil Functionality in a Paddy Field. Sci. Rep. 2021, 11, 10048. [Google Scholar] [CrossRef]
  27. Chen, C.; Han, G.; He, H.; Westcott, M. Yield, Protein, and Remobilization of Water Soluble Carbohydrate and Nitrogen of Three Spring Wheat Cultivars as Influenced by Nitrogen Input. Agron. J. 2011, 103, 786–795. [Google Scholar] [CrossRef]
  28. Tremblay, G.F.; Bélanger, G.; Drapeau, R. Nitrogen Fertilizer Application and Developmental Stage Affect Silage Quality of Timothy (Phleum pratense L.). Grass Forage Sci. 2005, 60, 337–355. [Google Scholar] [CrossRef]
  29. Beche, E.; Benin, G.; Da Silva, C.L.; Munaro, L.B.; Marchese, J.A. Genetic Gain in Yield and Changes Associated with Physiological Traits in Brazilian Wheat during the 20th Century. Eur. J. Agron. 2014, 61, 49–59. [Google Scholar] [CrossRef]
  30. Chen, H.; Deng, A.; Zhang, W.; Li, W.; Qiao, Y.; Yang, T.; Zheng, C.; Cao, C.; Chen, F. Long-Term Inorganic plus Organic Fertilization Increases Yield and Yield Stability of Winter Wheat. Crop J. 2018, 6, 589–599. [Google Scholar] [CrossRef]
  31. Kabato, W.; Ergudo, T.; Mutum, L.; Janda, T.; Molnár, Z. Response of Wheat to Combined Application of Nitrogen and Phosphorus along with Compost. J. Crop Sci. Biotechnol. 2022, 25, 557–564. [Google Scholar] [CrossRef]
  32. Lv, F.; Song, J.; Giltrap, D.; Feng, Y.; Yang, X.; Zhang, S. Crop Yield and N2O Emission Affected by Long-Term Organic Manure Substitution Fertilizer under Winter Wheat-Summer Maize Cropping System. Sci. Total Environ. 2020, 732, 139321. [Google Scholar] [CrossRef]
  33. Shi, X.; Song, X.; Yang, J.; Zhao, Y.; Yuan, Z.; Zhao, G.; Abbott, L.K.; Zhang, F.; Li, F.-M. Yield Benefits from Joint Application of Manure and Inorganic Fertilizer in a Long-Term Field Pea, Wheat and Potato Crop Rotation. Field Crops Res. 2023, 294, 108873. [Google Scholar] [CrossRef]
  34. Zadoks, J.C.; Chang, T.T.; Konzak, C.F. A Decimal Code for the Growth Stages of Cereals. Weed Res. 1974, 14, 415–421. [Google Scholar] [CrossRef]
  35. Yemm, E.W.; Willis, A.J. The Estimation of Carbohydrates in Plant Extracts by Anthrone. Biochem. J. 1954, 57, 508–514. [Google Scholar] [CrossRef]
  36. Zhang, G.; Hou, Y.; Zhang, H.; Fan, H.; Wen, X.; Han, J.; Liao, Y. Optimizing Planting Pattern and Nitrogen Application Rate Improves Grain Yield and Water Use Efficiency for Rain-Fed Spring Maize by Promoting Root Growth and Reducing Redundant Root Growth. Soil Tillage Res. 2022, 220, 105385. [Google Scholar] [CrossRef]
  37. Gerasko, T.; Pyda, S.; Ivanova, I. Effect of Living Mulch on Soil Conditions and Morphometrical Indices of Sweet Cherry Trees. Int. J. Appl. Agric. Sci. 2021, 7, 50. [Google Scholar] [CrossRef]
  38. Pearsall, W.H. Growth Studies VI. On the Relative Sizes of Growing Plant Organs. Ann. Bot. 1927, 41, 549–556. [Google Scholar] [CrossRef]
  39. Christopher, J.T.; Veyradier, M.; Borrell, A.K.; Harvey, G.; Fletcher, S.; Chenu, K. Phenotyping Novel Stay-Green Traits to Capture Genetic Variation in Senescence Dynamics. Funct. Plant Biol. 2014, 41, 1035–1048. [Google Scholar] [CrossRef]
  40. Hu, C.; Sadras, V.O.; Lu, G.; Zhang, R.; Yang, X.; Zhang, S. Root Pruning Enhances Wheat Yield, Harvest Index and Water-Use Efficiency in Semiarid Area. Field Crops Res. 2019, 230, 62–71. [Google Scholar] [CrossRef]
  41. Agegnehu, G.; Nelson, P.N.; Bird, M.I. The Effects of Biochar, Compost and Their Mixture and Nitrogen Fertilizer on Yield and Nitrogen Use Efficiency of Barley Grown on a Nitisol in the Highlands of Ethiopia. Sci. Total Environ. 2016, 569–570, 869–879. [Google Scholar] [CrossRef]
  42. Fatholahi, S.; Ehsanzadeh, P.; Karimmojeni, H. Ancient and Improved Wheats Are Discrepant in Nitrogen Uptake, Remobilization, and Use Efficiency yet Comparable in Nitrogen Assimilating Enzymes Capabilities. Field Crops Res. 2020, 249, 107761. [Google Scholar] [CrossRef]
  43. Kirchmann, H.; Kätterer, T.; Bergström, L.; Börjesson, G.; Bolinder, M.A. Flaws and Criteria for Design and Evaluation of Comparative Organic and Conventional Cropping Systems. Field Crops Res. 2016, 186, 99–106. [Google Scholar] [CrossRef]
  44. Liu, S.; Wang, J.; Pu, S.; Blagodatskaya, E.; Kuzyakov, Y.; Razavi, B.S. Impact of Manure on Soil Biochemical Properties: A Global Synthesis. Sci. Total Environ. 2020, 745, 141003. [Google Scholar] [CrossRef] [PubMed]
  45. Mubarak, A.R.; Gali, E.A.M.; Mohamed, A.G.; Steffens, D.; Awadelkarim, A.H. Nitrogen Mineralization from Five Manures as Influenced by Chemical Composition and Soil Type. Commun. Soil Sci. Plant Anal. 2010, 41, 1903–1920. [Google Scholar] [CrossRef]
  46. Lazicki, P.; Geisseler, D.; Lloyd, M. Nitrogen Mineralization from Organic Amendments Is Variable but Predictable. J. Environ. Qual. 2020, 49, 483–495. [Google Scholar] [CrossRef] [PubMed]
  47. Watts, D.B.; Torbert, H.A.; Prior, S.A. Soil Property and Landscape Position Effects on Seasonal Nitrogen Mineralization of Composted Dairy Manure. Soil Sci. 2010, 175, 27–35. [Google Scholar] [CrossRef]
  48. Zhang, S.; Gao, P.; Tong, Y.; Norse, D.; Lu, Y.; Powlson, D. Overcoming Nitrogen Fertilizer Over-Use through Technical and Advisory Approaches: A Case Study from Shaanxi Province, Northwest China. Agric. Ecosyst. Environ. 2015, 209, 89–99. [Google Scholar] [CrossRef]
  49. Ma, G.; Liu, W.; Li, S.; Zhang, P.; Wang, C.; Lu, H.; Wang, L.; Xie, Y.; Ma, D.; Kang, G. Determining the Optimal N Input to Improve Grain Yield and Quality in Winter Wheat with Reduced Apparent N Loss in the North China Plain. Front. Plant Sci. 2019, 10, 181. [Google Scholar] [CrossRef]
  50. Wang, H.; Zhang, Y.; Chen, A.; Liu, H.; Zhai, L.; Lei, B.; Ren, T. An Optimal Regional Nitrogen Application Threshold for Wheat in the North China Plain Considering Yield and Environmental Effects. Field Crops Res. 2017, 207, 52–61. [Google Scholar] [CrossRef]
  51. Ma, L.; Shi, L.; Wang, S.; Wang, K.; Zheng, W.; Li, Z.; Zhai, B. 15N Labelling of Cattle Manure Reveals the Distribution of Organic Fertiliser Nitrogen in a Winter Wheat System. Field Crops Res. 2022, 283, 108529. [Google Scholar] [CrossRef]
  52. Dordas, C. Variation in Dry Matter and Nitrogen Accumulation and Remobilization in Barley as Affected by Fertilization, Cultivar, and Source–Sink Relations. Eur. J. Agron. 2012, 37, 31–42. [Google Scholar] [CrossRef]
  53. Qin, X.; Zhang, F.; Liu, C.; Yu, H.; Cao, B.; Tian, S.; Liao, Y.; Siddique, K.H.M. Wheat Yield Improvements in China: Past Trends and Future Directions. Field Crops Res. 2015, 177, 117–124. [Google Scholar] [CrossRef]
  54. Sadras, V.O.; Lawson, C. Genetic Gain in Yield and Associated Changes in Phenotype, Trait Plasticity and Competitive Ability of South Australian Wheat Varieties Released between 1958 and 2007. Crop Pasture Sci. 2011, 62, 533–549. [Google Scholar] [CrossRef]
  55. Xiao, Y.G.; Qian, Z.G.; Wu, K.; Liu, J.J.; Xia, X.C.; Ji, W.Q.; He, Z.H. Genetic Gains in Grain Yield and Physiological Traits of Winter Wheat in Shandong Province, China, from 1969 to 2006. Crop Sci. 2012, 52, 44–56. [Google Scholar] [CrossRef]
  56. Montazeaud, G.; Karatoğma, H.; Özturk, I.; Roumet, P.; Ecarnot, M.; Crossa, J.; Özer, E.; Özdemir, F.; Lopes, M.S. Predicting Wheat Maturity and Stay–Green Parameters by Modeling Spectral Reflectance Measurements and Their Contribution to Grain Yield under Rainfed Conditions. Field Crops Res. 2016, 196, 191–198. [Google Scholar] [CrossRef]
  57. Sadras, V.O.; Mahadevan, M.; Zwer, P.K. Stay-Green Associates with Low Water Soluble Carbohydrates at Flowering in Oat. Field Crops Res. 2019, 230, 132–138. [Google Scholar] [CrossRef]
  58. Manschadi, A.M.; Soltani, A. Variation in Traits Contributing to Improved Use of Nitrogen in Wheat: Implications for Genotype by Environment Interaction. Field Crops Res. 2021, 270, 108211. [Google Scholar] [CrossRef]
  59. Feng, T.; Zhu, Y.-H.; Chai, N.; Zhang, X.-T.; Du, Y.-L.; Turner, N.C.; Du, P.; Li, F.-M. Increased Grain Yield in Modern Genotypes of Spring Wheat for Dryland Cultivation in Northwest China Is Associated with the Decreased Allocation of Carbon to Roots. Field Crops Res. 2023, 303, 109114. [Google Scholar] [CrossRef]
  60. Zhu, Y.-H.; Weiner, J.; Jin, Y.; Yu, M.-X.; Li, F.-M. Biomass Allocation Responses to Root Interactions in Wheat Cultivars Support Predictions of Crop Evolutionary Ecology Theory. Front. Plant Sci. 2022, 13, 858636. [Google Scholar] [CrossRef]
  61. Kindtler, N.L.; Sheikh, S.; Richardy, J.; Krogh, E.; Maccario, L.; Vestergård, M.; Da Fonseca, R.R.; Ekelund, F.; Laursen, K.H. Fertilizer Regime and Cultivar Affect Barley Growth and Rhizobiome Composition. Appl. Soil Ecol. 2024, 198, 105384. [Google Scholar] [CrossRef]
  62. Fageria, N.K. Nitrogen Harvest Index and Its Association with Crop Yields. J. Plant Nutr. 2014, 37, 795–810. [Google Scholar] [CrossRef]
  63. Gao, Z.; Xu, J.; Liu, S.; Tian, H.; Wang, Z. Variations of winter wheat nitrogen harvest index in field wheat population. Sci. Agric. Sin. 2021, 54, 583–595. [Google Scholar] [CrossRef]
  64. Afreh, D.; Zhang, J.; Guan, D.; Liu, K.; Song, Z.; Zheng, C.; Deng, A.; Feng, X.; Zhang, X.; Wu, Y.; et al. Long-Term Fertilization on Nitrogen Use Efficiency and Greenhouse Gas Emissions in a Double Maize Cropping System in Subtropical China. Soil Tillage Res. 2018, 180, 259–267. [Google Scholar] [CrossRef]
  65. Mueller, S.M.; Messina, C.D.; Vyn, T.J. Simultaneous Gains in Grain Yield and Nitrogen Efficiency over 70 Years of Maize Genetic Improvement. Sci. Rep. 2019, 9, 9095. [Google Scholar] [CrossRef]
  66. Duan, Y.; Xu, M.; Gao, S.; Yang, X.; Huang, S.; Liu, H.; Wang, B. Nitrogen Use Efficiency in a Wheat–Corn Cropping System from 15 Years of Manure and Fertilizer Applications. Field Crops Res. 2014, 157, 47–56. [Google Scholar] [CrossRef]
  67. Ren, K.; Sun, Y.; Zou, H.; Li, D.; Lu, C.; Duan, Y.; Zhang, W. Effect of Replacing Synthetic Nitrogen Fertilizer with Animal Manure on Grain Yield and Nitrogen Use Efficiency in China: A Meta-analysis. Front. Plant Sci. 2023, 14, 1153235. [Google Scholar] [CrossRef]
  68. Singh, D.K.; Pandey, P.C.; Nanda, G.; Gupta, S. Long-Term Effects of Inorganic Fertilizer and Farmyard Manure Application on Productivity, Sustainability and Profitability of Rice-Wheat System in Mollisols. Arch. Agron. Soil Sci. 2019, 65, 139–151. [Google Scholar] [CrossRef]
  69. Yaduvanshi, N.P.S. Substitution of Inorganic Fertilizers by Organic Manures and the Effect on Soil Fertility in a Rice–Wheat Rotation on Reclaimed Sodic Soil in India. J. Agric. Sci. 2003, 140, 161–168. [Google Scholar] [CrossRef]
  70. Caviglia, O.P.; Melchiori, R.J.M.; Sadras, V.O. Nitrogen Utilization Efficiency in Maize as Affected by Hybrid and N Rate in Late-Sown Crops. Field Crops Res. 2014, 168, 27–37. [Google Scholar] [CrossRef]
  71. Muurinen, S.; Slafer, G.A.; Peltonen-Sainio, P. Breeding Effects on Nitrogen Use Efficiency of Spring Cereals under Northern Conditions. Crop Sci. 2006, 46, 561–568. [Google Scholar] [CrossRef]
  72. De Oliveira Silva, A.; Ciampitti, I.A.; Slafer, G.A.; Lollato, R.P. Nitrogen Utilization Efficiency in Wheat: A Global Perspective. Eur. J. Agron. 2020, 114, 126008. [Google Scholar] [CrossRef]
  73. Connor, D.J. Land Required for Legumes Restricts the Contribution of Organic Agriculture to Global Food Security. Outlook Agric. 2018, 47, 277–282. [Google Scholar] [CrossRef]
  74. Connor, D.J. Analysis of Farming Systems Establishes the Low Productivity of Organic Agriculture and Inadequacy as a Global Option for Food Supply. Npj Sustain. Agric. 2024, 2, 2. [Google Scholar] [CrossRef]
Figure 1. Yield, biomass, harvest index (HI), and yield components as affected by fertilization, varieties, and growing season. Vertical bars show standard error (n = 3 per treatment). Different lowercase letters above the bars indicate significant differences among treatments within each season at p < 0.05.
Agronomy 15 01679 g001
Figure 2. Allometric coefficients as affected by fertilization, varieties and growing season. Vertical bars are standard error (n = 3 per treatment).
Agronomy 15 01679 g002
Figure 3. Water-soluble carbohydrate (WSC) content, translocation amount and translocation ratio as affected by fertilization, varieties and growing season. Vertical bars are standard error (n = 3 per treatment). Different lowercase letters above the bars indicate significant differences among treatments within each season at p < 0.05.
Agronomy 15 01679 g003
Figure 4. Stay-green traits: SPADmin, SPADmax, x50, rate, and area as affected by fertilization, varieties and growing season. Vertical bars are standard error (n = 3 per treatment). Different lowercase letters above the bars indicate significant differences among treatments within each season at p < 0.05.
Agronomy 15 01679 g004
Figure 5. The N uptake, N translocation, N translocation efficiency, N harvest index (NHI), N utilization efficiency (NutE), and partial factor productivity (PFP) as affected by fertilization, varieties, and growing season. Vertical bars are standard error (n = 3 per treatment). Different lowercase letters above the bars indicate significant differences among treatments within each season at p < 0.05.
Agronomy 15 01679 g005
Figure 6. Effect of fertilization and wheat varieties on the patterns of canopy senescence after anthesis during two growing seasons.
Agronomy 15 01679 g006
Table 1. Analysis of variance (ANOVA) for traits related to yield and its components, water-soluble carbohydrate (WSC), leaf senescence, and nitrogen (N). The results are from ANOVA testing effect of season, fertilization, variety and their interactions.
Season
(S)
Fertilization
(F)
Variety
(V)
S × FS × VF × VS × F × V
Yield (kg ha−1)0.1759<0.0001<0.00010.39370.00550.00340.0014
Biomass (kg ha−1)0.2055<0.00010.00220.00520.27190.03720.0022
Harvest index 0.0076<0.00010.00010.04540.38270.05780.3596
Grain number (m−2)<0.0001<0.0001<0.0001<0.00010.05580.03940.0185
Grain weight (g)<0.00010.0005<0.00010.55000.00130.29830.4438
WSC at anthesis (kg ha−1)<0.0001<0.00010.08040.03950.00840.40440.8819
WSC at maturity (kg ha−1)0.64490.01420.00350.49980.75890.44710.8342
WSC translocation amount (kg ha−1)<0.00010.00160.52830.15320.02360.45540.9090
WSC translocation ratio (%)<0.00010.43890.06350.62180.63360.53120.7508
SPADmin0.53920.10680.74620.00120.60450.52050.8948
SPADmax<0.0001<0.0001<0.00010.11150.07550.52780.0707
x50 (°Cd)0.4665<0.0001<0.00010.01400.09500.03340.0159
Rate (°Cd)0.70720.01840.51100.01630.29960.19280.7482
Area (°Cd)0.2426<0.0001<0.00010.18710.00340.00720.0152
Total N uptake at anthesis (kg ha−1)0.2955<0.00010.41500.22510.49770.02300.8531
Total N uptake at maturity (kg ha−1)<0.0001<0.00010.39600.30570.29060.05330.0126
N translocation (kg ha−1)0.4982<0.00010.21740.33090.35190.01890.9100
N translocation efficiency (%)0.30690.83140.00610.52220.09590.21760.9726
N harvest index<0.00010.17120.00050.42130.04510.90860.3196
N utilization efficiency (kg kg−1)<0.00010.00040.00190.42760.00050.95030.8259
Partial factor productivity (kg kg−1)0.3255<0.0001<0.00010.72480.0012<0.00010.0012
Table 2. Correlation matrix of yield, physiological, and nitrogen efficiency-related traits: grain yield (GY); thousand grain weight (TGW); grain number per square meter (GN/m2); dry matter at anthesis (DM ant); dry matter at maturity (DM mat); harvest index (HI); SPADmin; SPADmax; x50; rate; area; water-soluble carbohydrate at anthesis (WSC ant); water-soluble carbohydrate at maturity (WSC mat); water-soluble carbohydrate translocation amount (WSC amount); water-soluble carbohydrate translocation ratio (WSC ratio); total N uptake at anthesis (Nup ant); total N uptake at maturity (Nup mat); N harvest index (NHI); and N utilization efficiency (NutE) across two growing seasons. Bold indicates p < 0.05.
GYTGWGN/m2DM
ant
DM matHISPADmaxRatex50SPAD
min
AreaWSC
ant
WSC
mat
WSC
Amount
WSC
Ratio
Nup
ant
Nup
mat
NHI
−0.25 TGW
0.290.05 GN/m2
0.69−0.170.33 DM ant
0.86−0.190.340.95 DM mat
0.70−0.190.050.000.25 HI
0.76−0.200.010.310.520.75 SPADmax
0.260.210.040.420.39−0.080.14 rate
0.60−0.570.310.250.400.550.43−0.23 x50
0.20-0.100.120.180.190.110.310.35−0.07 SPADmin
0.80−0.470.290.380.570.710.810.020.850.30 area
0.20−0.34−0.800.110.140.210.300.07-0.010.050.10 WSC ant
-0.030.07−0.220.430.28−0.43−0.370.28−0.31−0.21−0.410.28 WSC mat
0.20−0.36−0.790.070.110.260.350.040.020.070.140.990.18 WSC amount
0.22−0.36−0.58−0.15-0.020.490.55−0.200.200.220.380.74−0.390.81 WSC ratio
0.85−0.190.420.710.810.480.700.270.530.370.770.04−0.130.050.11 Nup ant
0.89−0.300.010.600.760.640.830.290.490.190.740.41−0.010.420.390.80 Nup mat
0.000.13−0.66−0.34−0.250.370.15−0.11−0.15−0.17−0.120.560.000.580.51−0.230.07 NHI
−0.150.220.49−0.10−0.14−0.12−0.43−0.180.06−0.12−0.15−0.56−0.08−0.57−0.45−0.22−0.57−0.13NutE
Color legend: Agronomy 15 01679 i001.
Disclaimer/Publisher’s Note: The statements, opinions and data contained in all publications are solely those of the individual author(s) and contributor(s) and not of MDPI and/or the editor(s). MDPI and/or the editor(s) disclaim responsibility for any injury to people or property resulting from any ideas, methods, instructions or products referred to in the content.