Article

Evaluating of Four Irrigation Depths on Soil Moisture and Temperature, and Seed Cotton Yield Under Film-Mulched Drip Irrigation in Northwest China

1
College of Water Conservancy and Civil Engineering, Shandong Agricultural University, Tai’an 271018, China
2
Shandong Key Laboratory of Agricultural Water-Saving Technology and Equipment, Shandong Agricultural University, Tai’an 271018, China
3
Tai’an Hydrological Center, Tai’an 271018, China
4
Key Laboratory of Agricultural Soil and Water Engineering in Arid and Semiarid Areas of the Ministry of Education, Northwest A&F University, Yangling 712100, China
*
Authors to whom correspondence should be addressed.
Agronomy 2025, 15(7), 1674; https://doi.org/10.3390/agronomy15071674
Submission received: 12 June 2025 / Revised: 7 July 2025 / Accepted: 8 July 2025 / Published: 10 July 2025

Abstract

Soil mulching and irrigation are critical practices for alleviating water scarcity and enhancing crop yields in arid and semi-arid regions by regulating soil moisture and soil temperature. Clarifying the effects of various irrigation depths on soil moisture and temperature under mulched condition is essential for optimizing irrigation strategies. This study investigated the effects of four irrigation depths based on crop evapotranspiration (ETc): 60, 80, 100, and 120% (W0.6, W0.8, W1.0, and W1.2, respectively) on the soil moisture content (SMC), soil temperature and seed cotton yield in mulched cotton fields. Results revealed that when the irrigation depth increased from 60%ETc to 120%ETc, seed cotton yield increased by 12.04% in 2018 and 17.00% in 2019 at the cost of irrigation water use efficiency (IWUE), which decreased from 2.53 kg m−3 to 1.54 kg m−3 in 2018 and 2.60 kg m−3 to 1.58 kg m−3 in 2019. Soil temperature exhibited a temporal trend of initial increase followed by decline, and it was positively affected by soil mulching. Notably, W0.6 treatment maintained significantly higher soil temperature than other treatments. Soil moisture content was positively affected by irrigation depth, while soil water storage first decreased and then increased over time, reaching the minimum at the flowering and boll setting stages during the two growing seasons. Higher irrigation amount reduced the total spatial variability (C0 + C) of soil but did not significantly alter the distribution characteristics of soil moisture, as indicated by stable coefficients of variation (CVs) and stratification ratios (SRs). The variability of soil moisture diminished with soil depth with the lowest CV obtained at a 60 cm soil layer across the growth stages. Correlation analysis results showed that the seed cotton yield was mainly affected by irrigation depth and soil water storage. Soil temperature at the flowering and boll setting stage negatively affected seed cotton yield and was inversely correlated with soil water storage. The structural equation model (SEM) further indicated that both soil water storage and soil temperature primarily influenced seed cotton yield boll weight rather than boll number. Furthermore, 100%ETc (W1.0) can be considered as the recommended irrigation depth based on the soil moisture and temperature, seed cotton yield and water use efficiency in this region.

1. Introduction

As an important raw material for the textile industry, cotton is widely grown under irrigated condition around the world [1]. Xinjiang has become the biggest cotton-producing area in China, benefiting from the promotion of advanced drip irrigation technology and abundant light-rich resources [2]. However, the water shortage in Xinjiang severely inhibits the development of cotton industry [3], and the imbalance of water supply and demand caused by the increase in cotton planting area has exacerbated the water shortage in this region [4]. In order to alleviate the impact of water shortage on the cotton industry, mulched drip irrigation was introduced into Xinjiang in the 1990s [5,6]. Currently, there is more than 2 million ha of cotton irrigated under mulched drip irrigation in Xinjiang, occupying 58.5% of the planting area and 71% of the total cotton yield in this region [7,8].
Deficit irrigation, or regulated deficit irrigation, is defined as an irrigation technique that optimizes production by using irrigation amount below the full crop water requirement [9], and it is a common measure to alleviate water shortage in arid and semi-arid regions. Some researchers indicated that proper deficit irrigation was feasible to improve crop water productivity by reducing irrigation amount while maintaining a stable yield level [10,11]. However, the results acquired from previous studies that investigated the effect of deficit irrigation on seed cotton yield and water productivity were inconsistent due to the differences in experimental and environmental factors [12]. For instance, some researchers revealed that deficit irrigation significantly increased water productivity but reduced seed cotton yield [13,14], and others indicated that seed cotton yield slightly reduced or rarely affected under deficit irrigation conditions [15,16]. In addition to crop yield and water productivity, the soil moisture content and soil temperature were directly affected by irrigation amount.
As the main vector of elements in the Soil–Plant–Atmosphere Continuum (SPAC) system, the accurate evaluations of the content and distribution of soil moisture are critical for estimating soil water and energy balance [17]. Some studies confirmed that the deeper soil moisture content was affected by the increase in irrigation amount [18,19]. Bogena et al. [20] pointed out that the spatial variability of soil moisture decreased with the increase in irrigation amount. Bittelli et al. [21] revealed that the reason for the high variations in surface soil moisture was that water vapor can freely cross the soil–atmosphere interface, which has an adverse effect on seed germination and crop growth [22], and mulching can effectively reduce the fluctuation of surface soil moisture and temperature by forming an isolation layer between the soil surface and the atmosphere [23,24].
As we know, the distribution of soil moisture depends on precipitation, irrigation practices, soil evaporation and root water uptake [25], in which soil evaporation and root water uptake are affected by soil mulching, which can prevent soil moisture from evaporating into the atmosphere, reduce soil evaporation, increase soil moisture [26], and then improve the growth and yield formation of crops. Meanwhile, the vigorous growth of crops under plastic film mulching increase crop root water uptake to reduce soil moisture content [27]. Therefore, more complex soil water variations appear under mulched condition. Furthermore, in Xinjiang with sufficient sunlight and temperature varying widely from day to night, the effect of mulching on soil temperature cannot be ignored. Fan et al. [28] found that the 2~3 °C increase within 20 cm soil depth was observed under transparent film mulching conditions. It can be seen that the suitable moisture and temperature conditions can be created by film mulching, thereby ensuring the growth and yield formation of crops.
Soil moisture dynamic in an agricultural environment becomes more complicated due to the variation in soil property and vegetation cover caused by agricultural activities, such as irrigation, mulching, crop rotation, etc. [29]. However, many researchers have analyzed the soil moisture dynamic on large scales with spatial and temporal measurements [30,31], but few have studied the agricultural environment [32,33]. Clarifying the soil moisture dynamic in a specific area and time of the farmland can determine the occurrence locations and times of water stress and help managers choose the correct timing and amount of irrigation activities [34]. Meanwhile, studying the water flow and heat transports in the soil under drip irrigation with plastic mulch is necessary to evaluate whether agricultural water management strategies are reasonable. The objective of this study was to clarify the variation characteristics of soil moisture and soil temperature in drip-irrigated cotton fields under various irrigation depths, elucidate the influence mechanism of soil moisture and soil temperature on seed cotton yield and water utilization, and determine the irrigation regime suitable for cotton production in arid regions.

2. Materials and Methods

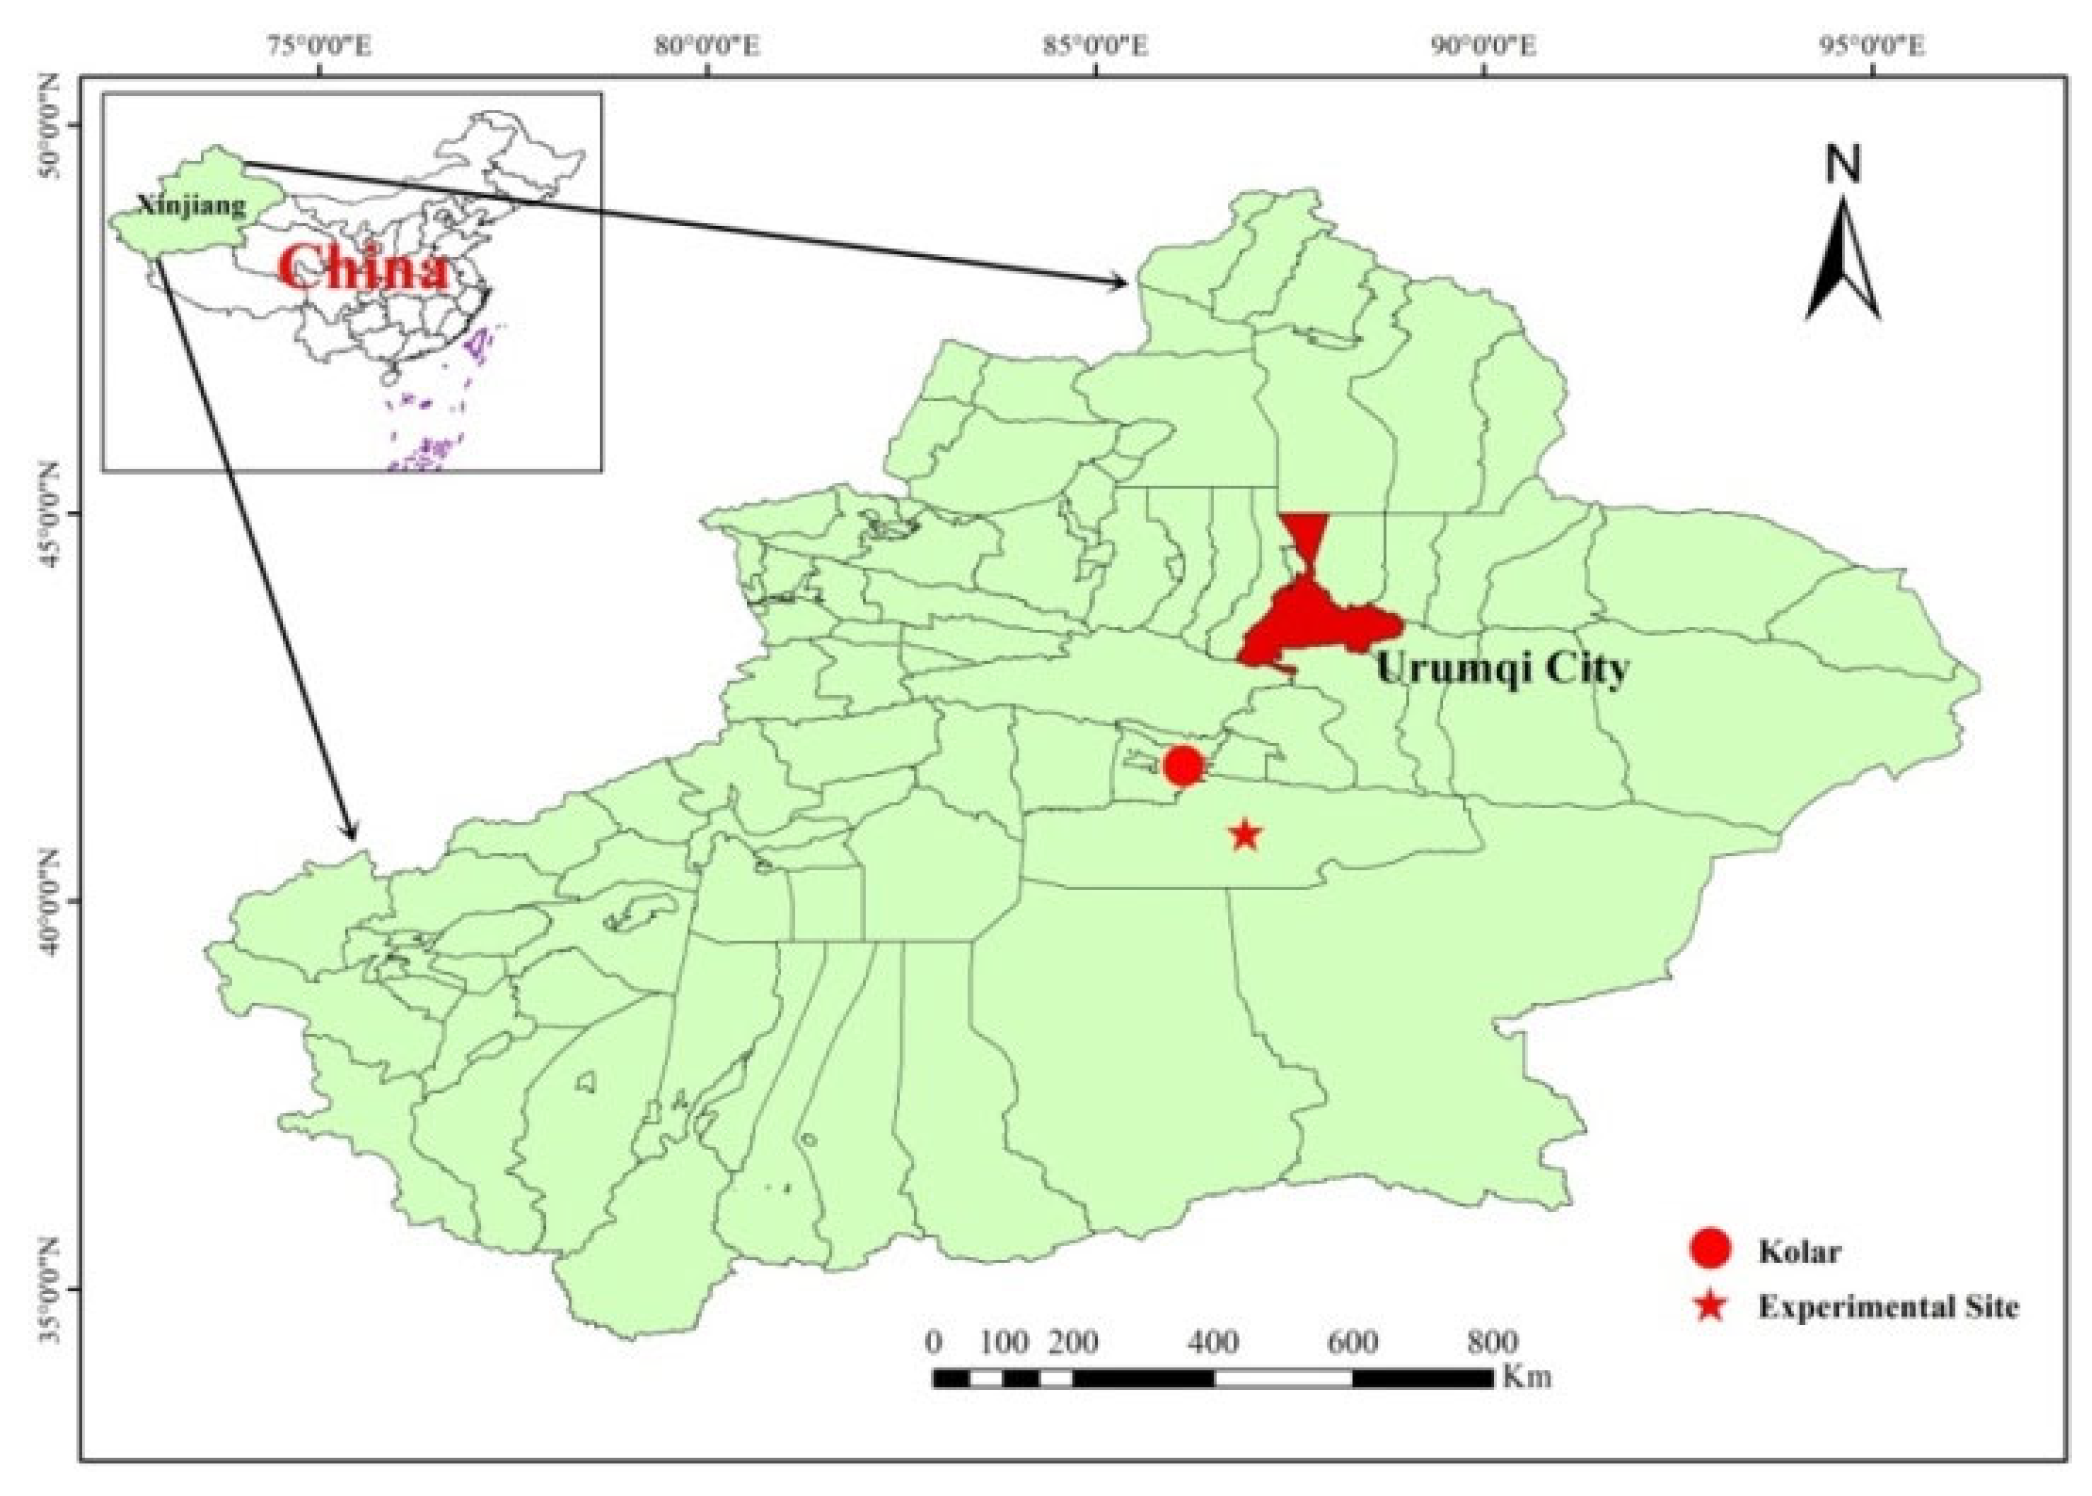
2.1. Experiment Site Description

The field experiment was conducted on cotton variety (Gossypium hirstum L.) at the experimental station located in Korla (40°53′ N, 86°56′ E), Xinjiang, China (Figure 1) in 2018 and 2019. The site has an altitude of 900 m above mean sea level and belongs to an arid region with a mean annual temperature of 11 °C, an average annual rainfall of 56 mm and the mean annual pan evaporation of 2500 mm. The site has long sunlight hours with the mean annual sunshine duration over 2900 h and frost-free period of 190 days. The climatic variables (rainfall, air temperature and radiation) are shown in Figure 2. The total rainfall during the cotton growing season was 18.6 mm in 2018 and 22.8 mm in 2019. The detailed information of soil layers (0–10, 10–20, 20–30, 30–40, 40–60, 60–80 cm) are provided in Table 1. The groundwater level during cotton growing stage was 1.2~1.6 m in the test site.

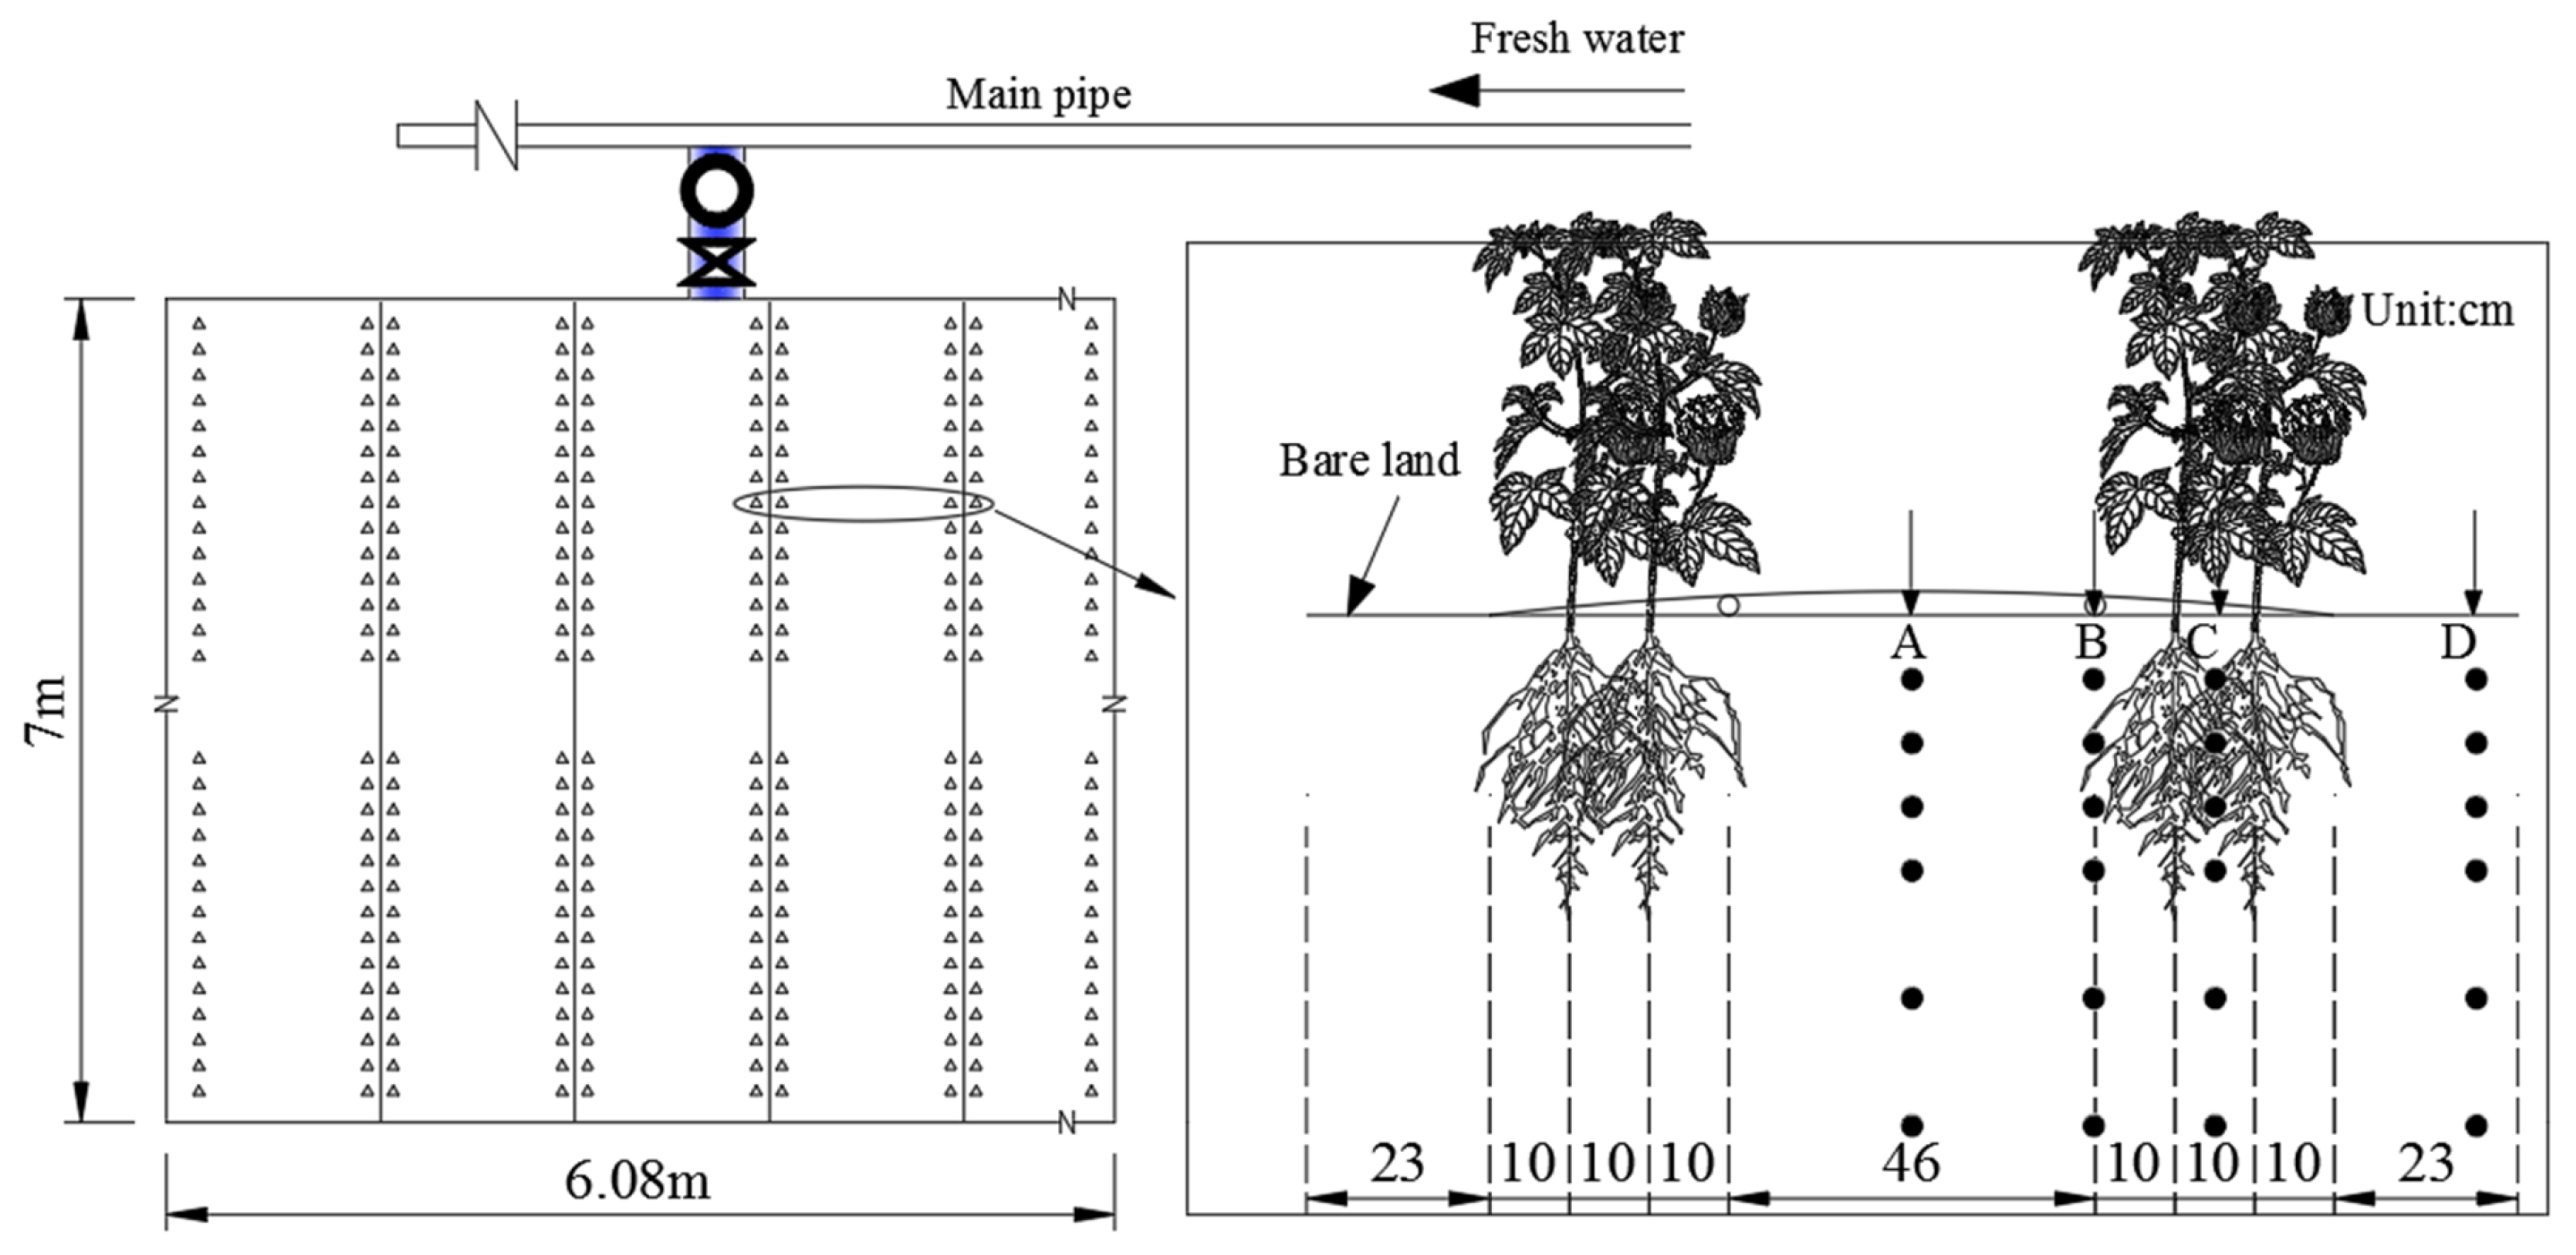
2.2. Experimental Design

In this experiment, four irrigation depths were evaluated based on crop evapotranspiration (ETc): 60, 80, 100, and 120% (W0.6, W0.8, W1.0, and W1.2, respectively). The experiment was conducted in a randomized plot design with three replicates. The crop water requirement (ETc, mm day−1) was estimated using Equation (1).
E T c = E T 0 × K c
where E T 0 is the reference crop evapotranspiration (mm day−1), and K c is the crop coefficient. According to Allen et al. [35], K c at the initial, mid and end-season stages were 0.30, 1.15 and 0.70, respectively. However, Kc was adjusted to 0.75, 1.15 and 0.70 considering the specific climate of the experiment site. Daily E T 0 was computed according to the FAO-56 Penman–Monteith equation [35].
During the growing seasons, cotton was irrigated using the drip irrigation system with water from a channel with a salinity of 0.7 g L−1. Four rows of cotton were sown under a single 1.06 m wide plastic film strip with a row spacing of 0.10 m + 0.66 m + 0.10 m, and the laterals were laid at 0.1 m intervals to two adjacent inner rows (Figure 3). The cotton seeds were sown 0.1 m apart in each bed and about 0.1 m away from the drip line (the material of the drip line was low-density polyethylene and the discharge rate was 2.4 L h−1 with the emitter interval of 0.3 m) at 0.05 m soil depth (Figure 3). Sowing was carried out on 12 April 2018 and 11 April 2019 with a plant density of 225,000 plants ha−1. Pests and weeds control followed the conventional practices in the experimental area.
In order to ensure the survival of cotton seedlings, irrigation was performed on 15 June (seeding stage) with irrigation depths of 33 mm in 2018 and 15 mm in 2019 and terminated on 27 August (boll opening stage) in both years. The cotton plants were irrigated at intervals of 7 days according to the tested irrigation depths. Nitrogen (urea, N ≥ 46%), potash (diammonium phosphate, P2O5 ≥ 46%) and phosphate (crystal potash fertilizer, K2O ≥ 62%) fertilizers were fertigated to the cotton field through drip irrigation systems using a pressure differential tank during the cotton growing season. The information of fertigation practices is shown in Figure 4. The accumulative irrigation depths of W0.6, W0.8, W1.0, and W1.2 were 219.20, 281.26, 343.33, and 405.40 mm in 2018 and 196.18, 256.57, 316.97, and 377.36 mm in 2019, respectively (Figure 4).

2.3. Sampling and Measurement

2.3.1. Weather Data

Air temperature, precipitation, wind speed, and solar radiation were recorded by an automated weather station located at the experimental field.

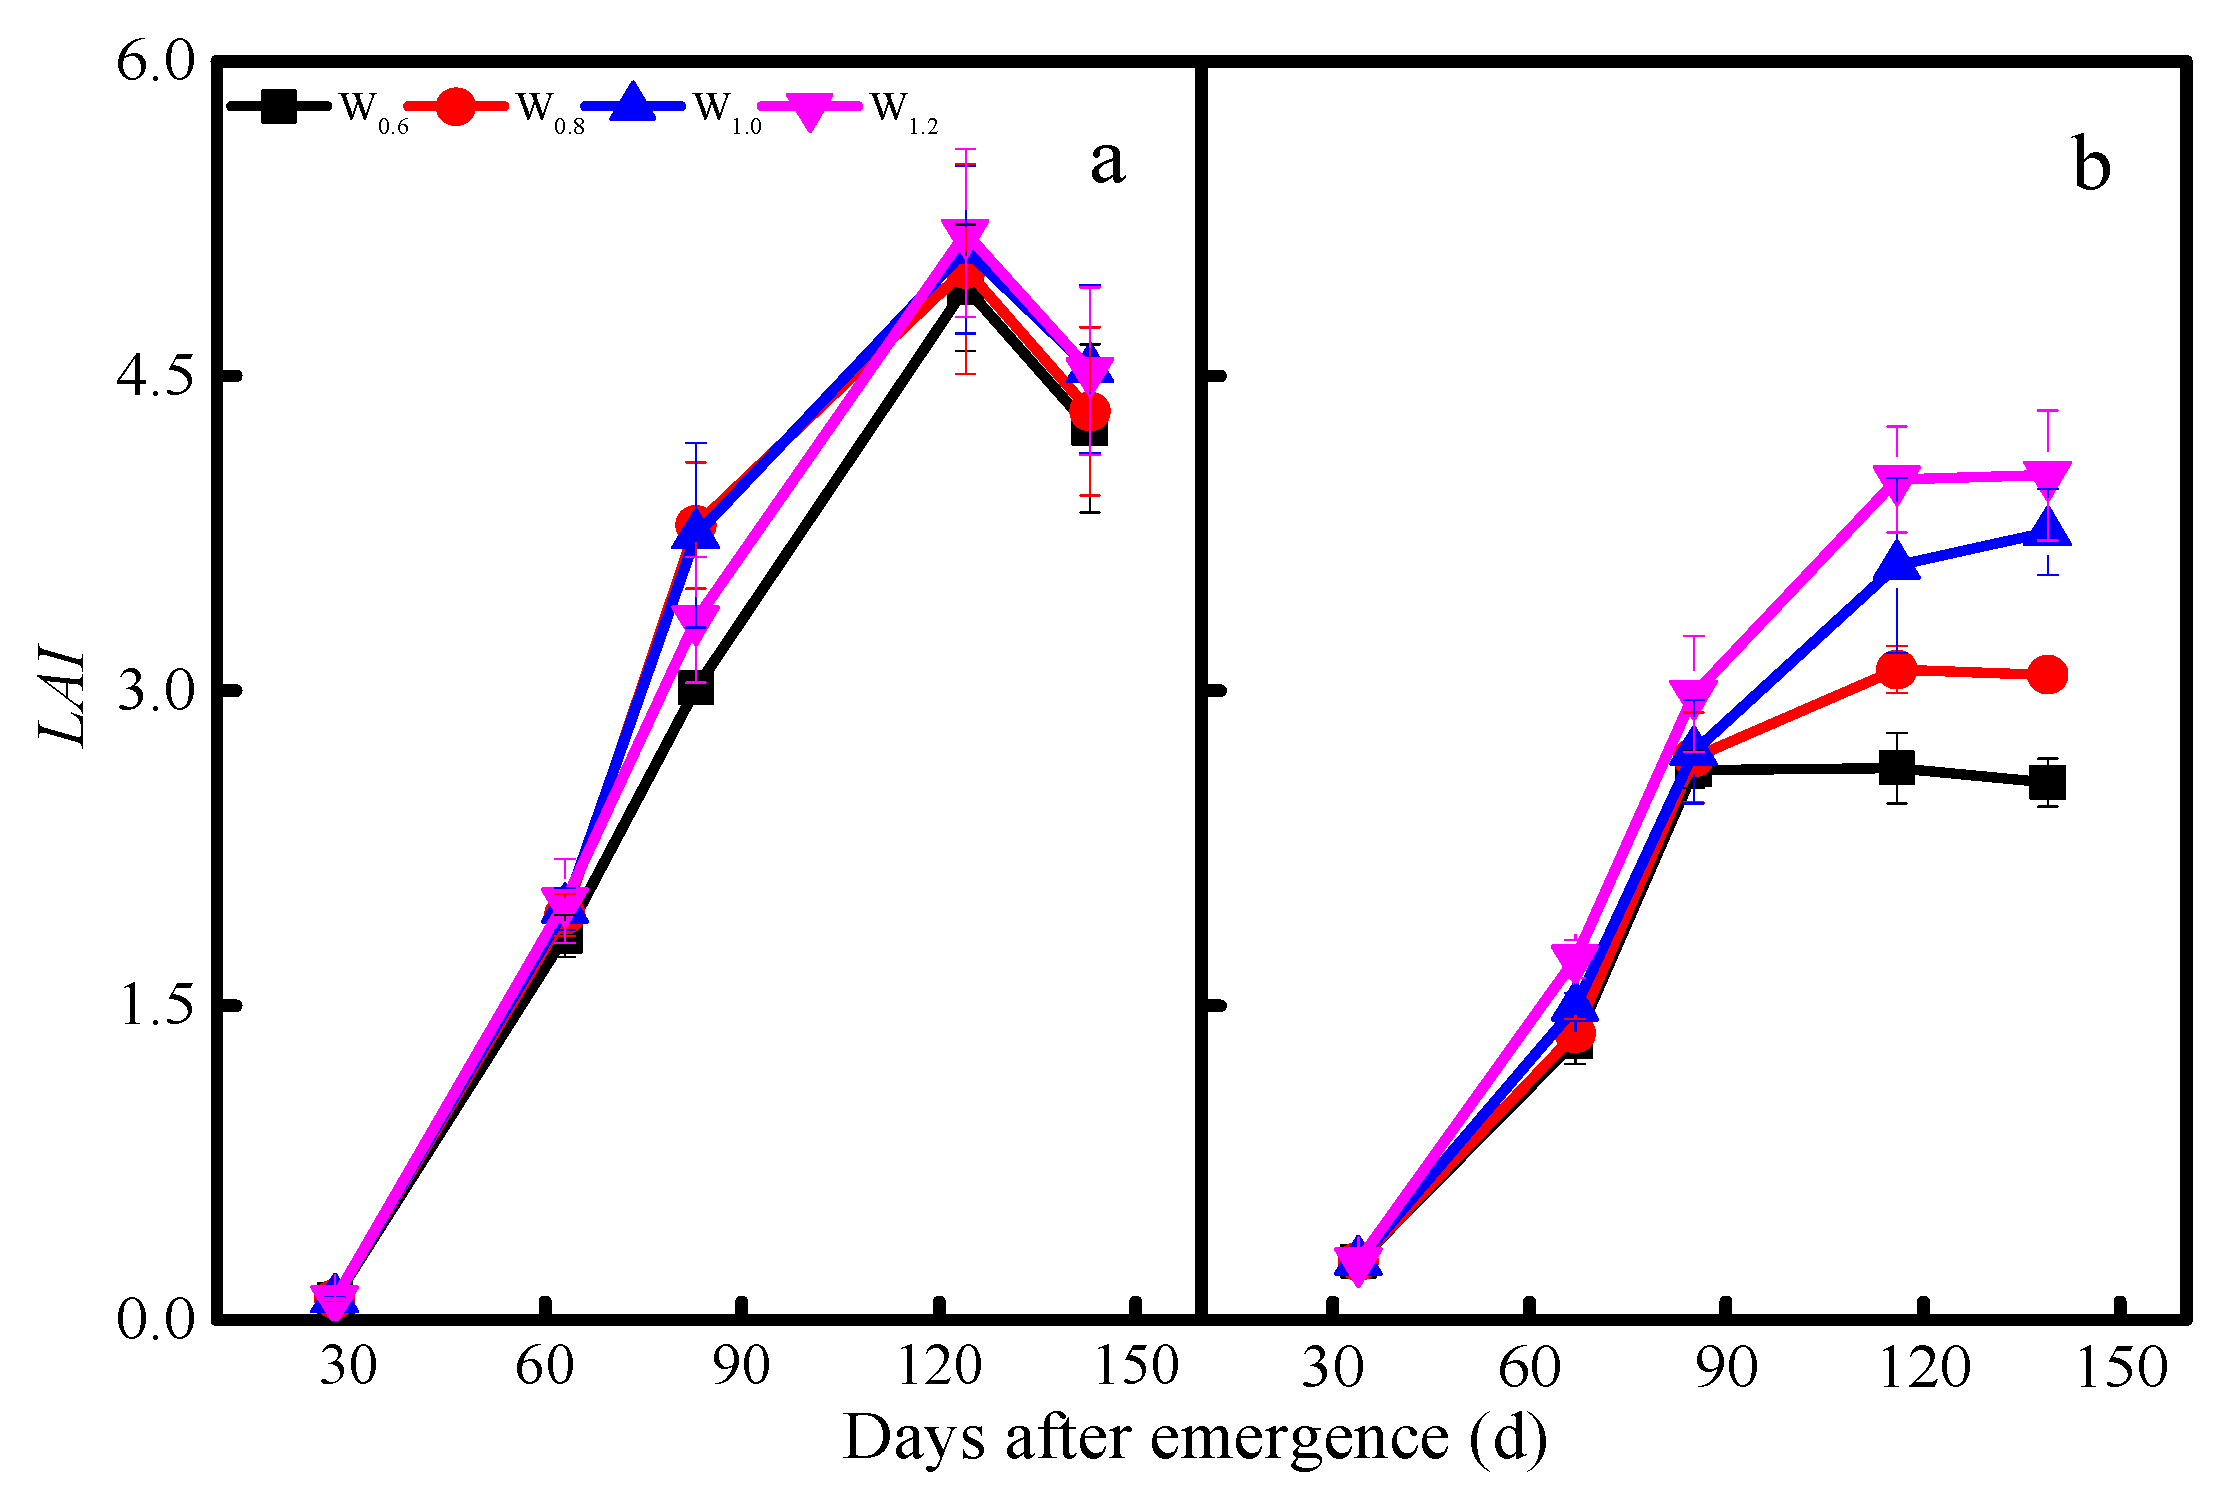
2.3.2. Leaf Area Index and Seed Cotton Yield

At the seeding, budding, flowering, boll setting and boll opening stages, four representative cotton plants were randomly selected in each plot. The punch method [36] was used to measure the leaf area, and then we determined the leaf area index ( L A I ) using Equation (2) [37].
L A I = T o t a l   a r e a   o f   t h e   l e a f O c c u p i e d   l a n d   a r e a
At the maturity stage (on 17 September in 2018 and 2019), five 1.00 m × 1.52 m areas were randomly selected in each plot to harvest by hand. The seeds were fully dried and then weighted to obtain the seed cotton yield.

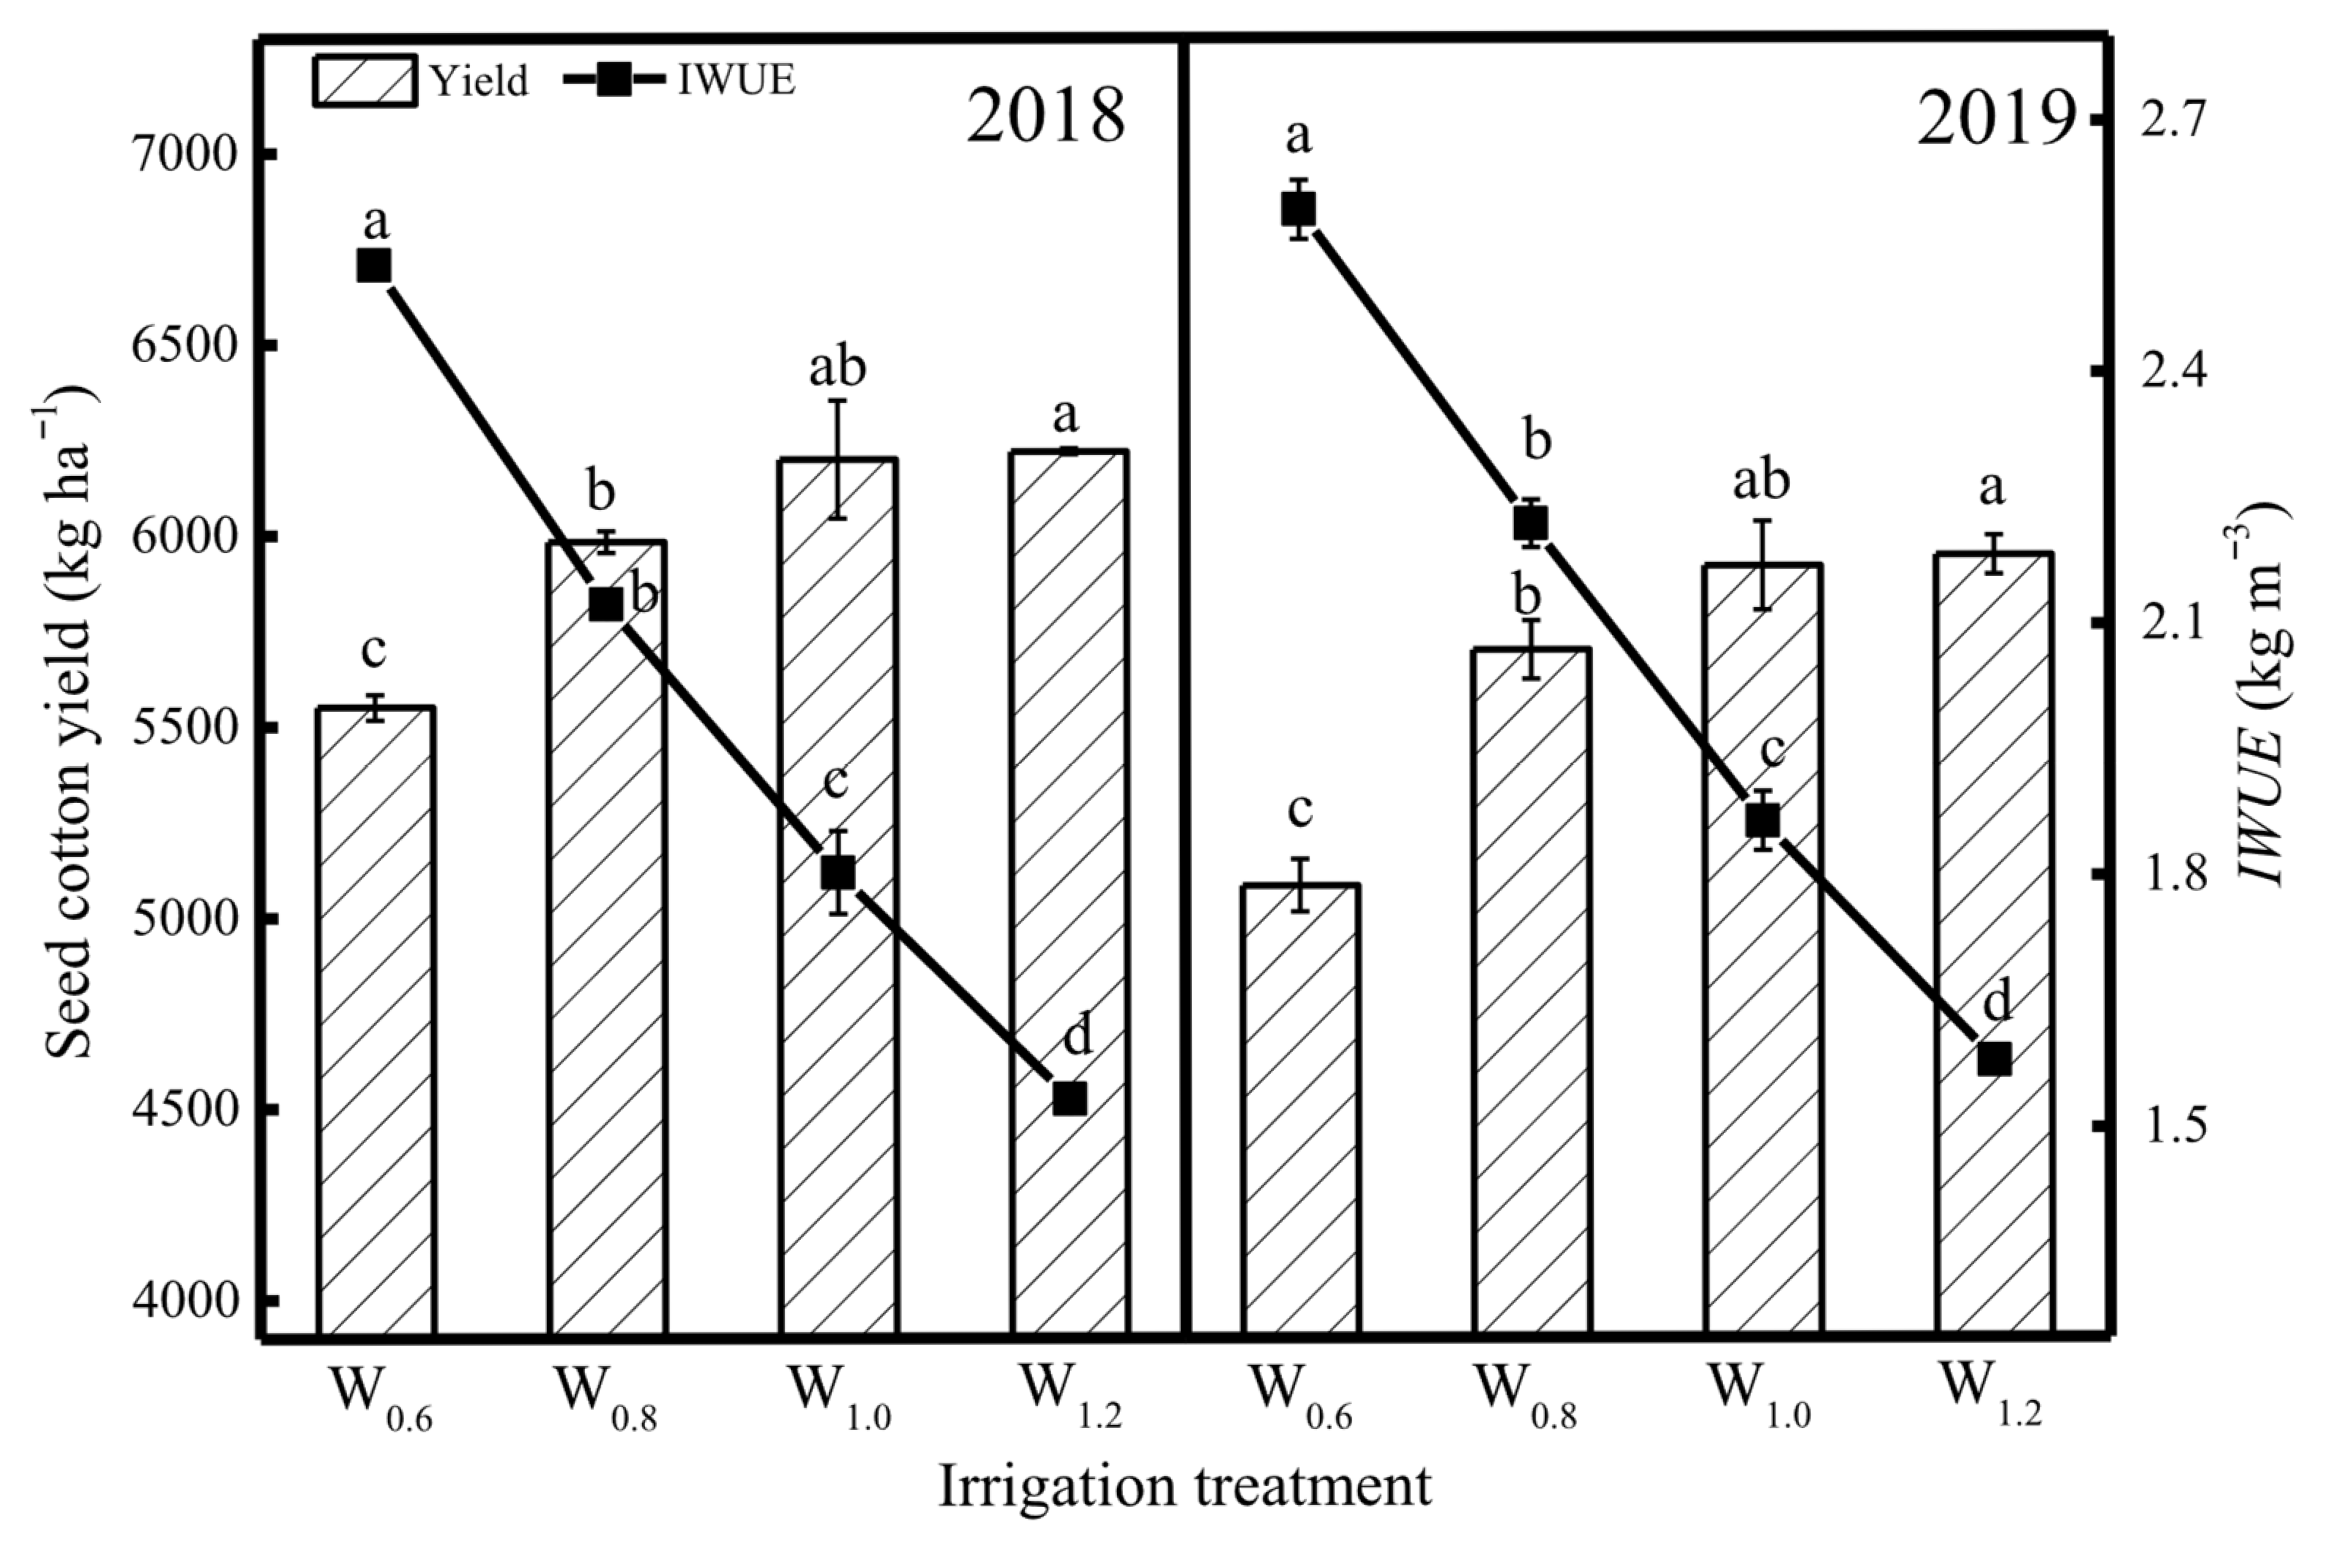
2.3.3. Irrigation Water Use Efficiency

Irrigation water use efficiency ( I W U E , kg m−3) was calculated using Equation (3).
I W U E = Y 10 I
where Y is the seed cotton yield (kg ha−1), and I is the irrigation depth (mm).

2.3.4. Measurement of Soil Temperature

For studying the variation in soil temperature at each growth stage of cotton under different irrigation treatments, measurements were carried out during the whole growing season at 20:00 (Beijing time, same as below) every day using a right-angle geothermometer. Meanwhile, soil temperature at each growth period was continuously measured at fixed time points (8:00, 10:00, 12:00, 14:00, 16:00, 18:00 and 20:00) to study the diurnal change in soil temperature. The places of the installation of the right-angle geothermometer were in the middle of the film and in the middle of the bare land (location A,D in Figure 3) at soil depths of 5, 10, 15, 20, and 25 cm in various irrigation treatments to monitor the soil temperature.

2.3.5. Measurement of Soil Moisture

In order to determine soil moisture contents (SMCs), soil samples were collected at 10 cm intervals in the top 0~40 cm soil layer and at 20 cm intervals in the 40~60 cm soil layer at different growth stages under various irrigation treatments in each replicated plot. The soil moisture content was obtained gravimetrically by drying the soil samples in an oven at 105 °C until their weights were constant. The places of soil profiles in various irrigation treatments were in the middle of the film, under the drip lines, between the two cotton rows, and in the middle of the bare land (location A–D in Figure 3). The soil moisture storage ( S , mm) and soil moisture consumption ( S , mm) were determined by using Equations (4) and (5), respectively.
S = ρ × θ × d × 10
S = S 1 S 2
where ρ is the soil bulk density (g cm−3), θ is the soil moisture content (g g−1), d is the soil depth (cm), S 1 is the soil moisture content before the experiment or growth stage (mm), and S 2 is the soil moisture content after the experiment or growth stage (mm).

2.3.6. Variability of Soil Moisture

The coefficient of variation (CV) and stratification ratio (SR) of soil moisture were used to describe the lateral and vertical variation in soil moisture using Equations (6) and (7), respectively [38].
C V = σ A
S R = S W C 20 40 S W C 0 20
where σ and A are the standard deviation and average value of moisture. S W C 20 40 and S W C 0 20 are the soil moisture content (g g−1) at the 0~20 cm and 20~40 cm depths, respectively. Generally, CV ≤ 0.1 is considered as weak variability, 0.1 < CV < 1 is considered as moderate variability, and CV ≥ 1 is considered as strong variability [39].
Variograms in geostatistics are frequently used to characterize the spatial distribution structure of regionalized variables, which can effectively reflect and describe the properties of regionalized variables [40,41]. The spatial structure of soil moisture was studied using the experimental semivariogram by Equation (8).
γ h = 1 2 N ( h ) i = 1 N ( h ) [ z ( x i ) z ( x i + h ) ] 2
where z ( x i ) and z ( x i + h ) are the soil moisture at locations x i and x i + h , and N ( h ) is the number of pairs of points separated by a vector h . A better fitting result was found in the Gaussian model using the SMC.GS+9.0 software (Gamma Design Software, LLC., Westland, MI, USA), and the Gaussian model is represented by Equation (9).
γ h = C 0 + C ( 1 e 3 h 2 A 2 )
where C0 reflects the randomness of regionalized variables, C0 + C characterizes the total variability of the system, A represents the autocorrelation change scale of the variable, and C0/(C0 + C) can be used to express the proportion of the spatial variability caused by random factors in the total variability of the system, and it can also reflect the degree of correlation of the variables. Generally, C0/(C0 + C) < 25% indicates that variables have strong spatial autocorrelation, 25% < C0/(C0 + C) < 75% indicates that variables have moderate spatial autocorrelation, C0/(C0 + C) > 75% indicates that variables have weak spatial autocorrelation [42].

2.4. Structural Equation Model

As a sophisticated multivariate technique, structural equation modeling (SEM) offers comprehensive capabilities for examining complex relationship among variables. This approach not only investigate the direct effects on response variables but also incorporates predictors (including latent variables as potential drivers), mediating variables, and the interaction between predictors. Consequently, SEM has become an invaluable tool for analyzing intricate variable relationships across various research domains. We established a causal relationship hypothesis among a set of variables within the SEM framework grounded in established theoretical hypothesis. The model was subsequently fitted using sample data with parameters estimated through maximum likelihood estimation. To evaluate model fit, we employed multiple robust indices: the chi-square/degree values (CHI/DF, χ2/df), goodness-of-fit index (GFI), comparative fit index (CFI), non-normed index (NFI), and root mean square error of approximation (RMSEA). Following conventional standards [43], a satisfactory model fit is indicated by χ2/df < 3, RMSEA < 0.05, and GFI, CFI, and NFI values approaching 1. If the initial simulation results are inadequate, the number of variables and the path relationship can be adjusted to re-fit the model until the requirements of model fitting parameters are met [43]. The relationships between the variables were ultimately reflected by the standardized path coefficients.

2.5. Statistical Analysis

One-way analysis of variance (ANOVA) was performed using the multivariate analysis in SPSS Statistics 23 software (SPSS Inc., Chicago, IL, USA) to evaluate the influence of irrigation depth on seed cotton yield, irrigation water use efficiency, soil moisture and soil temperature. The model included all main effects and two-way interactions. Factor levels within a specific level of another factor were compared using one-way ANOVA by Duncan’s multiple range tests at p < 0.05 or p < 0.01. Origin 9.0 software (OriginLab., Northampton, MA, USA) was used to draw the figures related to cotton growth, soil temperature and SMC. GS+9.0 software (Gamma Design Software, LLC., Westland, MI, USA) was used to fit variogram function models. AMOS 28.0 software (SPSS Inc., Chicago, IL, USA) and SPSS Statistics 23 software (SPSS Inc., Chicago, IL, USA) were used to establish the structural equation model (SEM).

3. Results

3.1. Air Temperature and Radiation

The daily air temperature and solar radiation in the two seasons are shown in Figure 2. In 2018, the average monthly air temperature was 15.98, 20.91, 26.16, 26.35, 25.87, and 19.34 °C in April, May, June, July, August, and September, respectively. The values in 2019 were 18.84, 20.88, 25.09, 27.11, 26.36, and 22.29 °C, respectively. In 2018, the monthly solar radiation was 206.98, 247.15, 238.73 and 208.08 W m−2 in June, July, August, and September, respectively. The values in 2019 were 246.57, 249.04, 227.36, and 213.58 W m−2, respectively. It can be concluded that the air temperature and radiation first increased and then decreased over time, and the maximum values of air temperature and radiation all appeared in July.

3.2. Leaf Area Index, Seed Cotton Yield, and Irrigation Water Use Efficiency

The leaf area index (LAI) first increased and then decreased over time in 2018, and the highest LAI was obtained at the boll setting stage (120 days after emerge -DAE). The LAI under W0.6, W0.8, W1.0, and W1.2 treatments at the boll setting stage were 4.92, 5.01, 5.10, and 5.18. The LAI at the boll opening stage decreased compared with that at the boll setting stage due to the senescence of leaves. In 2019, LAI in some treatments increased at the boll opening stage compared with that at the boll setting stage, but the increase did not reach a significant level (W1.0 and W1.2 treatments). As can be seen in Figure 5, there was a significant difference in LAI during the 2018–2019 growing seasons due to the change in weather condition, but the LAI increased with the increase in irrigation depth during the two seasons. The LAI at the boll opening stage increased from 4.25 to 4.52 when the irrigation depth increased from 60% ETc to 120% ETc in 2018, and the LAI in 2019 increased from 2.56 to 4.03.
The changes of seed cotton yield and IWUE under different irrigation depths in the two growing seasons are shown in Figure 6. The seed cotton yield increased with the increase in irrigation amount, and there was no significant difference in seed cotton yield under W1.0 and W1.2 treatments. The highest seed cotton yield was found under W1.2 treatment, 6218.07 kg ha−1 in 2018 and 5660.59 kg ha−1 in 2019, which was higher 0.32~12.04% in 2018 and higher 0.47~17.00% than that under the other three irrigation treatments, respectively. It can be seen from Figure 6 that the significant difference in irrigation water use efficiency (IWUE) among various irrigation depths was found, and the IWUE continued to decrease with the increase in irrigation depth. The IWUE decreased from 2.53 kg m−3 to 1.54 kg m−3 when the irrigation depth increased from 60% ETc to 120% ETc in 2018, and the corresponding irrigation water use efficiency decreased from 2.60 kg m−3 to 1.58 kg m−3 in 2019.

3.3. Soil Temperature

3.3.1. Temporal Variation in Soil Temperature

The temporal variations in daily soil temperature at 0–15 cm and 15–25 cm below the soil surface under various irrigation depths are shown in Figure 7. A similar trend to air temperature was obtained in soil temperature over time in the two growing seasons. The soil temperature first slightly increased and then decreased over time in the two growing seasons, and there was a slight increase in the soil temperature at the late growth stage in 2018. In 2018, the average soil temperature under mulched areas (0–25 cm) was 29.75 °C at 20–50 DAE, 25.43 °C at 50–80 DAE and 24.97 °C at 80–110 DAE, and the values in 2019 were 28.24, 27.16 and 23.68 °C. The soil temperature decreased with the increase in soil depth. The soil temperature at 15–25 cm was significantly lower than that at 0–15 cm due to less impact from solar radiation and air temperature. The average soil temperature at 0–15 cm soil depth was 28.34 °C in 2018 and 28.68 °C in 2019, which was 12.92% and 13.80% higher than that at 15–25 cm soil depth in 2018 and 2019. The soil temperature under W0.6 displayed larger fluctuations compared with that under other three irrigation amounts, especially in 2019. Increasing the irrigation depth reduced the soil temperature through affecting the LAI. The average soil temperatures at 0–15 cm and 15–25 cm were 29.02 °C and 25.62 °C, 28.12 °C and 24.82 °C, 27.82 °C and 25.05 °C, and 28.40 °C and 24.90 °C under W0.6, W0.8, W1.0, W1.2 in 2018, and the values in 2019 were 30.60 °C and 26.60 °C, 27.98 °C and 24.44 °C, 27.93 °C and 24.66 °C, and 28.22 °C and 25.11 °C.

3.3.2. Daily Variation in Soil Temperature

The data showed that the air temperature had a great impact on the daily variation in the soil temperature (Figure 8). A similar trend to that of air temperature was obtained for the soil temperature over time. The soil temperature was higher than the air temperature at the seeding stage, while it was lower than the air temperature after the seeding stage. The soil temperature under W0.6 treatment was significantly higher than those under the other three irrigation depths, and the difference gradually increased as the growth period progressed, especially in 2019. The minimum soil temperature in each treatment all appeared at 8:00, while the highest daily soil temperature appeared at different times at different growth stages. For instance, the maximum soil temperature appeared at 16:00 at the seeding stage, while it appeared between 12:00 and 14:00 at the budding stage and at 12:00 at the flowering and boll setting stage. The soil temperature under mulched areas was significantly higher than that under non-mulched areas, but the change trend of the two over time was the same. The difference between the soil temperature under mulched and non-mulched areas increased as the growth period progressed.

3.3.3. The Effects of Various Irrigation Depths on Soil Temperature at Different Growth Stages

The soil temperatures of different soil layers at different growth stages under various irrigation amounts are shown in Figure 9. Growth stage had a significant impact on the soil temperature in different soil layers. Irrigation depth did not have a significant impact on soil temperature in 2018, while it significantly influenced soil temperature in 2019. The soil temperature in each treatment first decreased and then slightly increased over time, and the greater increase in soil temperature was obtained at the late growth stage in 2018 compared to that in 2019. The more significant decrease was found in soil temperature at the surface soil layer than that at the deeper soil layer over time. The maximum soil temperature was obtained at the seeding stage in the two seasons, and the minimum soil temperature appeared at the flowering and boll setting stage or the boll opening stage. It can be seen from Figure 9 that the soil temperature was not significantly affected by irrigation depth at the seeding stage and boll opening stage in 2018 and 2019, but higher soil temperatures were observed under deficit irrigation conditions (W0.6 and W0.8 treatments) at the budding stage and flowering and boll setting stage.

3.4. Soil Moisture

3.4.1. Distribution of Soil Moisture

The data collected at different cotton growing stages to show the distribution of soil moisture under drip irrigation at various locations from the emitter are presented in Figure 10. The results showed that the SMC in the 0–40 cm soil layer significantly increased with the increase in irrigation depth, and the difference in the SMC among various irrigation depths gradually decreased in deeper soil layers (>40 cm). The SMC at the budding stage first slightly decreased at shallow soil layers and then increased at the mediate soil layers, and it remained above 20% below the soil depth of 50 cm. The water-poor zones were mainly concentrated at the bare land, where water stress was gradually alleviated with the increase in irrigation depth. A significant increase in the areas of SMC < 15% was observed at the flowering and boll setting stages, which meant that the SMC significantly decreased during this period. Compared to the distribution of soil moisture at the budding stage, in addition to the water-poor zone of bare land, another water-poor zone was obtained at 0–30 cm depth under the mulch area, which was considered as the main range of root distribution at flowering and boll setting stages. The areas of the two water-poor zones both decreased with the increase in irrigation depth. The SMC at the boll opening stage increased due to the reduction in cotton evapotranspiration and the increase in groundwater recharge. The SMC under mulched areas was significantly higher than that of bare land.

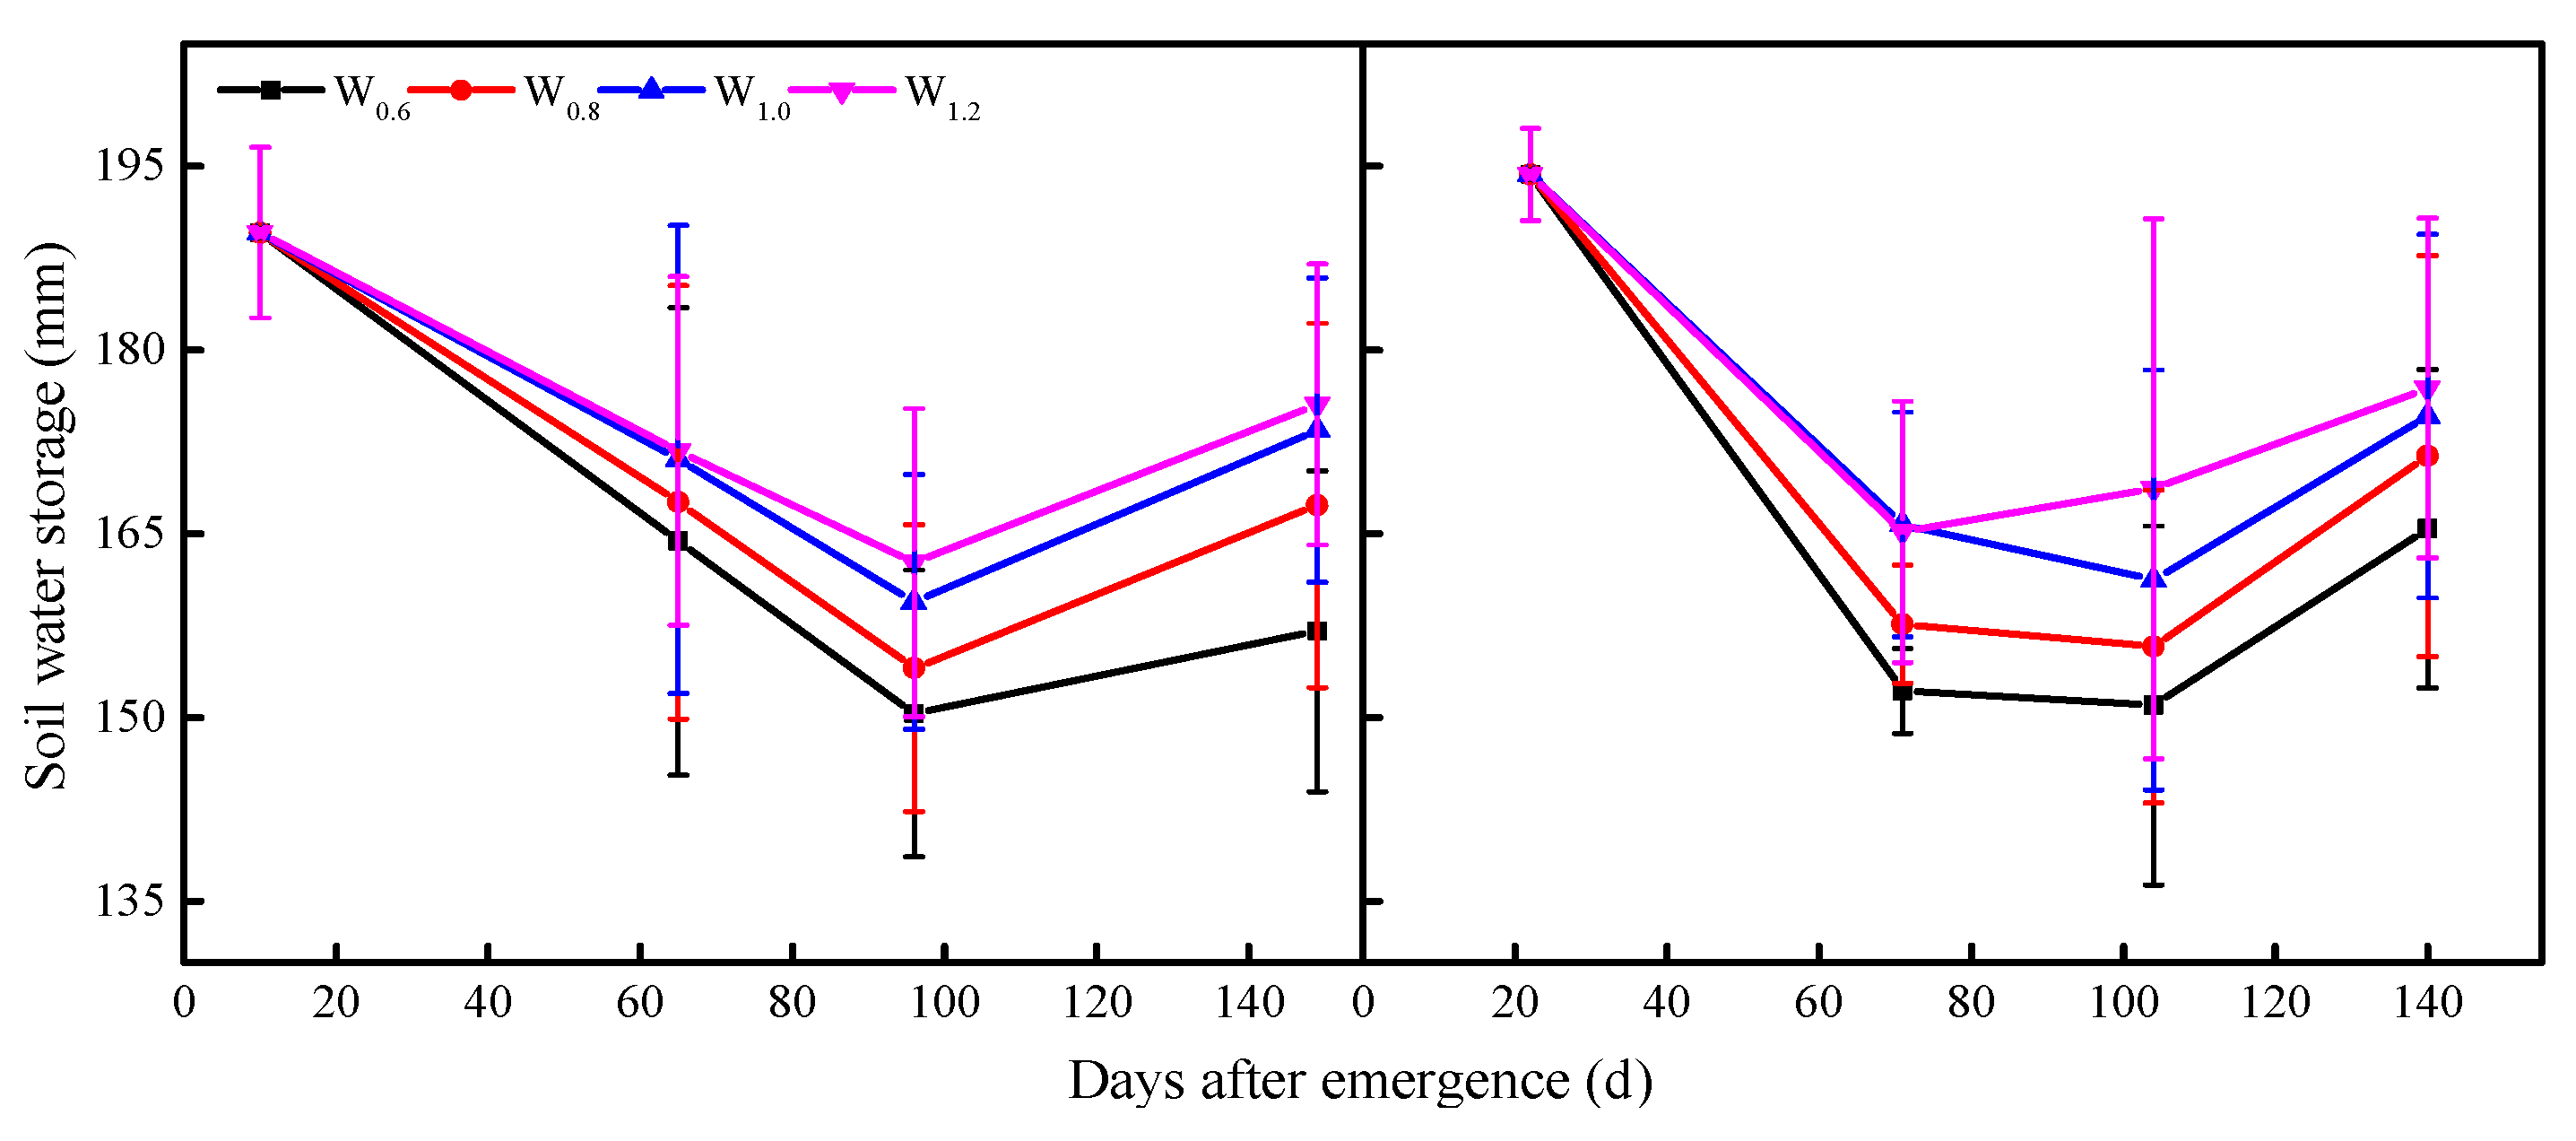
3.4.2. Soil Water Storage

Different variations in the soil water storage trends over time were observed in 2018 and 2019 (Figure 11). In 2018, from the beginning of the experiment to the flowering and boll setting stages, soil water storage showed a linear reduction over time, reduced by 20.70% under W0.6 treatment during this period, and the corresponding values were 18.75%, 15.90%, and 14.21% under W0.8, W1.0, and W1.2 treatments, respectively. In 2019, from the budding stage to the flowering and boll setting stages, soil water storage slightly decreased under W0.6, W0.8, and W1.0 while it increased under W1.2, which was inconsistent with that in 2018. Soil moisture storage at the boll opening stage increased compared with that at the previous growth stage of cotton in the two seasons. Soil water storage was consumed by 32.53, 22.25, 16.14, and 14.04 mm under W0.6, W0.8, W1.0, and W1.2 treatments in 2018. In 2019, the values found were 28.90, 22.97, 19.71 and 17.44 mm.

3.4.3. SMC Characteristics at Different Growth Stages Under Various Irrigation Depths

The statistics parameters of the horizontal SMC in the 0–60 cm soil layer at different growth stages under various irrigation depths are shown in Table 2. The average SMC gradually increased with the increase in soil depth at the budding stage and boll opening stage in the two seasons, while it first slightly decreased and then increased at the flowering and boll setting stages. At the budding stage, the average SMC of each soil layer was 0.158~0.168 and 0.145~0.160 under various irrigation depths in 2018 and 2019, respectively, and it increased with the increase in irrigation depth. The CV values of most treatments decreased with the increase in soil depth. There was no regular change in CV with the increase in irrigation depth at the budding stage. At the flowering and boll setting stage, the average SMC first slightly decreased and then increased with the increase in soil depth, and the average SMC was 0.142~0.157 and 0.143~0.164 under various irrigation depths in 2018 and 2019. Showing a similar trend to that of the SMC, the CV values first increased and then decreased with the increase in soil depth, and there was no significant difference in CV between various irrigation depths. Consistent with the results obtained at the budding stage, the average SMC kept increasing with the increase in soil depth at the boll opening stage, and it increased with the increase in irrigation depth. The CV values first increased and then decreased with the increase in soil depth. There was no significant difference in CV between different irrigation depths at the boll opening stage. The CV values varied significantly at different growth stages of cotton. The CV kept decreasing as the growth period progressed in 2018, while it first increased and then decreased in 2019. Meanwhile, the SMC in the 0~40 cm soil layer mainly showed moderate variability, while it showed weak variability below 40 cm.
The SMC in the 0~20 cm and 20~40 cm soil layer and stratification ratio (SR) were taken and calculated (Table 3). In the present study, soil samples were taken from four different locations (Figure 3) in each treatment to measure the SMC. The data acquired from the field showed that the SR was more than 1 during the whole growing season under different irrigation depths, which indicated that the SMC in the 20~40 cm soil layer was always higher than that in the 0~20 cm soil layer. However, there was a significant difference in the SR at different locations. For instance, the SR at locations B and C was significantly lower than that at locations A and D at the budding and flowering and boll setting stages due to the absorption of soil moisture by cotton root, while the SR at location D was the lowest at the boll opening stage. Meanwhile, there was no significant difference in the SR under various irrigation depths at different growth stages.

3.4.4. Variability Characteristics of SMC at Different Growth Stages Under Various Irrigation Depths

The varigram model was used to fit the SMC at the 0~60 cm soil layer under various irrigation depths at different growth stages (Table 4). It was found that the Gaussian model could be used for reasonable fitting in all treatments (R2 ≥ 0.827 for all treatments). It can be seen from Table 4 that the variation range of C0 was 0~1.1, which meant that the low spatial variation caused by soil characteristics and human activities (sampling, measurement process, etc.) in experiment. C0 + C decreased with the increase in irrigation depth at the budding stage and flowering and boll setting stages, indicating that the total variability of system was negatively affected by irrigation depth. The average values of C0 + C were 41.200, 38.330, 34.867 and 35.073 under W0.6, W0.8, W1.0 and W1.2 treatment in 2018, and the corresponding values were 37.823, 37.803, 34.407 and 31.010 in 2019, respectively. There was no significant difference in C0 + C of soil moisture content at the budding stage and flowering and boll setting stage, which was higher than that at the boll opening stage. Meanwhile, the C0/C0 + C of all treatments was less than 0.25, indicating that the SMC had a strong spatial autocorrelation in the 0–60 cm soil layer.

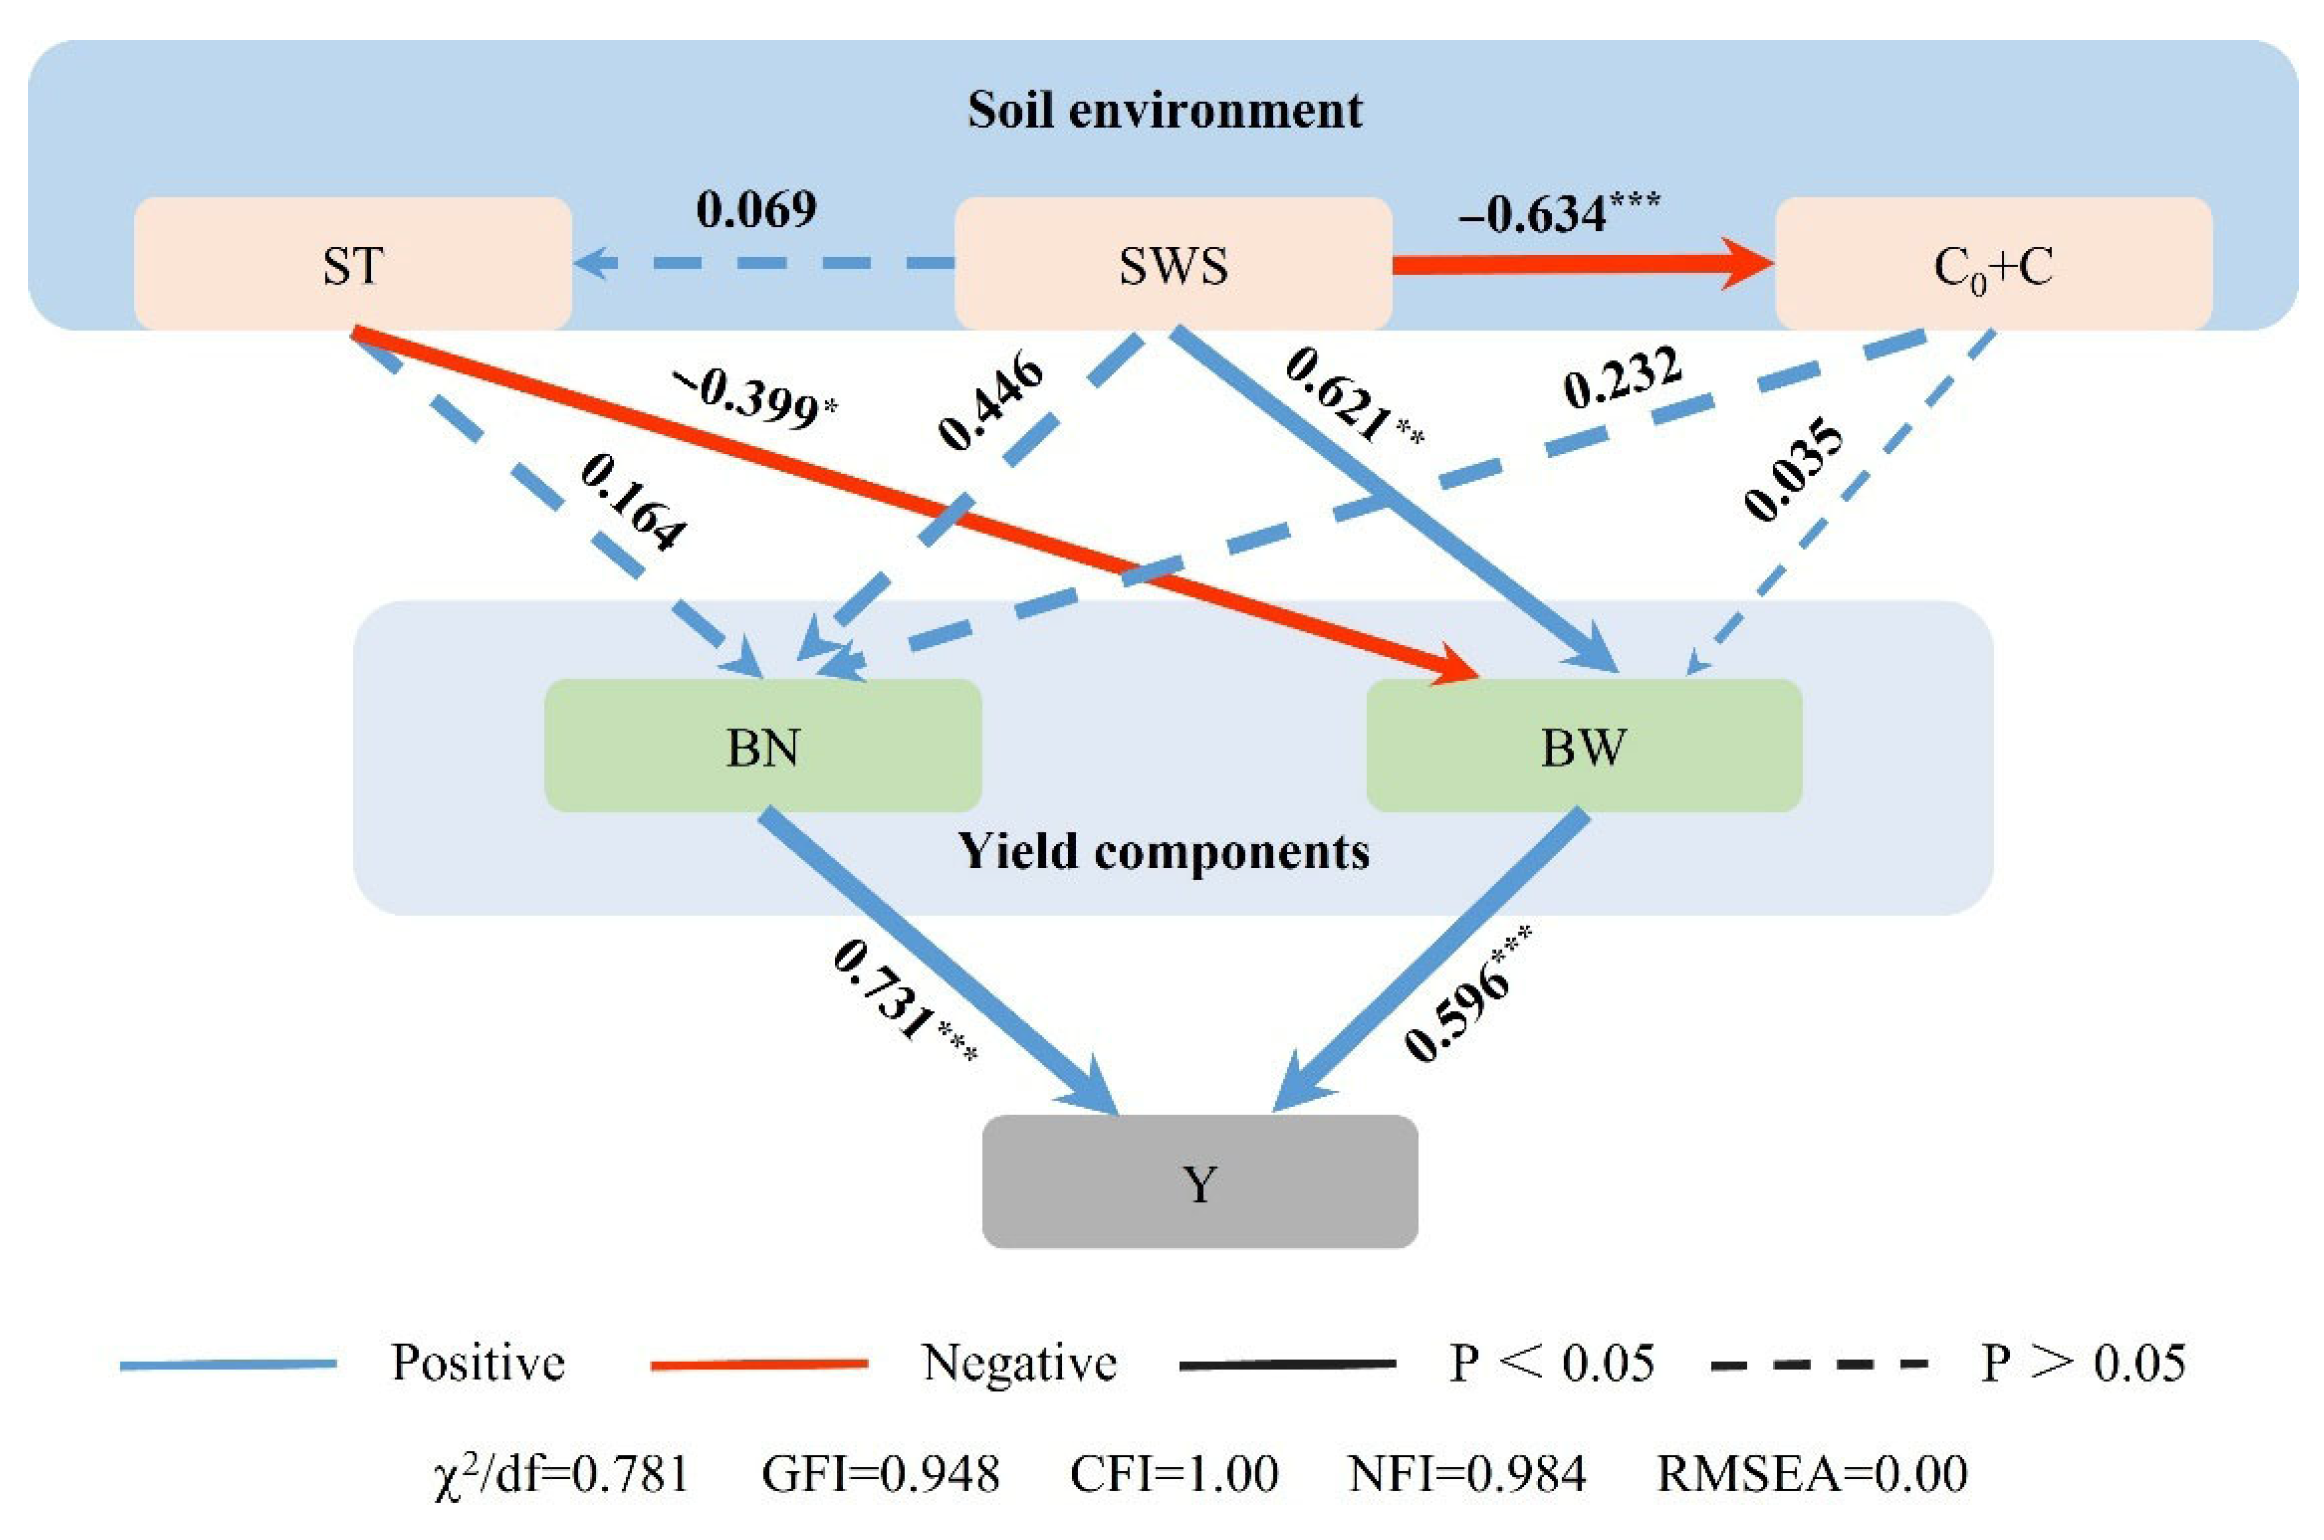
3.5. The Correlation Between Seed Cotton Yield and Soil Environment

The Pearson coefficients between the irrigation amount, soil water storage, soil temperature and seed cotton yield are shown in Table 5. In different growing stages, irrigation depth played a positive role on soil water storage, which was found to have a negative correlation with soil temperature; that is, the higher the soil water storage, the lower the soil temperature. Except for the seedling stage, irrigation depth and soil water storage were positively correlated with seed cotton yield, and with the advancement of growing stage, the promoting effects of irrigation depth and soil water storage on seed cotton yield first increased and then decreased, and they reached the maximum in the middle growth stage of cotton, namely the budding stage and the flowering and boll setting stage. The results showed that the soil temperature in different growth stages had no significant effect on seed cotton yield except for the flowering and boll setting stage, and there was a negative correlation between the soil temperature in the flowering and boll setting stage and seed cotton yield.
The structure equation model (SEM) was established to investigate the driving factors of seed cotton yield under different irrigation depths with satisfactorily fitting effects (χ2/df = 0.781, GFI = 0.948, CFI = 1.00, NFI = 0.984, and RMSEA = 0.00) (Figure 12). As the two main components of seed cotton yield, boll number (λ = 0.731, p < 0.001) and boll weight (λ = 0.596, p < 0.001) had significant direct effects on seed cotton yield. Soil water storage had a significant negative direct effect on the total variability of soil moisture (λ = −0.634, p < 0.001) and no significant direct relationship with soil temperature (λ = 0.069, p > 0.05). Soil temperature and soil water storage indirectly affect seed cotton yield by directly influencing boll weight with the former exhibiting a negative effect (λ = −0.399, p < 0.05) and the latter a positive effect (λ = 0.621, p < 0.01). Neither soil water storage, soil temperature, nor the total variability of soil moisture had a significant direct effect on boll number. Therefore, soil moisture can be regarded as the most critical environment factor affecting seed cotton yield primarily through its effect on boll weight.

4. Discussion

4.1. The Influence of Irrigation Depth on LAI, Seed Cotton Yield, and Irrigation Water Use Efficiency

As a crop very sensitive to soil moisture changes, cotton growth was greatly inhibited by water stress [44]. Ünlü et al. [45] indicated that there was a positive impact of irrigation amount on cotton growth. Similar to previous studies, we found that cotton growth was promoted by the increase in irrigation depth, and the highest LAI was obtained under W1.2 (120%ETc) treatment. Some studies have reported that cotton yield was positively correlated with the volume of water applied [14,46], which was similar to our findings. We found that seed cotton yield increased with the increase in irrigation depth, but there was no significant difference in seed cotton yield between W1.0 (100%ETc) and W1.2 (120%ETc) treatments, which was consistent with the finding of Kang et al. [47], and Basal et al. [48] also confirmed that a 25% reduction in full irrigation depth had no significant impact on seed cotton yield. Considering the saline–alkali soil in this experiment, 120% ETc could be regarded as full irrigation at the experimental site. In the present study, the highest seed cotton yield was obtained under W1.2 treatment in the two growing seasons, which was 6218.07 kg ha−1 in 2018 and 5945.63 kg ha−1 in 2019. Meanwhile, we confirmed that IWUE decreased with increasing irrigation depth in this study, which was consistent with the findings of Leogrande et al. [49].

4.2. Effects of Irrigation Depth on Soil Temperature in Cotton Field Under Film-Mulched Drip Irrigation

Soil temperature was considered as a vital factor, which has an impact on crop growth by regulating the absorption of water and nutrient by crop roots [50]. Zhou et al. [51] pointed out that low temperature in the spring had a negative effect on the development of crops. Therefore, mulched drip irrigation has been widely used worldwide due to its advantages of the conservation of water and heat [52]. In present study, we found that soil temperature significantly decreased while the solar radiation remained stable during the cotton growing stage; the reason for the phenomenon was that cotton growth, especially the increase in leaf area at the middle and late growth stages, reduced the received net radiation by soil surface, which was considered as the main contributing factor of soil temperature [27]. Therefore, the effects of crop growth on soil temperature by regulating the received net radiation by soil surface cannot be ignored. Similarly, it can be seen from Figure 5 that significant differences in LAI were found under various irrigation depths, which affected the reception of solar radiation by ground and thus caused the difference in soil temperature in the two seasons. The results showed that the soil temperature of the mulched area was always higher than that of bare land under various irrigation depths during the different growth stages of cotton, which also confirmed the positive effect of mulching on soil temperature.
We demonstrated that soil temperature decreased with the increase in irrigation depth, which was inconsistent with the results found by Liao et al. [50], who indicated that there was no significant effect of different irrigation depths on soil temperature, which can be explained by the following reasons. Firstly, a larger amount of rainfall in the experiment of Liao et al. [50] caused a decrease in soil temperature and weakened the effect of irrigation depth on soil temperature. But in the present study, soil moisture mainly came from irrigation activities, which caused the significant difference in soil moisture and inevitably led to differences in soil temperature. Furthermore, a larger area of soil surface was directly affected by solar radiation due to the lower leaf area of cotton under deficit irrigation (W0.6 and W0.8 treatments) in the present study, which was also the reason for the significant difference in soil temperature under various irrigation depths.

4.3. Effects of Irrigation Depth on Soil Moisture in Cotton Field Under Film-Mulched Drip Irrigation

Soil evaporation and transpiration were influenced by soil mulching and crop growth and thus affected soil moisture [27]. A uniform soil wetting zone will be formed in the shallow soil layer due to the point-source characteristics of drip irrigation, and a decreasing soil moisture gradient will be formed as the depth of the soil layer increases [53,54]. Some researchers pointed out that the wetting front under drip irrigation usually did not migrate further than 30–40 cm below the soil surface [18,55]. In this study, the distribution of SMC in the 0–40 cm soil layer greatly varied at different growth stages under various irrigation depths, and the SMC increased with the increase in irrigation depth. Meanwhile, the water replenishment of capillary rise from shallow groundwater caused the SMC in the soil layer below 40 cm to remain at a higher level in this study [18,56].
Mulching had a significant positive impact on the SMC by forming an isolation layer between the soil surface and atmosphere, which was also confirmed by many researchers [24,57,58]; therefore, in the present study, since the loss of soil moisture was reduced due to the reduction in soil evaporation under mulching conditions, the SMC under the bare land (location D in Figure 3) was thus significantly lower than those under mulching film (location A, B, and C in Figure 3). It was worth noting that the conservation effect of mulching on soil moisture was more significant at the early growth stage compared to that at the middle and late growth stages. At the early growing stage, there was a larger soil evaporation of bare land due to the direct effect of solar radiation on the soil surface, resulting in larger differences in SMC between the mulching and bare land. At the middle and late growth stages, firstly, irrigation increased the SMC in the soil profile; in addition, the absorption of soil water by cotton root increased due to the development of cotton, while the increase in leaf area reduced the soil evaporation of bare land. Meanwhile, the increase in the capillary rise of shallow groundwater was also the reason for the smaller difference in soil moisture under the mulched conditions and bare land conditions during this period.
The soil water storage in all treatments first decreased and then increased over time, which was similar to the finding of Liao et al. [50], while it was inconsistent with Huang et al. [59], who pointed out that a W type was found in the changes of soil water storage over time. This might be related to different climate conditions. A higher level of soil water storage was found at the early growth stage due to the lower soil evaporation caused by lower air temperature. After that, soil water storage continued to decrease due to the increase in air temperature and cotton evapotranspiration, and it reached the lowest in the flowering and boll setting stage in the two seasons. Soil water storage in all treatments has risen due to the decrease in air temperature and reduction in cotton water demand as well as the increase in the capillary of shallow groundwater during the boll opening stage [18,56]. Soil water storage was significantly affected by irrigation depth due to only one effective rainfall, and it increased with the increase in irrigation depth.

4.4. The Spatial Variability of Soil Moisture Under Various Irrigation Depths in Cotton Field Under Film-Mulched Drip Irrigation

Many studies have investigated the spatial variability of soil moisture under deficit irrigation condition. Martinez-Fernández and Ceballos [60] found a decreased variability with the decrease in soil moisture, which differed from the findings of Famiglietti et al. [61], Brocca et al. [62,63] and Rosenbaum et al. [64]. Famiglietti et al. [61] found the spatial variability of soil moisture decreased with the increase in soil moisture, and Brocca et al. [62] and Rosenbaum et al. [64] indicated that variability first increased and then decreased with decreasing soil moisture, which was consistent with our findings in this paper. In addition, we found there was no significant difference in the spatial distribution of soil moisture under various irrigation depths; the main manifestation was that no significant differences in CV and SR were found under various irrigation depths, which can be related to the soil moisture quickly completing the redistribution process driven by factors such as air temperature, thereby forming similar soil moisture distribution characteristics under various irrigation depths. Meanwhile, similar to the findings of Brocca et al. [62], we indicated that the spatial variability of soil moisture decreased with the increase in soil depth on the field scale, which may be related to the lower impact of atmosphere and irrigation activities on soil moisture at deeper soil layers.

4.5. The Relationship Between Soil Moisture and Temperature and Seed Cotton Yield

Previous studies have been conducted on the variation in soil moisture and soil temperature under different conditions, including mulching [65,66], tillage [67] and irrigation [68], and they also confirmed the feasibility of adjusting soil moisture and soil temperature conditions through agronomic measures to increase crop yields. In the present study, correlation analysis revealed that seed cotton yield was positively affected by irrigation depth and soil water storage with the strongest effects observed during the budding stage and flowering and boll setting stage, which was consistent with the findings of Hou et al. [69], who found that the flowering and boll setting stage could be considered as the pivotal water demand stage of cotton. Therefore, ensuring adequate water supply and beneficial soil moisture condition during the flowering and boll setting stage is the key to stable cotton yield.
Furthermore, a significant negative relationship was observed between soil temperature during the flowering and boll setting stage and seed cotton yield. Similarly, the accumulated soil temperature throughout the growing season showed an inverse relationship with seed cotton yield. Numerous studies have demonstrated that elevated soil temperature enhances crop growth during early development stages [70,71]. However, higher soil temperature resulting from a dense cotton canopy, reduced ventilation and high ambient air temperature adversely affects cotton growth and yield formation during the middle and later growing stages. Nevertheless, the underlying mechanisms through which soil temperature affects seed cotton yield remain poorly understood and warrant further investigation. Our finding corroborated previous research findings by Zhang et al. [72] and Salau et al. [73], demonstrating an inverse relationship between soil water storage and soil temperature, which suggested that maintaining adequate irrigation during the reproductive stages of cotton serves dual purposes: improving soil moisture conditions while simultaneously alleviating thermal stress, thereby creating optimal conditions for yield formation.
The structural equation model (SEM) in the present study revealed that both soil moisture and soil temperature indirectly affected seed cotton yield primarily through their influences on boll weight rather than boll number, suggesting that genotypic variation could be the primary determinant of boll number in cotton. Furthermore, considering the soil moisture and temperature, seed cotton yield and water use efficiency, the irrigation depth in south Xinjiang was recommended to be W1.0 treatment, that is, 100% ETc.

5. Conclusions

Cotton growth and seed cotton yield were positively affected by irrigation depth, and there was no significant difference in seed cotton yield between W1.0 (100%ETc) and W1.2 (100%ETc) treatments. Mulching had a positive effect on soil temperature, which decreased with the increase in irrigation depth, and it reached the highest value under W0.6 (60%ETc) treatment. Soil temperature first increased and then decreased over time due to the variations in air temperature and cotton growth. Higher soil moisture content was found in mulched soil than that under bare land. The lowest soil water storage was obtained at the flowering and boll setting stages due to the higher water demand of cotton during this period. Irrigation depth had no significant effect on soil moisture distribution, but it significantly reduced the spatial variability of soil moisture, which decreased with the increase in soil depth. Irrigation depth and soil water storage were positively affected seed cotton yield, which showed a negative correlation with the soil temperature at the flowering and boll setting stage, and there was a negative correlation between soil temperature and soil water storage. The results of SEM showed that soil moisture and soil temperature affect seed cotton yield by influencing boll weight rather than boll number. 100%ETc can be recommended as the appropriate irrigation depth in south Xinjiang considering the soil moisture and temperature, seed cotton yield and water use efficiency.

Author Contributions

Conceptualization, F.Z. and X.H.; methodology, X.H. and W.H.; software, X.H.; formal analysis, X.H.; investigation, X.H. and W.H.; resources, Q.L. and F.Z.; data curation, X.H. and W.H.; writing—original draft preparation, X.H.; writing—review and editing, X.H.; supervision, Q.L., J.F. and F.Z.; project administration, F.Z. All authors have read and agreed to the published version of the manuscript.

Funding

This research was funded by “the Key R&D Program of Shandong Province, China, grant number 2023CXGC010703” and “the National Key Research and Development Program of China, grant number 2023YFD1902605”.

Data Availability Statement

The data supporting the conclusions of this article will be made available by the authors on request.

Conflicts of Interest

The authors declare no conflicts of interest.

References

  1. Himanshu, S.K.; Ale, S.; Bordovsky, J.; Darapuneni, M. Evaluation of crop-growth-stage-based deficit irrigation strategies for cotton production in the Southern High Plains. Agric. Water Manag. 2019, 225, 105728. [Google Scholar] [CrossRef]
  2. National Bureau of Statistics of China. China Statistical Yearbook; China Statistics Press: Beijing, China, 2022. Available online: http://www.stats.gov.cn/ (accessed on 5 July 2025).
  3. Tan, S.; Wang, Q.J.; Xu, D.; Zhang, J.H.; Shan, Y.Y. Evaluating effects of four controlling methods in bare strips on soil temperature, water and salt accumulation under film-mulched drip irrigation. Field Crops Res. 2017, 214, 350–358. [Google Scholar] [CrossRef]
  4. Guo, Y.; Shen, Y.J. Agricultural water supply/demand changes under projected future climate change in the arid region of northwestern China. J. Hydrol. 2016, 540, 257–273. [Google Scholar] [CrossRef]
  5. Wang, H.D.; Li, J.; Cheng, M.H.; Zhang, F.C.; Wang, X.K.; Fan, J.L.; Wu, L.F.; Fang, D.P.; Zou, H.Y.; Xiang, Y.Z. Optimal drip fertigation management improves yield, quality, water and nitrogen use efficiency of greenhouse cucumber. Sci. Hortic. 2019, 243, 357–366. [Google Scholar] [CrossRef]
  6. Si, Z.Y.; Zain, M.; Mehmood, F.; Wang, G.S.; Gao, Y.; Duan, A.W. Effects of nitrogen application rate and irrigation regime on growth, yield, and water-nitrogen use efficiency of drip-irrigated winter wheat in the North China Plain. Agric. Water Manag. 2020, 231, 106002. [Google Scholar] [CrossRef]
  7. Tuerxun, M.; Youliwasi, F.; Tuohuti, A. Impact factors of excessive household fertilization: A case study of cotton growing in Xinjiang, China. J. Cotton Sci. 2016, 28, 619–627, (In Chinese with English Abstract). [Google Scholar]
  8. Wang, Z.; Fan, B.; Guo, L. Soil salinization after long-term mulched drip irrigation poses a potential risk to agricultural sustainability. Eur. J. Soil Sci. 2019, 70, 20–24. [Google Scholar] [CrossRef]
  9. Chai, Q.; Gan, Y.; Zhao, C.; Xu, H.L.; Waskon, R.M.; Niu, Y.; Siddique, K.H.M. Regulated deficit irrigation for crop production under drought stress. A review. Agron. Sustain. Dev. 2016, 36, 3. [Google Scholar] [CrossRef]
  10. Greaves, G.E.; Wang, Y.M. Identifying irrigation strategies for improved agricultural water productivity in irrigated maize production through crop simulation modelling. Sustainability 2017, 9, 630. [Google Scholar] [CrossRef]
  11. Du, T.S.; Kang, S.Z.; Zhang, J.H.; Davies, W.J. Deficit irrigation and sustainable water resource strategies in agriculture for China’s food security. J. Exp. Bot. 2015, 66, 2253–2269. [Google Scholar] [CrossRef]
  12. Cheng, M.H.; Wang, H.D.; Fan, J.L.; Zhang, S.H.; Wang, Y.L.; Li, Y.P.; Sun, X.; Yang, L.; Zhang, F.C. Water productivity and seed cotton yield in response to deficit irrigation: A global meta-analysis. Agric. Water Manag. 2021, 255, 107027. [Google Scholar] [CrossRef]
  13. Liu, H.; Gao, Y.; Sun, J.; Wu, X.; Li, Y. Responses of yield, water use efficiency and quality of short-season cotton to irrigation management: Interactive effects of irrigation methods and deficit irrigation. Irrig. Sci. 2017, 35, 125–139. [Google Scholar] [CrossRef]
  14. Papastylianou, P.T.; Argyrokastritis, I.G. Effect of limited drip irrigation regime on yield, yield components, and fiber quality of cotton under Mediterranean conditions. Agric. Water Manag. 2014, 142, 127–134. [Google Scholar] [CrossRef]
  15. Zhang, D.M.; Luo, Z.; Liu, S.H.; Li, W.J.; Tang, W.; Dong, H.Z. Effects of deficit irrigation and plant density on growth, yield and fiber quality. Field Crops Res. 2024, 197, 1–9. [Google Scholar] [CrossRef]
  16. Liao, H.; Liu, H.Y.; Tian, Q.Y.; Zhou, B.H.; Yang, H.L.; Hou, Z.A. Deficit drip irrigation combined with nitrogen application improves cotton yield and nitrogen use efficiency by promoting plant 15N uptake and remobilization. Field Crops Res. 2025, 324, 109792. [Google Scholar] [CrossRef]
  17. Arriaga, J.; Rubio, F.R. A distributed parameters model for soil water content: Spatial and temporal variability analysis. Agric. Water Manag. 2017, 183, 101–106. [Google Scholar] [CrossRef]
  18. Li, X.Y.; Šimůnek, J.; Shi, H.B.; Yan, J.W.; Peng, Z.Y.; Gong, X.W. Spatial distribution of soil water, soil temperature, and plant roots in a drip-irrigated intercropping field with plastic mulch. Eur. J. Agron. 2017, 83, 47–56. [Google Scholar] [CrossRef]
  19. Malamy, J.E. Intrinsic and environmental response pathways that regulate root system architecture. Plant Cell Environ. 2005, 28, 67–77. [Google Scholar] [CrossRef]
  20. Bogena, H.R.; Herbst, M.; Huisman, J.A.; Rosenbaum, U.; Weuthen, A.; Vereecken, H. Potential of wireless sensor networks for measuring soil water content variability. Vadose Zone J. 2010, 9, 1002–1013. [Google Scholar] [CrossRef]
  21. Bittelli, M.; Ventura, F.; Campbell, G.S.; Snyder, R.L.; Gallegati, F.; Pisa, P.R. Coupling of heat, water vapor, and liquid water fluxes to compute evaporation in bare soils. J. Hydrol. 2008, 3, 191–205. [Google Scholar] [CrossRef]
  22. Boyd, N.; van Acker, R. The effects of depth and fluctuating soil moisture on the emergence of eight annual and six perennial plant species. Weed Sci. 2003, 51, 725–730. [Google Scholar] [CrossRef]
  23. Abouziena, H.F.; Radwan, S.M. Allelopathic effects of sawdust, rice straw, burclover weed and cogongrass on weed control and development of onion. Int. J. ChemTech Res. 2015, 7, 337–345. [Google Scholar] [CrossRef]
  24. Zribi, W.; Aragü’es, R.; Medina, E.; Faci, J.M. Efficiency of inorganic and organic mulching materials for soil evaporation control. Soil Tillage Res. 2015, 148, 40–45. [Google Scholar] [CrossRef]
  25. Zhao, Y.; Mao, X.M.; Duan, M. Effects of film mulching and irrigation amount on farmland water–heat dynamics and growth of seed–maize. Trans. CSAM 2018, 49, 275–284, (In Chinese with English Abstract). [Google Scholar]
  26. Li, R.; Hou, X.Q.; Jia, Z.K.; Han, Q.F.; Ren, X.L.; Yang, B.P. Effects on soil temperature, moisture, and maize yield of cultivation with ridge and furrow mulching in the rainfed area of the Loess Plateau, China. Agric. Water Manag. 2013, 116, 101–109. [Google Scholar] [CrossRef]
  27. Yang, J.; Mao, X.M.; Wang, K.; Yang, W.C. The coupled impact of plastic film mulching and deficit irrigation on soil water/heat transfer and water use efficiency of spring wheat in Northwest China. Agric. Water Manag. 2018, 201, 232–245. [Google Scholar] [CrossRef]
  28. Fan, Y.Q.; Ding, R.S.; Kang, S.Z.; Hao, X.M.; Du, T.S.; Tong, L.; Li, S.E. Plastic mulch decreases available energy and evapotranspiration and improves yield and water use efficiency in an irrigated maize cropland. Agric. Water Manag. 2016, 179, 122–131. [Google Scholar] [CrossRef]
  29. Fry, J.E.; Guber, A.K. Temporal stability of field-scale patterns in soil water content across topographically diverse agricultural landscapes. J. Hydrol. 2020, 580, 124260. [Google Scholar] [CrossRef]
  30. Brocca, L.; Zucco, G.; Mittelbach, H.; Moramarco, T.; Seneviratne, S.I. Absolute versus temporal anomaly and percent of saturation soil moisture spatial variability for six networks worldwide. Water Resour. Res. 2014, 50, 5560–5576. [Google Scholar] [CrossRef]
  31. Mittelbach, H.; Seneviratne, S.I. A new perspective on the spatio-temporal variability of soil moisture: Temporal dynamics versus time invariant contributions. Hydrol. Earth Syst. Sci. Discuss. 2012, 16, 2169–2179. [Google Scholar] [CrossRef]
  32. Özerdem, M.S.; Acar, E.; Ekinci, R. Soil moisture estimation over vegetated Agricultural Areas: Tigris Basin, Turkey from Radarsat-2 data by polarimetric decomposition models and a generalized regression neural network. Remote Sens. 2017, 9, 395. [Google Scholar] [CrossRef]
  33. Rossato, L.; Alvalá, R.C.; Marengo, J.A.; Zeri, M.; Cunha, A.P.M.; Pires, L.B.M.; Barbosa, H.A. Impact of soil moisture on crop yields over Brazilian Semiarid. Front. Environ. Sci. 2017, 5, 73. [Google Scholar] [CrossRef]
  34. Yetbarek, E.; Ojha, R. Spatio-temporal variability of soil moisture in a cropped agricultural plot within the Ganga Basin, India. Agric. Water Manag. 2020, 234, 106108. [Google Scholar] [CrossRef]
  35. Allen, R.G.; Pereira, L.S.; Raes, D.; Smith, M. Crop Evapotranspiration: Guidelines for Computing Crop Water Requirements; FAO: Rome, Italy, 1998. [Google Scholar]
  36. Qiao, F. Plant Physiology Experimental Analysis and Determination Technology; China Agricultural Science and Technology Press: Beijing, China, 2002. [Google Scholar]
  37. Watson, D.J. Comparative physiological studies in the growth of field crops. I: Variation in net assimilation rate and leaf area between species and varieties, and within and between years. Ann. Bot. 1947, 11, 41–76. [Google Scholar] [CrossRef]
  38. Zhang, W.T.; Wu, H.Q.; Gu, H.B.; Feng, G.L.; Wang, Z.; Sheng, J.D. Variability of soil salinity at multiple spatio-temporal scales and the related driving factors in the Oasis areas of Xinjiang, China. Pedosphere 2014, 6, 753–762. [Google Scholar] [CrossRef]
  39. Zhang, R.D. Theory and Application of Spatial Variation; Science Press: Beijing, China, 2005. [Google Scholar]
  40. Junior, V.V.; Carvalho, M.P.; Dafonte, J.; Freddi, O.S.; Vazquez, E.V.; Ingaramo, O.E. Spatial variability of soil water content and mechanical resistance of Brazilian ferralsol. Soil Tillage Res. 2006, 85, 166–177. [Google Scholar] [CrossRef]
  41. Ferrero, A.; Usowicz, B.; Lipiec, J. Effects of tractor traffic on spatial variability of soil strength and water content in grass covered and cultivated sloping vineyard. Soil Tillage Res. 2005, 84, 127–138. [Google Scholar] [CrossRef]
  42. Yao, R.J.; Yang, J.S.; Liu, G.M. Spatial variability of soil salinity and moisture and their estimations by CoKriging method—A case study in characteristic field of Yellow River delta. J. Soil Water Conserv. 2006, 20, 133–138, (In Chinese with English Abstract). [Google Scholar]
  43. Gama-Rodrigues, A.C.; Sales, M.V.S.; Silva, P.S.D.; Comerford, W.P.; Cropper, W.P.; Gama-Rodrigues, E.F. An exploratory analysis of phosphorus transformations in tropical soils using structural equation modeling. Biogeochemistry 2014, 118, 453–469. [Google Scholar] [CrossRef]
  44. DeTar, W.R. Yield and growth characteristics for cotton under various irrigation regimes on sandy soil. Agric. Water Manag. 2008, 95, 69–76. [Google Scholar] [CrossRef]
  45. Ünlü, M.; Kanber, R.; Koç, D.L.; Tekin, S.; Kapur, B. Effects of deficit irrigation on the yield and yield components of drip irrigated cotton in a mediterranean environment. Agric. Water Manag. 2011, 98, 597–605. [Google Scholar] [CrossRef]
  46. Singh, Y.; Rao, S.S.; Regar, P.L. Deficit irrigation and nitrogen effects on seed cotton yield, water productivity and yield response factor in shallow soils of semi-arid environment. Agric. Water Manag. 2010, 97, 965–970. [Google Scholar] [CrossRef]
  47. Kang, Y.; Wang, R.; Wan, S.; Hu, W.; Jiang, S.; Liu, S. Effects of different water levels on cotton growth and water use through drip irrigation in an arid region with saline ground water of Northwest China. Agric. Water Manag. 2012, 109, 117–126. [Google Scholar] [CrossRef]
  48. Basal, H.; Dagdelen, N.; Unay, A. Effects of deficit drip irrigation ratios on cotton (Gossypium hirsutum L.) yield and fibre quality. J. Agron. Crop Sci. 2010, 195, 19–29. [Google Scholar] [CrossRef]
  49. Leogrande, R.; Vitti, C.; Lopedota, O.; Ventrella, D.; Montemurro, F. Effects of irrigation volume and saline water on maize yield and soil in Southern Italy. Irrig. Drain. 2016, 65, 243–253. [Google Scholar] [CrossRef]
  50. Liao, Y.; Cao, H.X.; Xue, W.K.; Liu, X. Effects of the combination of mulching and deficit irrigation on the soil water and heat, growth and productivity of apples. Agric. Water Manag. 2021, 243, 106482. [Google Scholar] [CrossRef]
  51. Zhou, L.M.; Zhang, F.; Liu, C.A. Improved yield by harvesting water with ridges and subgrooves using buried and surface plastic mulchs in a semiarid area of China. Soil Till. Res. 2015, 150, 21–29. [Google Scholar] [CrossRef]
  52. Zhang, G.; Liu, C.; Xiao, C.; Xie, R.; Ming, B.; Hou, P.; Liu, G.; Xu, W.; Shen, D.; Wang, K.; et al. Optimizing water use efficiency and economic return of superhigh yield spring maize under drip irrigation and plastic mulching in arid areas of China. Field Crops Res. 2017, 211, 137–146. [Google Scholar] [CrossRef]
  53. Al-Ogaidi, A.A.M.; Wayayok, A.; Rowshon, M.K.; Abdullah, A.F. Wetting patterns estimation under drip irrigation systems using an enhanced empirical model. Agric. Water Manag. 2016, 176, 203–213. [Google Scholar] [CrossRef]
  54. Bajpai, A.; Kaushal, A. Soil moisture distribution under trickle irrigation: A review. Water Supply 2020, 20, 761–772. [Google Scholar] [CrossRef]
  55. Machado, R.M.A.; Oliveira, M.R.G. Tomato root distribution, yield and fruit quality under different subsurface drip irrigation regimes and depths. Irrig. Sci. 2003, 24, 15–24. [Google Scholar] [CrossRef]
  56. Ren, D.Y.; Xu, X.; Hao, Y.Y.; Huang, G.H. Modeling and assessing field irrigation water use in a canal system of Hetao, upper Yellow River basin: Application to maize, sunflower and watermelon. J. Hydrol. 2016, 532, 122–139. [Google Scholar] [CrossRef]
  57. Liao, R.K.; Wu, W.Y.; Hu, Y.Q.; Xu, D.; Huang, Q.N.; Wang, S.Y. Micro-irrigation strategies to improve water-use efficiency of cherry trees in Northern China. Agric. Water Manag. 2019, 221, 388–396. [Google Scholar] [CrossRef]
  58. Suo, G.D.; Xie, Y.S.; Zhang, Y.; Luo, H. Long-term effects of different surface mulching techniques on soil water and fruit yield in an apple orchard on the Loess Plateau of China. Sci. Hortic. 2019, 246, 643–651. [Google Scholar] [CrossRef]
  59. Huang, J.H.; Liao, Y.C.; Gao, M.S.; Yin, R.J. Effects of tillage and mulching on orchard soil moisture content and temperature in Loess Plateau. Chin. J. Appl. Ecol. 2009, 20, 2652–2658, (In Chinese with English Abstract). [Google Scholar]
  60. Martinez-Fernández, J.; Ceballos, A. Temporal stability of soil moisture in a large-field experiment in Spain. Soil Sci. Soc. Am. J. 2003, 67, 1647–1656. [Google Scholar] [CrossRef]
  61. Famiglietti, J.; Devereaux, J.A.; Laymon, C.A.; Tsegaye, T.; Houser, P.R.; Jackson, T.J.; Graham, S.T.; Rodell, M.; Oevelen, V. Ground-based investigation of soil moisture variability within remote sensing footprints during the Southern Great Plains 1997 (SGP97) hydrology experiment. Water Resour. Res. 1999, 35, 1839–1852. [Google Scholar] [CrossRef]
  62. Brocca, L.; Melone, F.; Moramarco, T.; Morbidelli, R. Spatial-temporal variability of soil moisture and its estimation across scales. Water Resour. Res. 2010, 46, W02516. [Google Scholar] [CrossRef]
  63. Brocca, L.; Tullo, T.; Melone, F.; Moramarco, T.; Morbidelli, R. Catchment scale soil moisture spatial–temporal variability. J. Hydrol. 2012, 422–423, 63–75. [Google Scholar] [CrossRef]
  64. Rosenbaum, U.; Bogena, H.R.; Herbst, M.; Huisman, J.A.; Peterson, T.J.; Weuthen, A.; Western, A.W.; Vereecken, H. Seasonal and event dynamics of spatial soil moisture patterns at the small catchment scale. Water Resour. Res. 2012, 48, W10544. [Google Scholar] [CrossRef]
  65. Tuure, J.; Räsänen, M.; Hautala, M.; Pellikka, P.; Mäkelä, P.S.A.; Alakukku, L. Plant residue mulch increases measured and modelled soil moisture content in the effective root zone of maize in semi-arid Kenya. Soil Tillage Res. 2021, 209, 104945. [Google Scholar] [CrossRef]
  66. Mubvumba, P.; DeLaune, P.B.; Hons, F.M. Soil water dynamics under a warm-season cover crop mixture in continuous wheat. Soil Tillage Res. 2021, 206, 104823. [Google Scholar] [CrossRef]
  67. Nyawade, S.O.; Karanja, N.N.; Gachene, C.K.K.; Schulte-Geldermann, E.; Parker, K. Effect of potato hilling on soil temperature, soil moisture distribution and sediment yield on a sloping terrain. Soil Tillage Res. 2018, 184, 24–36. [Google Scholar] [CrossRef]
  68. Sampathkumar, T.; Pandian, B.J.; Mahimairaja, S. Soil moisture distribution and root characters as influenced by deficit irrigation through drip system in cotton–maize cropping sequence. Agric. Water Manag. 2012, 103, 43–53. [Google Scholar] [CrossRef]
  69. Hou, X.H.; Fan, J.L.; Zhang, F.C.; Hu, W.H.; Yan, F.L.; Xiao, C.; Li, Y.P.; Cheng, H.L. Determining water use and crop coefficients of drip-irrigated cotton in south Xinjiang of China under various irrigation amounts. Ind. Crops Prod. 2022, 176, 114376. [Google Scholar] [CrossRef]
  70. Chen, C.Q.; Lei, C.X.; Deng, A.X.; Qian, C.R.; Hoogmoed, W.; Zhang, W.J. Will higher minimum temperatures increase corn production in Northeast China? An analysis of historical data over 1965–2008. Agric. For. Meteorol. 2011, 151, 1580–1588. [Google Scholar] [CrossRef]
  71. Song, B.; Stöcklin, J.; Gao, Y.Q.; Zhang, Z.Q.; Yang, Y.; Li, Z.M.; Sun, H. Habitat-specific responses of seed germination and seedling establishment to soil water condition in two Rheum species in the high Sino-Himalayas. Ecol. Res. 2013, 28, 643–651. [Google Scholar] [CrossRef]
  72. Zhang, L.H.; Xu, C.; Yan, W.P.; Sun, N.; Tan, G.B.; Yu, J.; Zhao, H.X.; Li, F.; Meng, X.M.; Bian, S.F. Effects of surface mulching on soil water and temperature efficiency and maize yield in semi-arid area. Agric. Res. Arid Areas 2023, 41, 179–192, (In Chinese with English Abstract). [Google Scholar]
  73. Salau, A.W.; Olasantan, F.O.; Bodunde, J.G.; Makinde, E.A. Soil temperature and moisture content changes with growth and yield of cassava/vegetable intercrops. Arch. Agron. Soil Sci. 2014, 64, 447–460. [Google Scholar] [CrossRef]
Figure 1. Location of the study site in Korla, Xinjiang, China. The red area corresponds to Urumqi, the red dot corresponds to Kolar, and the red five-pointed stars correspond to the experimental site.
Agronomy 15 01674 g001
Figure 2. Daily rainfall, air temperature and radiation during the cotton growing seasons of 2018 and 2019.
Agronomy 15 01674 g002
Figure 3. Schematic diagram of the cropping pattern and lateral layout of the driplines under plastic mulch for cotton. The different capital letters A, B, C and D represent four sampling points in the horizontal direction, and the black points represent the sampling depth.
Agronomy 15 01674 g003
Figure 4. Timing and depth of drip irrigation and the proportions of total fertilizer applied each time for cotton in 2018 and 2019. 0.1 F and 0.2 F mean 10% and 20% of total fertilizer applied; W0.6, W0.8, W1.0, and W1.2 correspond to 60%, 80%, 100%, and 120% of the crop evapotranspiration (ETc), respectively.
Agronomy 15 01674 g004
Figure 5. The changes of LAI under various irrigation depths in 2018 (a) and 2019 (b); W0.6, W0.8, W1.0, and W1.2 correspond to 60%, 80%, 100%, and 120% ETc, respectively.
Agronomy 15 01674 g005
Figure 6. The changes of seed cotton yield and IWUE under various irrigation depths in 2018 and 2019. Bars are the means + one standard error of the mean (n = 3). Different letters on the top of the bar indicate significant differences at p < 0.05 according to Duncan’s tests. W0.6, W0.8, W1.0, and W1.2 correspond to 60%, 80%, 100%, and 120% ETc, respectively.
Agronomy 15 01674 g006
Figure 7. Variation in soil temperature in different soil layers under mulching with time under various irrigation depths. W0.6, W0.8, W1.0, and W1.2 correspond to 60%, 80%, 100%, and 120% ETc, respectively.
Agronomy 15 01674 g007
Figure 8. Daily variation in the soil temperature under different irrigation depths during the seeding, budding and flowering and boll setting stages. W0.6, W0.8, W1.0, and W1.2 correspond to 60%, 80%, 100%, and 120% ETc, respectively.
Agronomy 15 01674 g008
Figure 9. Soil temperature (°C) at different soil layers at different growing stages under various irrigation depths. Different letters on bars mean a significant difference at p < 0.05 according to Duncan’s tests. * Significant different at the 0.05 probability level, ** Significant different at the 0.01 probability level, *** Significant different at the 0.001 probability level, while ns means no significant difference. W0.6, W0.8, W1.0, and W1.2 correspond to 60%, 80%, 100%, and 120% ETc, respectively. S, B, FB, and BO correspond to the seeding, budding, flowering and boll setting, and boll opening stages, respectively.
Agronomy 15 01674 g009
Figure 10. The distribution of soil water content within the 0~60 cm soil profile under W0.6, W0.8, W1.0, and W1.2 during the budding stage (a~d; A~D), flowering and boll setting stage (e~h; E~H), and boll opening stage (i~l; I~L) in 2018 and 2019.
Agronomy 15 01674 g010
Figure 11. Soil water storage within the 0–60 cm soil profile under various irrigation depths during the 2018 and 2019 cotton growing seasons at Koalr, Xinjiang Province, China; W0.6, W0.8, W1.0, and W1.2 correspond to 60%, 80%, 100%, and 120% ETc, respectively.
Agronomy 15 01674 g011
Figure 12. Path diagram of structure equation model. ST is soil temperature, SWS is soil water storage, C0 + C is the total variability of soil moisture, BN is boll number, BW is boll weight, Y is seed cotton yield. χ2/df is chi-square/degree values, GFI is goodness-of-fit index, CFI is comparative fit index, NFI is non-normed fit index, RMSEA is root mean square error of approximation. The solid lines represent positive paths, while the dashed lines represent a negative relationship between the two variables, the data on the arrow are the standardized path coefficient (λ), and the width of arrows is proportional to the strength of path coefficients adjacent to the path coefficient (λ). *, **, and *** mean p < 0.05, p < 0.01, and p < 0.001.
Agronomy 15 01674 g012
Table 1. Soil properties at the experimental site. Clay (particle diameter < 0.002 mm)%, silt (particle diameter 0.002–0.05 mm)%, and sand (particle diameter 0.05–2 mm)%.
Depth (cm)Soil TextureSoil Mechanical Composition (%)Bulk Density (g cm−3)Field Capacity (%)
ClaySiltSand
0~10Sandy loam2.0043.5454.461.5820.67
10~20Silt loam3.3049.3047.411.6022.82
20~30Silt loam2.2854.0343.691.5916.14
30~40Silt loam3.3748.2348.401.5617.46
40~60Sandy loam3.1244.7952.091.6320.08
60~80Sandy0.0010.1689.841.6412.20
Table 2. Horizontal soil moisture content variation under various irrigation depths during different growth stages of cotton.
StagesSoil Depth (cm)20182019
SMC (%)SMC (%)
W0.6W0.8W1.0W1.2W0.6W0.8W1.0W1.2
# CV# CV# CV#CV# CV# CV# CV# CV
B0~100.121 0.198 0.129 0.190 0.137 0.219 0.140 0.189 0.114 0.175 0.113 0.139 0.120 0.173 0.125 0.173
10~200.122 0.186 0.127 0.128 0.140 0.159 0.143 0.135 0.104 0.091 0.112 0.134 0.127 0.155 0.122 0.188
20~300.139 0.208 0.143 0.208 0.146 0.207 0.141 0.187 0.124 0.053 0.127 0.134 0.143 0.127 0.147 0.150
30~400.171 0.129 0.174 0.166 0.175 0.213 0.180 0.207 0.156 0.052 0.167 0.030 0.173 0.027 0.174 0.073
40~600.236 0.069 0.236 0.055 0.235 0.027 0.234 0.019 0.225 0.014 0.232 0.025 0.235 0.017 0.231 0.023
F&BS 0~100.110 0.135 0.117 0.166 0.126 0.150 0.124 0.159 0.116 0.087 0.119 0.100 0.125 0.117 0.134 0.152
10~200.107 0.120 0.113 0.145 0.113 0.081 0.122 0.112 0.108 0.107 0.118 0.136 0.116 0.127 0.132 0.217
20~300.121 0.153 0.121 0.089 0.128 0.192 0.142 0.217 0.118 0.226 0.121 0.301 0.129 0.229 0.146 0.216
30~400.149 0.166 0.153 0.178 0.162 0.164 0.169 0.159 0.150 0.159 0.163 0.168 0.167 0.184 0.177 0.219
40~600.225 0.076 0.228 0.095 0.233 0.070 0.229 0.068 0.224 0.077 0.225 0.072 0.234 0.079 0.231 0.089
BO0~100.103 0.131 0.113 0.052 0.119 0.074 0.120 0.055 0.118 0.087 0.125 0.127 0.131 0.101 0.126 0.123
10~200.117 0.054 0.127 0.149 0.132 0.096 0.131 0.127 0.130 0.206 0.140 0.152 0.144 0.129 0.146 0.166
20~300.145 0.043 0.159 0.187 0.161 0.164 0.160 0.148 0.146 0.101 0.151 0.177 0.161 0.163 0.166 0.073
30~400.174 0.146 0.182 0.148 0.194 0.127 0.208 0.125 0.171 0.137 0.179 0.143 0.182 0.124 0.195 0.121
40~600.220 0.087 0.232 0.045 0.238 0.026 0.239 0.029 0.233 0.031 0.237 0.042 0.236 0.043 0.236 0.038
# is the average value of SMC at different soil depths (%). CV = standard deviation/average. B, F&BS, and BO correspond to budding, flowering and boll setting, and boll opening stages, respectively. W0.6, W0.8, W1.0, and W1.2 correspond to 60%, 80%, 100%, and 120% ETc, respectively.
Table 3. Vertical soil moisture content variation under various irrigation depths during different growth stages of cotton.
YearStagesLocationSMC (%)
W0.6W0.8W1.0W1.2
0–2020–40SR0–2020–40SR0–2020–40SR0–2020–40SR
2018BA0.140 0.187 1.334 0.143 0.194 1.357 0.157 0.202 1.284 0.149 0.201 1.351
B0.132 0.147 1.109 0.134 0.157 1.167 0.161 0.219 1.359 0.159 0.155 0.975
C0.124 0.156 1.252 0.134 0.157 1.166 0.149 0.166 1.111 0.150 0.156 1.043
D0.089 0.130 1.460 0.101 0.126 1.257 0.121 0.170 1.405 0.109 0.130 1.199
F&BSA0.110 0.161 1.462 0.120 0.154 1.276 0.119 0.170 1.432 0.121 0.192 1.582
B0.121 0.126 1.040 0.120 0.130 1.084 0.131 0.140 1.067 0.129 0.136 1.060
C0.113 0.114 1.008 0.128 0.117 0.915 0.119 0.154 1.300 0.140 0.146 1.048
D0.090 0.139 1.544 0.092 0.147 1.606 0.123 0.175 1.423 0.102 0.149 1.461
BOA0.102 0.160 1.566 0.115 0.159 1.389 0.121 0.174 1.431 0.123 0.179 1.452
B0.120 0.173 1.444 0.134 0.200 1.496 0.139 0.205 1.482 0.140 0.197 1.404
C0.116 0.166 1.433 0.126 0.184 1.463 0.129 0.186 1.446 0.124 0.208 1.672
D0.102 0.138 1.355 0.106 0.137 1.293 0.114 0.145 1.271 0.114 0.152 1.338
2019BA0.112 0.138 1.237 0.121 0.154 1.271 0.139 0.170 1.219 0.138 0.187 1.350
B0.115 0.141 1.221 0.115 0.151 1.318 0.127 0.150 1.182 0.134 0.154 1.147
C0.120 0.141 1.177 0.123 0.140 1.131 0.131 0.162 1.231 0.130 0.154 1.187
D0.090 0.140 1.557 0.092 0.144 1.562 0.096 0.151 1.581 0.092 0.148 1.617
F&BSA0.123 0.171 1.386 0.134 0.190 1.418 0.134 0.192 1.438 0.160 0.209 1.307
B0.106 0.125 1.184 0.112 0.126 1.120 0.125 0.128 1.026 0.142 0.142 1.001
C0.117 0.118 1.006 0.123 0.125 1.010 0.117 0.132 1.126 0.127 0.158 1.243
D0.103 0.123 1.199 0.100 0.130 1.244 0.106 0.140 1.317 0.104 0.137 1.322
BOA0.132 0.173 1.312 0.150 0.188 1.250 0.153 0.194 1.268 0.160 0.201 1.257
B0.145 0.173 1.187 0.145 0.178 1.230 0.142 0.185 1.302 0.140 0.184 1.316
C0.116 0.154 1.331 0.124 0.163 1.317 0.139 0.169 1.221 0.128 0.175 1.361
D0.104 0.135 1.297 0.113 0.131 1.164 0.116 0.138 1.194 0.116 0.160 1.381
A, B, C, and D correspond to the locations in Figure 3. B, F&BS, and BO correspond to budding, flowering and boll setting, and boll opening stages, respectively. W0.6, W0.8, W1.0, and W1.2 correspond to 60%, 80%, 100%, and 120% ETc, respectively.
Table 4. Indicator semivariogram models of soil moisture content.
StagesIrrigation Depth20182019
ModelC0C0 + CC0/(C0 + C)AR2ModelC0C0 + CC0/(C0 + C)AR2
BW0.6Gaussian0.10041.2000.00272.4340.893Gaussian0.10041.2000.00274.1660.854
W0.8Gaussian0.10041.2000.00277.1460.902Gaussian0.10041.2000.00271.2740.868
W1.0Gaussian0.01031.0100.00068.1220.909Gaussian0.01031.0100.00065.0040.842
W1.2Gaussian0.01031.0100.00069.8020.937Gaussian0.01031.0100.00067.4900.849
F&BSW0.6Gaussian0.10041.2000.00270.4430.893Gaussian0.10041.2000.00270.0100.913
W0.8Gaussian0.10041.2000.00270.1480.920Gaussian0.10041.2000.00270.4430.961
W1.0Gaussian0.10041.2000.00268.3990.880Gaussian0.10041.2000.00265.2120.906
W1.2Gaussian0.01031.0100.00063.0810.904Gaussian0.01031.0100.00062.4580.921
BOW0.6Gaussian0.10041.2000.00276.7470.914Gaussian0.04031.0700.00168.0350.827
W0.8Gaussian0.80032.5900.02564.3460.900Gaussian0.01031.0100.00069.2300.881
W1.0Gaussian0.70032.3900.02262.9600.886Gaussian0.01031.0100.00078.4620.904
W1.2Gaussian1.10043.2000.02569.4550.925Gaussian0.01031.0100.00073.6470.926
B, F&BS, and BO correspond to budding, flowering and boll setting, and boll opening stages, respectively. W0.6, W0.8, W1.0, and W1.2 correspond to 60%, 80%, 100%, and 120% ETc, respectively.
Table 5. The correlation of irrigation depth, soil temperature, soil moisture content and seed cotton yield.
IndexYieldI1I2I3I4T1T2T3T4SMC1SMC2SMC3SMC4
Yield1.00
I10.471.00
I20.79 **−0.021.00
I30.84 **0.090.99 ***1.00
I40.73 *−0.140.99 ***0.97 ***1.00
T1−0.080.73 *−0.26−0.18−0.351.00
T2−0.100.83 **−0.50−0.41−0.610.87 **1.00
T3−0.65 *0.24−0.74 *−0.70 *−0.77 *0.570.70 *1.00
T40.120.92 ***−0.28−0.18−0.400.88 **0.97 ***0.591.00
SMC1−0.47−1.00 ***0.02−0.090.14−0.73 *−0.83 **−0.24−0.92 ***1.00
SMC20.92 ***0.69 *0.65 *0.71 *0.560.230.19−0.440.39−0.69 *1.00
SMC30.66 *−0.220.96 ***0.93 ***0.99 ***−0.40−0.66 *−0.78 *−0.470.220.501.00
SMC40.64 *−0.300.90 **0.87 **0.92 ***−0.57−0.70 *−0.68 *−0.510.300.370.88 **1.00
I1, I2, I3, and I4 correspond to irrigation depths in the seeding, budding, flower and boll setting, and boll opening stages, respectively. T1, T2, T3, and T4 correspond to the soil temperature in the seeding, budding, flower and boll setting, and boll opening stages, respectively. SMC1, SMC2, SMC3, and SMC4 correspond to the soil moisture content in the seeding, budding, flower and boll setting, and boll opening stages, respectively. The values in the table are correlation coefficients. * Significantly different at the 0.05 probability level, ** Significantly different at the 0.01 probability level, *** Significantly different at the 0.001 probability level.
Disclaimer/Publisher’s Note: The statements, opinions and data contained in all publications are solely those of the individual author(s) and contributor(s) and not of MDPI and/or the editor(s). MDPI and/or the editor(s) disclaim responsibility for any injury to people or property resulting from any ideas, methods, instructions or products referred to in the content.

