Article

Comparative Analysis of Ratoon-Competent and Ratoon-Deficient Sugarcane by Hormonal and Transcriptome Profiling

1
State Key Laboratory of Tropical Crop Breeding, Sugarcane Research Institute, Yunnan Academy of Agricultural Sciences, Yunnan Key Laboratory of Sugarcane Genetic Improvement, Kaiyuan 661699, China
2
State Key Laboratory of Tropical Crop Breeding, Institute of Tropical Bioscience and Biotechnology, Sanya Research Institute, Chinese Academy of Tropical Agricultural Sciences, Sanya 572024, China
*
Authors to whom correspondence should be addressed.
Agronomy 2025, 15(7), 1669; https://doi.org/10.3390/agronomy15071669
Submission received: 30 May 2025 / Revised: 3 July 2025 / Accepted: 8 July 2025 / Published: 10 July 2025
(This article belongs to the Section Crop Breeding and Genetics)

Abstract

The ratooning capacity of sugarcane cultivars represents a crucial agronomic trait that significantly influences the sustainability of crop yields. This study elucidates the physiological and molecular mechanisms underlying the sugarcane ratooning ability observed in ratoon-competent GuiTang 29 (GT29) and ratoon-deficient Badila cultivars following stem excision. Through integrated hormonal profiling and transcriptome analysis, we identified significant differences in hormone levels and gene expression patterns. The quantification of 15 endogenous hormones via HPLC revealed marked reductions in zeatin (ZA) and zeatin riboside (ZR) in both cultivars. Additionally, GT29 exhibited notable reductions in gibberellins (GA3 and GA5) and strigolactone (5-DS) post-stem-excision, while Badila displayed stable or distinct hormonal changes. Additionally, Gene Ontology (GO) and Kyoto Encyclopedia of Genes and Genomes (KEGG) enrichment analyses indicated that hormone signal transduction, MAPK signaling pathways, phenylpropanoid biosynthesis, flavonoid biosynthesis, and other metabolic pathways were significantly enriched in both GT29 and Badila, with a particularly higher enrichment of plant hormone signal transduction in GT29. Furthermore, several differentially expressed genes (DEGs) had different expression patterns between GT29 and Badila, including the cytokinin receptor B-ARR and transcription factor A-ARR, gibberellin pathway components GID1 and DELLA, and AUX/IAA and SAUR in the auxin pathway. The real-time quantitative PCR (qRT-PCR) validation of 12 DEGs corroborated the RNA-seq data, further supporting the reliability of the transcriptomic analysis. This study delineates a clear molecular framework distinguishing ratoon competence, offers novel insights into the molecular basis of perennial regeneration and provides reliable candidate genes for functional marker development in sugarcane breeding.

1. Introduction

Sugarcane (Saccharum spp. hybrids), a globally vital C4 crop, supplies approximately 80% of commercial sugar and 40% of bioethanol production [1]. The ratooning process in sugarcane fundamentally depends on the activation of tiller buds at basal stem nodes, where dormant buds develop into productive tillers that ultimately form sucrose-accumulating stalks. This bud sprouting mechanism directly determines ratoon longevity and yield potential. Globally, ratoon sugarcane occupies over 75% of the total cultivation area, typically maintained through production cycles of 2 to 7 years. In contrast, China’s ratoon systems cover 60% of the sugarcane area but persist for only 1–2 years, significantly constraining industrial efficiency and cost competitiveness [2]. Therefore, developing ratoon-competent cultivars through genomic breeding has become a strategic priority for sustainable sugarcane production.
In sugarcane production systems, ratooning ability serves as a key agronomic trait for evaluating the regeneration capacity and economic viability of sugarcane varieties. Varieties that exhibit ratoon competency demonstrate a higher underground bud germination rate and vigorous tillering capacity, which facilitate the rapid establishment of a robust seedling population and ensure uniform field stand development [3]. Under appropriate cultivation and management practices, the yield of ratoon crops from such varieties can approach or even surpass that of plant cane, reflecting their high yield stability and productive potential [4]. From an economic perspective, ratoon-competent varieties substantially reduce production costs by minimizing the need for repeated plowing, seed cane procurement, and replanting [5]. In contrast, varieties with ratoon-deficient performance often experience low shoot emergence rates, necessitating replanting, which increases input costs and results in reduced yields in successive ratoon crops. This decline in productivity hampers the sustainability of sugarcane production systems [6]. Therefore, the development and adoption of ratoon-competent sugarcane cultivars can significantly enhance regenerative capacity, improve yield performance, lower production expenditures, and promote the sustainable development of the sugarcane industry.
The dynamics of basal bud sprouting govern both primary crop yield and ratoon regeneration. The activation of underground buds establishes new growth points, while residual stem buds compensate for yield losses related to lodging. Crucially, the sprouting vigor of these latent buds directly determines the effective stalk numbers. Understanding the molecular drivers of bud activation thus holds key implications for yield enhancement [7]. Previous studies have established correlations between ratoon competence and tillering capacity [8,9], with distinct phytohormonal profiles observed in ratoon-competent versus -deficient cultivars [10]. In rice, key tillering-related genes including OsMAX1a, OsMAX1b, OsMAX1c, OsMAX1d, and OsMAX1e [11] have been characterized, providing foundational genetic resources. Previous studies have identified quantitative trait loci (QTLs) and candidate genes associated with tillering and ratoon ability in sugarcane through genetic maps constructed using high-density SNP microarrays [12]. Li et al. employed transcriptomics and metabolomics approaches to investigate the molecular basis underlying superior sugarcane traits [13]. Additionally, genome-wide association studies (GWASs) and genomic prediction have identified candidate genes and molecular markers linked to ratoon ability, offering preliminary data to support genome-assisted breeding efforts aimed at improving ratoon traits in sugarcane [14]. Through transcriptomic and phytohormonal analyses of 23 rice varieties, Henry et al demonstrated that auxin plays a pivotal role in the formation of perennial roots [15]. However, the molecular mechanisms underlying basal bud activation in sugarcane ratoons remain poorly elucidated.
Given this, this study will focus on two sugarcane cultivars with significant differences in ratoon performance. Plant endogenous hormone and transcriptome sequencing analyses were conducted by truncating stems at the jointing stage, collecting tissues after 1 d, 3 d, and without truncation. From both physiological and transcriptomic perspectives, the characteristics of the experimental materials after truncation regarding changes in plant endogenous hormones, differential gene expression, and metabolic pathway response were analyzed. Subsequently, the key metabolic pathways and candidate genes affecting root performance were identified. The aim of this study was to analyze the mechanism of rapid sprouting of basal buds of ratoon-competent sugarcane through molecular and physiological studies, so as to lay a foundation for the cultivation of ratoon-competent sugarcane.

2. Materials and Methods
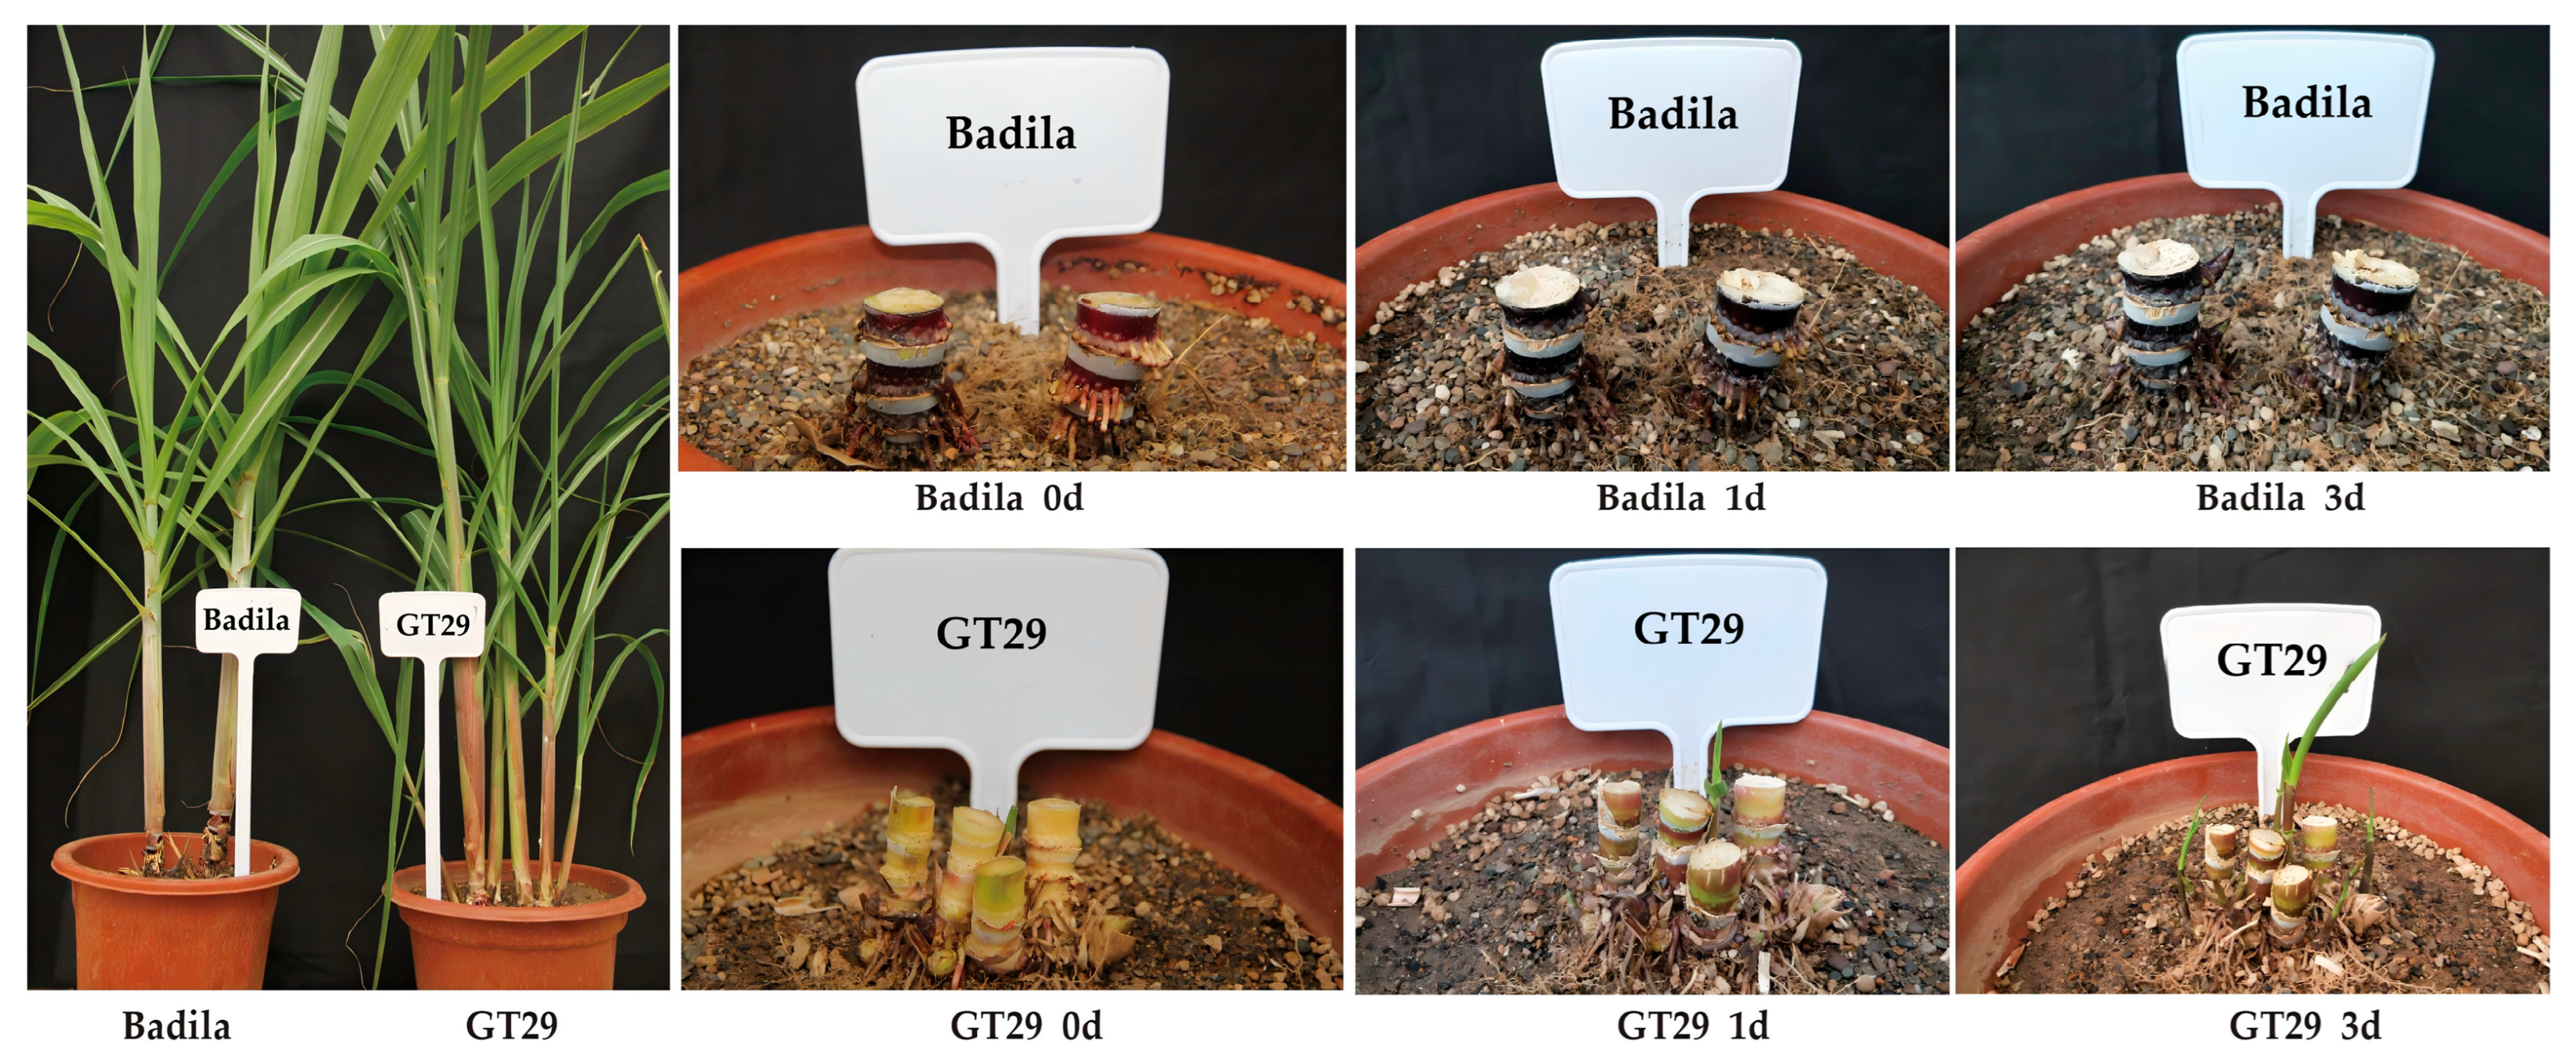
2.1. Materials

Two sugarcane cultivars, GuiTang29 (GT29) and Badila were selected as the research materials. The sugarcane cultivar GT29 possesses moderate drought tolerance, high sucrose content, robust ratooning ability, and strong potential for effective stem development [16]. In contrast, the cultivar Badila exhibits poor performance under drought stress, which may adversely impact its ratooning capacity [17]. Furthermore, ratoon yield in Badila significantly declined following disease infection, indicating its susceptibility and limited regeneration potential [18]. Both cultivars’ germplasm materials were obtained from the national sugarcane germplasm resources nursery at the Sugarcane Research Institute, Yunnan Academy of Agricultural Sciences, Kaiyuan, China.

2.2. Methods

Single-bud stems derived from the two sugarcane germplasm materials were cultivated in plastic pots with two stems per pot starting on 15 May 2024. All plants were maintained under standard greenhouse conditions. Following stem emergence, specimens exhibiting uniform growth and morphological normality were selected for stem excision. At 110 days post-planting, when the plants reached the jointing stage (Figure 1), experimental stem excision was performed. In the genotype GT29, which exhibits normal regenerative capacity, bud germination was observed within three days following stem decapitation. In contrast, the ratoon-deficient Badila exhibited no regenerative response. Basal tissues from the main stem stubble were collected at 0 (control), 1, and 3 days post-excision, immediately frozen in liquid nitrogen, and maintained in triplicate biological replicates. The samples were subsequently divided for parallel analyses: one batch underwent transcriptome sequencing at BGI Genomics (Shenzhen, China; accessed on 18 October 2024), while another batch was processed for phytohormone profiling at Suzhou Keming Biotechnology Co., Ltd. (Suzhou, China; accessed on 20 October 2024), with all specimens transported under cryogenic conditions.

2.3. Determination of Hormone Content

To quantify the endogenous hormone levels, a total of fifteen plant hormones were analyzed, including four cytokinins (kinetin, KT; 6-benzylaminopurine, 6-BA; zeatin, ZA; zeatin riboside, ZR), three auxins (indole-3-acetic acid, IAA; chlorinated IAA, CIAA; 1-naphthaleneacetic acid, NAA), five gibberellins (GA1, GA3, GA4, GA5, and GA7), two forms of abscisic acid (ABA; conjugated ABA, C-ABA), and one strigolactone (5-deoxystrigol, 5-DS).
All hormone measurements were performed by Suzhou Keming Biotechnology Co., Ltd. (Suzhou, China; accessed on 25 October 2024). Briefly, approximately 0.1 g of fresh tissue was ground in liquid nitrogen and extracted using a methanol-based extraction buffer. Following centrifugation and filtration, the supernatants were analyzed using an Agilent 1100 high-performance liquid chromatography (HPLC) system equipped with a Kromasil C18 reverse-phase column (250 mm × 4.6 mm, 5 μm). The mobile phase consisted of solvent A (0.1% formic acid in water) and solvent B (acetonitrile) under gradient elution conditions. Hormones were detected using UV absorbance at the appropriate wavelengths for each compound. Quantification was performed using external calibration with authenticated hormone standards, and both three biological and three technical replicates were conducted for hormone detection. All hormone changes were analyzed to explore their regulatory roles in the germination of basal buds following stem truncation treatment.

2.4. RNA Extraction, Transcriptome Sequencing, and Annotation

Total RNA extraction was performed by BGI, and transcriptome sequencing was conducted using the BGI BGISEQ-500 platform (Shenzhen, China; Shenzhen BGI Co., Ltd., accessed on 18 October 2024). High-quality clean reads were obtained using the SOAPnuke v1.4.0 filtering software independently developed by Shenzhen Huada Gene Co., Ltd. (Shenzhen, China), the de novo assembly of clean reads was executed using Trinity v2.1.1 assembly software, and Unigenes were obtained by clustering deredundancy of the transcripts using Tgicl-2.1. The quality of the assembled transcripts was assessed using the single-copy direct orthology database BUSCO 5.6.0. The coding regions in the Unigenes were predicted using TransDecoder V3.0.1 software. The Simple Sequence Repeat (SSR) sites of the Unigenes were detected using the MISA V1.0 software. The assembled Unigenes were annotated using BLAST software (version 2.16.0+) in seven functional databases (KEGG, GO, NR, NT, SwissProt, Pfam, and KOG).

2.5. DEGs Screening and Enrichment Analysis

Gene expression levels for each sample were calculated using RNA-Seq by Expectation-Maximization (RSEM). Principal Component Analysis (PCA) and Pearson correlation analysis were performed using the princomp function in R statistical software version 4.4.3. Differentially expressed genes (DEGs) between the treated and control samples were identified at a false discovery rate (FDR) < 0.001 and a fold change ≥ 2.0. Gene Ontology (GO) and Kyoto Encyclopedia of Genes and Genomes (KEGG) analyses were conducted for classification and enrichment assessment.

2.6. Real-Time Quantitative PCR Analysis

Samples of GT29 and Badila collected at different treatment time points were finely ground in a pre-chilled mortar using liquid nitrogen. Approximately 100 mg of the resulting powder from each sample was transferred into a 1.5 mL microcentrifuge tube for total RNA extraction. The extracted total RNA was then reverse-transcribed into first-strand cDNA, which was utilized for real-time quantitative PCR (qRT-PCR; accessed on 9 January 2025). A total of 12 DEGs were selected for qRT-PCR detection to verify the reliability of the transcriptome data. Using 18S rRNA as the reference gene, specific primers were designed based on the transcriptome sequences (Table 1). qRT-PCR reactions were performed on an analytikjena-qTOWER2.2 fluorescence quantitative PCR instrument using the DBI Bioscience 2 SYBR® Green Master Mix (DBI) fluorescence quantification kit (Karlsruhe, Germany). Three biological and three technical replicates were performed using the 2−ΔΔCt method [16].

2.7. Statistical Analysis of the Data

The data were processed by the Microsoft Excel 2019 software, data variance analysis and the LSD method significance test were performed using SPSS21 software, and mapping by OriginPro2021 software.

3. Results

3.1. Characteristic Analysis of Hormone Content

3.1.1. Characteristics of CTK Content

Phytohormonal profiling revealed differential cytokinin dynamics in response to stem excision (Figure 2, Table S1). Among the four quantified cytokinins, ZA and ZR exhibited consistent depletion patterns in both ratoon-competent GT29 and -deficient Badila cultivars at 1 and 3 days after treatment, suggesting their universal regulatory role in post-excision tiller initiation. In Badila, KT content showed no significant increase during the two post-truncation periods. However, in ratoon-competent germplasm Gui-tang29, KT content exhibited a significant elevation at 1 d after truncation, followed by a subsequent increase at 3 d post-truncation. These observations suggest that KT might be associated with the rapid growth mechanism in ratoon-competent germplasms. Contrastingly, 6-BA showed no significant variations in either cultivar, excluding its direct participation in early tillering regulation.

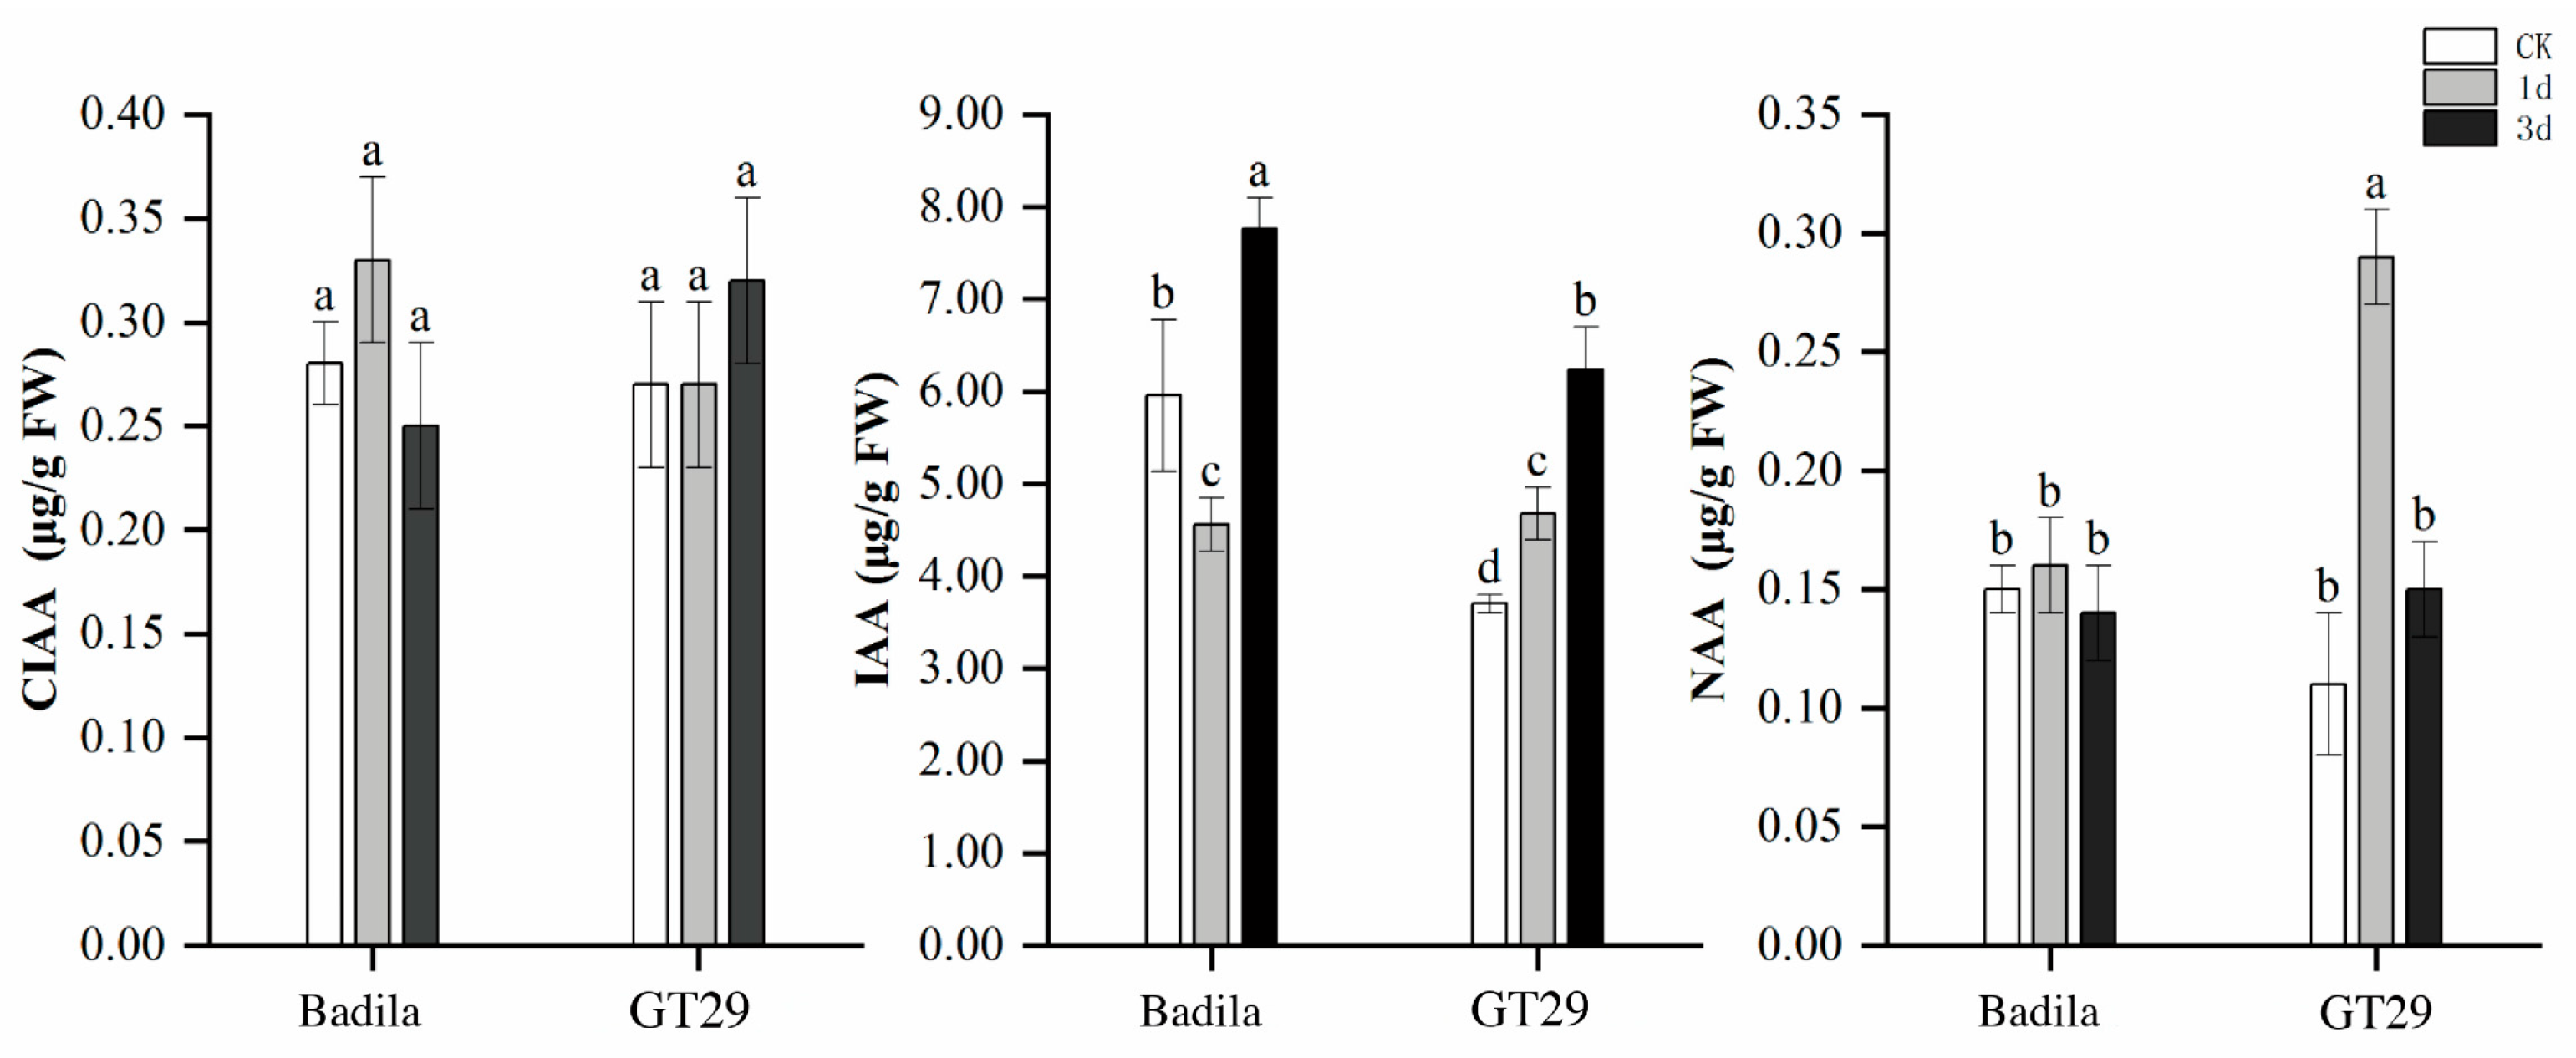
3.1.2. Characteristics of IAA Content

Auxin serves as the primary phytohormone regulating both the rate and directionality of plant growth [19]. This regulatory molecule facilitates cell elongation through cell wall relaxation while coordinating overall plant development [20,21]. We quantified three forms of auxin—CIAA, IAA, and NAA—following stem excision in the ratoon-competent GT29 and -deficient Badila cultivars (Figure 3, Table S2). CIAA levels remained stable in both cultivars throughout the observation period, suggesting minimal involvement in the differentiation of ratoon ability. Notably, IAA dynamics differed substantially between two cultivars; Badila displayed an initial decrease 1 day post-stem-excision followed by a significant elevation at day 3, while GT29 exhibited sustained increases from day 1 onward. These temporal patterns suggested superior IAA response kinetics in the ratoon-competent genotype, potentially facilitating rapid basal bud germination. NAA concentrations showed no significant variation in Badila but demonstrated a transient elevation at day 1 in GT29 before returning to baseline levels, indicating a possible involvement in the early regeneration processes of ratoon-competent cultivars.

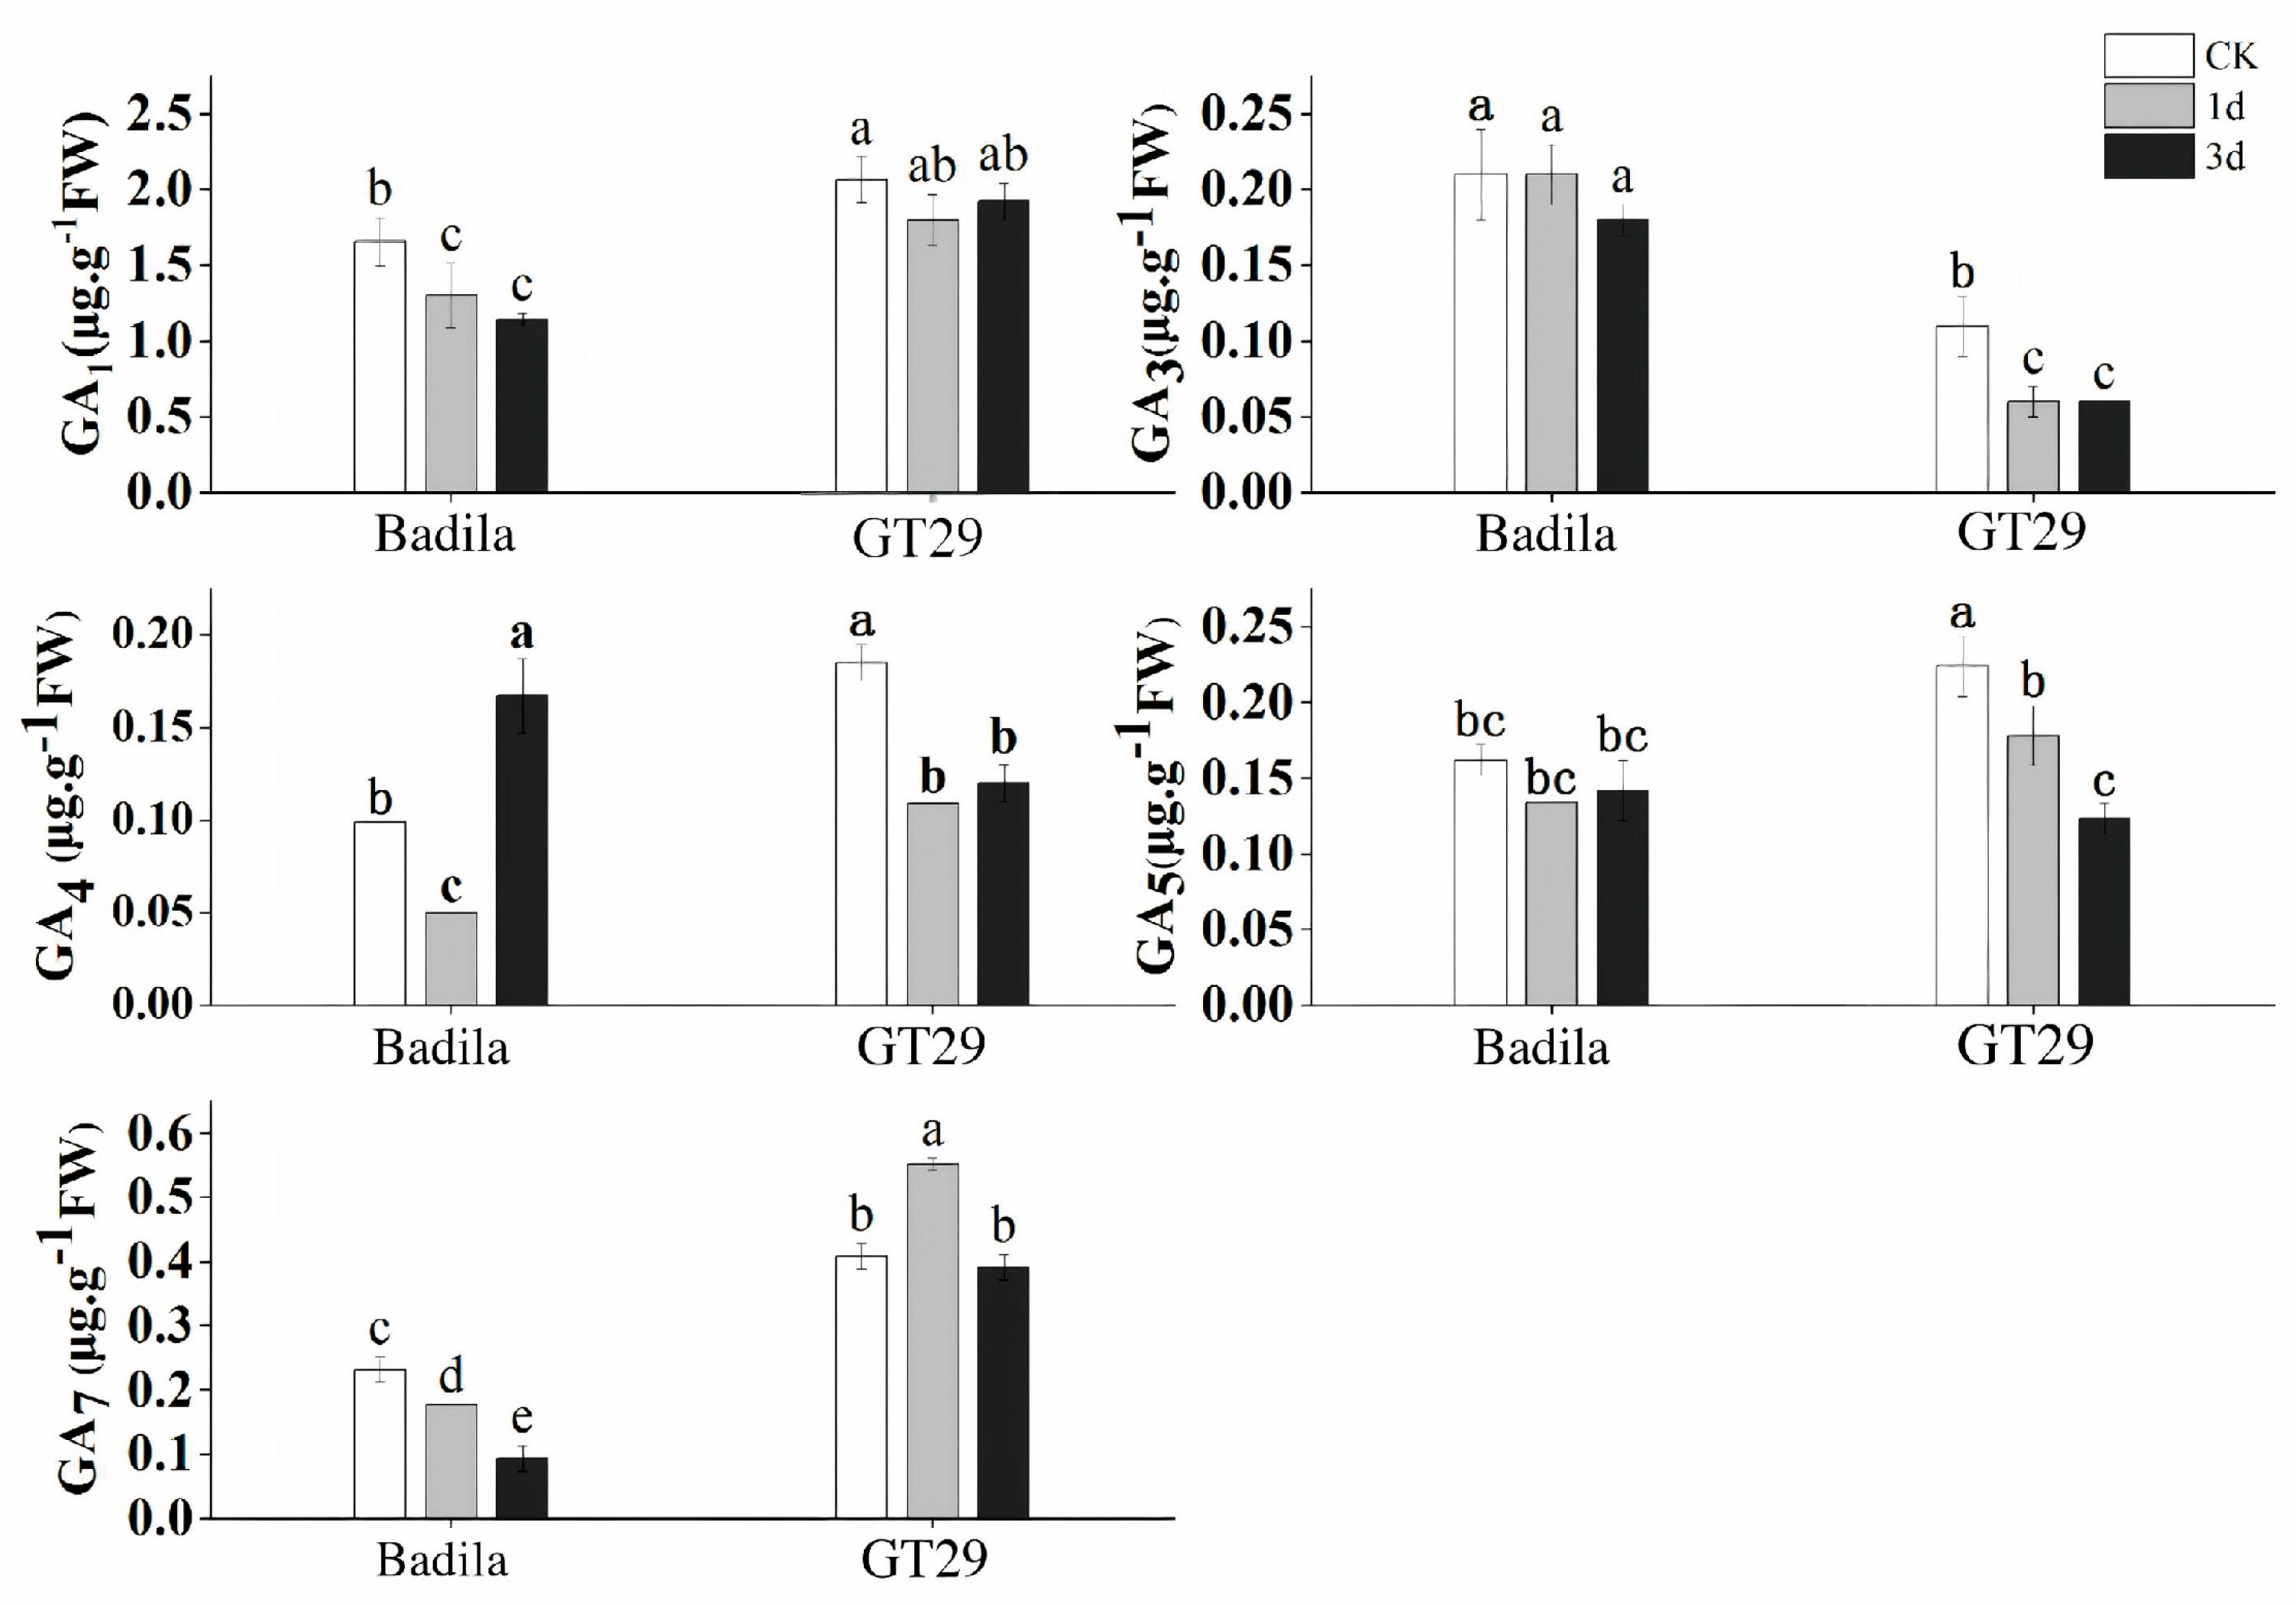
3.1.3. Characteristics of GA Content

The variations in five GA species were quantified following treatment (Figure 4, Table S3). Badila exhibited significant reductions in GA1 content, while GT29 maintained stable GA1 levels throughout the observation period. This stability potentially facilitated basal stem bud germination in GT29. Notably, GA3 and GA5 concentrations showed significant decreases exclusively in GT29 post-truncation, while Badila demonstrated no statistically significant alterations. Divergent temporal patterns emerged in GA4 dynamics; Badila displayed an initial decline followed by recovery, whereas GT29 exhibited sustained reduction. GA7 profiles differed markedly between the two cultivars, with Badila showing significant depletion while GT29 demonstrated a transient increase preceding subsequent decline.

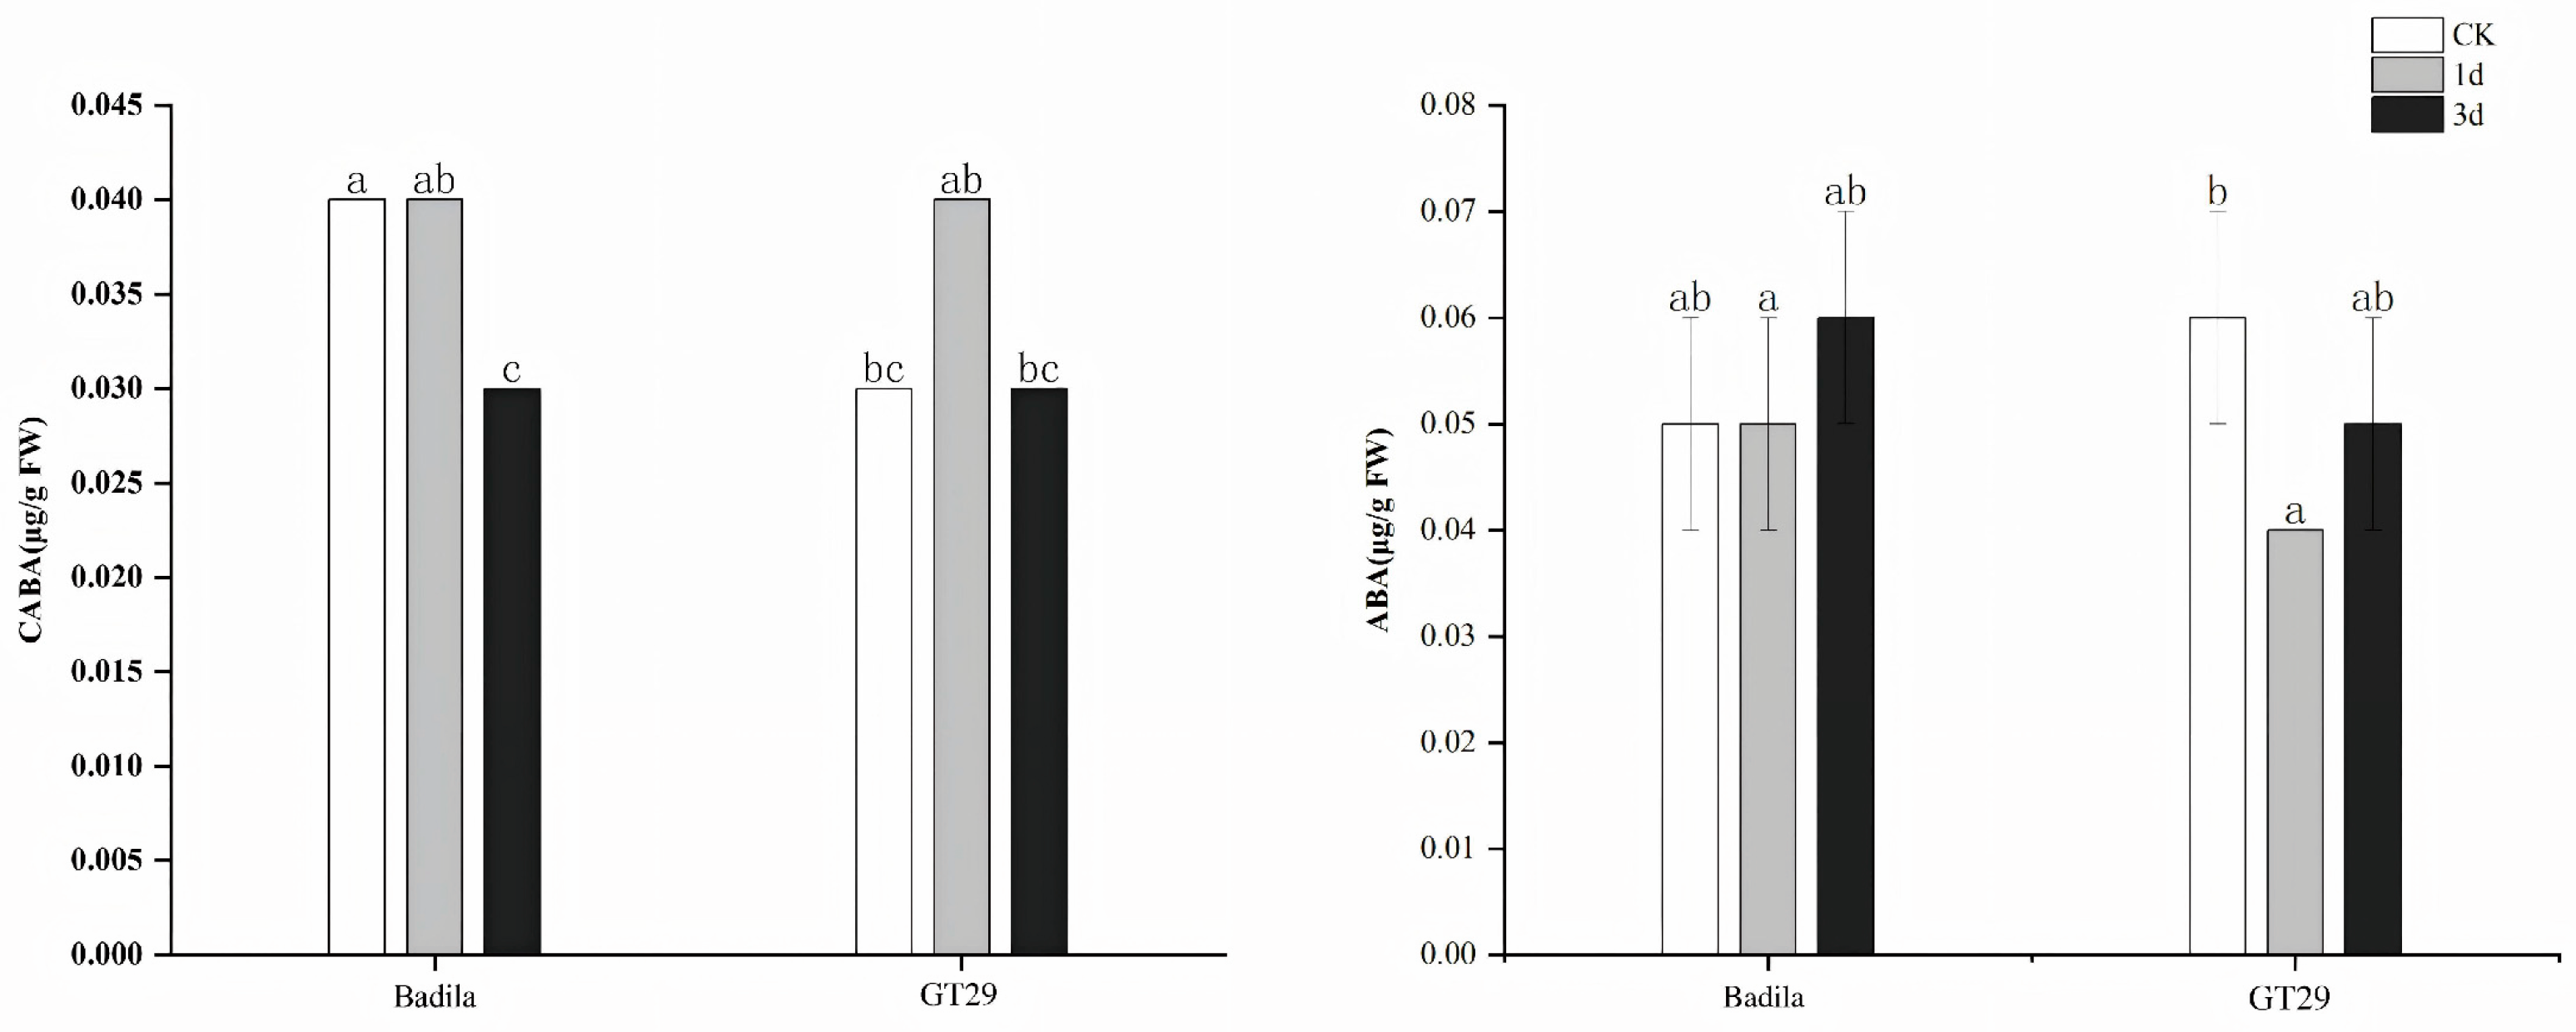
3.1.4. Characteristics of ABA Content

The ABA quantification results following stem excision treatments revealed distinct dynamic patterns between the two cultivars (Figure 5, Table S4). In Badila, CABA levels significantly decreased after 3 days of treatment compared to the untreated controls. Conversely, GT29 exhibited a transient 1.8-fold increase in CABA levels at 1 day post-treatment, followed by a return to baseline levels by day 3. While ABA concentrations remained stable in Badila throughout the experimental period, GT29 displayed an initial 40% ABA reduction at day 1, with partial recovery observed at day 3. These findings suggest that moderated ABA levels may facilitate growth recovery and tiller initiation in perennial root systems with vigorous regenerative capacity.

3.1.5. Characteristics of 5-DS Content

We analyzed 5-DS content changes following stem truncation in the two sugarcane cultivars. Badila showed no significant alteration in 5-DS levels, while GT29 exhibited a remarkable 68.3% reduction from 105.88 μg·g−1 FW to 33.51 μg·g−1 FW (Figure 6, Table S5). This differential response suggests that 5-DS may serve as a key regulatory factor in ratoon-competent-capacity germplasm.

3.2. Transcriptome Analysis
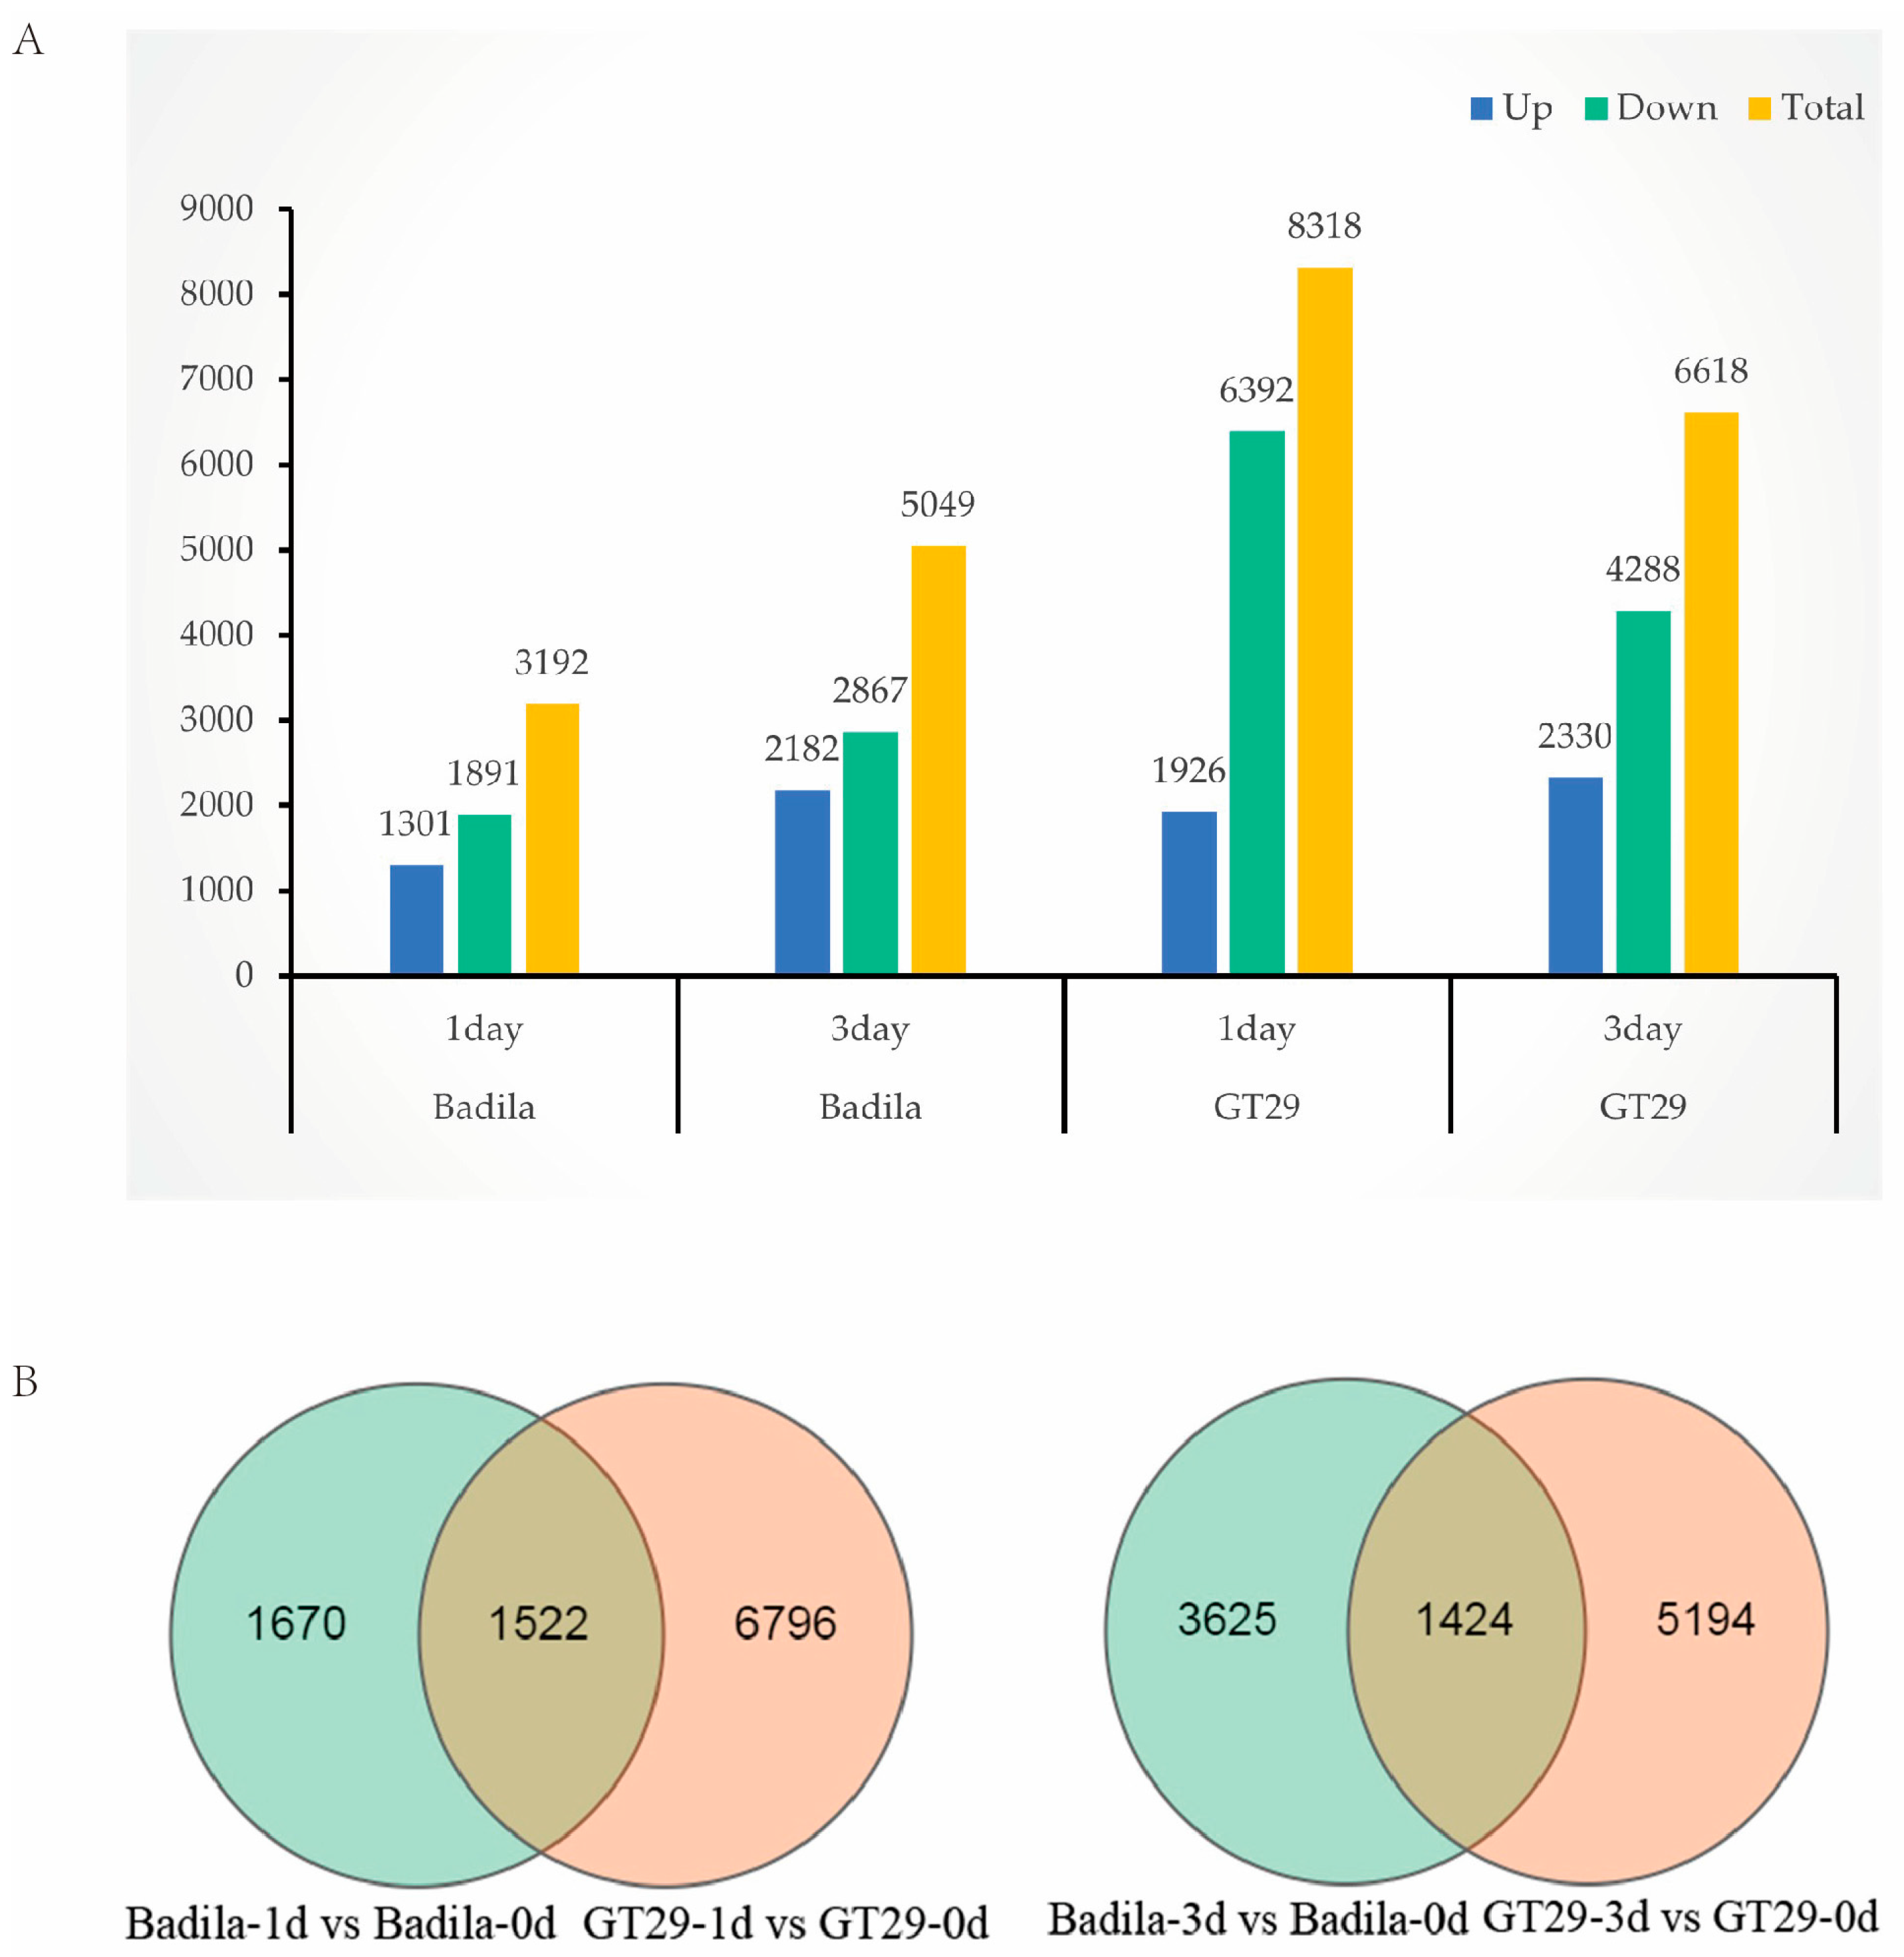
Sequencing generated 188.42 Gb of high-quality clean reads using the BGISEQ-500 platform, with an average of 10.47 Gb per sample. The clean reads exhibited mean base quality scores of Q20 = 97.10% and Q30 = 92.48% (Table 2), demonstrating satisfactory data quality for downstream analyses. The subsequent functional annotation of Unigenes across seven databases successfully annotated a total of 198,985 Unigenes.

3.3. DEGs Screening

DESeq2 analysis was performed using ratoon-competent GT29 and ratoon-deficient Badila as controls. DEGs were identified with thresholds of FDR < 0.001 and |log2FC| ≥ 2.0. In the ratoon-deficient cultivar Badila, 3192 (1301 upregulated and 1891 downregulated) and 5049 (2182 upregulated and 2867 downregulated) DEGs were detected at 1 day and 3 days post-truncation, respectively. The ratoon-competent cultivar GT29 exhibited substantially higher DEG numbers, with 8318 DEGs at 1 day post-truncation, including 1926 upregulated and 6392 downregulated genes, and 6618 DEGs at 3 days post-truncation, consisting of 2330 upregulated and 4288 downregulated genes (Figure 7A). Notably, GT29 demonstrated significantly greater transcriptional reprogramming than Badila, particularly in downregulated genes at 1 day post-truncation. Venn analysis revealed 1522 shared DEGs between the two cultivars after 1 day, with 1670 Badila-specific and 6796 GT29-specific DEGs. At 3 days post-truncation, 1424 shared DEGs were identified, alongside 3625 Badila-specific and 5194 GT29-specific DEGs (Figure 7B).

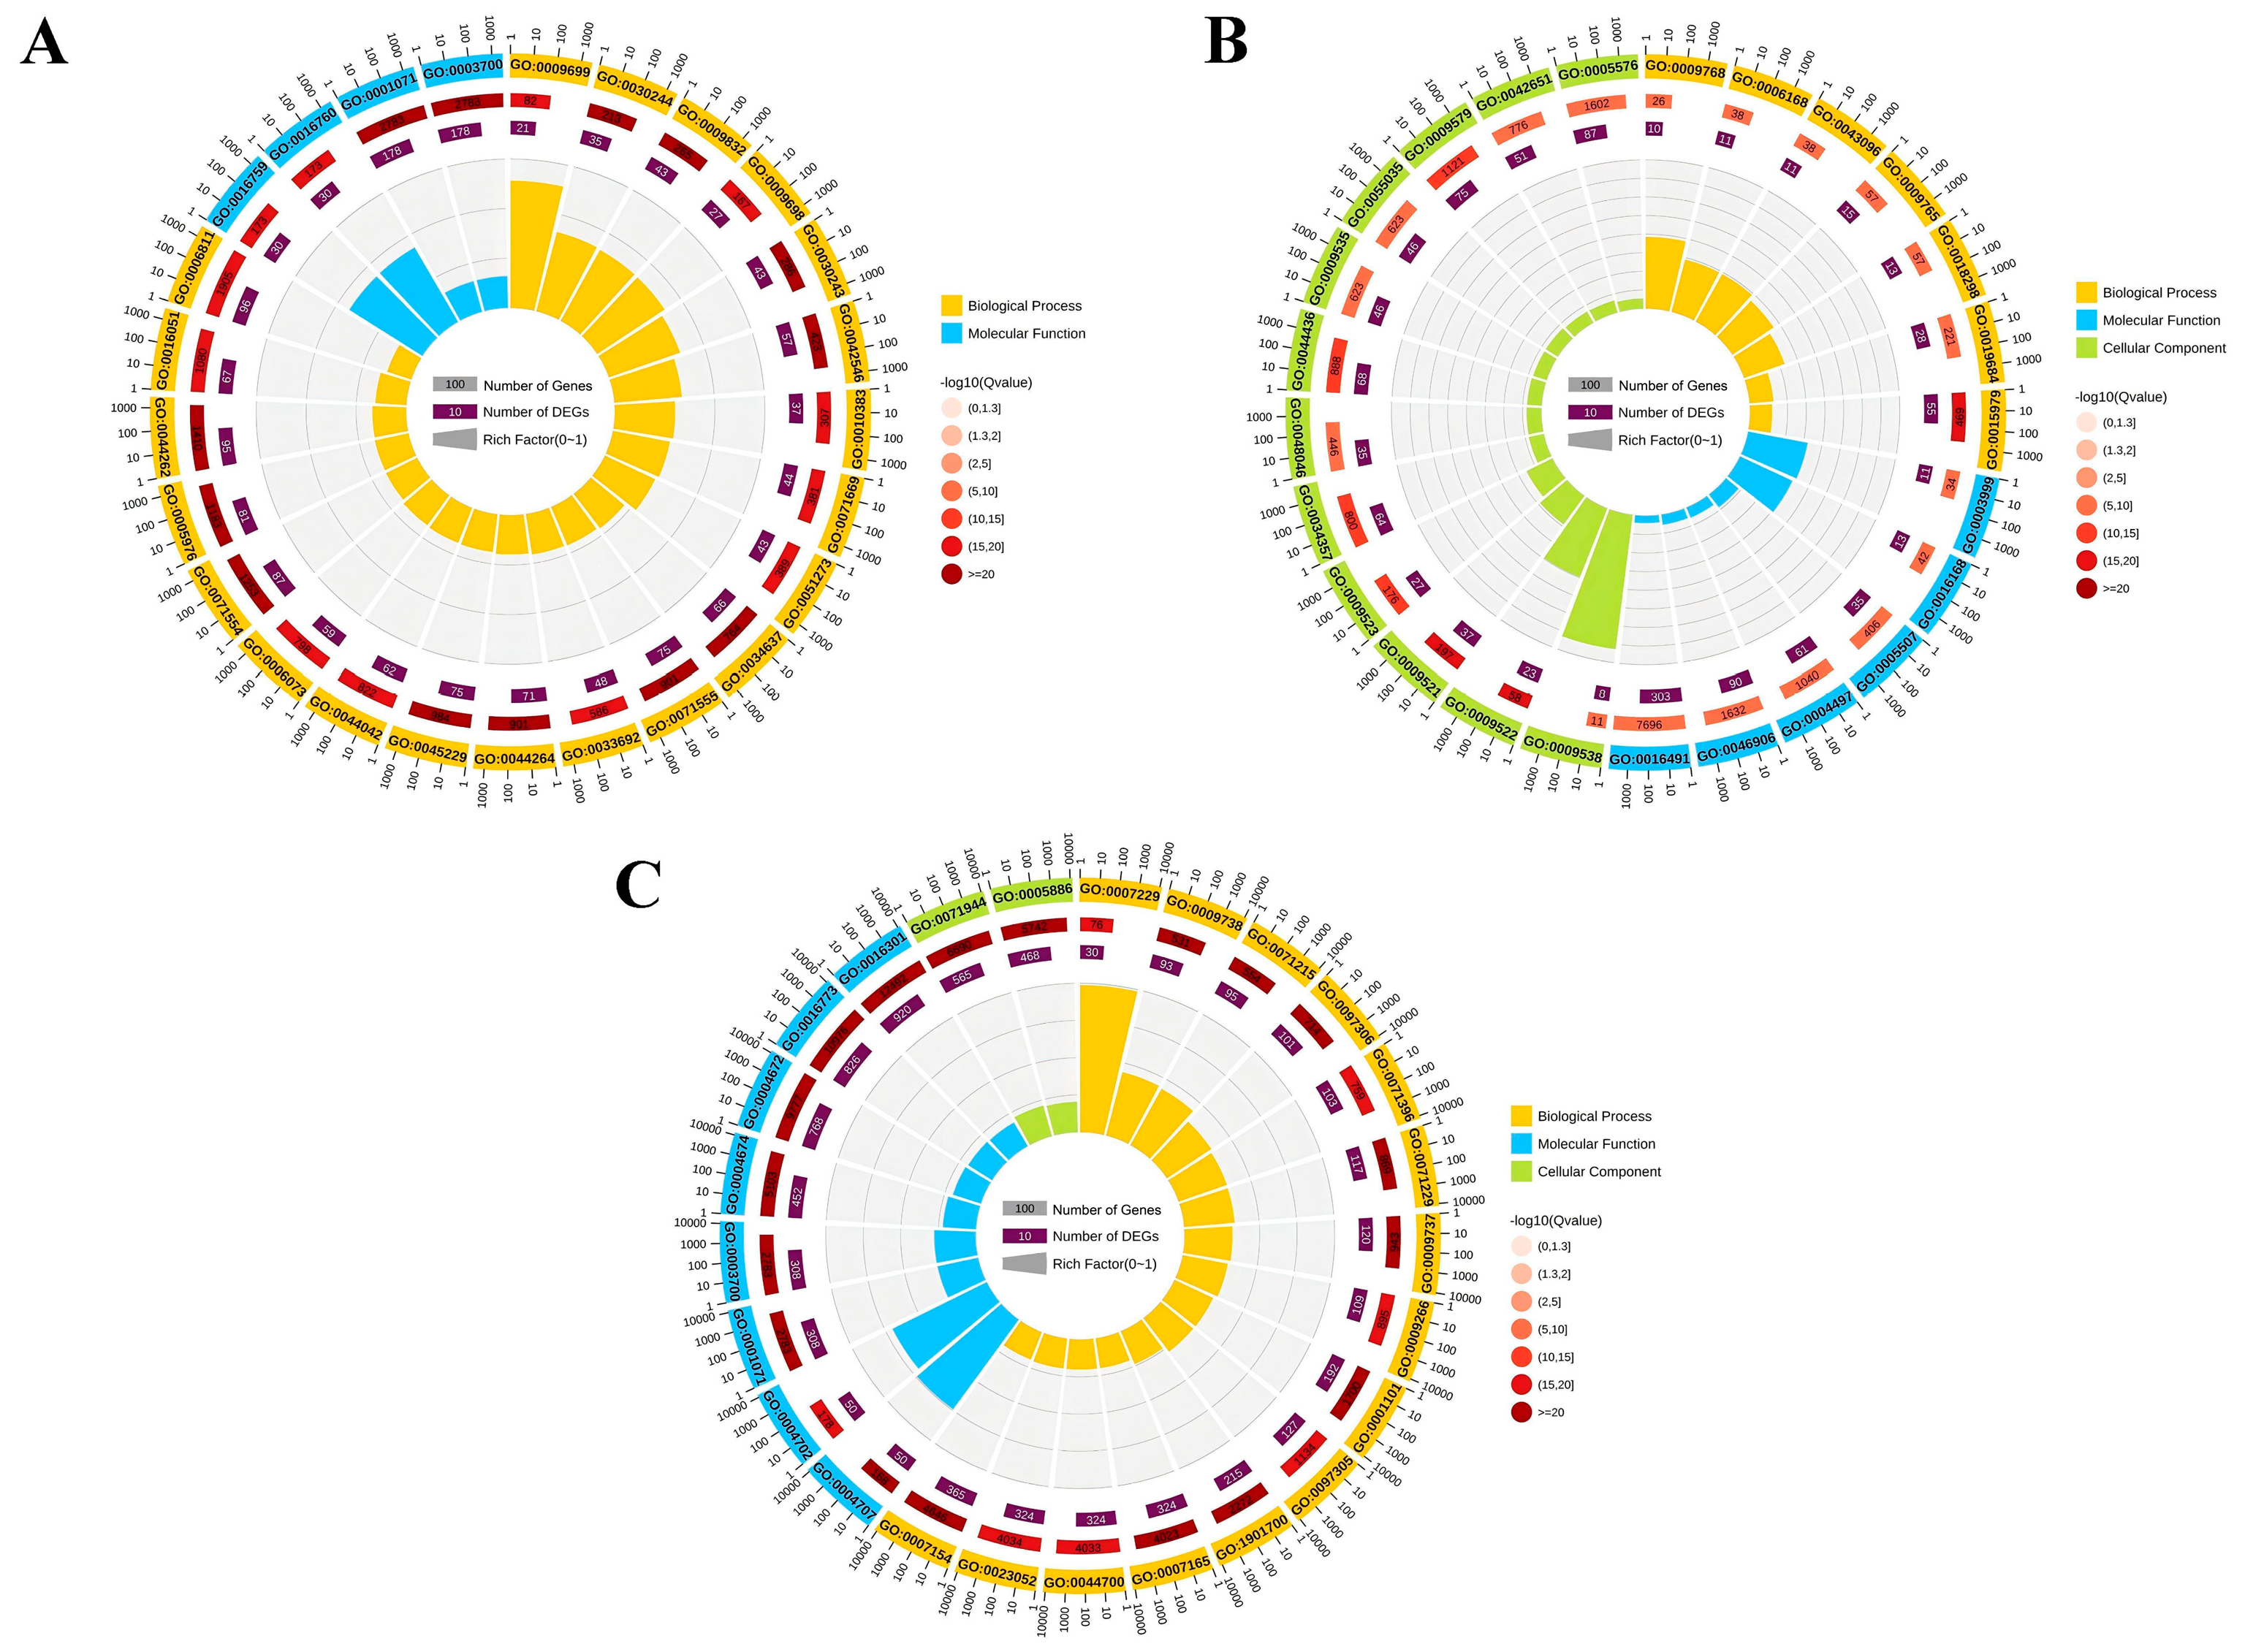
3.4. GO Analysis of DEGs

Comparative transcriptomic analysis of GT29 and Badila identified both shared and unique DEGs, which were subsequently subjected to GO enrichment analysis (Figure 8). The shared DEGs demonstrated significant enrichment (Q value < 0.05) across 287 functional categories, comprising 173 biological processes, 96 molecular functions, and 18 cellular components. Among the top 25 enriched GO terms ranked by significance, 21 were related to biological processes and 4 to molecular functions (Figure 8A). Notably, the most significantly enriched biological processes included the cellulose metabolic process (GO: 0030243), cell wall biosynthesis (GO: 0042546), cell wall organization (GO: 0071555), and polysaccharide metabolic process (GO: 0005976). Prominent molecular functions comprised nucleic-acid-binding transcription factor activity (GO: 0001071), sequence-specific DNA-binding transcription factor activity (GO: 0003700), and cellulose synthase activities (GO: 0016759 and GO: 0016760) (Figure 8A). These findings collectively indicate that the shared DEGs predominantly participate in cell wall-related metabolic processes and transcriptional regulation mechanisms.
GO enrichment analysis of the ratoon-deficient Badila revealed significant associations across three categories (Figure 8B). The 25 most enriched GO terms comprised 7 biological processes, 6 molecular functions, and 12 cellular components. Notably, the predominant biological processes included photosynthesis (GO: 0015979), light reactions (GO: 0019684), photosynthetic light harvesting (GO: 0009765), and photosystem light harvesting (GO: 0009768). The molecular functions showing the highest enrichment included oxidoreductase activity (GO: 0016491), chlorophyll binding (GO: 0016168), tetrapyrrole binding (GO: 0046906), and adenine phosphoribosyltransferase activity (GO: 0003999). The cellular components with maximal enrichment included photosystem I (GO: 0009522), photosystem complexes (GO: 0009521), photosynthetic membranes (GO: 0034357), and thylakoid components (GO: 0044436). These findings suggest that the identified GO functions are closely associated with the response to stem excision in the ratoon-deficient Badila cultivar.
For the ratoon-competent GT29, GO analysis of its unique DEGs identified 600 enriched terms (Figure 8C). The top 25 terms included 15 biological processes, 2 cellular components, and 8 molecular functions. The biological processes with the highest enrichment factors involved abscisic-acid-mediated signaling (GO: 0009738), cellular responses to abscisic acid (GO: 0071215), and responses to acidic conditions (GO: 0071229). The enriched molecular functions comprised sequence-specific DNA-binding transcription factor activity (GO: 0003700), protein serine/threonine kinase activity (GO: 0004674), and MAP kinase activity (GO: 0004707). Cellular component enrichment was primarily observed in the cell periphery (GO: 0071944) and plasma membrane (GO: 0005886).

3.5. KEGG Pathway of DEGs

To investigate the functional classification and metabolic pathways associated with basal bud germination-related genes, we performed KEGG database annotation and enrichment analysis on the DEGs common to GT29 and Badila. The results identified 15 significantly enriched metabolic pathways (Table 3). The top enriched pathways included MAPK signaling (ko04016), phenylalanine biosynthesis (ko00940), flavonoid biosynthesis (ko00941), plant circadian rhythm regulation (ko04712), plant–pathogen interaction (ko04626), and diarylheptanoid biosynthesis (ko00945). The pathways with the highest numbers of DEGs were secondary metabolite biosynthesis (ko01110), plant–pathogen interaction (ko04626), and the MAPK signaling pathway (ko04016) (Table 3).
The KEGG enrichment analysis of DEGs in ratoon-deficient Badila identified 15 significantly enriched pathways. The most prominently enriched pathways included photosynthesis antenna proteins (ko00196) and photosynthesis (ko00195). Core pathways such as secondary metabolite biosynthesis (ko01110) and general metabolic pathways (ko01100) encompassed the highest number of DEGs, with 421 and 733 associated genes, respectively (Table 4).
In the analysis of DEGs unique to the ratoon-competent GT29, 22 pathways demonstrated significant enrichment (Table 5). The most prominently enriched pathways included plant–pathogen interactions (ko04626), MAPK signaling (ko04016), phytohormone signaling (ko04075), phenylpropanoid biosynthesis (ko00940), and starch/sucrose metabolism (ko00500). Notably, secondary metabolite biosynthesis (ko01110) and key biological processes involving plant–pathogen crosstalk (ko04626), MAPK cascade regulation (ko04016), and phytohormone-mediated responses (ko04075) were substantially represented among the enriched pathways (Table 5).

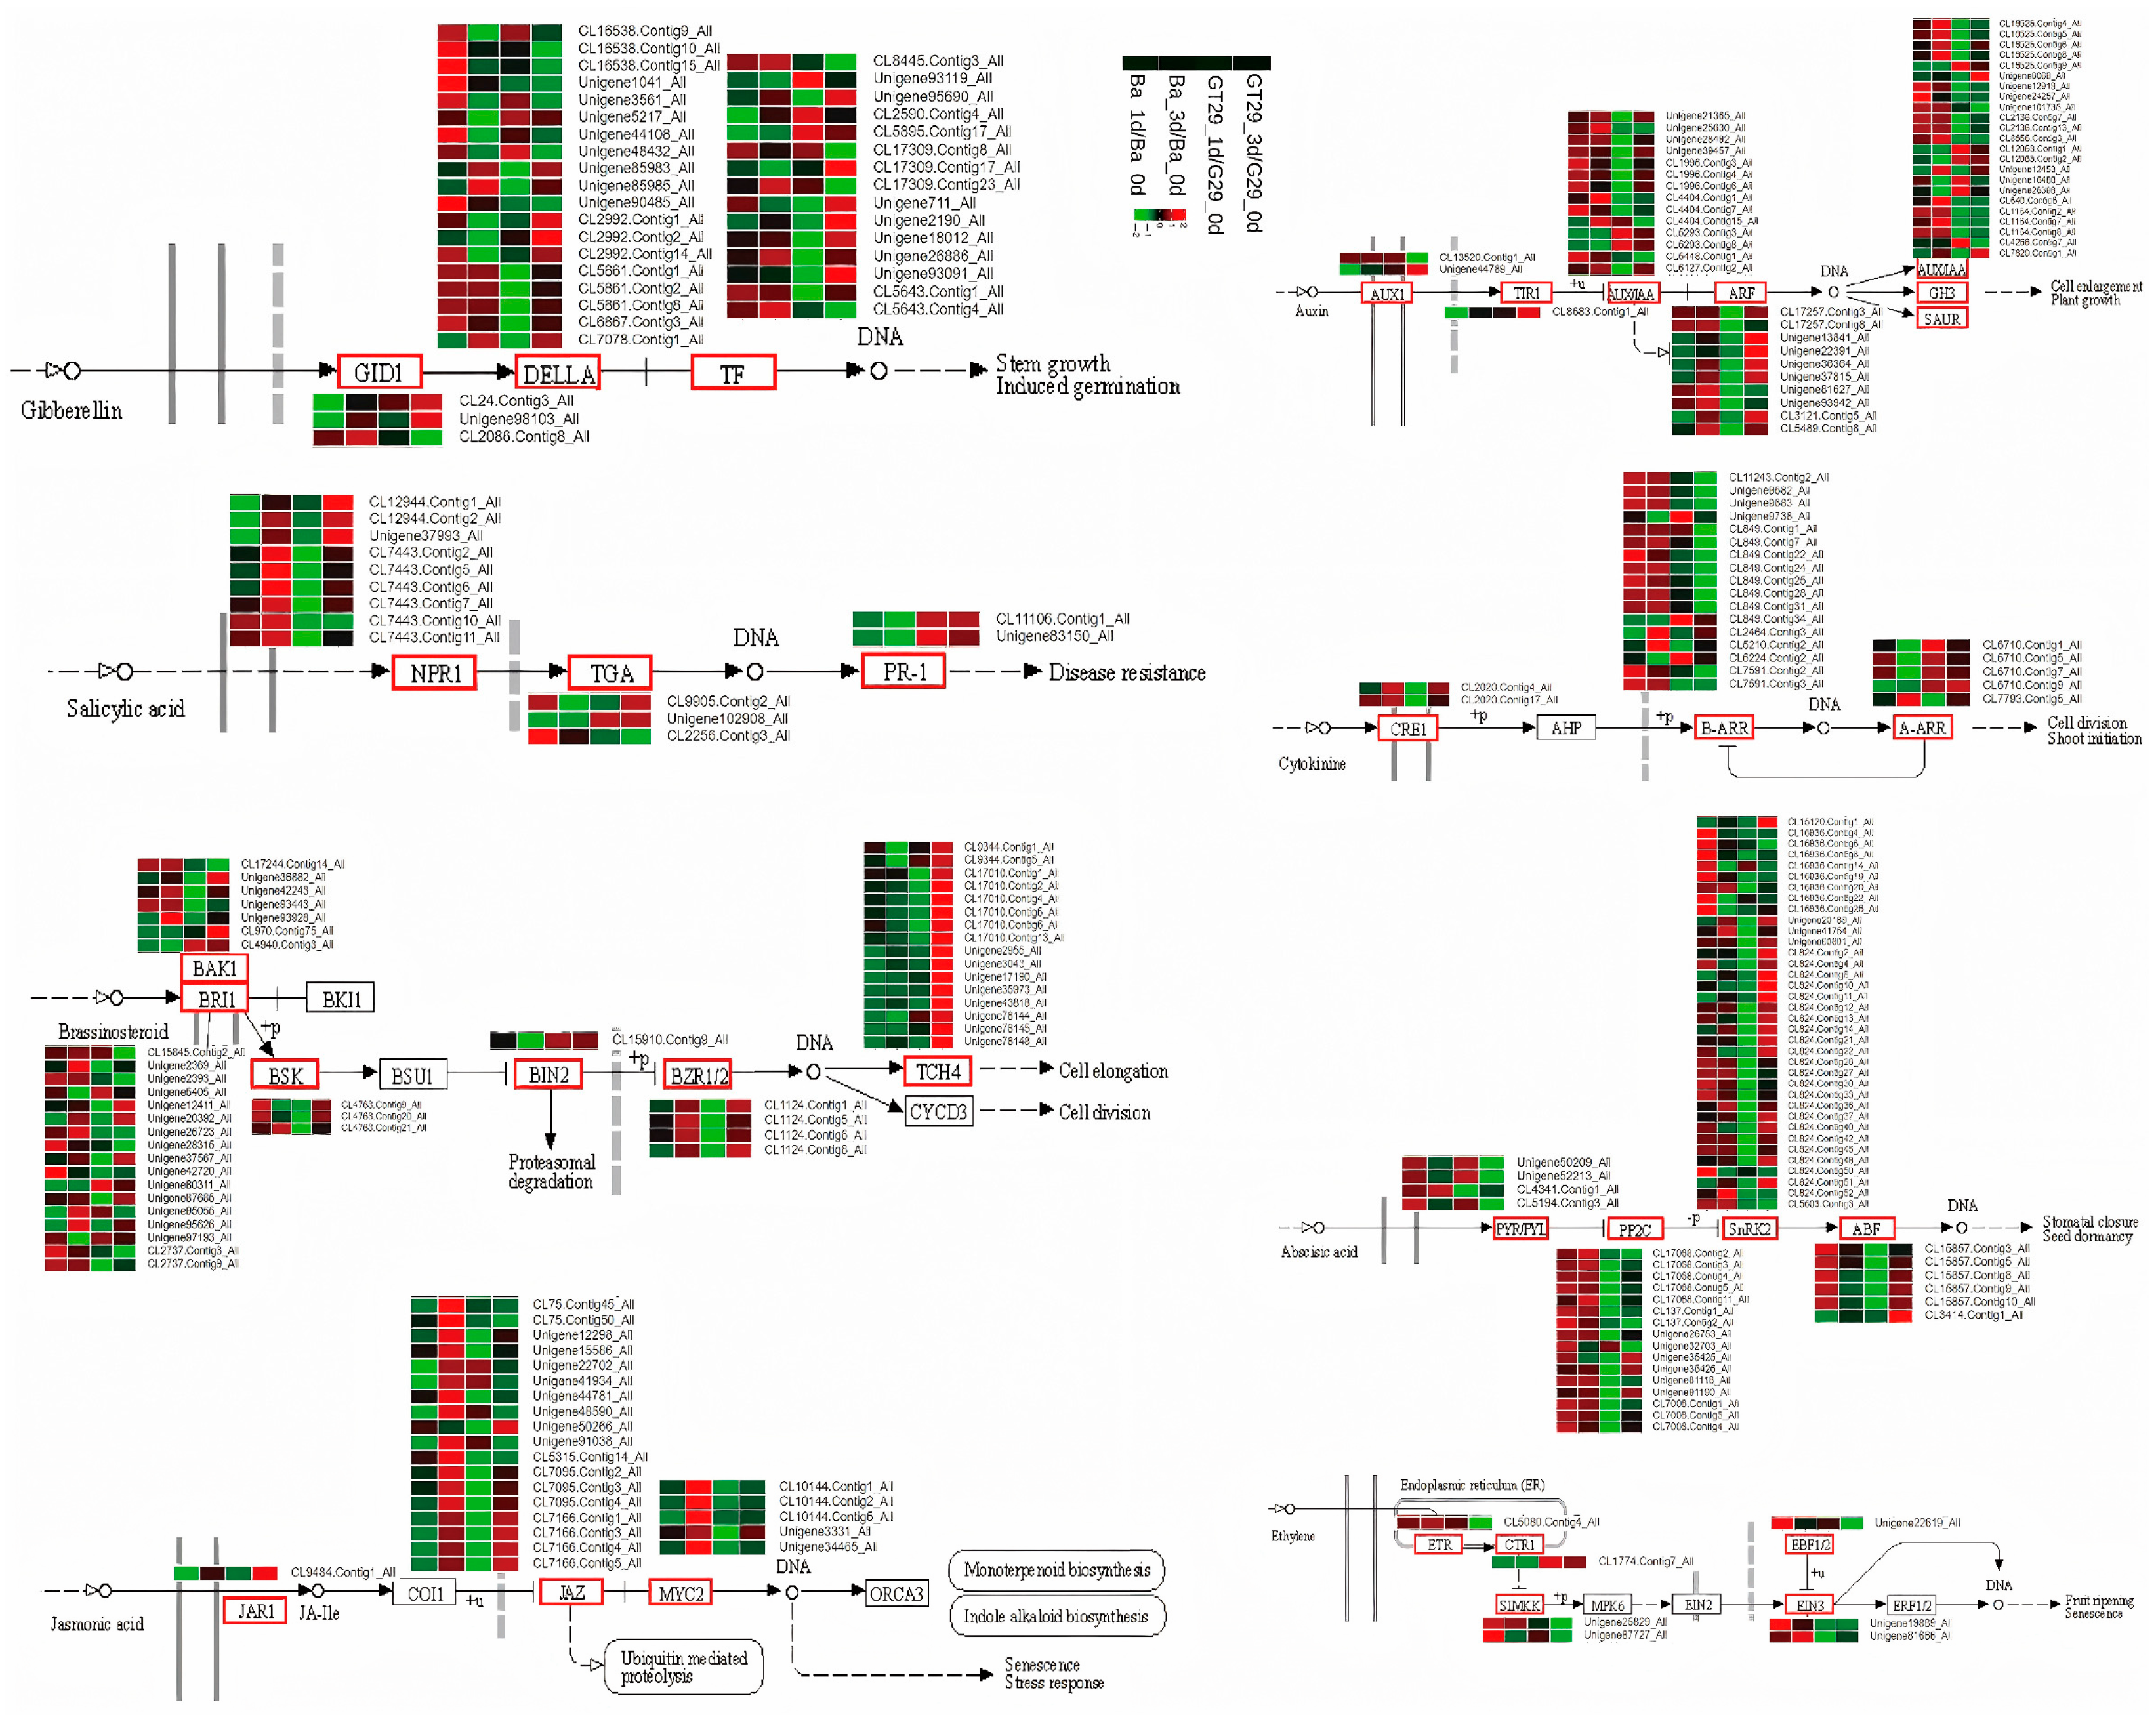
3.6. Characterization of Key Genes in Phytohormone Signal Transduction Pathways

Following the stem excision applied to the GT29 and Badila cultivars, we systematically analyzed the dynamic alterations in their endogenous phytohormone profiles. The results demonstrated a significant correlation between these hormonal fluctuations and the post-truncation developmental responses in both sugarcane varieties. KEGG pathway enrichment analysis revealed differential gene expression patterns, with GT29 exhibiting the substantial enrichment of DEGs in plant hormone signal transduction pathways (Table 5). Notably, this enrichment pattern was absent in Badila. Consequently, our investigation specifically focused on elucidating DEGs associated with major phytohormone signaling pathways, including IAA, CTK, GA, ABA, brassinosteroid (BR), jasmonic acid (JA), ethylene (ET), and salicylic acid (SA)-mediated regulatory networks (Figure 9).
Auxin exhibited the highest number of stem excision response genes (Figure 9). Comparative analysis between ratoon-competent GT29 and -deficient Badila stem excision at 1 d and 3 d revealed significant upregulation of the auxin transport carrier gene AUX1 in GT29. In contrast, Badila showed downregulation of five auxin-related genes (CL5293.Contig3_All, CL5293.Contig8_All, CL16525.Contig9_All, CL12953.Contig1_All, and CL12953.Contig2_All.). The auxin-responsive AUX/IAA genes (CL5293. Contig3_All and CL5293. Contig8_All) demonstrated 7.86-fold and 6.52-fold upregulation in GT29 at 1 d and 3 d post-stem-excision, respectively, while in Badila they displayed 4.68-fold and 4.46-fold downregulation. Notably, the SAUR gene (CL12953. Contig2_All) showed 6.1-fold and 4.2-fold upregulation in Gt29, and >2-fold downregulation in Badila at corresponding timepoints. CTK signaling components revealed distinct regulation patterns. The CTK receptor gene B-ARR (CL849.Contig34_All) exhibited 11.74-fold and 5.69-fold upregulation in GT29 at 1 d and 3 d, respectively, compared to 0.4-fold and 0.2-fold downregulation in Badila. The transcription factor A-ARR (CL6710.Contig9_All) showed >8-fold upregulation exclusively in GT29, potentially activating bud germination. GA signaling analysis revealed contrasting regulation. The GA receptor GID1 (CL24.Contig3_All) and transcription factor (CL5895.Contig17_All) showed >2.5-fold and >6.4-fold upregulation in GT29, respectively, while CL5643.Contig4_All was downregulated. ET signaling components showed moderate upregulation, with the ethylene-receptor-associated CTR1 gene (CL1774. Contig7_All) demonstrating >2.7-fold induction in GT29 and <1-fold in Badila. BR-related genes including BAK1, BRI1, and TCH4 were upregulated, with the BR receptor BRI1 (CL4940. Contig3_All) showing >8-fold induction in GT29. These components directly regulate brassinosteroid biosynthetic genes through promoter binding in feedback mechanisms.

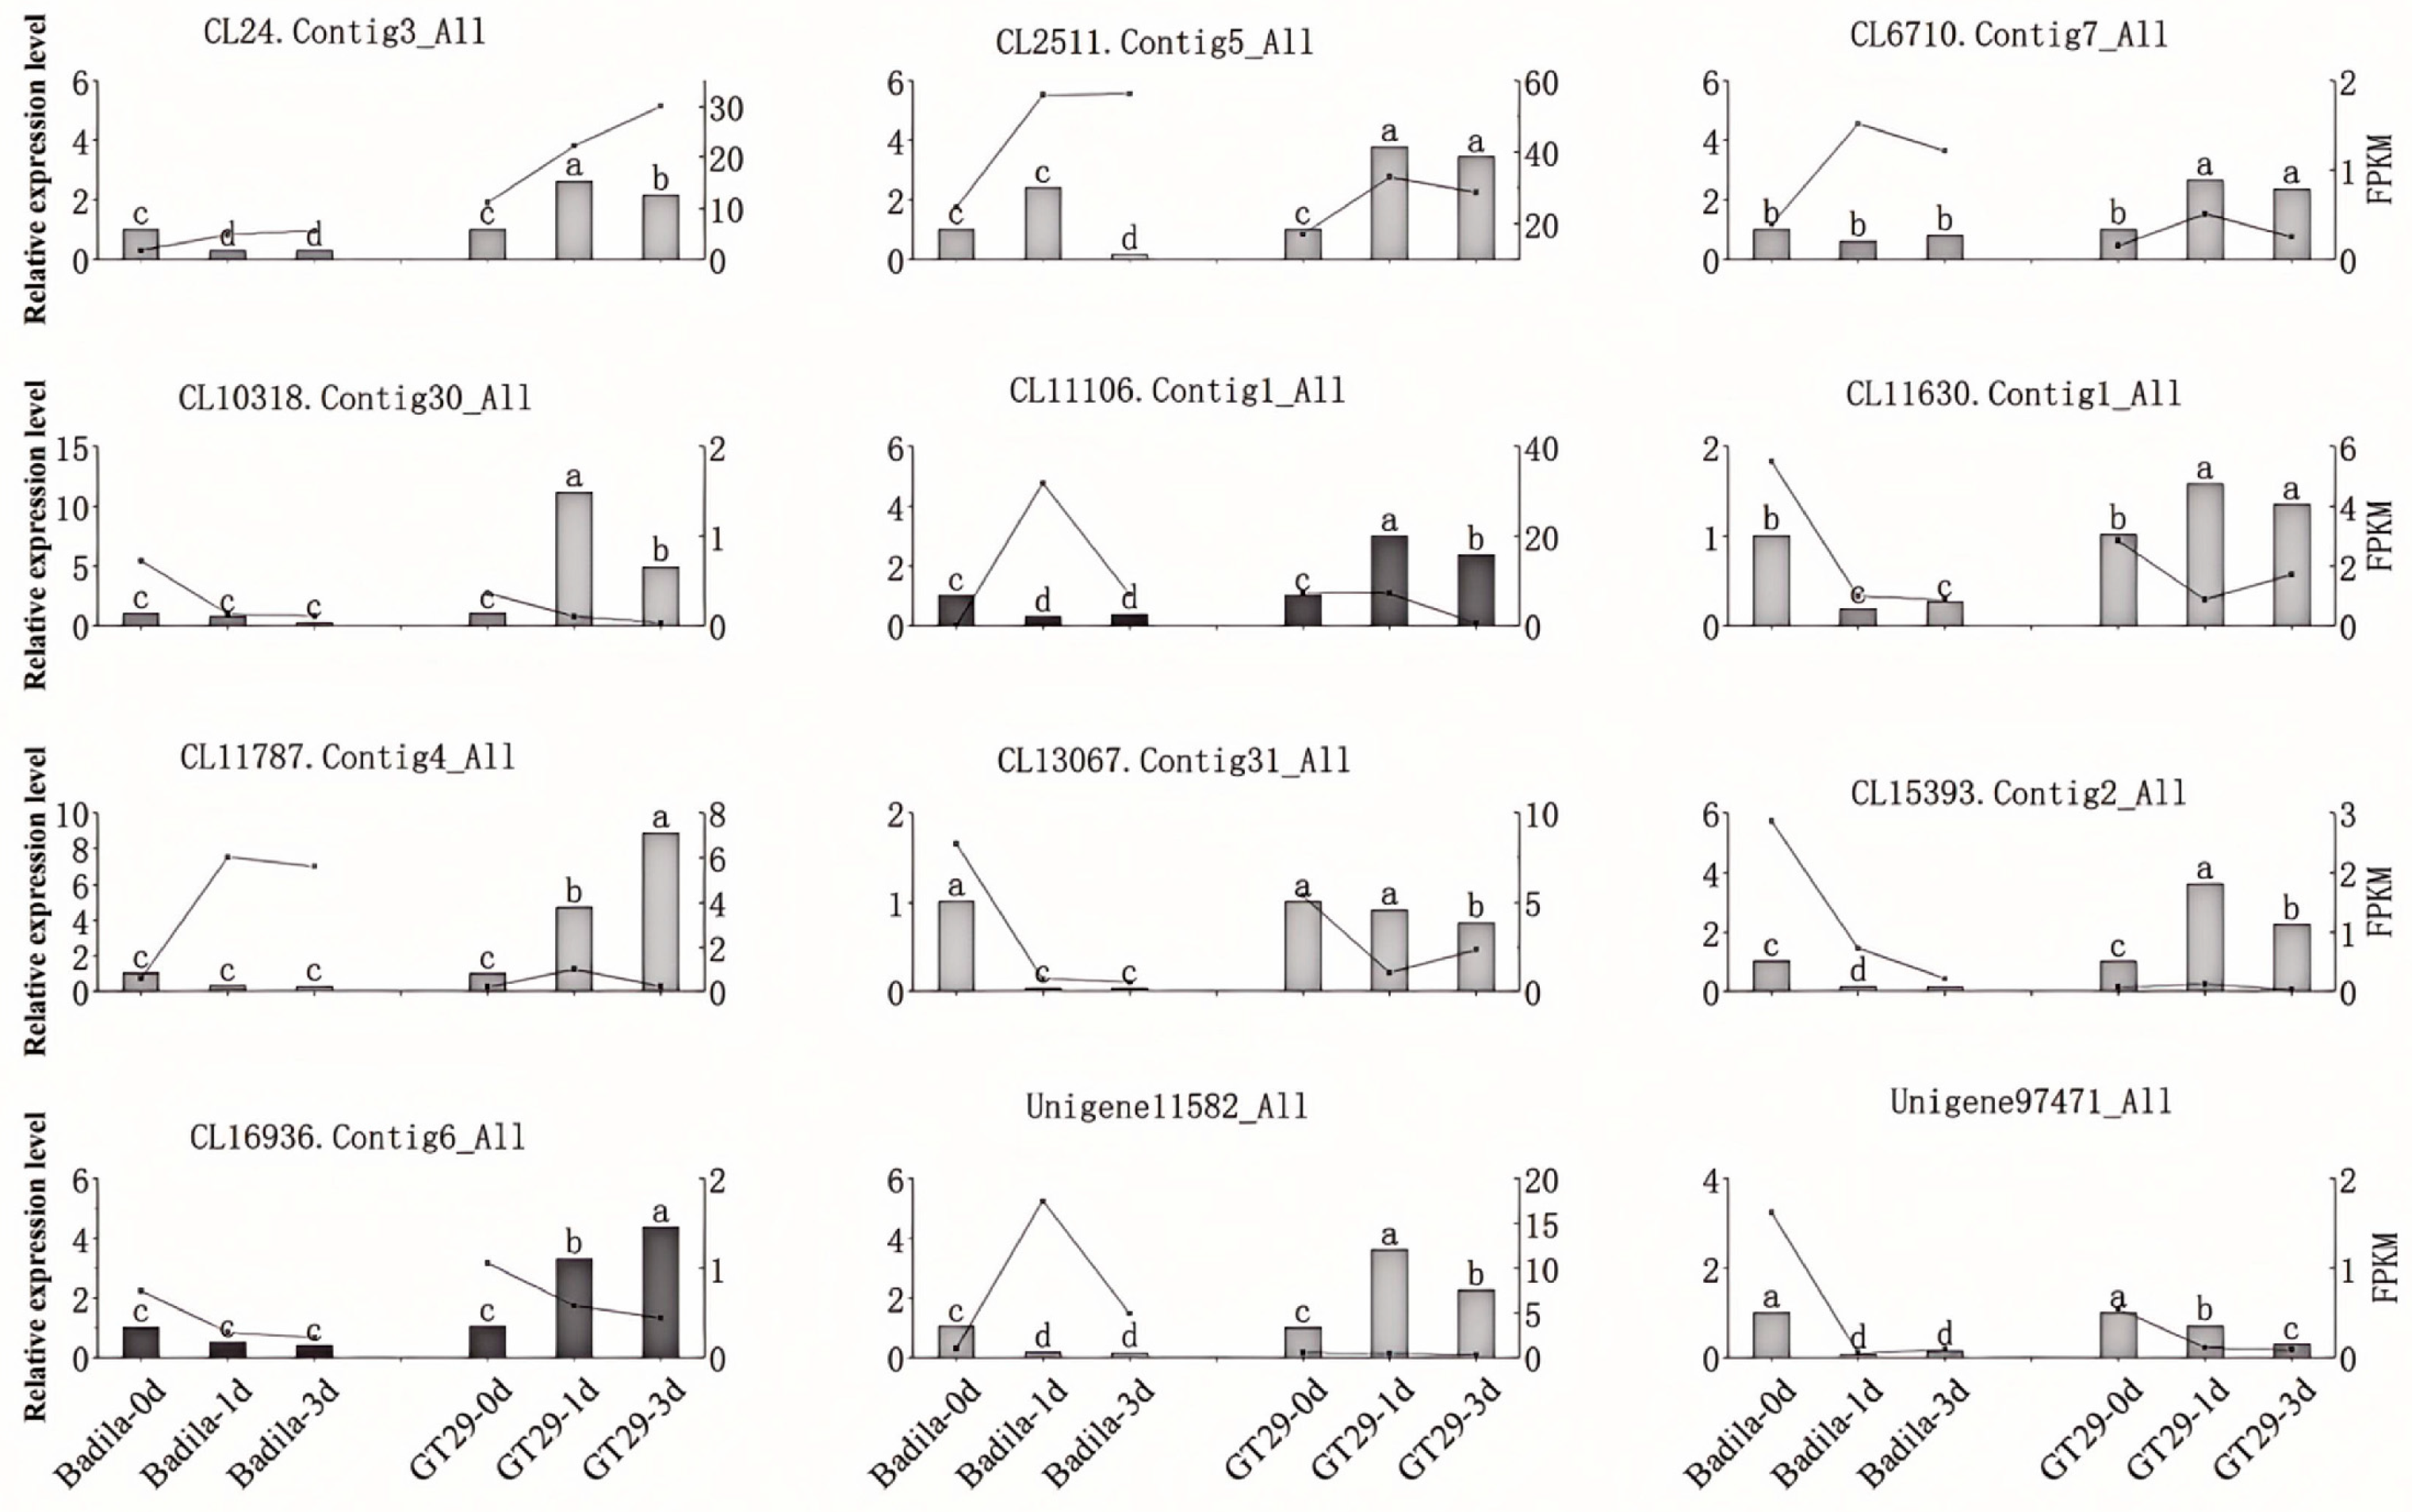
3.7. qRT-PCR Validation

To validate the accuracy of transcriptome profiling, twelve DEGs were selected for qRT-PCR verification in both the GT29 and Badila cultivars under stem excision treatment. The analyzed genes included CL2511.Contig5_All, CL13067.Contig31_All, Unigene11582_All, CL24.Contig3_All, CL10318.Contig30_All, CL11787.Contig4_All, CL16936.Contig6_All, CL11106.Contig1_All, Unigene11582_All, CL6710.Contig7_All, CL11630.Contig1_All, and CL15393.Contig2_All. Notably, all the listed genes exhibited downregulation in Badila following stem excision treatment but upregulation in GT29. Unigene97471_All showed consistent downregulation in both cultivars. In contrast, CL2511.Contig5_All displayed transient upregulation followed by gradual downregulation post-truncation in both cultivars. The qRT-PCR results showed strong concordance with transcriptome data (Figure 10, Table S6), confirming the reliability of our sequencing analysis.

4. Discussion

This study systematically elucidated the molecular physiological mechanisms underlying ratoon differentiation in sugarcane through an integrated analysis of endogenous hormone dynamics and transcriptome regulatory networks. At the hormonal regulation level, the key signaling components of the CTK pathway, zeatin (ZA), and zeatin riboside (ZR) exhibited synchronous attenuation following stalk decapitation (Figure 2). This observation presents a distinct contrast to the classical paradigm established in rice, where elevated CTK levels promote tiller development [22,23]. Subsequent investigations demonstrated distinct CTK signaling patterns, with the CTK receptor gene B-ARR (CL849.Contig34_All) and transcription factor A-ARR (CL6710.Contig9_All) exhibiting genotype-specific regulation. Notably, GT29 showed the remarkable upregulation of these genes by 11.74-fold and 8.3-fold, respectively, whereas Badila displayed downregulation (Figure 9). This expression pattern inversely correlated with the CTK accumulation trends observed during wheat tiller development [24,25,26], presenting an apparent “low hormone concentration–high receptor activity” paradox. We hypothesize that this phenomenon reflects a compensatory mechanism in ratoon-competent cultivars, where enhanced signal transduction efficiency counterbalances reduced absolute phytohormone concentrations. The specific induction of A-ARR in GT29 merits particular attention due to its functional conservation with OsAAP1, a well-characterized promoter of axillary bud development in Oryza sativa [27], suggesting that this gene may serve as a core regulatory node for rooting ability.
In the GA signaling pathway, GID1 functions as a canonical GA receptor, with homologous GID1 genes characterized in model species including Arabidopsis thaliana and Gossypium spp. [28,29,30]. DELLA proteins represent crucial regulatory components in GA signal transduction, serving as growth-repressing factors through their inhibitory effects on plant development [31,32]. The established GA signaling mechanism involves GA-GID1 complex formation, which subsequently triggers the ubiquitin-26S proteasome-mediated degradation of DELLA proteins [33,34]. This degradation cascade alleviates DELLA-mediated growth suppression while inducing the transcriptional reprogramming of downstream targets, ultimately manifesting GA-mediated physiological responses. In the present study, transcriptomic analysis results revealed distinctive GA signaling dynamics in GT29, exhibiting a coordinated reduction in endogenous GA3/GA5 levels coupled with a sustained upregulation of the GID1 receptor (CL24.Contig3_All), showing a 3.8-fold increase. This apparent “low GA–high receptor” configuration pattern potentially enhanced GID1-mediated DELLA protein turnover, as evidenced by the 6.4-fold upregulation of CL5895.Contig17_All, a putative DELLA degradation component (Figure 4 and Figure 9). Such regulatory dynamics may override the conventional GA-mediated tillering suppression mechanism documented in Oryza sativa [35], suggesting species-specific adaptation in sugarcane. Notably, this GA signaling profile showed functional convergence with SL pathway alterations, where GT29 exhibited a 68% depletion of 5-DS compared to the stable levels in Badila (Figure 4 and Figure 6). We propose a novel GA-SL crosstalk mechanism operating through two complementary pathways: reduced 5-DS levels may attenuate its inhibitory effects on GA3 biosynthesis, thereby potentiating GID1-mediated signaling efficiency for axillary bud primordium activation; concurrent SL reduction directly relieves bud dormancy constraints. This multi-layered hormonal regulation aligns with emerging models of SL-GA interaction in monocot development [36,37].
Transcriptional profiling of auxin signaling networks uncovered spatiotemporally specific regulatory features. The Badila genotype exhibited a transient peak in IAA accumulation, with a 1.5-fold increase at 3 days post-treatment, which was concurrent with the progressive downregulation of the AUX/IAA inhibitor (CL5293.Contig3/8_All) (Figure 3 and Figure 9). This coordinated regulation resulted in the hyperactivation of auxin signaling pathways and the subsequent suppression of lateral bud germination. In contrast, the GT29 genotype demonstrated the sustained upregulation of Aux/IAA transcripts during its early (1 d) and mid-phase (3 d) response to apical meristem removal. Notably, GT29 established a phytohormone signaling configuration that favored rapid tiller development through an immediate induction, showing a 6.1-fold increase in the expression of the SAUR family gene (CL12953.Contig2_All) (Figure 9). This regulatory mechanism exhibited functional conservation through SAUR-mediated cell elongation processes previously characterized in Arabidopsis root meristems, yet it represented a novel discovery in sugarcane ratooning systems [38,39]. Particularly significant was the 8-fold upregulation of BRI1 (CL4940.Contig3_All) observed in GT29 (Figure 9), suggesting that BR signaling may optimize auxin distribution patterns within axillary bud microenvironments by modulating polar auxin transport. This molecular mechanism provides a plausible explanation for the enhanced ratoon sprouting capacity observed in ratoon-competent sugarcane cultivars.
Transcriptome profiling further validated the specificity of phytohormone regulatory networks. Notably, the MAPK signaling pathway exhibited significant enrichment in GT29, where a CTR1 homolog gene (CL1774.Contig7_All) showed a 2.7-fold upregulation (Table 3 and Table 5, Figure 9), potentially mediating ET-MAPK crosstalk. The concurrent activation of the phenylpropanoid biosynthesis pathway not only supplied structural precursors for cell wall remodeling but also generated flavonoid derivatives that might fine-tune auxin spatial distribution through the modulation of PIN transporters.
The dual-layered regulatory model of hormone signaling established in this investigation comprehensively elucidates the molecular basis of ratoon bud differentiation in sugarcane GT29, achieving perennial growth dominance through four synergistic mechanisms: the rapid potentiation of CTK signaling sensitivity, establishment of GA-SL mutual inhibitory release mechanisms, optimization of IAA/BR spatial distribution networks, and coordinated activation of secondary-metabolism- and defense-related pathways. These findings not only refine the conventional paradigm of single-hormone dominance in tiller regulation but also identify crucial molecular targets for the marker-assisted breeding of novel sugarcane cultivars with enhanced sucrose accumulation and ratoon-competent traits. Future investigations should employ single-cell transcriptomics to resolve hormonal gradients in axillary meristem primordia and validate the functional conservation of core regulatory elements, thereby completing the holistic regulatory network governing perennial regeneration capacity.

5. Conclusions

In this study, the physiological and molecular mechanisms underlying ratooning ability in sugarcane were systematically elucidated through the integration of endogenous hormone profiling and transcriptomic analyses. The ratoon-competent cultivar GT29 exhibited a unique regulatory pattern characterized by simultaneous reductions in hormone concentrations (ZA, ZR, GA3, GA5, and 5-DS) and the significant upregulation of key signaling genes, including B-ARR, A-ARR, GID1, and BRI1. This “low hormone–high receptor activity” compensation model highlighted an adaptive mechanism in GT29 that enhanced signal transduction efficiency, thereby promoting the activation of dormant buds following stem excision. Notably, this study provides the evidence of a putative crosstalk between GA and strigolactone pathways in sugarcane, wherein reduced 5-DS levels may relieve suppression on GA biosynthesis, ultimately enhancing GID1-mediated DELLA protein turnover. Moreover, the coordinated transcriptional activation of auxin-responsive genes (AUX/IAA, SAUR) and BR receptors further shaped a favorable hormonal microenvironment for tiller emergence. GT29 also demonstrated significant enrichment of DEGs involved in MAPK signaling, phenylpropanoid biosynthesis, and hormone signal transduction, revealing a multihormonal and multi-layered regulatory network underlying its superior regenerative performance. In contrast, the ratoon-deficient cultivar Badila showed an attenuated hormonal response and a lack of key transcriptional reprogramming, suggesting an insufficient molecular response to decapitation. These findings delineate a clear molecular framework distinguishing ratoon competence and provide reliable candidate genes for functional marker development in breeding programs. Altogether, this study offers novel insights into the molecular basis of perennial regeneration in sugarcane and establishes a foundation for future work utilizing single-cell transcriptomics and functional genomics to refine the regulatory network controlling ratoon bud activation and longevity.

Supplementary Materials

The following supporting information can be downloaded at: https://www.mdpi.com/article/10.3390/agronomy15071669/s1, Table S1: CTK content of the stem base at 1 d and 3 d; Table S2: IAA content of the stem base at 1 d and 3 d; Table S3: GA content of the stem base at 1 d and 3 d; Table S4: ABA content of the stem base at 1 d and 3 d; Table S5: 5-DS content of the stem base at 1 d and 3 d; Table S6: Real-time quantitative PCR and RNA-seq analysis of 12 DEGs.

Author Contributions

Conceptualization, Q.W., J.L. and X.L.; methodology, L.Z.; investigation, L.Z., M.R., J.Z. (Jing Zhang), P.Z., F.Z. and J.Z. (Jun Zhao); data curation, L.Z. and W.Q.; writing—original draft preparation, L.Z. and M.R.; writing—review and editing, Q.W., J.L. and X.L. All authors have read and agreed to the published version of the manuscript.

Funding

This work was supported by the National Key R&D Program of China (2022YFD2301100); Science and Technology Major Project of Guangxi (Guike AA23073001); Yunnan Provincial Science and Technology Plan Project (202404BP090025 and 202304BT090027); The Yunnan Seed Laboratory (202205AR070001-13); and the China Agriculture Research System (CARS-17).

Data Availability Statement

The datasets supporting the conclusions of this manuscript and materials generated in this study are available from the corresponding author upon request.

Conflicts of Interest

The authors report no conflicts of interest.

References

  1. Ran, M.; Yu, B.; Cheng, C.; Li, X.; Guo, Y.; Zhao, L.; Zan, F.; Lin, X.; Hou, X.; Zhao, Y.; et al. Oligo-FISH-based analysis of the mechanisms underlying chromosome number variation in Saccharum spontaneum. Int. J. Mol. Sci. 2025, 26, 1958. [Google Scholar] [CrossRef] [PubMed]
  2. Ding, X.; Lin, P.; Yu, F.; Deng, Z. Research progress of sugarcane rationing ability. Sugar Crops China 2020, 42, 12–18. [Google Scholar]
  3. Xu, F.; Wang, Z.; Lu, G.; Zeng, R.; Que, Y. Sugarcane ratooning ability: Research status, shortcomings, and prospects. Biology 2021, 10, 1052. [Google Scholar] [CrossRef] [PubMed]
  4. Dlamini, N.E.; Zhou, M. Predicting ratooning ability of sugarcane varieties in selection trials. Sugar Tech. 2024, 26, 52–62. [Google Scholar] [CrossRef]
  5. Zhou, W.; Chen, D.; Wu, Q.; Fang, J.; Ao, J. Effects of tillage practices on yield, carbon emissions and economic benefits of ratoon sugarcane. Chin. J. Eco-Agric. 2024, 32, 1481–1491. [Google Scholar]
  6. Kumar, D.; Singh, P.; Verma, L.K.; Nag, N.K. An economic analysis of production of sugarcane under various methods of irrigation in Sonipat District of Haryana, India. Int. J. Curr. Microbiol. App. Sci. 2019, 8, 808–816. [Google Scholar] [CrossRef]
  7. Yang, S.; Zhang, Y.; Deng, J.; Li, R.; Fan, X.; Dao, J.; Quan, Y.; Hussain Bukhari, S.A. Effect of cutting depth during sugarcane (Saccharum spp. hybrid) harvest on root characteristics and yield. PLoS ONE 2021, 16, e0238085. [Google Scholar]
  8. Yan, H.; Zhou, H.; Luo, H.; Fan, Y.; Zhou, Z.; Chen, R.; Luo, T.; Li, X.; Liu, X.; Li, Y.; et al. Characterization of full-length transcriptome in Saccharum officinarum and molecular insights into tiller development. BMC Plant Biol. 2021, 21, 228. [Google Scholar] [CrossRef]
  9. Zhao, L.; Yang, K.; Zhao, P.; Qin, W.; Zhao, Y.; Zhu, J.; Zan, F.; Zhao, J.; Lu, X.; Wu, C.; et al. Sugarcane root distribution and growth as affected by genotype and crop cycle. Bragantia 2020, 79, 192–202. [Google Scholar] [CrossRef]
  10. Chumphu, S.; Jongrungklang, N.; Songsri, P. Association of physiological responses and root distribution patterns of ratooning ability and yield of the second ratoon cane in sugarcane elite clones. Agronomy 2019, 9, 200. [Google Scholar] [CrossRef]
  11. Wang, X.; Liang, Y.; Li, L.; Gong, C.; Wang, H.; Huang, X.; Li, S.; Deng, Q.; Zhu, J.; Zheng, A.; et al. Identification and cloning of tillering-related genes OsMAX1 in rice. Rice Sci. 2015, 22, 255–263. [Google Scholar]
  12. Wang, T.; Xu, F.; Wang, Z.; Wu, Q.; Cheng, W.; Que, Y.; Xu, L. Mapping of QTLs and screening candidate genes associated with the ability of sugarcane tillering and ratooning. Int. J. Mol. Sci. 2023, 24, 2793. [Google Scholar] [CrossRef] [PubMed]
  13. Li, A.; Wu, Q.; Yang, S.; Liu, J.; Zhao, Y.; Zhao, P.; Wang, L.; Lu, W.; Huang, D.; Zhang, Y.; et al. Dissection of genetic architecture for desirable traits in sugarcane by integrated transcriptomics and metabolomics. Int. J. Biol. Macromol. 2024, 280, 136009. [Google Scholar] [CrossRef] [PubMed]
  14. Islam, M.S.; Corak, K.; McCord, P.; Hulse-Kemp, A.M.; Lipka, A.E. A first look at the ability to use genomic prediction for improving the ratooning ability of sugarcane. Front. Plant Sci. 2023, 14, 1205999. [Google Scholar] [CrossRef]
  15. Henry, A. A step forward in breeding for ratooning ability in rice. Mol. Plant 2024, 17, 368–369. [Google Scholar] [CrossRef]
  16. Liang, Q.; Liu, X.; Zhou, H.; Lei, J.; Lin, S.; Yan, M.; Verma, K.K.; Wei, K.; Wei, H.; Li, W. Breeding and regional production capacity performance of new sugarcane cultivar GT 66. Sci. Rep. 2025, 15, 12963. [Google Scholar] [CrossRef]
  17. Yang, S.; Chu, N.; Feng, N.; Zhou, B.; Zhou, H.; Deng, Z.; Shen, X.; Zheng, D. Global responses of autopolyploid sugarcane Badila (Saccharum officinarum L.) to drought stress based on comparative transcriptome and metabolome profiling. Int. J. Mol. Sci. 2023, 24, 3856. [Google Scholar] [CrossRef]
  18. Yao, W.; Ruan, M.; Qin, L.; Yang, C.; Chen, R.; Chen, B.; Zhang, M. Field performance of transgenic sugarcane lines resistant to sugarcane mosaic virus. Front. Plant Sci. 2017, 8, 104. [Google Scholar] [CrossRef]
  19. Hussain, S.; Wang, W.; Ahmed, S.; Wang, X.; Adnan; Cheng, Y.; Wang, C.; Wang, Y.; Zhang, N.; Tian, H. PIP2, an auxin induced plant peptide hormone regulates root and hypocotyl elongation in Arabidopsis. Front. Plant Sci. 2021, 12, 646736. [Google Scholar] [CrossRef]
  20. Bai, Y.; Cai, M.; Mu, C.; Zheng, H.; Cheng, Z.; Xie, Y.; Gao, J. Integrative analysis of exogenous auxin mediated plant height regulation in Moso bamboo (Phyllostachys edulis). Ind. Crops Prod. 2023, 200, 116852. [Google Scholar] [CrossRef]
  21. Kubalová, M.; Müller, K.; Dobrev, P.I.; Rizza, A.; Jones, A.M.; Fendrych, M. Auxin co-receptor IAA17/AXR3 controls cell elongation in Arabidopsis thaliana root solely by modulation of nuclear auxin pathway. New Phytol. 2024, 241, 2448–2463. [Google Scholar] [CrossRef] [PubMed]
  22. Du, Y.; Liu, L.; Li, M.; Fang, S.; Shen, X.; Chu, J.; Zhang, Z. UNBRANCHED3 regulates branching by modulating cytokinin biosynthesis and signaling in maize and rice. New Phytol. 2017, 214, 721–733. [Google Scholar] [CrossRef] [PubMed]
  23. Li, M.; Li, H.; Zhu, Q.; Liu, D.; Li, Z.; Chen, H.; Luo, J.; Gong, P.; Ismail, A.M.; Zhang, Z. Knockout of the sugar transporter OsSTP15 enhances grain yield by improving tiller number due to increased sugar content in the shoot base of rice (Oryza sativa L.). New Phytol. 2024, 241, 1250–1265. [Google Scholar] [CrossRef] [PubMed]
  24. Yang, H.; Li, Y.; Qiao, Y.; Sun, H.; Liu, W.; Qiao, W.; Li, W.; Liu, M.; Dong, B. Low light stress promotes new tiller regeneration by changing source–sink relationship and activating expression of expansin genes in wheat. Plant Cell Environ. 2023, 46, 1562–1581. [Google Scholar] [CrossRef]
  25. Koprna, R.; Humplík, J.F.; Špíšek, Z.; Bryksová, M.; Zatloukal, M.; Mik, V.; Novák, O.; Nisler, J.; Doležal, K. Improvement of tillering and grain yield by application of cytokinin derivatives in wheat and barley. Agronomy 2020, 11, 67. [Google Scholar] [CrossRef]
  26. Lei, K.; Tan, Q.; Zhu, L.; Xu, L.; Yang, S.; Hu, J.; Gao, L.; Hou, P.; Shao, Y.; Jiang, D.; et al. Low red/far-red ratio can induce cytokinin degradation resulting in the inhibition of tillering in wheat (Triticum aestivum L.). Front. Plant Sci. 2022, 13, 971003. [Google Scholar] [CrossRef]
  27. Ji, Y.; Huang, W.; Wu, B.; Fang, Z.; Wang, X. The amino acid transporter AAP1 mediates growth and grain yield by regulating neutral amino acid uptake and reallocation in Oryza sativa. J. Exp. Bot. 2020, 71, 4763–4777. [Google Scholar] [CrossRef]
  28. Ferreira, L.G.; de Alencar Dusi, D.M.; Irsigler, A.S.T.; Gomes, A.C.M.M.; Mendes, M.A.; Colombo, L.; de Campos Carneiro, V.T. GID1 expression is associated with ovule development of sexual and apomictic plants. Plant Cell Rep. 2018, 37, 293–306. [Google Scholar] [CrossRef]
  29. Voegele, A.; Linkies, A.; Müller, K.; Leubner-Metzger, G. Members of the gibberellin receptor gene family GID1 (GIBBERELLIN INSENSITIVE DWARF1) play distinct roles during Lepidium sativum and Arabidopsis thaliana seed germination. J. Exp. Bot. 2011, 62, 5131–5147. [Google Scholar] [CrossRef]
  30. Ueguchi-Tanaka, M.; Nakajima, M.; Motoyuki, A.; Matsuoka, M. Gibberellin receptor and its role in gibberellin signaling in plants. Annu. Rev. Plant Biol. 2007, 58, 183–198. [Google Scholar] [CrossRef]
  31. Zhong, M.; Zeng, B.; Tang, D.; Yang, J.; Qu, L.; Yan, J.; Wang, X.; Li, X.; Liu, X.; Zhao, X. The blue light receptor CRY1 interacts with GID1 and DELLA proteins to repress GA signaling during photomorphogenesis in Arabidopsis. Mol. Plant 2021, 14, 1328–1342. [Google Scholar] [CrossRef] [PubMed]
  32. Chen, L.; Sun, S.; Song, C.-P.; Zhou, J.-M.; Li, J.; Zuo, J. Nitric oxide negatively regulates gibberellin signaling to coordinate growth and salt tolerance in Arabidopsis. J. Genet. Genomics 2022, 49, 756–765. [Google Scholar] [CrossRef] [PubMed]
  33. Xue, H.; Gao, X.; He, P.; Xiao, G. Origin, evolution, and molecular function of DELLA proteins in plants. Crop J. 2022, 10, 287–299. [Google Scholar] [CrossRef]
  34. Li, K.; Yu, R.; Fan, L.-M.; Wei, N.; Chen, H.; Deng, X.W. DELLA-mediated PIF degradation contributes to coordination of light and gibberellin signalling in Arabidopsis. Nat. Commun. 2016, 7, 11868. [Google Scholar] [CrossRef] [PubMed]
  35. Li, X.; Xie, Z.; Qin, T.; Zhan, C.; Jin, L.; Huang, J. The SLR 1-OsMADS 23-D14 module mediates the crosstalk between strigolactone and gibberellin signaling to control rice tillering. New Phytol. 2025, 246, 2137–2154. [Google Scholar] [CrossRef]
  36. Sun, H.; Guo, X.; Zhu, X.; Gu, P.; Zhang, W.; Tao, W.; Wang, D.; Wu, Y.; Zhao, Q.; Xu, G.; et al. Strigolactone and gibberellin signaling coordinately regulate metabolic adaptations to changes in nitrogen availability in rice. Mol. Plant 2023, 16, 588–598. [Google Scholar] [CrossRef]
  37. Zhuang, H.; Li, Y.F. Strigolactone and gibberellin crosstalk: The role of the SLR1-OsMADS23-D14 module in regulating rice tiller development. New Phytol. 2025, 246, 1893–1895. [Google Scholar] [CrossRef]
  38. van Mourik, H.; van Dijk, A.D.; Stortenbeker, N.; Angenent, G.C.; Bemer, M. Divergent regulation of Arabidopsis SAUR genes: A focus on the SAUR10-clade. BMC Plant Biol. 2017, 17, 245. [Google Scholar] [CrossRef]
  39. Yin, H.; Li, M.; Lv, M.; Hepworth, S.R.; Li, D.; Ma, C.; Li, J.; Wang, S.-M. SAUR15 promotes lateral and adventitious root development via activating H+-ATPases and auxin biosynthesis. Plant Physiol. 2020, 184, 837–851. [Google Scholar] [CrossRef]
Figure 1. Plants at jointing stage after 110 days of planting. Tillering difference between Badila and GT29 treatments at 1 d and 3 d.
Agronomy 15 01669 g001
Figure 2. CTK content of stem base at 1 d and 3 d. CK refers to stem truncation treatment at 0 d; Different lowercase letters indicate significant difference (p < 0.05).
Agronomy 15 01669 g002
Figure 3. IAA content of stem base at 1 d and 3 d; CK refers to stem truncation treatment at 0 d. Different lowercase letters indicate significant difference (p < 0.05).
Agronomy 15 01669 g003
Figure 4. GA content of stem base at 1 d and 3 d; CK refers to stem truncation treatment at 0 d. Different lowercase letters indicate significant difference (p < 0.05).
Agronomy 15 01669 g004
Figure 5. ABA content of stem base at 1 d and 3 d; CK refers to stem truncation treatment at 0 d. Different lowercase letters indicate significant difference (p < 0.05).
Agronomy 15 01669 g005
Figure 6. 5-DS content of stem base at 1 d and 3 d; CK refers to stem truncation treatment at 0 d. Different lowercase letters indicate significant difference (p < 0.05).
Agronomy 15 01669 g006
Figure 7. Transcriptome comparison between Badila and GT29. (A) Number of Badila and GT29 up-and downregulated DEGs at 1 d and 3 d; (B) Venn map of Badila and GT29 DEGs at 1 d and 3 d.
Agronomy 15 01669 g007
Figure 8. GO analysis of DEGs in GT29 and Badila. (A) Top 25 GO terms for shared DEGs in GT29 and Badila; (B) top 25 GO terms for unique DEGs of Badila; (C) top 25 GO terms for unique DEGs of GT29.
Agronomy 15 01669 g008
Figure 9. Hormone signal transduction pathways and related DEG expression patterns. Red indicates upregulated genes and green indicates downregulated genes; Ba_0d/1d/3d and GT29_0d/1d/3d indicate two sugarcane cultivars Badila and GT29 when untreated and treated for 1d and 3d, respectively.
Agronomy 15 01669 g009
Figure 10. Real-time quantitative PCR and RNA-seq analysis of 12 DEGs. Different lowercase letters indicate significant difference (p < 0.05).
Agronomy 15 01669 g010
Table 1. Primer sequences for qRT-PCR.
Gene IDForward Sequence (5′–3′)Reverse Sequence (5′–3′)
18S rRNACAACCATAAACGATGCCGAAGCCTTGCGACCATACTCC
CL11787.Contig4CTTGGTCTTCCAGCAGGAACGGAGGTGTTCCTGAAG
CL15393.Contig2GCAAGAGGAAATACGACCCCCCATCAGGCAAGTAACG
Unigene11582TGGTTTGGGATTGAGCAACGGCACAGTAGTATGGTC
CL2511.Contig5GAAGCCTCTGGACTACGAATCTTCTTGCCCTCCTTCT
Unigene97471ATGCTGGCTTAC CTTCTCTTCCGAATCCCTGTATGAC
CL24.Contig3TCCTCTCCTCCTCGTACTTCGGCTCCTCCAATACAA
CL13067.Contig31TTCAGACAAGCGTAGCCATGAAGGTGTGGTCAGCAT
CL11106.Contig1TGTCTTGCTGGTGTCGTTTCTTGAGGCGAGTTCTGAG
CL6710.Contig7TGGATACACCAGGGCAAACACACTTCTCGGCAGTTG
CL16936.Contig6CGGATTGACGAGAATGTGTAAAGATGCGTTGGTGTAAGTAT
CL10318.Contig30TCCAGACATCCAGTTCAGCTTGTTGTTCACCACCAA
CL11630.Contig1AGAAGACCCGTAGCAAAGGCTTTCCAACTCCACTCT
Table 2. Transcriptome sequencing data statistics.
Sample IDTotal Clean Bases (Gb)Q20 Content (%)Q30 Content (%)Mean Length (bp)N50 (bp)GC Content (%)
GT29-0 d110.4897.0492.341099167848.43
GT29-0 d210.5697.0292.231104169548.32
GT29-0 d310.6097.0592.471069164349.02
GT29-1 d110.5097.1992.721083165348.47
GT29-1 d210.5497.1692.591093168748.35
GT29-1 d310.5397.2092.741062162448.69
GT29-3 d110.4797.2592.851084168348.36
GT29-3 d210.5397.2692.831062162548.71
GT29-3 d310.5197.2092.691100169448.43
Badila-0 d110.5597.0592.371203184848.57
Badila-0 d29.5997.0992.451203182548.68
Badila-0 d310.5497.0992.421203182348.59
Badila-1 d110.5697.1692.571198182848.34
Badila-1 d210.4697.0092.301204182548.33
Badila-1 d310.5197.0092.281143175848.52
Badila-3 d110.4797.0092.281178179948.55
Badila-3 d210.5297.0092.271172178048.73
Badila-3 d310.5097.0092.261200183748.36
Mean10.4797.1092.481137173948.53
Table 3. KEGG pathways of shared DEGs in GT29 and Badila.
Pathway IDPathway NameDEGsRich RatioQ Value
ko04016MAPK signaling pathway-plant1220.0441.28 × 10−13
ko00940Phenylpropanoid biosynthesis910.0482.14 × 10−12
ko00941Flavonoid biosynthesis390.0761.01 × 10−10
ko04712Circadian rhythm-plant470.0641.66 × 10−10
ko04626Plant–pathogen interaction1550.0344.55 × 10−9
ko00945Stilbenoid, diarylheptanoid, and gingerol biosynthesis210.1108.23 × 10−9
ko01110Biosynthesis of secondary metabolites3410.0266.94 × 10−6
ko04075Plant hormone signal transduction910.0339.66 × 10−5
ko00944Flavone and flavonol biosynthesis90.1291.53 × 10−4
ko00500Starch and sucrose metabolism570.0363.36 × 10−4
ko00904Diterpenoid biosynthesis140.0622.26 × 10−3
ko00360Phenylalanine metabolism160.0535.23 × 10−3
ko03015mRNA surveillance pathway920.0289.82 × 10−3
ko00908Zeatin biosynthesis90.0622.30 × 10−2
ko00430Taurine and hypotaurine metabolism100.0572.56 × 10−2
Table 4. KEGG pathways of DEGs in Badila.
Pathway IDPathway NameDEGsRich RationQ Value
ko00196Photosynthesis antenna proteins140.3507.62 × 10−11
ko00195Photosynthesis280.1181.61 × 10−9
ko04712Circadian rhythm-plant460.0631.27 × 10−6
ko00941Flavonoid biosynthesis350.0686.57 × 10−6
ko01110Biosynthesis of secondary metabolites4210.0327.81 × 10−6
ko01100Metabolic pathways7330.0293.26 × 10−5
ko00280Valine, leucine, and isoleucine degradation330.0513.55 × 10−3
ko00640Propanoate metabolism210.0623.55 × 10−3
ko03010Ribosome820.0375.66 × 10−3
ko00940Phenylpropanoid biosynthesis720.0387.15 × 10−3
ko00500Starch and sucrose metabolism610.0381.45 × 10−2
ko00620Pyruvate metabolism420.0412.09 × 10−2
ko00514Other types of O-glycan biosynthesis140.0622.28 × 10−2
ko00945Stilbenoid, diarylheptanoid, and gingerol biosynthesis120.0633.65 × 10−2
ko00905Brassinosteroid biosynthesis70.0854.41 × 10−2
Table 5. KEGG pathways of DEGs in GT29.
Pathway IDPathway NameDEGsRich RatioQ Value
ko04626Plant–pathogen interaction4630.1011.46 × 10−36
ko04016MAPK signaling pathway-plant2930.1061.83 × 10−25
ko04075Plant hormone signal transduction2680.0961.57 × 10−17
ko00940Phenylpropanoid biosynthesis1710.0913.92 × 10−9
ko00500Starch and sucrose metabolism1490.0944.90 ×10−9
ko00906Carotenoid biosynthesis540.1245.84 × 10−7
ko00945Stilbenoid, diarylheptanoid, and gingerol biosynthesis280.1474.26 × 10−5
ko00460Cyanoamino acid metabolism610.0972.26 × 10−4
ko01110Biosynthesis of secondary metabolites8270.0622.54 × 10−4
ko00999Biosynthesis of various plant secondary metabolites550.0992.54 × 10−4
ko00591Linoleic acid metabolism210.1522.72 × 10−4
ko00515Mannose type O-glycan biosynthesis140.1924.32 × 10−4
ko00250Alanine, aspartate, and glutamate metabolism540.0941.11 × 10−3
ko00410beta-Alanine metabolism430.0953.61 × 10−3
ko00941Flavonoid biosynthesis460.097.67 × 10−3
ko00520Amino sugar and nucleotide sugar metabolism1130.0747.67 × 10−3
ko04070Phosphatidylinositol signaling system660.0827.67 × 10−3
ko00220Arginine biosynthesis350.0959.78 × 10−3
ko04712Circadian rhythm-plant590.0811.56 × 10−2
ko00360Phenylalanine metabolism290.0952.00 × 10−2
ko00524Neomycin, kanamycin, and gentamicin biosynthesis100.1492.25 × 10−2
ko00130Ubiquinone and other terpenoid-quinone biosynthesis340.0892.37 × 10−2
ko00910Nitrogen metabolism360.0882.50 × 10−2
ko00908Zeatin biosynthesis160.1113.31 × 10−2
ko00901Indole alkaloid biosynthesis30.3754.12 × 10−2
ko00965Betalain biosynthesis120.124.59 × 10−2
Disclaimer/Publisher’s Note: The statements, opinions and data contained in all publications are solely those of the individual author(s) and contributor(s) and not of MDPI and/or the editor(s). MDPI and/or the editor(s) disclaim responsibility for any injury to people or property resulting from any ideas, methods, instructions or products referred to in the content.

