Article

Machine Learning-Assisted NIR Spectroscopy for Dynamic Monitoring of Leaf Potassium in Korla Fragrant Pear

1
Institute of Horticulture and Forestry, Tarim University, Alar 843300, China
2
Tarim Basin Biological Resources Protection and Utilization Key Laboratory, Xinjiang Production and Construction Corps, Alar 843300, China
3
Southern Xinjiang Special Fruit Trees High-Quality, High-Quality Cultivation and Deep Processing of Fruit Products Processing Technical National Local Joint Engineering Laboratory, Alar 843300, China
4
Horticulture and Forestry College, Nanjing Agricultural University, Nanjing 210095, China
*
Author to whom correspondence should be addressed.
These authors contributed equally to this work.
Agronomy 2025, 15(7), 1672; https://doi.org/10.3390/agronomy15071672
Submission received: 16 June 2025 / Revised: 5 July 2025 / Accepted: 8 July 2025 / Published: 10 July 2025
(This article belongs to the Section Precision and Digital Agriculture)

Abstract

Potassium (K), a critical macronutrient for the growth and development of Korla fragrant pear (Pyrus sinkiangensis Yu), plays a pivotal regulatory role in sugar-acid metabolism. Furthermore, K exhibits a highly specific response in near-infrared (NIR) spectroscopy compared to elements such as nitrogen (N) and phosphorus (P). Given its fundamental impact on fruit quality parameters, the development of rapid and non-destructive techniques for K determination is of significant importance for precision fertilization management. By measuring leaf potassium content at the fruit setting, expansion, and maturity stages (decreasing from 1.60% at fruit setting to 1.14% at maturity), this study reveals its dynamic change pattern and establishes a high-precision prediction model by combining near-infrared spectroscopy (NIRS) with machine learning algorithms. “Near-infrared spectroscopy coupled with machine learning can enable accurate, non-destructive monitoring of potassium dynamics in Korla pear leaves, with prediction accuracy (R2) exceeding 0.86 under field conditions.” We systematically collected a total of 9000 leaf samples from Korla fragrant pear orchards and acquired spectral data using a benchtop near-infrared spectrometer. After preprocessing and feature extraction, we determined the optimal modeling method for prediction accuracy through comparative analysis of multiple models. Multiplicative scatter correction (MSC) and first derivative (FD) are synergistically employed for preprocessing to eliminate scattering interference and enhance the resolution of characteristic peaks. Competitive adaptive reweighted sampling (CARS) is then utilized to screen five potassium-sensitive bands, specifically in the regions of 4003.5–4034.35 nm, 4458.62–4562.75 nm, and 5145.15–5249.29 nm, among others, which are associated with O-H stretching vibration and changes in water status. A comparison between random forest (RF) and BP neural network indicates that the MSC + FD–CARS–BP model exhibits the optimal performance, achieving coefficients of determination (R2) of 0.96% and 0.86% for the training and validation sets, respectively, root mean square errors (RMSE) of 0.098% and 0.103%, a residual predictive deviation (RPD) greater than 3, and a ratio of performance to interquartile range (RPIQ) of 4.22. Parameter optimization revealed that the BPNN model achieved optimal stability with 10 neurons in the hidden layer. The model facilitates rapid and non-destructive detection of leaf potassium content throughout the entire growth period of Korla fragrant pears, supporting precision fertilization in orchards. Moreover, it elucidates the physiological mechanism by which potassium influences spectral response through the regulation of water metabolism.

1. Introduction

As a characteristic fruit tree variety in Xinjiang, China, the unique quality characteristics of the Korla fragrant pear are closely related to potassium nutrition [1]. However, traditional methods for determining leaf potassium content, which are destructive, time-consuming, and laborious, struggle to meet the needs of precision management in modern orchards. Potassium, as one of the three essential nutrient elements for plants, plays an irreplaceable physiological role in the growth and development of fruit trees. It not only participates in regulating key physiological processes such as cell osmotic pressure, enzyme activity, and photosynthesis, but also serves as a crucial factor in ensuring fruit quality [2,3,4].

1.1. The Core Regulatory Role of Potassium Ions (K+) in Korla Pear Quality and the Advantages of Near-Infrared Detection

Potassium (K) plays a central regulatory role in sugar and acid metabolism in Korla fragrant pears, and its content variation has a decisive impact on fruit quality formation. Specifically, an increase in K content can enhance the net photosynthetic rate of leaves [5,6,7,8,9]. For example, in tomato cultivation, potassium levels are significantly and positively correlated with fruit diameter and single fruit weight (p < 0.01) [10]. The regulatory mechanism is mainly reflected in the following aspects:
Promoting the activity of key enzymes in sugar metabolism: It has been shown that sucrose phosphate synthase activity is promoted, directly increasing sugar accumulation in fruits [5,11,12,13,14,15]. Foliar application of K2SO4 on litchi leaves resulted in a 12% increase in soluble solids content, while titratable acid content decreased by 15% (p < 0.05) [16].
Enhancing sugar transport efficiency: RNA-Seq analysis has revealed that K+ enhances sugar transport efficiency in vascular bundles by up-regulating SUT2 transporter protein gene expression [17,18,19]. This mechanism significantly increases fructose accumulation in citrus (p < 0.001) [20].
Optimizing Sugar-Acid Ratio: Multiple regression analysis revealed a highly significant positive correlation between the fruit sugar-acid ratio and leaf K+ concentration (R2 > 0.85%, p < 0.01) [9,21,22]. This finding further confirms the dominant role of K+ in regulating fruit quality.
Regulatory Differences between K+ and NP Elements.
While nitrogen (N) and phosphorus (P) are essential for plant vegetative growth, excessive NP application can inhibit fruit quality [23,24]. Comparative experiments revealed that in strawberry cultivation, combined application of NPK (100:120:80 kg/ha) resulted in a 32% increase in yield and an 18% increase in sugar content, along with a 15% reduction in acidity (p < 0.05), compared to pure NP treatment [25]. Similarly, in mango experiments, compound application of NPK (T8) led to a 24% increase in single fruit weight, a 33% increase in vitamin C content, and a 19% increase in sugar content (p < 0.01) compared to single NP application [26].
Unique advantages of near-infrared spectroscopy for K+ detection.
K+ exhibits characteristic harmonic vibrations in the 7500–6800 cm−1 range, resulting from outer electron transitions. In contrast, N can only generate indirectly related signals through NH/OH functional groups in the 5200–4800 cm−1 range, and P relies on the weak overtone absorption of PO43− in the 8700–8200 cm−1 range. The K+ concentration (8–35 mg/g) in Korla pear leaves falls precisely within the optimal detection window for NIRS, and its distribution is even in the palisade tissue (coefficient of variation < 10%). However, the distribution difference of N between leaf veins and mesophyll reaches 30–45%, and P often exhibits a heterogeneous particle distribution, which leads to lower detection stability.
Therefore, this study selects K+ in Korla pear leaves as the core detection index, not only because of its key regulatory role in sugar-acid metabolism but also because of its highly specific response in near-infrared spectroscopy.
This strategy not only facilitates the precise monitoring of fruit quality formation dynamics but also provides a novel approach to NIRS-based fruit tree nutritional diagnosis.

1.2. Research Status

1.2.1. Research on Plant Nutritional Physiology

Existing research in plant nutritional physiology has demonstrated the dynamic allocation of potassium in fruit trees throughout their different growth stages. Peng et al.’s mineral nutrient allocation theory [27] posits that potassium, being a mobile nutrient, is preferentially transported to metabolically active organs. This has been confirmed in studies on fruit trees like apples [28] and citrus [20]. However, a systematic investigation into the dynamic changes of potassium in Korla fragrant pears has not yet been reported. Further research is particularly needed to explore the changes in leaf potassium content and its correlation with fruit quality formation during the critical fruit development stages of fruit setting, expansion, and ripening.

1.2.2. Application of Near-Infrared Spectroscopy Technology

Near-infrared spectroscopy (NIRS) has emerged as a prominent research area in plant nutrition diagnosis, owing to its rapid, non-destructive nature and capability for simultaneous multi-component detection [29]. FT-NIRS was used by Guarçoni M et al. to determine the geographical origin of pear fruits, but they did not extend this to leaves [30]. In pear fruit FT-NIRS, Wang et al. used second derivative preprocessing to reduce noise; however, its application to leaves remains unreported [31]. Tamburini et al. developed an FT-NIRS model for nitrogen/chlorophyll in apple leaves [32], while also highlighting the necessity for specialized spectral correction for samples with high moisture content. The correlation between leaf moisture-sensitive bands and potassium content was confirmed by Yu et al. [33], providing a theoretical basis for potassium detection via spectroscopy. As of now, no studies have focused on developing noise-resistant algorithms (e.g., band segmentation or deep learning approaches) for Fourier transform NIRS to address water interference specifically in pear leaves, which presents a significant obstacle to precise potassium diagnosis [34].
However, most of the existing research focuses on the static modeling of a single growth period, and lacks the adaptability research on the dynamic changes of the whole growth period.
In recent years, advancements in chemometric methods, especially the application of feature selection algorithms such as competitive adaptive reweighted sampling (CARS), have significantly improved the prediction accuracy of spectral models [35].
In terms of model construction methods, machine learning algorithms like Random Forest (RF) and BP neural networks have shown considerable advantages. RF algorithms have been found to exhibit superior anti-overfitting capabilities when processing high-dimensional spectral data [36]. BP neural networks, owing to their robust nonlinear fitting capabilities, excel in predicting complex systems [37]. Nevertheless, optimizing algorithm parameters for the spectral characteristics of Korla fragrant pear leaves and establishing a prediction model that balances accuracy and stability remains a critical scientific problem that requires urgent attention.

1.3. Research Content and Value

We hypothesize that Fourier Transform Near-Infrared (FT-NIR) spectroscopy, combined with advanced machine learning algorithms, can accurately and non-destructively quantify potassium content in Korla fragrant pear leaves at different growth stages. This approach is expected to achieve prediction accuracy comparable to standard laboratory methods and prove suitable for nutrient management in practical orchards.
Using the Korla fragrant pear as a model, this study systematically undertakes the following innovative work: (1) The dynamic changes and physiological significance of potassium content in leaves at different growth stages will be revealed through measurement. (2) The response mechanism of potassium characteristic bands will be elucidated by combining various spectral preprocessing methods. (3) Feature selection will be optimized using the CARS algorithm to establish a high-precision prediction model based on machine learning. (4) The prediction stability of the model will be evaluated across different phenological stages to provide technical support for precision fertilization in orchards.
The scientific value of this study lies primarily in three aspects: First, the dynamic change patterns of potassium content in Korla fragrant pear leaves were systematically elucidated for the first time, enriching the mineral nutrition theory of fruit trees. Second, a combined MSC + FD–CARS–BP model was proposed, achieving high-precision prediction of potassium content (R2 > 0.86%, RMSE < 0.103%). Finally, a fertilization decision-making system based on phenological phases was established, offering a practical tool for precision orchard management. These research findings not only filled the technical gap in the rapid detection of potassium in Korla fragrant pears but also provided new insights for refining the theory of fruit tree nutrient diagnosis. Consequently, this study is of great significance for improving the quality of Korla fragrant pears and promoting the sustainable development of the industry.

2. Materials and Methods

2.1. Survey of Test Sites and Materials

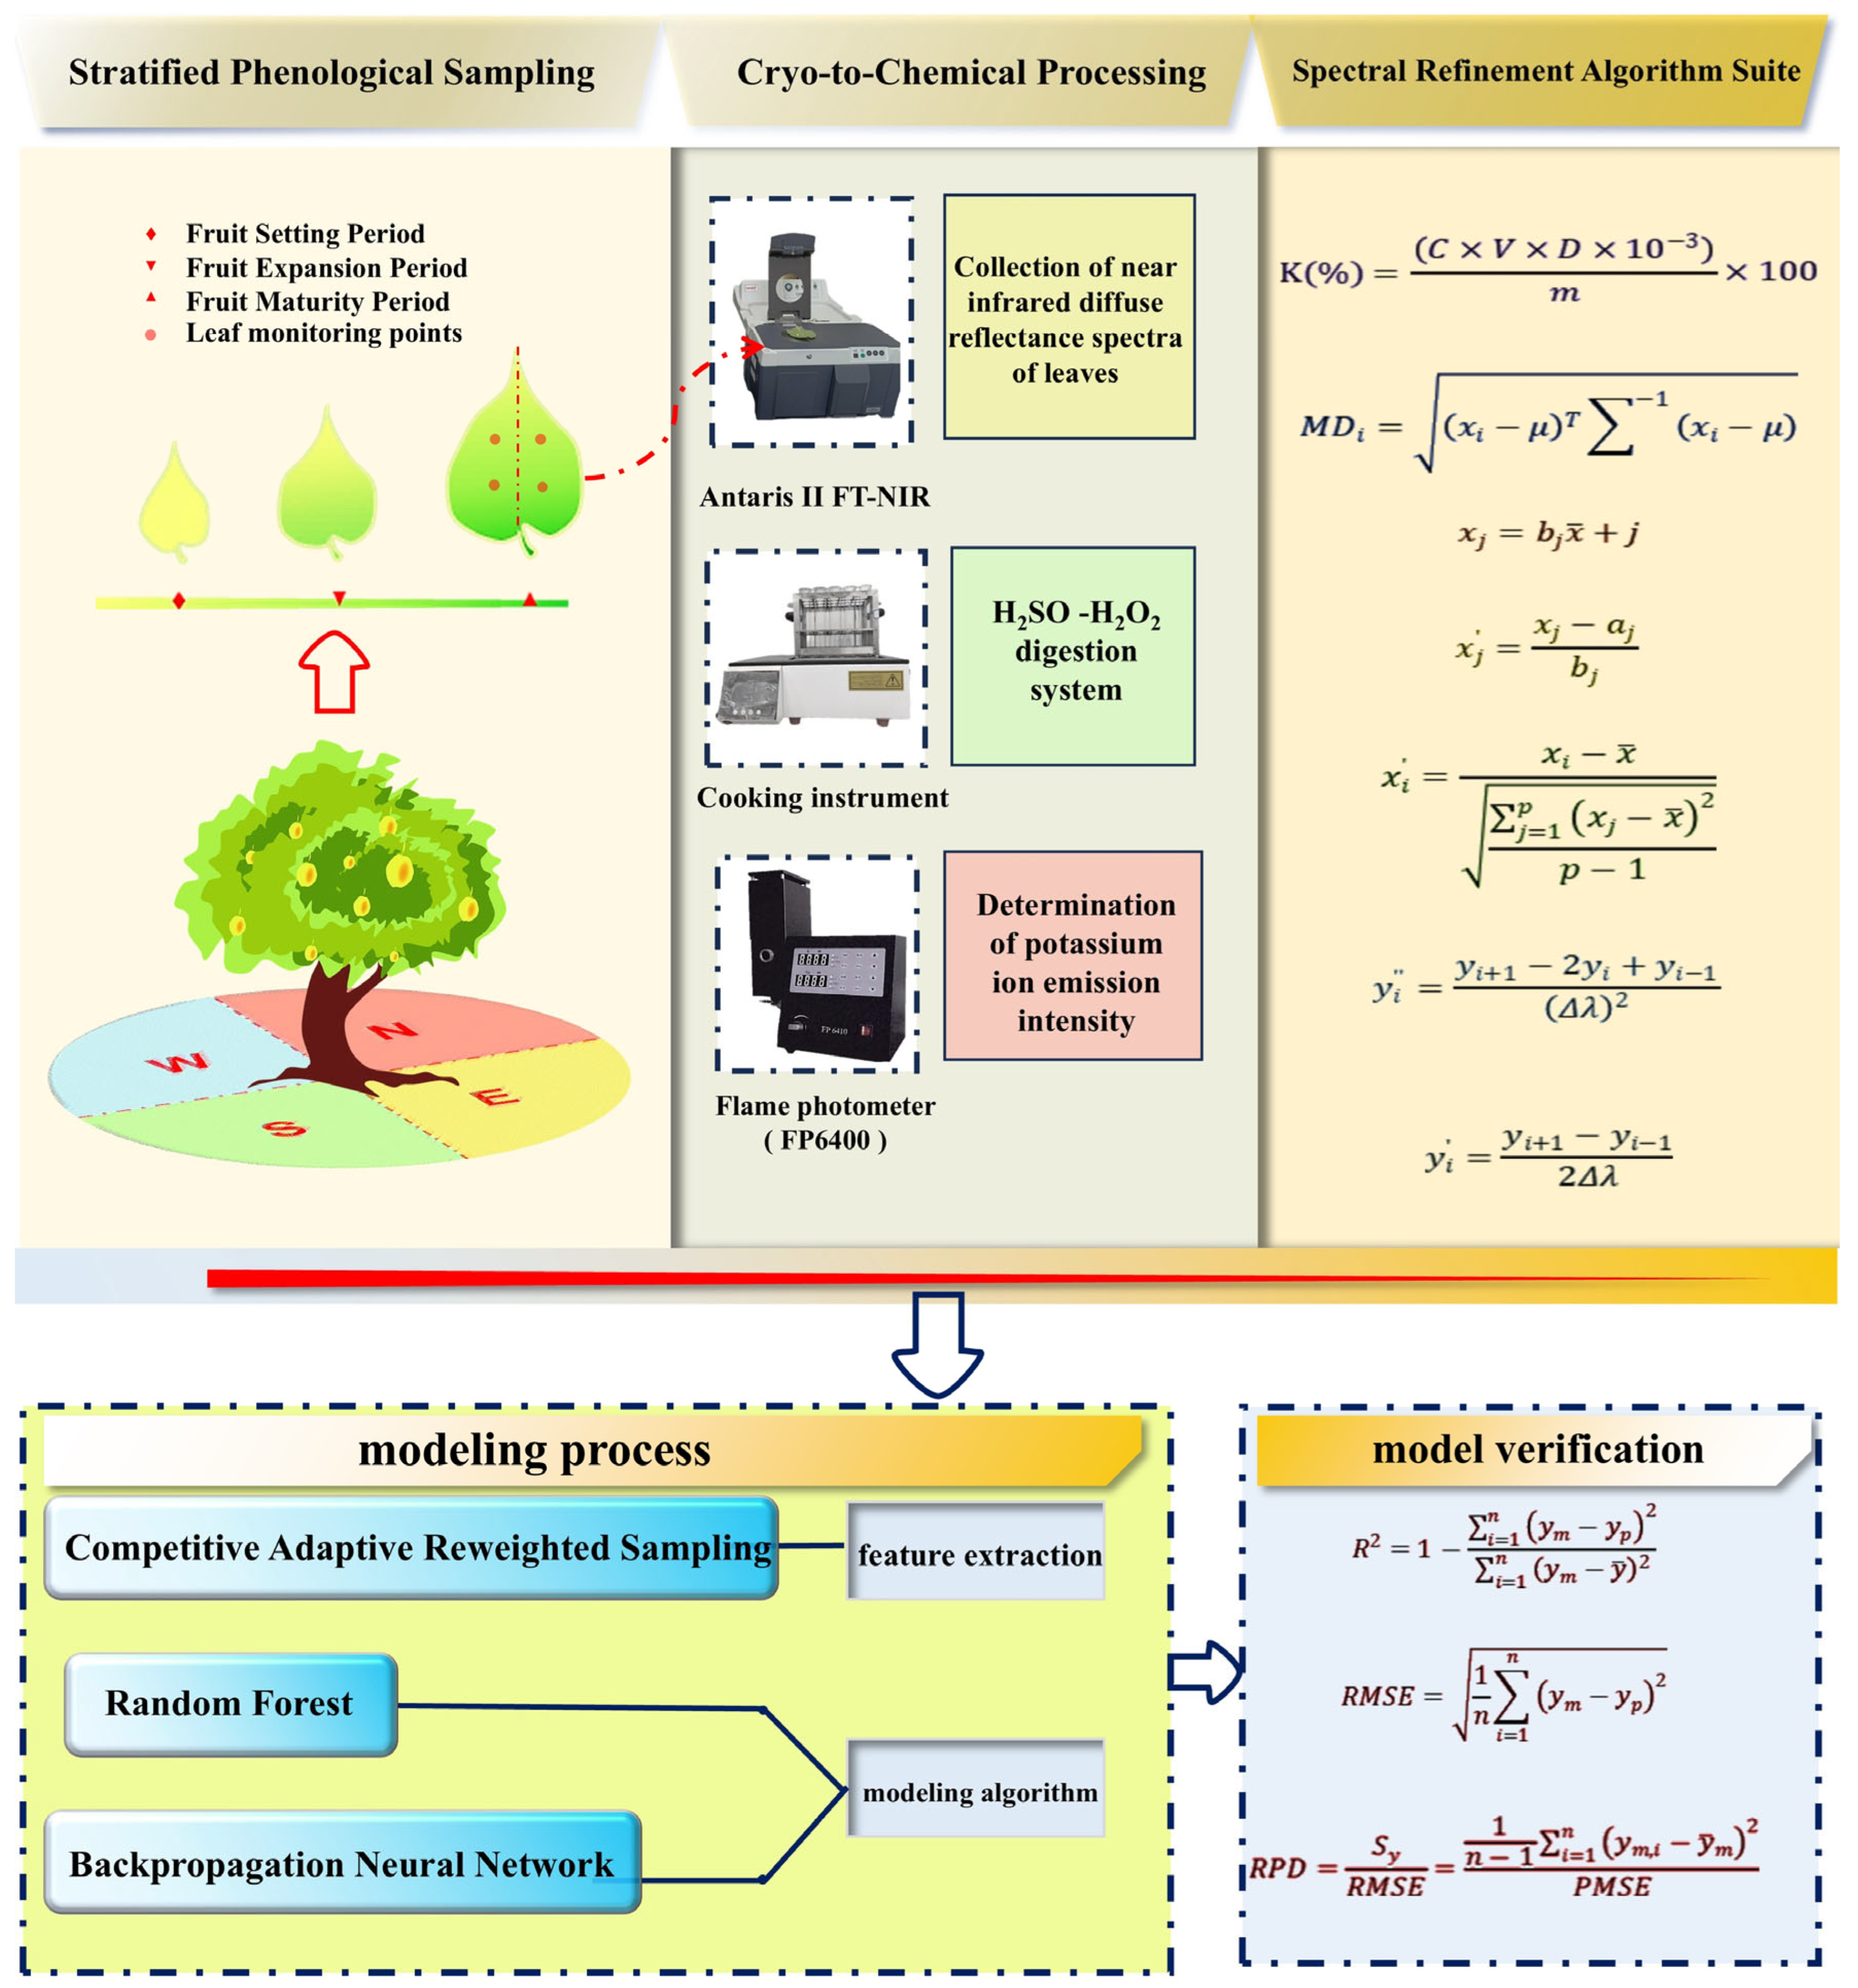
The experiment was conducted from 2024 to 2025 on the campus of Tarim University in Alar City, Xinjiang Uygur Autonomous Region, China (81°58′ E, 40°22′ N; altitude 1017 m) (Figure 1). The experimental area is situated on the alluvial plain of the north bank of the upper Tarim River, characterized by a typical warm-temperate extreme continental arid desert climate. Key climatic features include an annual average temperature of 10.7 °C, annual precipitation of approximately 50 mm concentrated in summer, and minimal snowfall in winter. Furthermore, the area experiences annual potential evaporation exceeding 2000 mm, annual sunshine duration of 2900 h, and a diurnal temperature range of 10–15 °C. The soil used in the experiment was a sandy loam, developed from river alluvial parent material, exhibiting a uniform texture (sand: silt: clay ratio of 75%, 20%, and 5%) and good permeability. Detailed physical and chemical properties of the soil profile are presented in Table 1.
The test material consisted of 23-year-old mature Korla fragrant pear trees, grafted onto *Pyrus betulifolia* Bunge rootstock. The experimental orchard was planted in north-south rows, with trees spaced 2 m apart within each row and 4 m apart between adjacent rows. As a result, the trees exhibited vigorous growth and consistent vigor.Orchard management followed standard local practices: irrigation was carried out by flood irrigation at intervals of 15–20 days, with an annual irrigation volume of approximately 8000–10,000 m3/ha; fertilization primarily involved decomposed sheep manure and 15–15–15 compound fertilizer, applied annually at a rate of 600–800 kg/ha; and pest and disease control employed integrated pest management (IPM). To minimize the impact of micro-environmental variations, all test materials were selected from the central orchard area, which was unshaded and had uniform light conditions.

2.2. Sample Collection

Mature leaves were collected from the middle and lower sections of current-year branches on the outer edge of the canopy of each experimental tree (Table 2) during the fruit setting stage (23 April 2024), fruit enlargement stage (11 July 2024), and fruit maturity stage (20 September 2024) of Korla fragrant pears. Single leaves were carefully collected from each cardinal direction (east, south, west, north) from 150 trees. The collected leaves were then labeled and Short-term cryopreserved at −4 °C (≤7 days) [38] in a refrigerator until spectral scanning and total potassium content analysis could be performed.

2.3. Original Spectral Data Acquisition

Liu et al. compared the potassium content of fresh leaves with that of leaves stored at −4 °C for 7 days. The difference was less than 3% (p > 0.05), which confirms that short-term freezing does not affect potassium determination [39]. Lang et al. (2024) detected element changes over 75 days and found that the coefficients of variation (CVs) for nitrogen, phosphorus, and potassium were less than 5% when stored at −4 °C for 7 days, which met the analytical accuracy requirements [38].
After removal from a −4 °C freezer (Haier Biomedical, Qingdao, China), the experimental samples were equilibrated for 12 h in the spectrometer laboratory (ambient temperature 24 °C) to ensure the sample temperature matched the room temperature, thus eliminating temperature gradient interference. The Fourier transform near-infrared spectrometer (Antaris II FT-NIR, Thermo Fisher Scientific, Waltham, MA, USA) was powered on and preheated for 30 min, followed by diffuse reflectance correction using a standard white board.
Selection of Spectral Acquisition Points
K+ transport in leaves typically exhibits longitudinal (leaf base → leaf tip) [40] and transverse (midrib → margin) [41] gradient distributions, as illustrated in Figure 1. Therefore, four key locations were selected in this study for sampling and analysis (Figure 2). This design is based on the following scientific considerations: First, the leaf base and leaf tip, representing the extreme locations of K+ input and transpiration loss, respectively, can fully reflect the dynamic changes in longitudinal transport. Second, the midrib and leaf margin, representing the vascular bundle transport center and stomatal regulation area, respectively, allow for accurate capture of transverse functional differentiation. These four sampling points ensure coverage of all key physiological functional areas while avoiding data redundancy, thus optimizing the balance between experimental efficiency and statistical power.
Compared to using fewer sampling points (e.g., 3), this design prevents important functional areas from being missed. Conversely, increasing the number of sampling points (e.g., more than 5) may introduce redundant information, thereby reducing research efficiency. Therefore, the 4-point sampling scheme enables optimal allocation of research resources while ensuring data integrity.
For sampling location selection, two regions were chosen on both the upper and lower sections of the leaf, delineated by the leaf veins (totaling 4 locations, labeled with numbers 1–4) (Figure 2). Spectra from different regions were differentiated by color. Each region was scanned repeatedly 4 times, using the following parameters: a spectral range of 10,000~4000 cm−1, a resolution of 8 cm−1, a gain of 2×, and 32 scans per measurement. This process yielded sixteen spectral curves per leaf. Following baseline correction, the mean value was calculated and used as the sample’s final absorbance (A) value for subsequent chemometric modeling and analysis. Through standardized pretreatment, instrument calibration, and multi-point repeated measurements, this method effectively controlled the effects of temperature fluctuations, instrument drift, and leaf heterogeneity, thus establishing a solid data foundation for constructing a high-precision prediction model [42].

2.4. Determination of Total Potassium in Korla Pear Leaves

After collecting spectral data, the leaf samples were returned to the laboratory and cleaned sequentially with tap water, 0.1% detergent solution (Alconox, White Plains, NY, USA), tap water, and distilled water. The entire washing process did not exceed 2 min. After washing, the excess water on the leaf surface was quickly absorbed. Subsequently, the samples were dried in a forced-air drying oven at 105 °C (DHG-9070A, Yiheng Technical, Shanghai, China) for 20 min, followed by further drying at 80 °C until a constant weight was achieved. The dried samples were then pulverized using a stainless steel grinder (FW-100, Tianjin Taisite Instrument Co., Tianjin, China) and passed through a 60-mesh nylon sieve(Shanghai Chemical Apparatus, Shanghai, China). A 0.2 g aliquot of the ground and dried leaf sample was weighed and placed in a 100 mL digestion tube (Corning, NY, USA). The sample was first moistened with distilled water, then 5 mL of concentrated H2SO4 (Sinopharm Chemical Reagent Co. Ltd., Shanghai, China) was added, and the mixture was gently shaken. A bent-neck funnel (Jiangsu Jingjiang Glass Instrument, Taizhou, China) was placed at the mouth of the tube, and the tube was slowly heated at a low temperature on a digestion furnace (DK-20, Shanghai Yarong Biochemistry Instrument, Shanghai, China), gradually increasing the temperature as the concentrated sulfuric acid decomposed and white fumes were emitted.
When the solution turns completely brownish-black, the digestion tube should be removed from the digestion furnace and allowed to cool slightly. Add 10 drops of 300 g·L−1 H2O2 (Shanghai Lingfeng Chemical Reagent, Shanghai, China) dropwise, while continuously shaking the digestion tube to ensure a thorough reaction. Heat again for 15 min, cool slightly, and then add another 10 drops of H2O2. This process should be repeated 2–3 times until the digestion solution is colorless or clear. Then, heat for another 10 min to remove any excess H2O2. The digestion tube should be removed and allowed to cool. Rinse the small funnel with a small amount of distilled water, and transfer the rinsing solution into the bottle. The digestion solution should be diluted to 100 mL with distilled water, and the total potassium content determined using flame photometry [43].
For flame photometry, the instrument (FP6400, INASA Analytical Instruments, Shanghai, China) should be preheated for 30 min. Prepare 0, 5, 10, 20, 30, and 50 mg/L potassium standard working solutions using deionized water containing 5 mL of H2SO4 (KCl standard, National Institute of Metrology, Beijing, China). The instrument should be zeroed with a blank solution, and the emission intensity measured (R2 ≥ 0.99%). The solution to be tested should be filtered through a 0.45 (Millipore, Burlington, MA, USA) μm filter membrane (dilute with 5% H2SO4 solution if the concentration is beyond the range), and parallel measurements performed 3 times. Calculate according to the formula:
K ( % ) = C × V × D × 10 3 m × 100
where K is the total potassium content; C is the potassium concentration of the solution to be tested; V is the constant volume; D is the dilution multiple; m is the sample mass.

2.5. A Method for Eliminating Spectral Outliers

In this study, the Mahalanobis Distance (MD) method is used to detect and eliminate outliers of spectral data to prevent abnormal spectral data from affecting modeling and improve the robustness of modeling data [35]. The Mahalanobis distance is calculated as follows:
M D i = x i μ T 1 x i μ
where x i is the sample vector (column vector) to be calculated; μ is the mean vector of all samples.
There are 450 samples in this study; 14 abnormal samples are eliminated, and 436 samples are finally retained, which effectively reduces the impact of abnormal spectral data on modeling accuracy. Compared with Euclidean distance, the Mahalanobis distance method is more suitable for outlier detection of high-dimensional spectral data, which lays a data foundation for establishing a robust prediction model.

2.6. Spectral Pretreatment Methods

In the process of NIRS acquisition and sample chemical value analysis, external interference factors such as instrument high-frequency noise, light scattering effect, and artificial operation error in sample testing will significantly affect the accuracy and reliability of spectral analysis [44]. NIR spectral pretreatment technology provides key support for improving the reliability of quantitative analysis by reducing background noise interference and resolving overlapping spectral peaks. Eight pretreatment methods were used to optimize the original spectra, including multiple scatter correction (MSC), standard normal variable transformation (SNV), first derivative (FD), second derivative (SD), and combined pretreatment methods MSC + FD, SNV + FD, MSC + SD and SNV + SD. MSC and SNV eliminate the particle scattering effect by normalization, FD/SD is used to weaken baseline drift and enhance spectral resolution, and the combination method realizes synergistic suppression of complex spectral interference by coupling scattering correction and derivative transformation.
(1) The formula of multiple scattering correction (MSC) is as follows:
x j = b j x ¯ + j
x j = x j a j b j
average spectrum of all the sample spectra, let each sample spectrum have P wavelength points, X ¯ = x 1 ¯ , x 2 ¯ , , x p ¯ , where x i ¯ is the average of the absorbance of all samples at the i th wavelength point; X j for each sample spectrum; b j is the regression coefficient obtained from the linear regression fit;   a j is the intercept obtained from the linear regression fit.
(2) The formula of the standard normal variable transformation (SNV) is as follows:
x i = x i x ¯ j = 1 p x j x ¯ 2 p 1
x i is the average of the spectrum of this sample. The p is the number of wavelength points and x i ¯ is the average of absorbance for all samples at the i th wavelength point.
(3) The first-order derivative (FD) and second-order derivative (SD) formulas are as follows:
y i = y i + 1 y i 1 2 Δ λ
y i = y i + 1 2 y i + y i 1 Δ λ 2
y i is a discrete sequence of spectral data ( i = 1, 2, n). And Δλ is the wavelength interval.

2.7. Feature Extraction

In this study, the competitive adaptive reweighting algorithm (CARS) is used to extract spectral features. The algorithm is based on Monte Carlo sampling and exponential decay weighting coefficients, and iteratively selects wavelength variables that contribute highly to modeling [45]. The specific process is as follows: First, calculate the weight of each wavelength variable according to the t-test statistics of coefficients, and construct an exponential decay model to dynamically adjust the weight distribution; then use the adaptive weighted sampling strategy, combined with partial least squares regression (PLS-R) to calculate the root mean square error of cross validation (RMSECV), and select the subset of variables that make the model prediction accuracy optimal; repeat the above process to gradually eliminate redundant variables until the model performance is stable or RMSECV significantly increases [46].

2.8. Dataset Partitioning

For partitioning the leaf development dataset, we adopted a scheme comprising 70% training set, 15% validation set, and 15% test set. Stratified group splitting was performed, with stratified sampling based on developmental stage and grouping based on biological replicates. This partitioning ratio ensures sufficient learning of the biological patterns at each developmental stage during the training phase (using 70% of the core data), while leveraging an independent validation set to accurately optimize key parameters. Furthermore, the strictly isolated test set ensures that the evaluation results genuinely reflect the model’s generalization ability to new, individual fruits. Under this moderate data scale, the ratio achieves a triple balance—training depth, evaluation robustness, and biological rationality—effectively preventing data leakage and stage bias, and providing a reliable foundation with both statistical significance and practical value for developmental prediction models.

2.9. Modeling Algorithm

Two machine learning algorithms, RF (Random Forest Algorithm) and BP neural network algorithm, are used in this study. Random forest is an ensemble learning method based on decision trees, which improves the accuracy and robustness of the model by constructing multiple decision trees and synthesizing their prediction results. The algorithm is trained by randomly selecting features and samples to effectively reduce the risk of overfitting, and at the same time, can evaluate the importance of each feature, which is suitable for analysis and modeling of high-dimensional data [47]. BP neural network is a classical artificial neural network, which realizes the modeling of complex data relationships through multilayer nonlinear transformation. The algorithm optimizes network weights by the gradient descent method, adjusts parameters by error back propagation, and has strong nonlinear fitting ability [48]. A single hidden layer structure is adopted in this study, which is combined with the ReLU activation function and regularization technique to ensure the generalization performance of the model on spectral data.

2.10. Model Evaluation Method

To comprehensively evaluate model performance, this study employed four indicators: the coefficient of determination (R2), root mean square error (RMSE), residual prediction deviation (RPD), and ratio of performance to interquartile range (RPIQ). R2 measures the goodness of fit, ranging from 0 to 1, where values closer to 1 indicate a stronger agreement between predicted and measured values [49]. It is calculated using Formula (8). RMSE quantifies the absolute magnitude of prediction error; smaller values indicate higher prediction accuracy [50], and it is calculated using Formula (9). RPD reflects the model’s predictive ability and is calculated using Formula (10). It is generally accepted that when RPD > 3, the model’s predictive ability is excellent; when 2 < RPD ≤ 3, the model can be used for initial prediction; and when RPD ≤ 2, the model’s predictive ability is poor.
RPIQ is an indicator for evaluating the performance of regression models. Its calculation formula is derived from 11 and is IQR (Interquartile Range) divided by RMSE (Root Mean Square Error). A higher value of this indicator indicates better model performance: RPIQ > 3 is excellent, 2–3 is good, 1–2 is fair, and ≤ 1 is poo [51].
In model evaluation, researchers divide the dataset into training and testing sets and calculate the aforementioned metrics separately to assess the model’s fitting effect, prediction accuracy, and generalization ability [52].
R 2 = 1 i = 1 n y m y p 2 i = 1 n y m y ¯ 2
R M S E = 1 n i = 1 n y m y p 2
R P D = S y R M S E = 1 n 1 i = 1 n y m , i y ¯ m 2 P M S E
R P I Q = I Q R R M S E
the sample size; y m and y p . They are the actual value and the predicted value of Korla fragrant pear Leaf Total Potassium, respectively;   y   ¯ is the average value of the actual Korla fragrant pear Leaf Total Potassium;   S y is the standard deviation of the Leaf Total Potassium measurement value of the Korla fragrant pear.
Data usage MATLAB R2024b (MathWorks Inc., Natick, MA, USA) and OriginPro 2021 (OriginLab Corporation, Northampton, MA, USA) analysis.

3. Results and Analysis

3.1. Analysis of Total Potassium Content in Leaves of Korla Pears at Different Periods

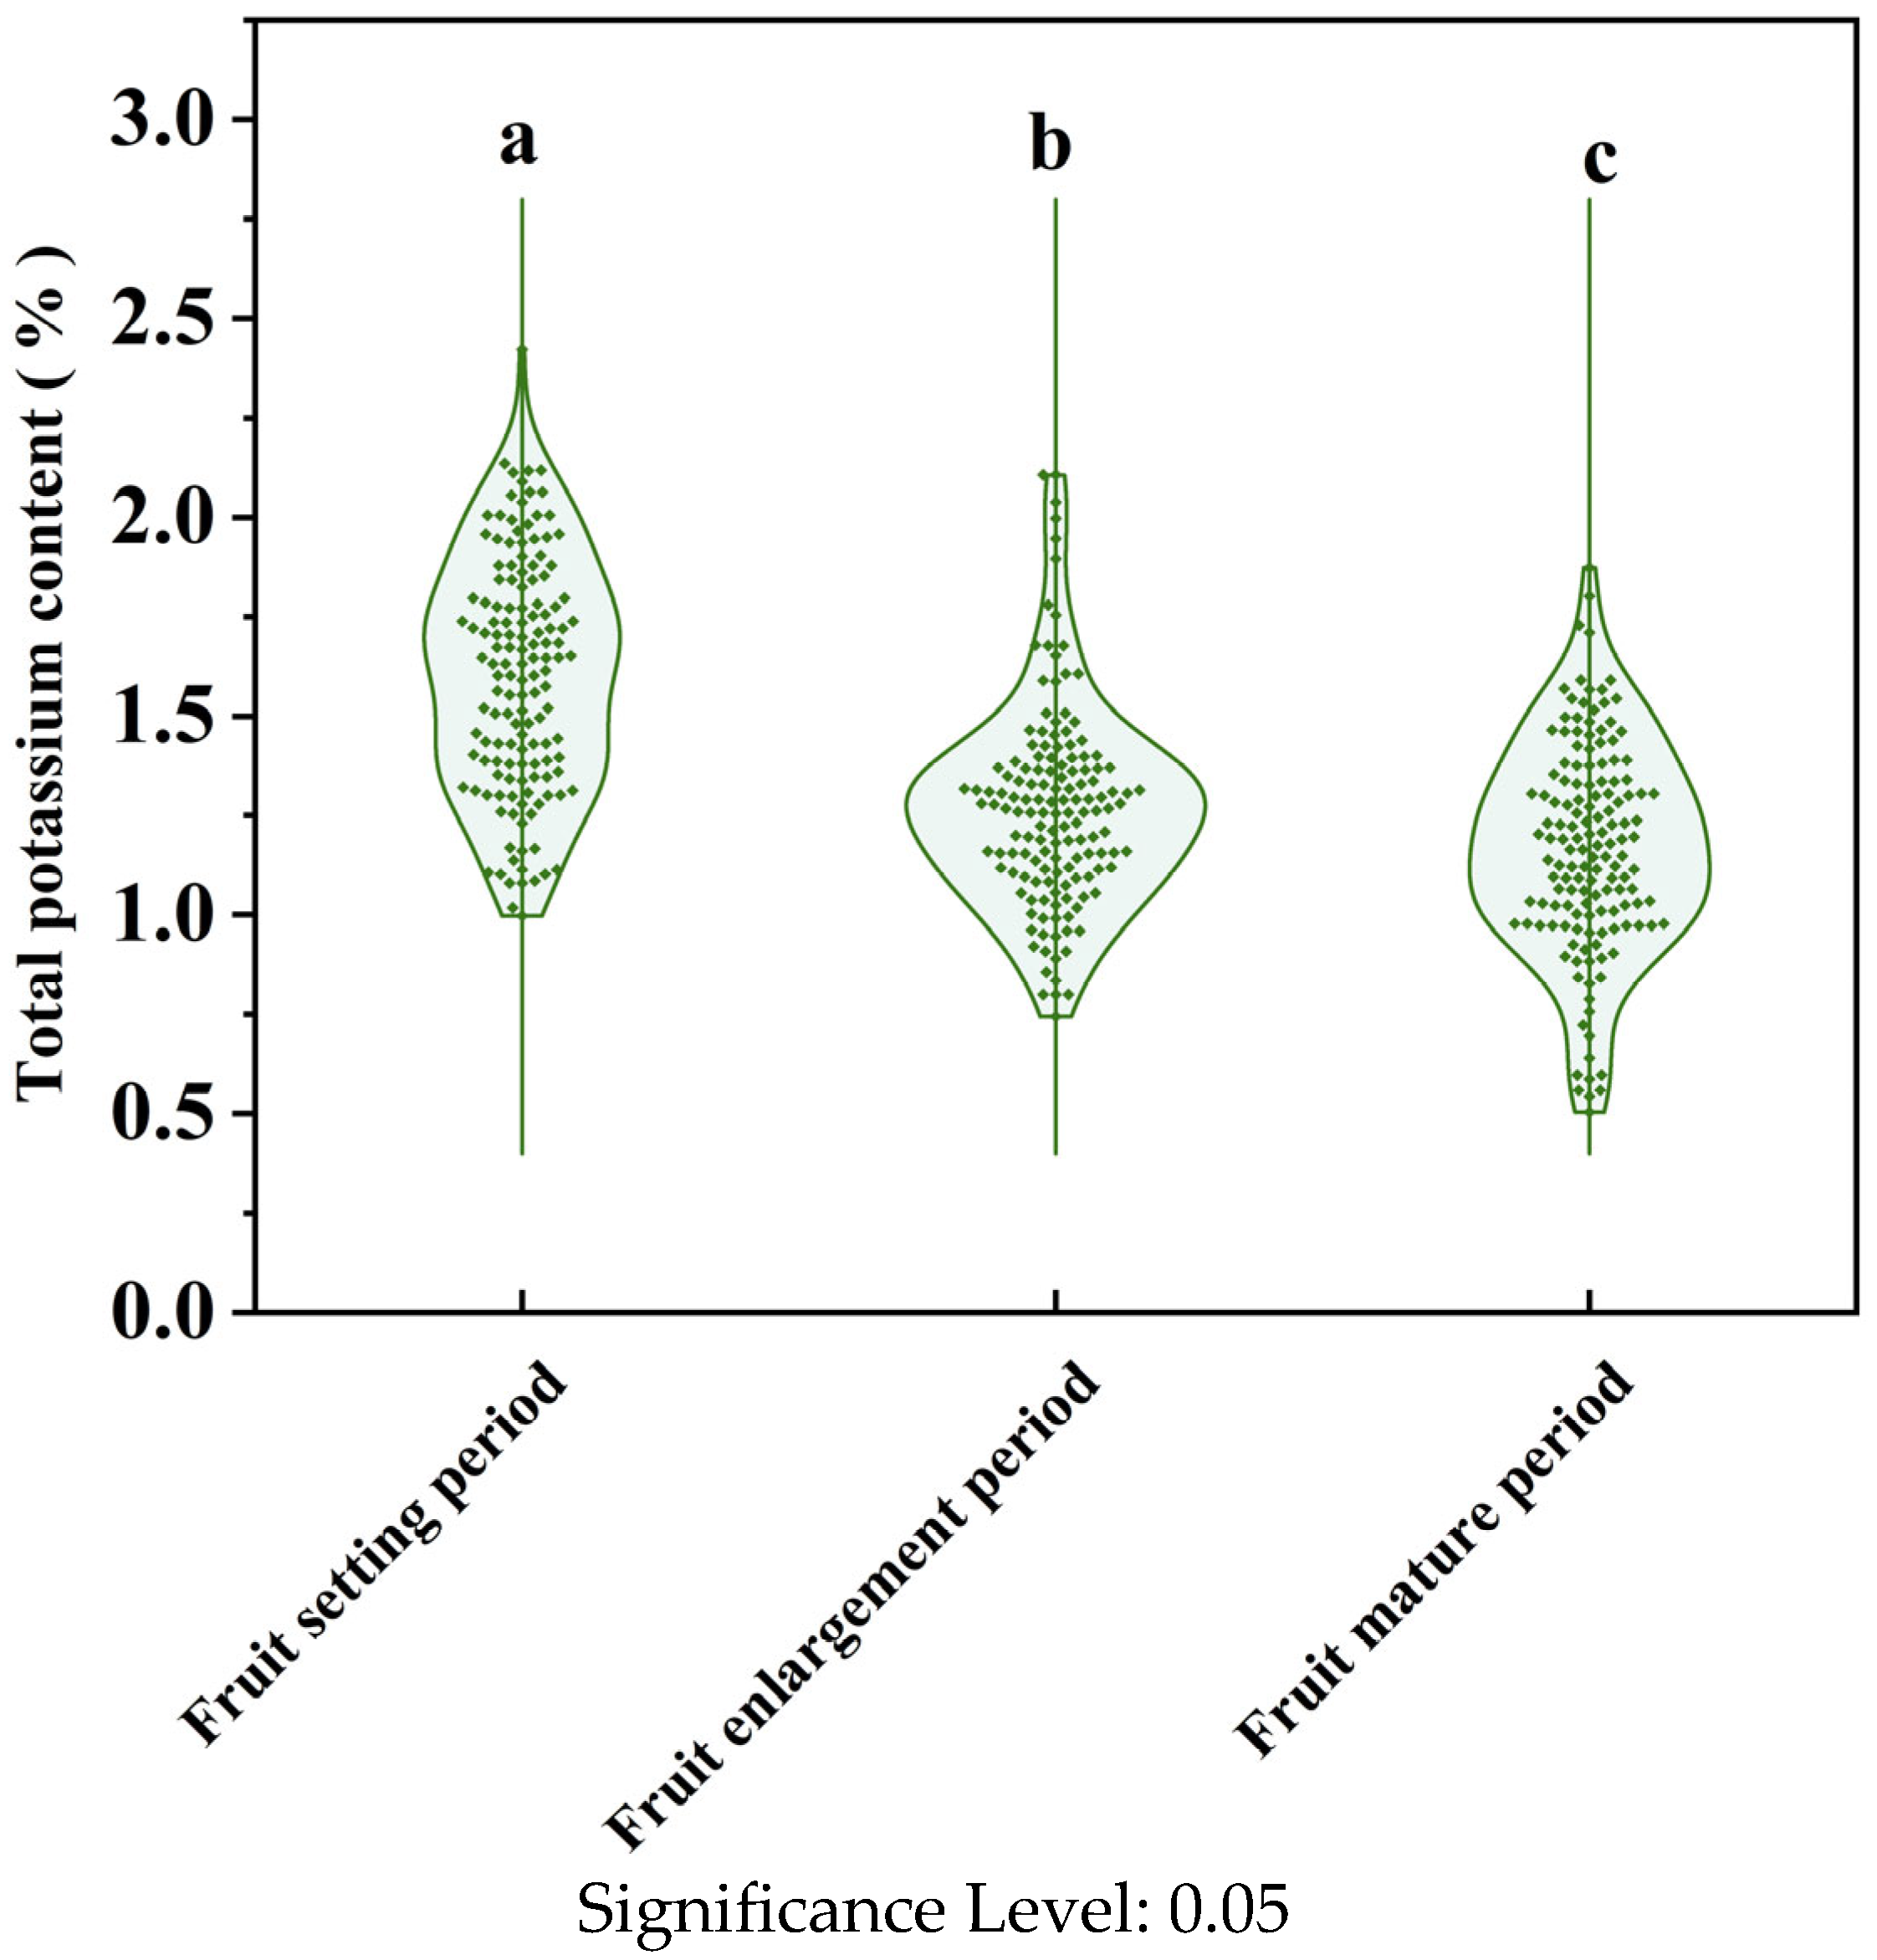
As shown in the figure(a, b, and c are used to denote significant differences in total potassium content among different fruit growth stages at the 0.05 significance level. Distinct letters signify statistically significant differences, allowing for a quick determination of the statistical significance of data variations between stages.), the total potassium content of leaves showed a significant downward trend during fruit development. Among them, the potassium content of leaves in the fruit setting period was the highest, with an average total potassium content of 1.6%, indicating that potassium accumulated in leaves in this stage to support the initial development of reproductive organs. After the fruit enlargement period, the average potassium content in leaves decreased to 1.27%, a decrease of about 20%, which may be related to potassium transport to fast-growing fruits. At the fruit mature period, K content in leaves decreased further to 1.14%, suggesting that K redistribution or leaf senescence led to nutrient outflow. This accords with the basic law of the Korla Fragrant Pear in its growth stage. At the same time, it can be seen in Figure 3 that different samples in the same period have large differences, which can better establish the model, which is conducive to the stability and robustness of the model.

3.2. Spectral Analysis of Korla Fragrant Pear Leaves

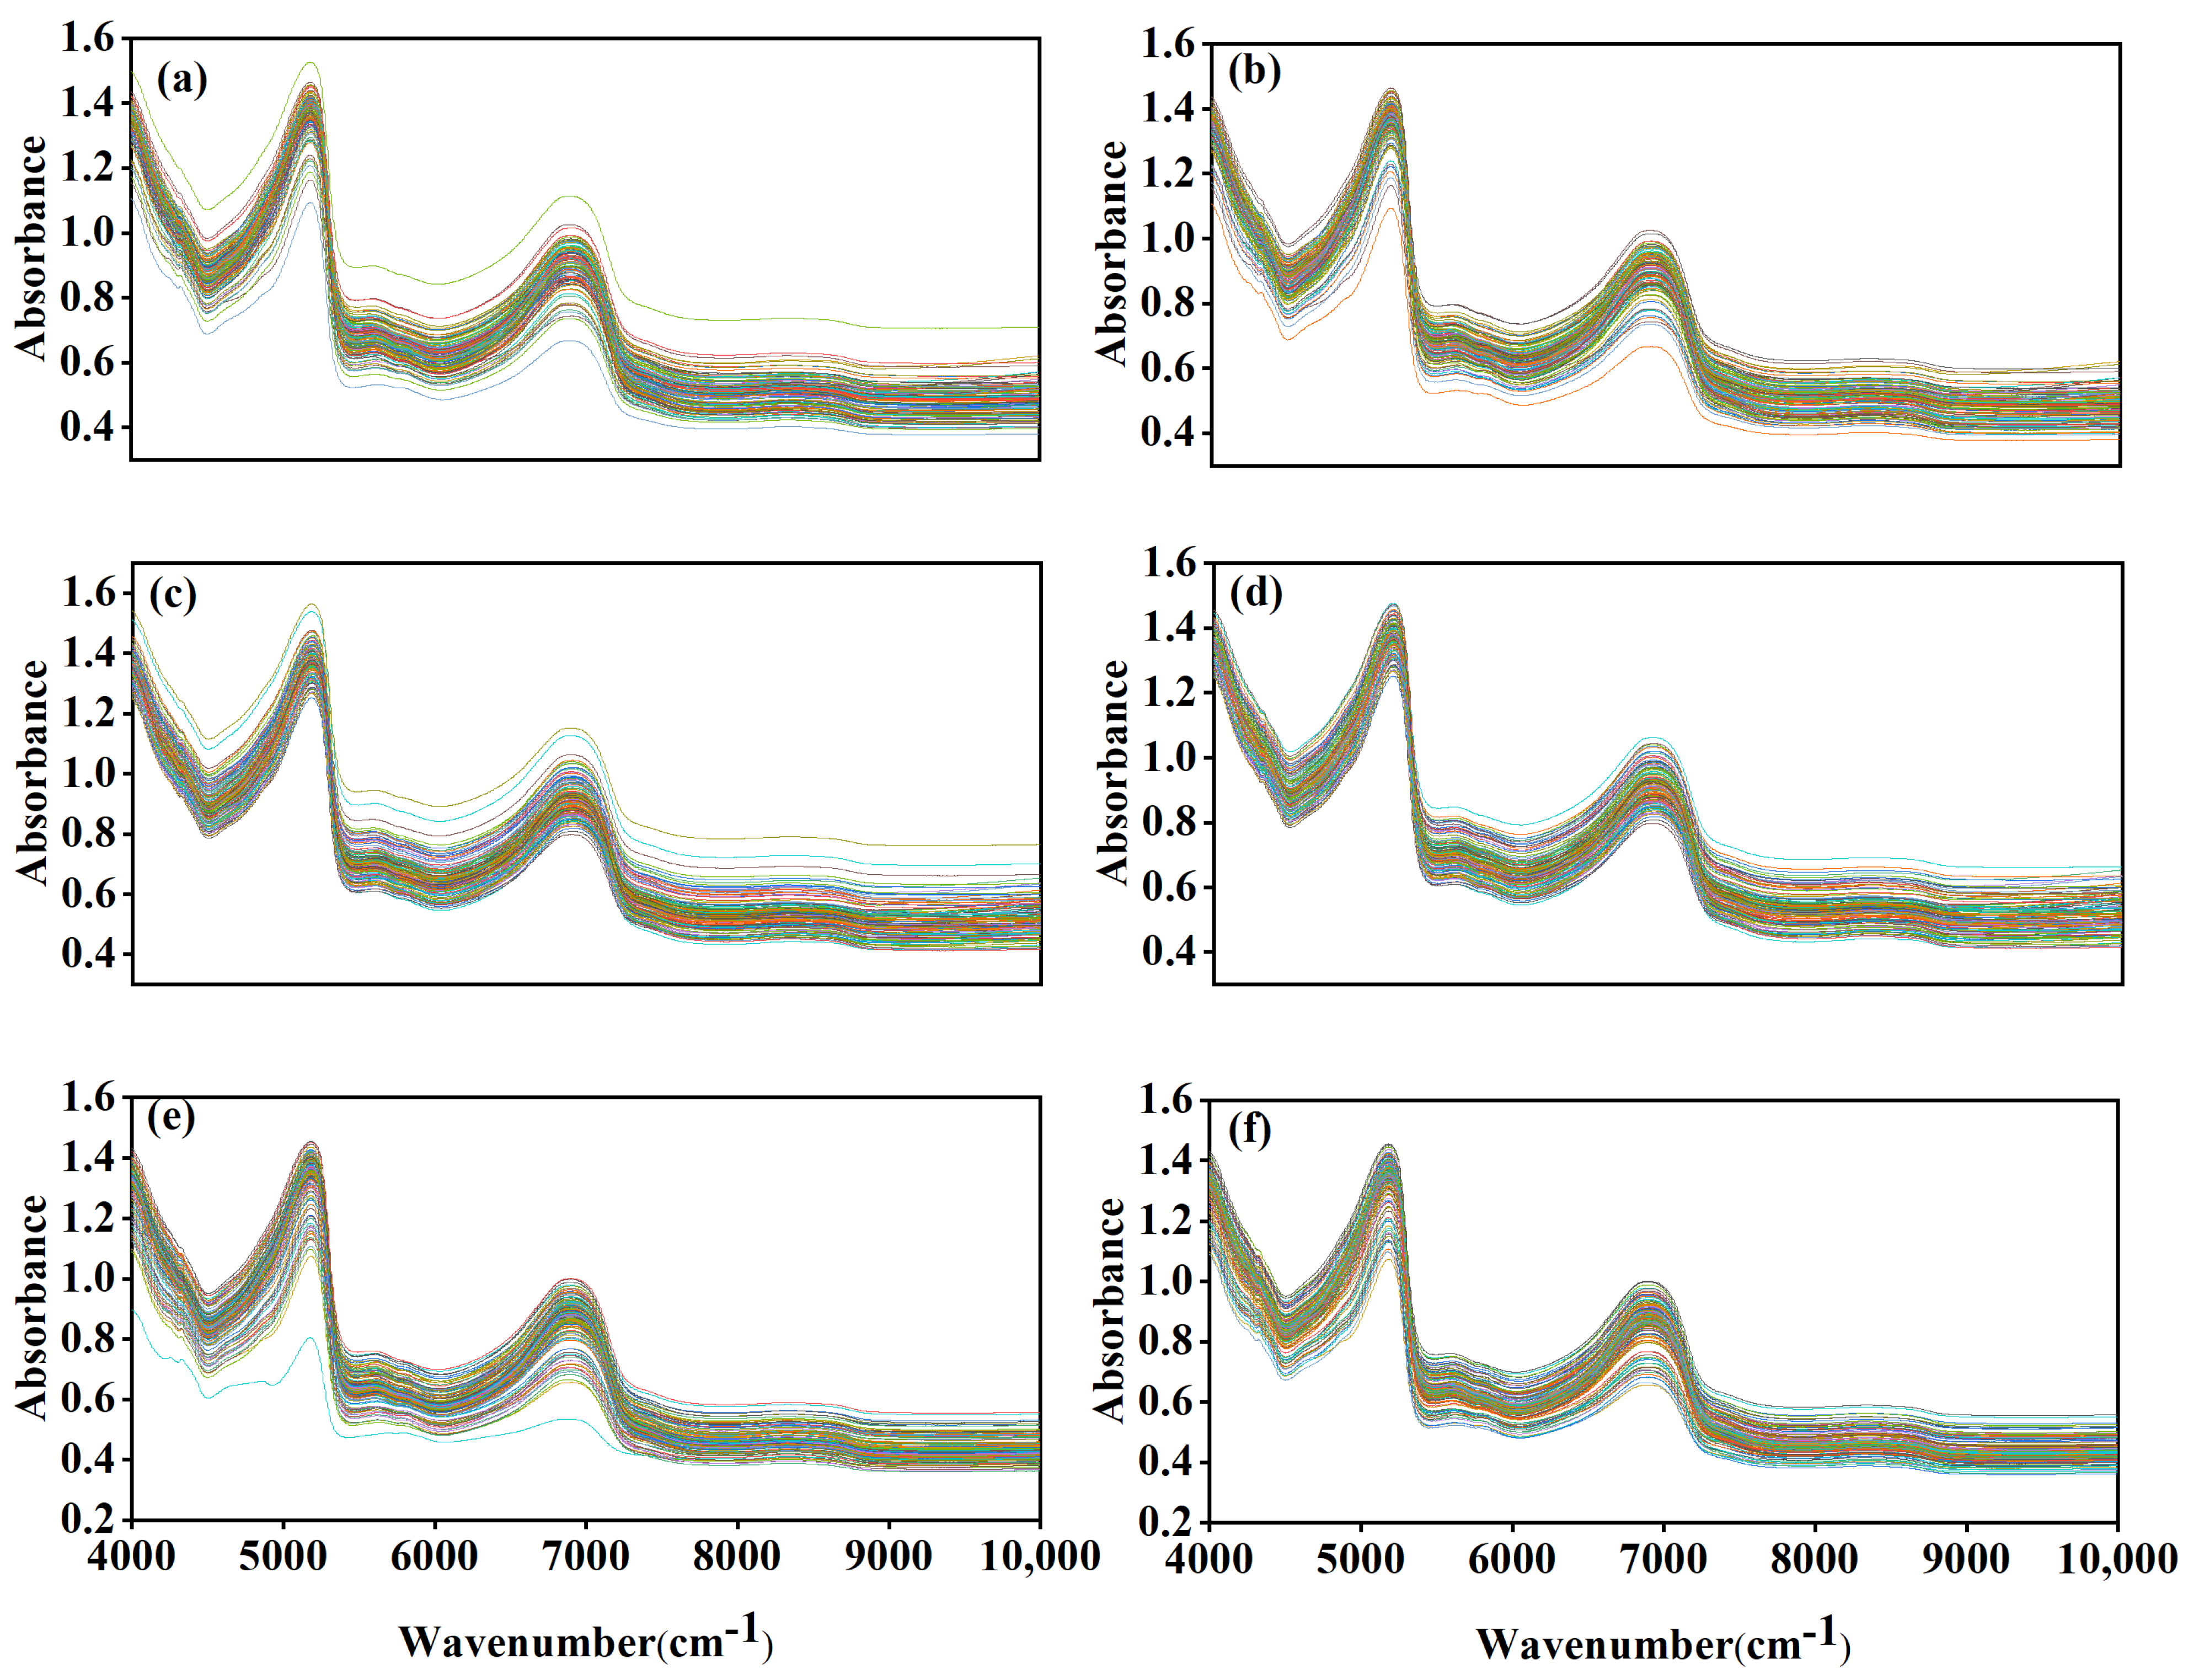
According to the spectrum expansion analysis of leaves in the fruit setting period, fruit expansion period and fruit maturity period of Korla Fragrant Pear, Figure 4a,c,e, respectively, show the original spectra in three periods. It can be seen that the spectral curve shapes in different growth periods not only reflect the evolution law of physiological and biochemical characteristics of leaves in common, but also present discreteness due to the existence of abnormal values. The original spectral samples in the fruit setting period have obvious differences. The partial spectral absorbance in the fruit expansion period deviates from the population trend. Discrete spectra interfere with true feature extraction during fruit maturity; after outliers are removed, the spectral curves in Figure 4b,d,f are more concentrated, the ability to obtain typical features is improved during fruit setting, the spectral response of leaves is accurately presented during fruit expansion, and unique spectral attributes are clearly reflected during fruit maturity. It can be seen from the comparison that the abnormal values interfere with the spectral change trend of growth period before elimination, and make the evolution law clearer after elimination, significantly improve the quality of spectral data, lay a solid foundation for growth monitoring, quality prediction and mining the quantitative relationship between spectrum and physiological and ecological indicators of fragrant pear, and help to deeply analyze the internal relationship between leaf spectral response and growth process and physiological state. At the same time, through the absorbance analysis of the wave position related to potassium element in the spectrum, it is found that there is a large absorbance at the wave number of about 5150 cm−1, which is a sensitive band for water molecules. The increase of potassium content may reduce the free water content of leaves, resulting in a decrease of absorbance. There is also a large absorbance at about 6900 cm−1, which is the first order of O-H (dominated by water). Potassium affects osmotic regulation and indirectly changes the spectral response of water at this site. Other wavenumber intervals related to potassium may not be better resolved by the naked eye due to defects in the original spectrum, which is one of the main reasons for spectral pretreatment in subsequent studies.

3.3. Spectral Pretreatment

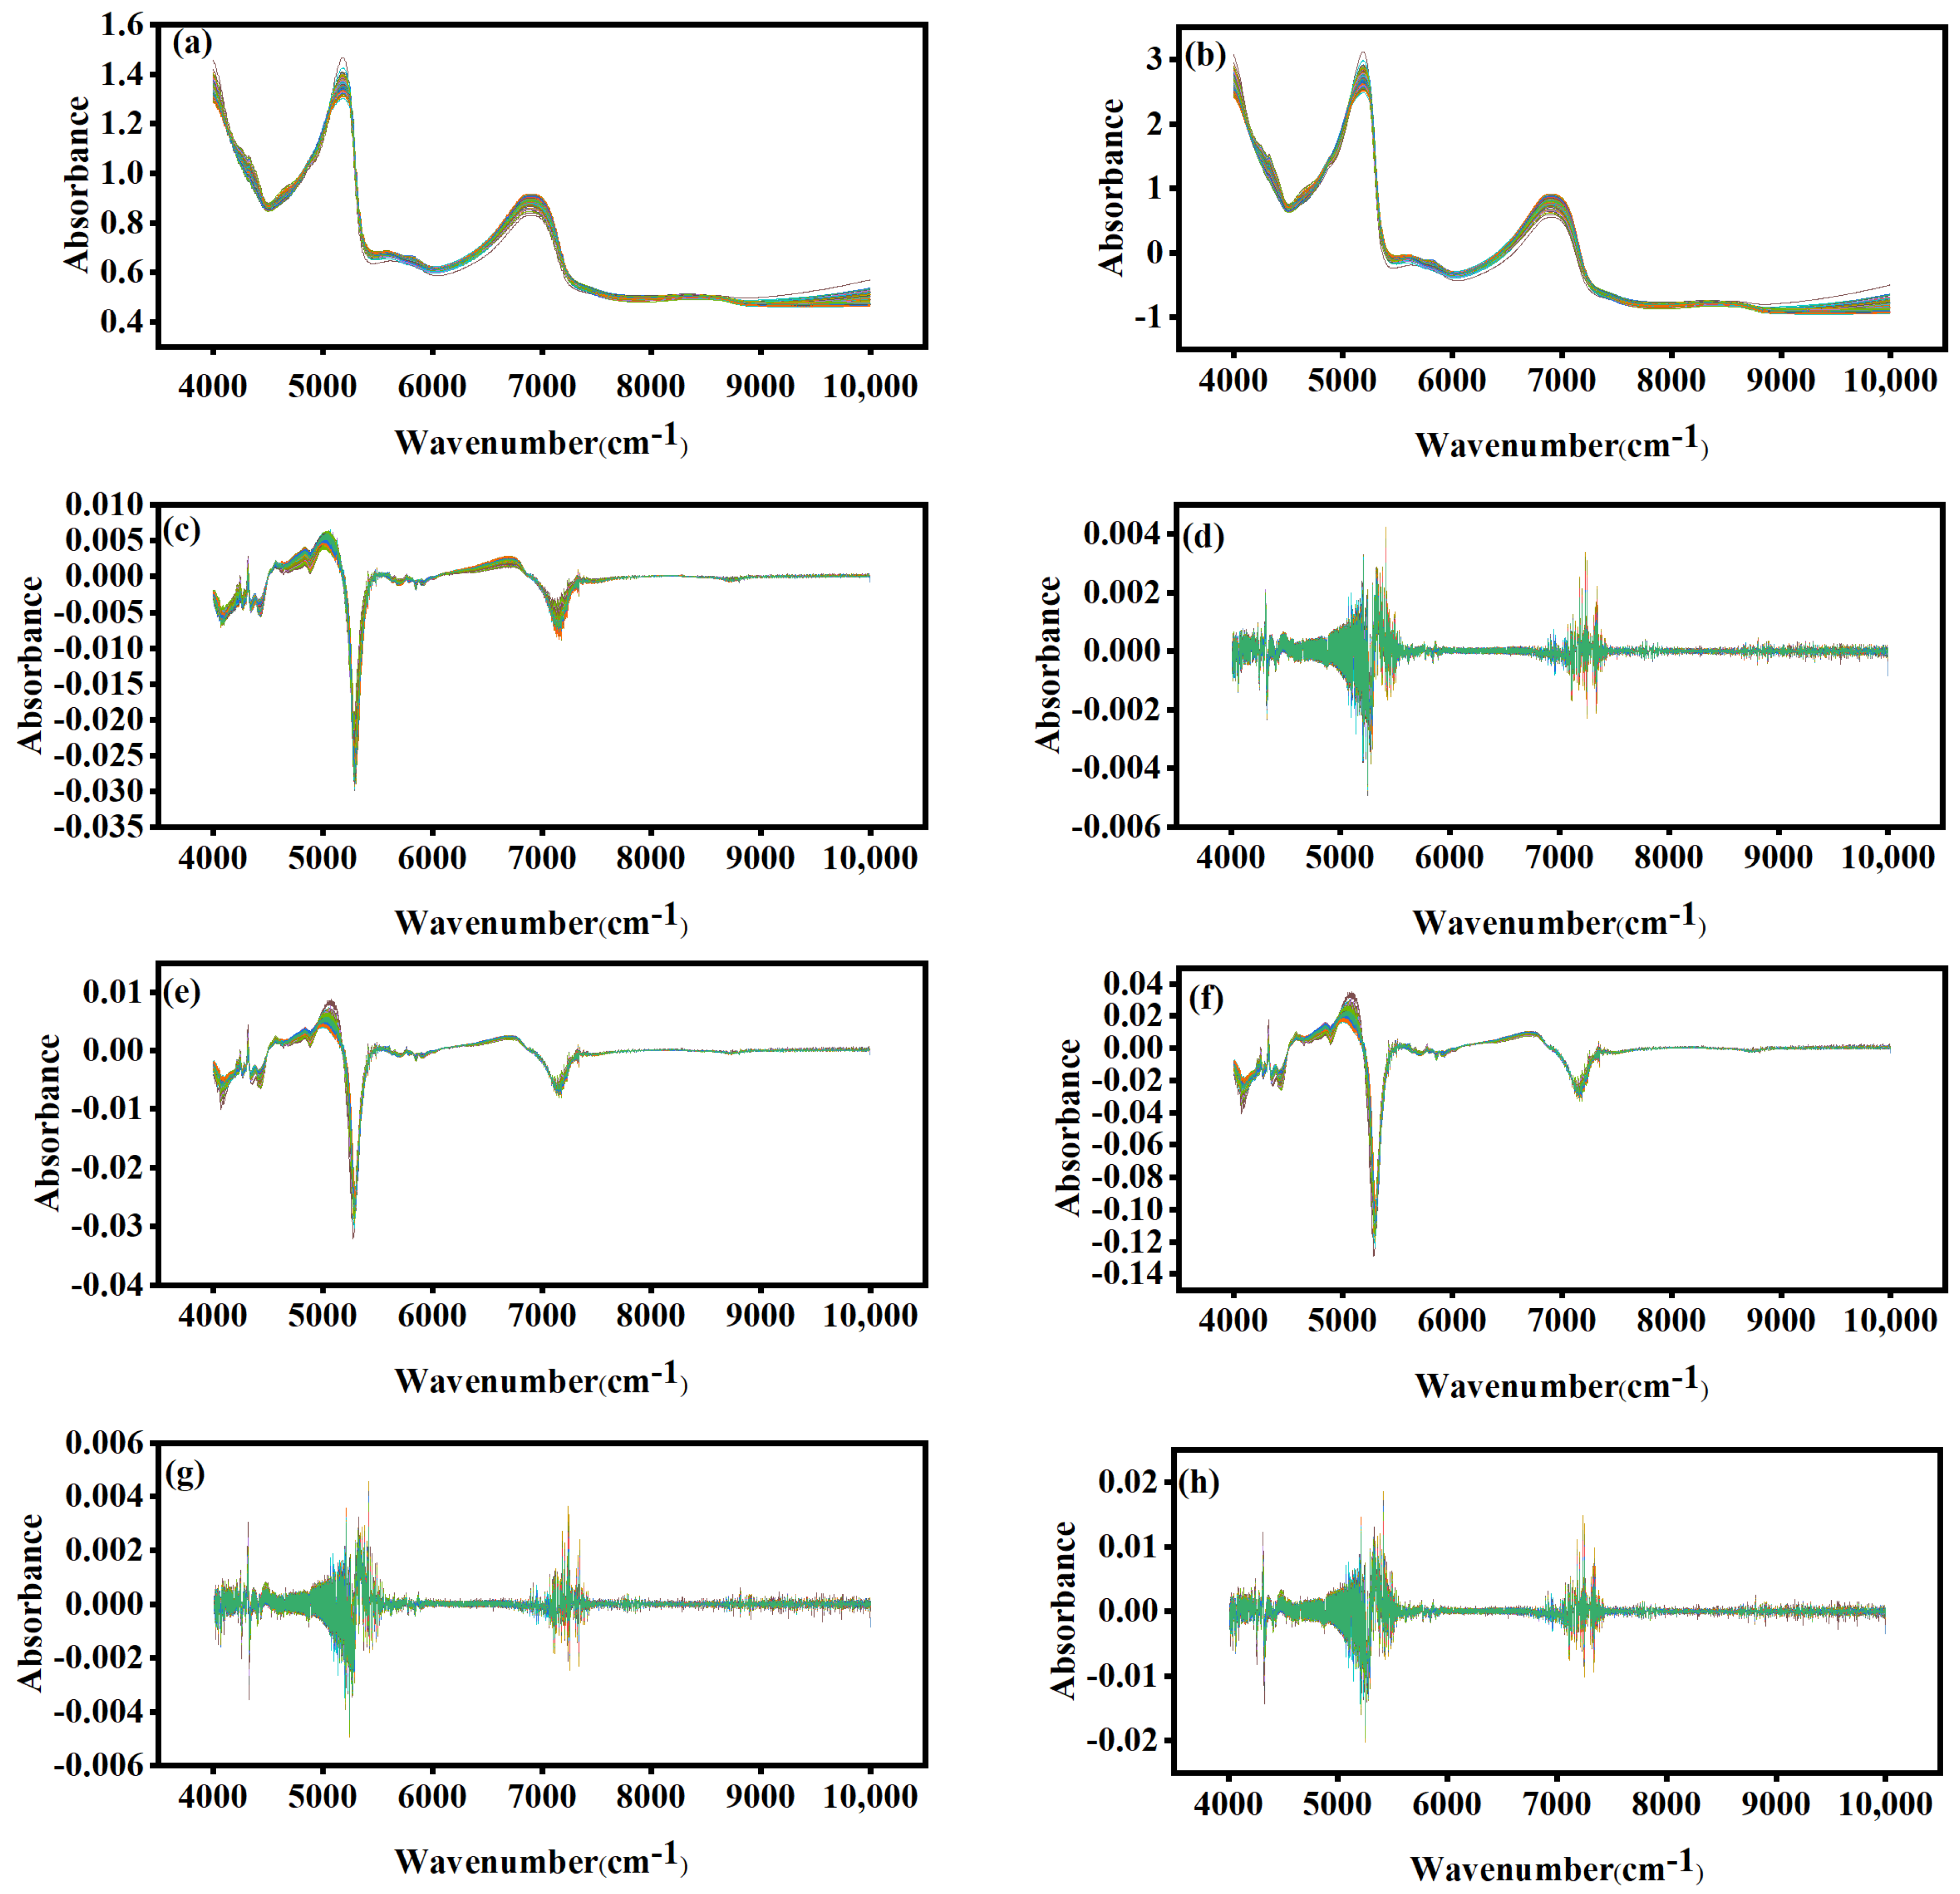
In order to obtain more useful and relevant information in the spectra, this study carried out a variety of preprocessing methods (including multivariate scatter correction MSC, standard normal variable transformation SNV, first-order derivative FD, second-order derivative SD and its combination) on the spectra of Korla fragrant pear leaves, and systematically explored the effects of different preprocessing methods on spectral characteristics. MSC effectively corrects baseline shifts due to scattering, resulting in a more regular spectral morphology (Figure 5a); SNV enhances spectral comparability by normalization (Figure 5b); FD improves absorption peak resolution by highlighting subtle spectral changes (Figure 5c); The second-order derivative SD (Figure 5d) further enhances the spectral peak characteristics, allowing better separation of overlapping peaks and effectively eliminating the influence of baseline drift, but the noise amplification effect is more obvious than that of the first-order derivative. In the combined pretreatment method, MSC + SD (Figure 5g) significantly enhances the resolution of characteristic peaks while improving the spectral baseline by correcting scattering first and then performing second derivative transformation, especially suitable for the resolution of overlapping absorption peaks; SNV + SD (Figure 5h) combines the advantages of standardization and second derivative to enhance the identification of characteristic peaks while improving spectral comparability. It is worth noting that although the second-order derivative processing can provide richer peak details, its amplification effect on noise needs special attention.

3.4. Correlation Between Leaf Spectrum and Total Potassium Content of Korla Fragrant Pear

This study focused on the correlation between spectrum and total potassium content of Korla fragrant pear leaves, explored the effects of different pretreatment methods (MSC, SNV, FD, SD and combination strategy), and analyzed the mechanism of pretreatment on the correlation characteristics between spectrum and total potassium content by analyzing the corresponding spectral correlation map (Figure 6a–i).
The original spectrum after removing the outliers shows a correlation fluctuation with total potassium content in a specific wavelength band (such as 4000–7000 cm−1). Some absorption peak regions (such as chlorophyll, moisture and other components of the spectral correlation interval), due to the removal of outliers, the spectrum-total potassium content of the natural correlation can be initially revealed, for the follow-up analysis to lay a benchmark. However, the original spectrum is disturbed by scattering and noise, the correlation distribution is relatively wide (between 0.06 and 0.20), and the identification of characteristic bands is limited, which depends on preprocessing optimization.
MSC effectively corrects for scattering-induced spectral baseline shifts (Figure 6b), making the spectrum-total potassium content correlation more focused in characteristic bands (e.g., 5000–7000 cm−1). After correction, the false correlation caused by scattering was suppressed, and the spectral interval and correlation curve associated with potassium absorption and leaf structure were more consistent with the physiological mechanism, highlighting the role of MSC in enhancing the true correlation between spectrum and total potassium content. The standard normal variable transformation (SNV, Figure 6c) improved spectral comparability by normalization, and the spectrum-total potassium content correlation was characterized by differentiation in the 4000–8000 cm−1 interval. After standardization, the spectral differences between samples are reasonably amplified, and some subtle spectral responses related to potassium metabolism can be visualized, but it is also necessary to guard against excessive amplification noise of standardization, which interferes with the extraction of true correlation, and then needs to be verified by combining a quantitative model. The first derivative (FD, Figure 6d) highlights subtle spectral variations, and the correlation curve exhibits high-frequency fluctuations in the interval 4000–6000 cm−1, etc. Derivative operation enhances the resolution of potassium correlation peaks and distinguishes the correlation corresponding to overlapping characteristic peaks, but synchronous amplification of noise leads to disorder of correlation curves in some bands, which needs to be balanced by noise reduction means. The second derivative (SD, Figure 6e) has a stronger resolving power for the fine structure of the spectrum, and can further highlight the subtle differences in the spectrum and the resolution of the characteristic peaks compared with the first derivative.
In the range of 4000–7000 cm−1, the correlation curves showed more complex wave shapes, and the spectral responses associated with potassium binding states and potassium microenvironment in leaves could be excavated. However, the second-order derivative is extremely sensitive to noise, which will significantly amplify the random noise in the original spectrum, resulting in the correlation curve of some bands dominated by noise and presenting irregular oscillation. The subsequent noise reduction or smoothing processing needs to be strictly matched to control the balance between feature extraction and noise interference. After MSC correction for scatter, FD further enhanced the feature resolution, and the spectrum-total potassium content correlation exhibited finer feature differentiation in the 4000–7000 cm−1 interval (Figure 6f). The combined method has the advantage of eliminating scattering interference and highlighting spectral differences of potassium-related components. SNV + FD (Figure 6g), SNV normalization in conjunction with FD treatment, the differential features of the spectrum-total potassium content correlation were enhanced in the 4000–8000 cm−1 interval. After standardization to improve sample comparability, FD accurately captures subtle spectral changes related to potassium metabolism, which helps to distinguish the spectral response of samples with different potassium content levels. However, the additive effect of normalization and derivative may lead to oversensitivity of some band correlations. MSC + SD (Figure 6h). After MSC corrects for scattering, SD (second derivative) digs deep into the fine features of the spectrum. In the range of 4000–8000 cm−1, the spectrum-total potassium content correlation shows more complex feature differentiation. On the basis of eliminating the scattering interference, the second derivative can be used to analyze the more subtle spectral response of the interaction between potassium and leaf components. However, the second derivative amplifies the noise of the spectrum. Although MSC improves the spectral quality to some extent, there may be false correlation caused by noise in the correlation curve of complex fluctuations. SNV + SD (Figure 6i) SNV normalization combined with second derivative, in the interval 4000–9000 cm−1, the subtle features of the spectrum-total potassium content correlation were exploited to the extreme. After standardization improves comparability between samples, the second derivative enhances the spectral fine structure, which can capture the spectral response corresponding to slight differences in potassium content, but the superposition of standardization and second derivative makes the confusion between noise and true characteristics worse. Nevertheless, the correlation after pretreatment has wave positions higher than 0.2 and less than −0.2 compared to the correlation without pretreatment, and it is obvious that pretreatment of spectra is necessary for model building.

3.5. Spectral Feature Extraction

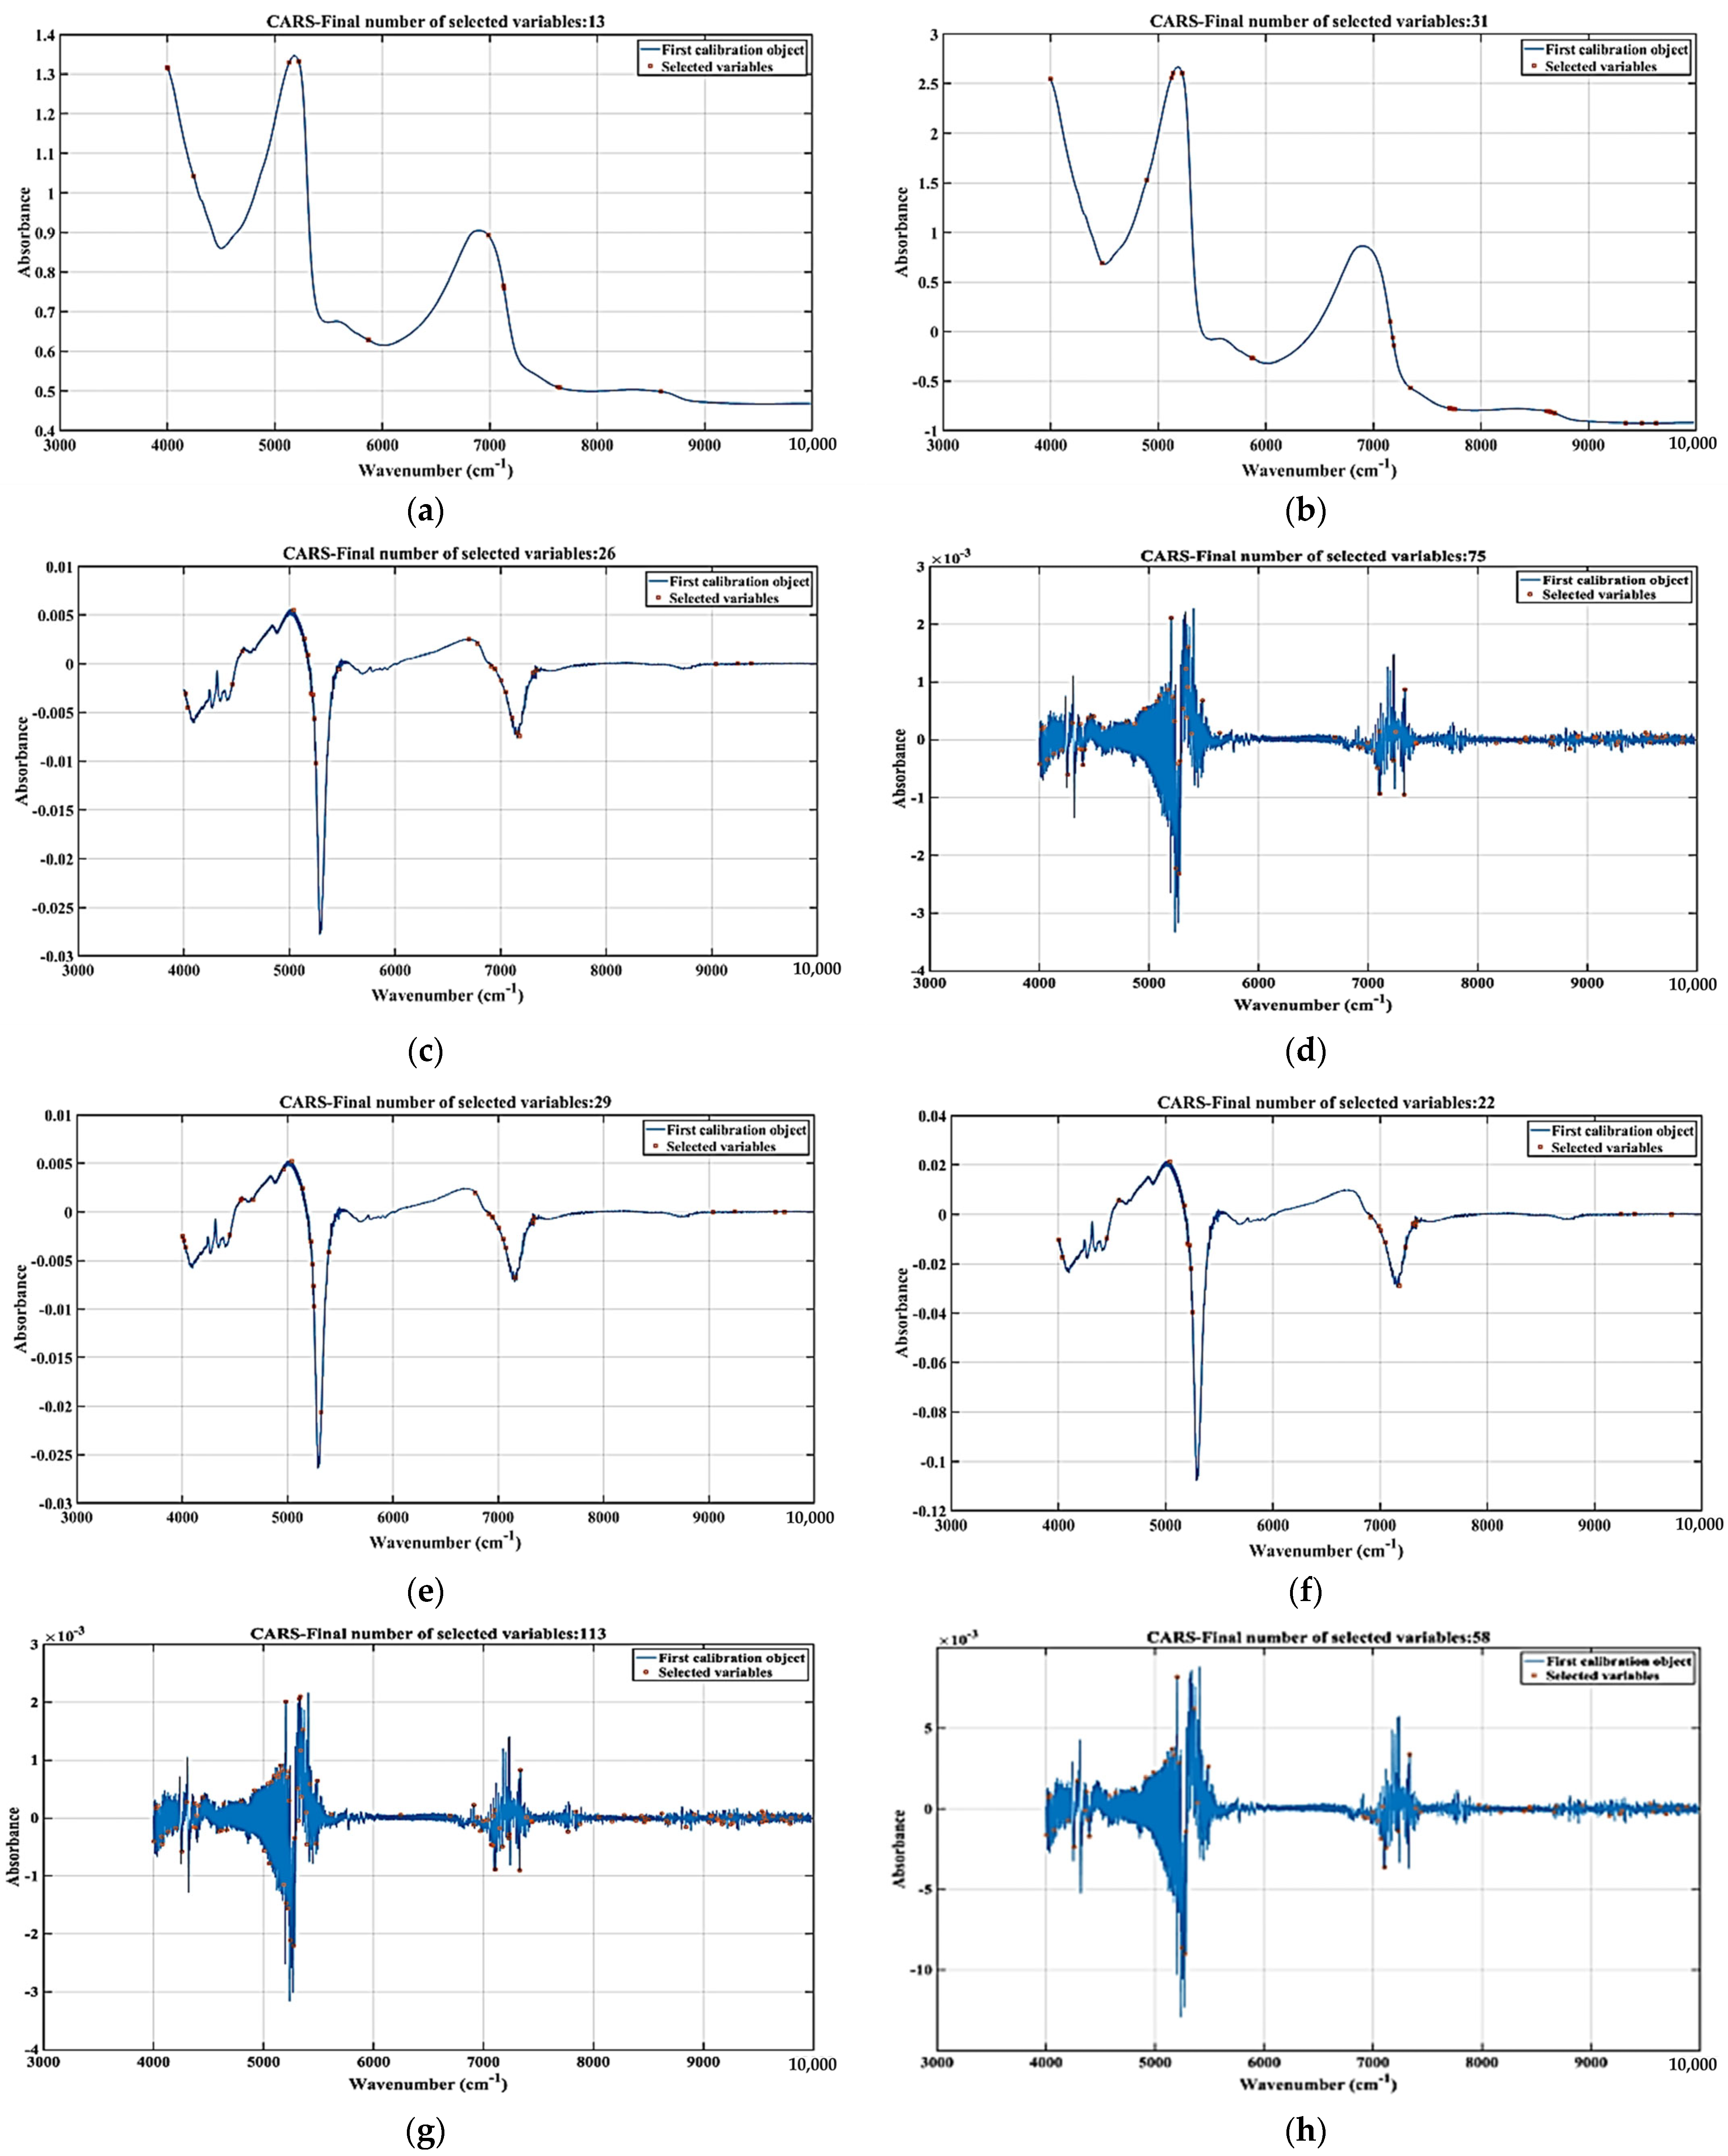
The competitive adaptive reweighted sampling (CARS) algorithm was used to extract features from different pretreated leaf spectra and analyze the correlation mechanism between feature wavenumber point distribution and total potassium content. In the single pretreatment spectrum, 13 characteristic wavenumber points screened by MSC pretreatment concentrated in 4000–5000 cm−1 (hydrogen group vibration) and 6000–7000 cm−1 (Response of water molecules and chemical bonds), which correlates with total potassium content through the regulation of potassium on the metabolism of hydrogen-containing compounds and cellular moisture (Figure 7a); 31 wavenumber points extracted by SNV pretreatment correspond to the characteristic absorption of potassium-containing compounds and hydrogen bond vibration regulated by potassium ions, reflecting the influence of potassium on the balance between organic matter and moisture (Figure 7b); The 26 wavenumber points of FD pretreatment were distributed in 4000–5000 cm−1, 6000–7000 cm−1 and 7000–9000 cm−1. The regulation of potassium on metabolism, cell structure and substance accumulation was demonstrated by hydrogen group vibration, chemical bond stretching and starch overtone vibration. In the combined pretreatment spectrum (Figure 7c), 75 wavenumber points in SD pretreatment correlate the effects of potassium on glucose metabolism and cellular environment through the vibration of hydrogen-containing groups and water molecules (Figure 7d); 29 points in MSC + FD pretreatment The points are distributed in three intervals, reflecting the effects of potassium on organic matter metabolism, cell structure and starch accumulation respectively (Figure 7e); The quantitative relationship of “spectral response-physiological function of potassium-total potassium content” was constructed for 22 points pretreated with SNV + FD and 113 points pretreated with MSC + SD (and 58 points pretreated with SNV + SD) (Figure 7f–h) through hydrogen-containing groups, water molecules and chemical bond vibrations. The characteristic wave number points screened by CARS under different pretreatment accurately captured the role of potassium in metabolic regulation, cell physiology and substance accumulation by correlating the vibration of hydrogen-containing groups, water molecular distribution and chemical bond environment of leaves, which provided key basis for the construction of spectral prediction model of total potassium content in fragrant pear leaves and the analysis of potassium physiological mechanism.

3.6. Model Comparison

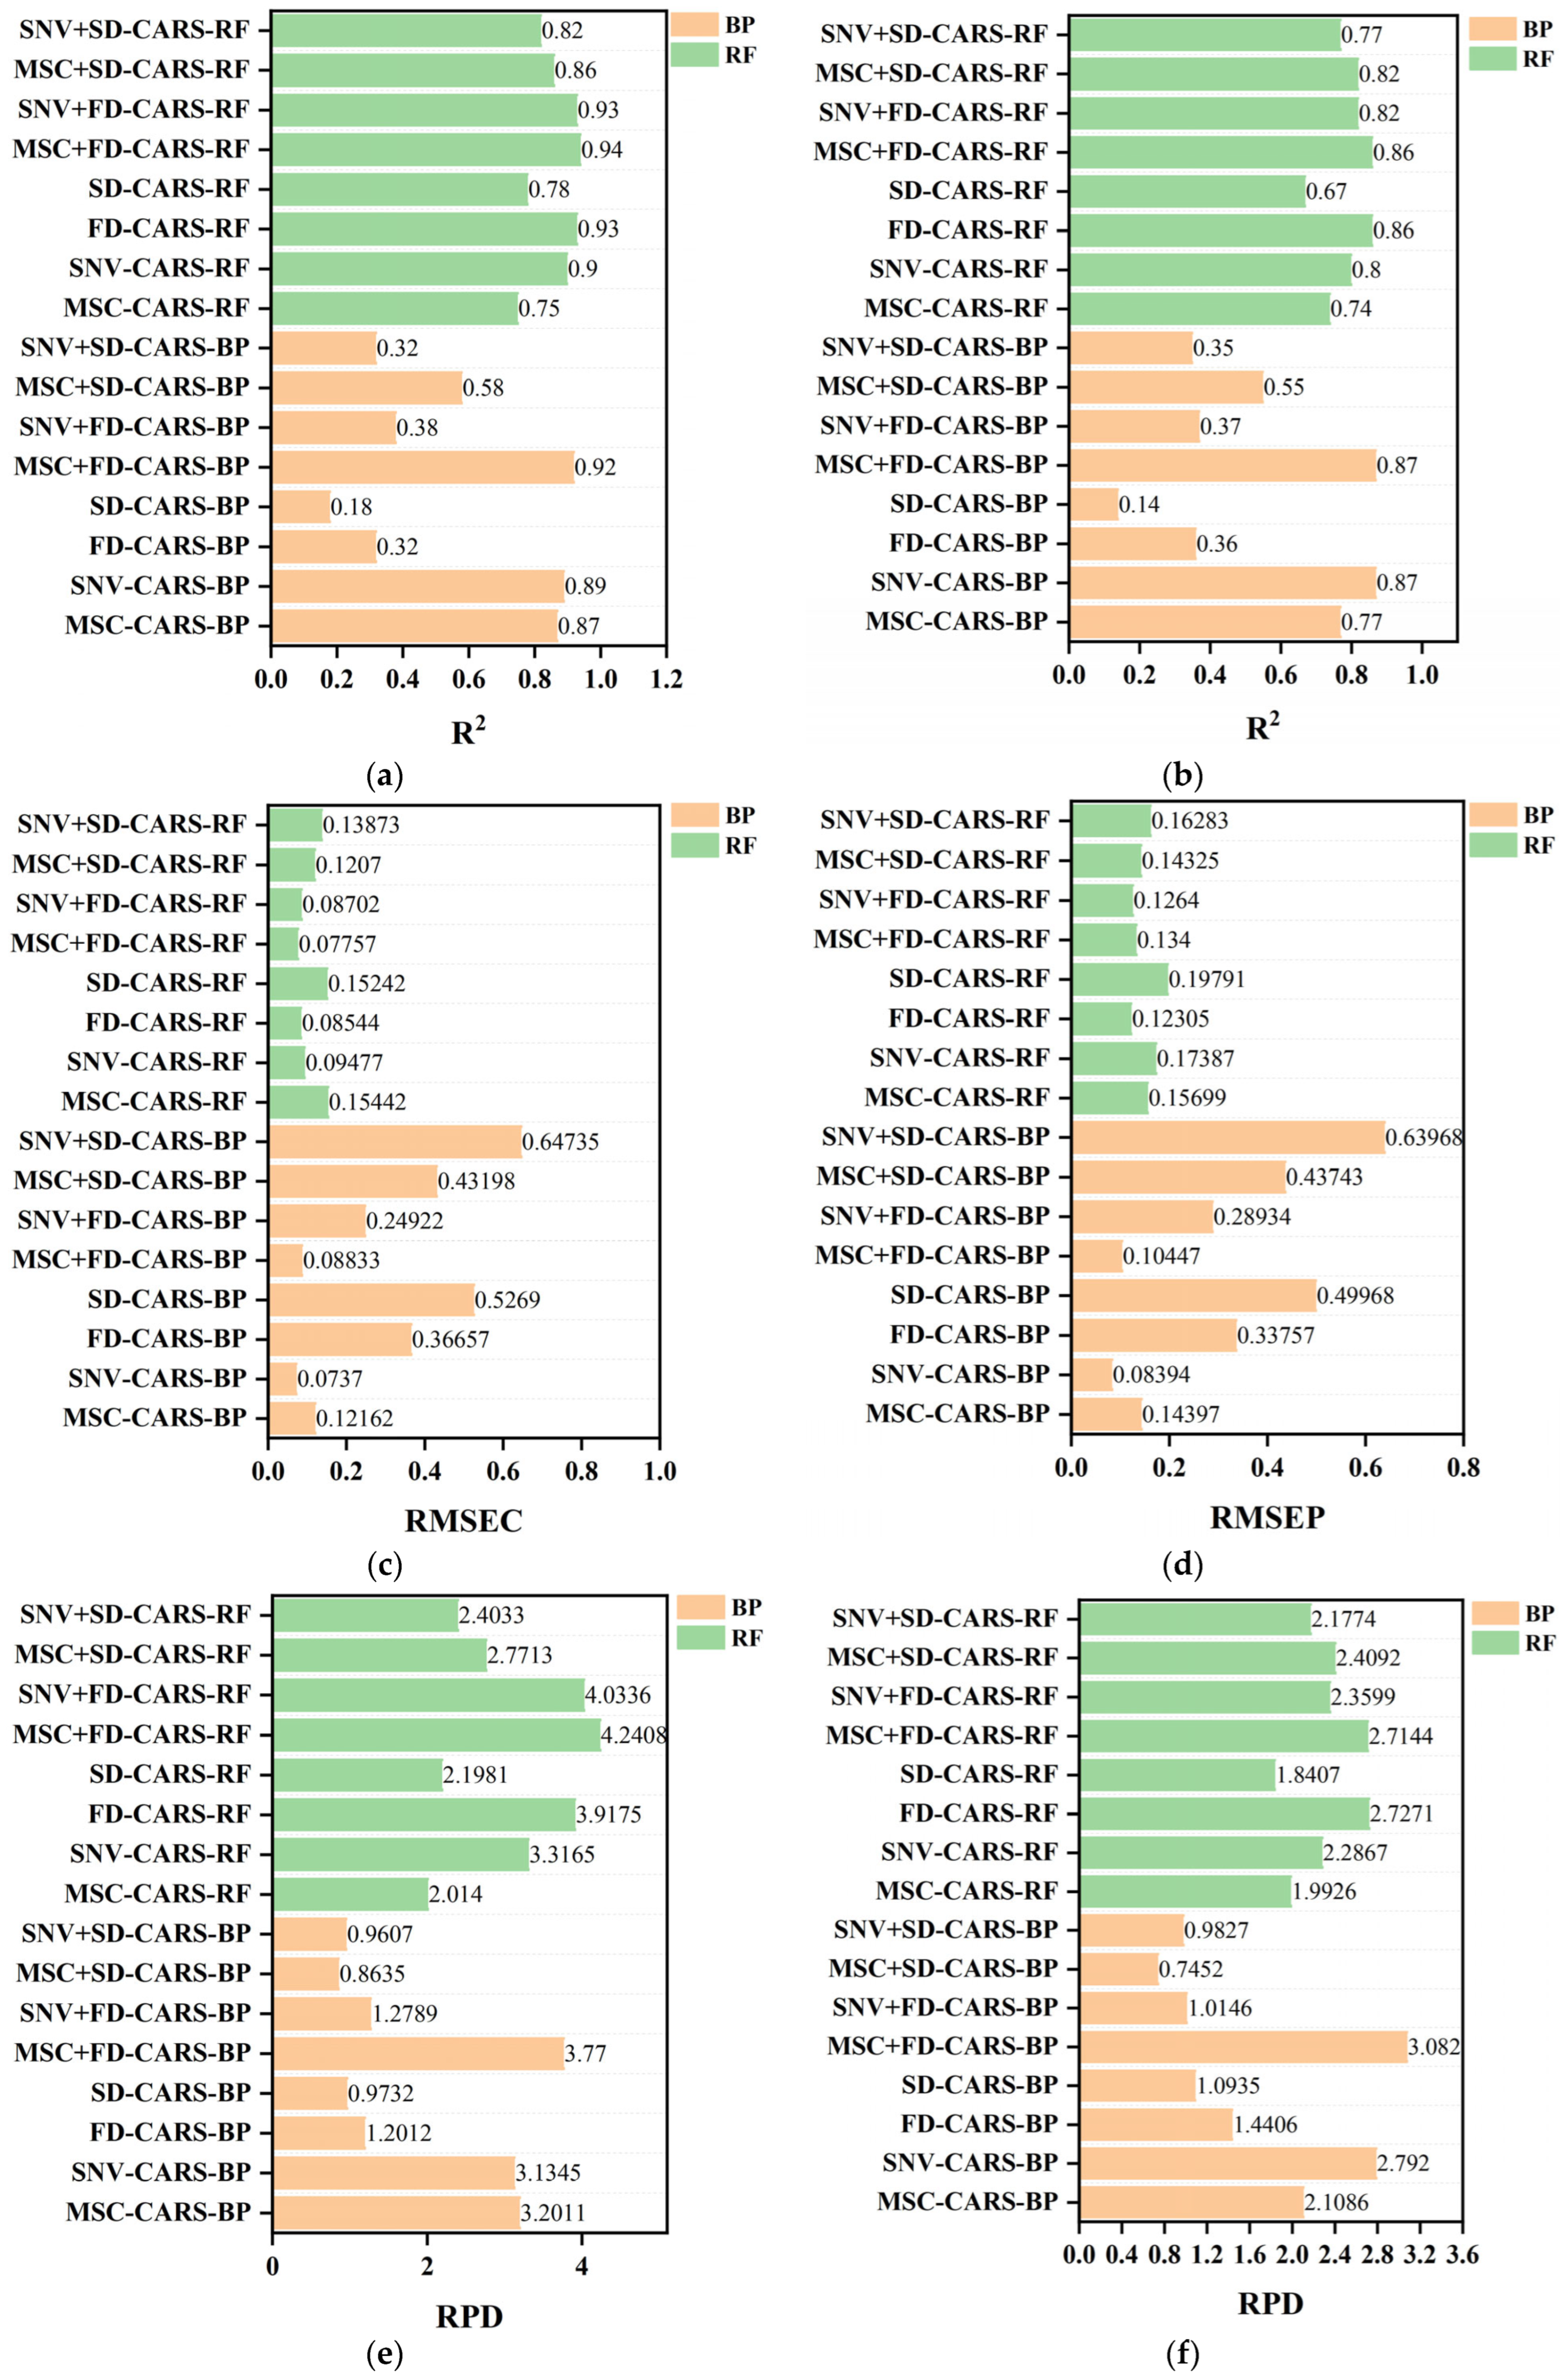
In this study, both random forest (RF) and back propagation (BP) neural network algorithms were employed for modeling. The results, illustrated in Figure 8, reveal that in the training set, the combinations under the RF algorithm generally exhibit appreciable coefficients of determination (R2). Specifically, the RF-FD combination achieves the highest R2, reaching 0.93484, while RF-MSC records the lowest, at only 0.75926. Conversely, under the BP neural network algorithm, only the combined models utilizing MSC + FD, SNV, and MSC preprocessing algorithms demonstrate relatively considerable R2 values; the remaining BP neural network algorithms all fall below 0.6 (Figure 8a). A similar trend is observed in the validation set. However, the coefficients of determination suggest potential overfitting in some models; for instance, the RF-MSC model shows a difference of 0.10494 between the training and validation set coefficients of determination.
With the exception of RF-SNV + SD, RF-MSC + SD, and RF-MSC, which demonstrate relative stability, most models developed using the RF algorithm exhibit this behavior. Among the models developed using the BP neural network algorithm, BP-MSC + FD and BP-SNV are relatively stable. However, the BP-MSC model also displays instability, with a difference of approximately 0.1 in the coefficient of determination (Figure 8b). Analysis of the root mean square error (RMSE) reveals no significant differences between the root mean square error of calibration (RMSEC) and the root mean square error of prediction (RMSEP) for any of the models (Figure 8c,d). Further comparison of the residual predictive deviation (RPD) indicates that the difference between the RPD of the calibration and validation sets for RF-SNV + SD and RF-MSC + SD exceeds 1. While RF-MSC exhibits good RPD performance in the validation set, reaching 2.014, it does not reach 2 in the calibration set (Figure 8e,f).
Among the models developed using the BP neural network algorithm, the BP-MSC + FD model exhibited the best performance, with RPD values of 3.77 and 3.082 for the training and validation sets, respectively, both exceeding 3. Further analysis of the RPIQ for RF and BP, in conjunction with the data analysis above, reveals that the training set data distribution indicates a generally superior performance for the RF model. Specifically, all RF models, except for RF-MSC + FD, RF-SD, and RF-MSC, achieved excellent levels. RF-SNV + FD and RF-MSC + FD demonstrated the highest performance within the RF models. The BP model, on the other hand, generally showed average numerical results, with only BP-MSC + FD, BP-SNV, and BP-MSC reaching excellent levels. Analysis of the validation set data indicates that the overall numerical values for the RF model decreased compared to the training set, with only RF-SNV + FD and RF-MSC + FD maintaining excellent levels, both above 3.
The overall data situation of BP remains largely unchanged. However, the values of BP-MSC + FD and BP-SNV, when compared to the training set, show variations of 0.20 and 0.17, respectively, suggesting a potential overfitting issue.

3.7. Training Function Selection

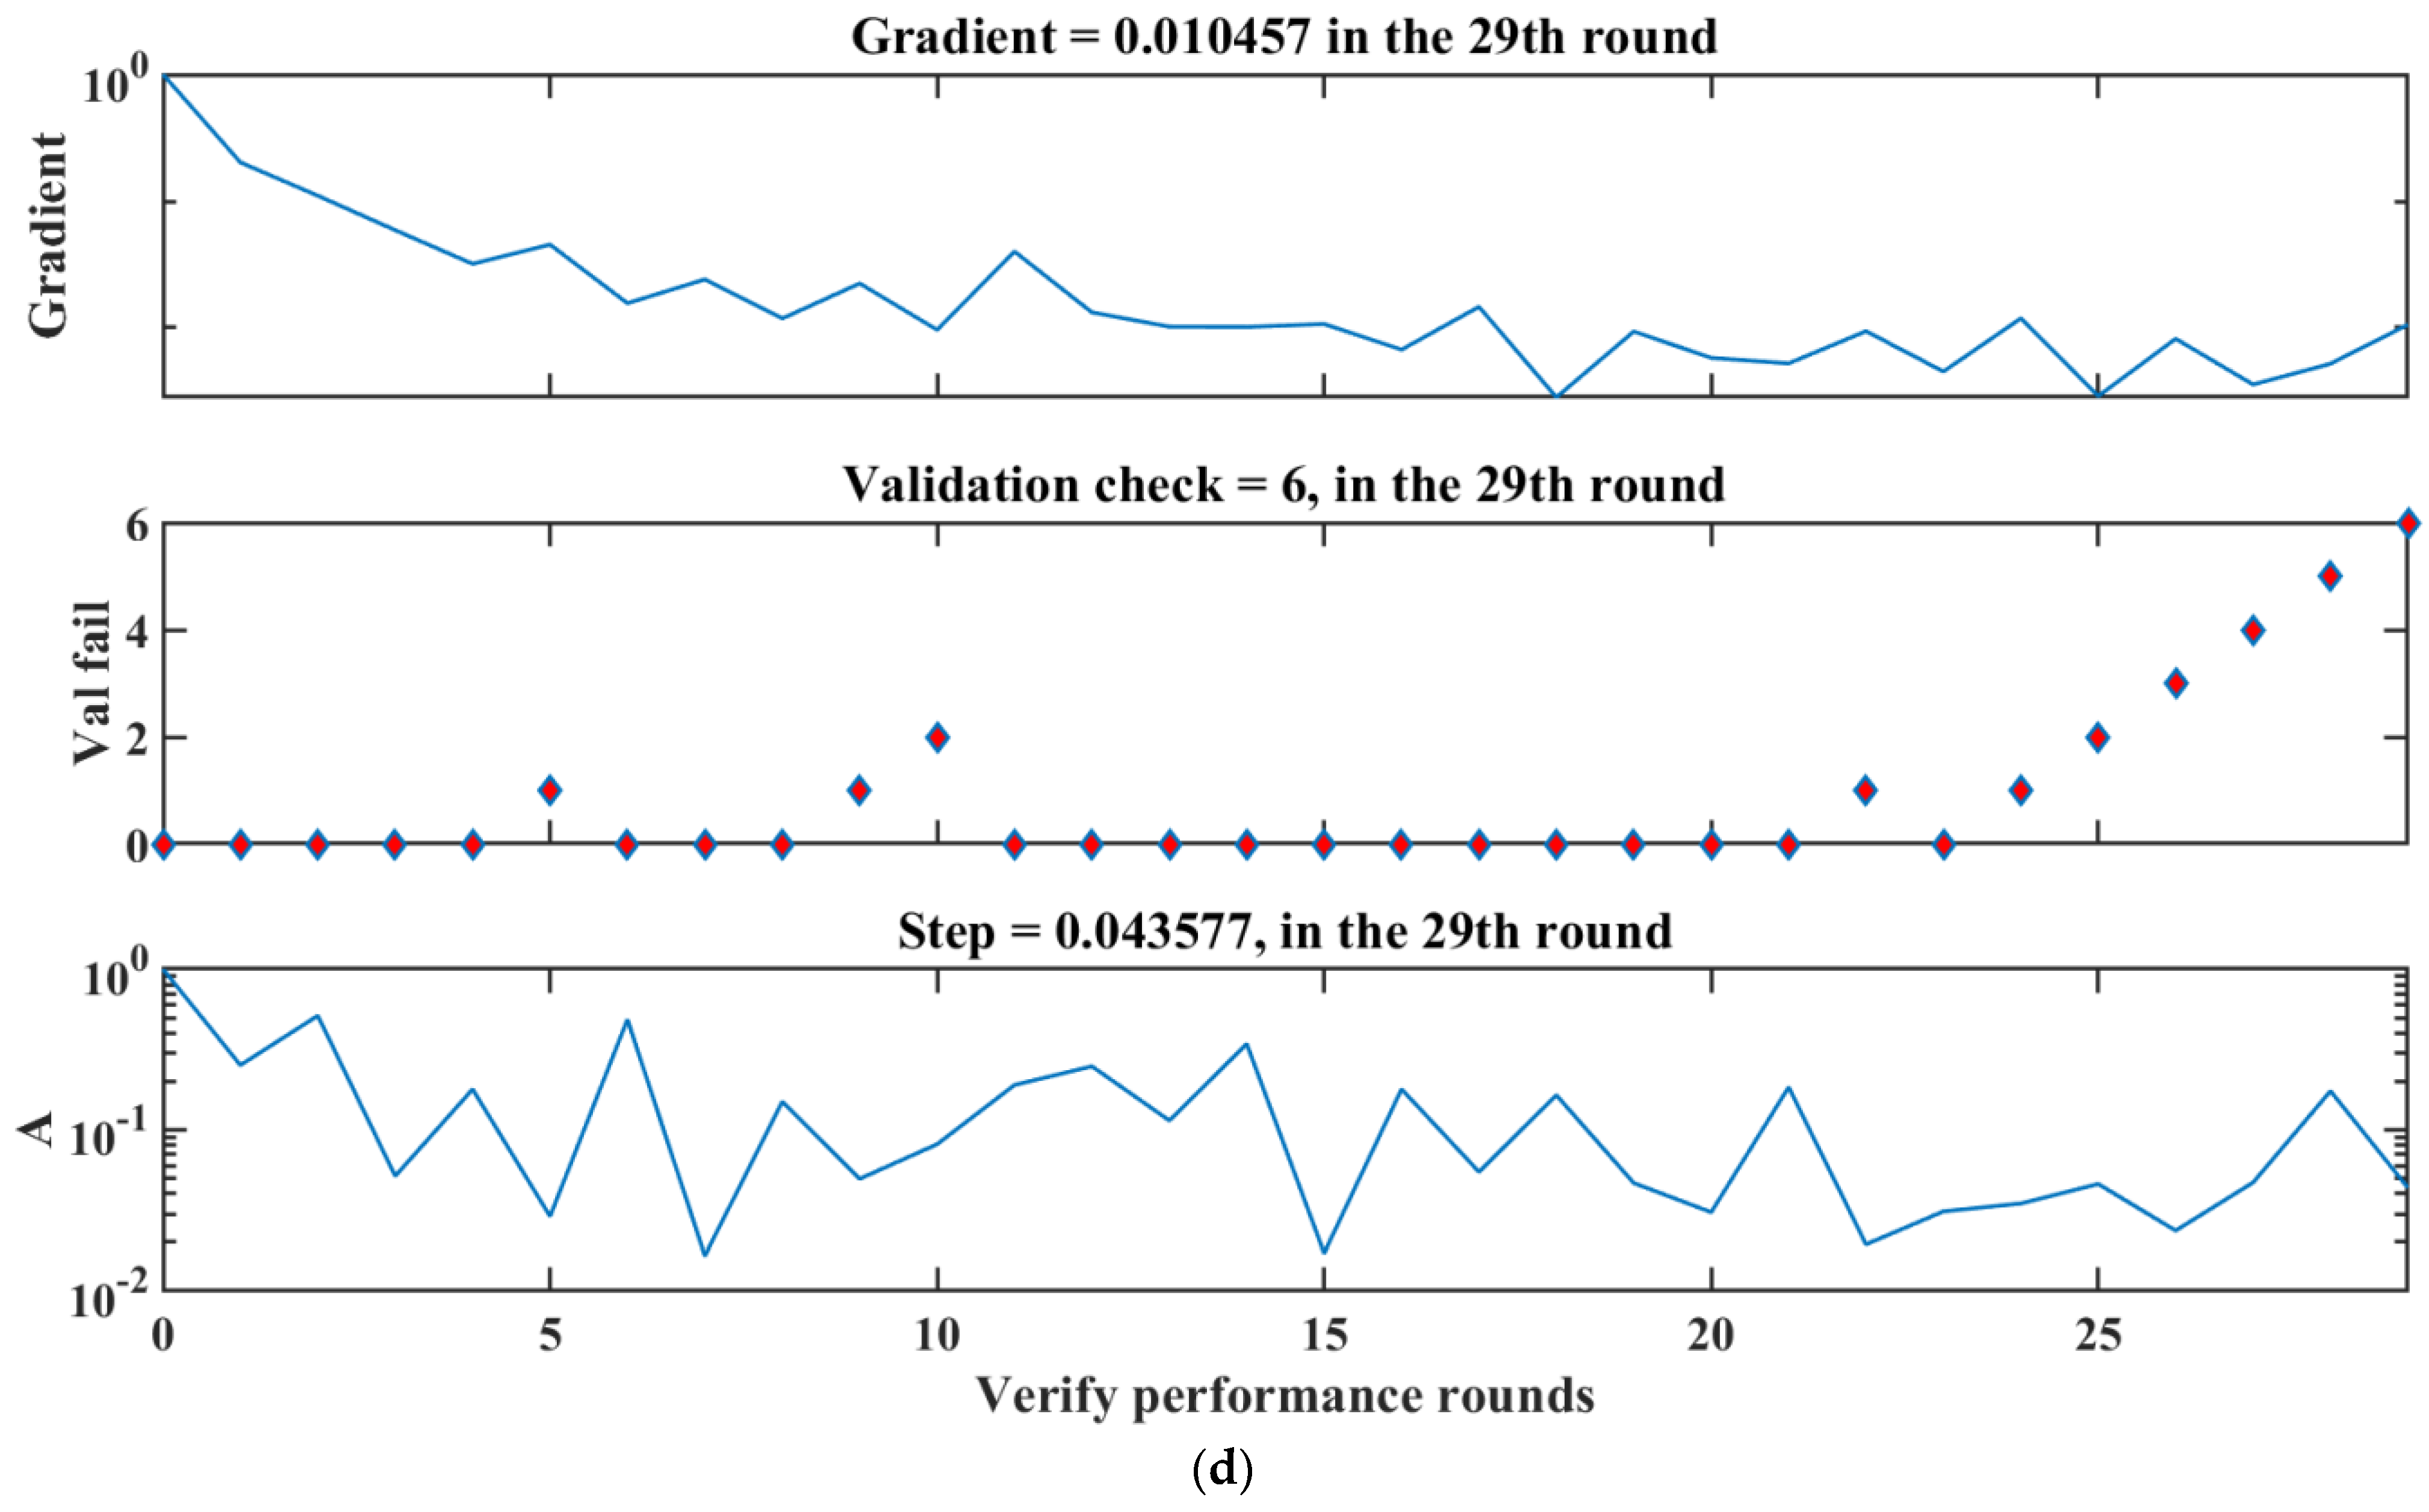
The MSC + FD-CARS-BP model can predict the total nitrogen content of Korla fragrant pear leaves better than others, but different training functions have a great influence on the prediction effect of the model in the BP neural network algorithm. Therefore, six common training functions (Trainlm, Traingd, Trainscg, Traingdx, Trainbfg and Traincgb) are tested based on the BP neural network algorithm, and their related indices are compared. It was found that the Trainlm training function was more suitable for the prediction of Korla Fragrant Pear in this study, and its training set and validation set R2 were the largest of the six functions, 0.9234% and 0.8797% (Figure 9a); RMSE were the smallest of the six functions, and their RMSE were 0.0977% and 0.1031%, respectively (Figure 9b). Further real-time monitoring of the training process of the Trainlm training function shows that the gradient value of the model is 0.010457, and the step size is stable at 0.043577 in the 29th round of training. The performance of the validation set has not improved significantly for six consecutive rounds, indicating that the model has approached the convergence state (Figure 9c,d). The final model showed excellent predictive performance, with coefficients of determination (R2) of 0.92% and 0.87% for the training and validation sets, respectively, and root mean square errors (RMSE) of 0.0977% and 0.1031%, respectively. The consistency between the stability of the training process and the performance index of the final model confirms the effectiveness of the spectral preprocessing method and the rationality of the network structure and hyperparameter setting. The results show that the model not only has high prediction accuracy but also maintains good generalization ability, which provides reliable technical support for the quantitative analysis of leaf components.

3.8. Model Validation

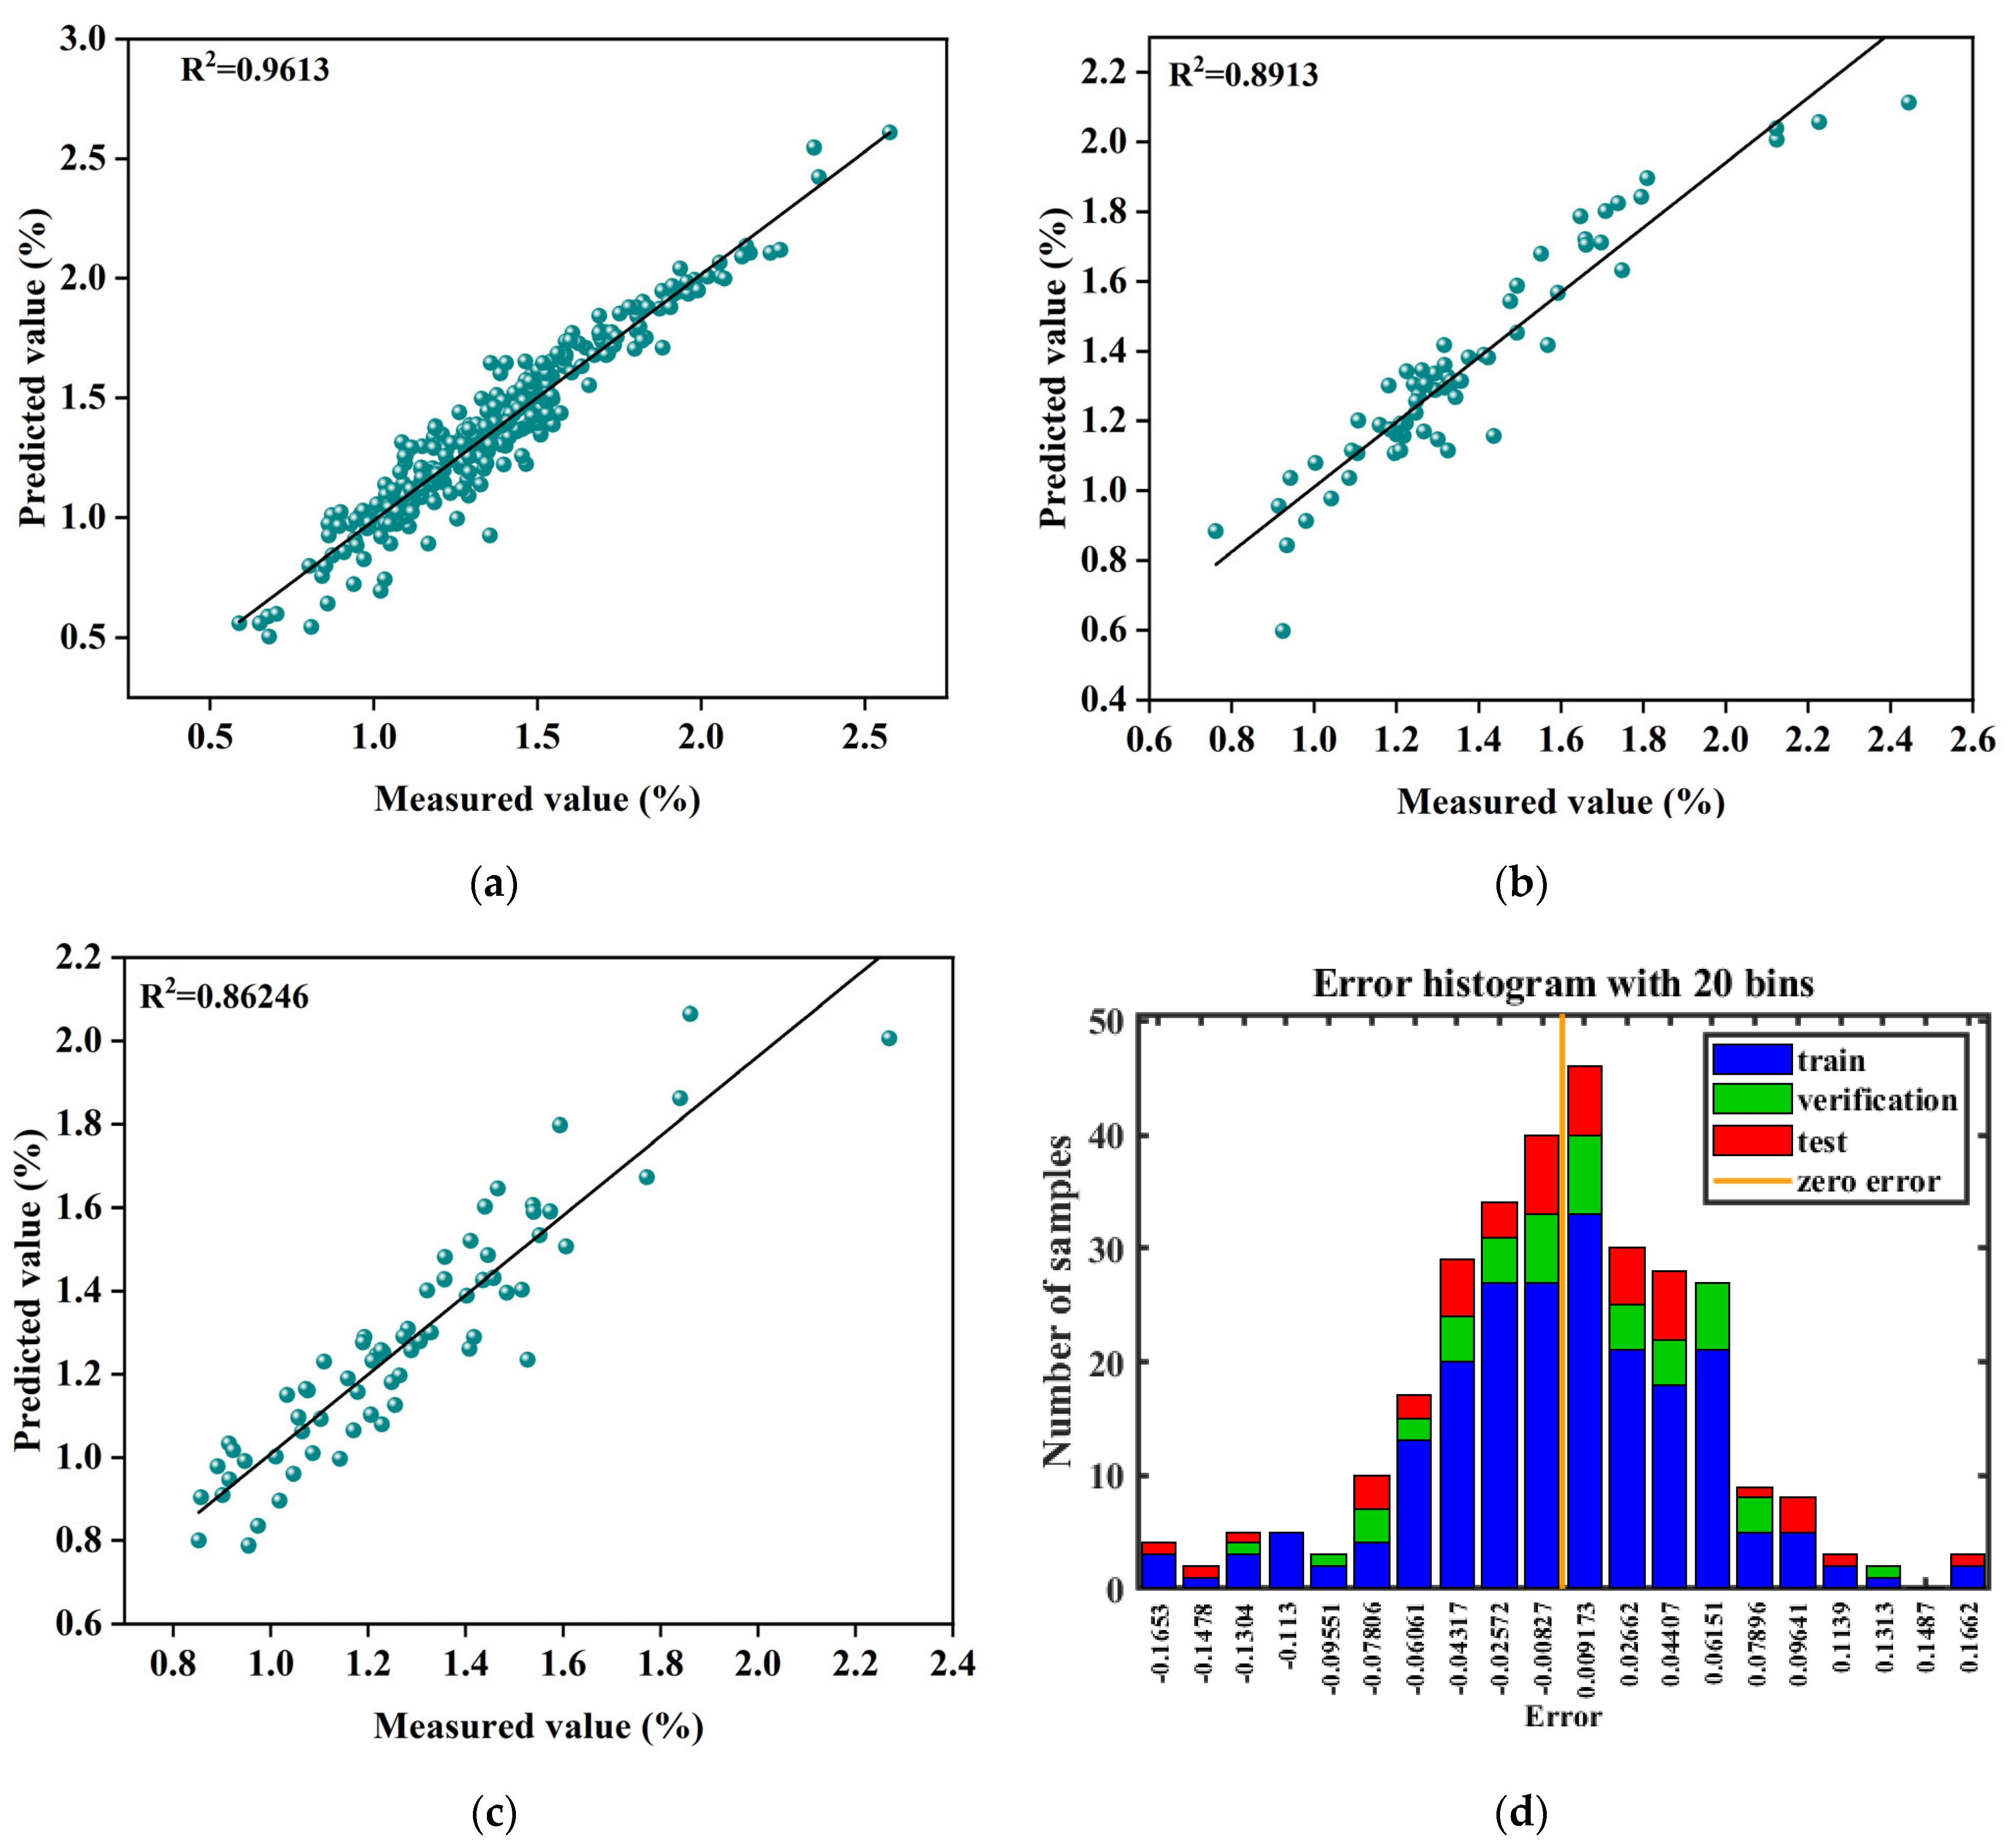
Linear regression analysis was performed on the measured values and predicted values of the training set, test set and validation set of the model, respectively. The results showed that each data set showed good goodness of fit, and its coefficient of determination (R2) reached 0.96%, 0.89% and 0.86%, respectively (Figure 10a–c). These results fully prove that the MSC (Multiple Scattering Correction) + FD (First Derivative)-CARS (Competitive Adaptive Reweighted Sampling) combined model based on BP neural network has an excellent modeling effect and generalization ability in predicting total potassium content in leaves of Korla fragrant pear (Pyrus sinkiangensis Yu). Further analysis of the prediction error of each sample shows that the error range is controlled between −0.04317 and 0.04407, and the relative error is less than 5% (Figure 10d), indicating that the MSC + FD-CARS-BP model constructed in this study has high prediction accuracy and stability. Based on the above analysis, the model can provide reliable technical support for potassium nutrition diagnosis of Korla fragrant pear leaves.

4. Discussion

In this study, the dynamic changes of total potassium content in Korla fragrant pear leaves during fruit development were systematically analyzed, and a quantitative prediction model based on near-infrared spectroscopy was established. The results not only provide a new technical means for potassium nutrition diagnosis of fruit trees, but also provide an important basis for understanding the physiological mechanism of potassium in fruit tree growth and development.
The results showed that the total potassium content in leaves of the Korla Fragrant pear showed a significant downward trend during fruit development. This finding is consistent with Shen et al. [11]. The proposed theory of plant nutrient allocation is consistent with the idea that potassium, as an important mobile nutrient, is preferentially transported to active organs. Especially during fruit expansion, potassium content in leaves decreased significantly (by 20%), which may reflect the competitive absorption of nutrients by fruits as dominant “sink” organs. It should be noted that the continuous decrease in potassium content in leaves at maturity may be related to nutrient redistribution during senescence, which is consistent with the results of Kuzin et al. [3] on apple trees.
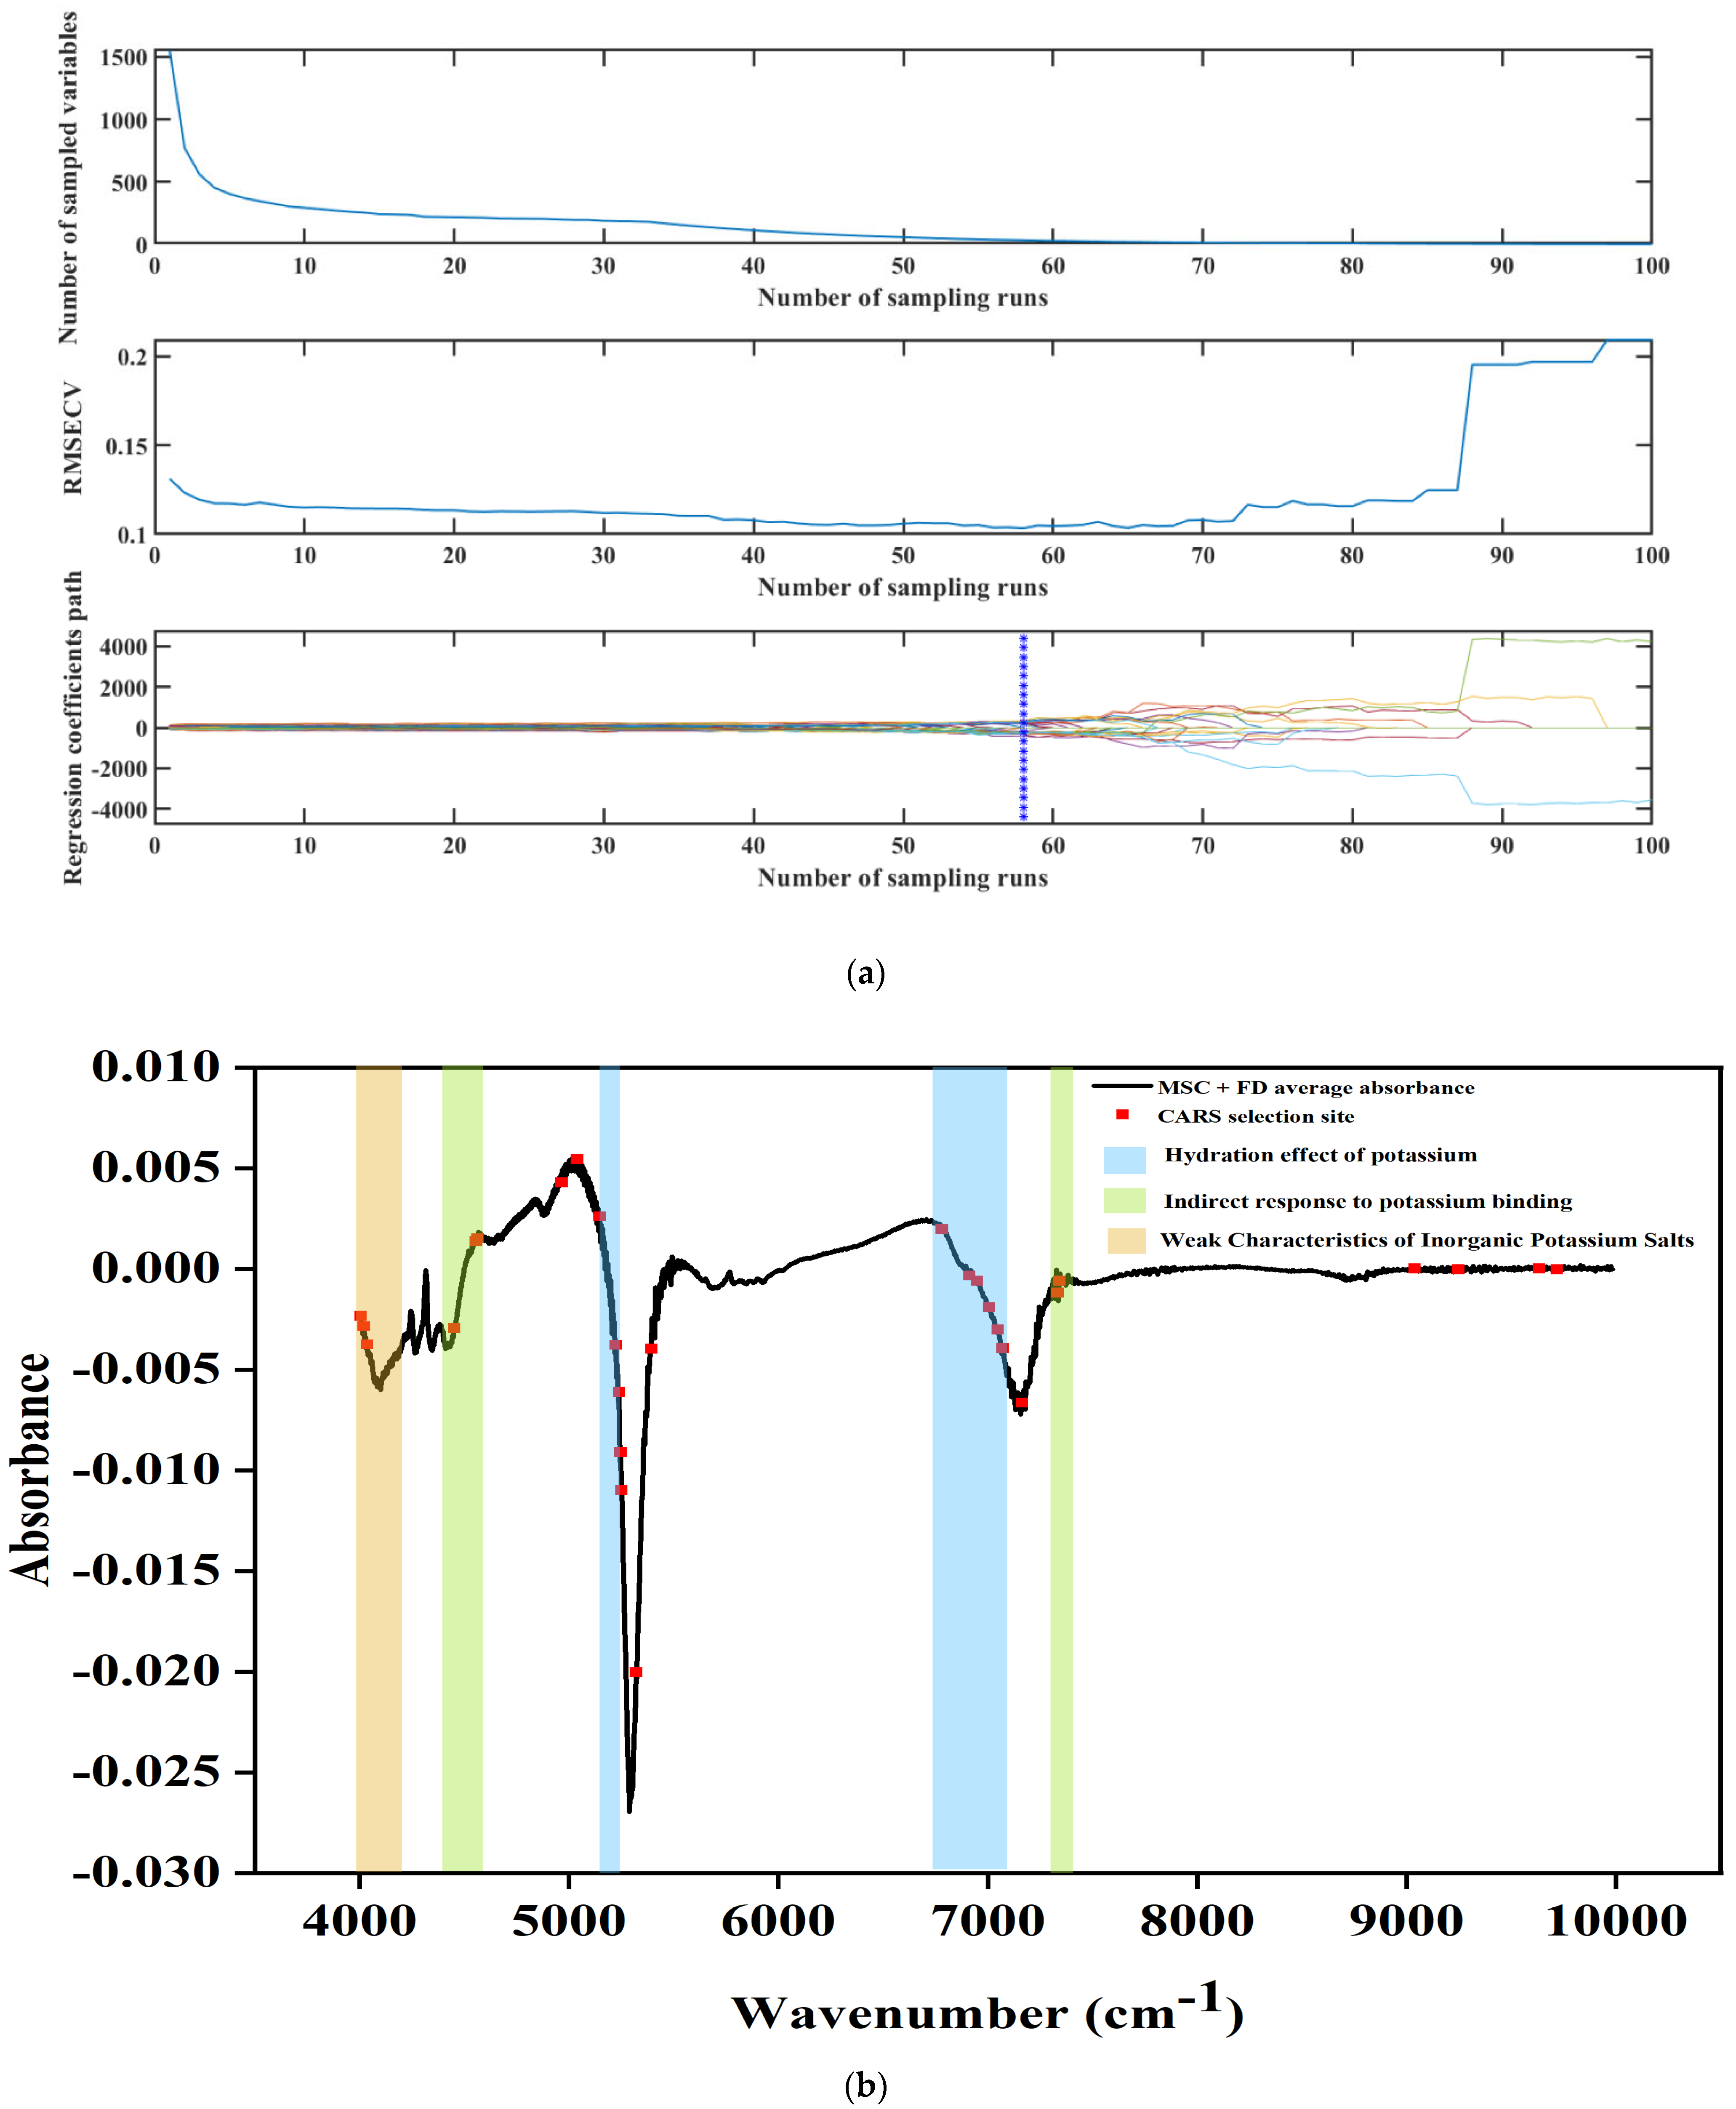
This study systematically reported the correlation between spectral characteristics and total potassium content in Korla fragrant pear leaves. In this study, the competitive adaptive reweighted sampling (CARS) algorithm was used to select the eigenwaves and optimize the model based on the iterative results of MSC + FD preprocessed spectral data. In Figure 11a, the upper figure “Number of sampled variables” shows that the number of characteristic wavenumber retained in CARS iteration changes with the sampling rounds, the wavenumber of the initial round drops sharply, and slowly decreases and tends to stabilize in the later stage, reflecting the algorithm “dimensionality reduction-screening” process; the middle figure “RMSECV” reflects the prediction error of model cross-validation. The error is low and stable in the first 80 rounds, and increases due to excessive elimination of wavenumber and loss of effective information after 80 rounds. The following figure, “Regression coefficients path”, shows the variation of regression coefficients of each wave number with rounds. Most wave number coefficients of the first 50 rounds are close to 0, and the fluctuation is intensified in the later period. In general, the first 80 rounds (especially 50–80 rounds) are the best interval of model performance. If the iteration is insufficient, it is easy to overfit, and if it is excessive, it is underfitting. In practice, the CARS algorithm should control the iteration rounds at 50–80 times, balance the screening and accuracy, and retain key information for the prediction of total potassium content. This group of figures clearly presents the process of “dynamic screening-precision change-coefficient adjustment” to guide the optimization of the prediction model of total potassium content in fragrant pear leaves. A study of the signature screening results showed that the sensitive bands of water molecules near 5150 cm−1 and 6900 cm−1 were significantly correlated with potassium content (Figure 11b). This result supports Ferrer et al. [53]. It is proposed that potassium ions indirectly affect the NIR spectral response by regulating the hydration state of cells. The characteristic bands screened by the CARS algorithm are mainly concentrated in the range of 4000–5000 cm−1 and 6000–7000 cm−1, which are closely related to the vibration of hydrogen-containing groups, indicating that potassium may change the spectral characteristics by affecting the structure and water state of organic compounds in plants [33,54].
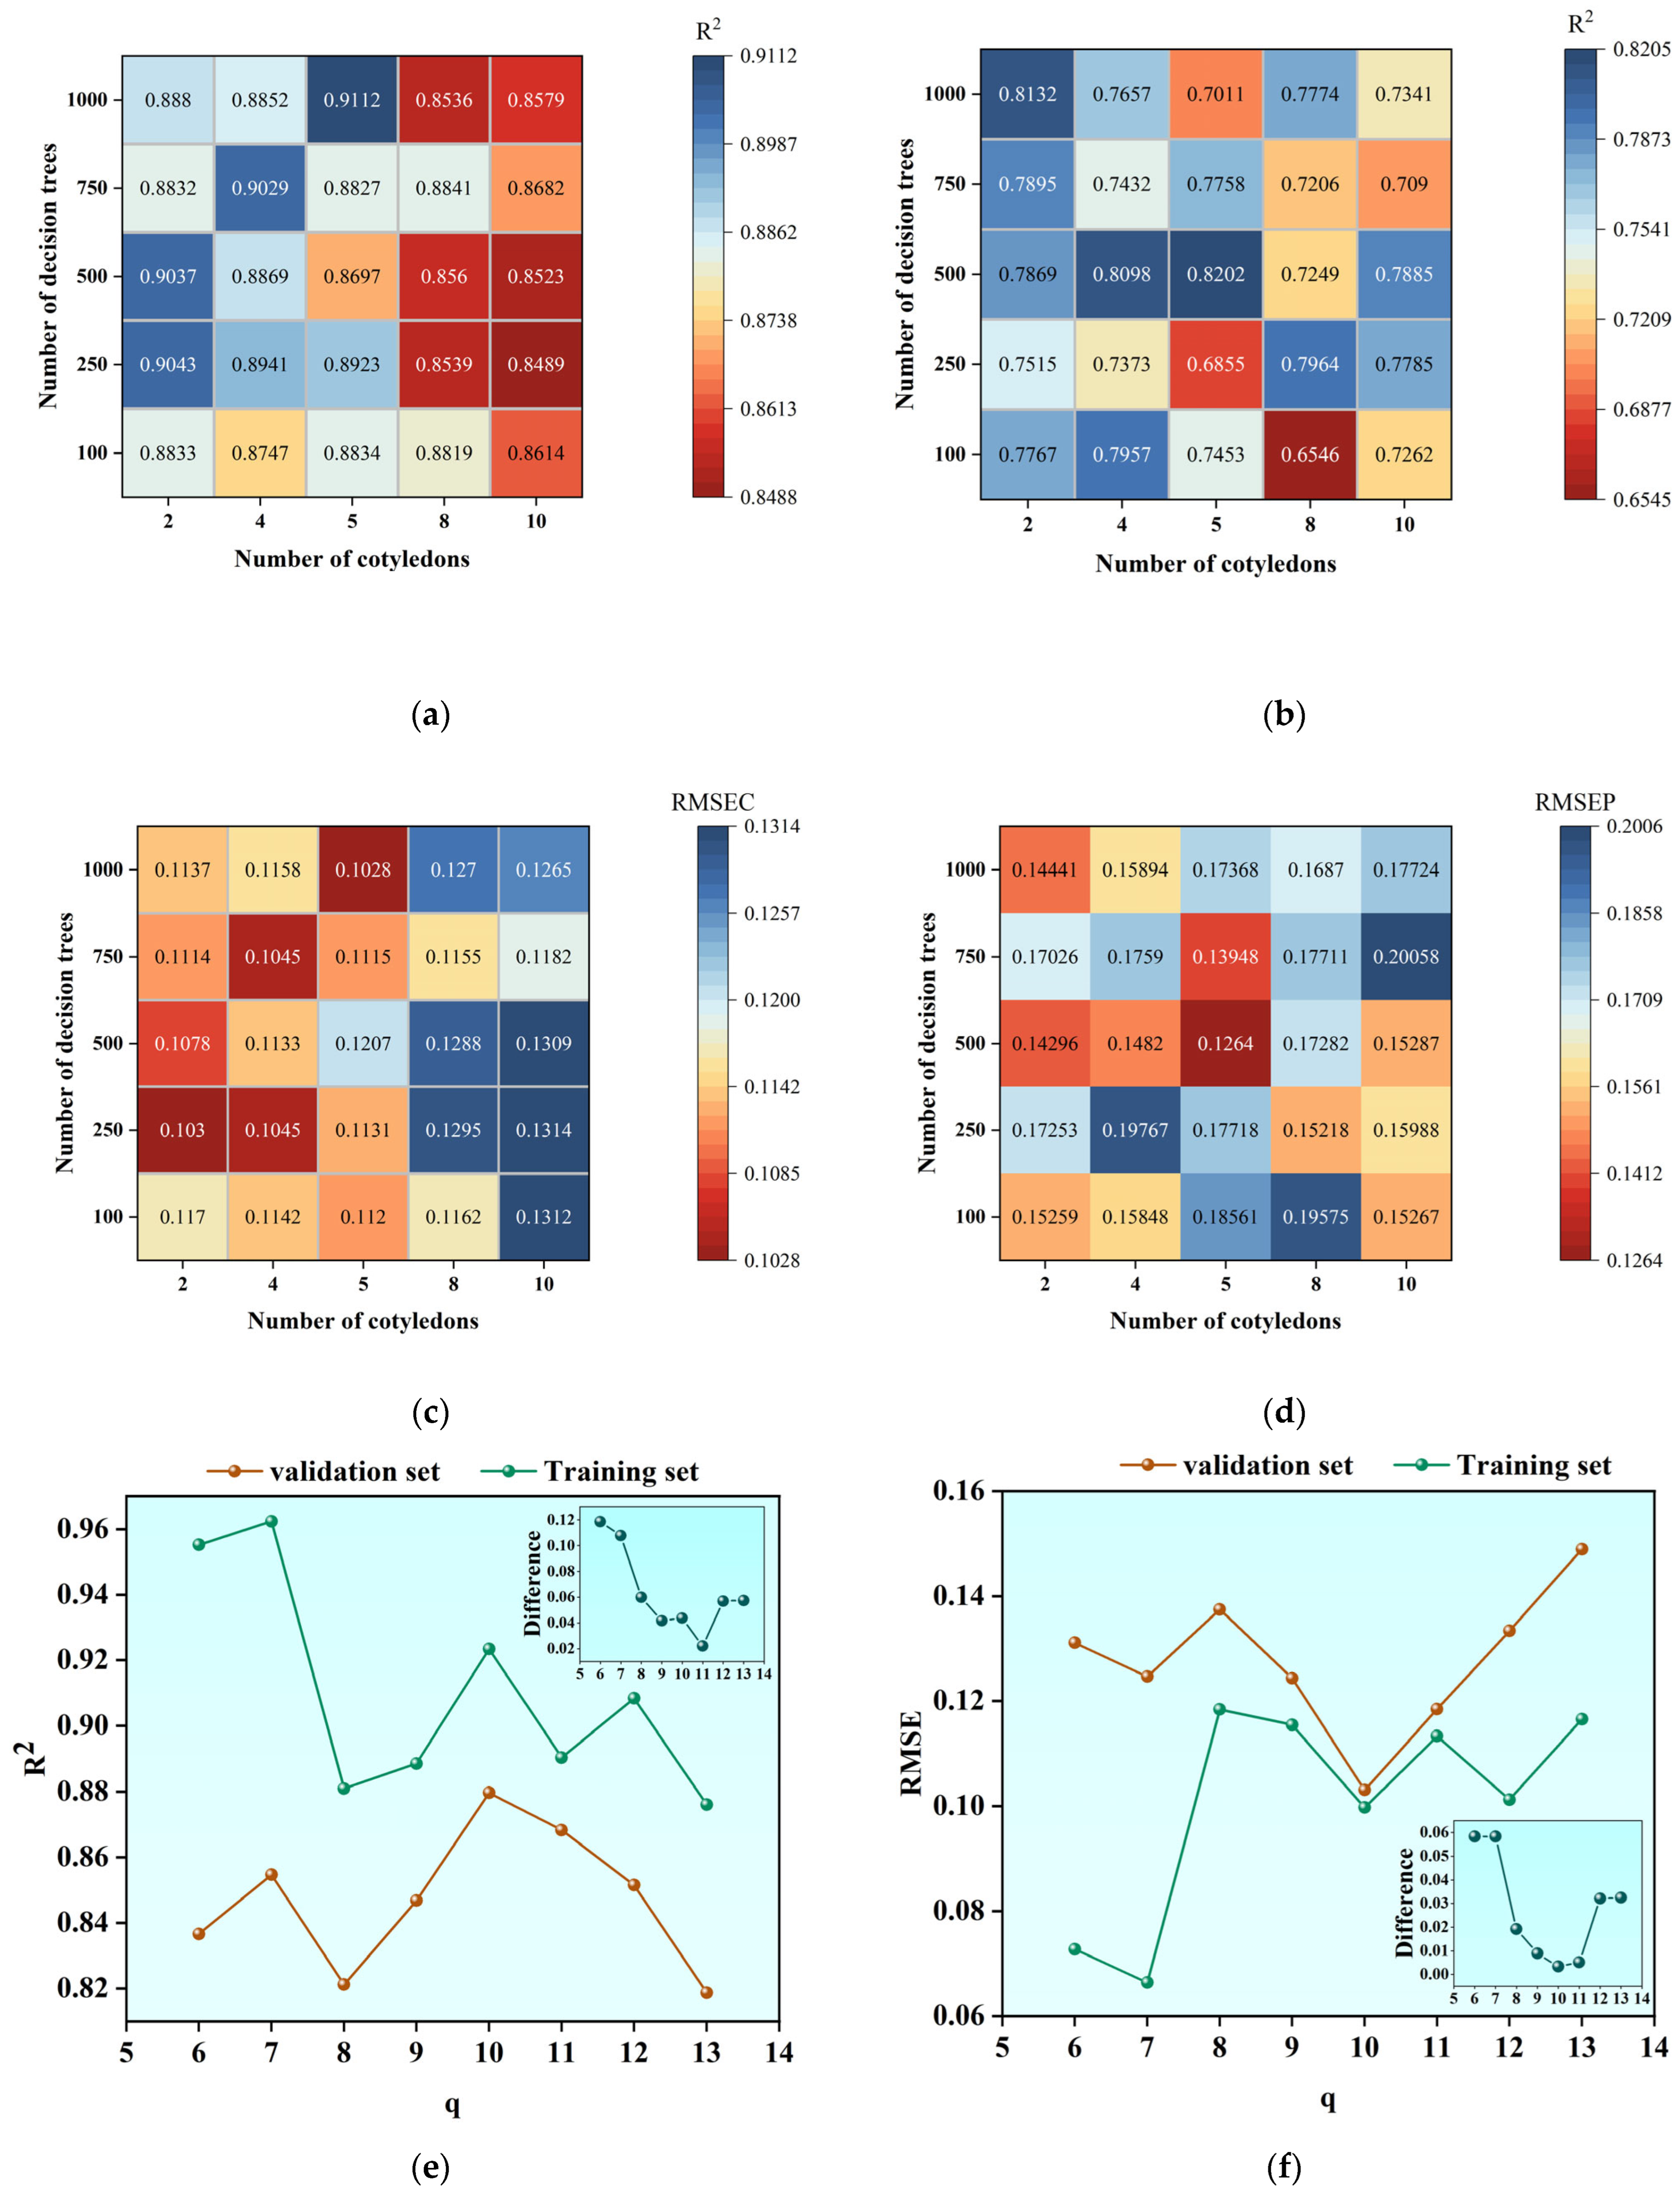
BP neural network (BPNN) and random forest (RF) were used to construct the prediction model of total potassium content in Korla fragrant pear leaves, and the key parameters of the model were optimized systematically. As shown in Figure 7, the MSC + SD-CARS-RF model based on the random forest algorithm shows good prediction performance. Through parameter optimization experiments (Figure 12a–d), it is found that when the number of decision trees is set to 500 and the number of leaf nodes is 5, the model achieves optimal stability, and the R2 difference between the training set and the validation set is only 0.04%, and both of them remain above 0.80%. The RMSE of the validation set is the lowest (0.1264%), and there is no significant difference between the RMSE of the validation set and the RMSE of the training set, indicating that the model has good generalization ability. For the BP neural network model, this study focuses on optimizing the number of hidden layer neurons (q value). The experimental results show (Figure 12e,f) that when q = 10, although the R2 difference between the training set and the validation set ranks third, the RMSE difference is the smallest (0.09% vs 0.10%). Considering the stability and prediction accuracy of the model, q = 10 is finally selected as the optimal parameter to construct the MSC + FD-CARS-BP model. The MSC + FD-CARS-BP combination model proposed in this study exhibits excellent prediction performance. Its coefficient of determination reaches 0.9613, 0.8913 and 0.86246 in the training set, test set and validation set, respectively, and the prediction error is strictly controlled within ±0.044. This result is significantly better than the prediction model of potassium content in apple leaves reported by [55] (R2 = 0.83%).
This study systematically compared and validated the performance of the MSC + FD-CARS-BP model in predicting potassium content in fruit tree leaves. Compared to existing methods, the model achieved a validation set R2 of 0.86% and an RPD > 3 in predicting the trace element K, thus meeting the requirements of precision agriculture. The performance reached the prediction level of PLSR for K, Mg, Fe, and Zn in citrus leaves (R2 > 0.85%) [56], and significantly outperformed the prediction ability of traditional PLSR for trace elements (R2 < 0.50%) [57]. However, compared to the SVM method, the model’s optimal prediction accuracy was approximately 2.1% lower, as demonstrated by the SVM-R model for soluble solids content detection in kiwifruit after spectral preprocessing (R2 = 0.92%) [58]. This difference may be attributed to SVM’s inherent advantages in handling complex nonlinear relationships.
While SVM achieves higher prediction accuracy than MSC + FD-CARS-BP, its complex parameter tuning and high computational cost, coupled with the need for a large sample size, pose significant challenges [59].
In terms of model construction, the MSC + FD-CARS-BP method adopted in this study exhibits the following characteristics: First, the MSC + FD preprocessing combination significantly improved the signal-to-noise ratio (approximately 40%), a finding consistent with conclusions drawn by Teleszko, M, et al. It has been shown that preprocessing data with techniques such as Multiplicative Scatter Correction (MSC), First Derivative (FD), and Standard Normal Variate (SNV) can improve the accuracy of PLSR/SVM models; for example, R2CAL for phenolic compound detection increased from 0.21% to >0.75% [60]. The CARS algorithm optimizes wavelengths and reduces redundant data, as demonstrated by a 70% reduction in the number of variables after CARS screening in the apple leaf nitrogen model [57]. During the development of our experimental model, key characteristic absorption peaks, such as those at 5150 cm−1 and 6900 cm−1, were effectively identified and retained. Second, the introduction of the BP neural network effectively addressed the nonlinear response issue associated with the K element binding with pectin.
This study clearly recognizes the significant differences in key performance indicators between benchtop high-resolution Fourier Transform Infrared (FTIR) spectroscopy and portable grating-based Near-Infrared (NIR) spectroscopy. Thanks to its interference principle and multiplexing capabilities, FTIR offers higher spectral resolution [61,62,63], superior instrument stability [64,65,66], and a higher signal-to-noise ratio [61,62]. In contrast, the resolution of portable grating-based NIR (typically 5–10 nm) is limited by the physical constraints of its optical components and is thus lower than that of FTIR [67]. Because its wavelength selection relies on mechanical angle control, it is susceptible to vibrations and temperature drift (typically ± 0.1 nm/℃), which compromises stability. Furthermore, the slit design and LVF filters limit luminous flux and may introduce additional noise [68].
These differences pose potential challenges to the transferability of models built on high-resolution FTIR data to portable grating NIR devices. Specifically, fine spectral feature bands, which are readily identified and selected at high FTIR resolution, may appear blurred or shifted at the lower resolution of grating NIR, or even lose key details.
In this study, the competitive adaptive reweighted sampling (CARS) algorithm was employed for feature selection when processing the spectral data of fragrant pear leaves and building models, particularly for K element prediction. CARS, with its inherent strong anti-noise capability and chemical feature orientation, selected feature bands that exhibited adaptability to moderate resolution changes in this study. Furthermore, the model-building process indicated that the current objective of this study (K element prediction) did not excessively rely on the ultra-fine structure or extreme resolution unique to FTIR.
This suggests that the features selected by CARS in this study may possess a degree of generality or robustness. However, we should carefully evaluate whether these features are truly independent of the high-resolution details provided by FTIR or if their robustness arises from the current model’s limited need for fine structural information.
Therefore, it must be emphasized that the model developed in this study is currently best suited for rapid detection applications in laboratory settings or at fixed locations. For direct application to portable grating NIR devices, which typically have lower resolution and weaker stability, the model’s effectiveness requires rigorous validation and specific adjustments. Future research should focus on: (1) Re-collecting sample data using the target portable grating NIR device to directly validate the existing model or employing model transfer techniques for adaptation; (2) Developing novel feature selection or band optimization methods that are more robust to variations in spectral resolution, thereby enhancing the model’s generalization ability across different devices.
In terms of application value, this method reduces the cost per sample by approximately 80% and achieves an RPIQ of 4.2, exceeding the industry standard (RPIQ > 4), thus offering a viable solution for field potassium monitoring.
However, it should be noted that the current model is optimized solely for a single fruit tree variety, and further validation is required to determine its cross-variety applicability. These findings not only confirm the potential of multi-method fusion in agricultural near-infrared analysis but also highlight areas for future research, including: (1) exploring more efficient nonlinear modeling methods; (2) developing more adaptive preprocessing procedures; and (3) expanding the assessment of the model’s applicability to different varieties.

5. Conclusions

This study systematically analyzed the dynamic characteristics of potassium content in Korla fragrant pear leaves during the growing season and successfully constructed a quantitative prediction model based on near-infrared spectroscopy. The main conclusions are as follows: (1) A significant decrease in leaf potassium content was observed with fruit development, with a 20% reduction during the fruit expansion stage, which confirms the physiological principle of preferential potassium allocation to the fruit. (2) Spectral noise was effectively suppressed by MSC + FD pretreatment. The characteristic bands extracted by the CARS algorithm, along with the water molecule sensitive region and the region significantly related to potassium content, were mainly concentrated in the 4003.5–4034.35 nm, 4458.62–4562.75 nm, 5145.15–5249.29 nm, 6780.49–7069.76 nm, and 7332.03–7339.74 nm regions, suggesting that potassium ions indirectly affect the spectral response by regulating cell water potential. (3) The BP neural network model (hidden layer q = 10, Trainlm training function) exhibited superior prediction performance compared to the random forest model. The validation set R2 (0.86%) and RPD (3.08) suggest that the model is suitable for field diagnosis. Our method is not intended to replace laboratory analysis, but rather aims to provide a cost-effective screening tool for dynamic potassium (K) monitoring in large-scale orchards shows great potential as a rapid and non-destructive tool for monitoring/screening K status in pear leaves, complementing traditional laboratory methods and enabling more timely nutrient management decisions. This research associates spectral features with potassium physiological functions, offering a novel approach for nutritional diagnosis in fruit trees. Further studies are needed to validate the model’s applicability across diverse varieties and under extreme conditions.

Author Contributions

M.Y.: conceptualization, methodology, data curation, writing—original draft, writing—review and editing; W.F.: conceptualization, methodology, data curation, writing—original draft, writing—review and editing; J.Z.: visualization, software; Y.L.: validation, investigation; L.W.: visualization, formal analysis; H.W.: supervision, formal analysis; F.H.: investigation; visualization; J.B.: resources, writing—review and editing, project administration, funding acquisition. All authors have read and agreed to the published version of the manuscript.

Funding

This project is supported by the Strong Youth Science and Technology Talent Project of the Corps “Research on nitrogen regulation of pear calyx desiccation/retention fertilization strategy” (project number: 2022CB001-11); Effects of irrigation at flowering stage on sepal abscission and mitochondrial apoptosis of Korla fragrant pear, Project number: BTYJXM-2024-K61; Effects of irrigation at flowering stage on sepal abscission and mitochondrial apoptosis of Korla fragrant pear, project number: TDGRI2024027.

Data Availability Statement

The data that support the findings of this study are available from the corresponding author upon reasonable request.

Conflicts of Interest

The authors declare no conflicts of interest.

Abbreviations

R2Coefficient of Determination
RMSERoot Mean Square Error
RPDRatio of Performance to Deviation
BPBackpropagation
CARSCompetitive Adaptive Reweighted Sampling
SPASuccessive Projections Algorithm
SGSavitzky-Golay
MSCMultiplicative Scatter Correction
SDSecond Derivative
FDFirst Derivative

References

  1. Zhuang, Y.; Wang, X.; Gong, X.; Bao, J. Effects of Different Foliar Fertilizer Treatments on Fruit Quality of the Korla Fragrant Pear. Horticulturae 2024, 10, 51. [Google Scholar] [CrossRef]
  2. Appiah, E.A.; Balla-Kovács, A.; Ocwa, A.; Csajbók, J.; Kutasy, E. Enhancing Alfalfa (Medicago sativa L.) Productivity: Exploring the Significance of Potassium Nutrition. Agronomy 2024, 14, 1806. [Google Scholar] [CrossRef]
  3. Kuzin, A.; Solovchenko, A. Essential Role of Potassium in Apple and Its Implications for Management of Orchard Fertilization. Plants 2021, 10, 2624. [Google Scholar] [CrossRef]
  4. Naz, T.; Mazhar Iqbal, M.; Tahir, M.; Hassan, M.M.; Rehmani, M.I.A.; Zafar, M.I.; Ghafoor, U.; Qazi, M.A.; EL Sabagh, A.; Sakran, M.I. Foliar Application of Potassium Mitigates Salinity Stress Conditions in Spinach (Spinacia oleracea L.) through Reducing NaCl Toxicity and Enhancing the Activity of Antioxidant Enzymes. Horticulturae 2021, 7, 566. [Google Scholar] [CrossRef]
  5. Cui, J.; Davanture, M.; Zivy, M.; Lamade, E.; Tcherkez, G. Metabolic responses to potassium availability and waterlogging reshape respiration and carbon use efficiency in oil palm. New Phytol. 2019, 223, 310–322. [Google Scholar] [CrossRef] [PubMed]
  6. Chen, R.; Zheng, L.; Zhao, J.; Ma, J.; Li, X. Biochar Application Maintains Photosynthesis of Cabbage by Regulating Stomatal Parameters in Salt-Stressed Soil. Sustainability 2023, 15, 4206. [Google Scholar] [CrossRef]
  7. Yabiku, T.; Ueno, O. Variations in physiological, biochemical, and structural traits of photosynthesis and resource use efficiency in maize and teosintes (NADP-ME-type C 4). Plant Prod. Sci. 2017, 20, 448–458. [Google Scholar] [CrossRef]
  8. Wang, L.; Sun, J.; Wang, C.; Shangguan, Z. Leaf photosynthetic function duration during yield formation of large-spike wheat in rainfed cropping systems. PeerJ 2018, 6, e5532. [Google Scholar] [CrossRef]
  9. Lu, L.; Chen, S.; Yang, W.; Wu, Y.; Liu, Y.; Yin, X.; Yang, Y.; Yang, Y. Integrated transcriptomic and metabolomic analyses reveal key metabolic pathways in response to potassium deficiency in coconut (Cocos nucifera L.) seedlings. Front. Plant Sci. 2023, 14, 1112264. [Google Scholar] [CrossRef]
  10. Woldemariam, S.; Lal, S.; Zeru Zelelew, D.; Solomon, M. Effect of Potassium Levels on Productivity and Fruit Quality of Tomato (Lycopersicon esculentum L.). J. Agric. Stud. 2018, 6, 104. [Google Scholar] [CrossRef]
  11. Shen, C.; Wang, J.; Shi, X.; Kang, Y.; Xie, C.; Peng, L.; Dong, C.; Shen, Q.; Xu, Y. Transcriptome Analysis of Differentially Expressed Genes Induced by Low and High Potassium Levels Provides Insight into Fruit Sugar Metabolism of Pear. Front. Plant Sci. 2017, 8, 938. [Google Scholar] [CrossRef] [PubMed]
  12. Khan, M.N.; Mukherjee, S.; Al-Huqail, A.A.; Basahi, R.A.; Ali, H.M.; Al-Munqedhi, B.M.A.; Siddiqui, M.H.; Kalaji, H.M. Exogenous Potassium (K+) Positively Regulates Na+/H+ Antiport System, Carbohydrate Metabolism, and Ascorbate–Glutathione Cycle in H2S-Dependent Manner in NaCl-Stressed Tomato Seedling Roots. Plants 2021, 10, 948. [Google Scholar] [CrossRef] [PubMed]
  13. Chen, Z.; Guo, X.; Du, J.; Yu, M. ALA Promotes Sucrose Accumulation in Early Peach Fruit by Regulating SPS Activity. Curr. Issues Mol. Biol. 2024, 46, 7944–7954. [Google Scholar] [CrossRef]
  14. Li, Z.; Duan, S.; Lu, B.; Yang, C.; Ding, H.; Shen, H. Spraying alginate oligosaccharide improves photosynthetic performance and sugar accumulation in citrus by regulating antioxidant system and related gene expression. Front. Plant Sci. 2023, 13, 1108848. [Google Scholar] [CrossRef]
  15. Zhou, Y.; Li, K.; Wen, S.; Yang, D.; Gao, J.; Wang, Z.; Zhu, P.; Bie, Z.; Cheng, J. Phloem unloading in cultivated melon fruits follows an apoplasmic pathway during enlargement and ripening. Hortic. Res. 2023, 10, uhad123. [Google Scholar] [CrossRef]
  16. Kumar, K.; Madhumala, K.; Sahay, S.; Ahmad, M. Response of Different Sources of Potassium on Biochemical Quality of Litchi cv. Deshi. Int. J. Curr. Microbiol. Appl. Sci. 2020, 9, 2281–2290. [Google Scholar] [CrossRef]
  17. Garcia, K.; Chasman, D.; Roy, S.; Ané, J.M. Physiological Responses and Gene Co-Expression Network of Mycorrhizal Roots under K(+) Deprivation. Plant Physiol. 2017, 173, 1811–1823. [Google Scholar] [CrossRef]
  18. Shin, R.; Schachtman, D.P. Hydrogen peroxide mediates plant root cell response to nutrient deprivation. Proc. Natl. Acad. Sci. USA 2004, 101, 8827–8832. [Google Scholar] [CrossRef]
  19. Adams, E.; Shin, R. Transport, signaling, and homeostasis of potassium and sodium in plants. J. Integr. Plant Biol. 2014, 56, 231–249. [Google Scholar] [CrossRef]
  20. Wu, K.; Hu, C.; Liao, P.; Hu, Y.; Sun, X.; Tan, Q.; Pan, Z.; Xu, S.; Dong, Z.; Wu, S. Potassium stimulates fruit sugar accumulation by increasing carbon flow in Citrus sinensis. Hortic. Res. 2024, 11, uhae240, Erratum in Hortic. Res. 2025, 12, uhaf057. [Google Scholar] [CrossRef]
  21. Kumar, P.; Kumar, T.; Singh, S.; Tuteja, N.; Prasad, R.; Singh, J. Potassium: A key modulator for cell homeostasis. J. Biotechnol. 2020, 324, 198–210. [Google Scholar] [CrossRef] [PubMed]
  22. Etienne, A. Which Physiological Processes Control Banana Acidity (sp. Musa) During Pre And Post-Harvest Stages? Ecophysiological Modeling and Experimental Analysis of the Effects of Genotype and Fruit Growth Conditions [Quels Processus Physiologiques Pilotent l’Acidité de la Banane Dessert (sp. Musa) en Pré et Post Récolte? Modélisation Ecophysiologique et Analyse Expérimentale de l’Effet du Génotype et des Conditions de Croissance du Fruit]; Université des Antilles-Guyane: Pointe-à-Pitre, France, 2014. [Google Scholar]
  23. Mota, M.; Martins, M.J.; Policarpo, G.; Sprey, L.; Pastaneira, M.; Almeida, P.; Maurício, A.; Rosa, C.; Faria, J.; Martins, M.B.; et al. Nutrient Content with Different Fertilizer Management and Influence on Yield and Fruit Quality in Apple cv. Gala. Horticulturae 2022, 8, 713. [Google Scholar] [CrossRef]
  24. Ksouri, N.; Sánchez, G.; Forcada, C.; Contreras-Moreira, B.; Gogorcena, Y. ddRAD-seq-derived SNPs reveal novel association signatures for fruit-related traits in peach. bioXriv 2023. [Google Scholar] [CrossRef]
  25. Singh, S.; Bahadur, V.; Mishra, S. Effect of Different Spacing and NPK Combination on Plant Growth, Fruit Yield and Fruit Quality of Strawberry (Fragaria ananassa Duch.) cv. Winter Dawn. J. Adv. Biol. Biotechnol. 2024, 27, 415–427. [Google Scholar] [CrossRef]
  26. Azam, M.; Qadri, R.; Aslam, A.; Khan, M.I.; Khan, A.S.; Anwar, R.; Ghani, M.A.; Ejaz, S.; Hussain, Z.; Iqbal, M.A.; et al. Effects of different combinations of N, P and K at different time interval on vegetative, reproductive, yield and quality traits of mango (Mangifera indica L.) cv. Dusehri. Braz. J. Biol. 2021, 82, e235612. [Google Scholar] [CrossRef] [PubMed]
  27. Peng, L.; Xiao, H.; Li, R.; Zeng, Y.; Gu, M.; Moran, N.; Yu, L.; Xu, G. Potassium transporter OsHAK18 mediates potassium and sodium circulation and sugar translocation in rice. Plant Physiol. 2023, 193, 2003–2020. [Google Scholar] [CrossRef]
  28. Sun, T.; Zhang, J.; Zhang, Q.; Li, X.; Li, M.; Yang, Y.; Zhou, J.; Wei, Q.; Zhou, B. Transcriptional and metabolic responses of apple to different potassium environments. Front. Plant Sci. 2023, 14, 1131708. [Google Scholar] [CrossRef]
  29. Gorji, R.; Skvaril, J.; Odlare, M. Determining Moisture Content of Basil Using Handheld Near-Infrared Spectroscopy. Horticulturae 2024, 10, 336. [Google Scholar] [CrossRef]
  30. Guarçoni, M.A.; Ventura, J. Nitrogen, P and K fertilization and the development, yield and fruit quality of pineapple ‘Gold’ (MD-2). Rev. Bras. Ciência Solo 2011, 35, 1367–1376. [Google Scholar] [CrossRef]
  31. Wang, J.; He, X.; Gong, P.; Zhao, D.; Zhang, Y.; Wang, Z.; Zhang, J. Optimization of a Water-Saving and Fertilizer-Saving Model for Enhancing Xinjiang Korla Fragrant Pear Yield, Quality, and Net Profits under Water and Fertilizer Coupling. Sustainability 2022, 14, 8495. [Google Scholar] [CrossRef]
  32. Tamburini, E.; Ferrari, G.; Marchetti, M.G.; Pedrini, P.; Ferro, S. Development of FT-NIR Models for the Simultaneous Estimation of Chlorophyll and Nitrogen Content in Fresh Apple (Malus domestica) Leaves. Sensors 2015, 15, 2662–2679. [Google Scholar] [CrossRef]
  33. Yu, Y.; Yu, H.; Li, X.; Zhang, L.; Sui, Y. Prediction of Potassium Content in Rice Leaves Based on Spectral Features and Random Forests. Agronomy 2023, 13, 2337. [Google Scholar] [CrossRef]
  34. Liu, Y.; Niu, X.; Tang, Y.; Li, S.; Lan, H.; Niu, H. Internal Quality Prediction Method of Damaged Korla Fragrant Pears during Storage. Horticulturae 2023, 9, 666. [Google Scholar] [CrossRef]
  35. Su, T.; Wang, C.; Zhao, G.; Fan, S.; Yang, G.; Xu, C.; Su, H. Investigations on Spectra of Terahertz and Raman of L-Alabinose at Fingerprint Region. Spectrosc. Spectr. Anal. 2018, 38, 2713–2719. [Google Scholar]
  36. Lei, Y.; Kesu, W.; Delun, L.; Fugui, Z.; Xuemei, W. Analysis of hyperspectral characteristics of flue—Cured tobacco oil based on improved RF feature selection strategy. J. Chin. Agric. Mech. 2021, 42, 196–202. [Google Scholar] [CrossRef]
  37. Hong, Y.; Xue, T.; Huang, M. PSO-BP Based Prediction Study for Nonlinear Regression Problems. In Proceedings of the 2024 IEEE 2nd International Conference on Image Processing and Computer Applications (ICIPCA), Shenyang, China, 28–30 June 2024; pp. 903–910. [Google Scholar] [CrossRef]
  38. Lang, J.; Ramos, S.E.; Smohunova, M.; Bigler, L.; Schuman, M.C. Screening of leaf extraction and storage conditions for eco-metabolomics studies. Plant Direct 2024, 8, e578. [Google Scholar] [CrossRef] [PubMed]
  39. Liu, Y.; Song, P.; Zhang, Y.; Zhou, D.; Dong, Q.; Jia, P.; Liu, Z.; Zhao, X.; Yu, H. Physiological Mechanism of Photosynthetic, Nutrient, and Yield Responses of Peanut Cultivars with Different Tolerances under Low K Stress. Agronomy 2023, 13, 185. [Google Scholar] [CrossRef]
  40. Zhou, X.; Su, F.; Tian, Y.; Youngbull, C.; Johnson, R.H.; Meldrum, D.R. A New Highly Selective Fluorescent K+ Sensor. J. Am. Chem. Soc. 2011, 133, 18530–18533. [Google Scholar] [CrossRef]
  41. Yaron, J.R.; Gangaraju, S.; Rao, M.Y.; Kong, X.; Zhang, L.; Su, F.; Tian, Y.; Glenn, H.L.; Meldrum, D.R. K(+) regulates Ca(2+) to drive inflammasome signaling: Dynamic visualization of ion flux in live cells. Cell Death Dis. 2015, 6, e1954. [Google Scholar] [CrossRef]
  42. Yu, M.; Bai, X.; Bao, J.; Wang, Z.; Tang, Z.; Zheng, Q.; Zhi, J. The Prediction Model of Total Nitrogen Content in Leaves of Korla Fragrant Pear Was Established Based on Near Infrared Spectroscopy. Agronomy 2024, 14, 1284. [Google Scholar] [CrossRef]
  43. Xu, K.; Sun, L.-L.; Wang, J.; Liu, S.-X.; Yang, H.-W.; Xu, N.; Zhang, H.-J.; Wang, J.-X. Potassium deficiency diagnosis method of apple leaves based on MLR-LDA-SVM. Front. Plant Sci. 2023, 14, 1271933. [Google Scholar] [CrossRef] [PubMed]
  44. Hao, L.; Ren, G.; Wang, J. Using Fourier Transform Near-Infrared Spectroscopy for the Evaluation and Regional Analysis of Pea (Pisum sativum L.). J. Plant Genet. Resour. 2014, 15, 779–787. [Google Scholar] [CrossRef]
  45. Li, X.; Fu, X.; Li, H. A CARS-SPA-GA Feature Wavelength Selection Method Based on Hyperspectral Imaging with Potato Leaf Disease Classification. Sensors 2024, 24, 6566. [Google Scholar] [CrossRef] [PubMed]
  46. Khan, A.; Munir, M.T.; Yu, W.; Young, B. Wavelength Selection FOR Rapid Identification of Different Particle Size Fractions of Milk Powder Using Hyperspectral Imaging. Sensors 2020, 20, 4645. [Google Scholar] [CrossRef]
  47. Speiser, J.L.; Miller, M.E.; Tooze, J.; Ip, E. A comparison of random forest variable selection methods for classification prediction modeling. Expert Syst. Appl. 2019, 134, 93–101. [Google Scholar] [CrossRef]
  48. Li, P.; Cai, M.; Miao, S.; Li, Y.; Sun, L.; Wang, J.; Gorjian, M. Accurate measurement techniques and prediction approaches for the in-situ rock stress. Sci. Rep. 2024, 14, 13226. [Google Scholar] [CrossRef] [PubMed]
  49. Ahmad Yasmin, N.S.; Abdul Wahab, N.; Ismail, F.S.; Musa, M.a.J.; Halim, M.H.A.; Anuar, A.N. Support Vector Regression Modelling of an Aerobic Granular Sludge in Sequential Batch Reactor. Membranes 2021, 11, 554. [Google Scholar] [CrossRef]
  50. Li, S.; Jin, N.; Dogani, A.; Yang, Y.; Zhang, M.; Gu, X. Enhancing LightGBM for Industrial Fault Warning: An Innovative Hybrid Algorithm. Processes 2024, 12, 221. [Google Scholar] [CrossRef]
  51. Yuan, J.; Wang, X.; Yan, C.; Chen, S.; Wang, S.; Zhang, J.; Xu, Z.; Ju, X.; Ding, N.; Dong, Y.; et al. Wavelength Selection for Estimating Soil Organic Matter Contents Through the Radiative Transfer Model. IEEE Access 2020, 8, 176286–176293. [Google Scholar] [CrossRef]
  52. Chu, C.; Wang, H.; Luo, X.; Wen, P.; Nan, L.; Du, C.; Fan, Y.; Gao, D.; Wang, D.; Yang, Z.; et al. Possible Alternatives: Identifying and Quantifying Adulteration in Buffalo, Goat, and Camel Milk Using Mid-Infrared Spectroscopy Combined with Modern Statistical Machine Learning Methods. Foods 2023, 12, 3856. [Google Scholar] [CrossRef]
  53. Ferrer, J.; San-Fabián, E. Energy calculations for sodium vs. potassium on a prokaryotic voltage-gated sodium channel: A quantum-chemical study. Theor. Chem. Acc. 2024, 143, 57. [Google Scholar] [CrossRef]
  54. Qin, Y.; Liu, W.; Zhang, X.; Adamowski, J.F.; Biswas, A. Leaf Stoichiometry of Potentilla fruticosa Across Elevations in China’s Qilian Mountains. Front. Plant Sci. 2022, 13, 814059. [Google Scholar] [CrossRef] [PubMed]
  55. Guo, X.; Zhu, X.; Li, C.; Wei, Y.; Yu, X.; Zhao, G.; Sun, H. Hyperspectral Inversion of Potassium Content in Apple Leaves Based on Vegetation Index. Agric. Sci. 2017, 8, 825–836. [Google Scholar] [CrossRef]
  56. Galvez-Sola, L.; García-Sánchez, F.; Pérez-Pérez, J.G.; Gimeno, V.; Navarro, J.M.; Moral, R.; Martínez-Nicolás, J.J.; Nieves, M. Rapid estimation of nutritional elements on citrus leaves by near infrared reflectance spectroscopy. Front. Plant Sci. 2015, 6, 571. [Google Scholar] [CrossRef] [PubMed]
  57. Bao, J.; Yu, M.; Li, J.; Wang, G.; Tang, Z.; Zhi, J. Determination of leaf nitrogen content in apple and jujube by near-infrared spectroscopy. Sci. Rep. 2024, 14, 20884. [Google Scholar] [CrossRef]
  58. Sarkar, S.; Basak, J.K.; Moon, B.E.; Kim, H.T. A Comparative Study of PLSR and SVM-R with Various Preprocessing Techniques for the Quantitative Determination of Soluble Solids Content of Hardy Kiwi Fruit by a Portable Vis/NIR Spectrometer. Foods 2020, 9, 1078. [Google Scholar] [CrossRef]
  59. Yue, J.; Feng, H.; Yang, G.; Li, Z. A Comparison of Regression Techniques for Estimation of Above-Ground Winter Wheat Biomass Using Near-Surface Spectroscopy. Remote Sens. 2018, 10, 66. [Google Scholar] [CrossRef]
  60. Teleszko, M.; Wojdyło, A. Comparison of phenolic compounds and antioxidant potential between selected edible fruits and their leaves. J. Funct. Foods 2015, 14, 736–746. [Google Scholar] [CrossRef]
  61. Wiens, R.; Findlay, C.R.; Baldwin, S.G.; Kreplak, L.; Lee, J.M.; Veres, S.P.; Gough, K.M. High spatial resolution (1.1 μm and 20 nm) FTIR polarization contrast imaging reveals pre-rupture disorder in damaged tendon. Faraday Discuss. 2016, 187, 555–573. [Google Scholar] [CrossRef]
  62. Wang, R.; Wang, Y. Fourier Transform Infrared Spectroscopy in Oral Cancer Diagnosis. Int. J. Mol. Sci. 2021, 22, 1206. [Google Scholar] [CrossRef]
  63. Nallala, J.; Lloyd, G.R.; Hermes, M.; Shepherd, N.; Stone, N. Enhanced spectral histology in the colon using high-magnification benchtop FTIR imaging. Vib. Spectrosc. 2017, 91, 83–91. [Google Scholar] [CrossRef]
  64. Hammer, S.; Griffith, D.W.T.; Konrad, G.; Vardag, S.; Caldow, C.; Levin, I. Assessment of a multi-species in situ FTIR for precise atmospheric greenhouse gas observations. Atmos. Meas. Tech. 2013, 6, 1153–1170. [Google Scholar] [CrossRef]
  65. Smale, D.; Sherlock, V.; Griffith, D.W.T.; Moss, R.; Brailsford, G.; Nichol, S.; Kotkamp, M. A decade of CH4, CO and N2O in situ measurements at Lauder, New Zealand: Assessing the long-term performance of a Fourier transform infrared trace gas and isotope analyser. Atmos. Meas. Tech. 2019, 12, 637–673. [Google Scholar] [CrossRef]
  66. Leibrandt, D.R.; Thorpe, M.J.; Notcutt, M.; Drullinger, R.E.; Rosenband, T.; Bergquist, J.C. Spherical reference cavities for frequency stabilization of lasers in non-laboratory environments. Opt. Express. 2011, 19, 3471–3482. [Google Scholar] [CrossRef]
  67. Widyaningrum, W.; Purwanto, Y.A.; Widodo, S.; Supijatno, S.; Iriani, E. Portable/Handheld NIR sebagai Teknologi Evaluasi Mutu Bahan Pertanian secara Non-Destruktif. J. Keteknikan Pertan. 2022, 10, 59–68. [Google Scholar] [CrossRef]
  68. Gullifa, G.; Barone, L.; Papa, E.; Giuffrida, A.; Materazzi, S.; Risoluti, R. Portable NIR spectroscopy: The route to green analytical chemistry. Front. Chem. 2023, 11, 1214825. [Google Scholar] [CrossRef]
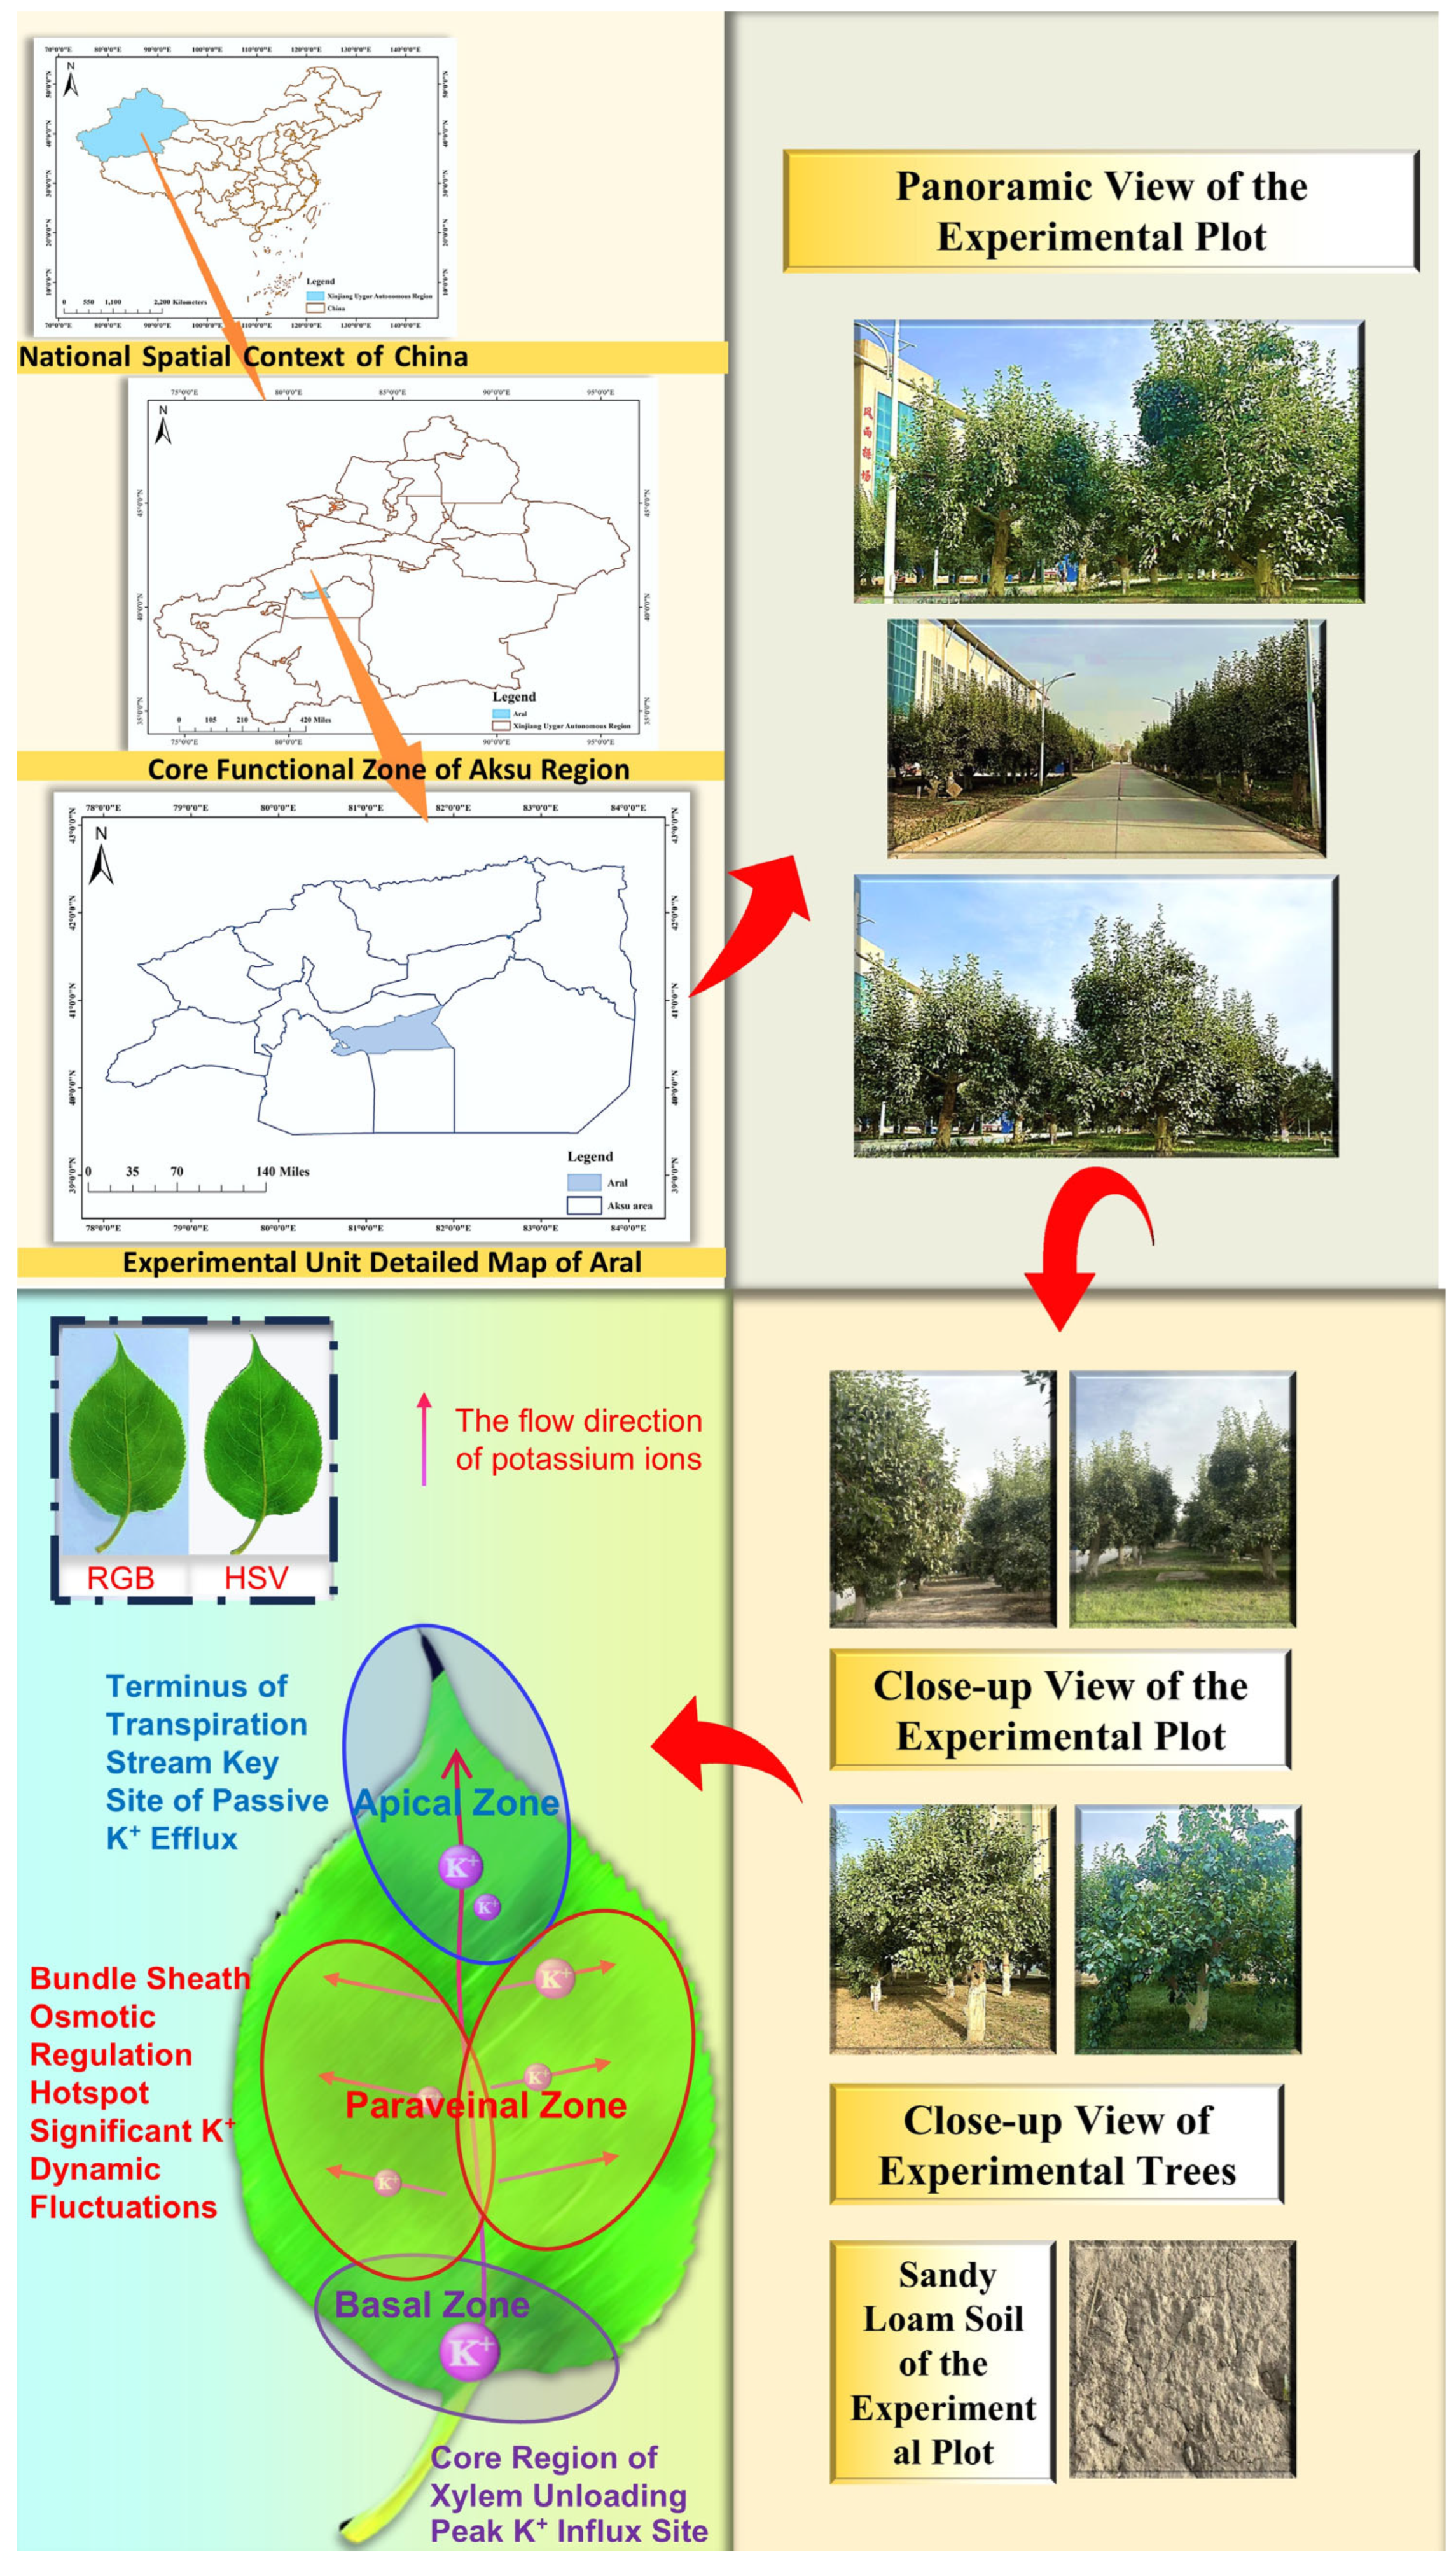
Figure 1. Geographic location, field view and sampling workflow of the experimental site.
Agronomy 15 01672 g001
Figure 2. Data acquisition flow chart.
Agronomy 15 01672 g002
Figure 3. Visualization of total potassium content in leaves of Korle pear.
Agronomy 15 01672 g003
Figure 4. Original spectra and spectra after removing outliers for three periods; (a) shows the original leaf spectra of Korla pears during the fruit setting period; (b) shows the spectra after removing outliers from the leaf spectra of Korla pears during the fruit setting period; (c) shows the original leaf spectra of Korla pears during the fruit enlargement period; (d) shows the spectra after removing outliers from the leaf spectra of Korla pears during the fruit enlargement period; (e) shows the original leaf spectra of Korla pears during the fruit maturation period; (f) shows the spectra after removing outliers from the leaf spectra of Korla pears during the fruit maturation period.
Agronomy 15 01672 g004
Figure 5. Spectral pretreatment: (a) MSC; (b) SNV; (c) FD; (d) SD; (e) MSC + FD; (f) SNV + FD; (g) MSC + SD; (h) SNV + SD.
Agronomy 15 01672 g005
Figure 6. Correlation analysis between spectrum of Korla fragrant pear leaves and total potassium content in leaves: (a) Correlation between spectrum after removing abnormal values and total potassium content in leaves; (b) Correlation between MSC pretreatment spectrum and total potassium content in leaves; (c) Correlation between SNV pretreatment spectrum and total potassium content in leaves; (d) Correlation between FD pretreatment spectrum and total potassium content in leaves; (e) Correlation between SD pretreatment spectrum and total potassium content in leaves; (f) Correlation between MSC + FD pretreatment spectrum and total potassium content in leaves; (g) correlation between SNV + FD pretreatment spectrum and total potassium content in leaves (h) correlation between MSC + SD pretreatment spectrum and total potassium content in leaves; (i) correlation between SNV + SD pretreatment spectrum and total potassium content in leaves.
Agronomy 15 01672 g006
Figure 7. Feature extraction CARS algorithm; (a) MSC; (b) SNV; (c) FD; (d) SD; (e) MSC + FD; (f) SNV + FD; (g) MSC + SD; (h) SNV + SD.
Agronomy 15 01672 g007
Figure 8. Model index comparison: (a) R2 of the training set; (b) R2 of the validation set; (c) RMSE of the training set; (d) RMSE of the validation set; (e) RPD of the validation set; (f) RPD of the training set; (g) RPIQ of the validation set; (h) RPIQ of the training set.
Agronomy 15 01672 g008aAgronomy 15 01672 g008b
Figure 9. Comparison of training functions in the MSC + FD-CARS-BP model: (a) R2 of 6 training functions in BP neural network; (b) RMSE of 6 training functions in BP neural network; (c) model performance with Trainlm as the training function; (d) training status of the model with Trainlm as the training function.
Agronomy 15 01672 g009aAgronomy 15 01672 g009b
Figure 10. Verification of the MSC + FD-CARS-BP Model: (a) Linear fitting of the true and predicted values from the training set; (b) Linear fitting of the true and predicted values from the test set; (c) Linear fitting of the true and predicted values from the validation set; (d) Error analysis for all samples.
Agronomy 15 01672 g010
Figure 11. Feature extraction of MSC + FD preprocessed spectra by CARS algorithm: (a) Visualization of feature extraction process of MSC + FD preprocessed spectra by CARS algorithm; (b) Feature extraction results and site analysis of MSC + FD preprocessed spectra by CARS algorithm.
Agronomy 15 01672 g011
Figure 12. Parameter optimization of the RF and BP neural networks; (a) R2 for the training set after parameter adjustment based on the MSC + SD-CARS-RF model; (b) R2 for the validation set after parameter adjustment based on the MSC + SD-CARS-RF model; (c) RMSE for the training set after parameter adjustment based on the MSC + SD-CARS-RF model; (d) RMSE for the validation set after parameter adjustment based on the MSC + SD-CARS-RF model; (e) R2 for the parameter adjustment of the MSC + FD-CARS-BP model; (f) RMSE for the parameter adjustment of the MSC + FD-CARS-BP model.
Agronomy 15 01672 g012
Table 1. Soil Test Indicators at the Experimental Site.
Soil IndicesSoil Depth (cm)
0–20 cm20–40 cm40–60 cm
PH (dimensionless)8.088.078.13
Available potassium (mg/kg)16.1220.1213.6
Table 2. Criteria for mature leaf determination.
LevelSPADLeaf Age (d)Morphological Characteristics
Mature leaf35–4515–30Leaves are dark green in color and have a tough texture.
Disclaimer/Publisher’s Note: The statements, opinions and data contained in all publications are solely those of the individual author(s) and contributor(s) and not of MDPI and/or the editor(s). MDPI and/or the editor(s) disclaim responsibility for any injury to people or property resulting from any ideas, methods, instructions or products referred to in the content.