1. Introduction
Maize plays a crucial role in global food security and agricultural economies, and its accurate identification is essential for monitoring crop development. Research [
1,
2,
3,
4,
5] has shown that in remote sensing-based land cover classification, feature selection is often arbitrary, and the optimization of feature combinations is limited. Common methods excessively rely on vegetation indices like NDVI and fail to account for dynamic crop growth, complicating accurate identification. Optical data-based methods often yield suboptimal results, especially in regions with frequent cloud cover and rainfall [
6].
Enhancing classification accuracy is crucial for efficient farmland management in precision agriculture. Recent advancements in remote sensing, especially the use of radar satellite data, have significantly improved crop identification accuracy and timeliness [
7,
8]. Radar data offers all-weather capabilities, compensating for optical data limitations in cloudy or rainy conditions [
9]. A recent approach, proposed by [
10], integrates spatial, temporal, and spectral datasets using a three-dimensional convolutional neural network (STF3DCNN). This approach offers a technique for spatiotemporal fusion that enhances data analysis in agricultural monitoring. In this context, this study incorporates Sentinel-1’s VV and VH polarized radar data, supplementing the dataset, alongside Sentinel-2 imagery, which provides high spatial and temporal resolution for maize differentiation [
11].
Integrating multi-source remote sensing data and optimizing features significantly improves crop identification accuracy. Research has shown that utilizing spectral characteristics, vegetation indices, red-edge indices, and texture features enhances precision, especially in complex agricultural environments [
12]. This study focuses on the Hexi Corridor, where red-edge indices are effective for distinguishing maize, and texture features aid in differentiating land cover types with similar spectra.
In addition to crop monitoring, multi-source remote sensing data have been extensively applied in geo-hazard monitoring and change detection. For example, radar and optical imagery have been utilized for mapping landslides, monitoring soil erosion, and detecting land cover changes over time. Recent research, including investigations aimed at predicting geo-hazards in underground mining, has demonstrated the effectiveness of integrating various remote sensing data sources for comprehensive hazard monitoring and risk evaluation, similar to the techniques employed in crop surveillance [
13].This illustrates the versatility of remote sensing data and underscores the potential for integrating various data sources to enhance monitoring capabilities across diverse environmental contexts.
Recent studies have adopted robust methods in crop identification, particularly focusing on feature optimization and selection. For example, Xie Yi et al. [
14] achieved high-precision winter wheat extraction using optimal feature combinations. The random forest classifier, known for its immunity to collinearity, is widely used for feature selection in agricultural studies. The recursive feature elimination random forest (RF-RFE) method has been employed by Liu Xueping et al. [
15] integrated this method with the random forest classification algorithm to map the spatial distribution of pomelo orchards in Pinghe County. Similarly, Zhou Xiaocheng et al. [
16] utilized the RF-RFE algorithm to identify key features conducive to forest information extraction, achieving efficient classification and recognition of forest trees. In this study, integrating feature importance ranking with redundancy elimination to optimize the model. To address potential multicollinearity, features with Pearson correlation coefficients exceeding 0.95 were filtered prior to the RF-RFE step, thereby reducing redundant features and enhancing the model’s computational efficiency, particularly under resource-constrained conditions.
The primary research hypothesis of this study posits that optimizing feature selection by integrating multi-source remote sensing data can significantly enhance crop classification accuracy, especially in arid regions. This methodology incorporates temporal, spectral, and spatial data features while utilizing a lightweight technique for feature selection, thereby ensuring both high accuracy and low computational costs.
This research does not introduce a novel algorithm; rather, it employs and modifies existing techniques within a complex agricultural context. The focus is on adapting these methodologies to better suit the unique challenges presented in the agricultural sector, thereby enhancing their applicability and effectiveness in real-world scenarios. While previous studies have investigated the integration of Sentinel-1 and Sentinel-2 data for crop identification, this study contributes significantly by effectively amalgamating diverse data sources and enhancing features for complex agro-ecological regions, exemplified by the arid Hexi Corridor. The integration of multi-source remote sensing data, encompassing both radar and optical imagery, not only improves accuracy but also addresses the challenges associated with redundant feature identification and low computational efficiency. This study enhances the practicality of crop classification under resource-limited conditions by implementing an optimized process that minimizes redundancy while retaining essential information. This method ensures effective model performance and efficient computation, making it particularly suitable for large-scale agricultural monitoring applications in constrained environments.
In summary, this study integrates multiple features and closely combines remote sensing technology with precision agriculture, providing a valuable reference for crop classification research under similar agricultural ecological conditions globally. The Hexi region of Gansu Province was selected as the study area, utilizing Sentinel-2 optical imagery and Sentinel-1 radar imagery to construct a multidimensional feature set that encompasses spectral data, vegetation indices, red-edge indices, and texture features [
17,
18,
19,
20,
21]. The recursive feature elimination (RF-RFE) algorithm was employed to optimize feature selection, further enhancing the accuracy of maize identification [
4,
22,
23,
24,
25]. By integrating multi-source data, this study offers a more comprehensive feature space for model learning, which enables the capture of complex patterns and relationships, thus improving generalization capabilities and ensuring more stable and accurate identification results in complex environments. The primary objective of this study is to enhance the accuracy and efficiency of maize identification through optimized feature combinations, thereby providing reliable technical support for precision agriculture and crop monitoring.
2. Materials and Methods
2.1. Study Area
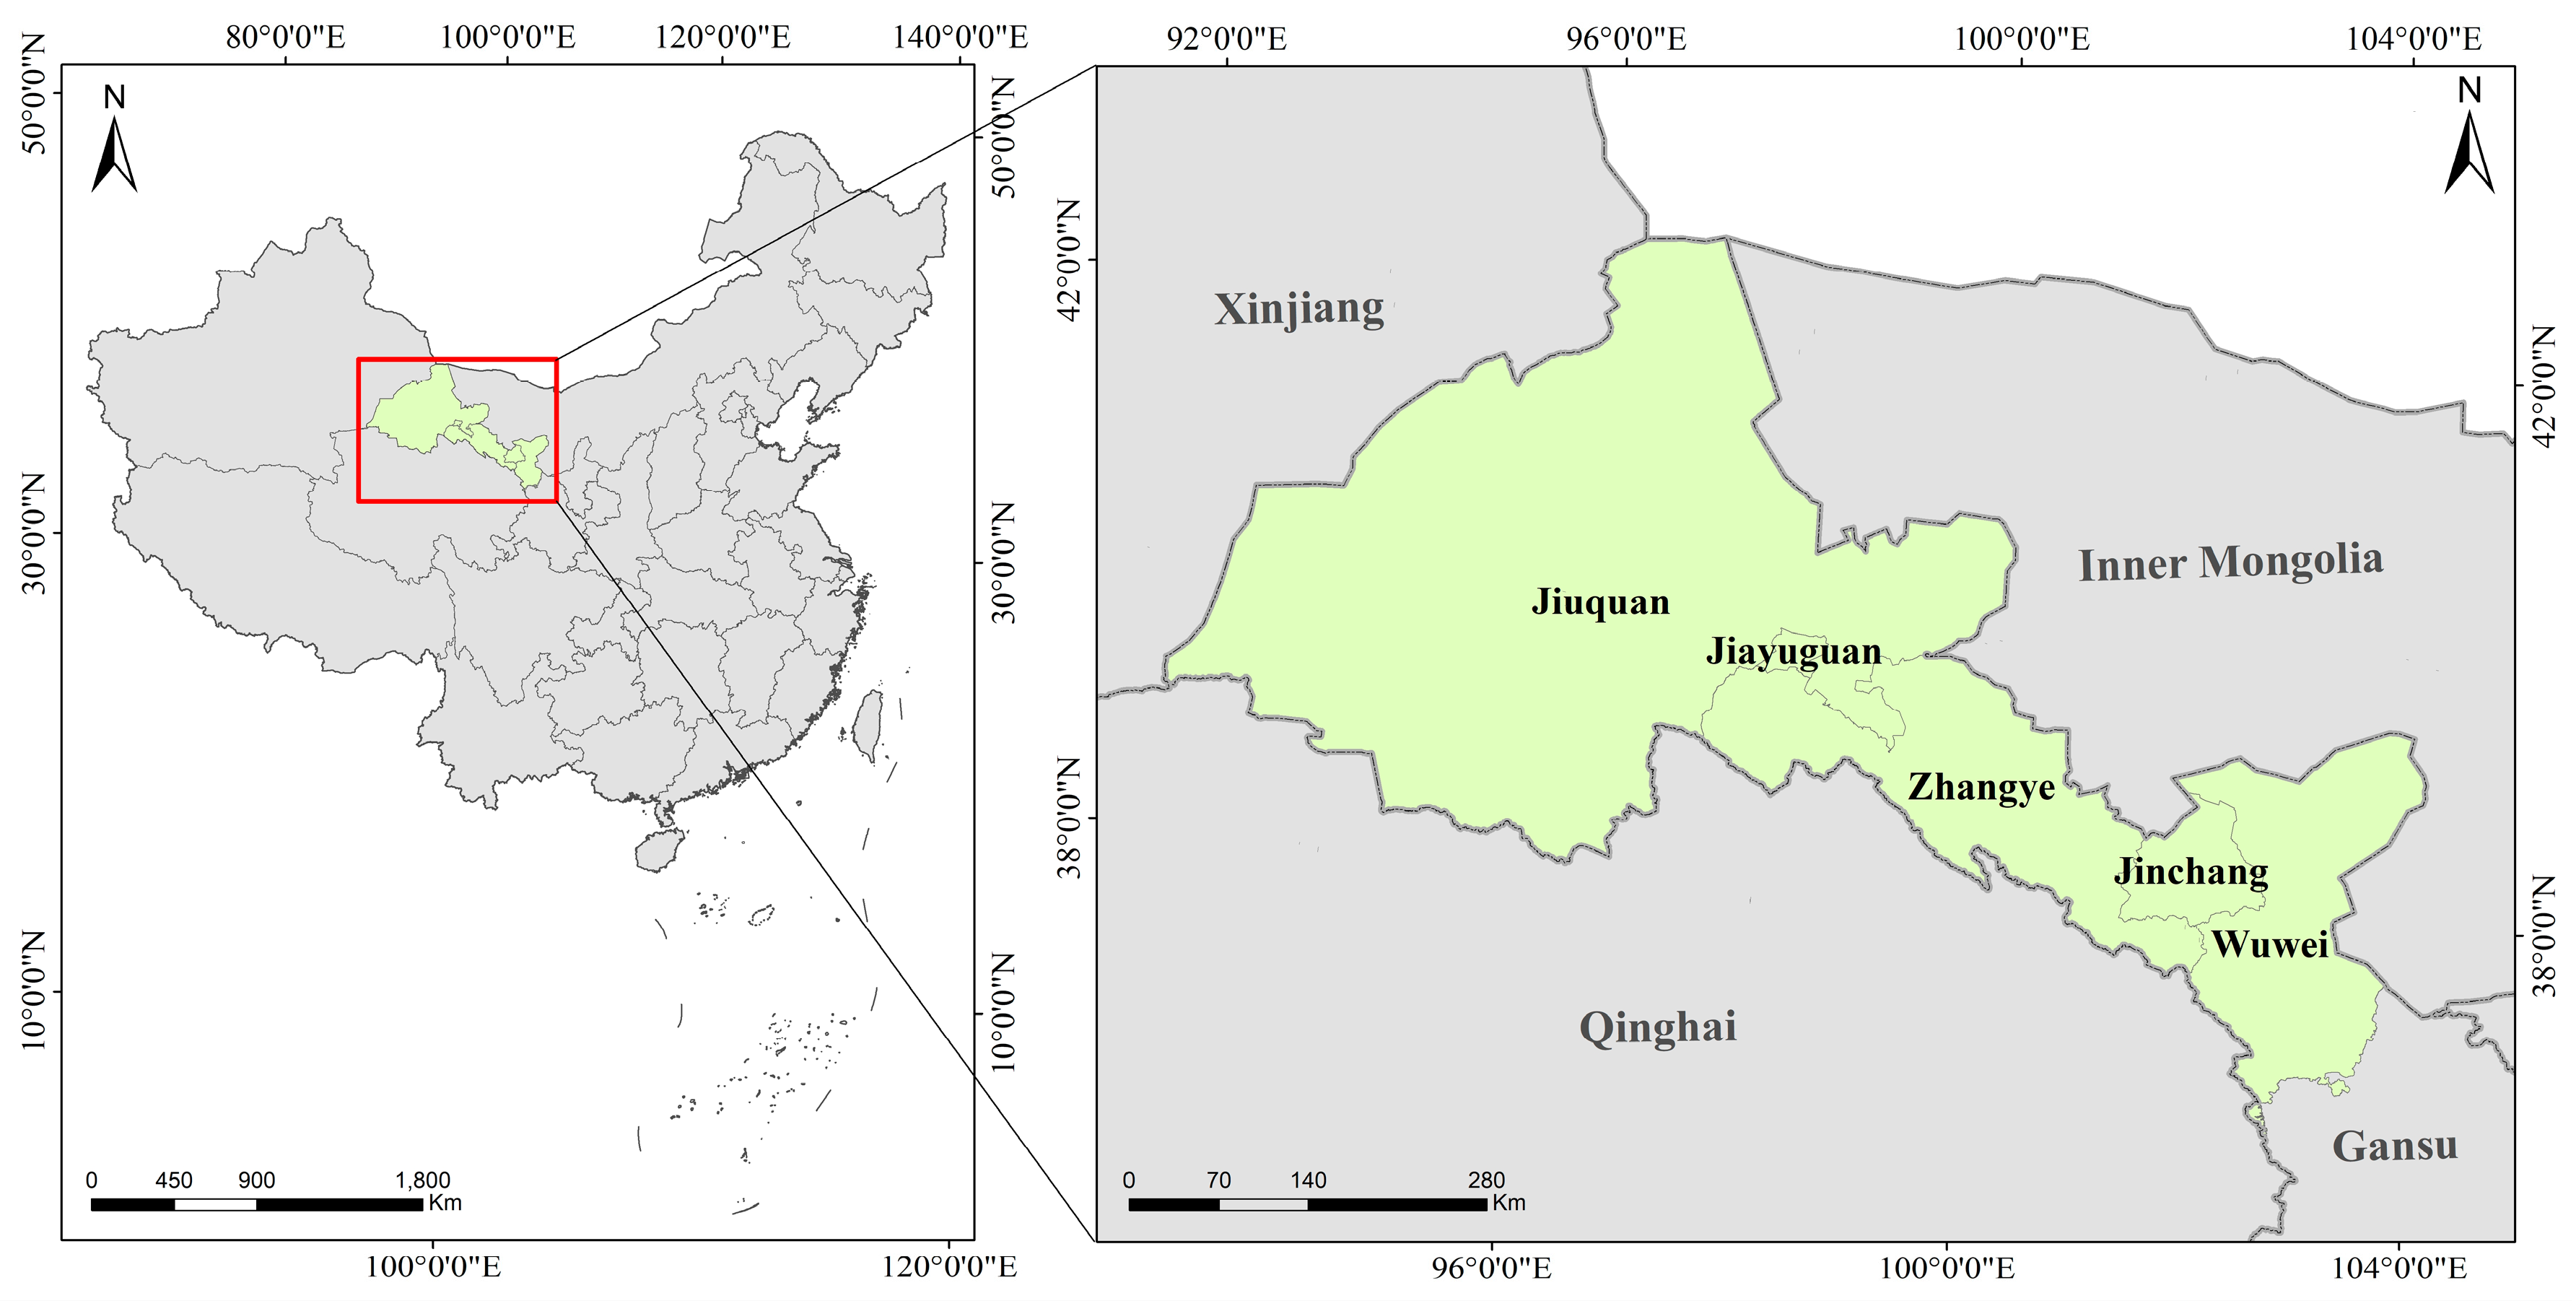
The Hexi region is situated in the northwestern part of China, extending from 92°44′ to 104°14′ east longitude and from 37°15′ to 42°49′ north latitude, as illustrated in
Figure 1. It encompasses the cities of Jiuquan, Jiayuguan, Zhangye, Wuwei, and Jinchang from west to east. The total area of the Hexi region, as defined in this study, spans approximately 250,000 square kilometers. The terrain exhibits a gradient slope from east to west and from south to north, characterized primarily by mountains and plains, interspersed with deserts and oases, thereby forming a typical arid and semi-arid environment. The Hexi region experiences a temperate continental climate, with an average annual temperature ranging from 5 to 10 °C and an annual sunshine duration of 2800 to 3300 h [
26]. Precipitation is predominantly concentrated in the summer, with annual rainfall varying between 140 and 350 mm. These climatic conditions establish a robust foundation for the development of irrigated agriculture. Furthermore, the significant diurnal temperature variation is beneficial for maize growth, while the abundant sunlight not only enhances crop yields but also facilitates high-resolution remote sensing monitoring. This region serves as a crucial area for maize cultivation and breeding in China. Its agricultural ecosystem is highly representative, encompassing both irrigated and rain-fed agriculture, which is akin to other arid and semi-arid regions in northwestern China. The selection of the Hexi region for this study is highly representative and provides valuable insights and theoretical support for other areas in China with similar climatic and agro-ecological characteristics. The primary crops cultivated in the Hexi region include maize, alfalfa, and wheat, with land use predominantly comprising cropland and grassland. Maize is grown from mid-April to late September, aligning well with the local climate. These characteristics further substantiate the scientific rationale for selecting the Hexi region as the study area. The study area is located in the Hexi Corridor, with elevation ranging from 800 m to 3000 m above sea level. This range encompasses both flat plains and mountainous regions.
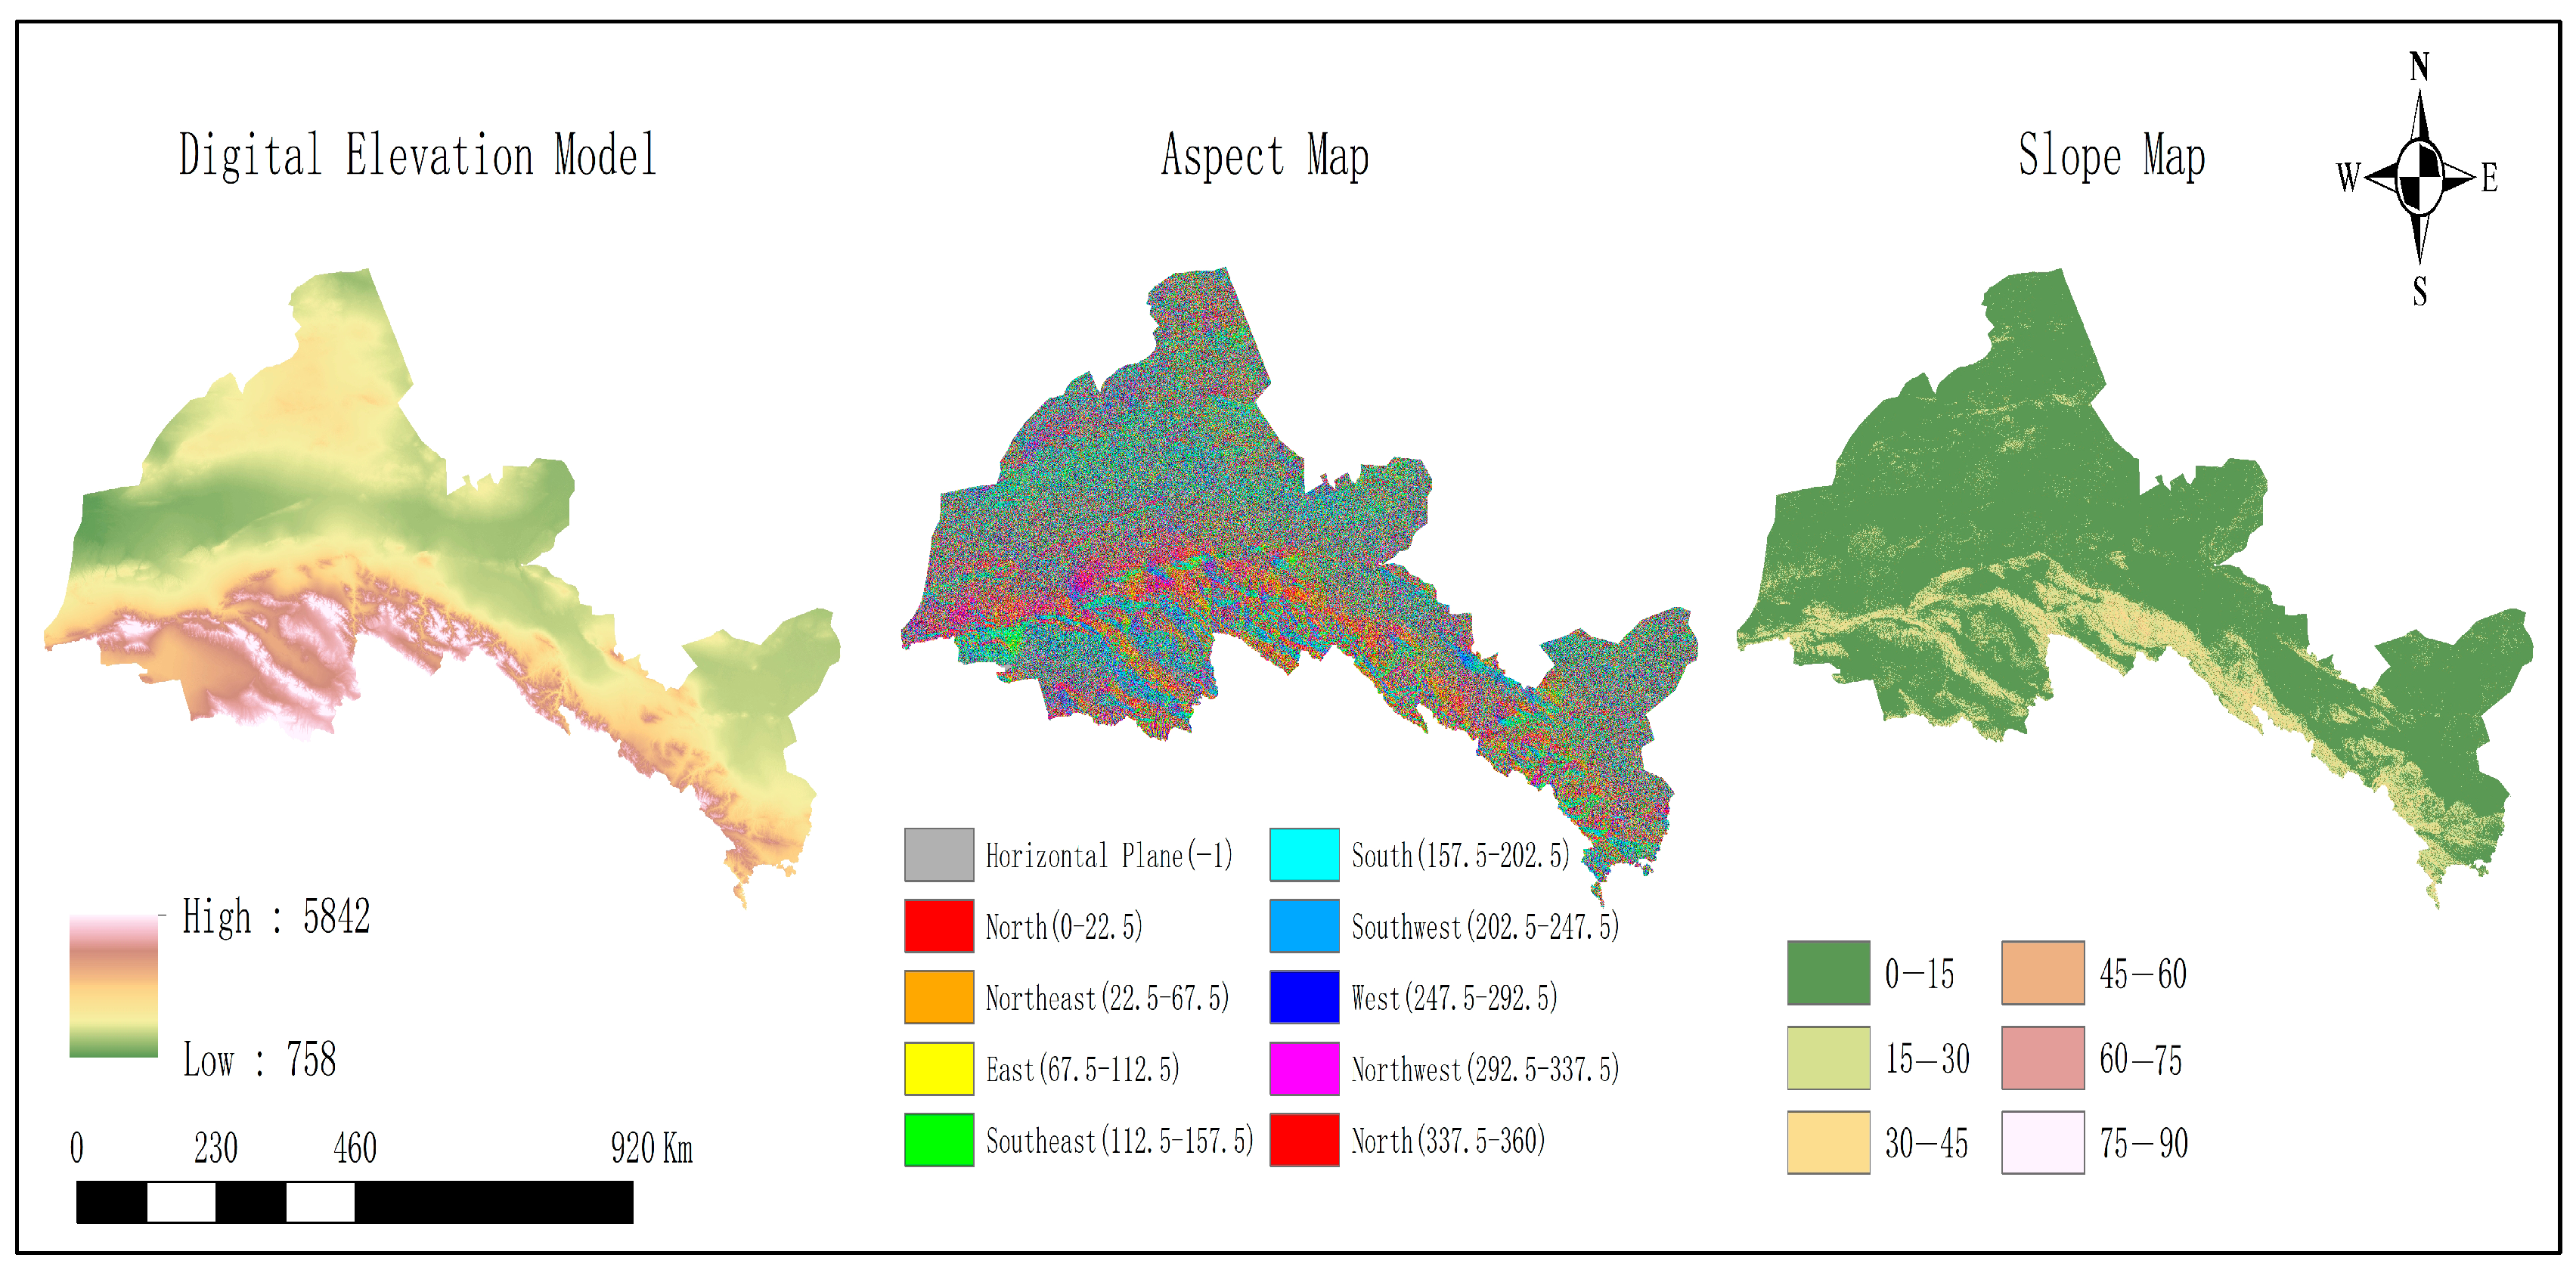
To effectively demonstrate the topographic intricacies of the Hexi region,
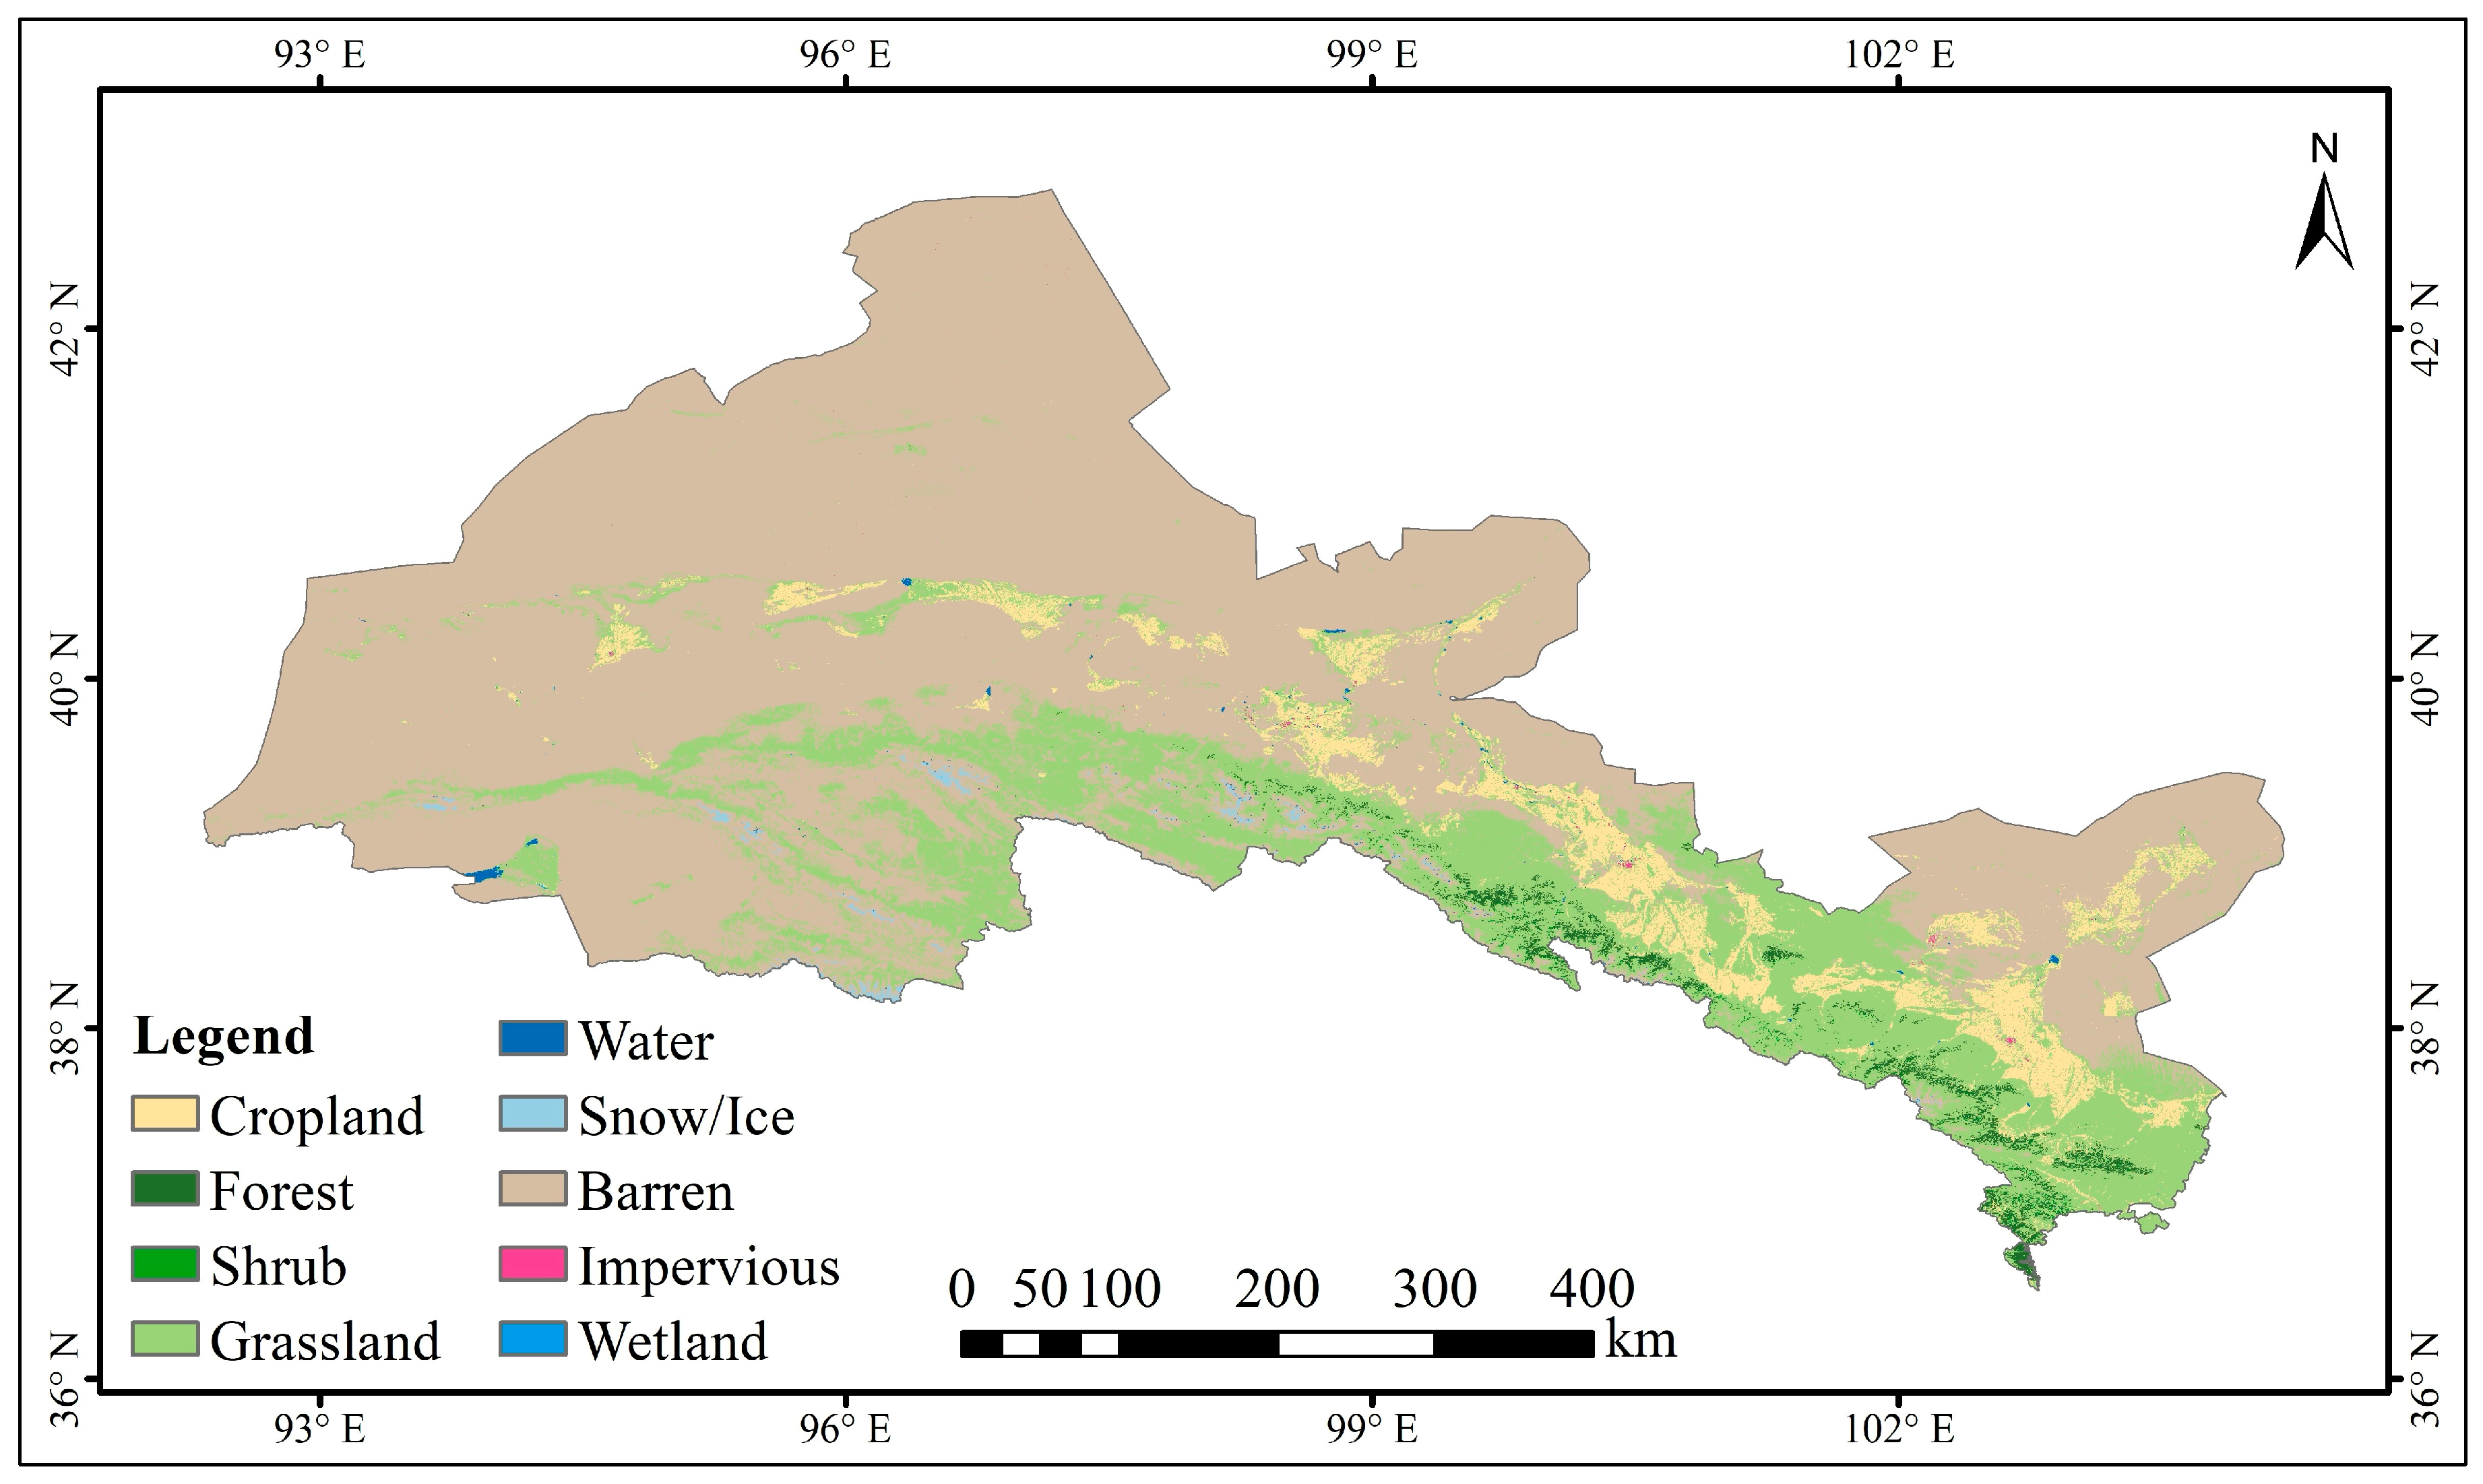
Figure 2 presents three distinct terrain analyses: elevation, aspect, and slope. The elevation analysis highlights the diversity in terrain height within the region, which ranges from 800 to 3000 m above sea level. The aspect analysis illustrates the orientation of the terrain, shedding light on how varying sunlight exposure across the study area can impact maize growth and classification accuracy. Meanwhile, the slope analysis reveals the gradient of the terrain, a crucial factor for understanding water drainage patterns and identifying potential challenges for crop cultivation in areas with steeper gradients. These topographic features significantly influence the accuracy of crop classification, as they are determinant factors for vegetation distribution, water accessibility, and overall environmental conditions. To further illustrate the agricultural land distribution within the study area,
Figure 3 presents a land cover map of the Hexi region derived from the 2020 version of the China Land Cover Dataset (CLCD), as shown in
Figure 3.
2.2. Data Sources and Preprocessing
This study employed the Google Earth Engine (GEE) platform to acquire satellite imagery from the European Space Agency’s Sentinel-1 and Sentinel-2 missions, focusing on the Hexi region of Gansu Province, China. To ensure consistency between the Sentinel-1 and Sentinel-2 data, all Sentinel-2 images were resampled to a 30 m resolution using bilinear interpolation for continuous bands and nearest-neighbor interpolation for categorical masks.
Table 1 shows the Sentinel-2 band information, including central wavelength and spatial resolution. Sentinel-1 images were also normalized to match the reflectance units of Sentinel-2 data. This preprocessing step was critical to ensure accurate feature comparison and fusion in subsequent analysis. To effectively capture the critical growth stages of maize, the research concentrated on specific time periods, selecting imagery from June, July, and August 2023. These months were chosen as they accurately reflect the growth characteristics of maize. To ensure data validity and high quality, median compositing was applied to the imagery for each time period. Specifically, the median value of each pixel across different time points was calculated to effectively mitigate interference from clouds and atmospheric noise. In the image preprocessing stage, the Fmask cloud detection algorithm is initially employed to eliminate cloud and cloud shadow areas, generating a cloud mask. Fmask leverages the spectral characteristics of Sentinel-2, specifically the blue band and shortwave infrared band, to effectively identify clouds and cloud shadows, thus ensuring the validity of the images. Subsequently, the median composite technique is utilized to process images from multiple time periods, mitigating the impact of cloud cover and atmospheric interference. This technique enhances the representativeness and stability of the imagery by calculating the median of each pixel across multiple time points, which eliminates noise and ensures an accurate reflection of vegetation conditions. After cloud removal and median composition, the imagery accurately represents the state of vegetation, free from the interference of cloud cover and climatic variations, thereby providing a robust data foundation for subsequent crop identification and monitoring.
Subsequently, multiple features were extracted from the imagery for each time period, including six traditional vegetation indices, six red-edge vegetation indices, and eight texture features. Furthermore, Sentinel-1’s VV and VH polarized radar imagery were integrated and subjected to filtering and noise reduction to minimize the impact of noise on classification results. The China Land Cover Dataset (CLCD) with a spatial resolution of 30 m and an overall accuracy of approximately 85% was employed to mask non-agricultural areas such as water bodies, forests, grasslands, and built-up land. This ensured that the subsequent analysis and classification were confined to agricultural land only.
The China Land Cover Dataset (CLCD), characterized by a spatial resolution of 30 m and an overall accuracy of approximately 85%, was employed to exclude non-agricultural regions, such as forests, urban areas, and water bodies. This methodology ensured that subsequent analyses focused exclusively on agricultural terrains. To maintain data consistency, Sentinel-2 imagery was resampled to a 30-m resolution using bilinear interpolation for continuous bands and nearest-neighbor interpolation for categorical masks. Furthermore, Sentinel-1 images were calibrated to align with the reflectance scale of Sentinel-2. These preprocessing procedures significantly enhanced the compatibility of data from various sources, thereby facilitating optimized feature extraction and reinforcing the reliability of classification results.
2.3. Sample Data
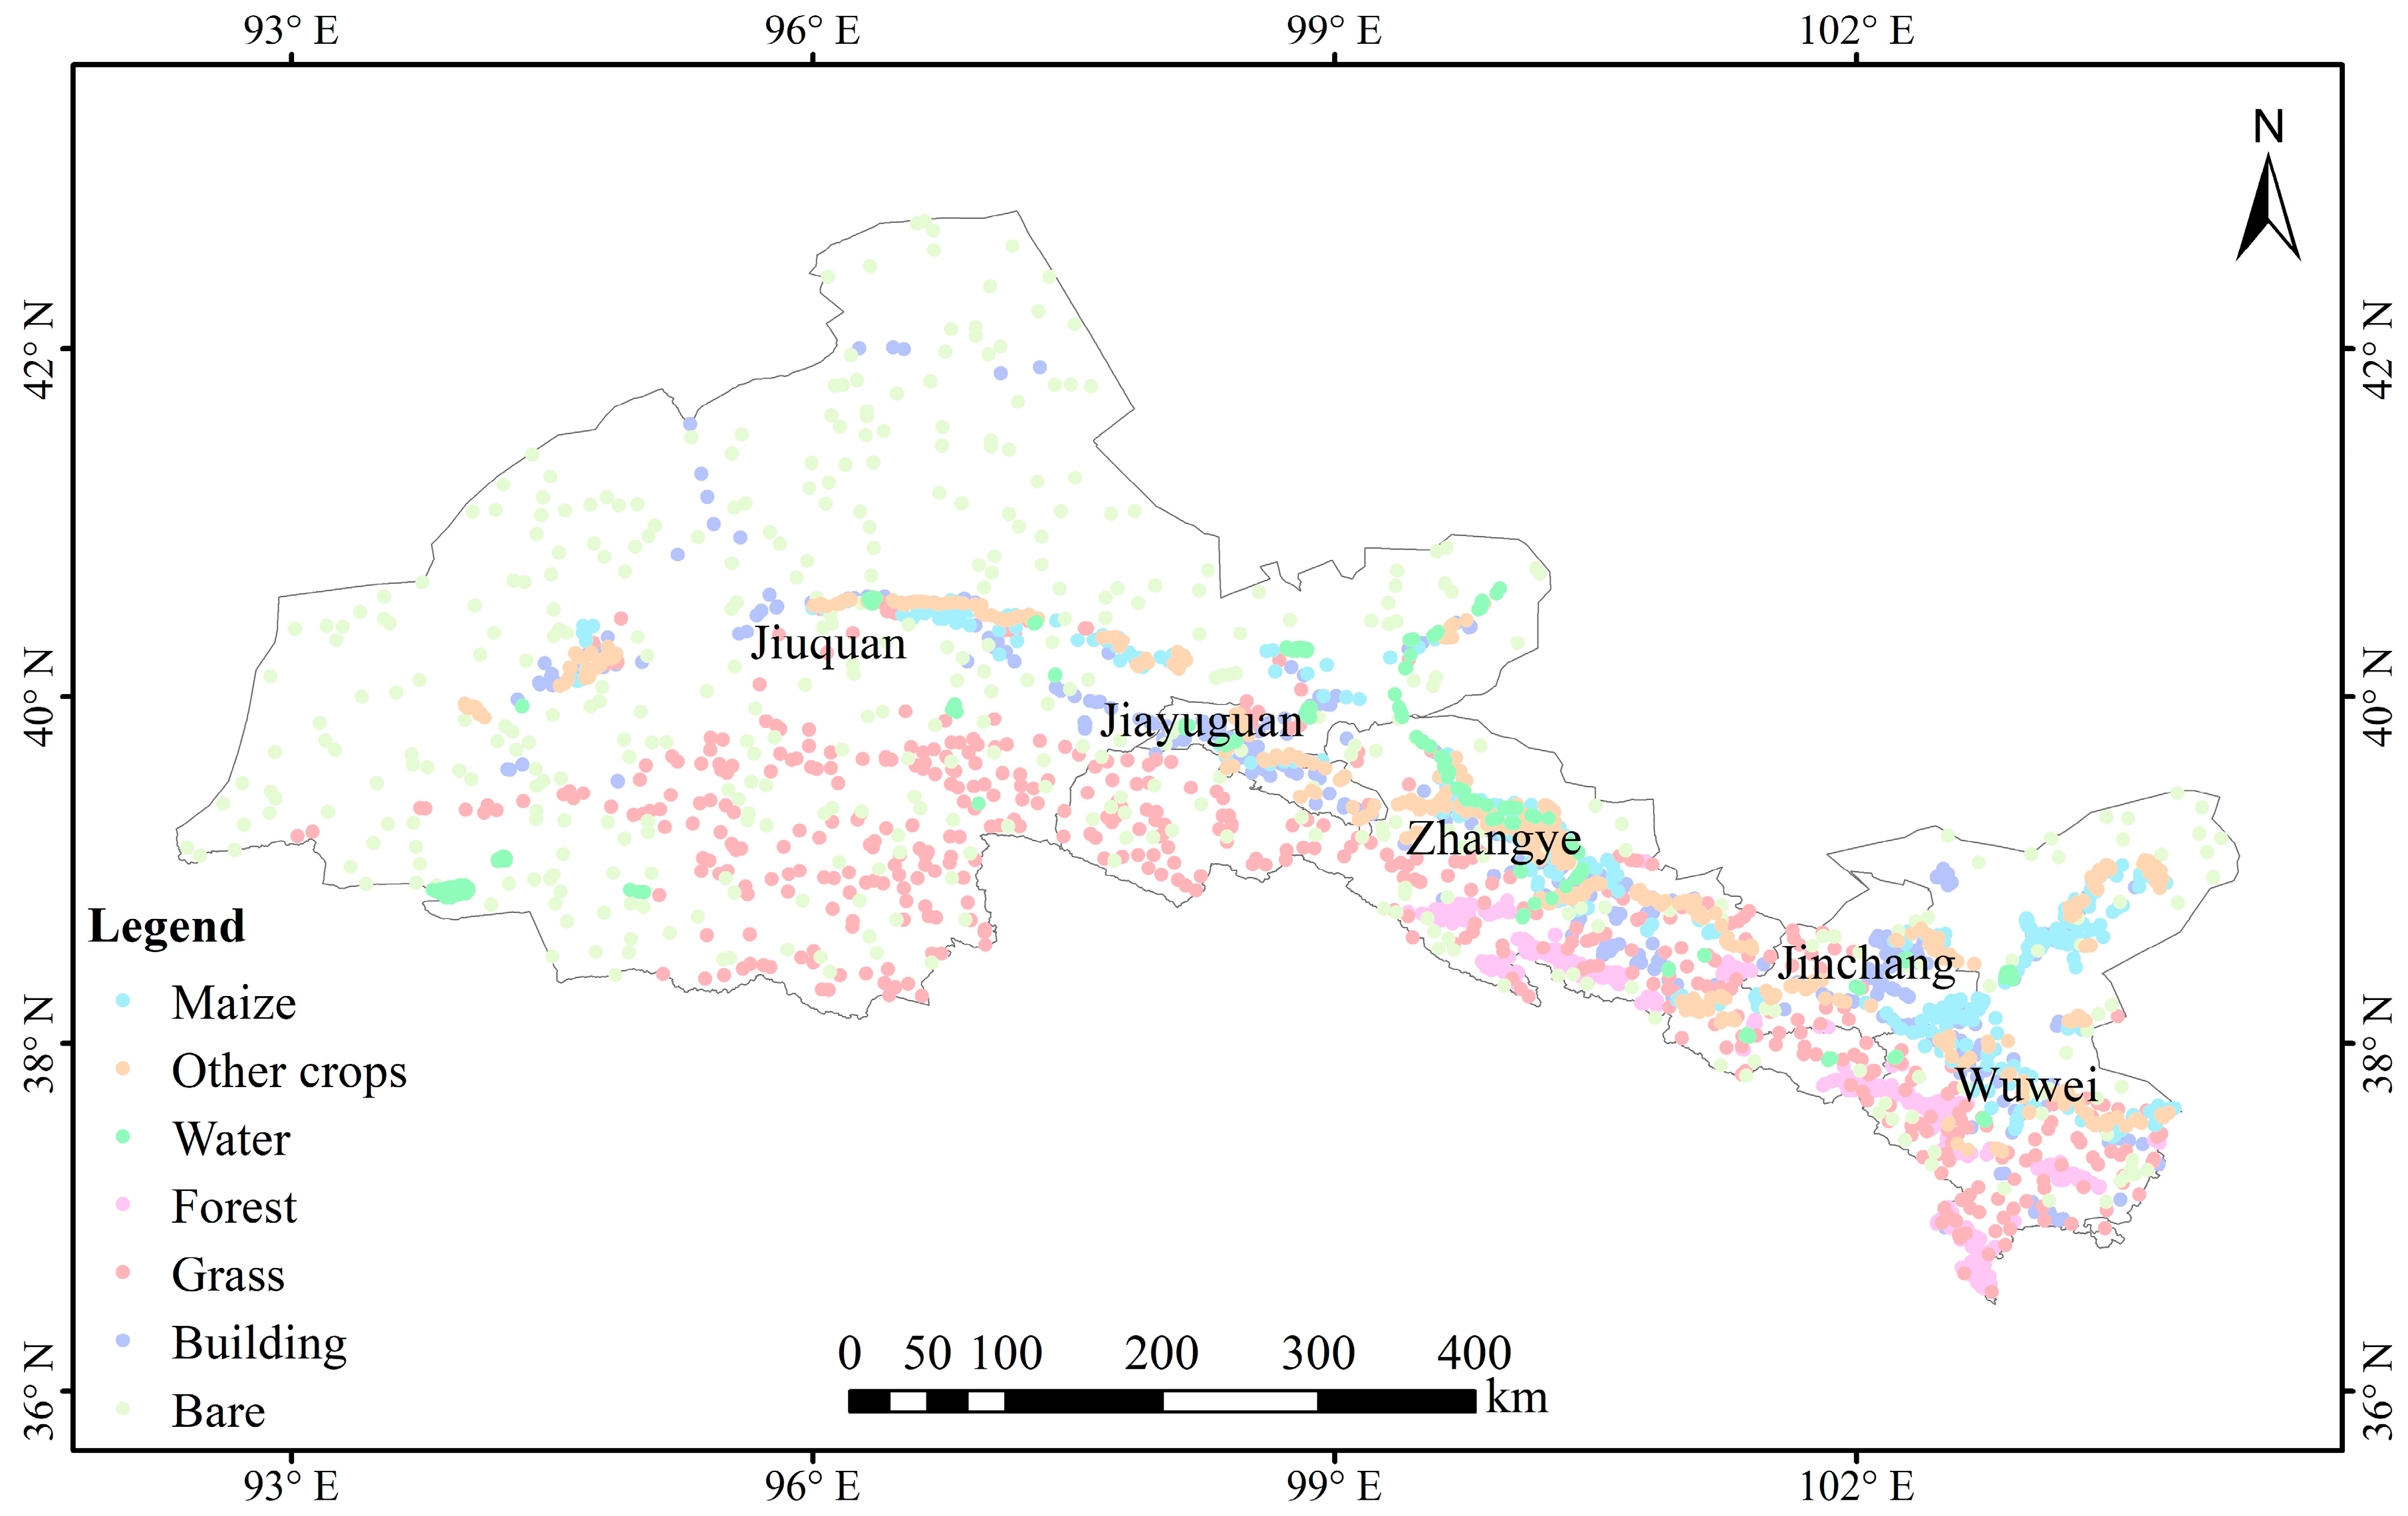
The sample data for this study consisted of two components: a field survey and high-resolution satellite imagery. The land cover types in the study area were classified into seven categories: maize, other arable crops, water bodies, forest land, grassland, construction land, and others. Ground surveys of arable crops were conducted from 20 July 2024 to 27 August 2024, encompassing a total of 3200 sample points for maize, with the spatial distribution of these samples illustrated in
Figure 4. For the remaining categories, samples were primarily obtained through visual interpretation of high-resolution Google satellite imagery during the same time frame, totaling 6800 sample points. To improve the reliability of these reference data, field verification was conducted at seven representative sites across the Hexi region, as shown in
Figure 4. Sampling surveys within these sites confirmed the accuracy of the visual interpretation, enhancing confidence in the classification results. A detailed quantitative assessment of the classification accuracy and validation of these visually interpreted samples is provided in
Section 3.4. Half of these sample points were allocated for training, while the other half were utilized to validate the accuracy of the classification results. Considering the specified research area of approximately 250,000 km
2, the maize sample dataset, which consists of 3200 points, corresponds to a spatial sampling density of approximately 0.011% of the total area. When evaluated against the cropland area defined by the CLCD dataset—approximately 61,000 km
2—the coverage of the sampling increases to roughly 0.047%. These figures indicate that there is sufficient spatial representation for modeling within extensive and diverse agricultural landscapes.
2.4. Feature Set Construction and Workflow
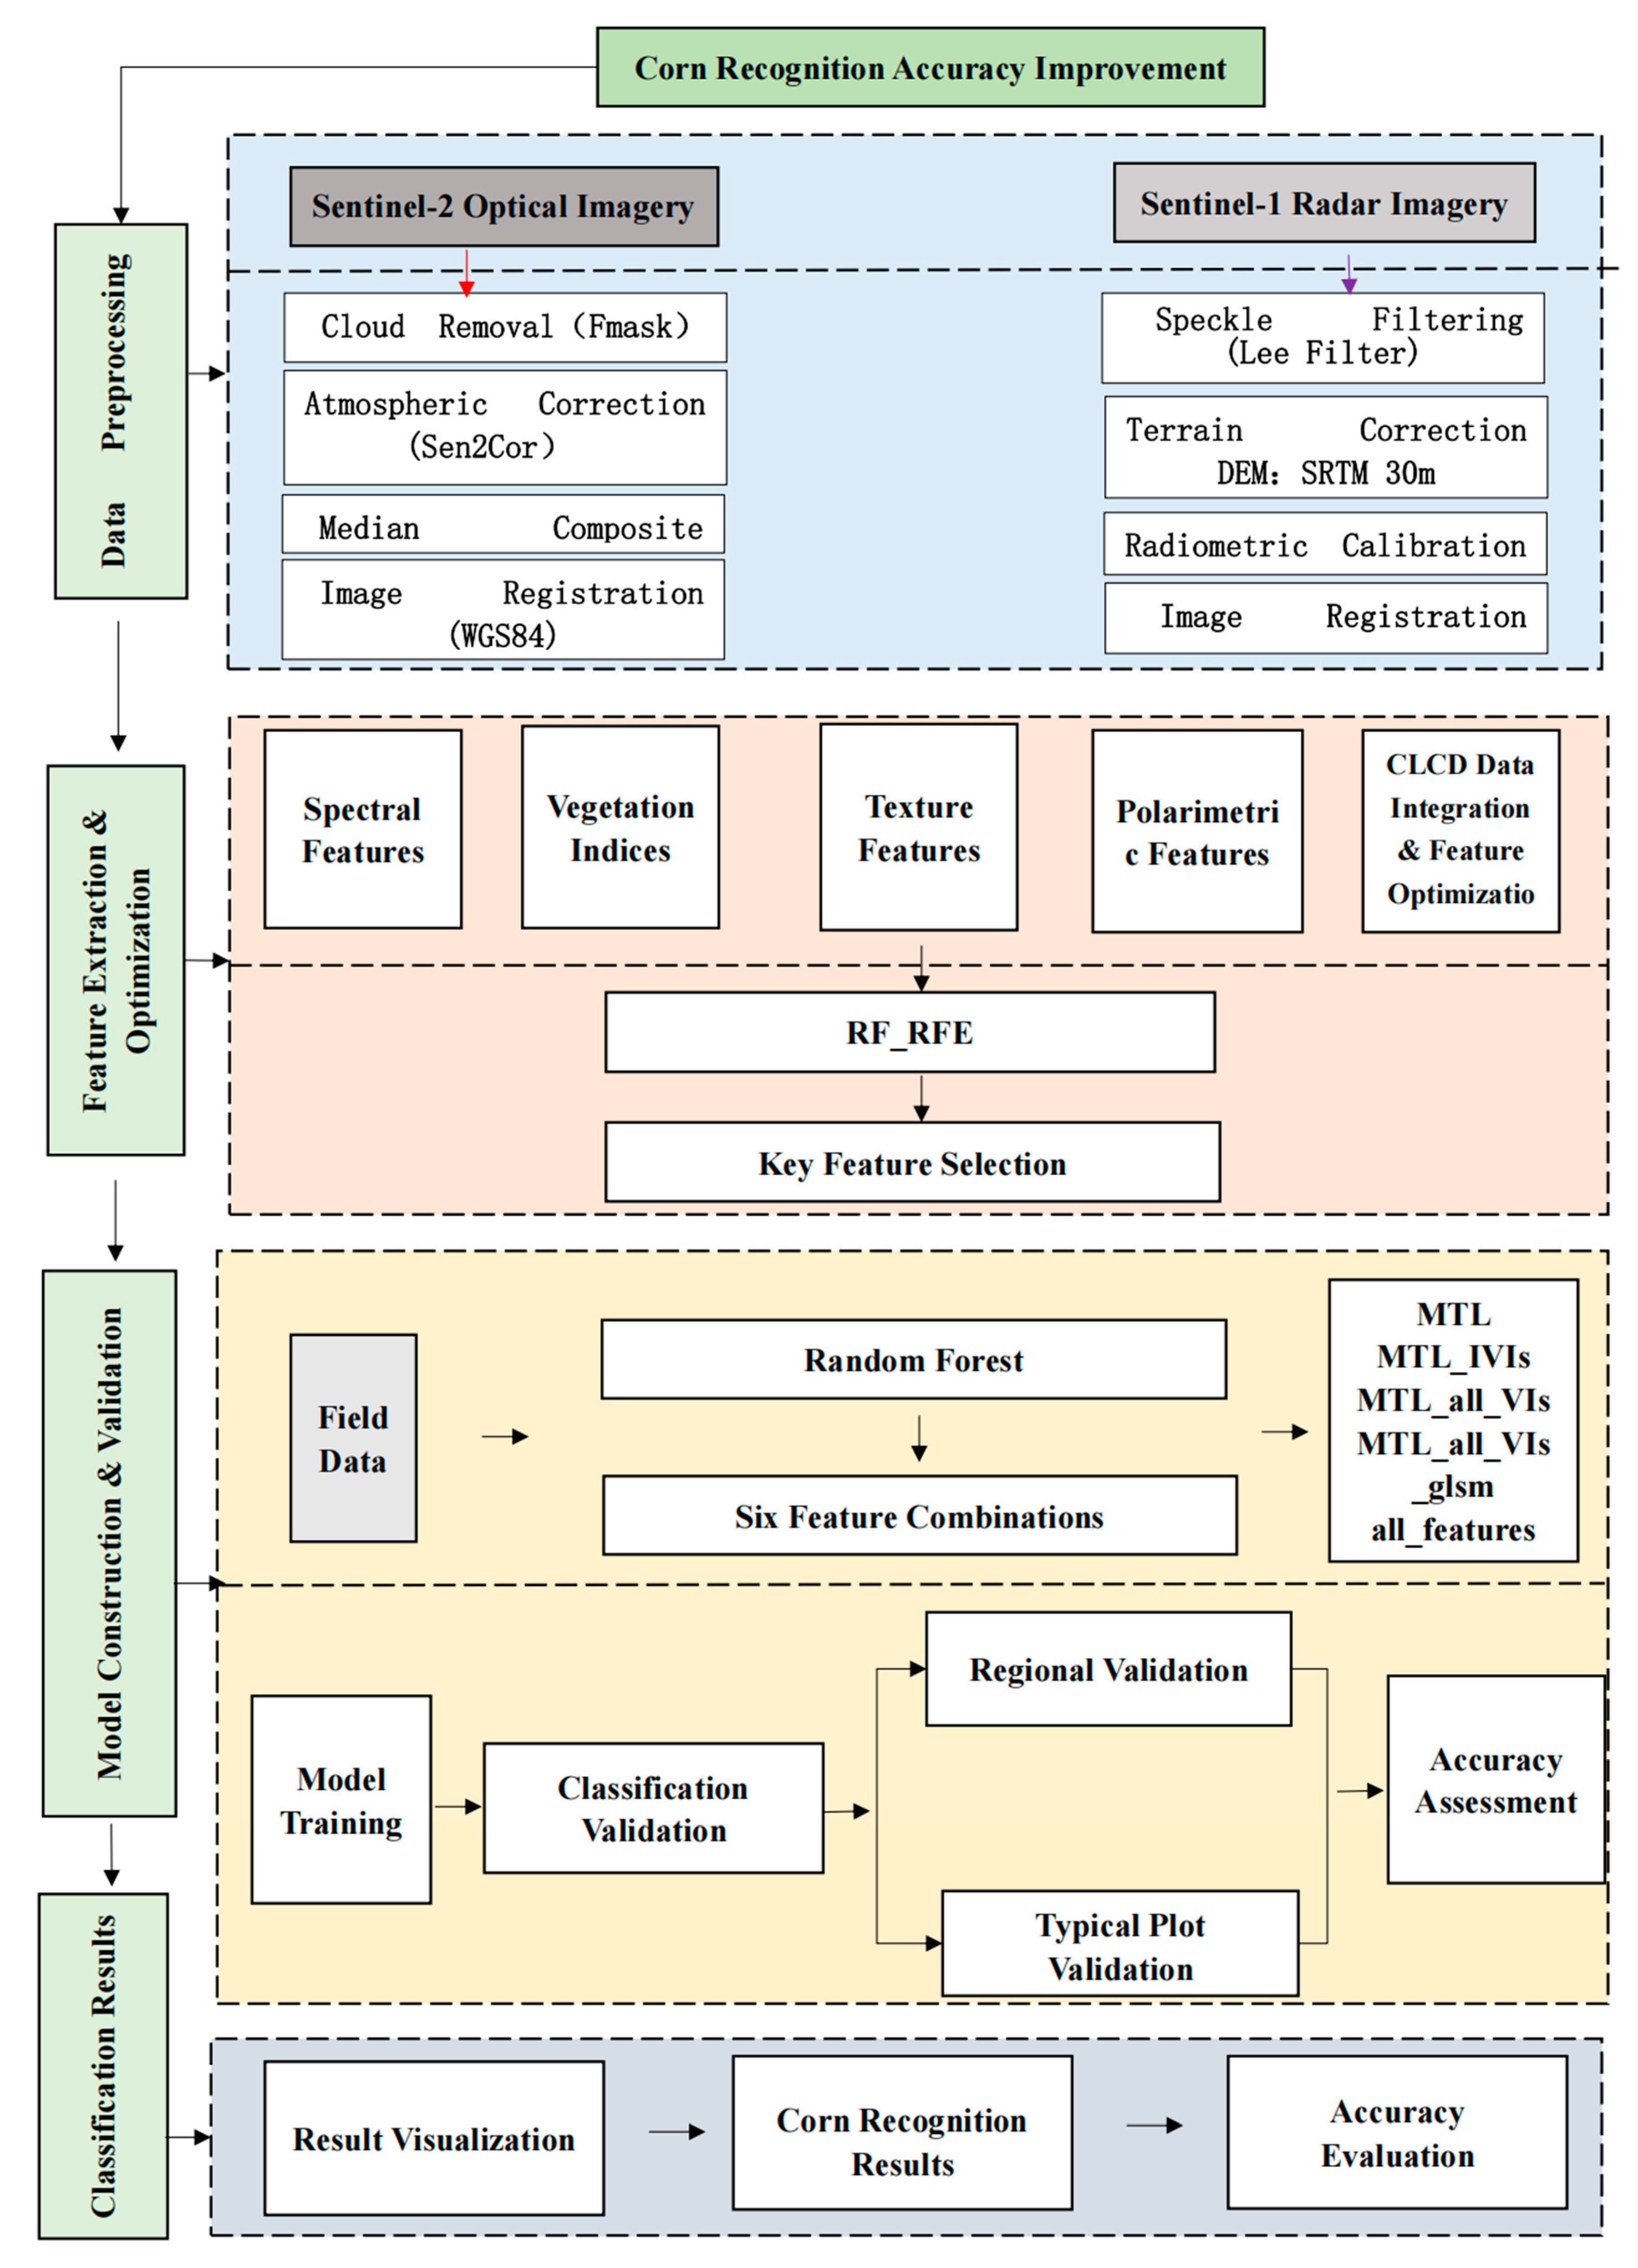
The workflow for the Sentinel-2-based maize identification study in the Hexi region is illustrated in
Figure 5. Initially, Sentinel-2 imagery and Sentinel-1 VV and VH polarized radar imagery covering the entire Hexi region were acquired through the Google Earth Engine (GEE) platform. These datasets underwent preprocessing steps, including median compositing, image filtering, and cloud removal. A total of 96 features were extracted, encompassing spectral, texture, and red-edge index features, among others. The recursive feature elimination random forest (RF-RFE) algorithm was employed to iteratively eliminate the least important features, and six distinct feature combination schemes were designed. Prior to applying random forest feature importance ranking, features exhibiting a Pearson correlation coefficient exceeding 0.95 were eliminated to mitigate multicollinearity. This process aids in preserving the most distinctive characteristics for classification, which consequently enhances the model’s robustness and its ability to generalize.
Although RF-RFE achieved a marginally reduced accuracy, it required significantly more computational time and memory. This observation underscores the efficiency advantages of the proposed optimized feature set approach. Through this process, the most effective features for maize identification were optimized and selected. Additionally, the confusion matrix method was utilized to evaluate the accuracy of the classification results, enabling an assessment of performance differences in maize identification across various feature combinations.
Feature Set Construction
In this study, a comprehensive feature set was constructed by integrating various types of remote sensing data and vegetation indices. Specifically, the ten spectral bands of Sentinel-2 were utilized to extract six traditional vegetation indices and six red-edge vegetation indices. These indices are detailed in
Table 2, where each feature’s contribution to maize classification is presented. For instance, the NDVI and EVI indices, which are widely used in vegetation monitoring, were selected for their effectiveness in reflecting vegetation health and biomass. Similarly, six red-edge indices, also outlined in
Table 2, were chosen due to their heightened sensitivity to vegetation chlorophyll content, which is particularly advantageous during the grain-filling stage of maize. Additionally, eight texture features were derived through image texture analysis methods, providing valuable insights into the spatial structural attributes of land cover types. These texture features, including GLCM and LBP, are described in
Table 2 and play a pivotal role in differentiating maize from other crops, especially in regions with similar spectral characteristics. To further enhance classification accuracy, Sentinel-1 radar data were incorporated. The VV and VH imagery, also listed in
Table 2, was selected for its capacity to complement optical data, thereby improving classification in areas with frequent cloud cover. Ultimately, this integration of diverse feature types—spectral, texture, and radar—resulted in a comprehensive feature set, as summarized in
Table 2, providing the classification model with rich input data and enhancing overall classification performance.
2.5. Feature Optimization Method
This study employed the random forest recursive feature elimination (RF-RFE) technique to screen features [
27]. This method is grounded in the random forest algorithm, which iteratively removes the least significant features to minimize redundancy in the feature space, thereby enhancing model accuracy. It assesses feature importance by training decision trees and evaluating their contributions to classification performance. Through this iterative process, the core features that influence classification outcomes are identified, optimizing the model and reducing the risk of overfitting. To enhance model stability and mitigate multicollinearity, features with Pearson correlation coefficients exceeding 0.95 were eliminated before evaluating feature importance. The identified key features not only improve the accuracy of maize identification in the Hexi region but also provide valuable insights for future research.
In each decision tree of the random forest, the Out-Of-Bag (OOB) data are utilized to compute its error (E1). Subsequently, noise is randomly introduced to the features of all OOB samples, and the OOB error (E2) is recalculated [
28]. Assuming the random forest comprises N trees, the importance rating (
IR) of a feature is determined using the following formula:
In the formula, IRj represents the feature importance score, E1 is the OOB error without noise interference, E2 is the OOB error after adding noise interference, and N is the number of decision trees in the random forest. If the OOB accuracy significantly decreases (i.e., E2 is notably greater than E1) after adding noise to a feature, it indicates that the feature has a substantial impact on the classification results, resulting in a higher importance score. Conversely, if the OOB accuracy remains relatively unchanged, the feature has a smaller impact on the classification results, leading to a lower importance score.
By ranking the features according to their importance scores from high to low and cumulatively adding them, one can determine the optimal number of features, thereby achieving feature optimization. This method effectively identifies the key features that significantly contribute to the classification results, optimizes the model, and mitigates the risk of overfitting.
Despite the extensive use of this combination in remote sensing and machine learning, its application for large-scale crop classification in arid zones using GEE-based workflows remains limited, which is the primary focus of this study.
2.6. Feature Combination Schemes
In this study, a meticulously designed feature combination strategy was employed to compare the effects of various feature sets on maize identification. Through comprehensive analysis, six schemes were established, ranging from single optical features to multi-dimensional combinations that integrate multi-source information, thereby presenting a hierarchical structure from simple to complex features. Each scheme was constructed based on distinct data sources and feature attributes, primarily to elucidate the contribution of each data feature to classification accuracy. Below is a detailed explanation of each feature combination.
- (1)
MTL: Sentinel-2 Optical Data Only
MTL utilizes the ten spectral bands of Sentinel-2 to classify maize by analyzing variations in surface reflectance. This method serves as a benchmark for comparison, highlighting the conventional optical classification approach and providing a reference point for evaluating more complex feature combinations;
- (2)
MTL_tVIs: Sentinel-2 Optical Data + Traditional Vegetation Indices
The MTL_tVIs method integrates six vegetation indices, including NDVI and EVI, to enhance the sensitivity of Sentinel-2 data to vegetation growth. This approach significantly improves the identification of maize, particularly during the growing season;
- (3)
MTL_all_VIs: Sentinel-2 Optical Data + Traditional Vegetation Indices + Red-Edge Vegetation Indices
The MTL_all_VIs introduces six additional red-edge vegetation indices to the conventional indices, thus enhancing the identification of maize by detecting subtle spectral variations at its peak growth stage. The incorporation of red-edge bands improves sensitivity to both chlorophyll and nitrogen levels, which are critical for distinguishing maize from various types of land cover;
- (4)
MTL_all_VIs_glsm: Sentinel-2 Optical Data + Traditional Vegetation Indices + Red-Edge Vegetation Indices + Texture Features
The MTL_all_VIs_glsm method integrates spectral features, red-edge features, and texture characteristics, including GLCM and LBP, to effectively capture the spatial and structural attributes of land cover. This technique significantly enhances the identification of maize, particularly in areas with mixed land cover [
29];
- (5)
All_features: Sentinel-2 Optical Data + Traditional Vegetation Indices + Red-Edge Vegetation Indices + Texture Features + Sentinel-1 Radar Data
All features incorporate every available attribute, including optical data from Sentinel-2, red-edge characteristics, texture features, and radar information from Sentinel-1. The inclusion of radar data effectively addresses the limitations of optical data when cloud cover is present. Moreover, the integration of multi-source information enhances the accuracy of classification;
- (6)
Optimized Feature Set:
In this study, among the six combinations of features developed, one particular optimized group—optimized feature set—was introduced to achieve a balance between classification accuracy and computational efficiency. This group incorporates the most distinct features from various categories, sourced through a recursive feature elimination methodology that utilizes random forest importance rankings alongside redundancy filtering. Unlike traditional feature selection methods, this approach first eliminates highly correlated variables to mitigate multicollinearity, subsequently selecting the top 30 features by identifying the inflection point in the curve of importance scores. The selected features encompass spectral indices, red-edge vegetation indices, texture descriptors, and radar metrics, thereby ensuring both representativeness and minimal redundancy.
The six frameworks, which range from singular optical data to feature sets derived from multiple remote sensing sources, provide numerous advantages. Methods for feature integration vary from basic techniques to more sophisticated combinations of data from diverse origins. Multi-task learning (MTL) utilizes baseline optical data as a reference for comparing various feature sets. MTL that incorporates vegetation indices (MTL_tVIs) enhances sensitivity and facilitates more accurate vegetation classification. Conversely, MTL that considers all vegetation indices (MTL_all_VIs) improves crop recognition by including red-edge indices, which are particularly beneficial in regions with high crop density. To further enhance classification precision, MTL_all_VIs_glsm incorporates texture features, which are crucial in areas with varied land cover. The all_features approach employs every available feature, maximizing the advantages of multi-source data and achieving improved classification results in regions characterized by complex land cover diversity.
In comparison to alternative methods, the optimized feature set subset demonstrates enhanced effectiveness regarding both accuracy and efficiency. By concentrating on the most pertinent features from various data sources, it minimizes computational demands without compromising classification accuracy. This optimized configuration enables the deployment of lightweight models, making it suitable for extensive crop monitoring activities in resource-limited or diverse environments.
2.7. Classification Model
In this study, the performance of the random forest model was optimized through hyperparameter tuning. A grid search was conducted to identify the optimal combination of the number of trees (n_estimators) and the maximum depth (max_depth). The search was performed within the ranges of 100 to 500 trees for n_estimators and 10 to 50 for max_depth, selecting the combination that maximized validation accuracy. This tuning process aimed to achieve optimal classification performance by balancing model complexity and accuracy while mitigating overfitting. The optimized random forest model was subsequently employed for feature selection and classification tasks, thereby contributing to improved accuracy of the results.
The model’s efficiency experienced a significant enhancement due to the optimization of feature selection. By reducing the dimensionality of features by 69%, processing time was decreased by 62.5%, and memory consumption declined by 66.7%. This optimization not only enhances computational efficiency but also improves the model’s scalability, making it suitable for extensive applications, particularly in cloud computing environments such as the Google Earth Engine (GEE). These advancements ensure that the model can function effectively in resource-limited situations while maintaining excellent classification performance.
The random forest algorithm, which is a type of ensemble learning, performs classification tasks by leveraging multiple decision tree models trained concurrently [
30]. During the training process, each decision tree was trained on a random subset of the data, which increases the model’s diversity and stability [
31]. The predictions from all decision trees were then aggregated using a voting mechanism to determine the final classification. The random forest algorithm is known for its strong generalization capabilities and its ability to handle high-dimensional and complex feature sets. This made it an ideal choice for feature classification in this study, significantly improving both classification accuracy and reliability.
This methodology is designed to address the challenges posed by complex topography and varying elevation ranges. Specifically, the integration of Sentinel-1 radar data with Sentinel-2 red-edge bands enhances the capability to monitor crops under diverse environmental conditions. The backscatter from the Sentinel-1 radar effectively mitigates the data gaps in optical observations caused by cloud cover, while the red-edge bands of Sentinel-2 exhibit heightened sensitivity to subtle variations in vegetation. This sensitivity is particularly critical in regions characterized by heterogeneous terrain and fluctuating elevation. The findings of this study provide a pragmatic solution for intelligent farmland management, especially in areas with challenging topographic features [
32].
In this study, the random forest recursive feature elimination (RF-RFE) method was employed for feature selection. RF-RFE systematically eliminates the least significant features, thereby ensuring that only the most pertinent features are preserved for classification purposes. This approach is notably effective in diminishing dimensionality while upholding classification accuracy. When compared to alternative feature selection techniques, RF-RFE proves especially advantageous in contexts involving high-dimensional data.
2.8. Accuracy Assessment
This study employed four commonly used metrics to evaluate the accuracy of the classification results: overall accuracy (OA), user’s accuracy (UA), producer’s accuracy (PA), and the Kappa coefficient. The dataset was divided into training and validation sets, allocating 70% of the samples for training and 30% for validation. The classification accuracy was assessed using overall accuracy (OA), Kappa coefficient, and both producer’s and user’s accuracies. Additionally, the confusion matrix was generated to evaluate the model’s performance in terms of accurately classified pixels. Overall, accuracy reflects the overall classification performance and serves as a simple and intuitive metric. User’s accuracy describes the probability that a randomly selected sample from the classification results will have a class label consistent with the actual ground truth label [
33]. In contrast, producer’s accuracy indicates the probability that the reference data of a certain class are correctly classified; it is defined as the ratio of the number of correctly classified samples to the total number of samples assigned to that class by the classifier [
34].The Kappa coefficient measures the agreement between the actual and predicted values. In this study, half of the samples in the test set were utilized as validation data, and the classification results were evaluated using a confusion matrix. By comparing and analyzing the classification accuracy, the performance of maize identification under different feature combinations was comprehensively assessed, thereby ensuring the reliability of the research results.
3. Results
3.1. Feature Importance Analysis
In the pursuit of high-accuracy classification results, optimizing feature selection is crucial. Incorporating an excessive number of features may lead to overfitting, where the model performs exceptionally well on training data but poorly on test data. Furthermore, utilizing too many features can increase computational costs and prolong training time. Therefore, it is essential to select the most critical features for analysis. In this study, a total of 96 features across three time periods were selected for research on maize identification accuracy. The importance scores of these features are illustrated in
Figure 6, where features for each period are distinguished by month suffixes.
Based on the ranking of feature importance, the highest-scoring features are predominantly concentrated within the top 30 features, exhibiting significant variations in importance among the feature variables. The scoring results reveal that within this subset, six features are derived from traditional vegetation indices, twelve from Sentinel-2 spectral bands, three from radar data, and nine from red-edge vegetation indices.
Table 3 categorizes these findings by month, indicating that August contributed the most significant features (17), followed by July (6) and June (7). From a temporal distribution perspective, features in June are primarily characterized by spectral bands and traditional vegetation indices, reflecting vegetation cover and moisture conditions during the early growth stage of crops. In July, red-edge indices gain prominence, illustrating changes in chlorophyll and nitrogen content during the mid-growth stage. By August, both spectral and red-edge indices are abundant, providing a comprehensive reflection of biomass, chlorophyll, and moisture conditions during the late growth stage of crops. August marks the grain-filling stage for corn, during which the red-edge band (705–865 nm) is particularly sensitive to chlorophyll content in leaves and the canopy structure. The Sentinel-2 satellite’s B5 (705 nm) and B6 (740 nm) red-edge bands effectively capture variations in nitrogen uptake and photosynthetic efficiency, thereby serving as critical features for differentiating corn from other crops. The variability in feature contributions throughout this temporal dimension is closely linked to the growth cycle of corn, emphasizing the significance of spatiotemporal variation for classification models.
In the feature optimization scheme, the proportions of different types of features among the top 30 important features are shown in
Table 4. Spectral features and red-edge index features contribute the most, with optimized proportions of 40% and 50%, respectively. These features effectively capture the spectral characteristics and growth status of crops. Radar features comprise 50% of their category among the optimized features, compensating for the limitations of optical data under cloudy conditions and significantly improving classification accuracy. Traditional vegetation indices make up 33.4% of the optimized features, effectively reflecting crop growth status and health levels, particularly during the early growth stages of maize. Changes in vegetation indices can well characterize growth conditions, thereby influencing the performance of the classification model. Notably, texture features are absent among the top 30 important features, which may indicate that maize and other crop fields share similar spatial structures.
The spectral bands of Sentinel-2 effectively capture the physiological characteristics of maize, including chlorophyll content and photosynthetic activity. These bands play a crucial role in assessing crop health. Notably, the red-edge bands, such as B5_8 and B6_6, are critical for identifying and distinguishing dense vegetation, allowing for the differentiation of maize from other crops. Additionally, red-edge vegetation indices significantly reflect leaf nitrogen content and photosynthetic efficiency during the mid-growth stage of maize, further enhancing the distinction between maize and other crops.
3.2. Feature Optimization Results
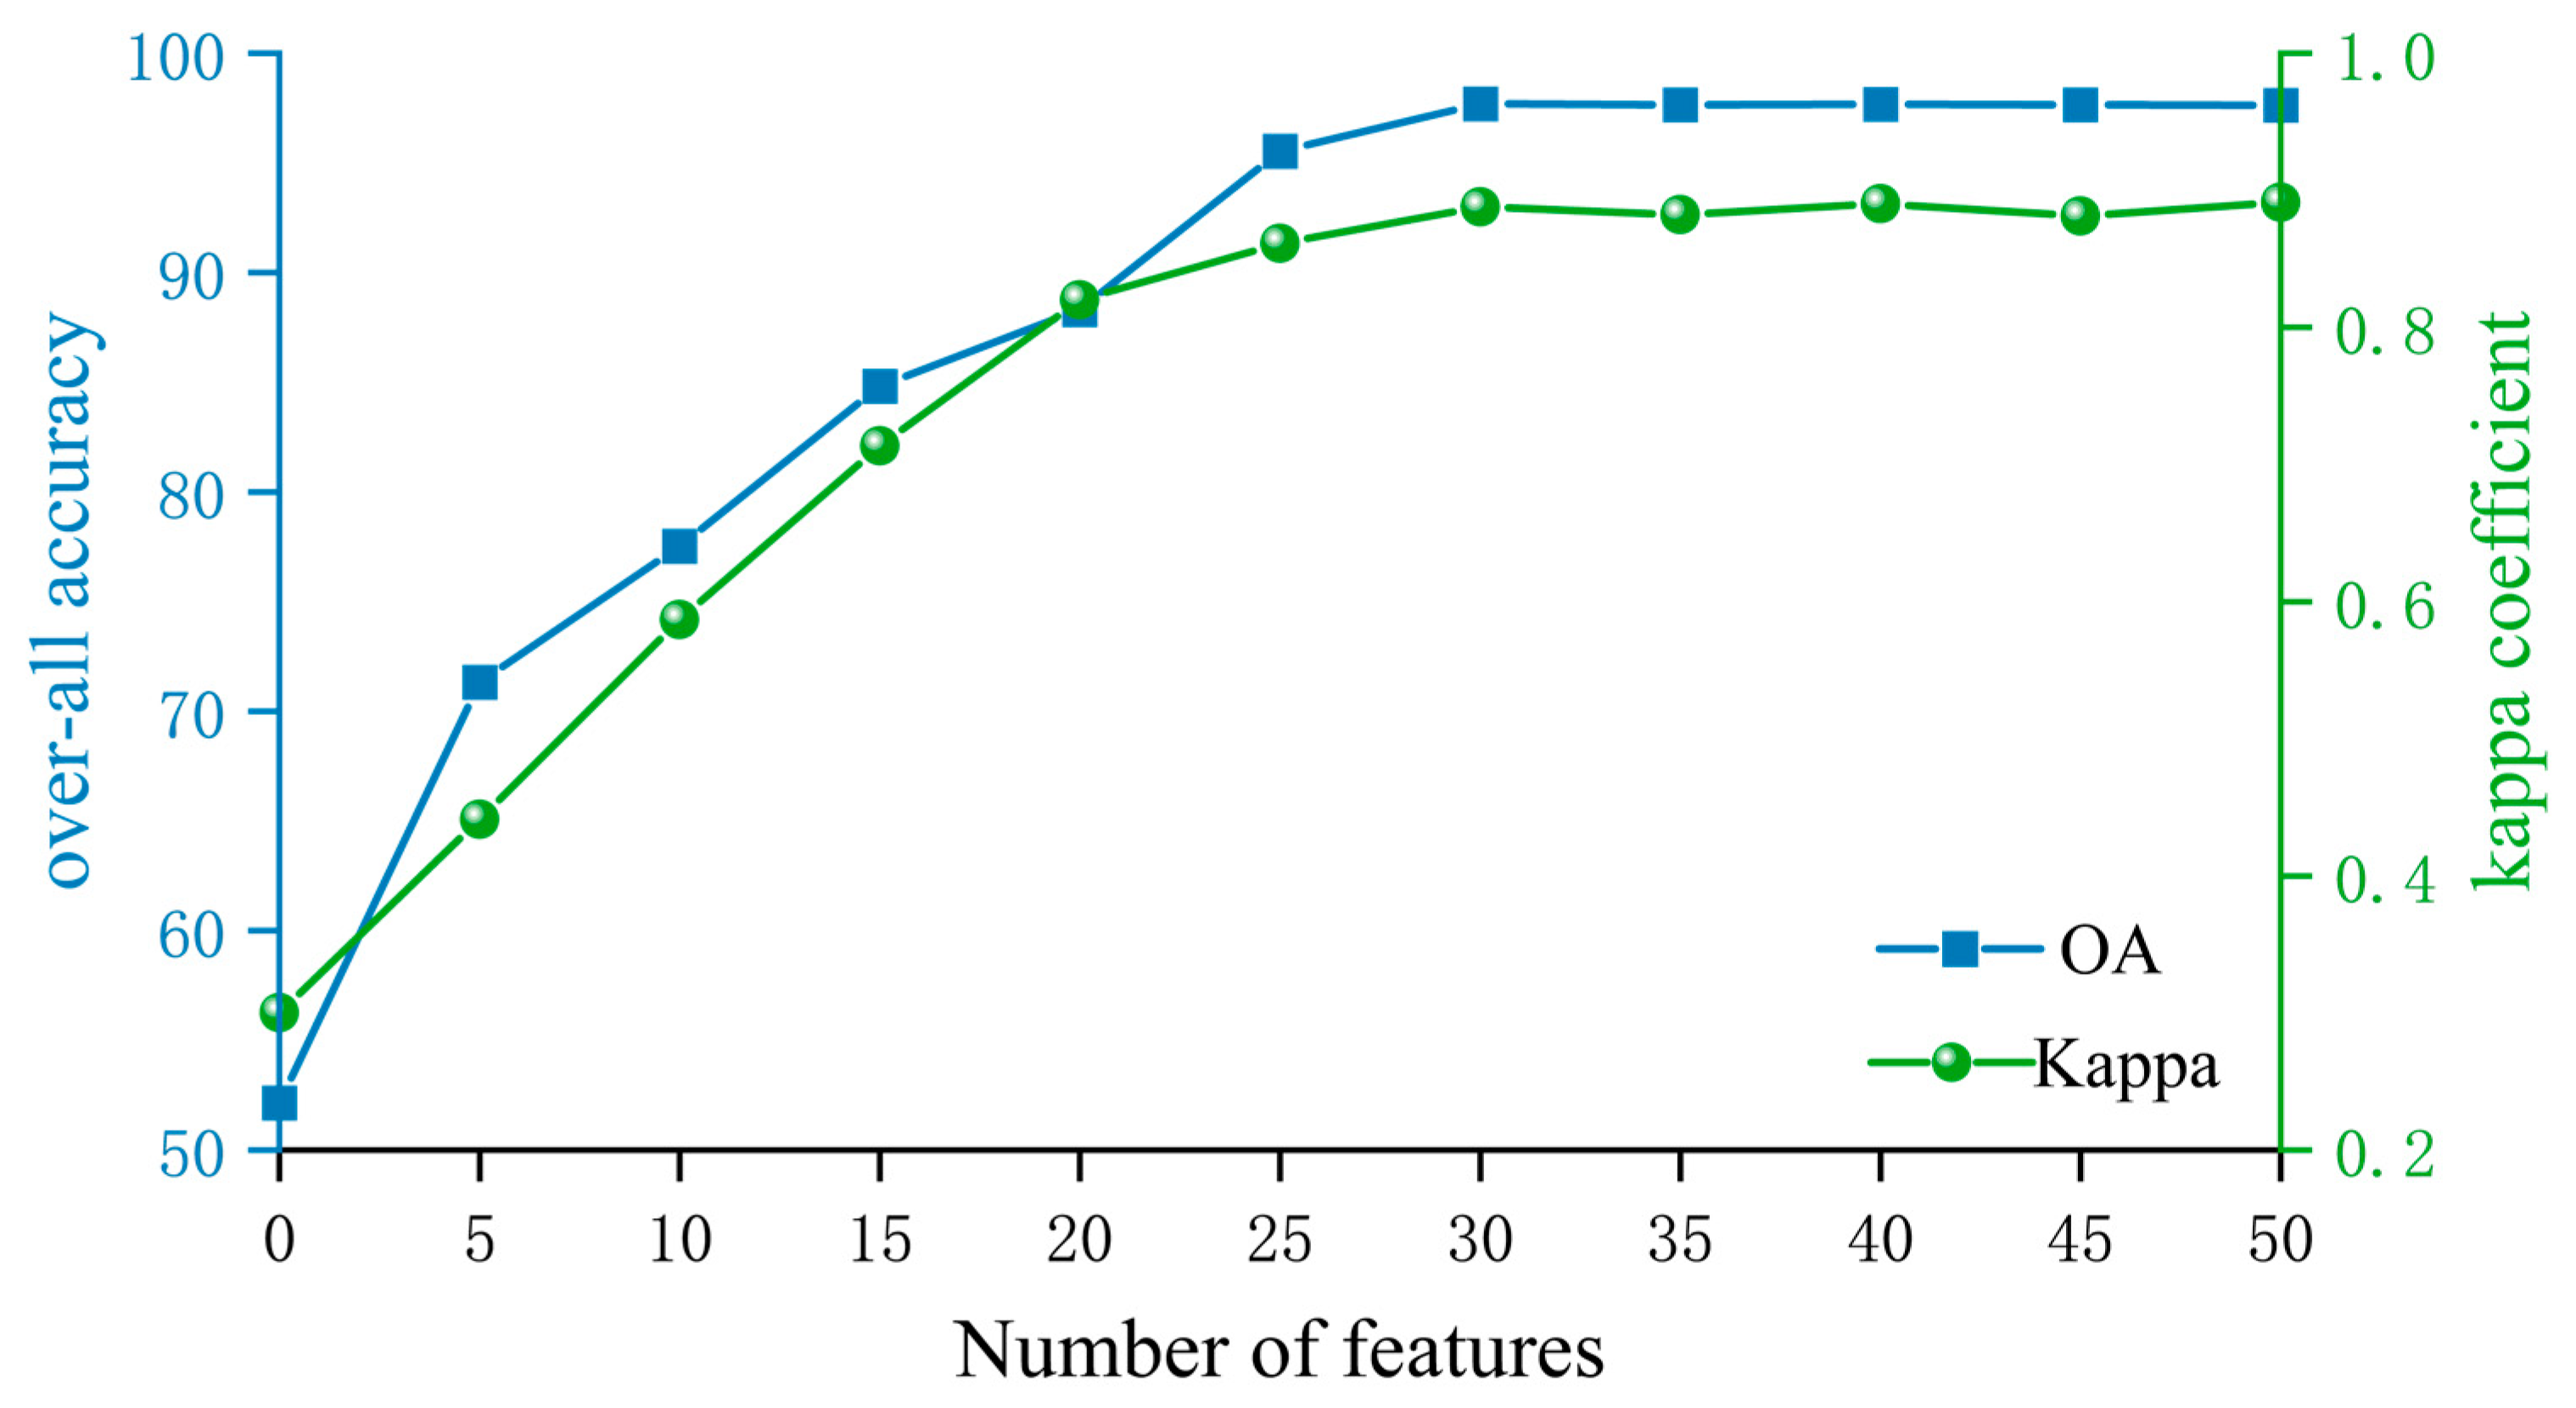
To enhance the accuracy of maize identification based on Sentinel-2 imagery, this study employed a feature optimization method that incrementally increased the number of features while recording the trends in producer’s accuracy (PA) and the Kappa coefficient (as illustrated in
Figure 7). As depicted in
Figure 7, when the number of features increased to 30, PA improved from 95.00% to 97.69%, and the Kappa coefficient rose from 0.850 to 0.8878. This indicates that the increase in the quantity of features significantly enhanced classification accuracy. However, when the number of features exceeded 30, the improvements in PA and the Kappa coefficient plateaued, with only minor fluctuations observed. This suggests that an excessive number of features may introduce redundancy and contribute minimally to further accuracy gains. At 30 features, both PA and the Kappa coefficient reached relatively high levels, indicating that this feature count represents the optimal choice. Further increasing the number of features did not significantly improve accuracy; instead, it increased computational complexity.
Based on the feature importance analysis, this study identified the top 30 features contributing the most to maize identification, including spectral bands from Sentinel-2 imagery, red-edge vegetation indices, and texture features. These optimized features not only effectively capture the growth characteristics of maize but also avoid the interference of redundant features on the model, enhancing the generalization ability and stability of the classification model.
In summary, feature optimization not only ensures high accuracy but also significantly reduces the number of features, thereby improving model efficiency and practicality. This approach offers an effective feature combination scheme for maize identification.
3.3. Comparison of Feature Combination Schemes
This study evaluates the accuracy of maize identification across six feature combination schemes, with the accuracy statistics for each scheme presented in
Table 5. The results indicate that when utilizing only spectral data (MTL scheme), the classification achieves a producer’s accuracy (PA) of 97.69%, a user’s accuracy (UA) of 96.54%, and a Kappa coefficient of 0.8638. Although spectral data alone captures fundamental land cover characteristics, its capacity to distinguish complex crop types is limited. The inclusion of traditional vegetation indices enhances classification accuracy, while the further incorporation of red-edge indices provides only marginal improvements. Texture features also contribute to classification accuracy; however, their impact remains relatively modest.
The accuracy of the classification was assessed utilizing overall accuracy, the Kappa coefficient, and both producer’s and user’s accuracy metrics. A total of 2000 sample points were randomly selected from the complete dataset for validation purposes. The classification performance in complex terrain was enhanced through the optimization of feature selection and model parameters.
The highest classification accuracy was achieved using all 96 features; however, this approach compromises computational efficiency. By employing the RF-RFE feature optimization algorithm, which selects the top 30 most important features, the final feature set attains accuracy comparable to that of the full feature set while significantly decreasing the number of features. This reduction in features results in faster computation without sacrificing classification performance.
The random forest classifier exhibits significant resilience to collinearity, enabling the model to sustain high accuracy even when presented with highly correlated input features [
35]. This characteristic renders random forest particularly advantageous for high-dimensional datasets, especially in comparison to other machine learning techniques, such as support vector machines (SVM), which may suffer from performance degradation under similar conditions [
36].
3.4. Classification Accuracy Verification and Validation of Visually Interpreted Non-Crop Samples
3.4.1. Source and Method of Validation Data
The validation data utilized in this study were sourced from two primary origins. First, seven representative field sites were selected within the study area, where actual land surface information was gathered through on-site surveys and direct observations. Second, authoritative land cover datasets served as supplementary reference materials. During the visual interpretation process, remote sensing imagery was meticulously analyzed and interpreted based on multisource data and land surface characteristics. These interpretations were subsequently cross-verified and validated using the aforementioned reference data to ensure the accuracy and representativeness of non-crop samples. The validation samples encompassed various land cover types, including maize, other crops, forests, grasslands, water bodies, built-up areas, and additional categories, thereby ensuring a comprehensive and scientifically robust classification evaluation.
3.4.2. Accuracy Assessment Metrics
The classification accuracy was evaluated using a confusion matrix, where the rows represent the reference (ground truth) classes and the columns represent the predicted classes. Based on the confusion matrix, we calculated user’s accuracy (UA), producer’s accuracy (PA), overall accuracy (OA), and the Kappa coefficient. UA reflects the proportion of correctly classified pixels among those labeled as a specific class in the classification results, while PA indicates the proportion of actual reference samples of a class that were correctly identified. OA provides an overall measure of classification correctness, and the Kappa coefficient quantifies the statistical agreement between the classification results and the reference data, accounting for chance agreement.
3.4.3. Classification Results and Analysis
Detailed classification results are presented in
Table 6,
Table 7 and
Table 8.
Table 6 displays the confusion matrix, which illustrates the classification outcomes for each land cover class. For maize, the producer’s accuracy (PA) reached 97.2%, while the user’s accuracy (UA) was 96.8%, indicating that the majority of maize samples were accurately classified with minimal misclassification. For other crops, as well as forest, grassland, and non-crop classes, both PA and UA remained above 95%. The water and built-up classes demonstrated even higher accuracies, with PA and UA reaching 99.4% and over 98%, respectively. This reflects their distinct spectral and structural features that facilitate easy discrimination.
Table 7 provides a comprehensive summary of user accuracy (UA) and producer accuracy (PA) for all classes, offering a clear quantification of the distribution of classification errors. The consistently high values of UA and PA across all classes reflect the accuracy and stability of the classification results, thereby effectively supporting subsequent crop mapping and land use analysis.
Table 8 presents the overall accuracy and Kappa coefficient, which reached 92.5% and 0.87, respectively. The overall accuracy (OA) reflects the proportion of correctly classified samples among the total validation samples. Meanwhile, the Kappa coefficient, a statistical measure of agreement, confirms that the classification significantly outperforms random assignment, thereby ensuring strong reliability.
In conclusion, these results validate the effectiveness of the proposed multi-source remote sensing data fusion and optimized feature selection method in achieving high-precision classification of both maize and non-crop land cover types in the Hexi Corridor.
3.5. Regional Classification Results
The evaluation of classification accuracy was performed using overall accuracy, the Kappa coefficient, and both producer’s and user’s accuracies, leveraging a validation dataset comprising 2000 sample points. The model achieved an overall accuracy of 97%, indicating a significant enhancement in classification performance attributed to the optimized feature selection process.
Figure 8 illustrates the classification results for seven selected locations within the Hexi region. These results exhibit varying levels of accuracy, ranked from highest to lowest as follows: Zhangye Points 1 and 2 > Jinchang Point 1 > Wuwei Points 1 and 2 > Jiuquan Points 1 and 2.
In Zhangye, where the terrain is flat, farmland is concentrated, and maize grows under favorable conditions, the optimized scheme performed exceptionally well, achieving the highest classification accuracy with clear maize field boundaries and minimal misclassification. In Jinchang, despite the more dispersed farmland, the classification accuracy remained relatively high, though some field boundaries appeared blurred. In Wuwei, the complex farmland distribution led to noticeable misclassification and omission errors, particularly in distinguishing maize from bare soil and other crops. In Jiuquan, the challenging terrain, scattered farmland, and harsh climatic conditions resulted in lower classification accuracy and significant misclassification and omission errors.
The optimized feature selection scheme performed well in regions like Zhangye and Jinchang, effectively suppressing “salt-and-pepper” noise and improving classification accuracy. However, further optimization is needed for complex regions like Wuwei and Jiuquan.
3.6. Typical Plot Classification Evaluation
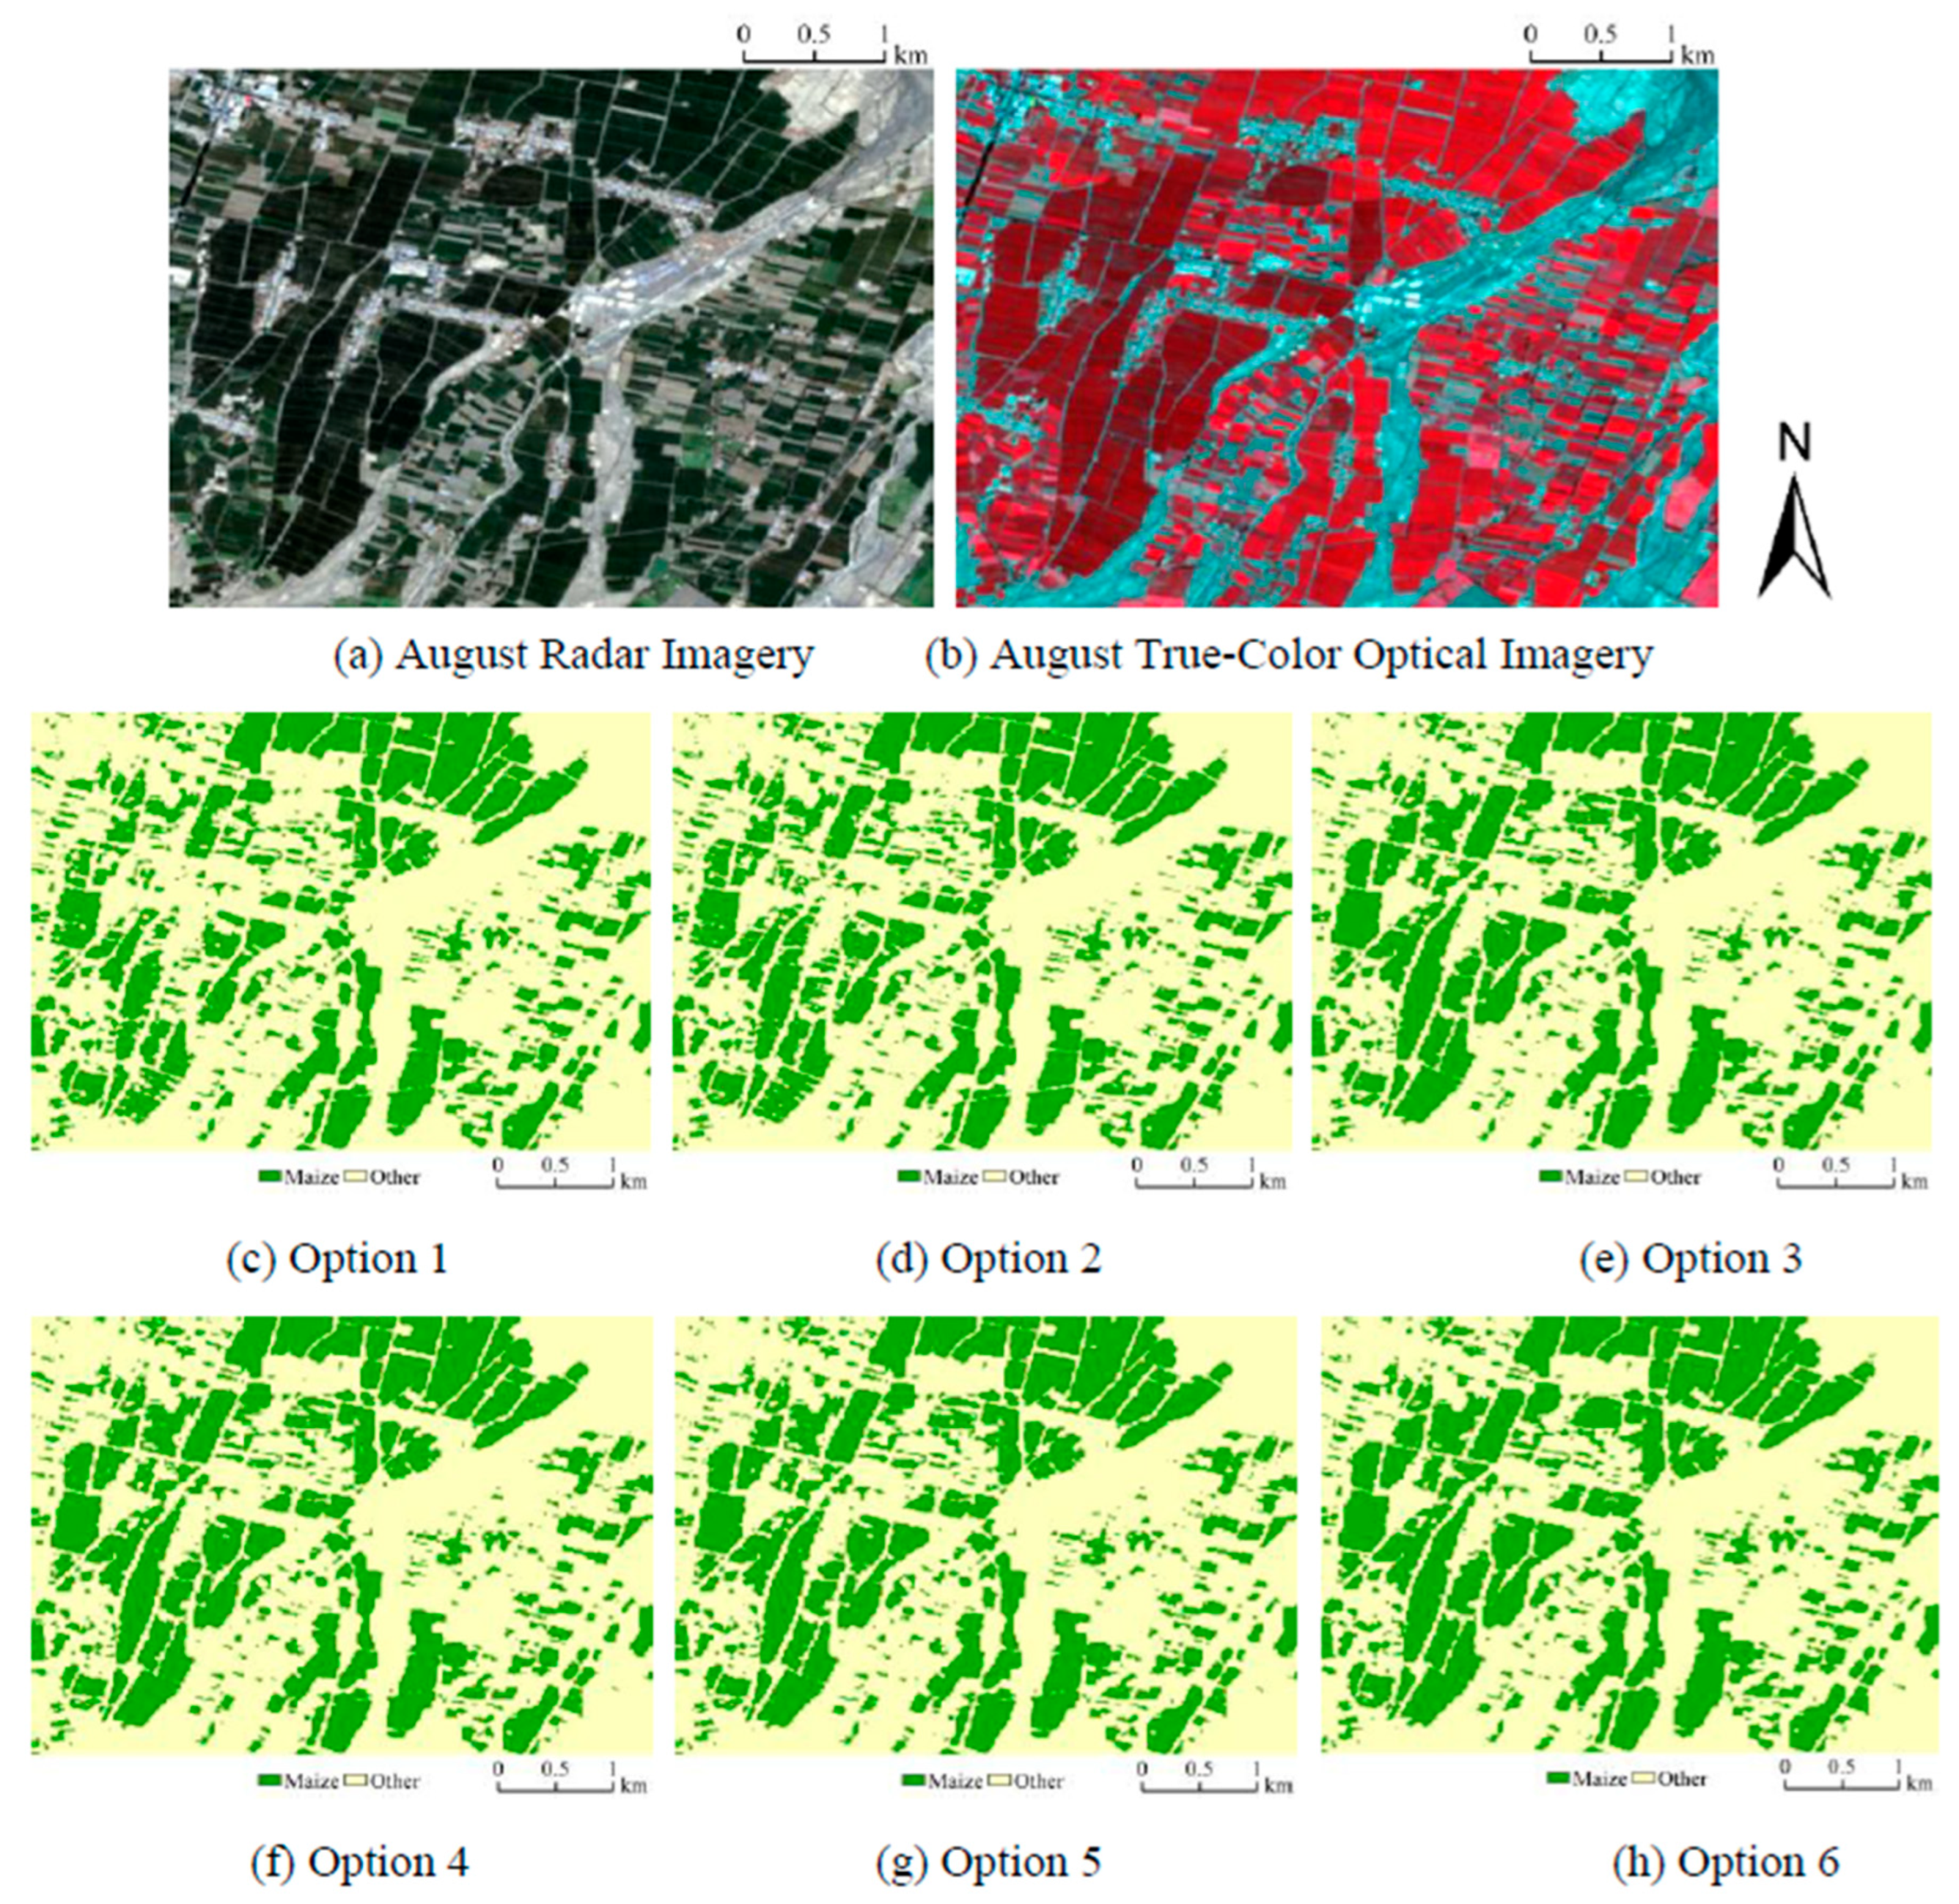
Within the study area, typical plots were selected, and the spatial distribution of maize was obtained through visual interpretation using August radar imagery (
Figure 9a) and optical true-color imagery (
Figure 9b). The classification results were compared with the six experimental classification outcomes (
Figure 9c–h).
In the results derived from single-source data (
Figure 9c–e), “salt-and-pepper” noise was evident, especially in the schemes without feature optimization, which showed noticeable misclassification and omission errors. Specifically,
Figure 9c demonstrated the lowest classification accuracy, with clear misclassification and omission errors, making it unsuitable for practical applications.
Figure 9d identified maize plots but still had omission errors and misclassification in built-up areas.
Figure 9e showed some improvement but continued to suffer from excessive features, leading to data redundancy that limited accuracy enhancement.
In contrast, the classification results using multi-source data (
Figure 9f–h) exhibited significant improvements. The “salt-and-pepper” noise was effectively suppressed, and classification performance greatly outperformed unoptimized schemes. While
Figure 9g achieved higher accuracy, the spectral similarities among maize, other crops, and bare soil blurred the boundaries of maize plots. However,
Figure 9h showed the best performance, with optimized features derived from multi-source data. This method produced results that aligned closely with visual interpretations, offering clear classification boundaries and significantly reducing misclassification and omission errors. The approach effectively lowered misclassification rates between maize and other land cover types, demonstrating its robustness for accurate maize identification.
3.7. Maize Area Estimation
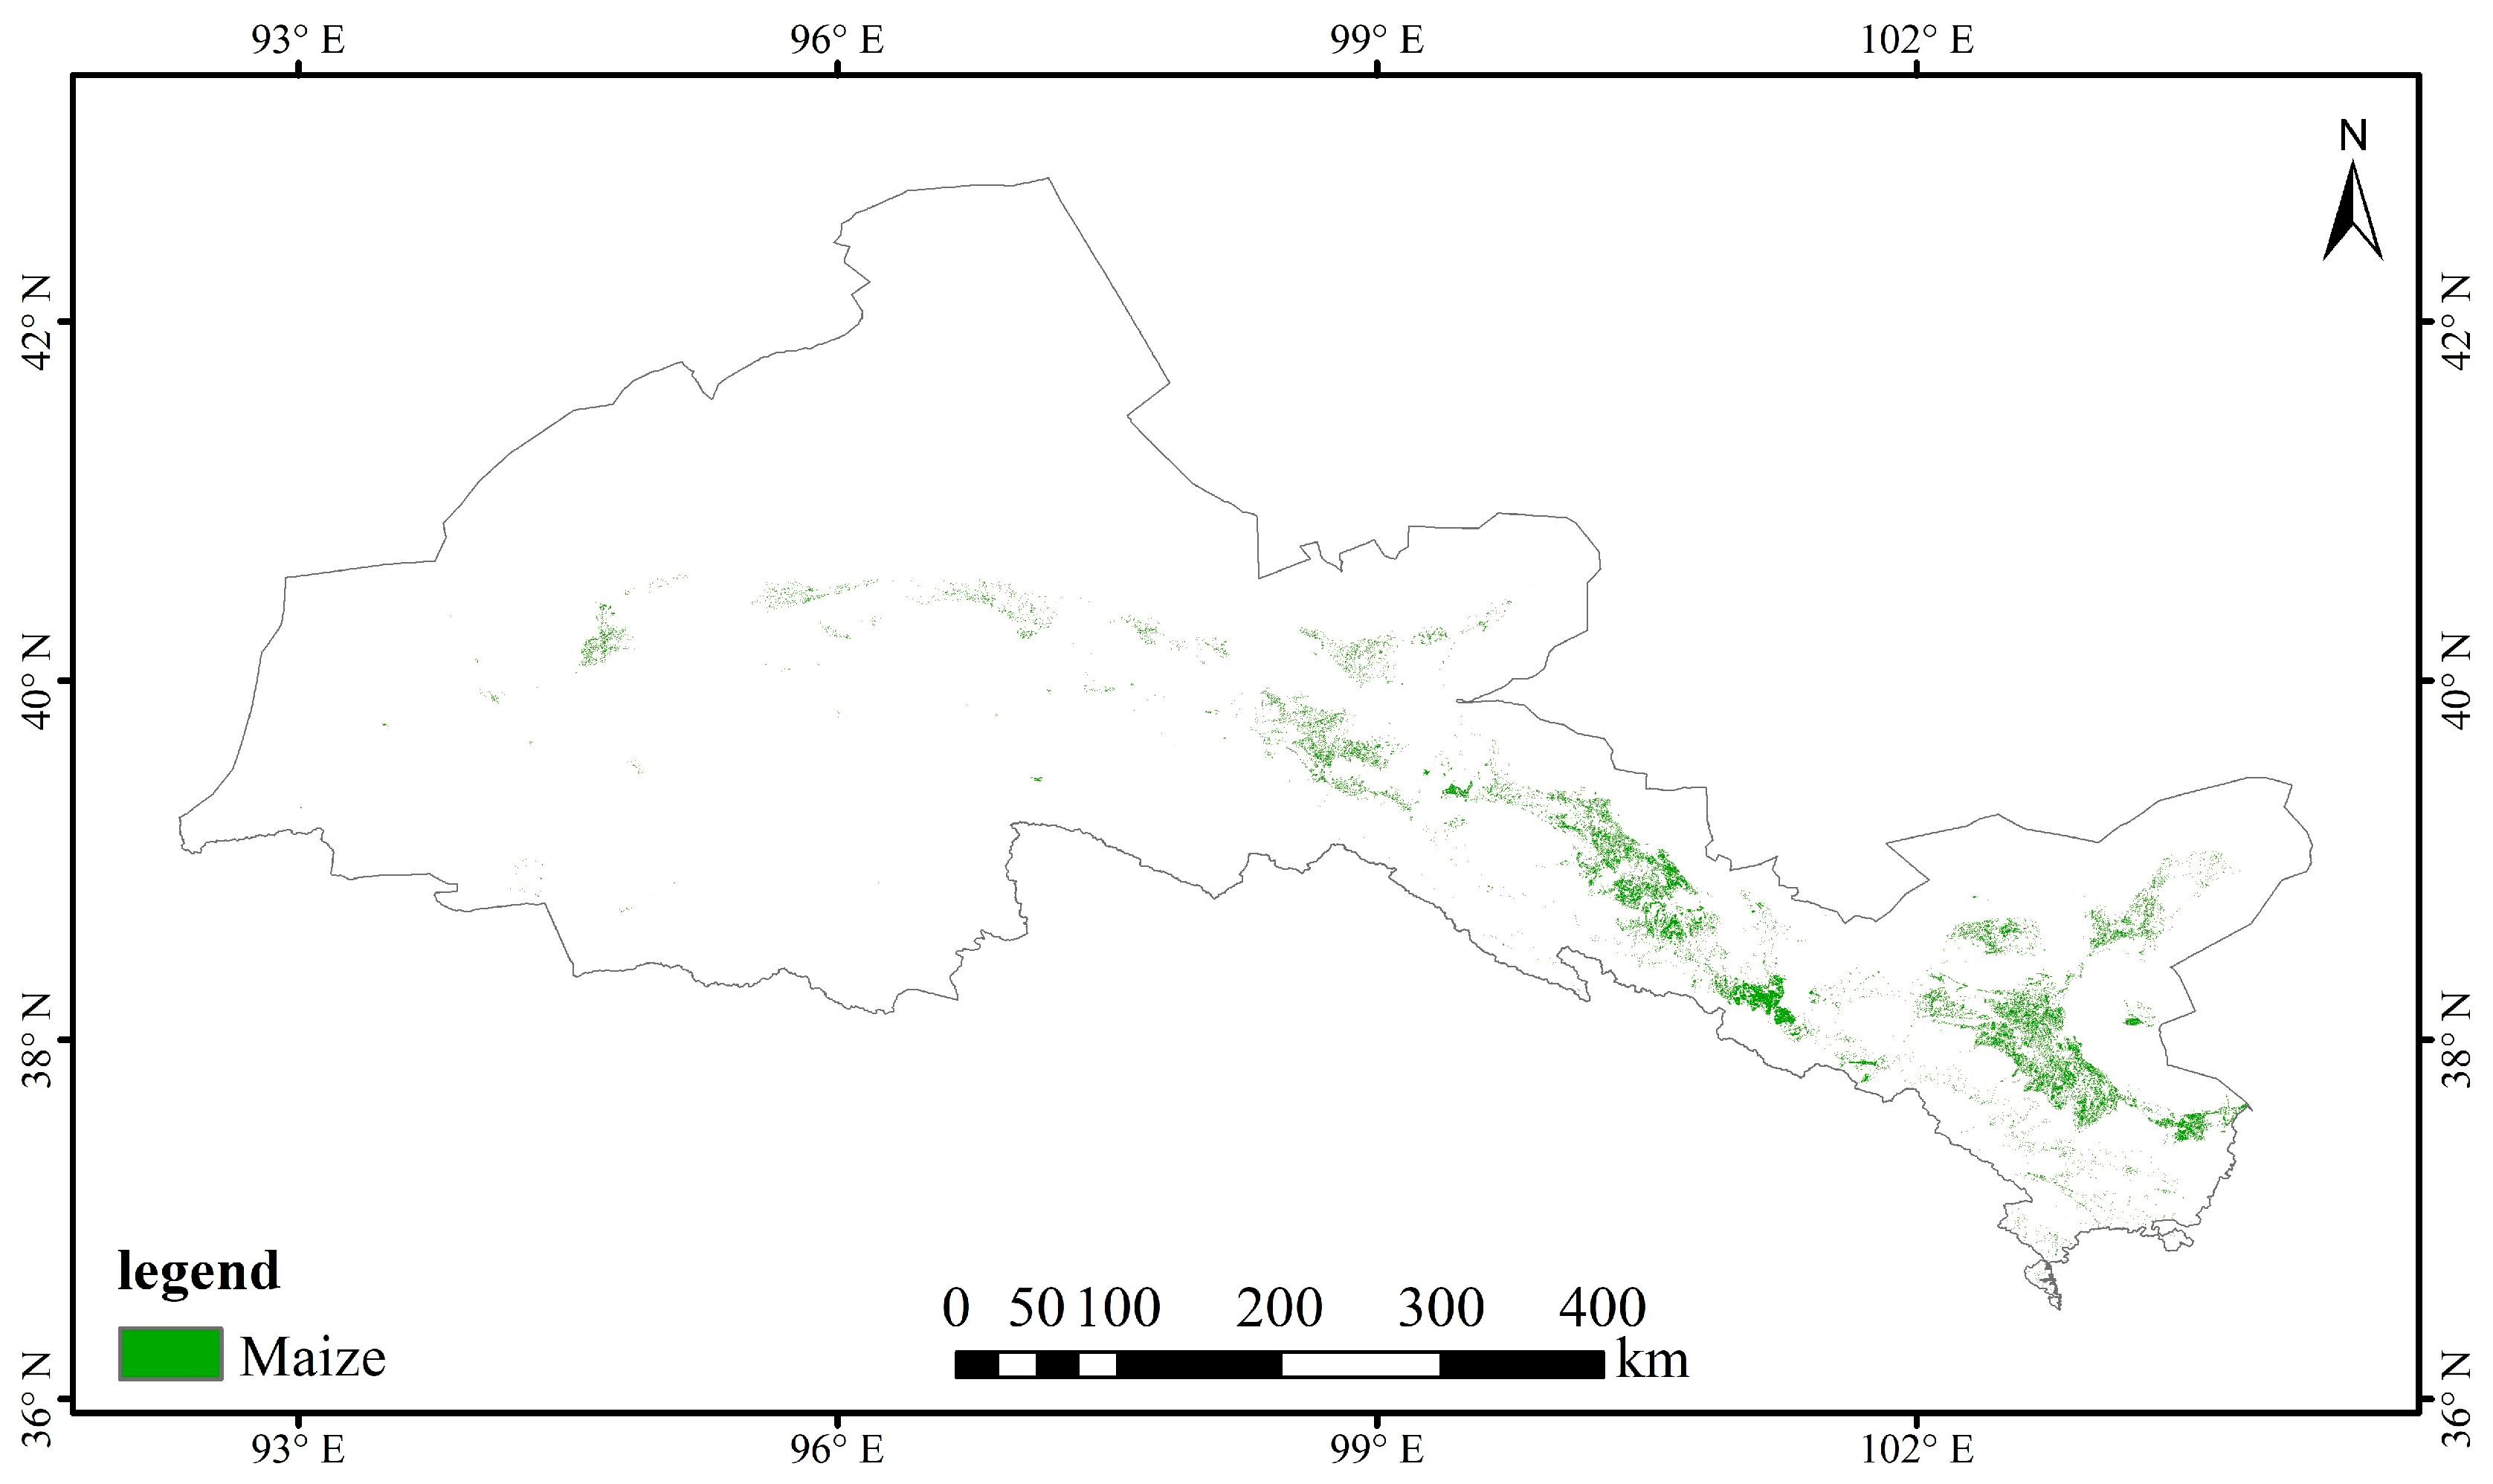
Utilizing the finalized classification outcomes derived from the enhanced feature set, an estimation of the maize cultivation area within the Hexi Corridor was conducted. Specifically, 135,500 hectares were identified as cultivated land for maize, which constitutes approximately 2.22% of the total cropland area (6,100,000 hectares) according to the CLCD dataset. This quantitative analysis not only provides a detailed spatial representation of maize distribution but also offers valuable insights for agricultural resource management, particularly in arid and semi-arid regions where precise crop monitoring is essential for sustainable land utilization.
Figure 10 illustrates the spatial pattern of maize cultivation areas throughout the study area, presenting a visual depiction of cultivation trends on a regional scale. This map serves as a crucial reference point for policy-makers, land use planners, and agricultural stakeholders aiming to allocate water resources effectively and enhance crop management practices in dryland areas.
4. Discussion
This study advances the development of maize classification methods in arid and topographically complex regions by integrating multi-source remote sensing data with a lightweight feature optimization framework. The results indicate that, particularly during the grain-filling period in August, the red-edge bands (especially B5 and B6) provide crucial spectral information closely related to chlorophyll content and canopy structure, thereby supporting high-precision maize identification. Previous research has demonstrated that red-edge bands exhibit high sensitivity and classification capability in estimating maize straw resources, primarily focusing on modeling straw distribution during the post-harvest stage [
37]. In contrast, this study further validates the responsiveness of red-edge bands to changes in canopy structure and chlorophyll during the maize growth period, particularly in the grain-filling stage, highlighting their advantages in early-season classification. The effectiveness of these bands is closely related to the phenological characteristics and canopy closure of maize, both of which peak during this period.
The classification framework proposed in this study is based on the classic random forest feature importance ranking, combined with a correlation filtering method. This approach effectively removes redundant variables, reduces multicollinearity, and enhances the model’s generalization capability. Existing research has demonstrated that utilizing random forests for feature selection, along with the integration of multi-source data (such as Sentinel-1, Sentinel-2, and DEM), can significantly improve the accuracy of land cover classification in semi-arid agricultural regions. In contrast, this paper further simplifies the feature selection process and enhances computational efficiency and model applicability through variable optimization, all without increasing data dimensionality. This makes it particularly suitable for large-scale crop identification tasks in resource-constrained environments [
38]. Unlike the traditional RF-RFE method, which is computationally intensive, our simplified approach achieves a 69% reduction in feature dimensionality while maintaining comparable accuracy. Specifically, processing time is reduced by 62.5%, and memory usage is decreased by 66.7%, due to targeted feature optimization and a streamlined model structure. This improvement significantly enhances the computational efficiency of the model, making it particularly suitable for large-scale applications in resource-constrained environments, such as cloud computing platforms based on the Google Earth Engine (GEE).
In contrast to previous studies that relied solely on optical data, such as the research conducted by Wang et al. (2024) [
39], which reported an accuracy of 86.15%, the methodology employed in this study achieved an accuracy exceeding 97%. This finding highlights the significance of integrating radar features and red-edge information in complex agricultural environments. The capacity of Sentinel-1 backscatter to alleviate cloud-induced gaps, alongside the ability of red-edge bands to capture subtle variations in canopy structure, significantly enhances class separability in heterogeneous terrains.
Numerous studies rely on optical remote sensing data, particularly vegetation indices such as the normalized difference vegetation index (NDVI). However, this study emphasizes the complementary role of radar data and the red-edge band, especially in arid regions and complex terrains, where the benefits of their integration are more pronounced. Existing research on remote sensing identification of tea plantations has shown that combining Sentinel-1 radar data with Sentinel-2 optical data can effectively counteract the decline in classification accuracy caused by cloud cover, thereby enhancing the stability and robustness of multi-source monitoring. The integration of multi-source data has been demonstrated to improve both the robustness and accuracy of classification, particularly in areas susceptible to cloud interference or with complex terrains, where traditional optical methods face challenges [
40]. The inclusion of Sentinel-1 radar data facilitates all-weather, continuous crop monitoring, effectively addressing the data gaps that optical methods cannot cover.
This approach offers significant advantages for the management of smart farmlands and enhances decision-making within precision agriculture. By addressing the challenges posed by diverse topographies and climatic conditions, it enables improved and scalable observation of agricultural resources. This, in turn, assists policy-makers and remote sensing experts in making more informed decisions regarding crop management and land-use strategies. Furthermore, the method provides a scalable framework for extensive crop monitoring in resource-constrained areas, particularly in light of the emergence of new smart farming technologies.
Although the feature selection approach used in this study—combining random forest importance ranking with correlation filtering—is well established, our contribution lies in applying and validating it within a highly heterogeneous, resource-limited agricultural environment. Moreover, this study demonstrates how the strategy leverages cloud platforms, such as the Google Earth Engine (GEE), to achieve lightweight, efficient, and interpretable large-scale crop classification. By focusing on reducing feature dimensionality without compromising classification accuracy, this method offers a practical solution for smart agriculture in arid and computationally resource-constrained regions. Consistent with previous studies that constructed remote sensing crop water productivity mapping models based on GEE—such as research utilizing Landsat remote sensing images combined with geeSEBAL and the Monteith model to assess crop yield and water use efficiency at a regional scale—this study further validates the versatility and efficiency of GEE in agricultural remote sensing [
41].
Overall, this study presents a transferable technical framework for accurate crop monitoring in regions characterized by complex topography, restricted field accessibility, and spectral heterogeneity. The modular nature of the proposed method facilitates its adaptation to other crops or regions with similar agro-ecological conditions, thereby contributing to the advancement of precision agriculture and smart farming applications in data-scarce environments. This approach offers a practical framework for utilizing remote sensing data in large-scale, resource-limited agricultural monitoring, ultimately enabling improved management of crop resources and more informed decision-making in precision agriculture.
5. Conclusions
Arid and mountainous agricultural regions frequently experience fragmented farmland, pronounced spectral heterogeneity, and limited accessibility, which pose significant challenges for remote sensing-based crop classification. Addressing these challenges necessitates the implementation of efficient data fusion techniques and scalable modeling solutions that uphold high accuracy despite resource constraints.
This study proposes a lightweight framework for maize identification that integrates Sentinel-1 and Sentinel-2 data with an optimized feature set. The method combines temporally sensitive vegetation indices and backscatter bands with a reduced set of discriminative features, which are selected through random forest importance ranking and multicollinearity filtering.
The key results indicate that features derived from the August grain-filling stage, particularly the red-edge bands (B5, B6), contribute most significantly to classification accuracy. The optimized feature set achieved a dimensionality reduction of 69%, a processing time improvement of 62.5%, and a memory usage decrease of 66.7%, while attaining an overall accuracy (OA) of 97.16%, as evaluated based on the optimized feature set in
Table 5.
This study demonstrates that a streamlined RF-RFE approach, combined with correlation filtering, achieves high classification accuracy while significantly improving computational efficiency.
The suggested method has demonstrated effectiveness across various agro-ecological and topographical contexts within the Hexi Corridor. Its modular design and minimal input requirements make it adaptable to different crop varieties, including wheat and soybean, as well as to similar dryland and hilly areas. Future research could enhance this strategy by incorporating higher temporal resolution images, multi-temporal radar datasets, or deep learning models based on transformers. This study contributes to the practical application of precision agriculture and smart farming systems in environments with limited data, particularly in regions where cloud resources and field sampling capabilities are constrained.
In addition, the identified maize cropping area was approximately 135,500 hectares, accounting for 2.22% of the CLCD-defined cropland in the Hexi region. This spatial insight contributes to practical agricultural assessments and supports the implementation of data-informed precision agriculture policies in arid zones.


