Article

From First Frost to Last Snow: Tracking the Microclimate Evolution of Greenhouses Across North China’s Winter Spectrum

1
Beijing Agricultural Technology Extension Station, Beijing 100029, China
2
Beijing Changping District Agricultural Technology Extension Station, Beijing 102299, China
3
State Key Laboratory of Plant Environmental Resilience, Engineering Research Center of Plant Growth Regulator, Ministry of Education, College of Agronomy and Biotechnology, China Agricultural University, Beijing 100193, China
*
Author to whom correspondence should be addressed.
Agronomy 2025, 15(7), 1663; https://doi.org/10.3390/agronomy15071663
Submission received: 21 May 2025 / Revised: 3 July 2025 / Accepted: 8 July 2025 / Published: 9 July 2025

Abstract

Global climate change has intensified the challenges of low-temperature, low-light, and high-humidity microclimates in North China’s greenhouses during winter, exposing the limitations of traditional controlled-environment agriculture (CEA) facilities. This study monitored air temperature, relative humidity, and light intensity in three greenhouse types—an externally insulated plastic greenhouse, soft-shell solar greenhouse, and brick-walled solar greenhouse—across three overwintering periods (pre-, mid-, post-) using high-precision sensors (monitoring period is from 1 October 2024 to 31 March 2025). A Comprehensive Evaluation Index (CEI) based on the entropy method was developed, integrating seven indicators (daily average temperature, temperature range, hours below 5 °C, average humidity, hours above 80% humidity, average light intensity, and light utilization efficiency) to systematically evaluate greenhouse microclimate regulation performance. Results showed that the brick-walled solar greenhouse exhibited superior thermal insulation, with nearly zero hours below 5 °C during mid-overwintering, while the soft-shell solar greenhouse achieved the highest light utilization efficiency (75.1–79.6%). The externally insulated plastic greenhouse exhibited the highest relative humidity (>80% for 13–19 h/day) but a poor thermal insulation performance. The CEI ranked the brick-walled solar greenhouse (0.86) and the soft-shell solar greenhouse (0.84) significantly higher than the externally insulated plastic greenhouse (0.39), with the relative humidity significantly negatively correlated with light indicators (P < 0.05), and the temperature and light indicators strongly correlated with the CEI (P < 0.01). Structural design and material innovation are critical for climate adaptation. Brick-walled and soft-shell solar greenhouses balance thermal and light performance, while the externally insulated plastic greenhouse faces structural limitations. The findings provide a scientific basis for greenhouse optimization and regional layout planning.

1. Introduction

Global climate change is reshaping the basic pattern of agricultural production at an unprecedented speed [1]. With the continuous increase in the concentration of greenhouse gases, the frequency and intensity of extreme weather events have significantly increased, posing a severe challenge to controlled-environment agriculture (CEA), which relies on stable environmental conditions [2,3,4]. In the past few decades, the rise in the average winter temperature has not alleviated the risks faced by agricultural production but has instead intensified the volatility of the climate system [5,6]. The intertwined occurrence of extreme meteorological phenomena such as cold waves, persistent low temperatures, and insufficient sunlight has made the vulnerability of traditional CEA facilities more prominent [7]. As an important means of breaking through natural condition limitations, the core function of CEA lies in creating a suitable growth environment for crops through artificial regulation [8]. However, the uncertainties brought about by climate change are weakening this advantage. For example, frequent extreme low temperatures not only increase the energy consumption of greenhouse heating but also disrupt the crop growth cycle [9,10]. The continuous reduction in winter light resources directly affects the efficiency of photosynthesis, reducing the yield and quality of crops [11,12]. This dual pressure forces agricultural producers to find a new balance between energy costs and production efficiency, and it also exposes the limitations of the traditional CEA technology system in dealing with complex climate stresses.
As an important agricultural production base in China, North China’s unique climate conditions pose special challenges to the development of CEA [13]. The region is cold and dry in winter, with a large diurnal temperature range of 15–20 °C [14]. The frequent northwest monsoon exacerbates heat loss, forming a typical climate characteristic of “low temperature and low light” (daylength 9–11 h) [15]. This environment places higher demands on the thermal insulation performance, light transmittance efficiency, and wind resistance of greenhouse structures. For a long time, CEA in North China has mainly taken the form of solar greenhouses, and its design concept focuses on making full use of solar energy for passive heat storage [16,17,18]. However, with the intensification of climate change, traditional greenhouses are gradually showing their inadequacy in dealing with extreme weather. In recent years, the scale of CEA in the region has continued to expand, but structural contradictions have also become more prominent. Some old greenhouses, due to problems such as the aging of thermal insulation materials and unreasonable structural design, struggle to maintain a stable internal environment [19]. Although newly built greenhouses have adopted certain technological innovations, they still face common problems such as high energy consumption and insufficient environmental regulation accuracy during actual operation [20]. This current situation not only restricts the stability of winter vegetable supply but also deviates to a certain extent from the development direction of green and low-carbon modern agriculture.
China’s CEA has gone through a progressive development process from simple plastic greenhouses to intelligent greenhouses [21]. Currently, in North China, there is a pattern of coexistence of three mainstream types: externally insulated plastic greenhouses, soft-shell solar greenhouses, and brick-walled solar greenhouses [22,23]. The large-span externally insulated plastic greenhouses are widely used in agricultural production due to their low cost and flexible construction [24]. The soft-shell solar greenhouses represent the latest application achievements of materials science. Through the design of new covering materials and adjustable structures, they seek a balance between light transmittance and thermal insulation [25]. The brick-walled solar greenhouses continue the wisdom of traditional architecture, relying on thick wall structures to achieve day–night heat regulation [26]. These three types of greenhouses have their own characteristics in material selection, structural design, and functional positioning, reflecting the technological understanding and production needs of different historical stages. However, in the actual application process, all types of greenhouses have clear performance shortcomings. Plastic greenhouses have limited thermal insulation capabilities under extreme low temperatures, the environmental regulation stability of soft-shell greenhouses needs to be improved, and brick-walled greenhouses face practical constraints such as a low land utilization rate and high reconstruction costs. This phenomenon of technological generational differences and coexistence deeply reveals the complex game between economic benefits and environmental adaptation in the development of CEA.
Although the three types of greenhouses are widely used in North China, the systematic research on the formation mechanism of the microclimate during their overwintering period is still insufficient. Existing research mostly focuses on the static analysis of a single environmental parameter, lacking a dynamic analysis of the synergistic effects of multiple elements such as temperature, humidity, and light. For example, the traditional evaluation system often examines the thermal insulation performance of greenhouses in isolation, but ignores the potential impact of a high-humidity environment on the physiological processes of crops [27,28]. The attention to light conditions mostly stays at the total-amount level, without deeply revealing the coupling effect between light quality changes and temperature fluctuations [29,30]. This fragmented approach struggles to fully reflect the real operation state of the greenhouse microenvironment and also limits the direction of optimized design [31]. In addition, the changes in the climate characteristics during the overwintering period caused by climate change have gradually weakened the reference value of historical experience data, and there is an urgent need to establish a dynamic evaluation model based on real-time monitoring. This study constructs a high-precision environmental monitoring network to systematically analyze the microclimate evolution laws of the three types of greenhouses during the complete overwintering cycle, with a focus on revealing the internal connection between structural characteristics and environmental responses. The objective of this study is to provide a scientific basis for greenhouse structural optimization, precise environmental regulation, and regional layout planning, with important practical value for improving the climate adaptation ability of CEA and promoting the sustainable development of the industry.

2. Materials and Methods
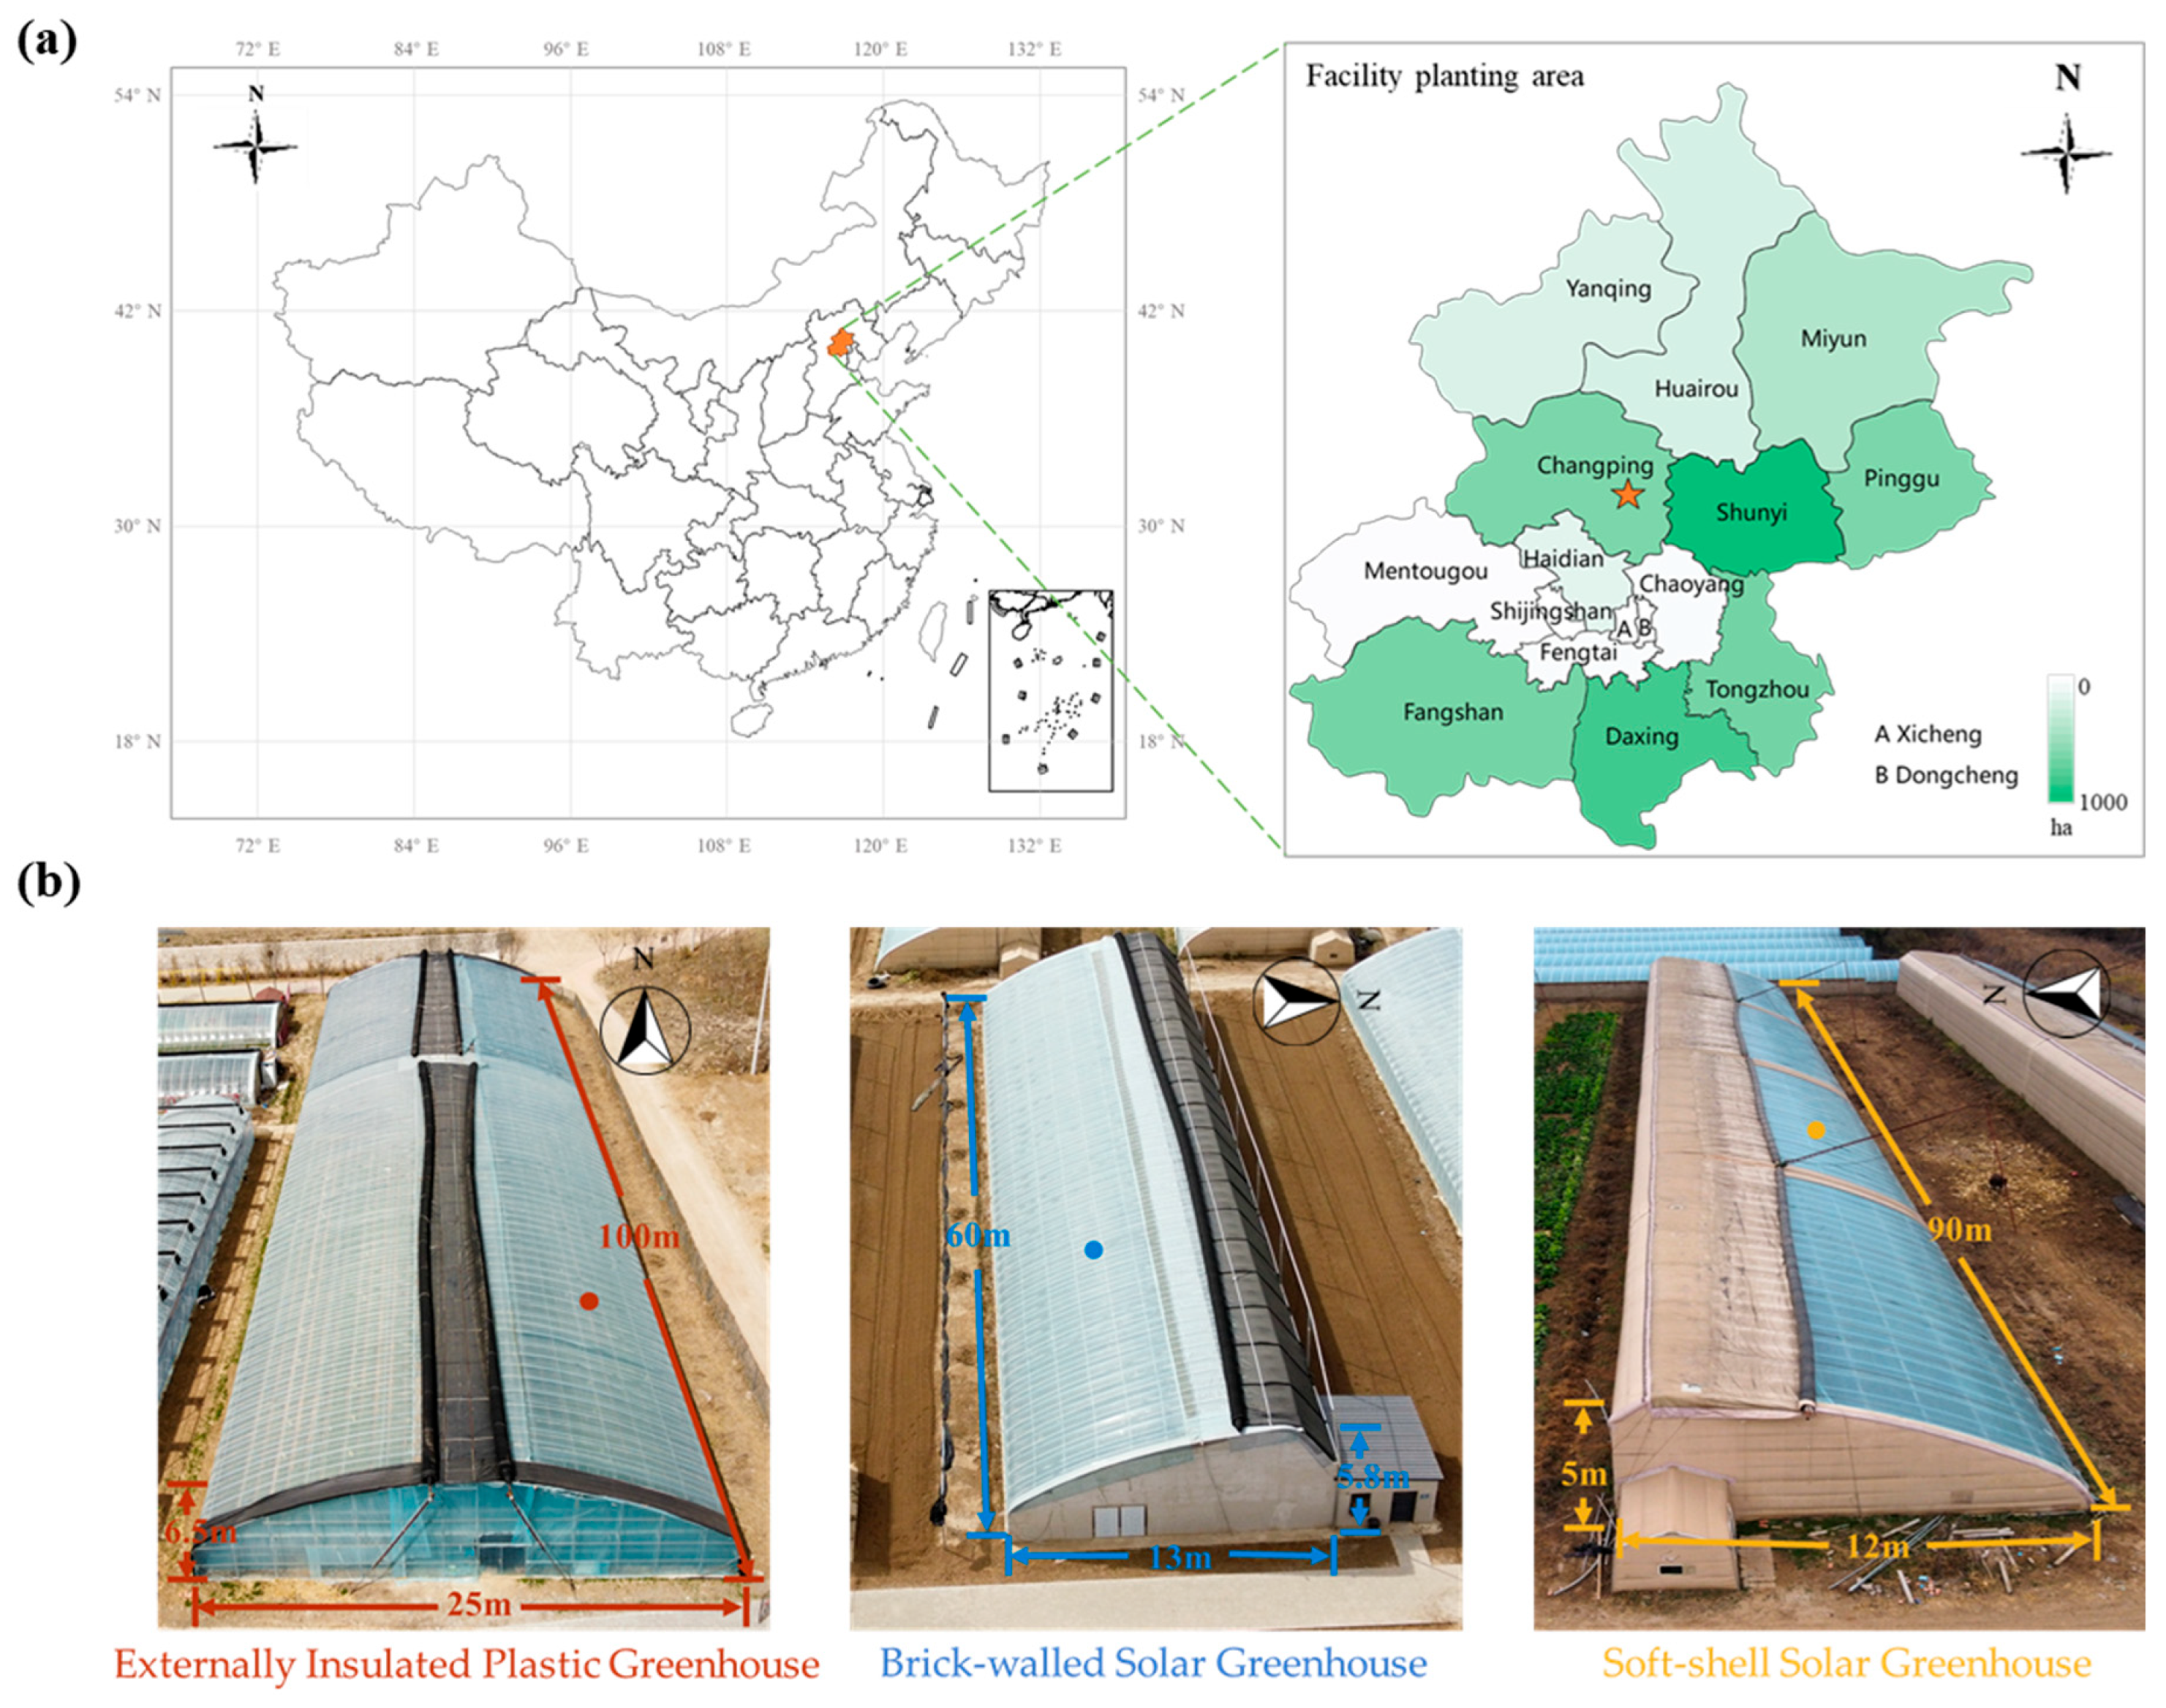
2.1. Study Area

This experiment was conducted at the Jinhuinong Rural Cooperative (40°19′ N, 116°39′ E, elevation 41 m) in Beijing’s Changping District, located at Northern China (Figure 1a). The region belongs to the temperate continental monsoon climate, and the total CEA production area across Beijing exceeds 11500 hectares [32]. The external covering materials of the three types of greenhouses are all 10-micron crystal PO films, and the external thermal insulation materials are all quilts with a thickness of about 6 cm. The experimental subjects are a large-span externally insulated plastic greenhouse, a brick-walled solar greenhouse, and a soft-shell solar greenhouse (Figure 1b). The shed spacing of the soft-shell solar greenhouse and the brick-walled solar greenhouse is 8 m. There is only one externally insulated plastic greenhouse in this area, and there is no surrounding obstruction. During the overwintering period, the ventilation management of the three greenhouse types mainly relies on experienced farmers controlling the opening and closing of the upper vents. For the solar greenhouses (both brick-walled and soft-shell types), which utilize solar energy for thermal insulation and north wall heat storage, the upper vents at the top are opened at 10:30–11:00 am on sunny days when the internal temperature reaches approximately 30 °C and closed before 14:00 pm to retain heat. The initial vent width is controlled at about 5 cm. For the externally insulated plastic greenhouse, which has a larger space and relatively weaker thermal insulation, the upper vents are opened after 9:00 am on sunny days depending on the temperature. The ventilation volume is adjusted flexibly: when the internal temperature exceeds 30 °C, the vent is enlarged, and it is closed when the temperature drops to around 25 °C in the afternoon. Although intelligent greenhouses (referring to soft-shell solar greenhouses with adjustable structures) have automated systems, manual experience is still used during overwintering. A temperature threshold is set (e.g., automatically opening the upper vents when the temperature exceeds 30 °C and reducing the vent size when it drops to 25 °C), with manual fine-tuning of vent sizes based on wind direction and spatial temperature differences. During the mid-to-post-overwintering period, the externally insulated plastic greenhouse closes (lowers) its thermal insulation quilt at around 15:30–16:00, approximately one hour earlier than the soft-shell solar greenhouse and brick-walled solar greenhouse.

2.2. Data Sources

The monitoring of light, temperature, and humidity in the outdoor climate and in the microclimate of greenhouses were carried out, respectively, by the small meteorological monitoring station and the greenhouse intelligent sensors provided by Beijing Tian-chuang Jinong Technology Co., Ltd. (http://www.bjtcjn.com/facility.html#facility, accessed on 1 April 2025). The small meteorological monitoring station was positioned at the center of the area, 2 m above the ground, with no surrounding obstructions. For the brick-walled solar greenhouse and soft-shell solar greenhouse, the greenhouse intelligent sensor was hung at the greenhouse center, 8 m away from the back wall and 2 m above the ground, ensuring no obstruction from shed beams or plants. As for the externally insulated plastic greenhouse, the greenhouse intelligent sensor was suspended at a location 20 m from the south gate and 8 m from the east wall, 2 m above the ground, with no obstruction from shed beams or plants. The monitoring data, which are hourly records, were provided by the company’s internal platform. The entire overwintering stage is divided into three periods: the pre-overwintering period (1 October 2024–30 November 2024), the mid-overwintering period (1 December 2024–31 January 2025), and the post-overwintering period (1 February 2025–31 March 2025).

2.3. Calculation

2.3.1. Air Temperature

The average values of daily maximum temperature, daily minimum temperature, and daily average temperature were calculated for each stage of the overwintering period. The greater the daily temperature span (the range between maximum and minimum temperatures), the more pronounced its benefit in enhancing fruit quality [33,34], and 5 °C is the minimum survival temperature for most vegetables [35]. Therefore, the daily temperature range (calculated as the difference between daily maximum and minimum temperatures) and the number of hours below 5 °C were analyzed simultaneously.

2.3.2. Relative Humidity

The average values of daily maximum relative humidity, daily minimum relative humidity, and daily average relative humidity were calculated for each stage of the overwintering period, respectively. Suitable humidity is conducive to the growth of greenhouse vegetables, and humidity fluctuations can reflect the stability of greenhouse performance to a certain extent [36]. However, an excessively high relative air humidity will aggravate the spread of diseases in greenhouse vegetables [37,38]. Thus, the daily relative humidity range (calculated as the difference between daily maximum and minimum relative humidity) and the number of hours with a relative humidity exceeding 80% were analyzed simultaneously.

2.3.3. Light Intensity

Light intensity has a highly significant impact on both the yield and quality of vegetables [39,40]. Therefore, the average daily light intensity during different stages of the overwintering period was calculated. Meanwhile, the ratio of light intensity inside the greenhouse to that outside was used to represent greenhouse light transmission [41].

2.3.4. Comprehensive Evaluation Index

The entropy method is an objective weighting approach, which mainly utilizes objective data collected from the real environment to obtain the original information of the objects to be evaluated and analyze the internal relationships between various evaluation indicators. The advantage of this method lies in that it determines weights completely based on the magnitude and degree of difference of the observed values of the indicators themselves, thereby avoiding the personal subjective biases that may exist in subjective weighting methods and making the evaluation process more objective and fairer. Therefore, a Comprehensive Evaluation Index (CEI) for greenhouse performance constructed based on the entropy method is proposed to more accurately reflect the environmental performance of different greenhouse types [41]. Seven indicators are selected as the evaluation indicators: daily average temperature, daily temperature range, daily <5 °C hours, daily average humidity, daily >80% hours, daily average light intensity, and light utilization efficiency. Among them, daily <5 °C hours and daily >80% hours are negative indicators.
Data standardization processing:
X i j   ( P o s i t i v e   i n d i c a t o r s ) = X i j m i n { X j } max X j m i n { X j }
X i j   ( N e g a t i v e   i n d i c a t o r s ) = max X j X i j max X j m i n { X j }
Calculate the proportion of the j-th indicator value for the i-th greenhouse type:
Y i j   = X i j i = 1 m X i j
Calculate the indicator information entropy:
e j = k i = 1 m ( Y i j   × ln Y i j   )
Calculate the information entropy redundancy:
d j = 1 e j
Calculate indicator weights:
W i = d j / j = 1 n d j
Calculate the comprehensive evaluation index:
C E I = j = 1 n ( W i   × X i j   )
In the formula: Xij represents the value of the j-th evaluation indicator for the i-th greenhouse type; min{Xj} and max{Xj} denote the minimum and maximum values of the j-th evaluation indicator across all greenhouse types, respectively; k = 1/ln(m), where m is the number of greenhouse types (3), and n is the number of indicators (7).

2.4. Statistical Analysis

In this experiment, Microsoft Excel 2023, IBM SPSS Statistics 25, and Origin 2024 were used for analysis of variance (ANOVA), correlation distraction, and plotting the measurement data. This study quantified the correlation between the CEI and microclimate indicators through the Mantel test and constructed a correlation matrix in combination with Pearson correlation. The ANOVA at p < 0.05 was used to identify differences. Before the analysis, the normality of the data was inspected through descriptive statistics (mean, standard deviation, skewness, kurtosis) and the Shapiro–Wilk test. Non-conforming data were either transformed or analyzed using non-parametric tests. The homogeneity of variance was evaluated with the Levene test. In case of unequal variance, the Welch correction was used in the analysis of variance, and the weighted least squares method was adopted in the regression analysis. These procedures ensured the rationality of the data assumptions and provided strong statistical support for the conclusions.

3. Results

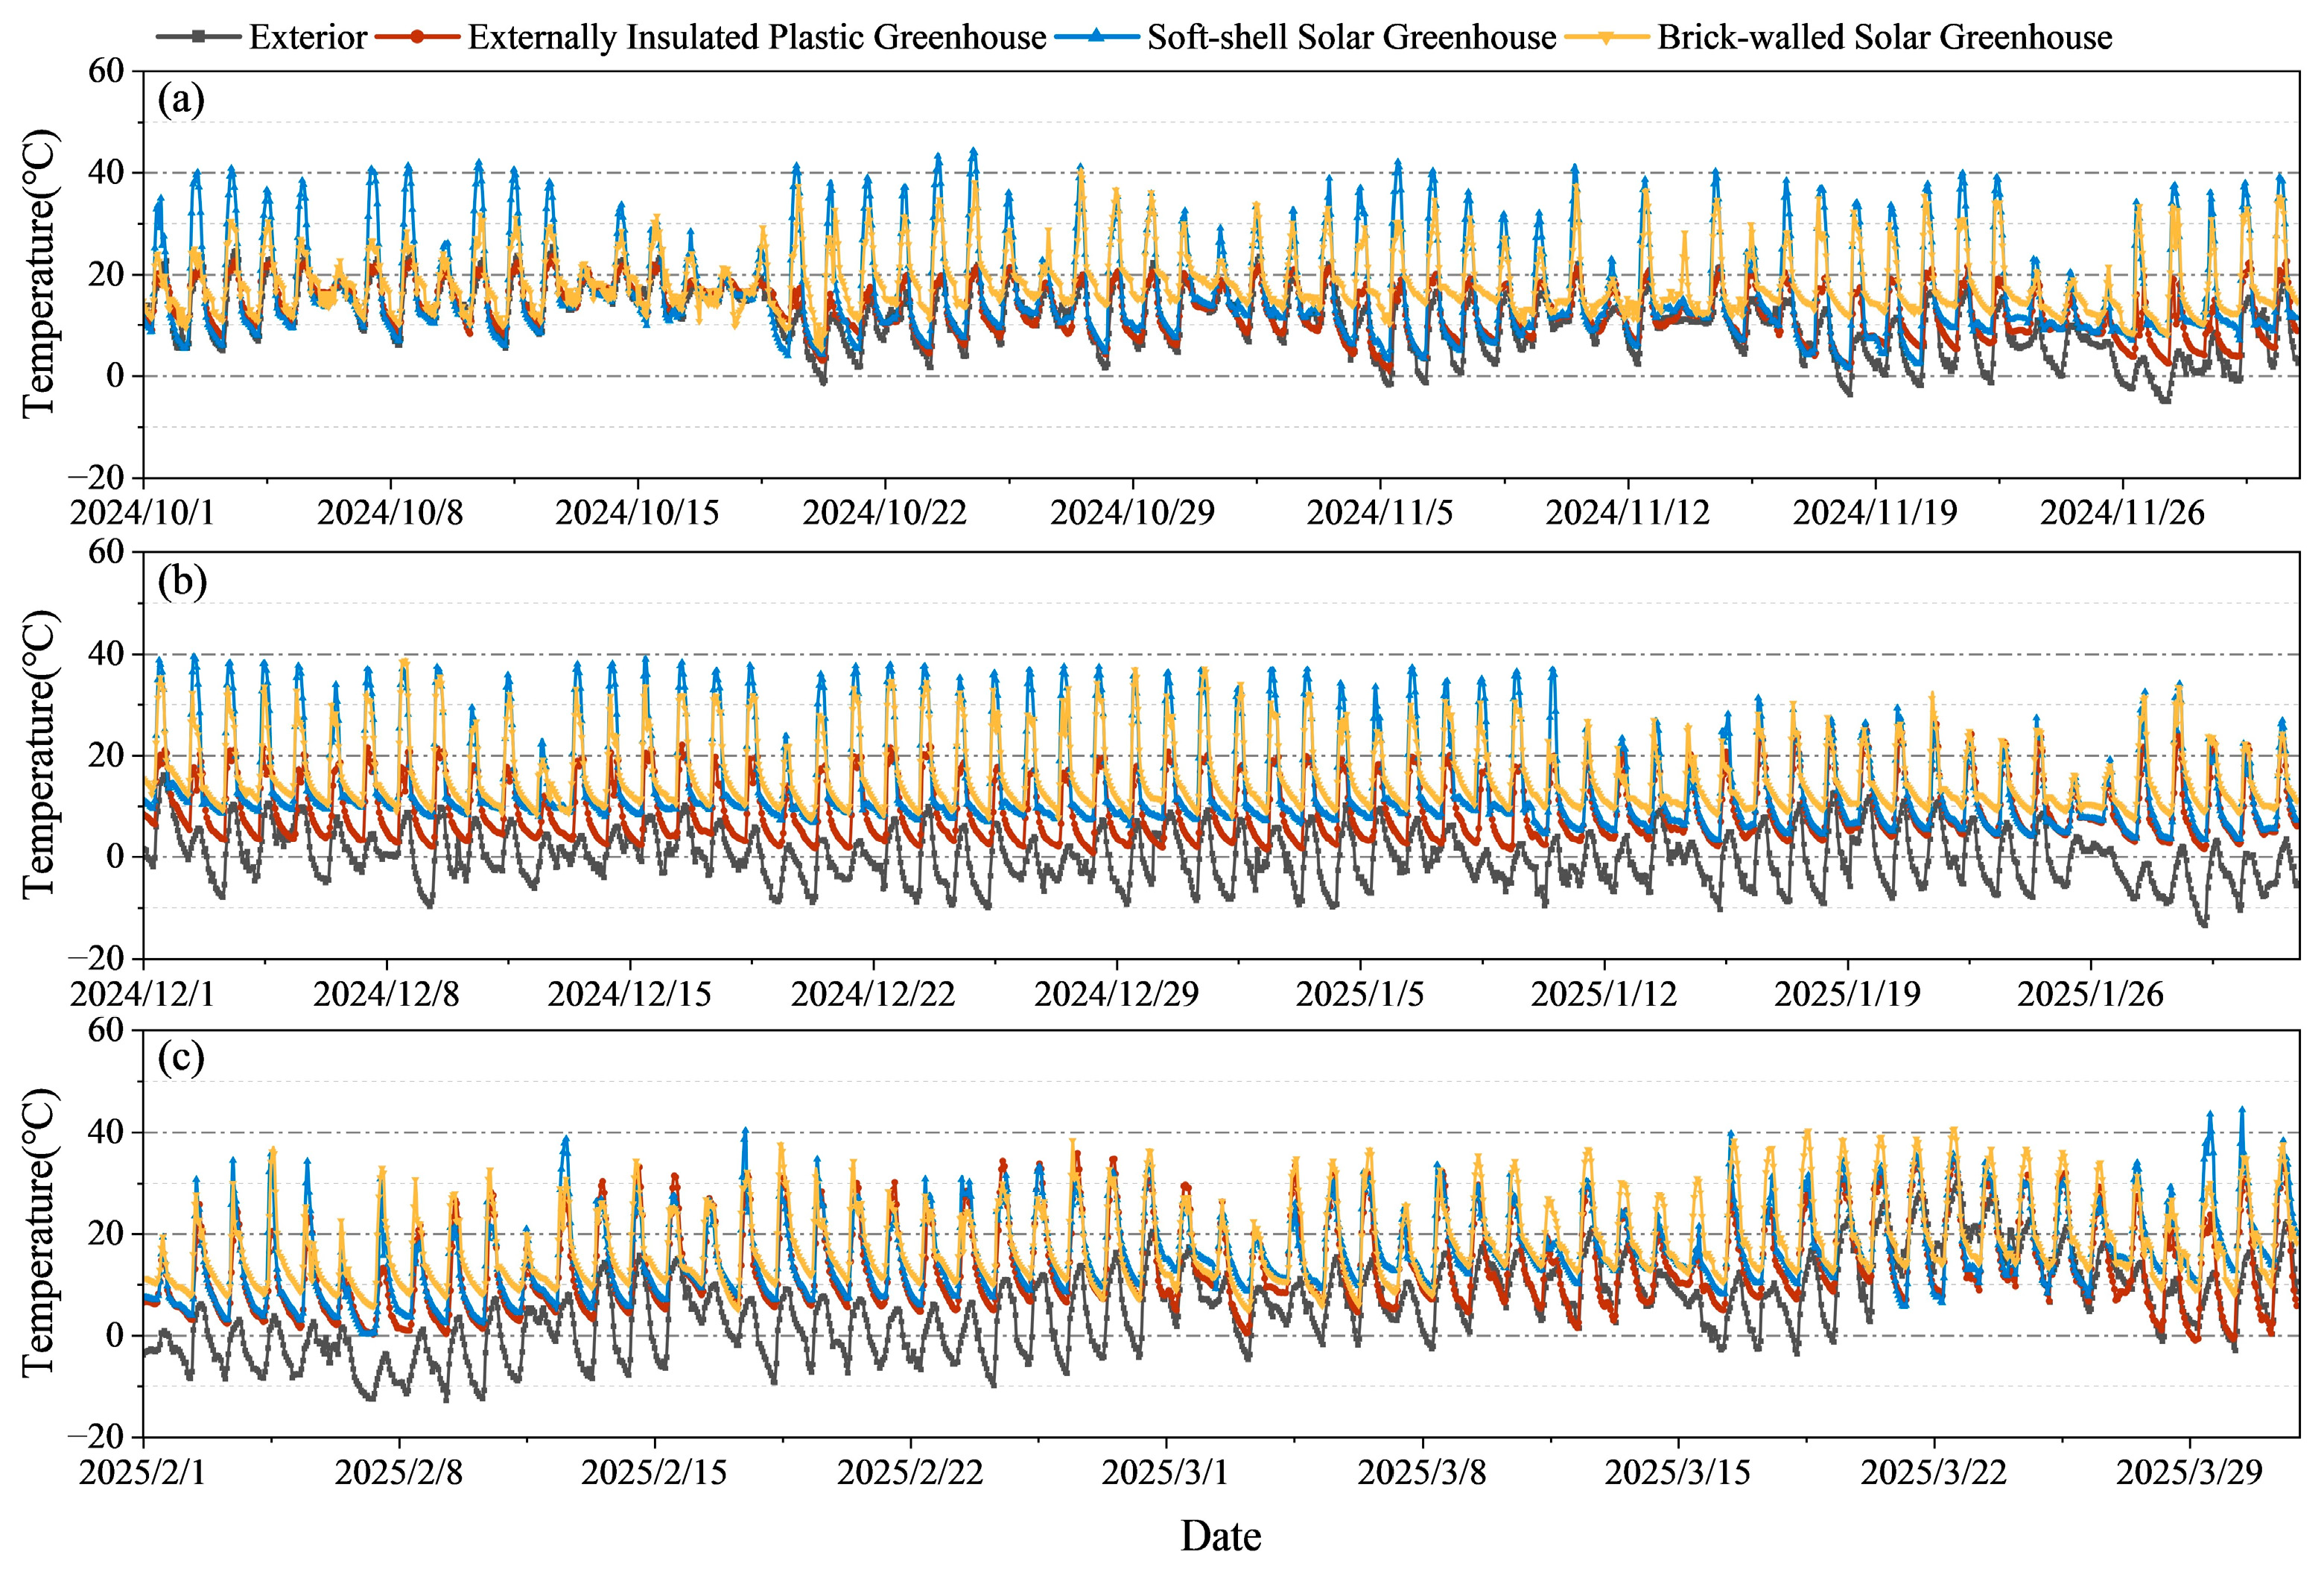
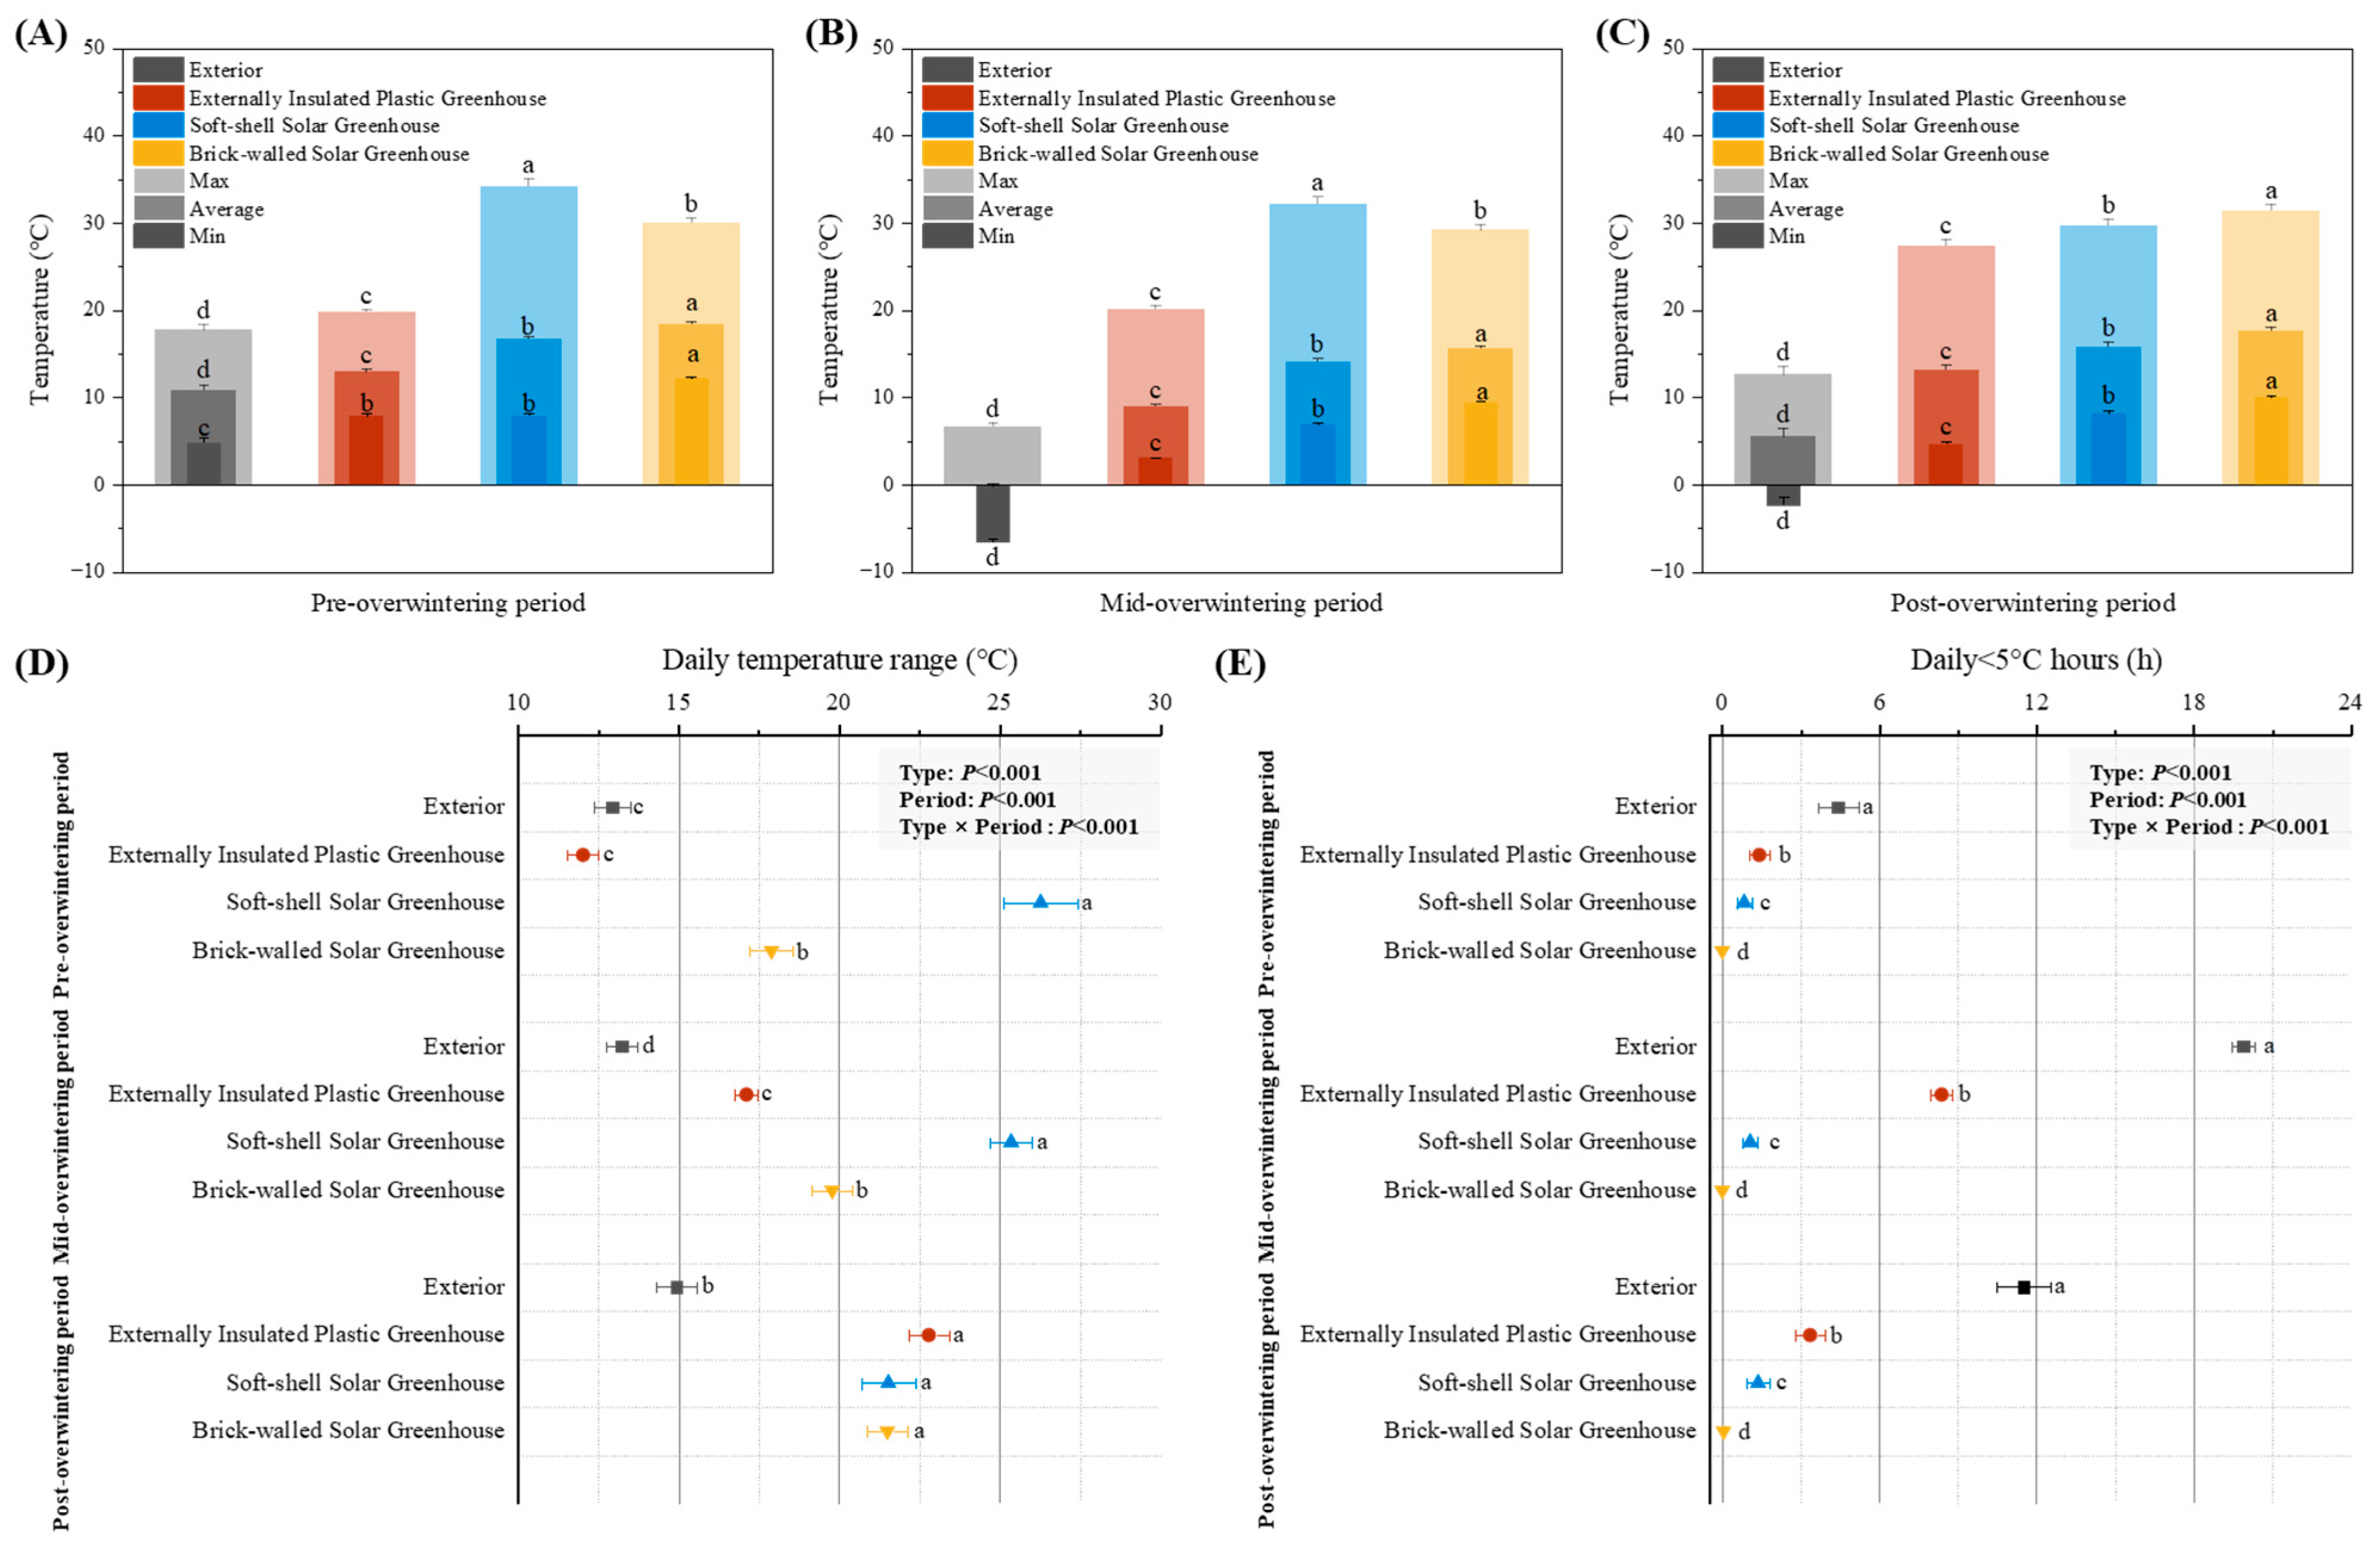
3.1. Air Temperature Indicators

The differences among the external environment, externally insulated plastic greenhouse, soft-shell solar greenhouse, and brick-walled solar greenhouse were systematically analyzed based on the hourly temperature monitoring data of different types of facilities in the three overwintering periods (Figure 2). During the pre-overwintering stage, temperature fluctuations in the external environment began to appear. In some periods, the temperature peaks of the soft-shell solar greenhouse and brick-walled solar greenhouse were prominent, while the externally insulated plastic greenhouse remained stable, and the thermal insulation characteristics of different structures were initially revealed (Figure 2a). During the mid-overwintering period (a severe cold phase), the external temperature exhibited lower values and violent fluctuations. The externally insulated plastic greenhouse, due to its thermal insulation design, experienced a significant temperature drop and low stability; the soft-shell solar greenhouse utilized solar energy for daytime heating and showed a certain nighttime temperature decline; and the brick-walled solar greenhouse maintained optimal temperature stability through wall heat storage, effectively withstanding the severe cold (Figure 2b). During the post-overwintering stage, the external temperature rebounded somewhat but fluctuations still existed. The temperature fluctuations of the soft-shell solar greenhouse and brick-walled solar greenhouse increased, but they still remained at a relatively high level, and the brick-walled greenhouse remained stable (Figure 2c). In general, in the three stages, each greenhouse effectively buffered the external temperature changes. Although the thermal insulation performance had its own characteristics due to differences in structural materials, they all provided a stable temperature guarantee for overwintering.
The average air temperature in each period was ordered as brick-walled > soft-shell > externally insulated plastic greenhouse > exterior (Figure 3A–C), indicating that different types of greenhouses can all play a certain heat-preservation role during the overwintering period, especially in the middle of the overwintering period (Figure 3B). During the mid-overwintering period, the average maximum temperature was recorded in the soft-shell solar greenhouse (32.2 °C), while the average minimum air temperature was observed in the externally insulated plastic greenhouse (3.0 °C). The diurnal temperature range of the brick-walled solar greenhouse and the externally insulated plastic greenhouse showed an increasing trend from the early to late overwintering stages, ranging from 17.9 to 21.5 °C and 12.0 to 22.8 °C, respectively. In contrast, the soft-shell solar greenhouse exhibited a decreasing trend in the diurnal temperature range, with values ranging from 26.3 to 21.5 °C (Figure 3D). During the mid- to post-overwintering period, the duration of exterior temperatures below 5 °C reached 11–19 h per day. However, the brick-walled solar greenhouse exhibited nearly zero hours below 5 °C, indicating its optimal thermal insulation performance. In contrast, the externally insulated plastic greenhouse experienced up to 8 h per day below 5 °C during the mid-overwintering period, while the soft-shell solar greenhouse showed approximately 1 h of such low temperatures (Figure 3E).

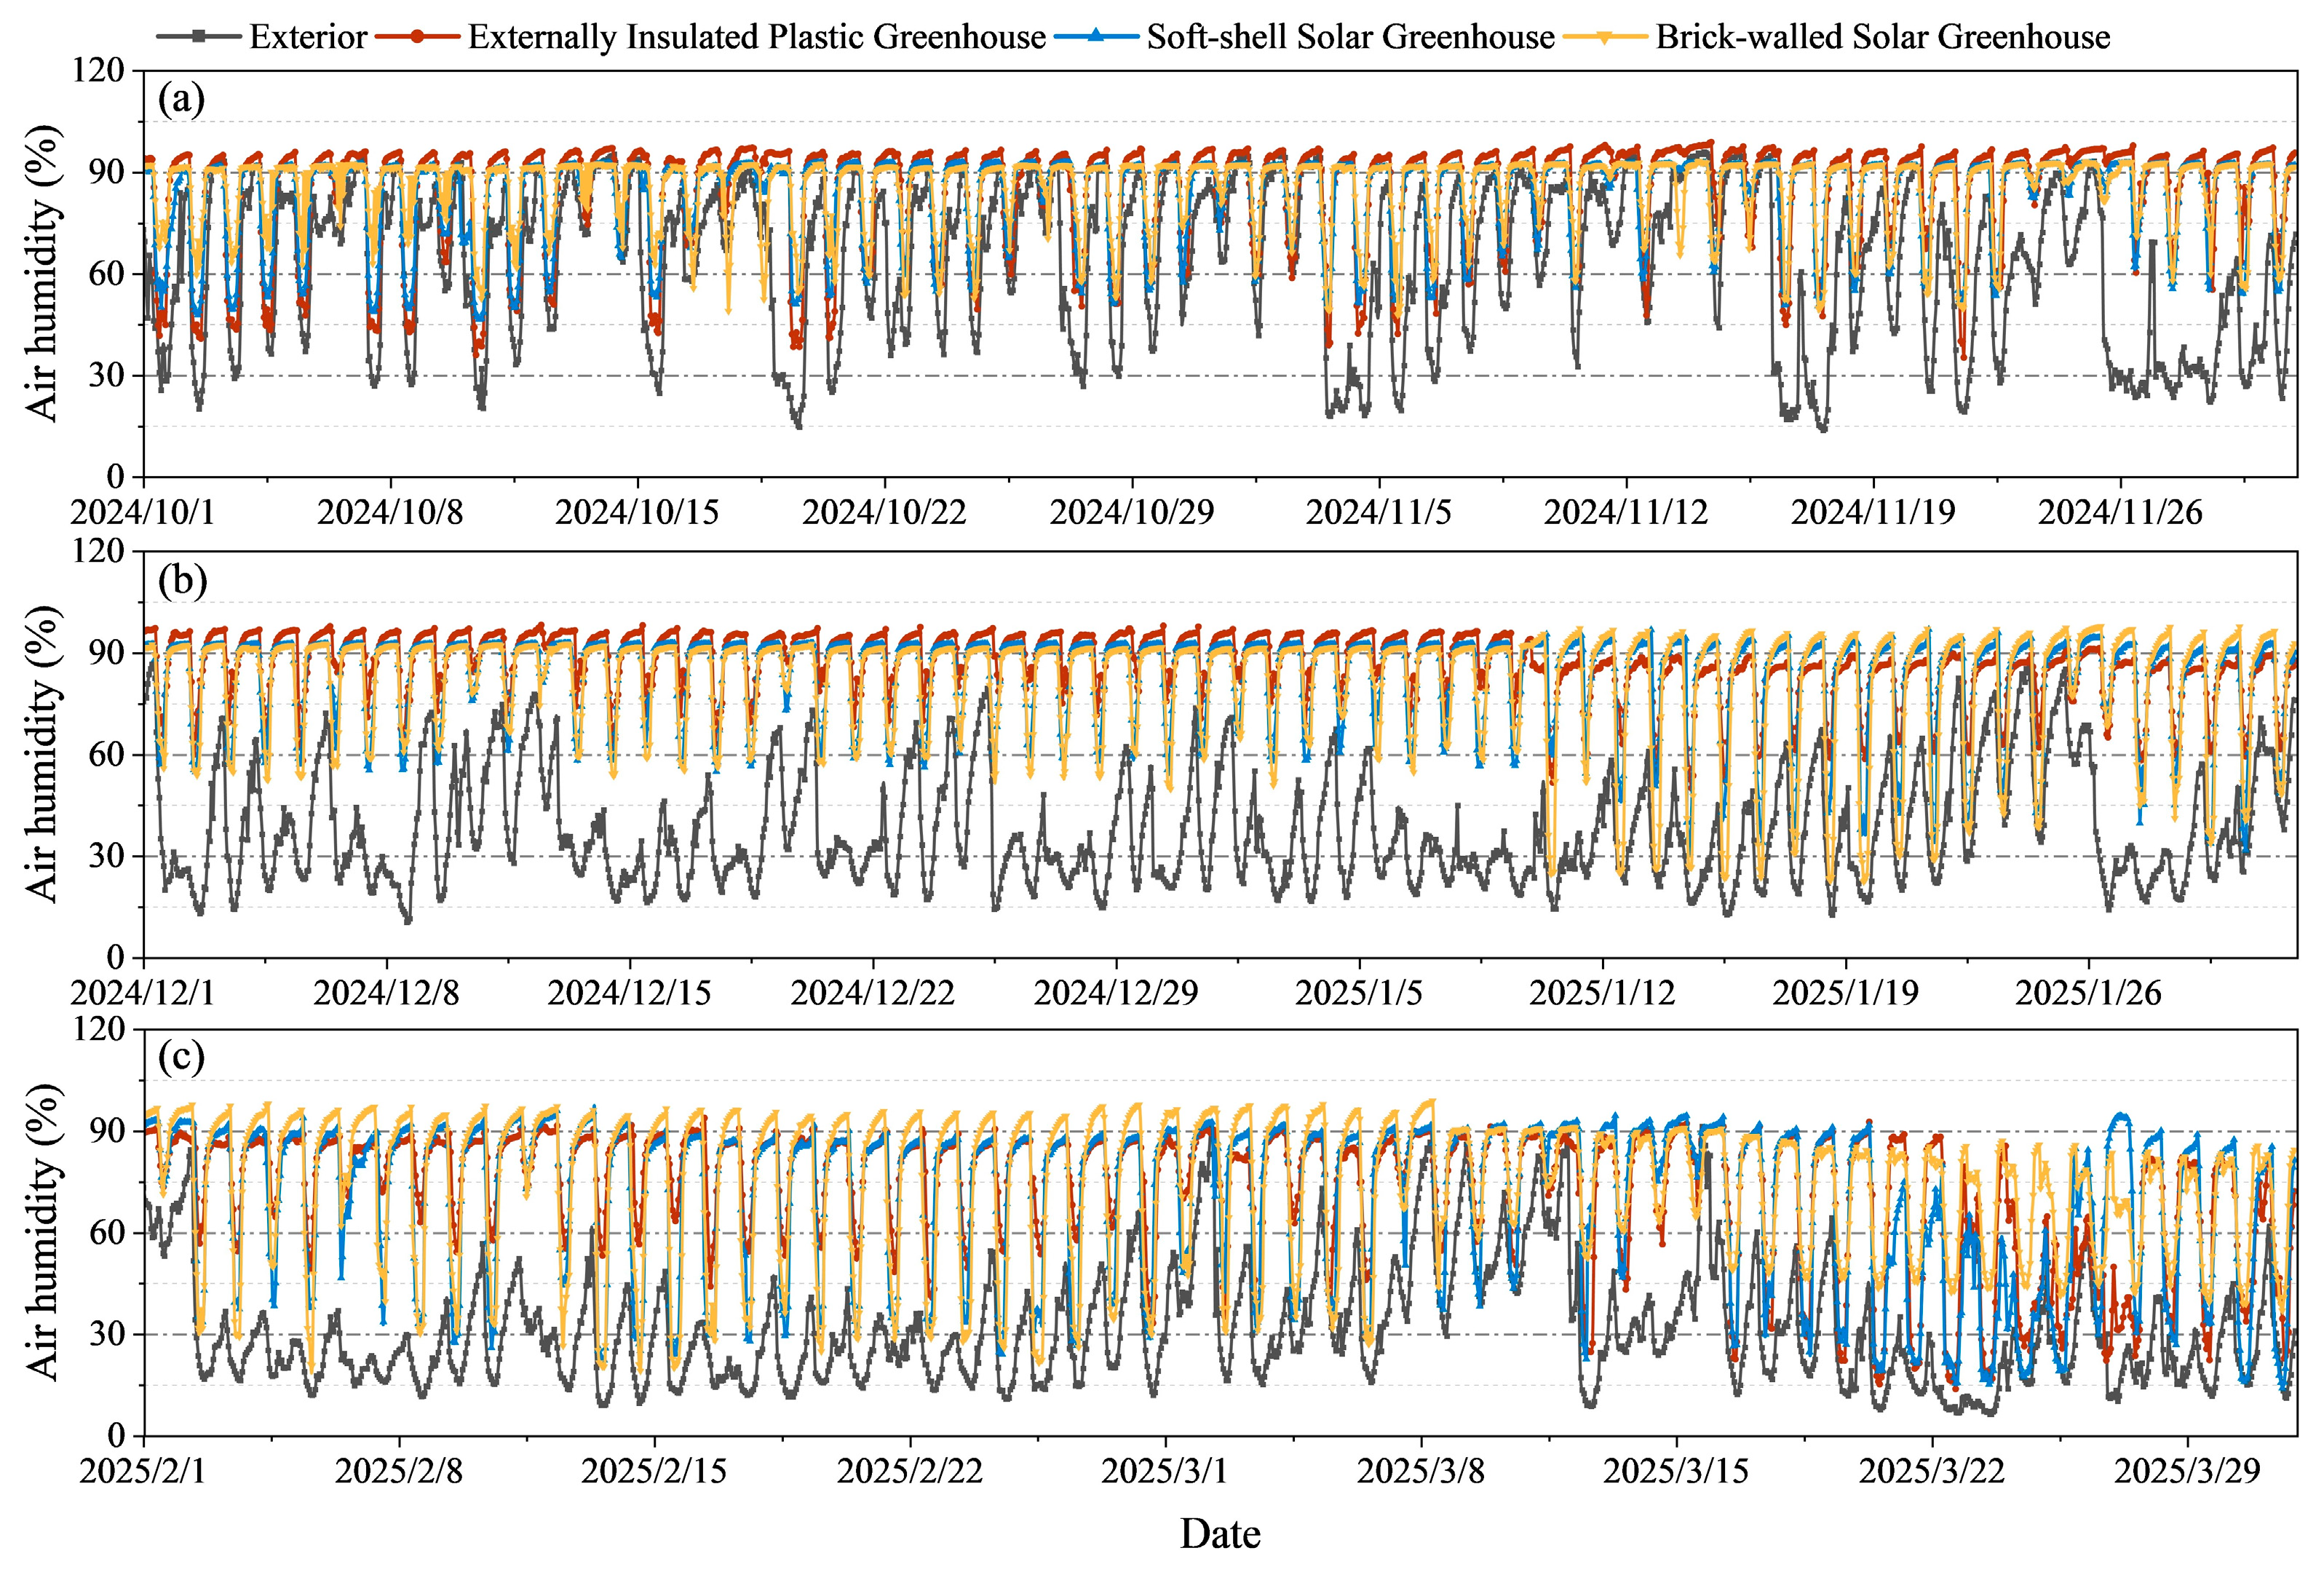
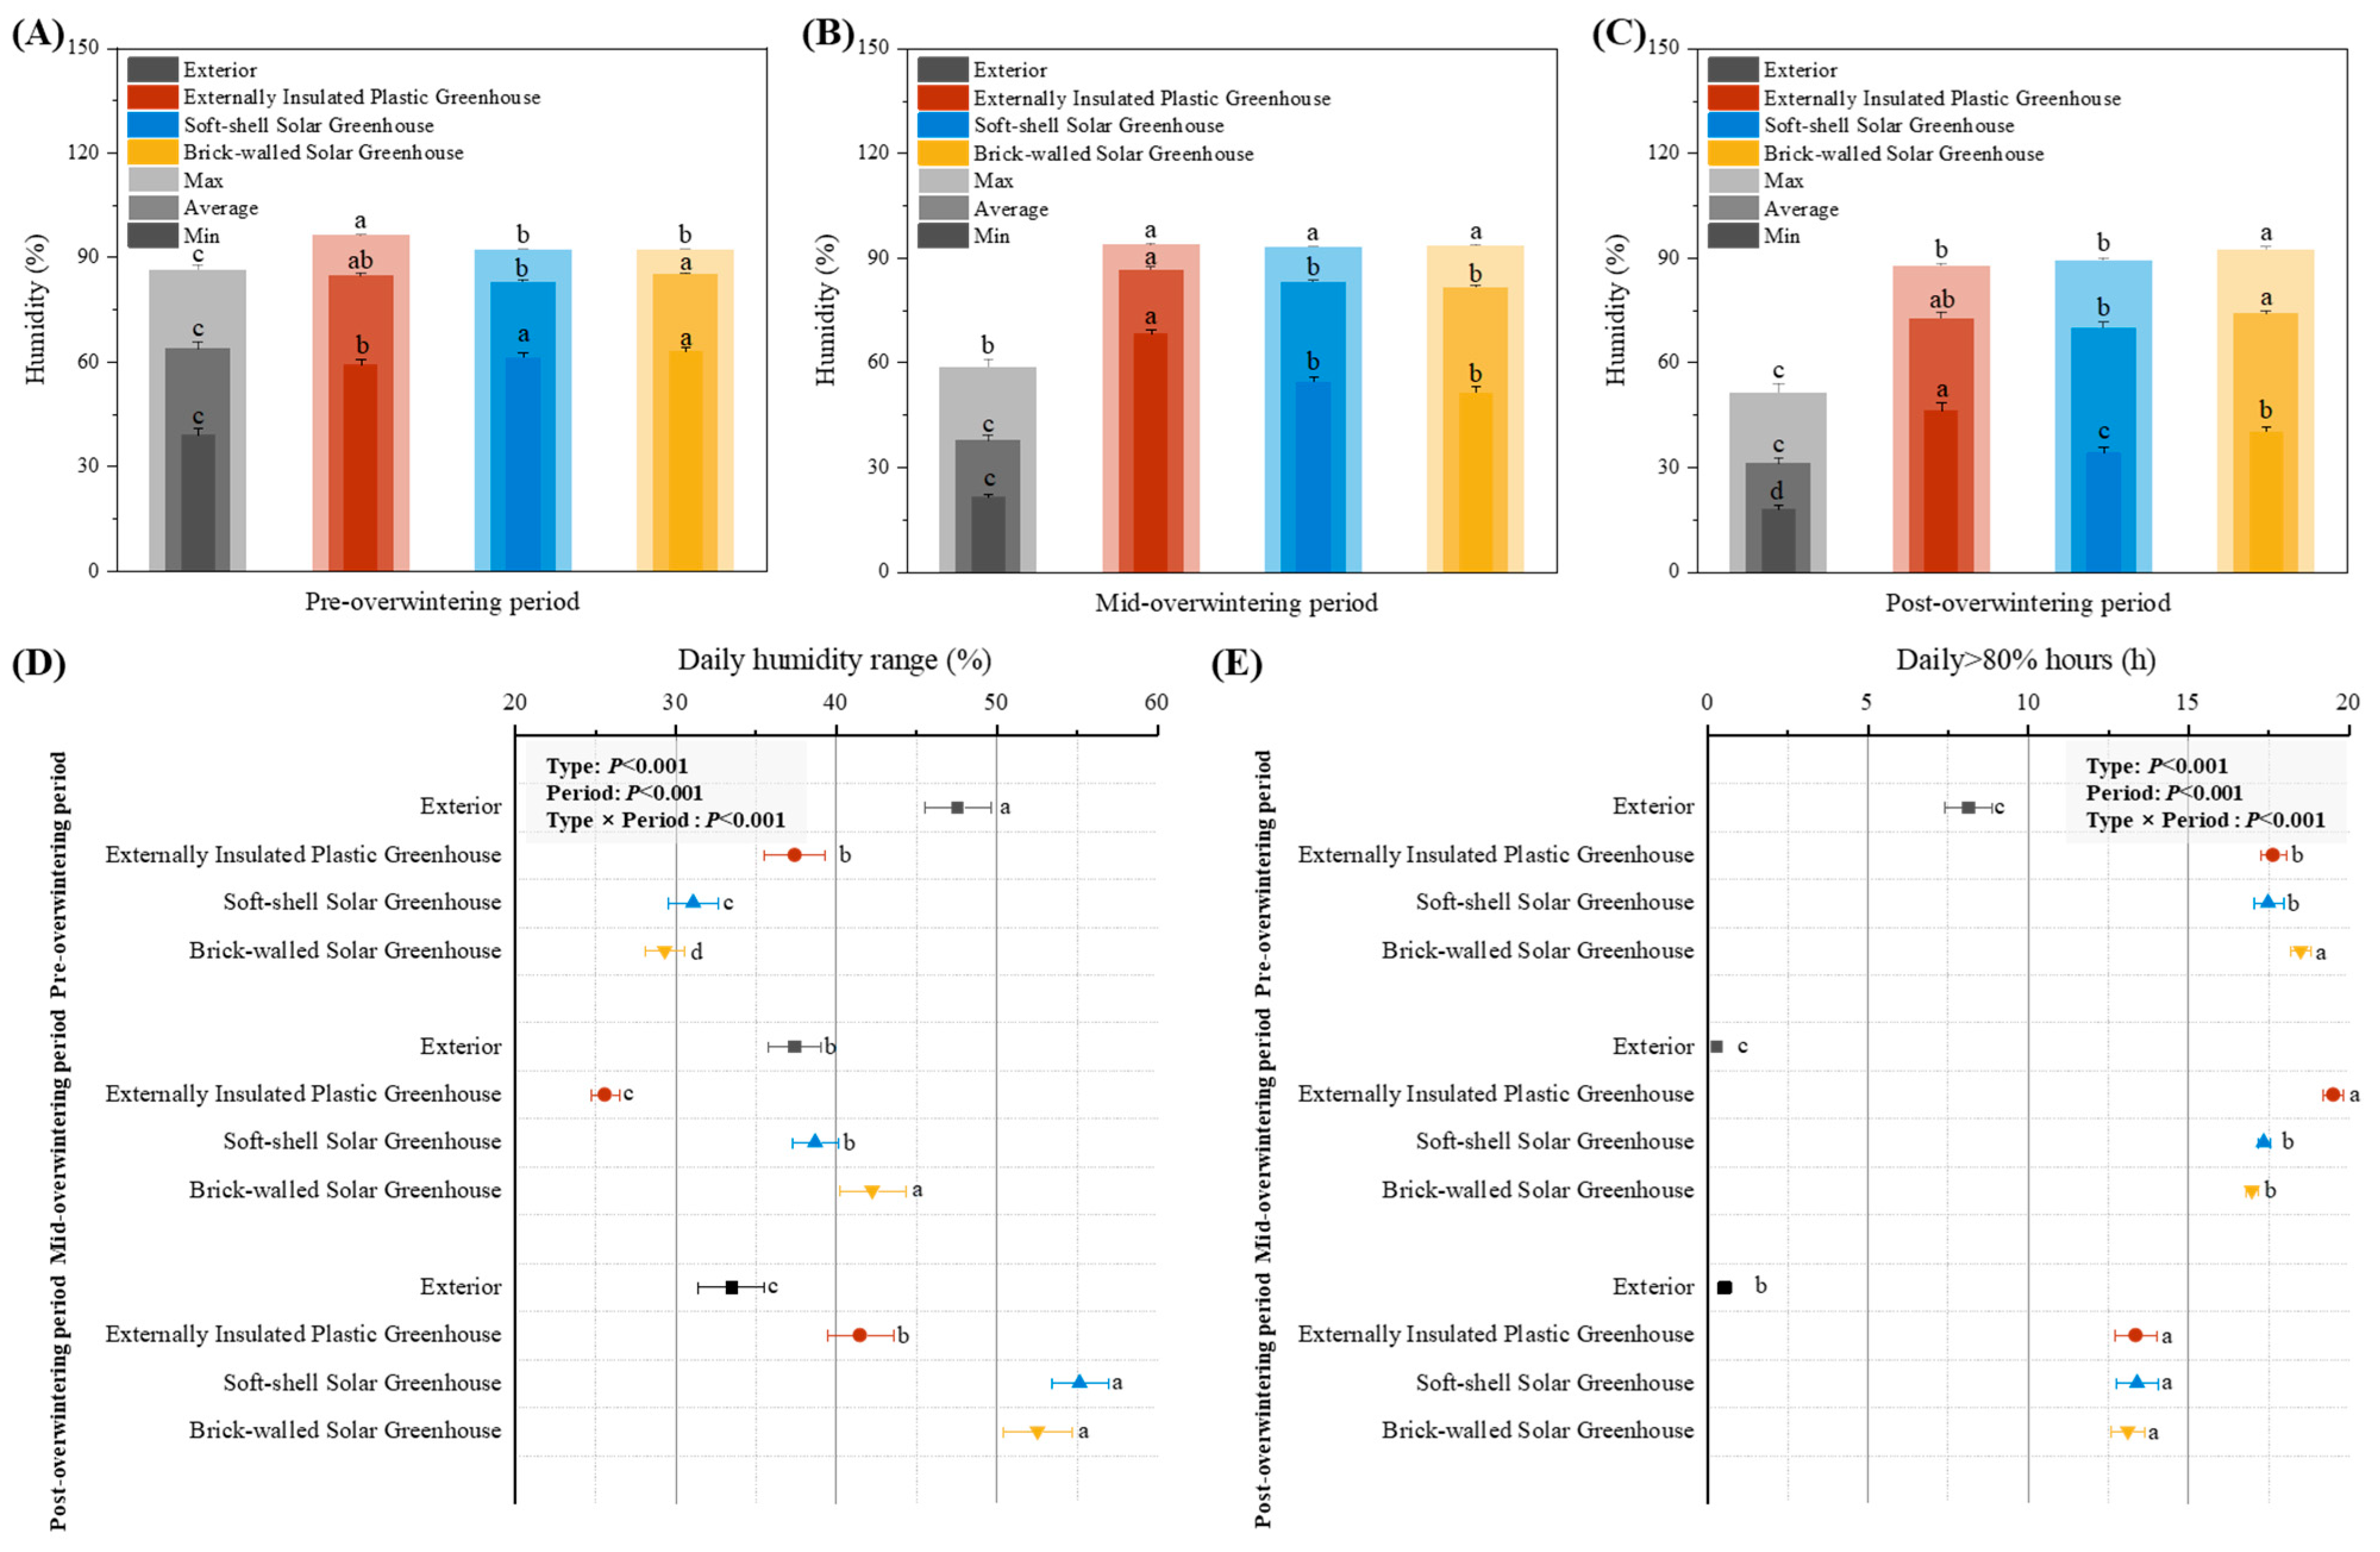
3.2. Relative Humidity Indicators

The differences among the external environment, externally insulated plastic greenhouse, soft-shell solar greenhouse, and brick-walled solar greenhouse were systematically analyzed based on the hourly relative humidity monitoring data of different types of facilities in the three overwintering periods (Figure 4). The results showed that during the pre- to mid-overwintering periods, the air relative humidity of the externally insulated plastic greenhouse remained at the highest level among the three types of greenhouses (Figure 4a,b). During the mid- to post-overwintering periods, the air relative humidity of the soft-shell solar greenhouse remained at the highest level (Figure 4b,c). The brick-walled solar greenhouse remained at an intermediate level throughout. The relative humidity of the external environment fluctuates most drastically. The three types of greenhouses can buffer external humidity changes in different overwintering stages and maintain a relatively high and little-fluctuating internal humidity environment. Although the humidity-change characteristics of different greenhouse types are slightly different, they all effectively regulate the drastic external fluctuations, providing relatively stable humidity conditions internally and contributing to the stability of the environment during the overwintering period.
The maximum air relative humidities of the three types of greenhouses all remained at a level greater than 90%, and the average air relative humidity of the soft-shell solar greenhouse was at the lowest level in different stages of the overwintering period (70.0–80.3%) (Figure 5A–C). During the pre-overwintering period, the humidity range of the externally insulated plastic greenhouse was the highest, reaching 37.4%. In the mid-overwintering period, the brick-walled solar greenhouse had the highest humidity range, reaching 42.3%. In the post-overwintering period, the soft-shell solar greenhouse had the highest humidity range, reaching 55.2% (Figure 5D). Throughout the overwintering period, the daily duration of relative humidity greater than 80% in different types of greenhouses ranged from approximately 13 to 19 h (Figure 5E).

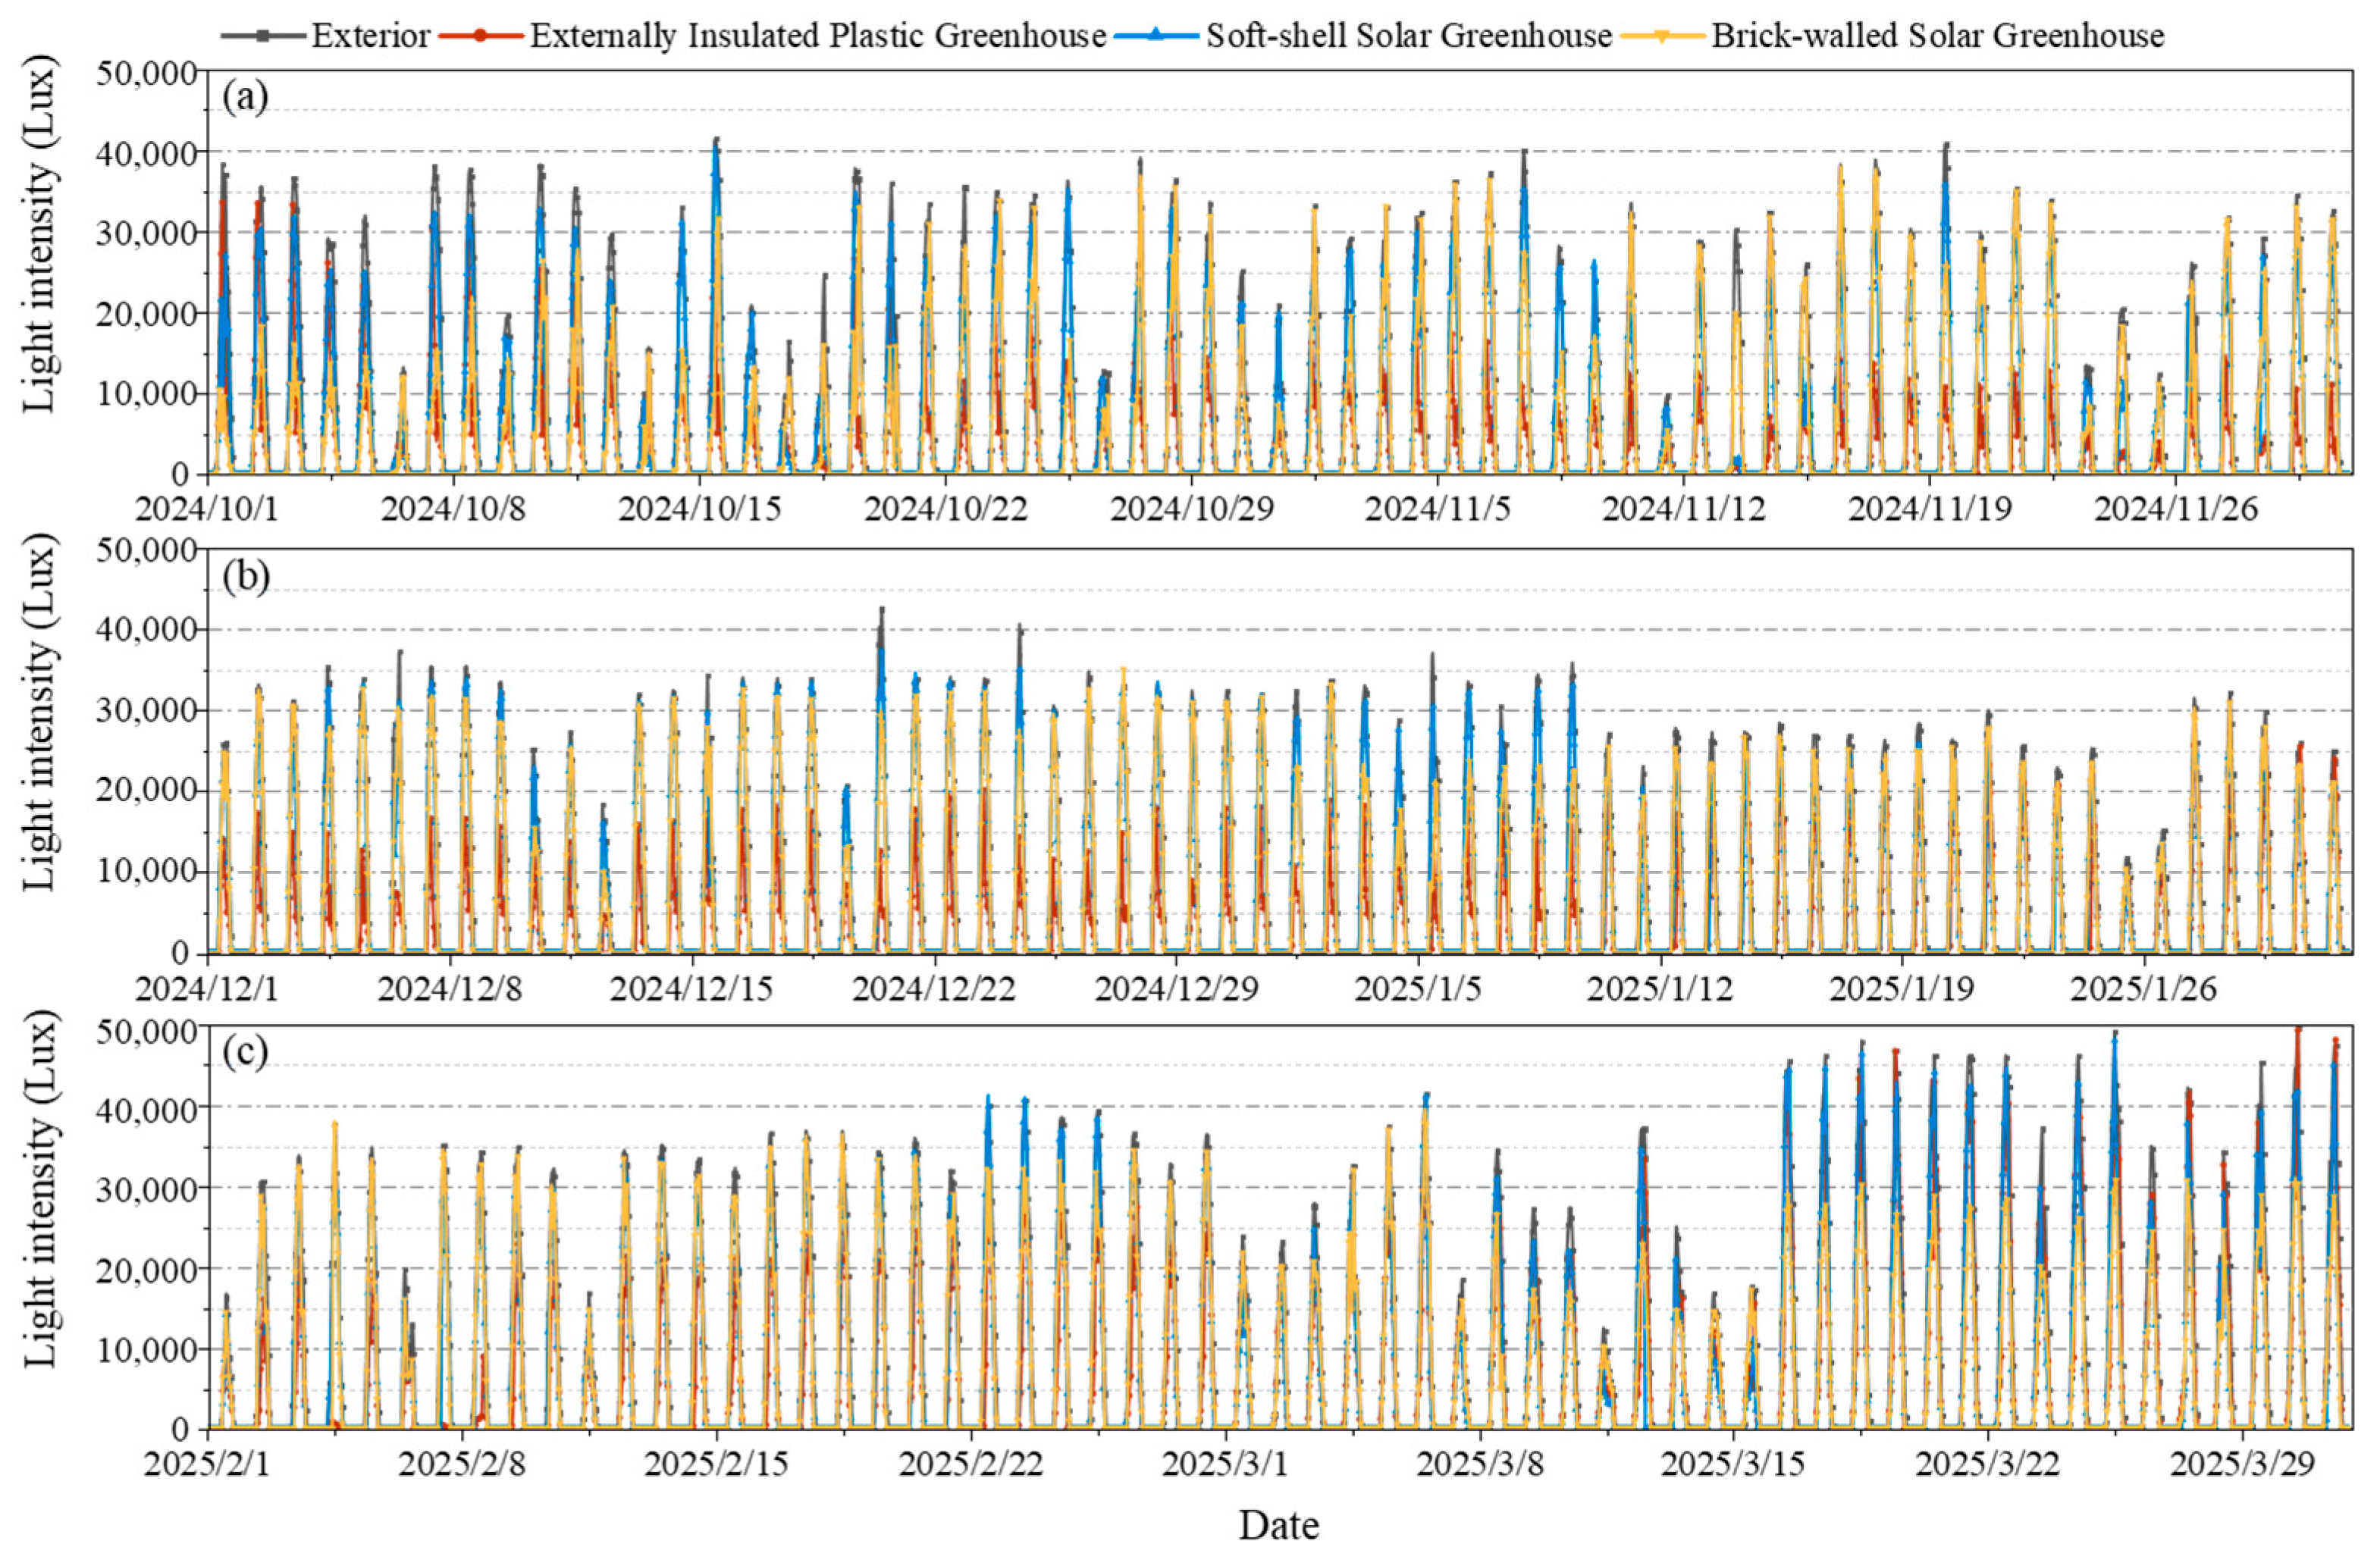
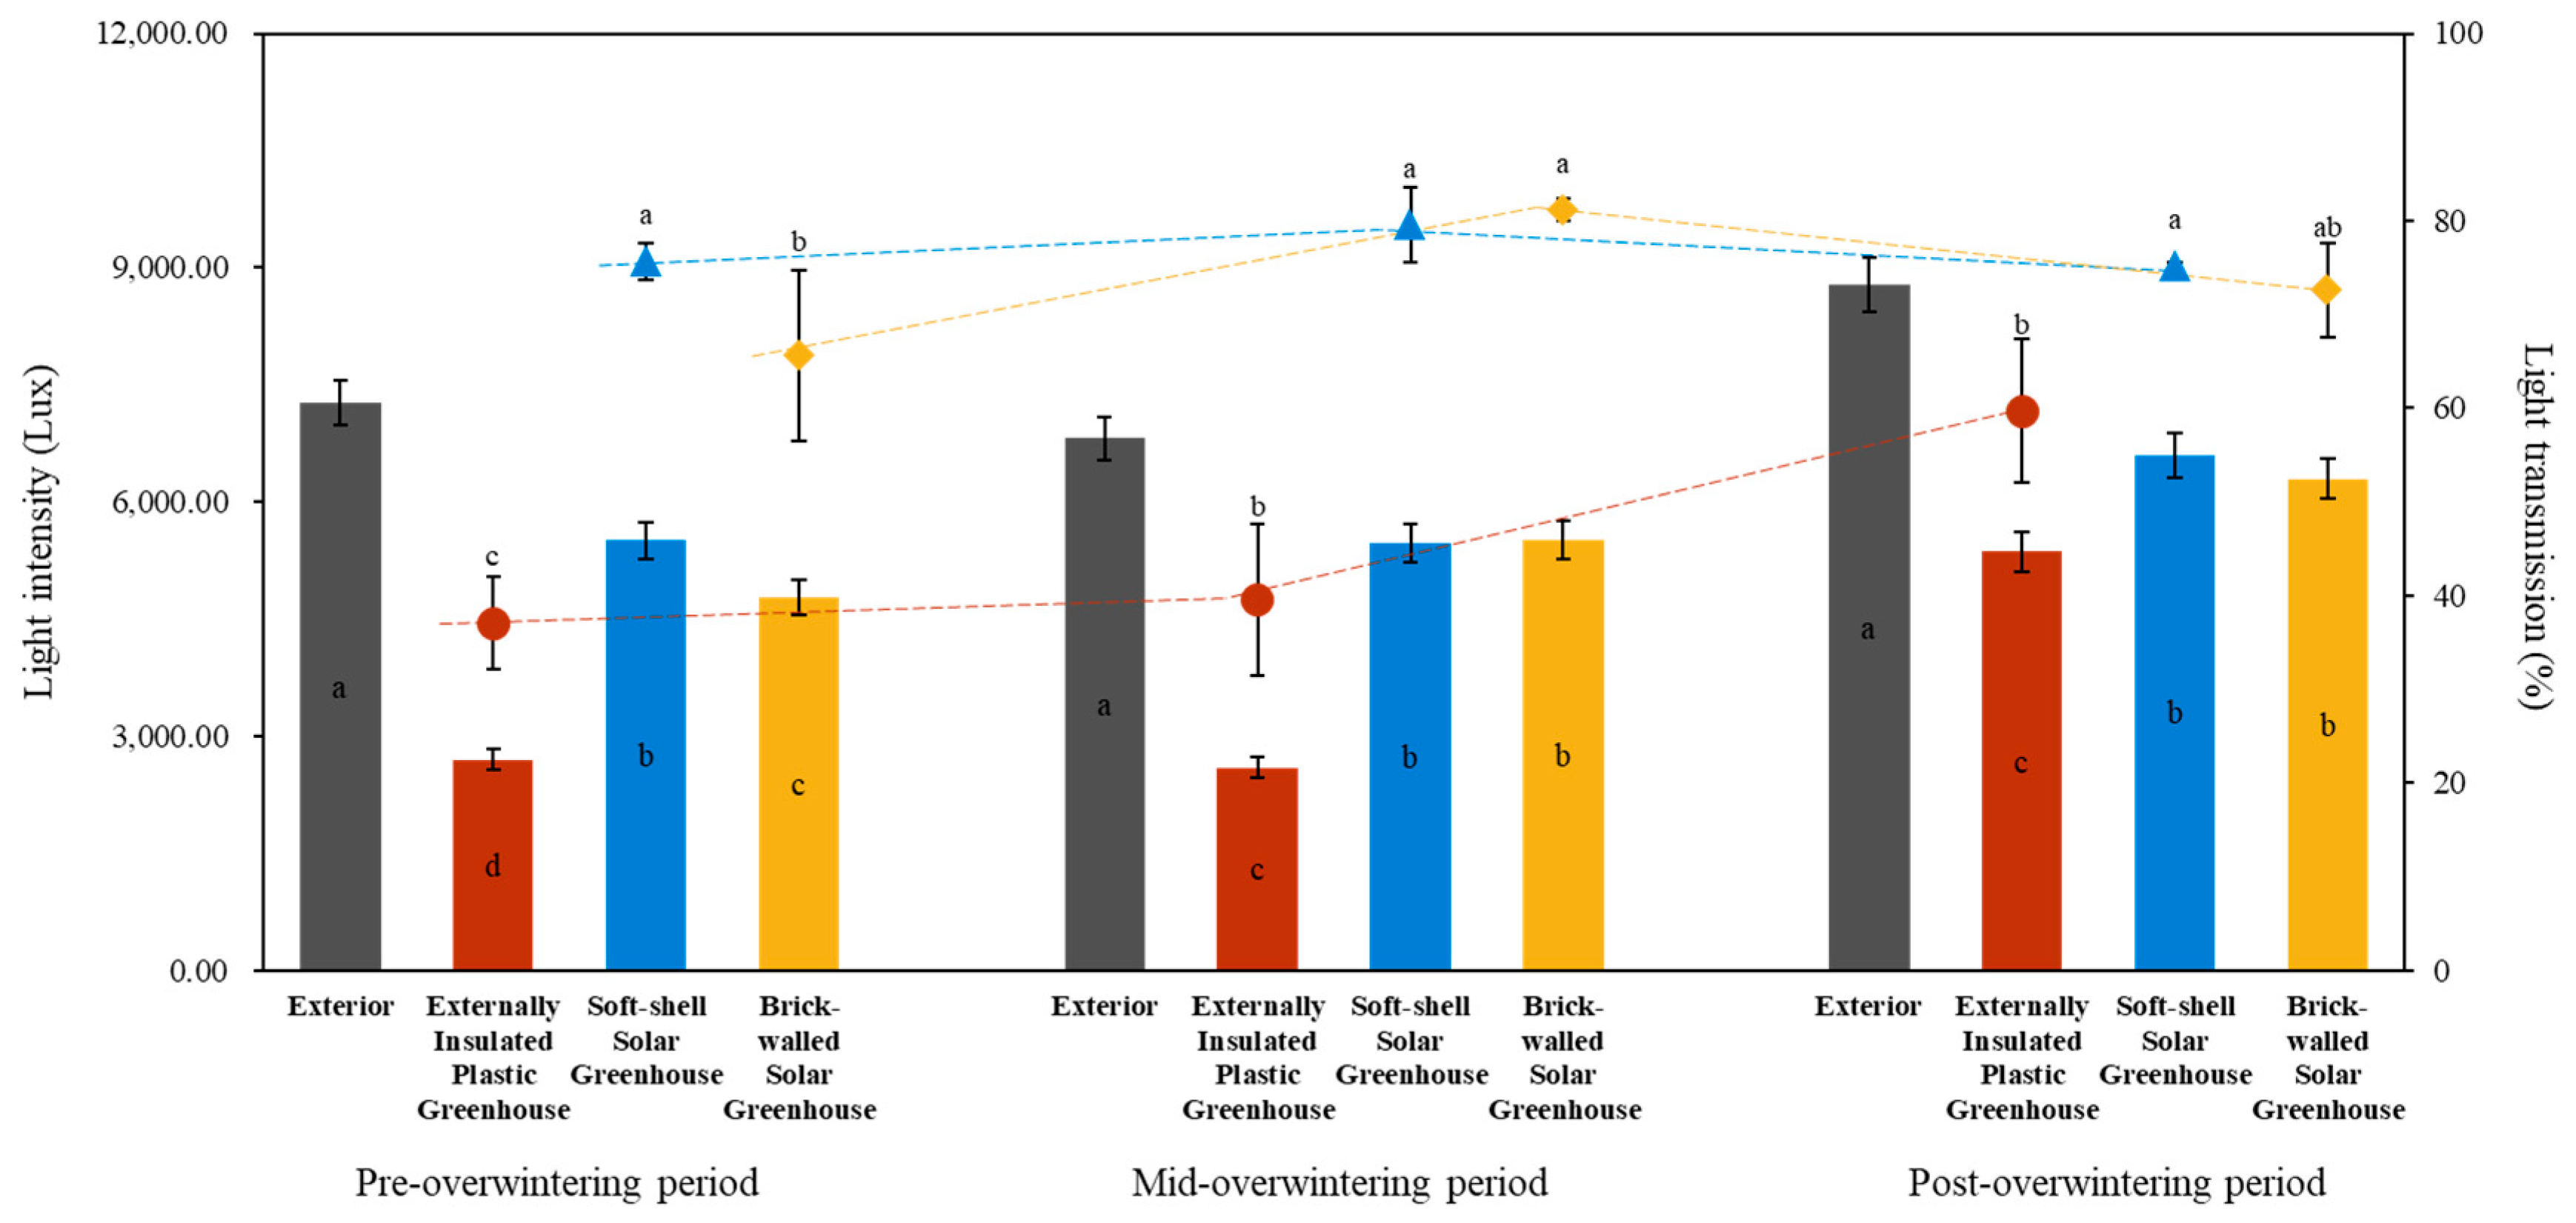
3.3. Light Intensity Indicators

The differences among the external environment, externally insulated plastic greenhouse, soft-shell solar greenhouse, and brick-walled solar greenhouse were systematically analyzed based on the hourly light intensity monitoring data of different types of facilities in the three overwintering periods (Figure 6). During the pre-overwintering period, the light intensity of the externally insulated plastic greenhouse remained at a relatively low level (Figure 6a). From the mid-overwintering period to the post-overwintering period, the light intensity of the externally insulated plastic greenhouse increased, and the light intensity of the soft-shell solar greenhouse essentially remained the highest among the three types of greenhouses (Figure 6b,c). In the post-overwintering period, the light intensity of the brick-walled solar greenhouses and externally insulated plastic greenhouse showed an upward trend (Figure 6c).
Throughout the overwintering period, the exterior light intensity showed a trend of first decreasing and then increasing (6811.0–8786.9 lux) (Figure 7). The average light intensity in greenhouses followed the order of soft-shell solar greenhouse (5472.9–6597.4 lux) > brick-walled solar greenhouse (4474.9–6298.3 lux) > externally insulated plastic greenhouse (2591.9–5362.0 lux). The light transmission of the brick-walled solar greenhouse (65.7–81.1%) and soft-shell solar greenhouse (75.1–79.6%) was significantly higher than that of the externally insulated plastic greenhouse (37.1–59.7%) (Figure 7). During the overwintering period, the light transmission of the brick-walled solar greenhouse and soft-shell solar greenhouse showed a trend of first increasing and then decreasing, but this trend was not significant. In contrast, the light transmission of the externally insulated plastic greenhouse showed a significantly increasing trend.

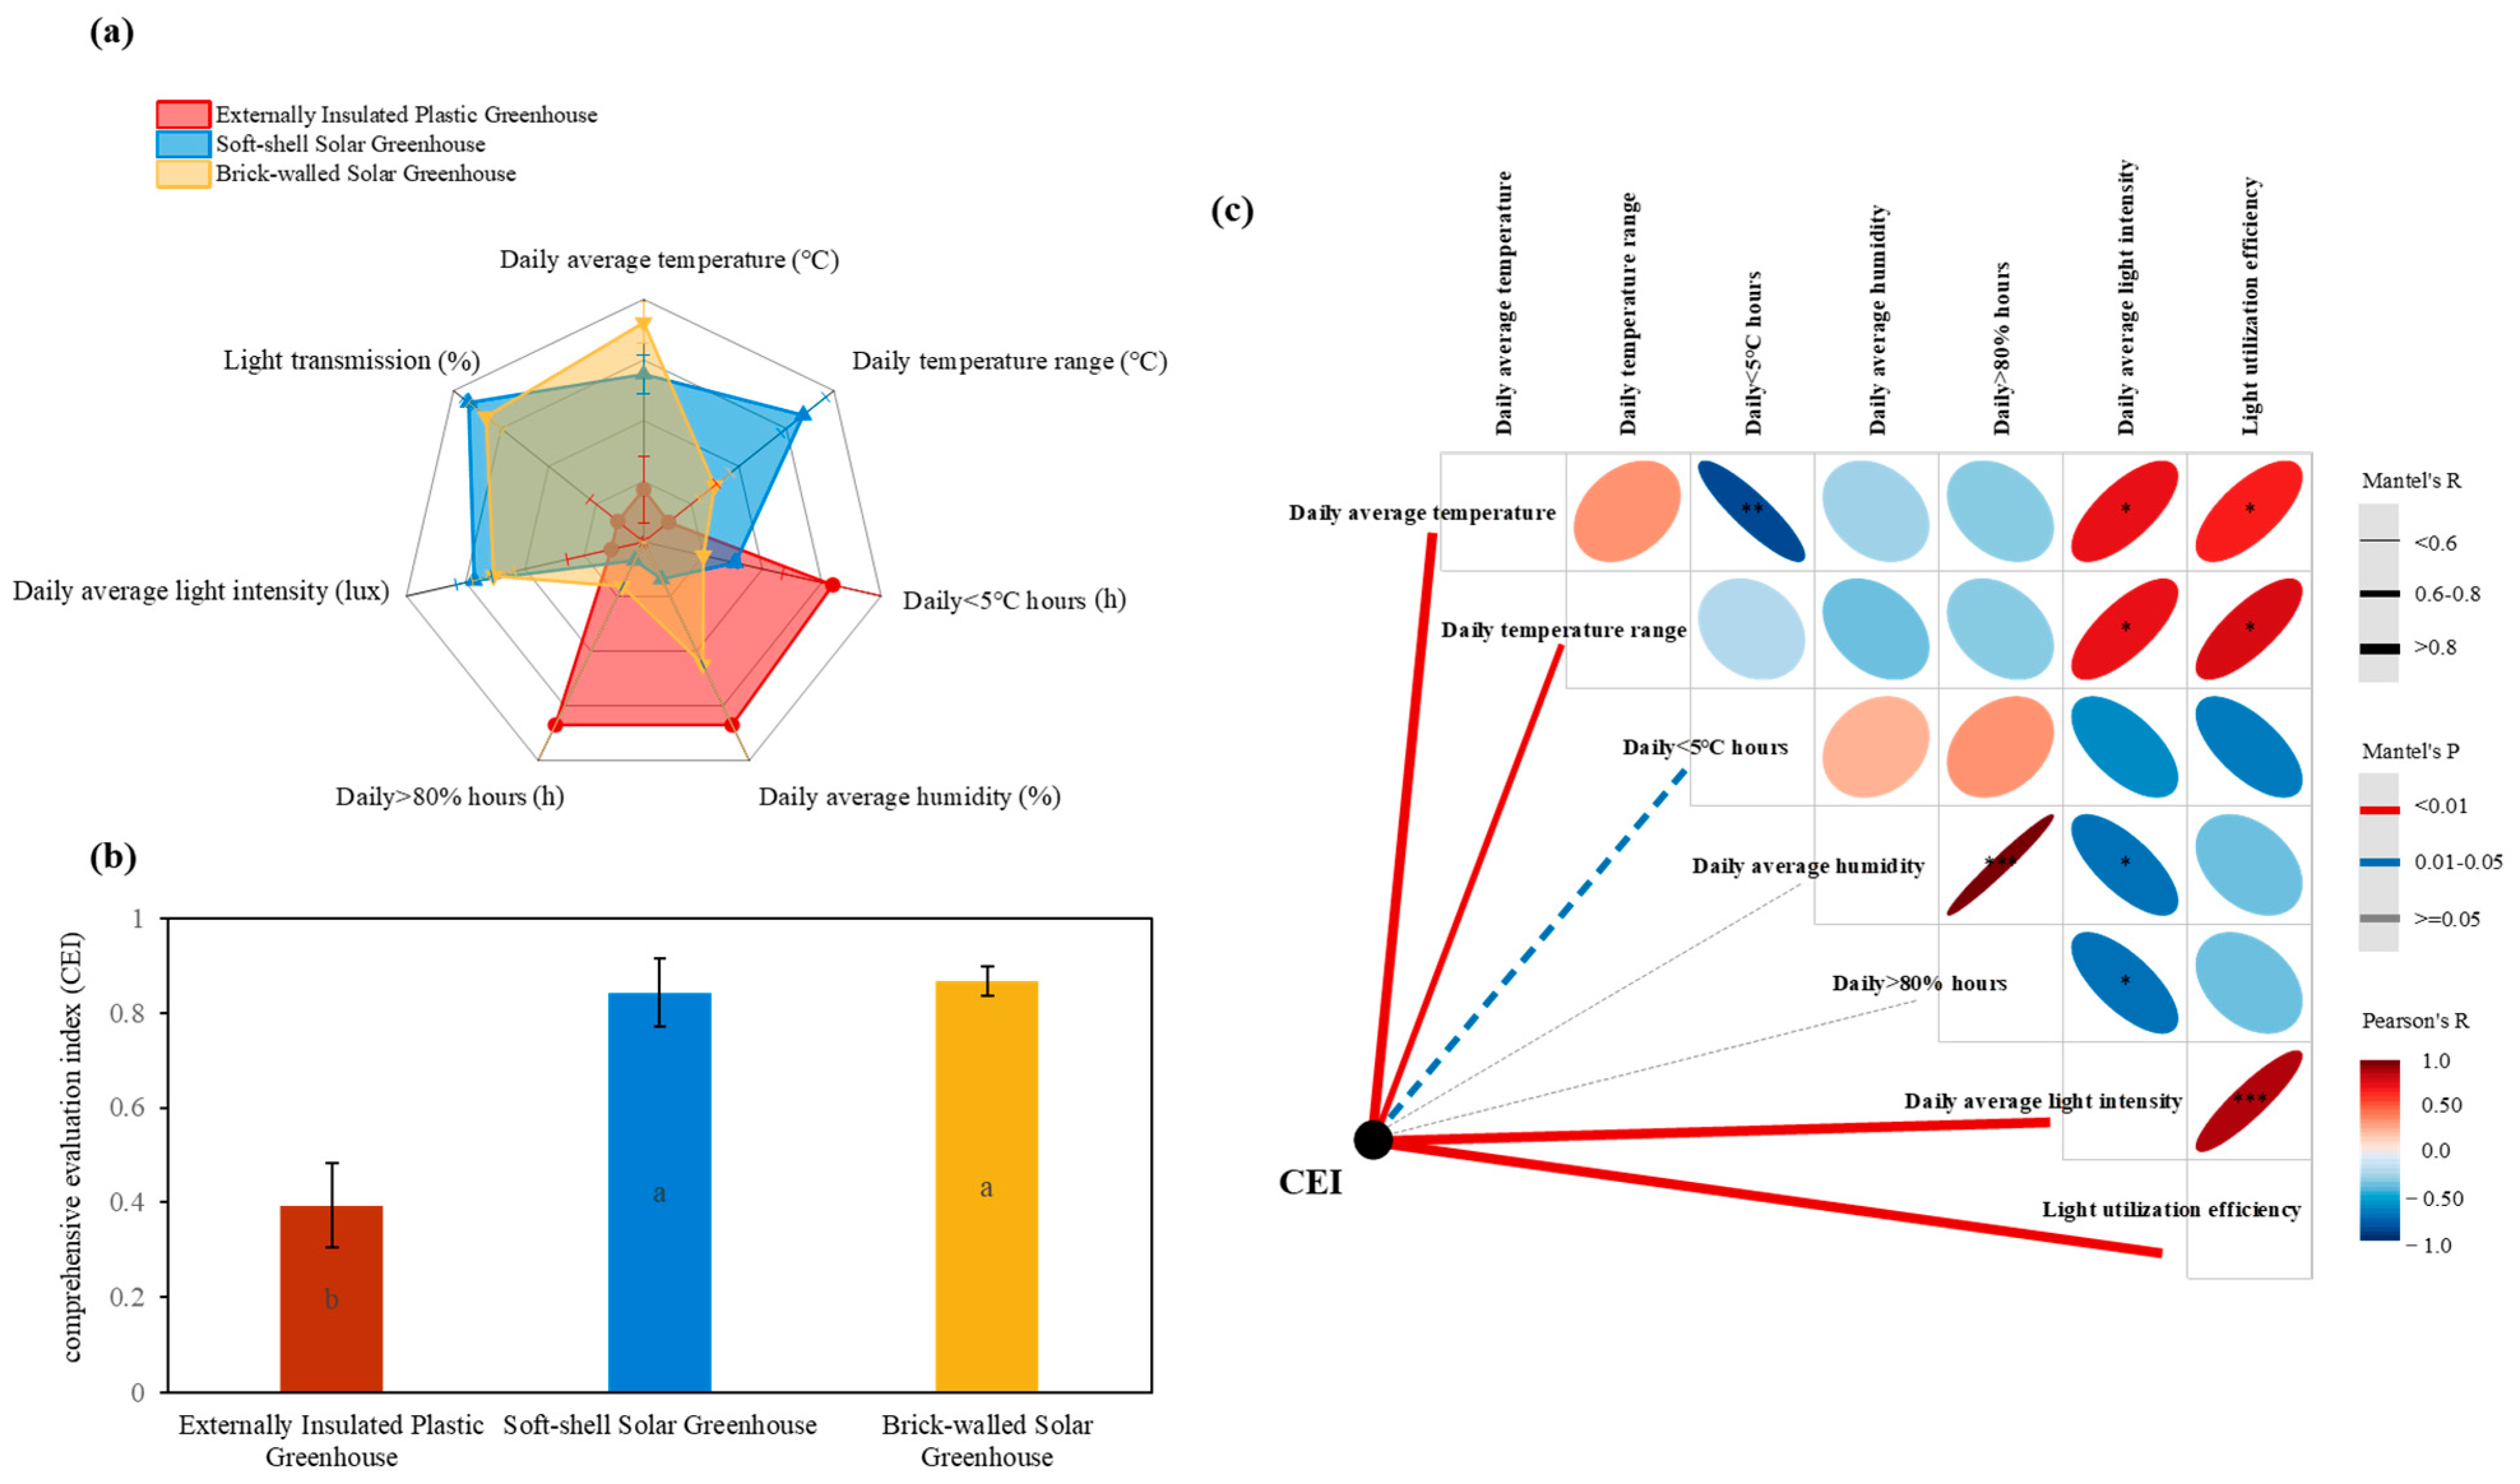
3.4. Greenhouse CEI and Its Relationship with Microclimate

The entropy method was used to conduct a comprehensive evaluation of the light–temperature–humidity environmental performance of different greenhouse types (Figure 8a-b). The results show that the soft-shell solar greenhouse performs better in diurnal temperature variation and light utilization, the brick-walled solar greenhouse has a better heat-preservation performance, and the externally insulated plastic greenhouse has higher moisture retention but poor heat preservation (Figure 8a). The CEI shows the following order: brick-walled (0.86) > soft-shell (0.84) > externally insulated plastic greenhouses (0.39). The brick-walled solar greenhouse is slightly higher than the soft-shell solar greenhouse but without a significant difference, which is reflected in the advantages of different environmental factors (Figure 8b).
The correlation analysis results indicate that the daily temperature range exhibits a significantly positive correlation with light intensity (p < 0.05), indicating a dynamic balance between temperature variation and light conditions. In contrast, humidity indicators show a significantly negative correlation with light intensity (p < 0.05), highlighting that condensation issues in high-humidity environments have a more pronounced impact on light transmittance during greenhouse microclimate regulation (Figure 8c). The CEI is significantly correlated with temperature and light indicators (p < 0.01), but not with humidity indicators (p > 0.05), suggesting that optimizing light and temperature environments remains the core objective in greenhouse comprehensive performance evaluation. Humidity management, however, requires coordinated regulation with light and temperature conditions, and further exploration of its independent effects should be conducted in conjunction with specific crop physiological response models (Figure 8c).

4. Discussion

The microclimate disparities among the three greenhouse types essentially reflect the interplay between structural design philosophies and material science advancements. Brick-walled solar greenhouses embody traditional agricultural wisdom through their “thick-wall heat storage” mechanism, leveraging the high thermal inertia of masonry structures to redistribute diurnal heat. This passive temperature regulation strategy demonstrates unique advantages under North China’s typical “low-temperature and low-light” winter climate: the walls absorb solar radiation during the day and store it as latent heat, releasing it gradually via long-wave radiation at night to buffer abrupt temperature drops [26,42,43]. While this “natural energy storage-delayed release” model slightly compromises light transmittance, it creates a nearly constant-temperature microenvironment for overwintering crops, particularly suitable for cold-sensitive solanaceous vegetables. In contrast, soft-shell solar greenhouses represent a modern agricultural innovation driven by material breakthroughs. Their multi-layer composite film materials achieve selective light transmission (e.g., high visible light transmittance with near-infrared reflectance), enhancing photosynthetically active radiation (PAR) utilization while suppressing non-functional heat gain [44,45]. This “precision light-transmission dynamic thermal insulation” design maintains high light transmission even during the mid-overwintering period with limited sunlight, but its heavy reliance on solar energy results in weaker nighttime temperature control compared to brick structures, highlighting the conceptual divide between active environmental control and passive design. The performance bottlenecks of externally insulated plastic greenhouses underscore the structural contradictions of traditional facilities: the combination of simple steel frames and a single-layer film, while cost-effective, struggles to balance thermal insulation, light transmittance, and ventilation [23,46]. The high humidity in these greenhouses not only elevates disease risks through condensation but also forms a “humidity–light” negative feedback loop by reducing light transmittance, exposing the adaptive limits of low-cost structures under extreme climates.
From the perspective of climate change adaptation, this study provides empirical evidence for CEA in North China to address the new challenges of “warm winters with cold extremes”. Recent trends show that rising regional winter temperatures have not reduced the frequency of extreme low-temperature events but instead intensified compound stresses like sporadic severe cold waves combined with persistent low light [32,47]. These new climatic normal demands multifunctional synergy in greenhouses. The stability of brick-walled solar greenhouses against extreme cold confirms the irreplaceable role of traditional structures in climate resilience, while the efficient light capture of soft-shell solar greenhouses under low-light conditions offers solutions to the production challenges of “weak light stress-insufficient photosynthesis” [48]. Notably, although externally insulated plastic greenhouses can partially improve microclimates through management adjustments (increased ventilation, optimized insulation blanket operation) in late overwintering, their structural limitations still fail to meet the needs of low-carbon and high-efficiency agriculture, contrasting with the policy-driven transition toward “energy-efficient and smart” CEA in North China.
This study provides the revelation of the “structure–function–stress” response mechanism in greenhouse microclimate regulation, where different structural types shape unique trajectories of temperature, light, and humidity control through variations in light-to-heat conversion efficiency (soft-shell greenhouses), thermal inertia (brick-walled greenhouses), or environmental closure (plastic greenhouses). However, this study has not fully elucidated the dynamic coupling between crop physiological processes and microclimate parameters—such as whether the stable low temperatures in brick-walled greenhouses delay crop development or whether the high light intensity in soft-shell greenhouses enhances crop stress resistance via photomorphogenesis, which require validation through physiological indicators like chlorophyll fluorescence and stomatal conductance. Meanwhile, the greenhouses in the study lacked repetition. There was only one sample for each type of greenhouse, and statistical analysis of only one year of data was conducted. Future research could explore the following directions: (1) developing machine learning-based cross-scale prediction models linking “greenhouse structure–microclimate–crop response” to enable intelligent inference from environmental monitoring to production decisions; (2) designing “phase-change material-enhanced brick walls + dimmable smart film” hybrid structures to surpass the performance limits of traditional greenhouses in light and heat regulation; and (3) conducting multi-site validation across the Beijing–Tianjin–Hebei region to define the climatic adaptability boundaries of different greenhouse types and provide refined guidance for the regional CEA layout. These explorations will not only refine the theoretical framework of controlled-environment agriculture but also provide critical technical support for green agricultural transformation under the “double carbon” goals.

5. Conclusions

This study systematically investigates the microclimate dynamics of three greenhouse types (externally insulated plastic greenhouse, soft-shell solar greenhouse, and brick-walled solar greenhouse) during the overwintering period in North China, addressing the urgent need to optimize greenhouse structures under climate change. The key innovations lie in 1) establishing a Comprehensive Evaluation Index (CEI) based on the entropy method to integrate seven microclimate indicators (temperature, humidity, light intensity), enabling a quantitative assessment of greenhouse performance; 2) revealing that brick-walled solar greenhouses excel in thermal insulation (nearly zero hours <5 °C in mid-winter) while soft-shell solar greenhouses achieve the highest light transmission (75.1–79.6%), outperforming externally insulated plastic greenhouses (CEI: 0.86, 0.84, 0.39); and 3) identifying that relative humidity negatively correlates with light transmittance (p < 0.05), while temperature and light indicators show strong positive correlations with the CEI (p < 0.01), highlighting the critical role of structural design in balancing thermal-light performance. These findings fill the gap in our understanding of the dynamic evaluation of greenhouse microclimates across the entire overwintering cycle and provide a scientific basis for regional layout planning. Future research may explore crop-physiology-based microclimate optimization and machine learning-driven predictive models to advance climate-resilient controlled-environment agriculture.

Author Contributions

Conceptualization, X.L. and Y.T. (Yanan Tian); methodology, H.Z., W.L. and Y.W.; software, S.L. and Y.T. (Yuan Tao); validation, N.Z. and D.S.; formal analysis, H.L.; investigation, H.L. and Y.T. (Yuan Tao); resources, N.Z. and X.L.; data curation, H.L. and T.W.; writing—original draft preparation, H.L., H.Z., S.L., W.L., T.W. and Y.T. (Yuan Tao); writing—review and editing, Y.W., Y.T. (Yanan Tian), N.Z. and X.L.; visualization, H.L., S.L., D.S. and T.W.; supervision, N.Z. and X.L.; project administration, Y.T. (Yanan Tian) and X.L.; funding acquisition, Y.T. (Yanan Tian) and X.L. All authors have read and agreed to the published version of the manuscript.

Funding

This research was funded by the Beijing Rural Revitalization Agriculture Science and Technology Project (Grant No. NY2502030025), the Modern Agricultural Industrial Technology System Beijing Facility Vegetable Innovation Team Science and Technology Project (Grant No. BAIC01-2025), and the Science and Technology Support for Rural Industrial Revitalization Project (Grant No. Z221100006422003).

Data Availability Statement

The original contributions presented in this study are included in the article. Further inquiries can be directed to the corresponding authors.

Acknowledgments

We are thankful for the greenhouse and test materials provided by the JinHuinong Agricultural Cooperative of Changping District.

Conflicts of Interest

The authors declare no conflicts of interest.

References

  1. Fuglie, K. Climate change upsets agriculture. Nat. Clim. Chang. 2021, 11, 294–295. [Google Scholar] [CrossRef]
  2. Filonchyk, M.; Peterson, M.P.; Zhang, L.F.; Hurynovich, V.; He, Y. Greenhouse gases emissions and global climate change: Examining the influence of CO2, CH4, and N2O. Sci. Total Environ. 2024, 935, 173359. [Google Scholar] [CrossRef] [PubMed]
  3. Garg, S.; Rumjit, N.P.; Arora, P. Addressing climate change impacts through sustainable agricultural solutions: A review. Environ. Dev. Sustain. 2024. [Google Scholar] [CrossRef]
  4. Lee, M.H.; Yao, M.H.; Kow, P.Y.; Kuo, B.J.; Chang, F.J. An artificial intelligence-powered environmental control system for resilient and efficient greenhouse farming. Sustainability 2024, 16, 10958. [Google Scholar] [CrossRef]
  5. Belolyubtsev, A.I.; Dronova, E.A.; Ilinich, V.V.; Avdeev, S.M.; Asaulyak, I.F. Agricultural Risks of Winter Season in the Modern Changing Climate. Russ. Meteorol. Hydrol. 2023, 48, 818–822. [Google Scholar] [CrossRef]
  6. Ni, H.; Hu, H.; Zohner, C.M.; Huang, W.G.; Chen, J.; Sun, Y.S.; Ding, J.X.; Zhou, J.Z.; Yan, X.Y.; Zhang, J.B.; et al. Effects of winter soil warming on crop biomass carbon loss from organic matter degradation. Nat. Commun. 2024, 15, 8847. [Google Scholar] [CrossRef]
  7. Hasegawa, T.; Sakurai, G.; Fujimori, S.; Takahashi, K.; Hijioka, Y.; Masui, T. Extreme climate events increase risk of global food insecurity and adaptation needs. Nat. Food 2021, 2, 587–595. [Google Scholar] [CrossRef]
  8. Engler, N.; Krarti, M. Optimal designs for net zero energy-controlled environment agriculture facilities. Energy Build. 2022, 272, 112364. [Google Scholar] [CrossRef]
  9. Engler, N.; Krarti, M. Review of energy efficiency in controlled environment agriculture. Renew. Sustain. Energy Rev. 2021, 141, 110786. [Google Scholar] [CrossRef]
  10. Talbot, M.H.; Monfet, D. Development of a crop growth model for the energy analysis of controlled agriculture environment spaces. Biosyst. Eng. 2024, 238, 38–50. [Google Scholar] [CrossRef]
  11. Lanoue, J.; Hao, X.; Vaštakaitė, K.V.; Marcelis, L.F.M. Editorial: Physiological growth responses to light in controlled environment agriculture. Front. Plant Sci. 2024, 15, 1529062. [Google Scholar] [CrossRef]
  12. Zou, J.; Wang, Z.; Huang, H.; Huang, X.; Shi, M. A low-energy lighting strategy for high-yield strawberry cultivation under controlled environments. Agronomy 2025, 15, 1130. [Google Scholar] [CrossRef]
  13. NBS. China Statistical Yearbook. 2023. Available online: https://www.stats.gov.cn/sj/ndsj/2023/indexch.htm (accessed on 1 May 2025).
  14. Fu, D.; Ding, Y. The study of changing characteristics of the winter temperature and extreme cold events in China over the past six decades. Int. J. Climatol. 2021, 41, 2480–2494. [Google Scholar] [CrossRef]
  15. Li, J.; Hao, X.; Liao, H.; Wang, Y.H.; Cai, W.J.; Li, K.; Yue, X.; Yang, Y.; Chen, H.S.; Mao, Y.H.; et al. Winter particulate pollution severity in North China driven by atmospheric teleconnections. Nat. Geosci. 2022, 15, 349–355. [Google Scholar] [CrossRef]
  16. Fang, H.; Yang, Q.; Zhang, Y.; Sun, W.; Lu, W.; Tong, Y. Performance of a solar heat collection and release system for improving night temperature in a Chinese solar greenhouse. Appl. Eng. Agric. 2015, 31, 2. [Google Scholar] [CrossRef]
  17. Ma, J.; Du, X.; Meng, S.; Ding, J.; Gu, X.; Zhang, Y.; Li, T.; Wang, R. Simulation of thermal performance in a typical Chinese solar greenhouse. Agronomy 2022, 12, 2255. [Google Scholar] [CrossRef]
  18. Tian, D.; Li, Y.; Zhao, S.; Wu, Q.; Ma, C.; Song, W. An analysis of the influence of construct parameters on the solar radiation input in an insulated plastic greenhouse. Agronomy 2024, 14, 510. [Google Scholar] [CrossRef]
  19. Hou, Y.; Li, A.; Li, Y.; Jin, D.C.; Tian, Y.; Zhang, D.; Wu, D.M.; Zhang, L.H.; Lei, W.J. Analysis of microclimate characteristics in solar greenhouses under natural ventilation. Build. Simul. 2021, 14, 1811–1821. [Google Scholar] [CrossRef]
  20. He, M.; Wan, X.C.; Liu, H.L.; Xia, T.Y.; Gong, Z.R.; Li, Y.M.; Liu, X.G.; Li, T.L. Theory and application of sustainable energy-efficient solar greenhouse in China. Energy Convers. Manag. 2025, 352, 119394. [Google Scholar] [CrossRef]
  21. Wang, T.Y.; Wu, G.X.; Chen, J.W.; Cui, P.; Chen, Z.X.; Yan, Y.Y.; Zhang, Y.; Li, M.C.; Niu, D.X.; Li, B.G.; et al. Integration of solar technology to modern greenhouse in China: Current status, challenges and prospect. Renew. Sustain. Energy Rev. 2017, 70, 1178–1188. [Google Scholar] [CrossRef]
  22. Luo, G.L.; Cheng, R.F.; Zhang, Y.; Fang, H.; Li, D.; Zhang, J.F.; Song, G.X. Sunlight greenhouse active heat storage system optimization. Trans. Chin. Soc. Agric. Eng. 2020, 36, 8. [Google Scholar] [CrossRef]
  23. Li, H.; Lu, J.R.; He, X.Y.; Zong, C.J.; Song, W.T.; Zhao, S.M. Effect of installation factors on the environment uniformity of multifunctional fan-coil unit system in Chinese solar greenhouse. Case Stud. Therm. Eng. 2024, 60, 104818. [Google Scholar] [CrossRef]
  24. Li, H.; Zong, C.J.; Lu, J.R.; Zhao, S.M.; Yang, D.Y.; Song, W.T. Experimental study on spatiotemporal variation patterns of thermal environment in the large-span insulated greenhouse. Appl. Therm. Eng. 2025, 264, 125530. [Google Scholar] [CrossRef]
  25. Wang, Y.F.; Lei, X.H.; LI, W.; Niu, M.L.; Wang, B.H.; Wang, F.D. Application Status and Development Suggestions for Greenhouse with Flexible Thermal Insulation Wall in Beijing. China Veg. 2023, 1, 11–16. [Google Scholar]
  26. Liu, X.G.; Li, Y.M.; Liu, A.H.; Yue, X.; Li, T.L. Effect of North Wall Materials on the Thermal Environment in Chinese Solar Greenhouse (Part A: Experimental Researches). Open Phys. 2019, 17, 752–767. [Google Scholar] [CrossRef]
  27. Xiao, F.; Wu, X.L.; Xia, Y. Development of energy saving and rapid temperature control technology for intelligent greenhouses. greenhouses. IEEE Access 2021, 9, 29677–29685. [Google Scholar] [CrossRef]
  28. Dewi, V.A.K.; Setiawan, B.I.; Minasny, B.; Liyantono, L.; Waspodo, R.S.B. Modeling Air temperature inside an organic vegetable greenhouse. AGRIVITA J. Agric. Sci. 2020, 42, 295–305. [Google Scholar] [CrossRef]
  29. Fu, Q.; Li, X.; Zhang, G.; Ma, Y. Revolutionizing solar greenhouses: A lighting environment control system for renewable vegetable cultivation, empowered by roller shutter control. J. Food Process Eng. 2024, 47, e14494. [Google Scholar] [CrossRef]
  30. Mu, Z.; Bo, Y.; Xu, J.; Song, K.; Dong, B.; Wang, J.; Shu, S.; Wang, Y.; Guo, S. Development and application of greenhouse light environment simulation technology based on light path tracing. Comput. Electron. Agric. 2024, 218, 108652. [Google Scholar] [CrossRef]
  31. Xu, D.M.; Fei, S.P.; Wang, Z.; Zhu, J.Y.; Ma, Y.T. Optimum design of Chinese solar greenhouses for maximum energy availability. Energy 2024, 304, 131980. [Google Scholar] [CrossRef]
  32. Liu, H.; Tian, Y.; Zhao, H.; Liu, S.; Zhu, N.; Wang, Y.; Li, W.; Sun, D.; Wang, T.; Li, L. Decoding the secrets of agricultural light, heat, and water resources in beijing under climate change: Spatio-temporal variations on a small scale and future prospects. Agriculture 2025, 15, 371. [Google Scholar] [CrossRef]
  33. Kläring, H.; Schmidt, A. Diurnal temperature variations significantly affect cucumber fruit growth. HortScience 2017, 52, 60–64. [Google Scholar] [CrossRef]
  34. Rafique, R.; Ahmad, T.; Khan, M.A.; Ahmed, M. Temperature variability during the growing season affects the quality attributes of table grapes in Pothwar-insight from a new emerging viticulture region in South Asia. Int. J. Biometeorol. 2023, 67, 1881–1896. [Google Scholar] [CrossRef] [PubMed]
  35. Zhuang, Y.; Zhao, S.; Cheng, J.; Wang, P.; Lu, N.; Ma, C.; Xing, W.; Zheng, K. An air convection wall with a hollow structure in Chinese solar greenhouses: Thermal performance and effects on microclimate. Agronomy 2022, 12, 520. [Google Scholar] [CrossRef]
  36. Shi, Q.; Wang, X.Q.; He, B.; Yang, Y.J.; Huang, W. Differential impact of decreasing relative humidity on photosynthesis under fluctuating light between maize and tomato. Physiol. Plant. 2024, 176, e14179. [Google Scholar] [CrossRef]
  37. Dixon, M.H.; Nellore, D.; Zaacks, S.C.; Barak, J.D. Time of arrival during plant disease progression and humidity additively influence Salmonella enterica colonization of lettuce. Appl. Environ. Microbiol. 2024, 90, e01311-24. [Google Scholar] [CrossRef] [PubMed]
  38. Wang, X.; Pan, Y.; Liu, H.; Meng, H.; Cheng, Z. Physiological Responses of Cucumber Seedlings to Combined High-Temperature and High-Humidity Stress at Different Leaf Stages. Horticulturae 2024, 10, 1369. [Google Scholar] [CrossRef]
  39. Gruda, N.S.; Samuolienė, G.; Dong, J.; Li, X. Environmental conditions and nutritional quality of vegetables in protected cultivation. Compr. Rev. Food Sci. Food Saf. 2025, 24, e70139. [Google Scholar] [CrossRef]
  40. Kim, C.K.; Eom, S.H. Light Controls in the Regulation of Carotenoid Biosynthesis in Leafy Vegetables: A Review. Horticulturae 2025, 11, 152. [Google Scholar] [CrossRef]
  41. Critten, D.L. A general analysis of light transmission in greenhouses. J. Agric. Eng. 1986, 33, 289–302. [Google Scholar] [CrossRef]
  42. Wang, J.; Wei, X.; Guo, Q. A three-dimensional evaluation model for regional carrying capacity of ecological environment to social economic development: Model development and a case study in China. Ecol. Indic. 2018, 89, 348–355. [Google Scholar] [CrossRef]
  43. Xu, F.; Ma, C.W.; Qu, M.; Liu, Y.; Gong, B.B.; Zhang, J.Y.; Cao, Y.F.; Sun, G.T.; Liu, C.X. Investigation and evaluation of microclimate environment in solar greenhouses in five provinces/regions of North China. Chin. J. Agrometeorol. 2014, 35, 17–25. [Google Scholar] [CrossRef]
  44. Esmaeli, H.; Roshandel, R. Optimal design for solar greenhouses based on climate conditions. Renew. Energy 2020, 145, 1255–1265. [Google Scholar] [CrossRef]
  45. Zhang, Z.Y.; Zhu, Y.B.; Guo, Y.B.; Li, P.; Cheng, J.Y.; Zhao, S.M.; Sun, J.Z.; Wei, M. Distribution characteristics and improvement measures of light environment of flexible thermal insulation solar greenhouse. J. China Agric. Univ. 2025, 30, 197–205. [Google Scholar]
  46. Chen, S.Q.; Zhu, Y.P.; Xie, J.C.; Zhang, H. Study on winter application strategy and effect of phase change material in southern plastic greenhouse. Acta Energiae Solaris Sin. 2020, 41, 205–211. [Google Scholar]
  47. Song, Y.; Zhou, G.; Linderholm, H.W.; Wang, J.; Li, Y.; Wang, G.; Fu, Y.; Xu, J.; Shi, Y.; Xu, Y.; et al. Growth of winter wheat adapting to climate warming may face more low-temperature damage. Int. J. Climatol. 2023, 43, 1970–1979. [Google Scholar] [CrossRef]
  48. Liu, H.; Zhao, H.; Liu, S.; Tian, Y.; Li, W.; Wang, B.; Hu, X.; Sun, D.; Wang, T.; Wu, S.; et al. When Tomatoes Hit the Winter: A Counterattack to Overwinter Production in Soft-Shell Solar Greenhouses in North China. Horticulturae 2025, 11, 436. [Google Scholar] [CrossRef]
Figure 1. Study area (a) and greenhouse types (b). The dot is the position of the greenhouse where the microclimate monitor is placed. The greenhouses were no more than 25 m in distance from each other.
Agronomy 15 01663 g001
Figure 2. Hourly temperature monitoring at different stages of the overwintering period. (a): Pre-overwintering period; (b): mid-overwintering period; (c): post-overwintering period.
Agronomy 15 01663 g002
Figure 3. Statistics on temperature-related indicators. (AC): Different periods of maximum temperature, minimum temperature, and average temperature; (D): different periods of daily temperature range; (E): the number of hours per day below 5 °C in different periods. Note: At the 5% probability level, values followed by different letters within the same variety are significantly different.
Agronomy 15 01663 g003
Figure 4. Hourly relative air humidity monitoring at different stages of the overwintering period. (a): Pre-overwintering period; (b): mid-overwintering period; (c): post-overwintering period.
Agronomy 15 01663 g004
Figure 5. Statistics on relative humidity-related indicators. (AC): Different periods of maximum relative humidity, minimum relative humidity, and average relative humidity; (D): different periods of daily relative humidity range; (E): the number of hours per day above 80% in different periods. Note: At the 5% probability level, values followed by different letters within the same variety are significantly different.
Agronomy 15 01663 g005
Figure 6. Hourly light intensity monitoring at different stages of the overwintering period. (a): Pre-overwintering period; (b): mid-overwintering period; (c): post-overwintering period.
Agronomy 15 01663 g006
Figure 7. Average light intensity (bar chart) and light transmission (point-line chart) in different periods. Note: At the 5% probability level, values followed by different letters within the same variety are significantly different.
Agronomy 15 01663 g007
Figure 8. The distribution (a) and CEI (b) of different environmental indicators under different types of greenhouses and the correlation analysis (c). The thickness of the lines represents the degree of impact, the solid and dashed lines represent significant and nonsignificant impacts, respectively, and the red and blue lines represent positive and negative impacts, respectively.
Agronomy 15 01663 g008
Disclaimer/Publisher’s Note: The statements, opinions and data contained in all publications are solely those of the individual author(s) and contributor(s) and not of MDPI and/or the editor(s). MDPI and/or the editor(s) disclaim responsibility for any injury to people or property resulting from any ideas, methods, instructions or products referred to in the content.

