1. Introduction
Common bean (
Phaseolus vulgaris L.) is the most important legume for direct human consumption worldwide and constitutes an essential protein source for more than 300 million people, primarily in developing countries [
1]. Its global production exceeds 30 million metric tons annually, and it is concentrated in Asia, Latin America, and Africa [
2]. However, climate change represents a growing challenge for bean production because of the increasing frequency and intensity of abiotic stresses, particularly drought and high temperatures [
3,
4].
The global mean temperature has increased by 0.8 °C since 1880, with two-thirds of this increase occurring since 1975 at a rate of 0.15–0.20 °C per decade [
5]. Common bean has a base temperature of 8.3 °C, with an optimal temperature of 25 °C [
6]. Global warming is expected to increase the frequency of extreme temperatures, with a gradual increase in the mean temperature between 2 and 4 °C [
6]. This increase in temperature will have differential effects depending on the region: in temperate zones, it will favor crop development and expand cultivable areas, whereas in subtropical and tropical regions, it will intensify negative effects on susceptible crops such as beans [
7]. In some production areas, such as El Bajío, Mexico, under irrigated conditions during the dry season, high temperatures directly cause flower and pod abortion and indirectly favor the incidence of pests and pathogens [
6]. Temperatures above 30 °C during the day or 20 °C at night significantly reduce yield by causing bud, flower, and pod abortion; decreasing pollen viability and anther dehiscence; affecting pollen tube formation; and altering seed size and filling [
7].
More than 60% of global bean production is limited by water deficit, with losses ranging from mild to total losses, depending on intensity, frequency, and timing during the phenological cycle [
8]. This situation is critical in smallholder farming systems with limited access to irrigation. The magnitude of losses is influenced by genotype, growth stage, soil type, and local climatic conditions [
9], with photosynthetic limitation being a determining factor in reducing biomass and grain filling [
10].
The response to these environmental stresses varies according to germplasm origin. Andean genotypes, adapted to altitudes between 1400 and 2800 masl, show greater sensitivity to high temperatures than Mesoamerican genotypes, adapted to altitudes between 400 and 2000 masl. When thermal stress coincides with terminal drought, a frequent condition in the field, its effects are magnified due to physiological interactions that affect days to flowering, maturity, plant height, seed weight, biomass, and yield [
11].
Previous studies have identified the leaf area index, biomass accumulation, and efficiency in converting biomass to seeds as key indicators of yield under stress. Genotypes that maintain growth and resource allocation toward yield under adverse conditions are particularly valuable for genetic improvement [
10]. Comparative evaluation of genotypes across contrasting seasons (rainy and dry) has proven effective for assessing adaptations to environmental stresses, as it allows analysis of plant responses under natural variations in temperature and water availability [
12,
13].
The objective of this study was to identify common bean genotypes with tolerance to terminal drought stress and high temperatures and compare their performance under optimal conditions (rainy season) with that under stress conditions (dry season with and without water deficit). This experimental approach allows the evaluation of both individual and combined effects of drought and high-temperature stress. Through systematic phenotypic evaluation and genotype classification based on stress tolerance indices, this research provides valuable germplasm and selection criteria for breeding programs aimed at developing varieties adapted to the abiotic stress conditions expected under climate change scenarios.
2. Materials and Methods
2.1. Experimental Site
The research was conducted at the Bajío Experimental Station (CEBAJ) of the National Research Institute of Forestry, Agricultural and Livestock Research (INIFAP), which is located in Celaya, Guanajuato, Mexico (20°35′01″ N, 100°49′22″ W, 1763 masl). The soil at the experimental site is a pelic vertisol with a deep clay texture, good drainage, and a pH of 8.7. The regional climate is classified as semidry temperate with summer rainfall.
The study was developed during two growing cycles within the same year, 2024: the dry season (February–May) and the rainy season (July–October). This strategy allowed the evaluation of genotype response under three contrasting growth conditions: (1) optimal conditions during the rainy season (control), (2) high-temperature stress during the dry season with full irrigation, and (3) combined stress of high temperatures and terminal drought during the dry season.
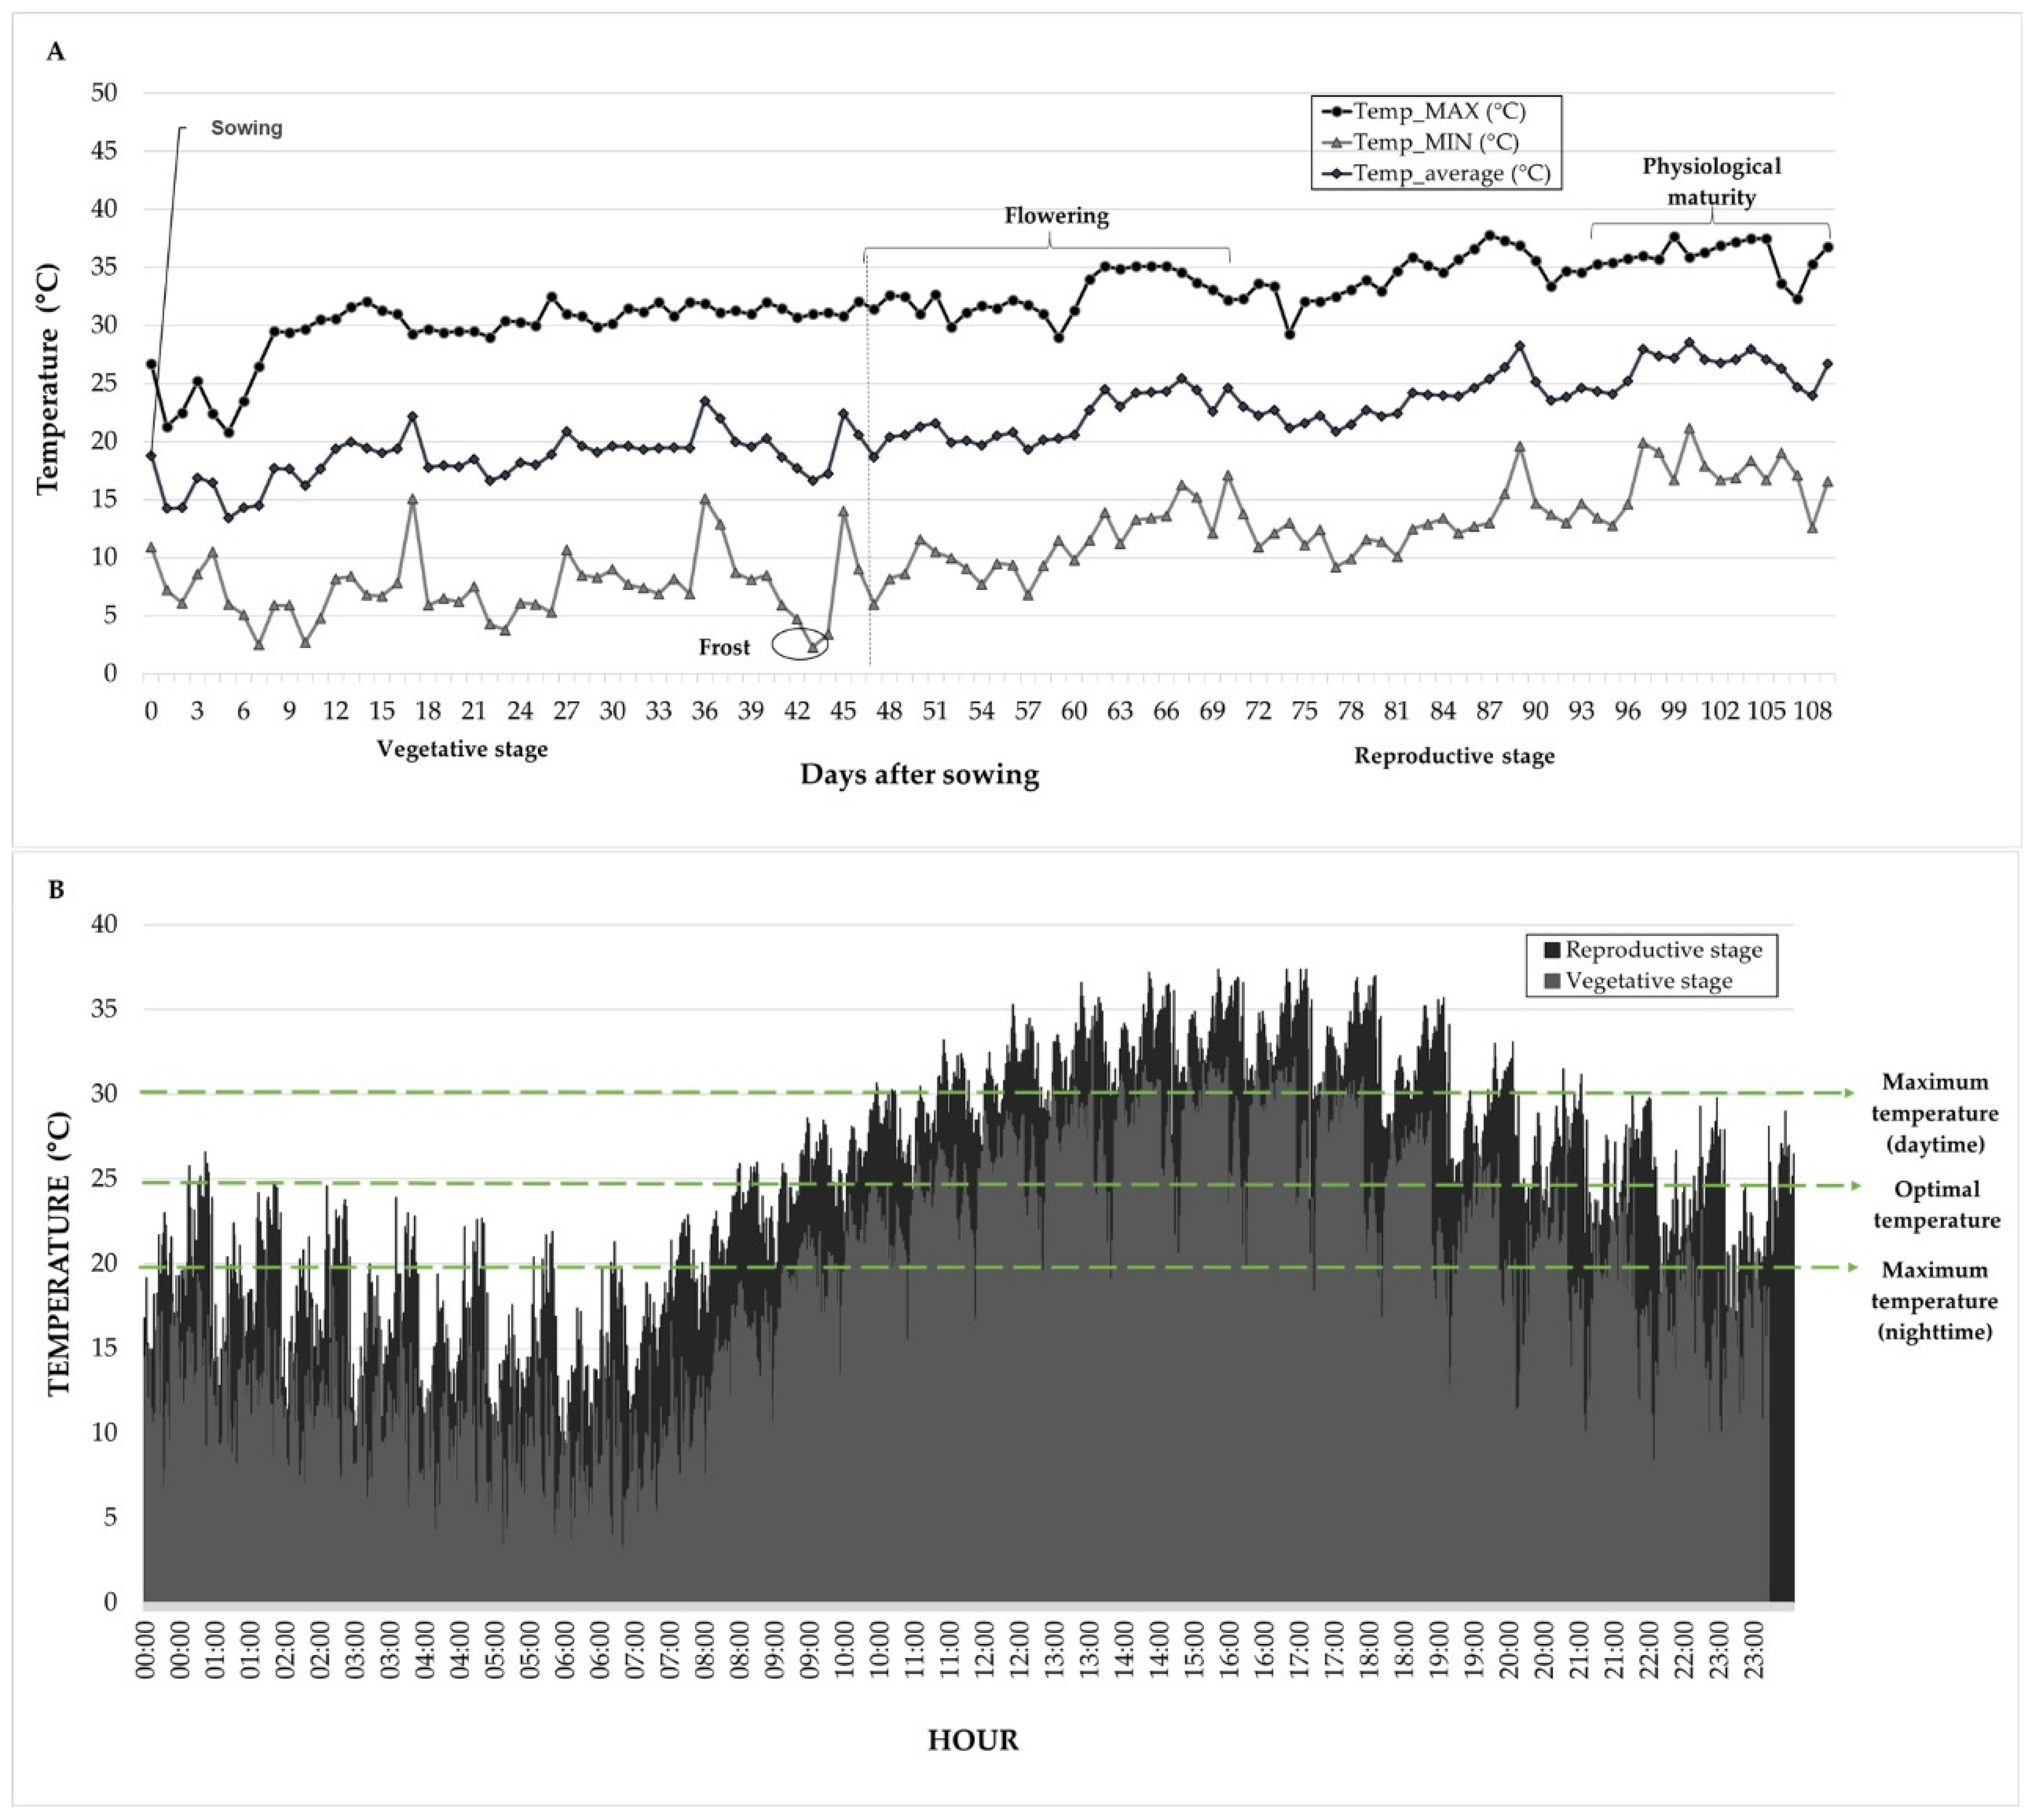
Climatological variables (daily maximum and minimum temperatures, relative humidity, precipitation, and solar radiation) were recorded at an automatic weather station, (Vantage Pro2, Davis Instruments, Hayward, CA, USA), which is located 300 m from the experimental site. During the dry season (February–May), the maximum temperature ranged from 29–37 °C, whereas during the rainy season (July–October), the maximum temperature ranged from 24–30 °C, indicating contrasting thermal conditions between the two growing cycles (
Figure 1).
2.2. Genetic Material
One hundred common bean genotypes representing the genetic diversity available in the breeding program of the Bajío Experimental Station were evaluated [
14]. The genetic material included landraces (criollos), advanced lines, and improved cultivars belonging to the Durango, Jalisco, Mesoamerican, and Nueva Granada races. The genotypes included different commercial types, such as Flor de Mayo, Flor de Junio, Pinto, Black, Azufrado, and Bayo (detailed information is available in the
Supplementary Materials, Table S1).
The evaluated set presented diverse growth habits, including determinate (type 1) and indeterminate (types 2 and 3) materials, as well as different photoperiod responses, a characteristic that varies according to genetic origin, with Andean genotypes generally being more sensitive than Mesoamerican genotypes. This diversity of materials was selected on the basis of previous evaluations that indicated variability in agronomic characteristics and adaptive potential to stress conditions.
2.3. Experimental Design and Management
Dry season (stress conditions): The experiment was conducted under a 10 × 10 simple lattice design with three replications, and two moisture conditions were evaluated: full irrigation (high-temperature stress) and terminal drought (combined drought and high-temperature stress). The experimental unit consisted of a 4 m long row, with 76 cm between rows. Sowing was performed manually in dry soil, depositing 12 seeds per linear meter on 12 February 2024.
During the crop cycle, the environmental conditions were recorded via a weather station. Although heat was not an experimentally applied treatment, because the trial was conducted during the dry season, high temperatures were naturally present. During the reproductive stage (April–May), the maximum daytime temperatures consistently exceeded 35 °C, and the nighttime temperatures exceeded 15 °C, indicating that natural thermal stress conditions were present in both moisture treatments.
The rainy season (optimal conditions/control): During the rainy season (July–October 2024), an experiment was established with the same genotypes via a 10 × 10 triple lattice design with three replications. Sowing was performed on 15 July 2024, coinciding with the establishment of rains in the region, reaching a total precipitation of approximately 320 mm during the cycle. The temperatures during this season were more moderate, with daytime maximums from 24–30 °C and nighttime minimums from 12–16 °C, indicating better thermal conditions for bean crop development. This rainy season treatment served as a control not only for temperature conditions but also for soil moisture conditions, as supplementary irrigation was applied when necessary to ensure optimal soil moisture throughout the crop cycle, avoiding water stress that could occasionally occur during dry periods within the rainy season.
2.4. Moisture Conditions
Full irrigation (high-temperature stress): A drip irrigation system with drip tapes was installed with a flow rate of 1 L h−1 in each row. The first irrigation was applied for 10 h to ensure uniform emergence. Subsequent irrigation was carried out every 10–12 days according to the crop requirements, and a total of 7 irrigations were applied until physiological maturity. The total irrigation depth applied was 320 mm.
Terminal drought (combined stress): Management was similar to that of the previous treatment until the onset of flowering, at which point irrigation was suspended to induce water stress. The 60% threshold for flowering initiation occurred between days 58 and 62 after sowing, with most of these genotypes (approximately 80%) initiating flowering on day 60. Given these subtle differences in flowering time, irrigation was suspended uniformly on day 60 after sowing. Before this point, four irrigations were applied. The total irrigation depth applied was 180 mm.
2.5. Agronomic Management
Fertilization was performed during the first cultivation at the third trifoliate leaf development stage in 60% of the genotypes; 60-50-20 kg ha−1 of nitrogen, phosphorus, and potassium (N-P-K) was applied approximately 25 days after sowing, and a commercial mixture of 18-24-12 (N-P-K) plus microelements was used. The weed control included a second mechanical cultivation 40 days after sowing and manual weeding when needed. Thirty days after sowing, the herbicide Fisiflex (fluazifop-p-butyl, 125 g a.i. L−1) was applied at a dose of 1 L ha−1 to control weeds that were not eliminated during the first mechanical cultivation.
Constant monitoring of pests and diseases was conducted. During the cycle, moderate infestations of leafhoppers (Empoasca kraemeri) and whiteflies (Bemisia tabaci) occurred, which were controlled with applications of imidacloprid (17.8% a.i., 350 mL ha−1), diazinon (25% a.i., 1 L ha−1), and cypermethrin (20% a.i., 350 mL ha−1) via mechanical spraying.
Phenology and yield evaluations were conducted only on genotypes that completed the crop cycle under the three evaluated conditions; those with minimum yield (less than 25 kg ha−1) and those that did not produce flowers or pods due to stress conditions were not included in the data analyses.
2.6. Evaluated Variables
2.6.1. Phenological Variables
Days to flowering (DF): The number of days from sowing until 50% of the plants in the plot presented at least one open flower was recorded. The flowering data for each genotype in each environment are provided in
Supplementary Table S1, which allows for the comparison of genotypes with similar flowering timing across treatments.
Days to physiological maturity (DM): Following standard procedures in legume crop evaluation, maturity was determined via two complementary criteria: (1) visual assessment when 50% of the plants presented color changes in the leaves and pods, indicating the onset of senescence, and (2) verification of seed weight stability through sequential sampling (three samples taken at 3-day intervals) to confirm that the seeds had reached their maximum dry weight. The genotypes were considered mature when both criteria were met.
2.6.2. Morphological Variables
Plant height (PH): This was measured at the beginning of flowering in each treatment, in centimeters from the base of the stem to the apex of the plant.
Aerial biomass (BIO): Determined by sampling plants in 50 cm linear rows per plot during the mid-grain-filling stage. To standardize sampling across genotypes with different phenological cycles, biomass samples were collected 15 days after flowering initiation for each genotype, ensuring comparable developmental stages despite different absolute days after sowing. The samples were dried in an oven at 70 °C until a constant weight was reached, and the total weight was calculated and expressed in kg ha−1.
2.6.3. Yield Components
Grain yield (YLD): The grains from the entire plot were harvested, the moisture content was determined using an Agratronix MT-PRO PLUS portable grain moisture meter (Agratronix Inc., Streetsboro, OH, USA), and the weight was adjusted to 14% moisture via the following formula:
The results are expressed in kg ha−1.
The 100-seed weight (100SW): The average weight in grams of four samples of 100 seeds per plot was calculated.
2.7. Statistical Analysis
An analysis of variance was performed for all evaluated characteristics, considering a simple lattice experimental design with three replications per treatment for the dry season and a triple lattice for the rainy season. For the combined analysis across environments, a mixed-effects model was used with the following structure:
where environment, replication, and block were considered fixed effects, and genotype effects were analyzed as both fixed and random depending on the analysis objective. Mean comparisons were made via Tukey’s test, with a significance level of
p ≤ 0.05.
Additionally, simple correlations between the characteristics evaluated within each treatment were calculated to explore linear relationships between variables. Pearson’s correlation coefficient was used to quantify the strength and direction of these associations. To visualize these relationships, a correlation matrix was generated.
A principal component analysis (PCA) was performed to reduce the dimensionality of the dataset and explore patterns of variation between genotypes and variables. Components with eigenvalues greater than 1.0 were retained, and a varimax rotation was applied to facilitate interpretation. For the PCA, all six agronomic variables (days to flowering, days to maturity, plant height, aerial biomass, grain yield, and 100-seed weight) were included using standardized data (mean = 0, variance = 1) to ensure equal weighting of variables with different measurement units. No additional data transformations were applied beyond standardization.
A GGE biplot multivariate analysis was used to examine the genotype × environment interaction, considering the three evaluated conditions as environments: the rainy season (optimal), irrigation in the dry season (high-temperature stress), and terminal drought in the dry season (combined stress).
All the statistical analyses were performed via the SAS v9.4 statistical package (SAS Institute Inc., Cary, NC, USA) and Genotype-Environment Analysis in R (GEA-R) v4.1 (Developer: International Maize and Wheat Improvement Center (CIMMYT) (Texcoco, Mexico); complementary multivariate analyses, graphs, and calculations were developed in Microsoft Excel 2016 (Microsoft Office, Redmond, WA, USA).
2.8. Genotype Classification by Stress Response
On the basis of their performance across the three environments (rainy season control, irrigation with high temperatures, and terminal drought with high temperatures), the genotypes were classified into response groups using grain yield data (kg ha−1) from all three environmental conditions. Beyond the drought susceptibility index classification, genotypes were also categorized by comparing their relative performance patterns: (1) high-yielding under all conditions, (2) tolerant to high temperatures (superior under irrigation with high temperatures), (3) tolerant to combined drought and high-temperature stress (superior under terminal drought with high temperatures), and (4) sensitive to abiotic stress. This classification provides a clear framework for identifying genotypes with specific adaptation patterns to individual or combined stresses.
For objective classification, a drought susceptibility index (DSI) was calculated according Fischer et al. [
15], via the following equation:
where
is the yield of a genotype under stress,
is the yield of the same genotype under nonstress conditions,
is the mean yield of all genotypes under stress, and
is the mean yield of all genotypes under nonstress conditions. Genotypes with DSI values < 0.5 were considered highly tolerant to stress, those with DSI values between 0.5 and 1.0 were considered moderately tolerant, and those with DSI values > 1.0 were considered susceptible to stress. This classification system enables the systematic identification of superior genotypes for use as parental lines in breeding programs, facilitating the development of improved cultivars with enhanced stress tolerance through conventional crossing and selection strategies for different stress scenarios.
3. Results
3.1. Environmental Conditions and Phenological Response
The environmental conditions significantly differed between the evaluated cycles. In the dry season (February–May 2024), an initial period with moderate maximum temperatures from 25–30 °C and minimum temperatures from 3–10 °C was recorded after sowing (12 February). During the vegetative stage, light frost occurred on 26 March at temperatures below 5 °C, which damaged the upper leaflets of the canopy and reduced the plant population by approximately 2%. This event delayed crop development, postponing flowering by an average of 15 days compared with previous evaluations of the same genotypes.
By mid-April, coinciding with the onset of flowering, a sustained increase in temperature was observed, with maximums reaching 35 °C and minimums above 10 °C. These high temperatures persisted throughout the reproductive stage until harvest (late May), with peaks exceeding 37 °C during May. The complete temperature records and climatological conditions are presented in
Figure 1, which shows the contrasting thermal environments between evaluation periods.
In contrast, during the rainy season (July–October 2024), temperatures were more moderate, with maximums from 25–30 °C and minimums from 12–16 °C. The accumulated precipitation during this cycle was approximately 320 mm, distributed mainly between July and September, providing favorable water conditions for crop development.
The natural temperature conditions during the dry season allowed the evaluation of the response of the tested germplasm under two stress levels: high-temperature stress (with full irrigation) and the combined stress of high temperature and terminal drought. Among the 100 genotypes evaluated, 42 did not produce grain under either moisture treatment in the dry season, either because they did not initiate flowering, due to drying and dropping of flower buds, or because they exhibited abortion of flowers, pods, and seeds. The performance of genotypes that completed their reproductive cycle under dry season conditions is presented in
Table 1,
Table 2 and
Table 3, which show the analysis of variance and ranking of superior genotypes under irrigation and terminal drought treatments.
The contrasting phenotypic responses between stress-tolerant and stress-susceptible genotypes are clearly demonstrated in
Figure 2. Under identical combined stress conditions, tolerant genotypes maintained robust pod loading and seed development (
Figure 2A), producing high-quality seeds (
Figure 2C), while susceptible genotypes showed severely limited reproductive development with minimal pod formation (
Figure 2B), indicating differential physiological mechanisms for stress adaptation.
The statistical analysis of genotype performance under these contrasting dry season conditions is detailed in the subsequent sections, with comprehensive results presented in
Table 1,
Table 2 and
Table 3.
3.2. Response Under Irrigation with High Temperatures
The analysis of variance revealed significant differences among genotypes (
p ≤ 0.05) for all recorded traits (
Table 1). The coefficients of variation were relatively high for yield (23.28%) and biomass (30.60%).
The highest yield under irrigation conditions with high temperatures was obtained from the Pinto-type line G69-Sel33-PT (2095 kg ha
−1), followed by the landrace G-19158 (1880 kg ha
−1) and two experimental lines of the Flor de Mayo type: G69-Sel21-FM (1695 kg ha
−1) and G69-Sel16-FM (1623 kg ha
−1). Yields above 1300 kg ha
−1 were also notable for the lines Flor de Durazno (1458 kg ha
−1), G69-1E-18-FM (1390 kg ha
−1), and Pinto Saltillo XTA-245-1-3 (1331 kg ha
−1). The Negro Zacatecas variety (G-22076) ranked ninth, with 1302 kg ha
−1, which is relevant given its commercial importance and wide adoption by producers in temperate zones of Mexico. The SCR-16 genotype ranked tenth, with 1295 kg ha
−1 (
Table 2).
3.3. Response Under Terminal Drought with High Temperatures
The analysis of variance revealed significant differences among genotypes (
p < 0.05) for all evaluated traits (
Table 1). The coefficients of variation under terminal drought were high for biomass (37.6%) and yield (31.3%), exceeding the values observed under irrigation (30.6% and 23.3%, respectively).
The terminal drought treatment was applied when 60% of the genotypes reached the flowering stage (60 DAS), with a total irrigation depth of 180 mm during the cycle. Under these conditions, the development of the genotypes accelerated, reaching maturity between 93 and 98 DAS, five days earlier than under full irrigation. The average yield was reduced by 64% compared with that in the irrigation treatment.
The superior genotypes under terminal drought were G69-Sel.25 (Ojo de Cabra type), with 832 kg ha
−1; Pinto Mestizo, with 762 kg ha
−1; Dalia, with 680 kg ha
−1; SCR-16 (red type, Mesoamerican race), with 627 kg ha
−1; and G-13675 (native material), with 581 kg ha
−1 (
Table 3).
An improved Pinto-type line (P. SaltilloXTA-245-1-1-3) ranked sixth in yield, with 333 kg ha−1.
Comparative analysis of genotype performance under contrasting moisture conditions revealed differential responses (
Table 4). Under full irrigation, genotypes G61-60, Rincón Grande, and G-9862 presented the highest yields (1880.2, 1742.6, and 1622.7 kg ha
−1, respectively); however, these materials presented significant yield reductions under terminal drought, with decreases of 74.3%, 90.9%, and 78.1%, respectively.
Conversely, some genotypes with low yields under irrigation conditions presented higher yields under water stress: Pinto Mestizo, Azufrado Pimono78, and G69-25 presented yields of 762.5, 540.4, and 710.4 kg ha−1, respectively, representing increases of 23.2%, 91.4%, and 13.2%, respectively, compared with those in the irrigation treatment.
3.4. Response Under Rainy Season Conditions
Environmental conditions during the rainy season included moderate temperatures and water availability through regular precipitation (320 mm total).
The average yield in the rainy season was 1344 kg ha−1, which was significantly greater than that obtained in the dry season treatments (889 kg ha−1 for irrigation and 317 kg ha−1 for terminal drought). Commercial varieties presented yields above 2000 kg ha−1.
The comparative analysis between sowing seasons revealed that, on average, the yield in the dry season under irrigation represented 66.1% of that obtained in the rainy season, whereas under terminal drought, it reached 23.6% (
Table 5).
3.5. Combined Analysis of Moisture Treatments
The combined analysis revealed specific patterns in the germplasm response to full irrigation and terminal drought treatments. The combined analysis of variance for the three environmental conditions (
Table 6) revealed highly significant effects (
p < 0.01) of environment, genotype, and the genotype × environment interaction for all evaluated variables, indicating differential responses of the genotypes according to environmental conditions.
The number of days to flowering did not significantly differ between the irrigation and drought treatments, which is logical since the measurements were taken before the drought treatment was established. However, there were marked differences between the dry season (average DF = 64.4 days) and the rainy season (average DF = 39.4 days).
The rest of the evaluated variables (days to maturity, hundred-seed weight, and yield) showed significant effects for both the environment and the genotype × environment interaction, indicating that environmental conditions differentially affected these traits across genotypes. The coefficient of variation for yield was relatively high (31.84%).
3.6. Genotype–Environment Interaction Analysis
Genotype–environment interaction (GEI) analysis revealed the formation of two contrasting environments. The GGE biplot analysis (
Figure 3) effectively visualizes these genotype × environment interactions, showing how different genotypes respond specifically to each stress environment. The environment characterized by irrigation plus high temperatures presented a vector of greater magnitude, indicating a higher yield potential under these conditions. In this environment, the G69-Sel.16-FM, G69-33-FJ, and G-19158 genotypes presented yields of 994, 1027, and 1124 kg ha
−1, respectively, demonstrating specific adaptations to elevated temperature conditions.
The second environment, characterized by the combination of terminal drought plus high temperatures, presented a vector of lower magnitude, suggesting more restrictive conditions for expressing yield potential. Under these conditions, the Pinto Mestizo genotype presented the highest yield, reaching 820 kg ha−1.
The distribution of genotypes in the GGE biplot (
Figure 3) showed that a significant proportion of the evaluated materials did not show specific adaptations to either of the two stress environments, suggesting that these genotypes might be better adapted to more favorable conditions. This differential response of genotypes confirms the importance of specific selection for environments with abiotic stress, as noted by Rao et al. [
4]. The GGE biplot (
Figure 3) provides a clear visualization of these adaptation patterns, enabling breeders to identify genotypes with specific environmental adaptation for targeted selection strategies.
3.7. Principal Component Analysis
The first two components resulting from the principal component analysis (PCA) explained 61.2% of the total variation, with PC1 and PC2 representing 41.1% and 20.1%, respectively (
Figure 4). PC1 (41.1%) separated the genotypes on the basis of yield, hundred-seed weight (100SW), and plant height. On the positive side of the axis were genotypes such as G69-33-FJ and G-1457, characterized by relatively high yields, 100SW, and plant heights. In contrast, on the negative side were genotypes such as G-2355MIX, with lower values for these variables.
PC2 (20.1%) discriminated genotypes on the basis of days to flowering, days to maturity, and height. Genotypes located in the upper part of the axis, such as Pinto Mestizo, presented earlier cycles and lower heights, whereas genotypes such as Negro 8025 and Rincón Grande, located in the lower part, presented later cycles and greater heights. The distribution of genotypes in the four quadrants indicates diversity in the determined characteristics of the evaluated population.
3.8. Correlation Analysis
Correlation analysis revealed significant associations among the evaluated agronomic variables (
Figure 5). A strong positive correlation was found between days to flowering and days to maturity (r = 0.8653).
Yield was moderately negatively correlated with days to flowering (r = −0.3086) and days to maturity (r = −0.3261). These results coincide with those reported by Rao et al [
4], who reported that earliness can be a strategy for escaping thermal stress in beans. Additionally, yield was moderately positively correlated with hundred-seed weight (r = 0.3537) [
16].
Hundred-seed weight exhibited moderate negative correlations with days to flowering (r = −0.3717) and days to maturity (r = −0.3647). Plant height was moderately positively correlated with number of days to flowering (r = 0.3860) and days to maturity (r = 0.3559).
Biomass showed a weak and nonsignificant correlation with the evaluated variables, suggesting that, under combined stress conditions (thermal and water), biomass production and its conversion to yield were differentially affected. This response could be explained by alterations in resource partitioning patterns between vegetative and reproductive development that occur under contrasting environmental conditions.
3.9. Classification of Genotypes by Stress Response
On the basis of the drought susceptibility index (DSI) calculated from the ratio between yield under terminal drought with high temperatures (stress conditions) and yield during the rainy season (optimal conditions), the evaluated genotypes were classified into three groups according to their response to combined stress (
Table 7).
Among the 58 genotypes that completed their reproductive cycle under the three evaluated conditions, 13 (22.4%) were classified as highly tolerant to combined stress (DSI < 0.5). This group included Pinto Mestizo (DSI = 0.30), G69-Sel25 (DSI = 0.35), and Dalia (DSI = 0.41). These highly tolerant genotypes presented intermediate yields under optimal conditions (average of 963 kg ha−1) and minimum yield reduction under stress, with an average reduction of 17.3% yield under optimal conditions.
Twenty-two genotypes (37.9%), including SCR-16 (DSI = 0.64), G-13675 (DSI = 0.71), and P. Saltillo XTA-245-1-3 (DSI = 0.82), were classified as moderately tolerant (DSI between 0.5 and 1.0).
The remaining 23 genotypes (39.7%) were classified as susceptible to combined stress (DSI > 1.0). This group included genotypes with high yields under optimal conditions, such as G69-33-PT (DSI = 1.38), G-19158 (DSI = 1.29), Negro Zacatecas (DSI = 1.21), and G69-Sel16-FM (DSI = 1.33).
Correlation analysis between DSI and morphophysiological traits revealed significant negative associations between DSI and days to flowering (r = −0.42, p < 0.01) and days to maturity (r = −0.38, p < 0.01). No significant correlation was found between DSI and 100-seed weight (r = 0.12, p > 0.05) or plant height (r = 0.09, p > 0.05).
4. Discussion
4.1. Environmental Characterization and Stress Effects
The environmental conditions recorded during the experiments were characterized by significant thermal variations, with a period of moderate temperatures after sowing in the dry season, followed by light frost during the vegetative stage and, subsequently, a sustained increase in temperature during the reproductive stage. This thermal pattern, with maximum temperatures above 35 °C during flowering and pod filling, created a natural heat stress scenario for all the evaluated genotypes. The coincidence of high temperatures with the reproductive phase is particularly crucial, as this is the most sensitive period to thermal stress in common bean [
7].
The elevated coefficients of variation observed under terminal drought for biomass (37.6%) and yield (31.3%), exceeding those under irrigation (30.6% and 23.3%, respectively), can be explained mainly by the effects of multiple stresses (drought and high temperatures) that increase variability in the response of the evaluated genotypes with different genetic origins and adaptation mechanisms [
13].
The combined effect of natural high temperatures and experimentally induced terminal drought revealed the complexity of the interaction between these two stress factors. The differential response among genotypes, as evidenced by the significant genotype × environment interaction for most evaluated traits, indicates the existence of diverse adaptation mechanisms within the studied germplasm. The observation that 42% of the evaluated genotypes did not complete their reproductive cycle under these stressful conditions highlights the severe impact of combined stress and suggests that adaptation to multiple stresses requires specific genetic configurations that are not common in conventional germplasms [
13,
17].
The comparative analysis among the three evaluated conditions (rainy season, irrigation with high temperatures, and terminal drought with high temperatures) provides a more complete perspective of the genotype response. The rainy season, with moderate temperatures and adequate precipitation, represented a more favorable environment for crop development, allowing the expression of the productive potential of the materials and better overall development of the genotypes, which reached average yields of 1344 kg ha
−1. Commercial varieties demonstrated their adaptation to the agroclimatic conditions of the Bajío region, the yield was reduced to 889 kg ha
−1 (66.1% of the potential), whereas under terminal drought with high temperatures, it reached 317 kg ha
−1 (23.6% of the potential), demonstrating the cumulative impact of both stress factors. These differences highlight the severe impact of high temperatures, even under optimal irrigation conditions, and the more pronounced effect when both stresses (drought and heat) are combined [
7].
4.2. Physiological Mechanisms and Genotypic Responses
The decrease in yield under irrigation with high temperatures, compared with that in the rainy season, can be attributed to the direct effects of thermal stress on reproductive processes. Temperatures above 30 °C during the day or 20 °C at night, as recorded in this study, have been associated with reduced pollen viability, anther dehiscence, pollen tube formation, and flower and pod abortion [
13]. These physiological effects explain why, even with an adequate water supply, thermal stress alone considerably reduces the yield potential.
When thermal stress was combined with terminal drought, the negative effects increased. Drought induces stomatal closure to conserve water, which reduces transpiration and a plant’s thermal dissipation capacity, increasing leaf temperature and exacerbating thermal stress [
7]. This interaction explains why the yield reduction under combined stress (76.4%) was greater than the simple sum of the reductions expected from each individual factor. The crop cycle was also significantly shortened under these conditions, with maturity advanced by approximately 5 days, reflecting an escape strategy that sacrifices productive potential to complete the reproductive cycle under adverse conditions [
17].
The differential performance of genotypes across stress types reveals the complexity of stress tolerance mechanisms. Genotypes such as G69-33-PT and G-19158, which excelled under high temperature with adequate irrigation but showed poor performance under combined stress, likely possess specific heat tolerance mechanisms (such as heat shock proteins or efficient thermal dissipation) but lack effective drought tolerance traits like enhanced water use efficiency or osmotic adjustment. Conversely, genotypes like Pinto Mestizo and G69-Sel25, which performed better under combined stress, appear to have integrated stress response systems that effectively manage both water limitation and thermal stress simultaneously, suggesting different physiological strategies for stress adaptation.
The analysis of yield under different conditions allowed the identification of genotypes with specific adaptation patterns. Under irrigation with high temperatures, genotypes such as G69-Sel33-PT and G-19158 presented yields above 1800 kg ha
−1, indicating adaptation to thermal stress. The capacity of these plants to maintain reproductive development despite high temperatures suggests the presence of physiological mechanisms that protect reproductive organs from thermal damage, such as efficient antioxidant systems or heat shock proteins [
18].
In contrast, under the combined stress of terminal drought and high temperatures, genotypes G69-Sel25, Pinto Mestizo, and Dalia maintained yields above 680 kg ha
−1, indicating specific adaptations to multiple stress factors. Particularly interesting is the case for genotypes such as Pinto Mestizo, which presented higher yields under drought conditions than under irrigation, suggesting that certain adaptive mechanisms are activated more efficiently under stress than under optimal conditions. This response coincides with what was reported by Beebe et al. [
18] in specific drought-adapted lines. The improved Pinto-type line (P. SaltilloXTA-245-1-1-3), which ranked sixth in yield with 333 kg ha
−1, comes from an interspecific cross between
Phaseolus vulgaris L. and
P. acutifolius, suggesting the incorporation of drought tolerance genes from the latter species [
18].
4.3. Stress Tolerance Classification and Trait Relationships
The classification of genotypes according to their drought susceptibility index (DSI) allows the objective identification of materials with differential adaptations to combined stress. The finding that 22.4% of the evaluated genotypes showed high tolerance to combined stress (DSI < 0.5), whereas 39.7% were susceptible (DSI > 1.0), reveals the existence of specific genetic configurations for stress adaptation within the evaluated germplasm. Genotypes with high tolerance to combined stress, such as Pinto Mestizo and G69-Sel25, generally presented moderate performance under optimal conditions, suggesting a trade-off between maximum yield potential and stress tolerance. This observation agrees with previous studies suggesting that excessive investment in yield under optimal conditions may compromise adaptive mechanisms for stress conditions [
18].
The negative correlation between the DSI and phenological traits (days to flowering and maturity) supports the hypothesis that earliness represents an effective escape mechanism for avoiding the most severe effects of combined stress, particularly when high temperatures coincide with the reproductive stage. This finding coincides with those reported by Rao et al [
4], who reported that earliness can be a strategy for escaping thermal stress in beans [
4,
17].
Importantly, the results of this study allow us to identify genotypes with specific adaptation patterns to different stress conditions but do not necessarily isolate the individual effects of each stress factor completely. Some genotypes identified as tolerant to combined stress might be primarily drought tolerant, whereas others might have specific mechanisms for heat tolerance. The contrasting behavior observed in genotypes such as G69-33-PT and G-19158, which performed excellently under high temperature with adequate irrigation but poorly under combined stress, suggests that these materials possess specific adaptations to thermal stress but lack effective mechanisms for drought tolerance. Conversely, genotypes such as Pinto Mestizo and Dalia presented moderate performance under high temperatures alone but maintained stable yields under combined stress, indicating robust water use efficiency mechanisms that may be their primary adaptation trait. This differential response underscores the complexity of breeding for tolerance to multiple stresses and suggests that different physiological mechanisms may be involved in adaptation to individual versus combined stresses.
The statistical analyses revealed important relationships between agronomic variables. The strong correlation between days to flowering and maturity (r = 0.865) was expected given that both variables are physiologically related to the phenological development of the crop. The negative correlation between these phenological variables and yield (r = −0.309 and r = −0.326, respectively) suggests that, under the evaluated stress conditions, earliness constitutes an effective escape strategy, allowing the crop to complete its reproductive cycle before stress conditions become more severe, as indicated by Rao [
4]. Additionally, the moderate positive correlation between yield and hundred-seed weight (r = 0.3537) indicates that genotypes with larger seeds tended to be more productive under the evaluation conditions. The moderate negative correlations between hundred-seed weight and days to flowering (r = −0.3717) and days to maturity (r = −0.3647) suggest that early genotypes tended to develop larger seeds.
Under combined stress conditions (thermal and water), biomass production and its conversion to yield were differentially affected, as evidenced by the weak and nonsignificant correlation of biomass with other evaluated variables. This response could be explained by alterations in resource partitioning patterns between vegetative and reproductive development that occur under contrasting environmental conditions [
7,
17].
4.4. Multivariate Analysis and Genotype Characterization
Principal component analysis allows visualization of the multidimensional relationships between variables and genotypes, identifying groups of materials with similar response patterns. The distribution of genotypes in the PCA biplot revealed that yield, hundred-seed weight, and plant height were the main discriminatory variables, explaining 41.1% of the total variation (PC1). The second component (PC2, 20.1%) was associated with phenological variables, confirming the importance of cycle duration as an adaptive characteristic under stress. The contribution of height to both PC1 and PC2 represents “cross-loading” in multivariate analysis, where a variable can have a significant influence on more than one component. The distribution of genotypes in the four quadrants indicates diversity in the agronomic characteristics of the evaluated population.
The GGE biplot analysis clearly revealed the formation of two contrasting environments. The environment characterized by irrigation plus high temperatures presented a vector of greater magnitude, indicating a higher yield potential under these conditions. The second environment, characterized by the combination of terminal drought plus high temperatures, presented a vector of lower magnitude, suggesting more restrictive conditions for expressing yield potential. This type of analysis is particularly valuable for breeding programs focused on developing cultivars for specific production environments [
17].
4.5. Breeding Implications and Genetic Improvement Strategies
These findings have direct implications for genetic improvement strategies under contrasting environmental conditions. The identification of genotypes with differential adaptations to high temperatures (G69-33PT, G-19158) or to combined stress of drought and heat (G69-Sel25, Pinto Mestizo) provides valuable genetic resources for developing improved cultivars adapted to different production scenarios. Genotypes such as G69-33-FJ, which combine high yield with earliness, represent desirable characteristics for environments with abiotic stress and can be used as progenitors in breeding or as new improved cultivars [
17]. These materials serve as genetic sources in crossing schemes aimed at pyramiding multiple stress tolerance genes.
Additionally, the identification of associations between traits and adaptation patterns provides guidance for indirect selection, facilitating the development of improved cultivars with tolerance to multiple stresses. These correlations suggest the possibility of simultaneously selecting for earliness and yield, which are valuable characteristics for developing cultivars adapted to combined thermal and water stress conditions [
4,
17].
4.6. Physiological and Morphological Factors Affecting Stress Response
The diversity of responses observed in the evaluated germplasms reflects adaptive variation in the complexity of interactions between abiotic stress factors. Physiological characterization studies have shown that, when drought is combined with high temperatures, specific responses are induced, including a reduction in photosynthesis, increased respiration, and stomatal closure, accompanied by an increase in leaf temperature [
5]. These stresses can affect the nutraceutical quality of beans, although they do not necessarily compromise their nutritional value [
19].
The differential response is modulated by photoperiod sensitivity, a characteristic that varies with genotype and is accentuated with mean temperatures above 20 °C. The differences observed between the dry season (average DF = 64.4 days) and the rainy season (average DF = 39.4 days) reflect the effects of photoperiod and temperature on phenological development [
20,
21,
22]. Considering that 89% of Mexican landraces exhibit a short-day response [
20], the inclusion of genotypes with different photoperiod sensitivities allowed the documentation of a broad spectrum of adaptive responses.
Growth habits constitute another determining factor in the stress response. The studies included materials of determinate (type 1) and indeterminate (types 2 and 3) habits. Type 3 cultivars, characterized by greater branching and low stature, develop a favorable microclimate under their canopy, a particularly advantageous characteristic against thermal stress in cultivars with a neutral photoperiod [
17].
4.7. Methodological Considerations and Future Research
The strategy of evaluation in two contrasting seasons (dry and rainy) within the same year proved to be effective for identifying specific adaptations. The results suggest that selection of genotypes under combined stress conditions may be more effective than selection under individual stress conditions, especially when the objective is to develop cultivars for regions where multiple stresses occur simultaneously, as is expected in climate change scenarios.
The identification of genotypes with specific adaptations to each type of stress provides valuable germplasm for breeding programs focused on developing cultivars that are tolerant to high temperatures or to the combination of drought and heat. These materials can serve as progenitors for generating new cultivars that are better adapted to the climate change conditions predicted for bean-producing regions. The complex nature of the genotype × environment interaction observed in this study emphasizes the importance of multienvironment evaluation and specific selection strategies for different target environments [
13,
17].
While the experimental approach used in this study—comparing performance across the rainy season (optimal conditions), dry season with irrigation (high-temperature stress), and dry season with terminal drought (combined stress)—provides valuable insights into genotype responses under different environmental conditions, it has certain limitations. Specifically, this design does not include a treatment with drought stress alone under moderate temperatures, which would allow for more precise dissection of the individual effects of each stress factor. Future studies could benefit from controlled environment experiments where temperature and water availability can be manipulated independently to gain a deeper understanding of the physiological mechanisms underlying tolerance to individual and combined stresses. Nevertheless, the field-based approach used here closely represents the actual conditions that crops face in agricultural systems, particularly in regions expected to experience an increased frequency of combined stresses under climate change scenarios. While the experimental approach used in this study provides valuable insights into genotype responses under different environmental conditions, it has certain limitations. The field-based comparison between seasons involves multiple environmental factors beyond temperature and water availability that may contribute to observed differences. However, the dry season treatments (irrigated vs. drought) were conducted simultaneously under identical photoperiod, solar radiation, and humidity conditions, allowing direct comparison of water stress effects under high temperature. The rainy season served as a yield potential baseline, an approach commonly used in drought susceptibility index calculations and field-based stress evaluations in bean breeding programs.
5. Conclusions
The combined stress of terminal drought and high temperatures primarily revealed differential adaptive mechanisms in the evaluated common bean germplasms, suggesting that the response to multiple stress factors is more complex than individual stress responses. The comparative evaluation between contrasting seasons and moisture treatments primarily allowed the identification of genotypes with specific adaptations to different stress conditions, with average yields mainly declining from 1344 kg ha−1 under optimal conditions to 889 kg ha−1 (66.1%) under high-temperature stress and to 317 kg ha−1 (23.6%) under combined stress.
Under high-temperature stress with irrigation, genotypes G69-33-PT and G-19158 demonstrated specific tolerance mechanisms to elevated temperatures with yields above 1800 kg ha−1. In contrast, under combined drought and heat stress, genotypes G69-Sel25, Pinto Mestizo, and Dalia maintained superior performance (>680 kg ha−1), indicating robust water use efficiency and multiple stress tolerance. The drought susceptibility index classification revealed that 22.4% of genotypes were highly tolerant to combined stress, with negative correlations between DSI and phenological traits suggesting that earliness serves as an important adaptive mechanism.
The diversity of superior genotype origins (improved lines, landraces, and commercial cultivars) confirms the importance of exploring various germplasm sources for breeding programs. Genotypes such as G69-33-PT and G-19158 showed excellent performance under heat stress but susceptibility to combined stress, making them suitable for high-temperature environments with reliable water supplies, while highly tolerant genotypes like Pinto Mestizo and G69-Sel25 represent valuable genetic resources for environments with simultaneous drought and heat stress.
This study establishes the foundation for developing cultivars adapted to climate change scenarios where simultaneous drought and high temperatures will be increasingly frequent. The identified genotypes provide valuable tools for breeding programs focused on multiple stress tolerance, with the classification system enabling systematic identification of superior materials for use as parental lines in conventional crossing and selection strategies.


 ,
, 


