Article

Integrated Assessment of Yield, Nitrogen Use Efficiency, and Environmental Impact of Biochar and Organic Fertilizer in Cherry Tomato Production

1
School of Breeding and Multiplication (Sanya Institute of Breeding and Multiplication), Hainan University, Sanya 572025, China
2
School of Tropical Agriculture and Forestry, Hainan University, Haikou 570100, China
3
Department of Agronomy, Garden Campus, Abdul Wali Khan University Mardan, Mardan 23200, Pakistan
*
Author to whom correspondence should be addressed.
Agronomy 2025, 15(7), 1623; https://doi.org/10.3390/agronomy15071623
Submission received: 27 May 2025 / Revised: 29 June 2025 / Accepted: 1 July 2025 / Published: 3 July 2025

Abstract

Chemical nitrogen (N) fertilizer application has substantially boosted crop yield over the past few decades. However, an excessive N supply often comes at the expense of soil health and the long-term sustainability of agricultural ecosystems. To avoid these concerns, both biochar and organic fertilizers offer the potential to improve soil fertility while reducing reliance on chemical N fertilizer. However, the impact of these amendments on N use efficiency (NUE) and potential environmental risk in cherry tomatoes remains unclear. To fill the void, a two-year field experiment was conducted to evaluate the effects of biochar and organic fertilizer in combination with chemical N fertilizer on cherry tomato fruit yield, N uptake, NUE, and potential environmental risk. The results showed that compared with the CK (without biochar and organic fertilizer), biochar application had no significant effect on cherry tomato yield and NUE. In contrast, compared to CK, organic fertilizer increased the fruit yield, partial factor productivity of applied N, N agronomic efficiency, and N recovery efficiency by 21.4%, 18.4%, 18.5%, and 25.1%, respectively, averaged across both cropping seasons. In addition, increasing N fertilizer application alongside organic fertilizer further enhanced cherry tomato yield, but it compromised NUE and increased potential environmental risks related to global warming and terrestrial acidification. A comprehensive evaluation using Z-score analysis, integrating yield performance, NUE, and environmental risk, identified the combined application of organic fertilizer and 160 kg N ha−1 as the most promising fertilizer management practice for the sustainable production of cherry tomatoes. These findings provide a valuable reference for optimizing fertilizer management in cherry tomato production, especially in tropical regions where achieving a balance between sustainability and productivity is crucial.

1. Introduction

Enhancing soil health without compromising food security remains one of the foremost challenges in achieving global sustainable agriculture [1]. Each year, over 120 million tons of chemical nitrogen (N) fertilizer are applied globally to boost crop production [2]. However, a significant proportion of this input is not utilized by crops and is instead lost to the environment, leading to serious consequences such as water and air pollution, ecosystem degradation, and contributions to climate change [3]. Cherry tomato (Lycopersicon esculentum var. cerasiforme), a highly nutritious and economically valuable horticultural crop, is widely cultivated across the world [4]. In practice, the amount of N fertilizer applied in cherry tomato cultivation often exceeds the crop’s actual demand, resulting in soil degradation, environmental harm, and N loss [5]. Enhancing N use efficiency (NUE) is therefore essential to achieve the dual goals of sustaining high crop yields and minimizing environmental impacts [6]. Addressing this challenge requires a shift from conventional fertilization approaches toward more sustainable practices. Consequently, identifying and adopting optimal fertilizer management strategies that reduce dependence on chemical N fertilizers while improving NUE and crop productivity is imperative for advancing agricultural sustainability.
Generally, NUE declines as N input increases, particularly when the input surpasses crop N uptake [7]. Applying organic fertilizer is widely regarded as a promising strategy for improving soil physicochemical properties and providing a continuous nutrient supply, thereby alleviating the lower NUE associated with higher chemical N fertilizer rates [8]. Urea, one of the most commonly used N fertilizers, is rapidly converted to ammonium and is thus more prone to volatilization and leaching losses, whereas N from organic fertilizer is released gradually, thereby influencing N losses [9]. Although the release of N organic fertilizer outside the growth period is theoretically expected to reduce NUE [10], field trials in China suggest that the NUE of organic fertilizers exceeds that of inorganic fertilizers [11]. A likely explanation for the increased NUE of organic fertilizers is the presence of organic matter, along with a full spectrum of macro- and micronutrients, which can enhance crop production [8]. The findings of Duan et al. (2011) support this assertion, suggesting that long-term application of organic fertilizers enhances both NUE and yields compared to the use of chemical fertilizers alone [12]. These results suggest that organic fertilizers can serve as a key component of sustainable fertilizer management strategies, particularly when integrated with optimal N fertilizer rate, which further enhances N retention and utilization.
Returning carbonized agricultural wastes such as biochar to the soil is a promising agronomic intervention that makes full use of agricultural residues, improves fertility, and mitigates long-term environmental degradation [13]. Biochar is a carbon-rich material produced through the pyrolysis of biomass at high temperatures (typically between 200 °C and 1200 °C) under limited or no oxygen conditions [13]. Due to its highly porous structure, large specific surface area, and high cation exchange capacity, biochar significantly improves soil physicochemical properties and nutrient retention [14]. For example, biochar has been shown to enhance NUE by improving soil structure, stimulating beneficial microbial activity, and reducing N losses through leaching and volatilization in paddy fields [15]. To date, the application of biochar has been extensively studied in cereal-based cropping systems, particularly in rice [15], wheat [16], and maize [17]. However, compared with cereal crops, the application of biochar in horticultural crops such as cherry tomatoes remains relatively limited. Given the high N fertilizer demand and low NUE often associated with cherry tomato cultivation, investigating the potential of biochar to enhance NUE and maintain crop productivity is of great importance. Therefore, applying biochar in cherry tomatoes can be a win–win strategy, offering both agronomic and environmental benefits.
In summary, the development of a sustainable farming system relies on the judicious use of agricultural inputs such as chemical N fertilizer, organic amendments, and biochar to ensure food security [18]. Notably, these inputs are also major sources of atmospheric pollution and other environmental concerns, raising persistent concerns about whether their agronomic benefits justify the associated environmental costs [19]. Life Cycle Assessment (LCA) is a widely accepted tool that quantitatively evaluates the environmental impacts of farming systems with different levels of input intensity across the entire production chain [20]. Although LCA has been applied in studies assessing the sustainability of agricultural practices such as crop rotation and conservation tillage, most of these assessments have focused on conventional cropping systems [21], with limited attention to high-input systems such as cherry tomato production. Furthermore, the existing LCA studies have primarily concentrated on greenhouse gas emissions or carbon footprints, often lacking a more comprehensive evaluation across multiple environmental impact categories. In addition, few studies have systematically examined the environmental consequences of different fertilizer management strategies within cherry tomato cultivation. Hence, given the intensive resource input associated with current cherry tomato cropping systems, there is an urgent need to develop evidence-based recommendations that support sustainable agricultural production while minimizing adverse environmental impacts.
The primary objective of this study is to evaluate the agronomic performance and environmental consequences of different fertilizer management strategies in cherry tomato production, with a particular emphasis on improving NUE while minimizing environmental burdens. Specifically, this study aims to (1) examine the effects of biochar and organic fertilizer in combination with chemical N fertilizer application on cherry tomato yield and NUE, and (2) quantify and compare the environmental impacts of these fertilization strategies using an LCA approach across multiple environmental categories. The ultimate goal is to provide a scientific foundation for selecting sustainable fertilization practices in high-input horticultural systems such as cherry tomato cultivation.

2. Materials and Methods

2.1. Experimental Site and Design

Field experiments were performed during two cherry tomato cropping seasons (2022–2023 and 2023–2024) at Chengmai (110°20′ E, 19°75′ N), Hainan Province, China. Chemical characteristics of the 0–20 cm topsoil at the beginning of the first growing season: soil organic matter, 11.05 g kg−1; total N, 1.25 g kg−1; NH4+, 6.29 mg kg−1; NO3, 2.37 mg kg−1; available phosphate, 40.52 mg kg−1; pH 5.0.
Both experiments were carried out in a split-plot design with three replicated plots (10 m × 2 m) for each treatment. The main plots consist of three treatments: biochar, organic fertilizer, and CK (without biochar and organic fertilizer). The application rate of both biochar and organic fertilizer was 20 t ha−1. The organic fertilizer was dried chicken manure being decomposed, had a pH of 7.9, and contained 326 g kg−1 of organic matter, 26.0 g kg−1 total N, 23.2 g kg−1 P2O5, 11.8 g kg−1 K2O, 263 mg kg−1 available P, 2.8 mg kg−1 NH4+, and 0.6 mg kg−1 NO3. The biochar was produced from waste coconut shells through pyrolysis at 600 °C, with a pH of 10.23, carbon content of 71%, N content of 0.5%, a C/N ratio of 142, and a specific surface area of 256 m2·g−1. Before transplanting cherry tomatoes, biochar, organic fertilizer, and soil were thoroughly mixed by a rotary tiller in both years. The subplots consisted of five N fertilizer application rates of 0 kg N ha−1, 80 kg N ha−1, 160 kg N ha−1, 240 kg N ha−1, and 320 kg N ha−1. The N fertilizer was applied in the form of urea (N, 46%) and was split into eight applications. The first four applications each accounted for 12.5% of the total N amount, while the remaining four each accounted for 15.6%. A basal dose of phosphate fertilizer (120 kg P2O5 ha−1) and potassium fertilizer (180 kg K2O ha−1) was broadcast and incorporated into the soil before transplanting the cherry tomatoes. The planting spacing and row spacing were both 1 m, and the planting density was 1×10⁴ plants ha−1. A commercial hybrid cherry tomato variety (Qianxi) was used in these trials. All other crop management practices were implemented following the local agronomic recommendations.

2.2. SPAD Value, Fruit Yield, and Its Components

Cherry tomato fruits started to mature around 80 days after transplanting, and harvesting was carried out in multiple rounds thereafter. The fruit was picked once a week over a total of eight harvests during the production period, and the fruit yield (t ha−1) was calculated based on the cumulative harvest. During this process, 20 fruits were randomly selected at each harvest to determine the average fruit weight (g per fruit). These fruits were then dried in an oven at 80 °C to a constant weight to calculate their dry weight. The fruit number (no. m−2) was calculated based on the individual fruit weight, total fruit weight, and plant density. After the final harvest, three cherry tomato plants (including stem and leaf) were randomly selected from each plot and dried at 80 °C to a constant weight and used to calculate the aboveground biomass (t ha−1). At 100 days after transplanting, the SPAD value (representing the relative chlorophyll content) of the 10 leaves was determined using a portable chlorophyll meter (SPAD-502, Konica Minolta, Tokyo, Japan).

2.3. N Accumulation and NUE

The N concentration in different plant tissues, including fruit, stem, and leaf, was determined by the Kjeldahl method [22]. The samples were ground and passed through a 100-mesh sieve before measuring N concentration. Total N uptake was determined by summing the N content of various plant components. The partial factor productivity (PFP, kg kg−1) of applied N, N agronomic efficiency (NAE, kg kg−1), N recovery efficiency (NRE, %), N physiological efficiency (NPE, kg kg−1), and N harvest index (NHI, %) were calculated according to the following formulae:
P F P = F r u i t   y i e l d   i n   N   t e a t e d   p l o t N   s u p p l y
N A E = F r u i t   y i e l d   i n   N   t e a t e d   p l o t F r u i t   y i e l d   i n   N   z e r o   N   p l o t N   s u p p l y
N R E = N   u p t a k e   o f   t h e   w h o l e   p l a n t   i n   N   t r e a t e d   p l o t N   u p t a k e   o f   t h e   w h o l e   p l a n t   i n   N   z e r o   N   p l o t N   s u p p l y   ×   100
N P E = F r u i t   y i e l d   i n   N   t e a t e d   p l o t F r u i t   y i e l d   i n   N   z e r o   N   p l o t N   u p t a k e   o f   t h e   w h o l e   p l a n t   i n   N   t r e a t e d   p l o t N   u p t a k e   o f   t h e   w h o l e   p l a n t   i n   N   z e r o   N   p l o t
N H I = N   u p t a k e   o f   f r u i t N   u p t a k e   o f   t h e   w h o l e   p l a n t   ×   100

2.4. Life Cycle Environmental Impact Assessment with Seven Categories

The environmental impact assessment method was implemented as CML-IA baseline methodology (Center of Environmental Science of Leiden University, Guinée, 2002 [23]) to evaluate a set of mid-point environment categories. A popular CML-IA was employed because this database contains a comprehensive characterization factor for life cycle impact assessment (LCIA), and could be easily accessed and applied (EC-JRC, 2011 [24]). According to the principles and framework of the ISO 14040/14044 standard series (ISO, 2006a; ISO, 2006b [25,26]), four-step LCA procedures, including goal and scope definition, life-cycle inventory, impact assessment, and interpretation, were conducted in this study [27]. In consideration of major impact categories involving various fertilizer inputs, seven mid-point categories with the most importance on the ecological environment subjected to the CML-IA baseline were selected, including ecotoxicity, global warming, fossil resource scarcity, human toxicity, water consumption, terrestrial acidification, and mineral resource scarcity. In the process of life cycle inventory analysis, the summary of inventory data for cherry tomato production is shown in Table 1. Background data regarding the production of agricultural machinery, diesel fuel, fertilizer, irrigation facility, and pesticides were retrieved from the Ecoinvent 3.5 and Agri-footprint database [28]. The processing and characterization of the seven mid-point categories were completed using the software SimaPro 9.0 (PRé Sustainability, Amersfoort, The Netherlands).
Data represent mean values across the two cropping seasons. tkm/ha: ton-kilometers per hectare, a unit representing the transport workload of one ton of material transported over one kilometer per hectare of land area.

2.5. Standardized Comparison Using the Z-Score Method

To comprehensively evaluate the influence of the combined application of biochar and organic fertilizer with N fertilizer, three important datasets—yield performance, NUE, and environmental risks—were integrated into a unified assessment. Yield-related indicators included fruit yield, fruit number, fruit weight, and aboveground biomass. NUE was evaluated based on PFP, NAE, NRE, NPE, and NHI. Environmental risks were assessed across seven environmental impact categories per kg of fruit yield produced. Yield performance was assigned a weight of 50%, considering it the primary factor, while NUE and environmental risks, reflecting resource utilization and sustainability, respectively, were each assigned a weight of 25%. Finally, to eliminate the influence of differing units and scales among these indicators, the datasets were standardized using the Z-score method prior to comparison.
Z i = x i x - S D   ( positive   indicator )
Z i = x - x i SD   ( negative   indicator )
where Zi denotes the normalized value, xi is the actual value of a given variable under a specific treatment, x is the mean of that variable across all treatments, and SD is the corresponding standard deviation. The positive indicator included yield-related and NUE-related traits, while the negative indicator comprised the seven environmental impact categories per kg of fruit yield produced.

2.6. Statistical Analyses

A three-way analysis of variance (ANOVA) was performed to assess the influence of years, main treatments, and five N application rates and their interactions on yield, N uptake, and NUE-related parameters using SAS software (version 9.3; SAS Institute, Cary, NC, USA). When the results of the ANOVA were significant (p < 0.05), the means among different treatments were compared according to the least significant difference test (LSD0.05). Sigma Plot (version 12.5; SYSTAT, San Jose, CA, USA) and R software (version 4.0.0; R Core Team, Vienna, Austria) were used to generate figures.

3. Results

3.1. Fruit Yield and Its Components

During both cropping seasons, the application of biochar did not result in a significant change in cherry tomato yield compared to CK, whereas organic fertilizer significantly increased the yield (Table 2 and Table 3). Compared to CK, organic fertilizer significantly enhanced the fruit yield by 11.0% and 21.4%, the fruit number by 16.0% and 24.6%, and aboveground biomass by 13.1% and 19.9% across the two cropping seasons. In addition, a significant increase in cherry tomato yield was observed with an increase in the rate of chemical N fertilizer across all three main plot treatments (Table 2 and Table 3). The fruit yield increased significantly when N rates increased from 0 to 240 kg N ha−1 under biochar, while the fruit yield of cherry tomato reached its maximum when the N fertilizer rate was 160 kg N ha−1 under organic fertilizer. Further increases in N application to 360 kg N ha−1 did not result in any significant yield improvement.

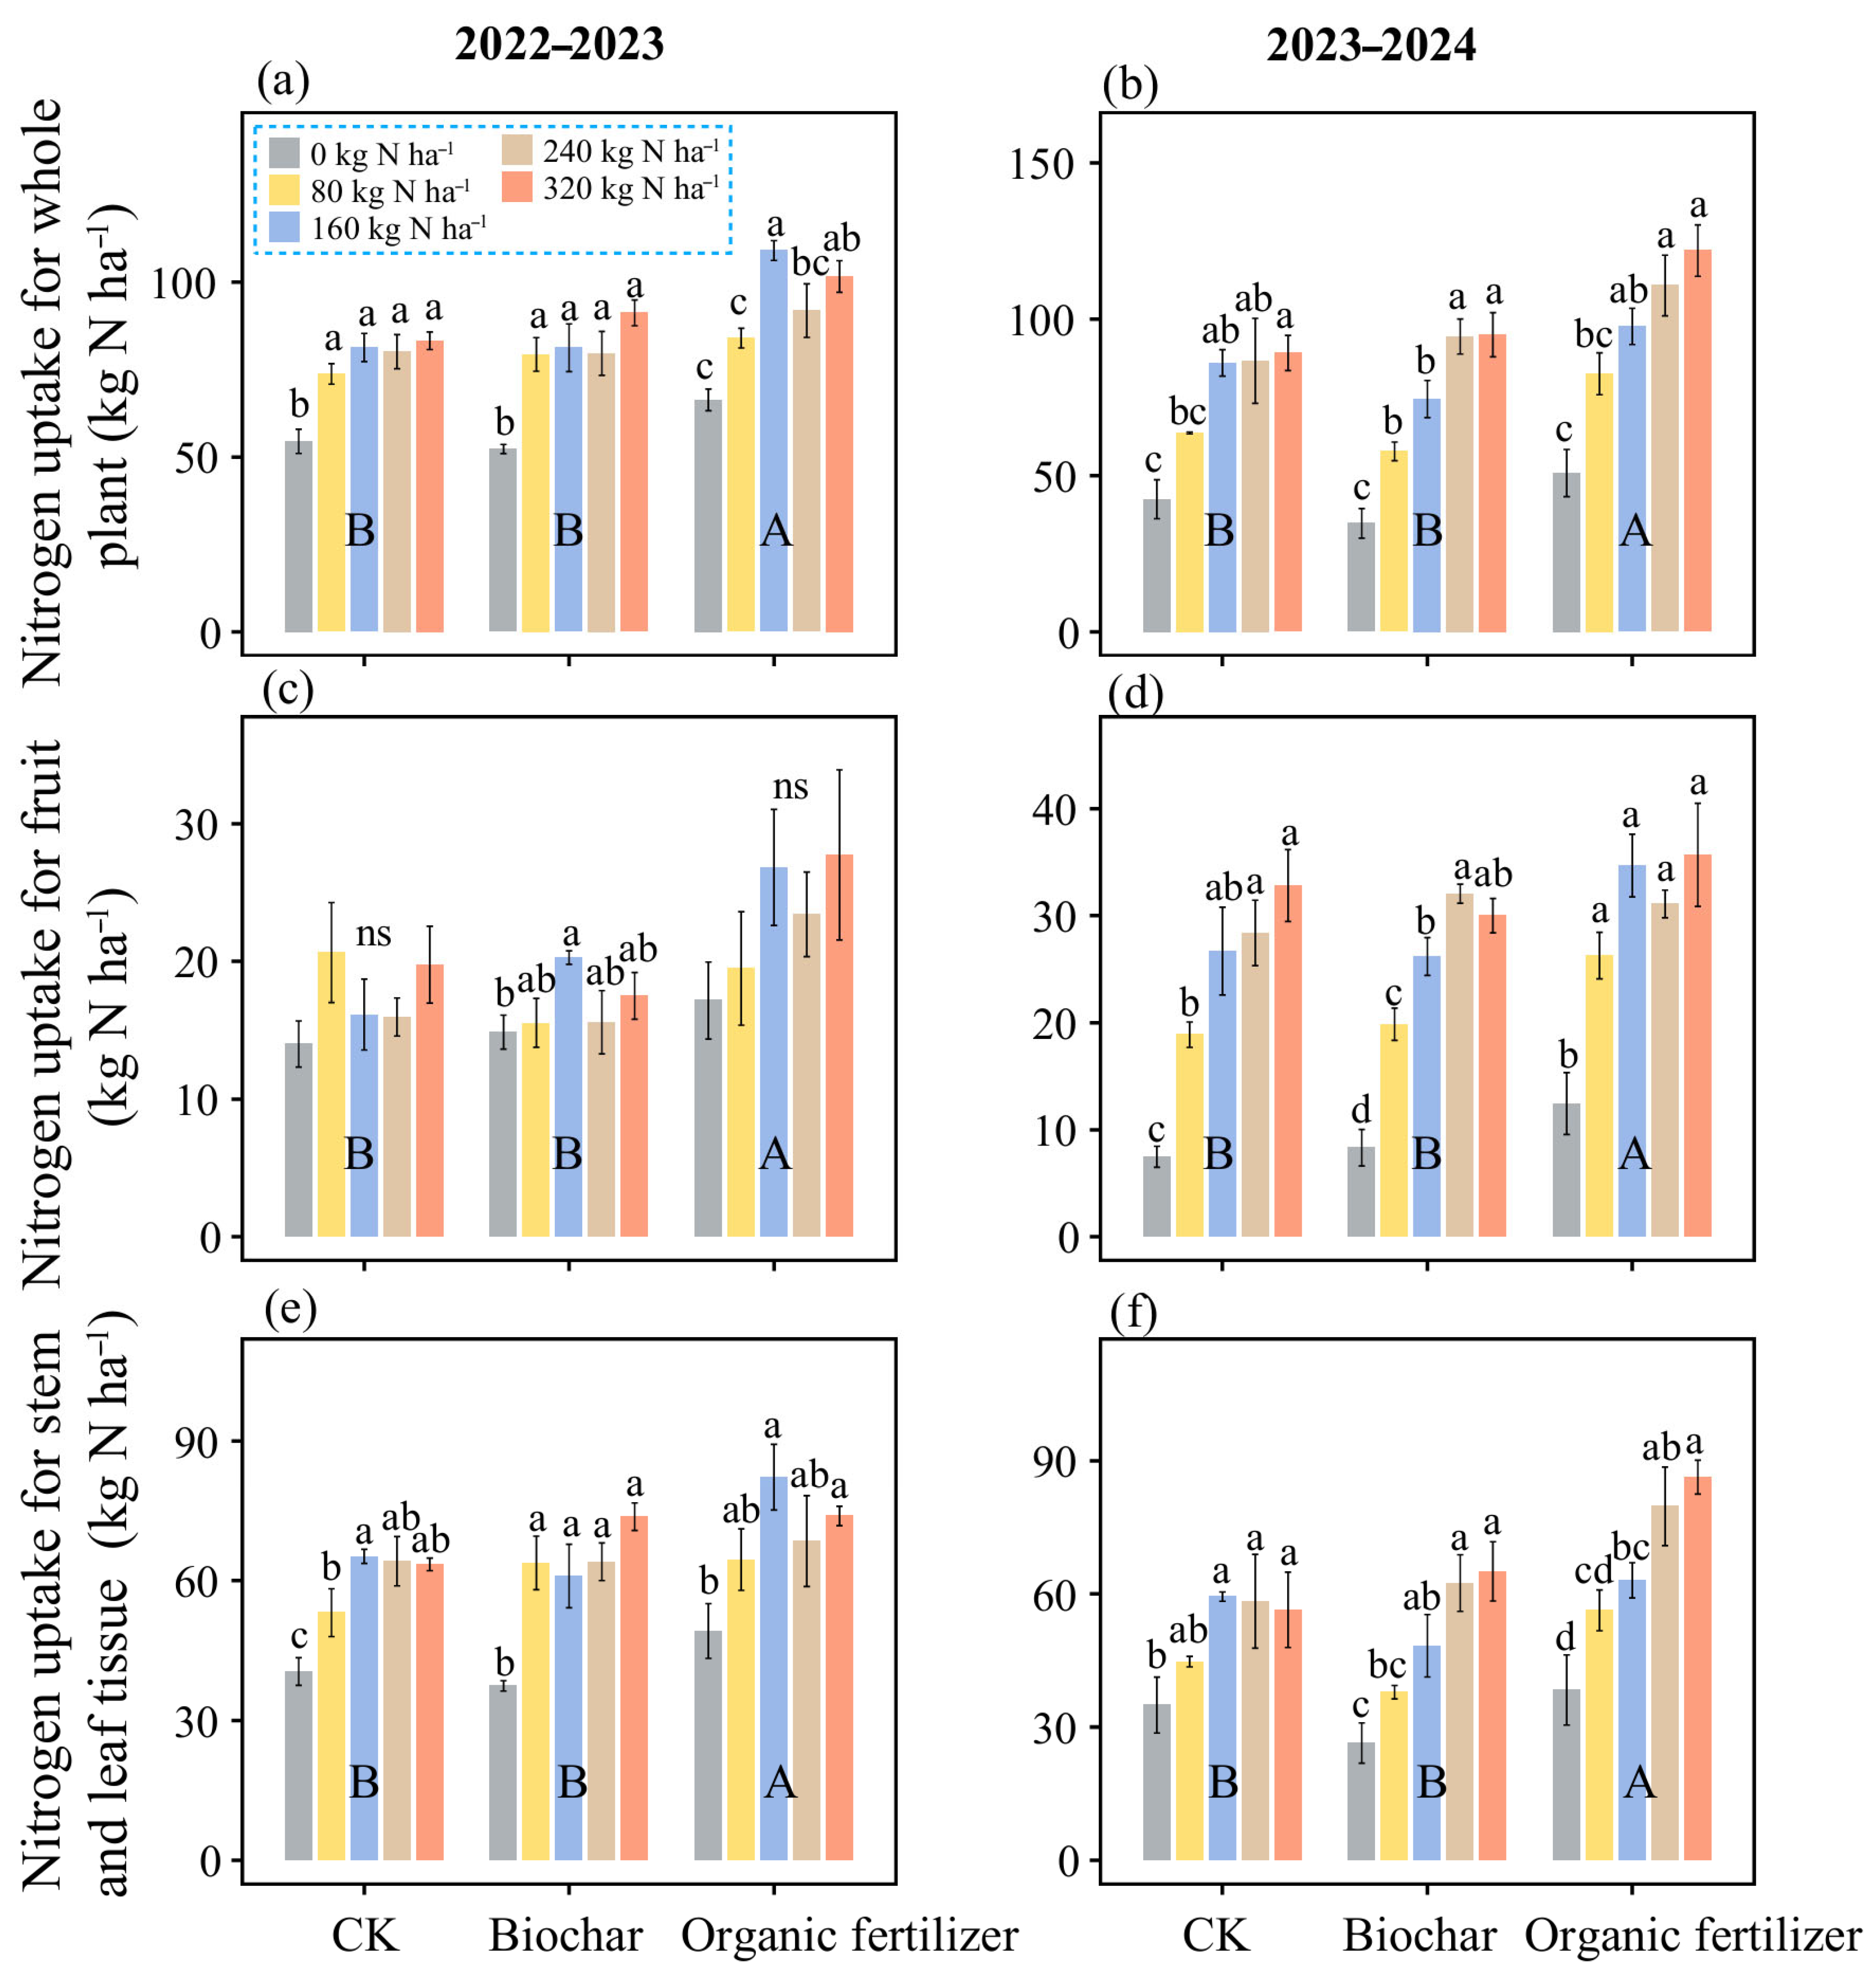
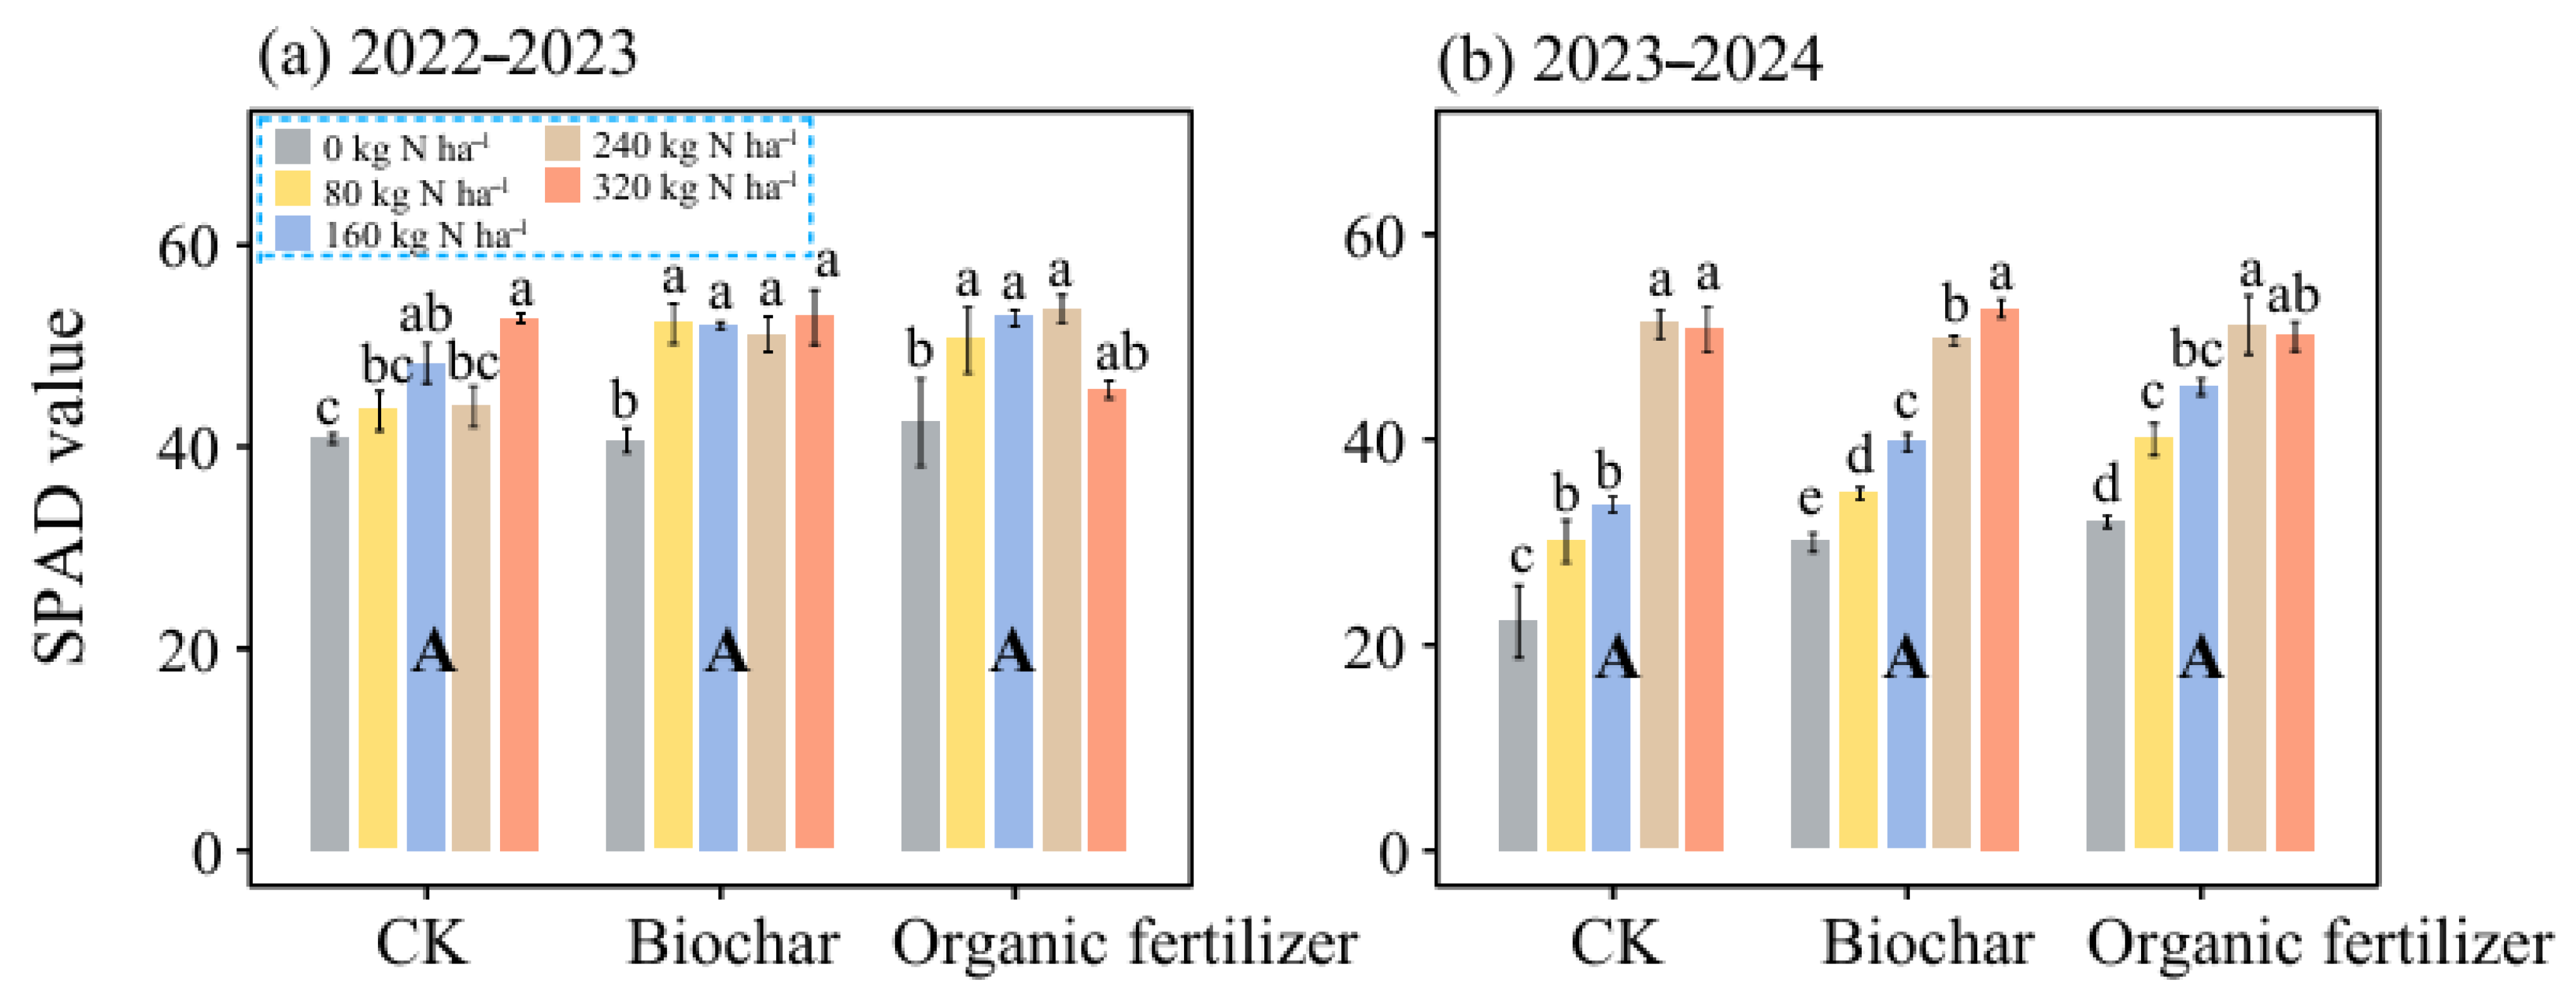
3.2. SPAD Values, N Uptake, and NUE

Organic fertilizer and N fertilizer significantly affected the N uptake for the whole plant, fruit, and stem+leaf tissue, while biochar did not significantly affect these parameters (Figure 1). Compared to CK, the N uptake of whole plant was significantly increased by 21.4% and 26.0%, the N uptake of fruit by 32.5% and 22.7%, and the N uptake of stem+leaf by 18.1% and 27.5% under organic fertilizer in both cropping seasons. The N uptake and SPAD exhibited a positive response to increasing N fertilizer rates when applied in combination with the biochar or organic fertilizer (Figure 2). The N uptake of whole plant and SPAD values under organic fertilizer combined with an N application rate of 160 kg N ha−1 increased by 78.4% and 32.6%, respectively, compared to zero N treatment, when averaged across both cropping seasons.
Compared to CK, biochar application improved NRE and NPE by 12.57% and 1.55%, averaged across the two years. Similarly, in comparison to CK, organic fertilizer increased PFP, NAE, NRE, and NHI by 18.4%, 18.5%, 25.1%, and 4.73%, respectively, when averaged across both cropping seasons (Table 4). In contrast, the PFP, NAE, and NRE were significantly reduced with increasing N application rates under biochar and organic fertilizer in both cropping seasons. The PFP, NAE, and NRE under 240 kg N ha−1 were reduced by 62.6%, 27.6%, and 66.30% in the first year and 57.2%, 26.6%, and 13.4% in the second year, respectively, compared with 80 kg N ha−1 after application of biochar. Similarly, the PFP, NAE, and NRE under 160 kg N ha−1 were reduced by 65.2%, 54.9%, and 51.8% in the first year and 62.1%, 50.2%, and 36.9% in the second year, respectively, compared with 80 kg N ha−1 after application of organic fertilizer. The PCA results further confirmed that higher N application rates were associated with reduced N use efficiency parameters (Figure 3).

3.3. Key Environmental Impact Categories

The seven area-scaled environmental impact categories for biochar and organic fertilizer combined with N fertilizer are summarized in Table 5. Averaged across the five N application rates, the mean environmental impact per hectare across the seven categories increased by 16.4% under biochar and by 66.4% under organic fertilizer, compared to the CK. In particular, the damage categories of ecotoxicity, global warming, and mineral resource depletion were influenced considerably after the application of biochar and organic fertilizer. The ecotoxicity of biochar and organic fertilizer was 14.4% and 64.5% higher than that of CK. Likewise, the global warming potential of biochar and organic fertilizer was 105.5% and 194.4%, whereas the mineral resource depletion was higher by, respectively, 25.0% and 61.0% than CK. Similarly, N application rates had a significant influence on the seven environmental impact categories per hectare, with impacts increasing as the N application rose from 0 to 320 kg N ha−1. Specifically, the mean of all environmental impact categories per hectare under high N applications of 240 and 320 kg ha−1 was enhanced by 93.5% and 124.9%, respectively, compared to the 0 kg N ha−1.
To better reflect the environmental burden per unit of production, the functional unit was shifted from an area-based to a yield-based scale (per 1 kg of fruit yield) to assess the intensity of the seven environmental impact categories, as shown in Table 6. The mean of the seven environmental impacts per kilogram of yield produced under biochar and organic fertilizer increased by 14.9% and 43.0%, respectively, compared to the CK, averaged across the five N application rates. Compared to CK, the ecotoxicity per kilogram of yield produced was 3% and 67% higher with biochar and organic fertilizer. Similarly, in comparison to CK, the global warming per kilogram of yield produced with biochar and organic fertilizer was higher by 13% and 41.6%, whereas mineral resource depletion per kilogram of yield produced was higher by 22.5% and 35.9%, respectively. Meanwhile, following the application of biochar and organic fertilizer, all seven environmental impact categories per kilogram of yield exhibited an increasing trend with higher N fertilizer rates. Specifically, the mean of all environmental impact categories per hectare under the maximum N rates of 240 and 320 kg ha−1 was boosted by 38.9% and 56.8%, respectively, in comparison to 0 kg N ha−1.

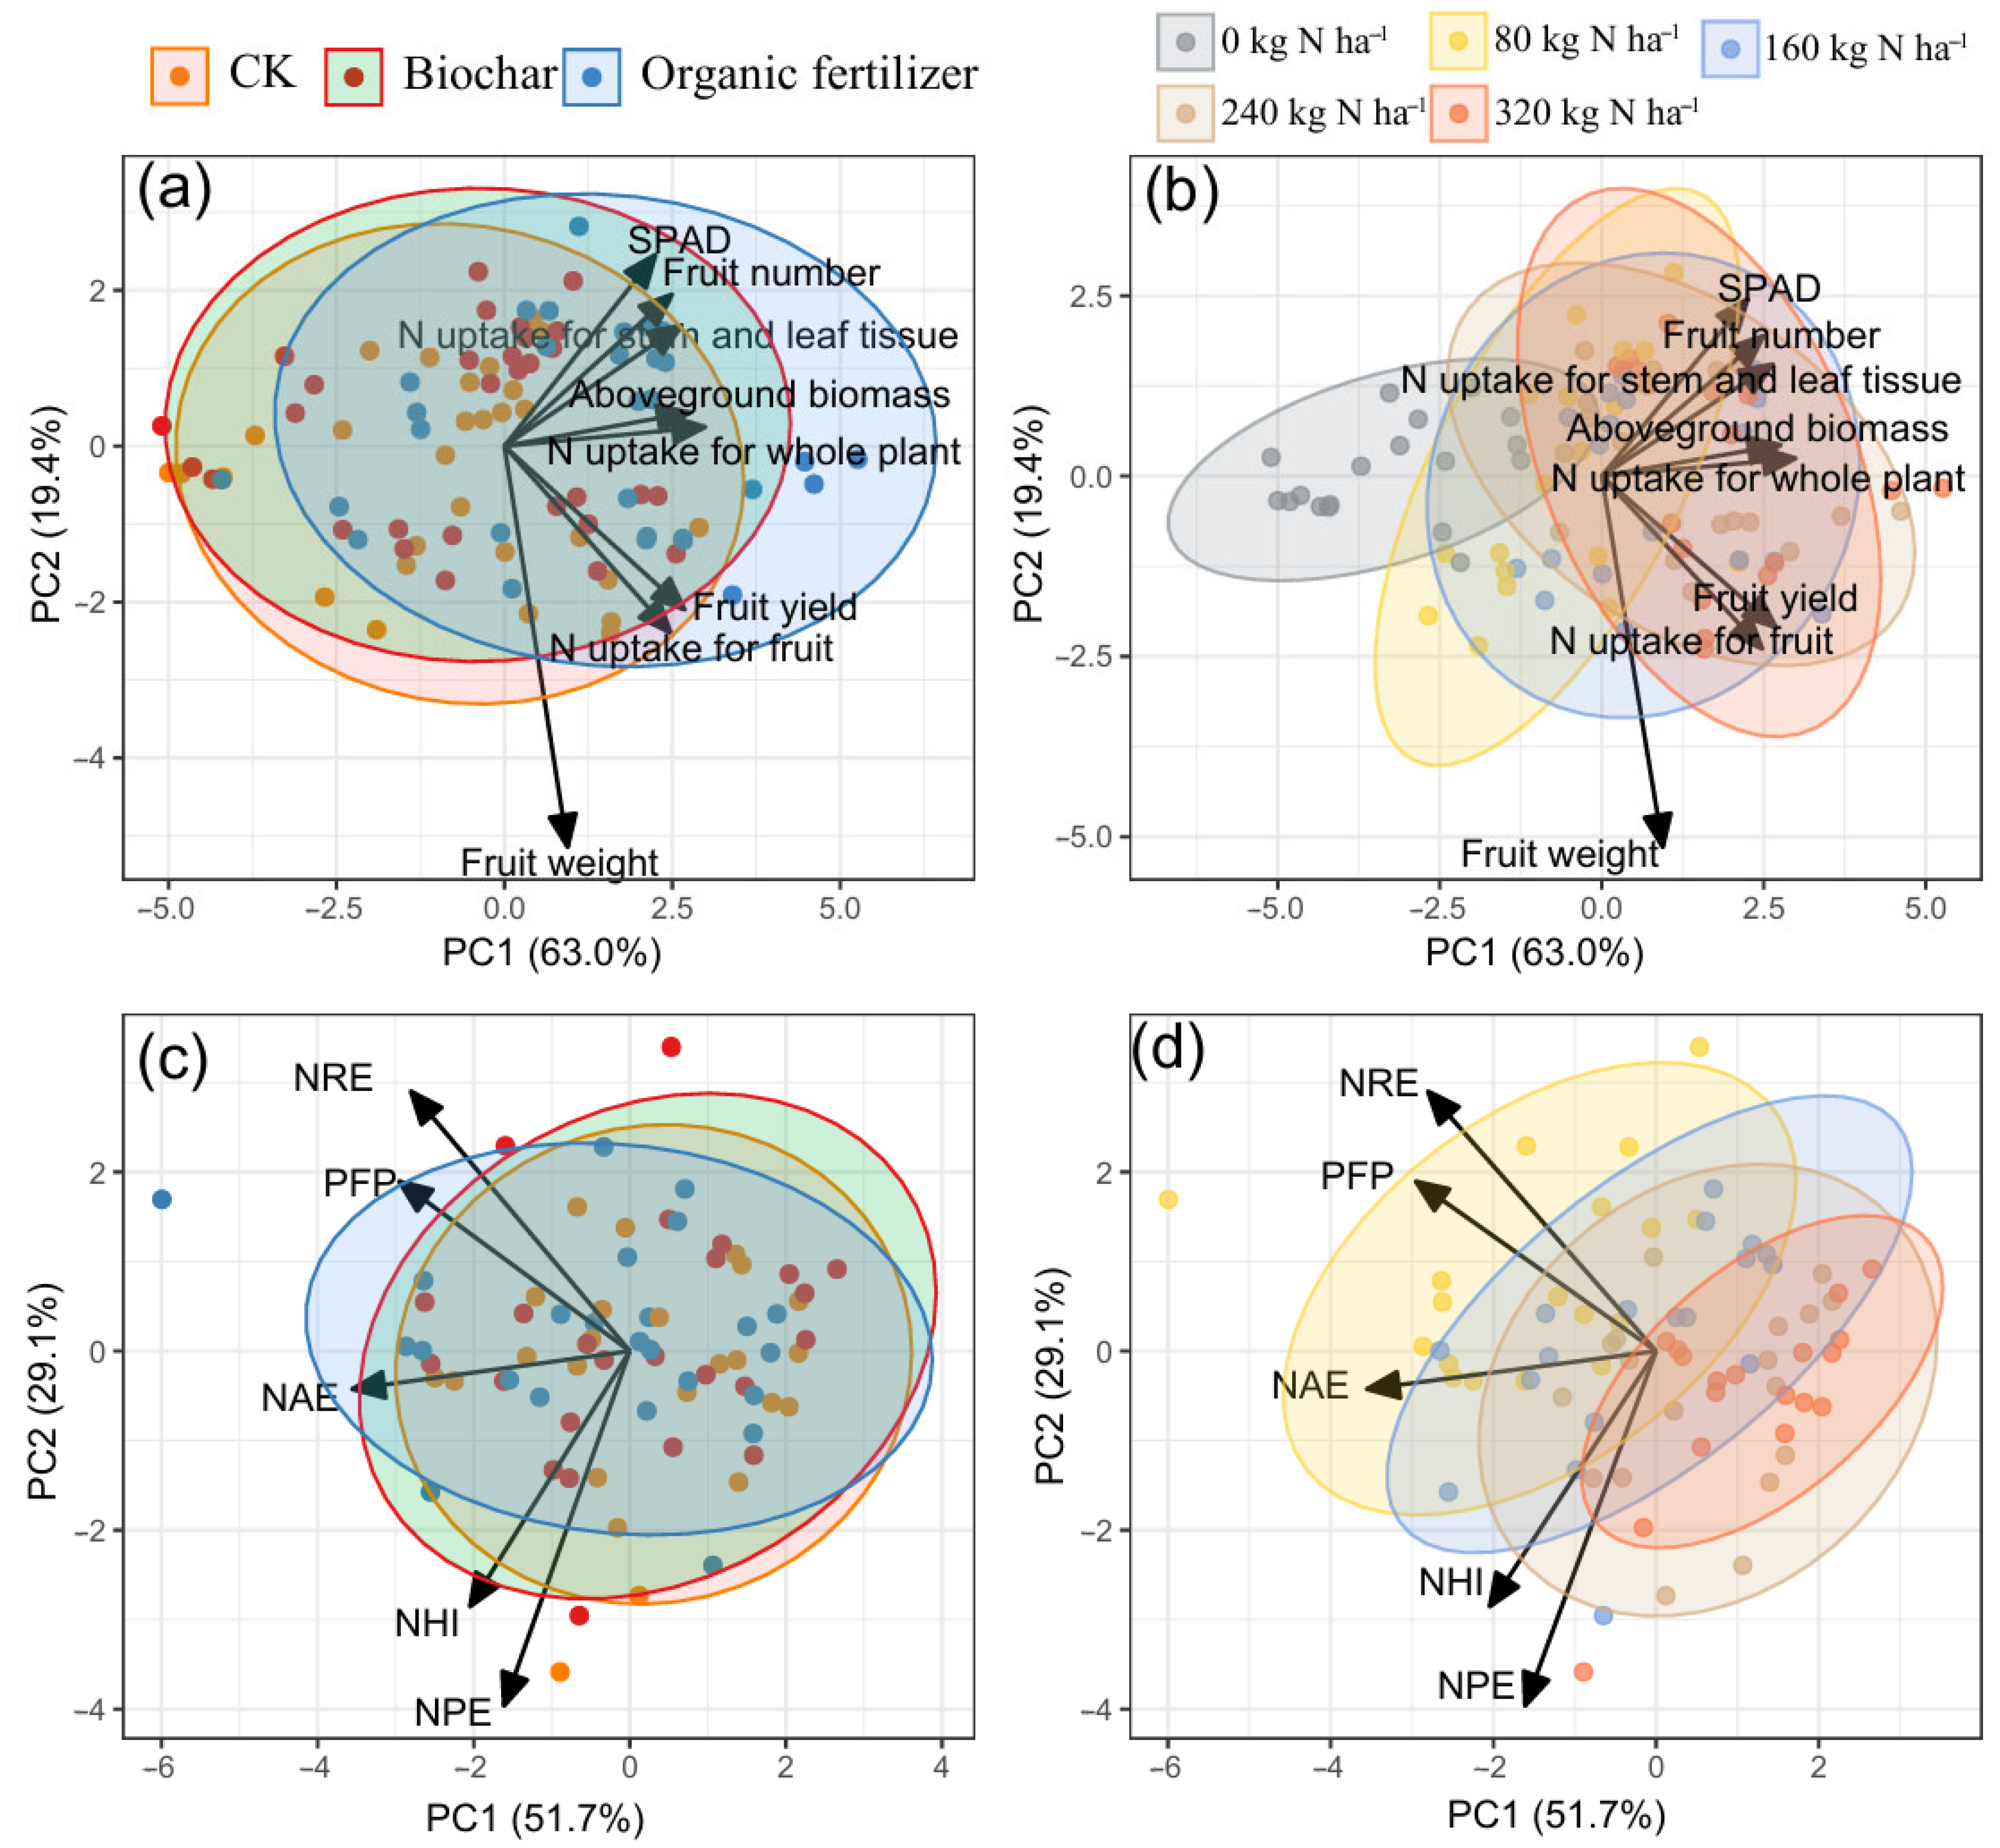
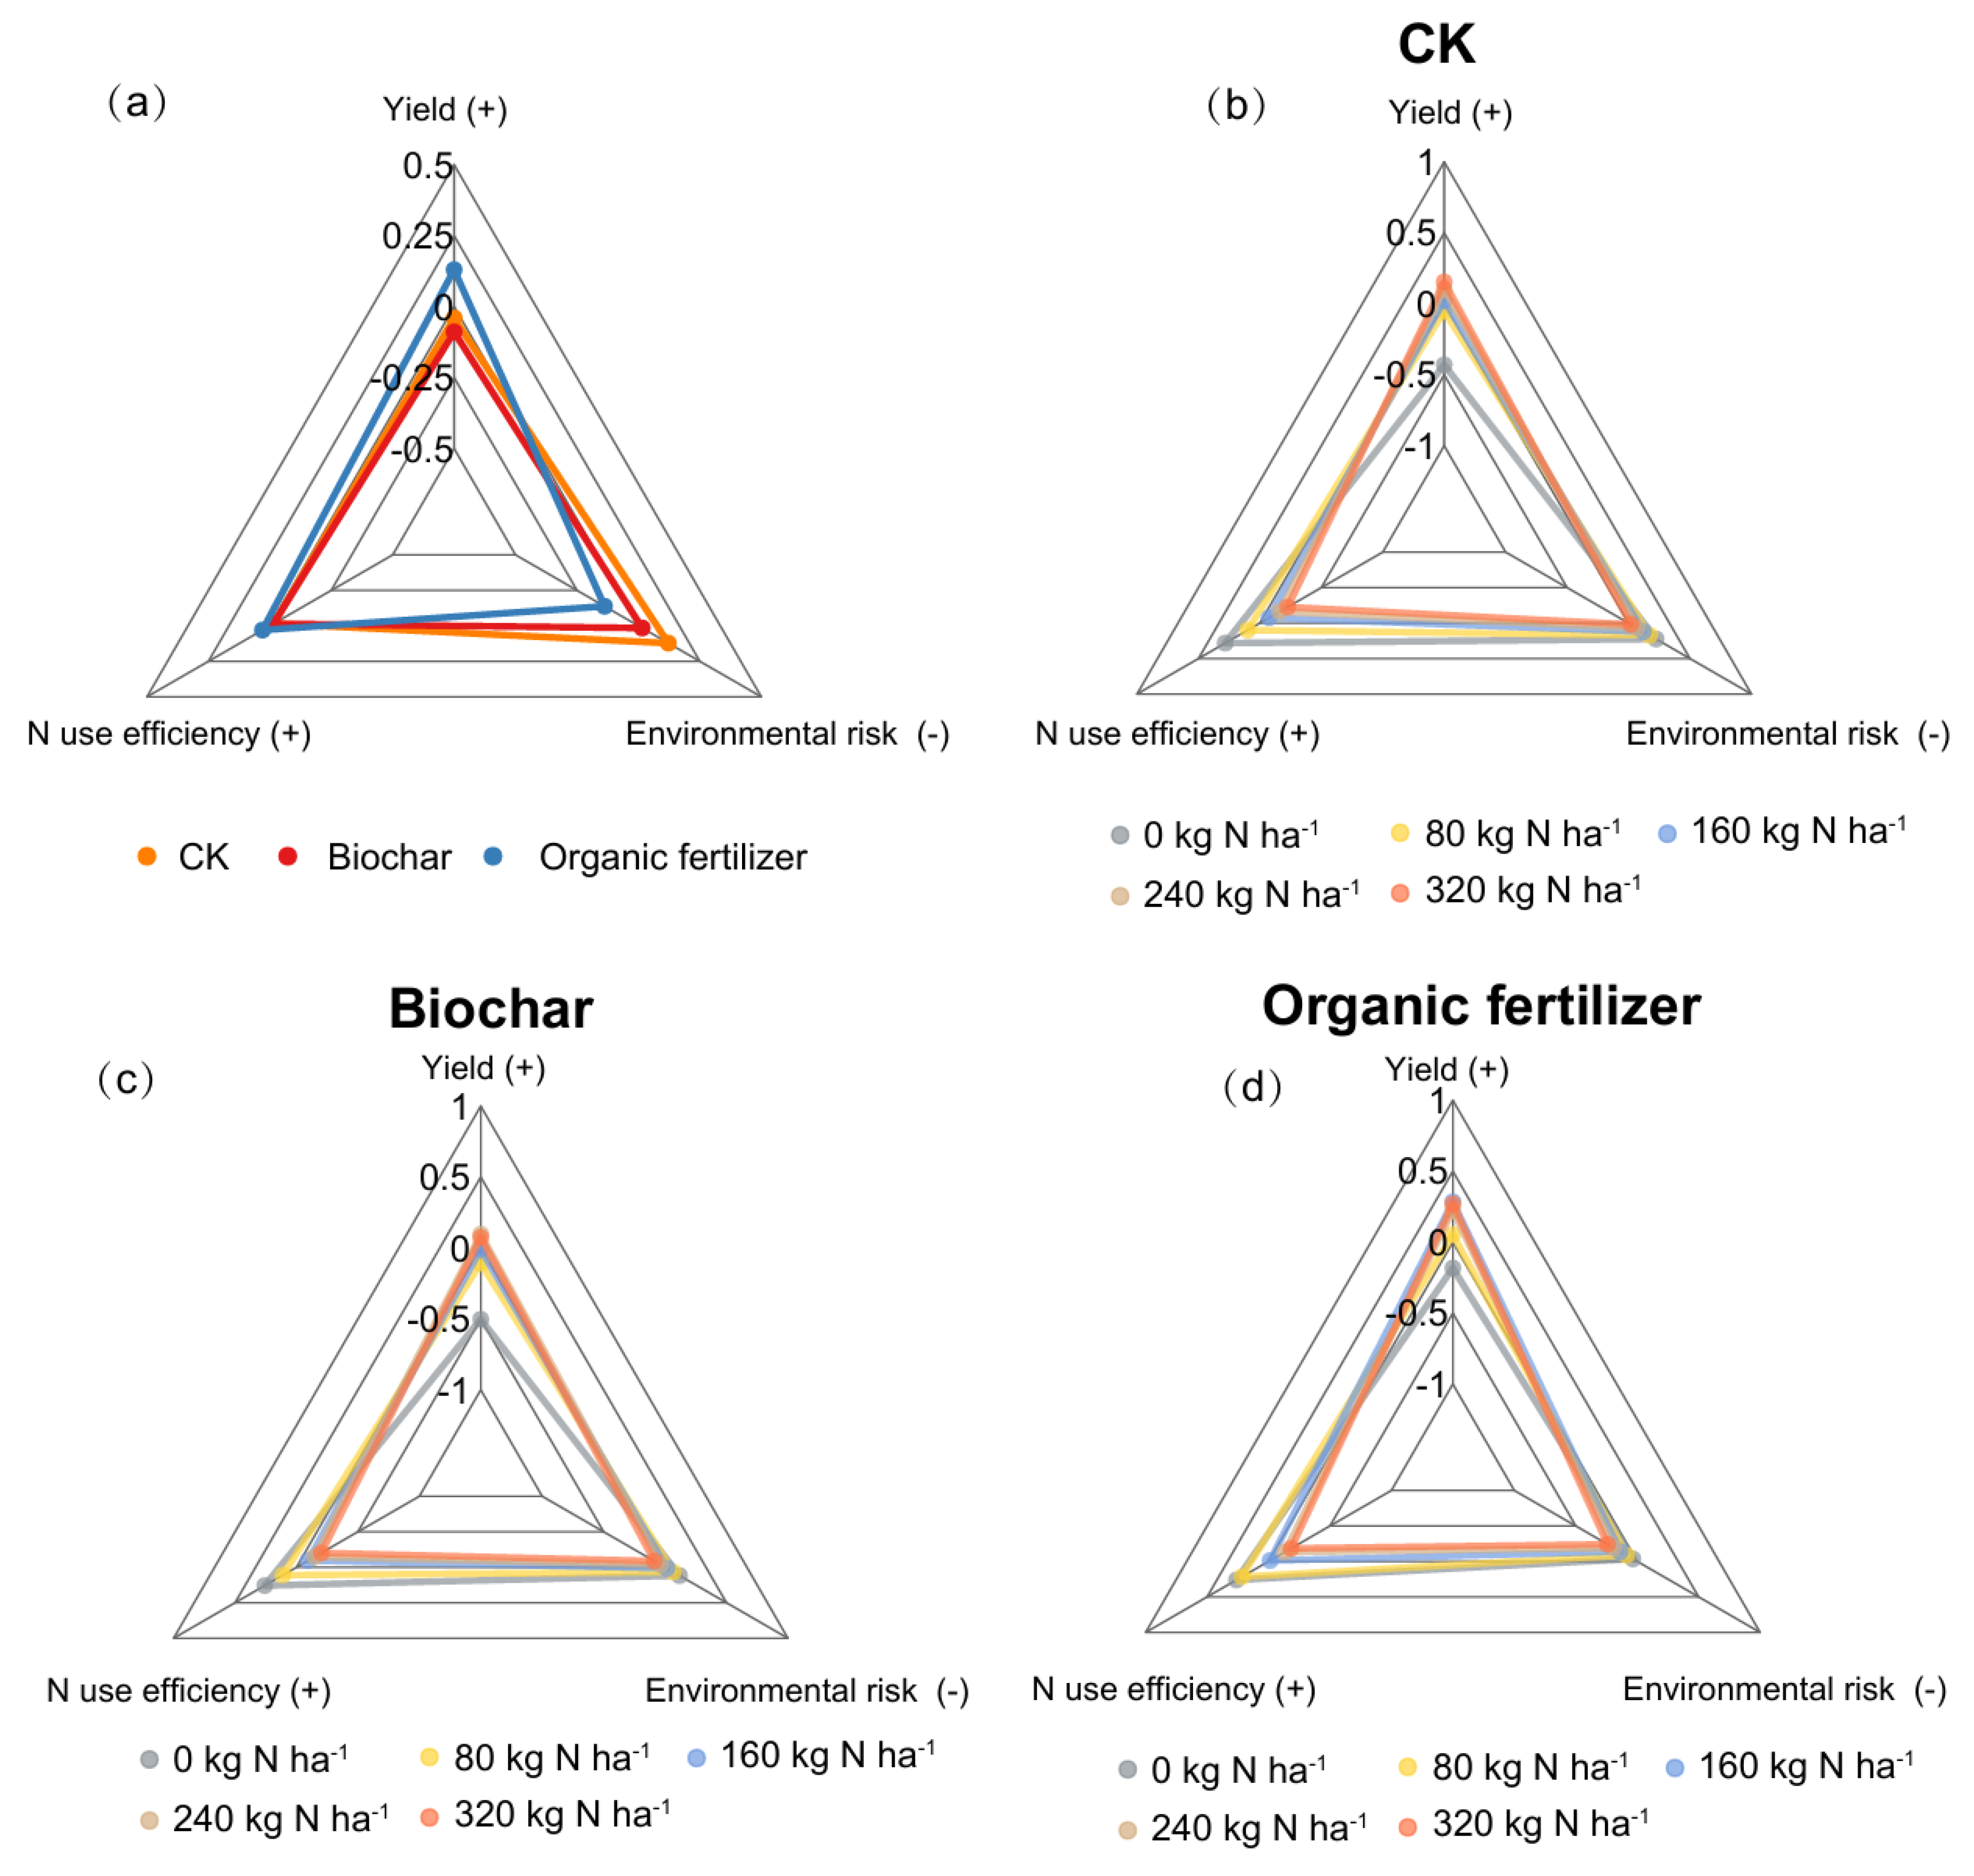
3.4. Integrated Evaluation of Yield Performance, NUE, and Environmental Risk

Three major datasets, including yield performance, NUE, and environmental risks, were integrated into a unified assessment through standardization using the Z-score method (Figure 4). Overall, the organic fertilizer system had far higher Z scores than the CK and biochar for yield performance and NUE (Figure 4a), as shown in Table 3 and Table 4. However, the application of organic fertilizer can pose higher environmental risks, such as increased global warming potential and mineral resource scarcity. Similarly, N application can enhance fruit yield, but it reduces NUE and environmental benefits. The total Z-score of N fertilization was significantly higher than that of 0 kg N ha−1. Overall, combining the organic fertilizer with 160 kg N ha−1 was the optimal fertilizer management strategy for cherry tomato production, balancing yield performance, NUE, and environmental risk.

4. Discussion

4.1. Contrasting Fruit Yields in Response to Soil Amendments

We observed contrasting effects of biochar and organic fertilizer on cherry tomato yield in this study. Biochar application did not significantly affect yield, whereas organic fertilizer led to a notable increase (Table 3). These findings highlight the divergent yield performance in response to different soil amendments. Similar results have been reported in a three-year field trial involving seven different biochar types, where none of the biochar types had a significant effect on processing tomato yield, regardless of application rate, year, or site [29]. The limited yield response to biochar is likely due to its disruption of the soil carbon-to-N ratio, which can hinder N uptake and utilization by crops [30]. In addition, Leng et al. noted that N in biochar primarily exists in the form of heterocyclic aromatic compounds, which are poorly available to plants, resulting in lower N accumulation in crop plants [31]. In the present study, the biochar application was derived from waste coconut shells, which are characterized by relatively low nutrient content, particularly N, when compared to biochar produced from manure or other nutrient-rich feedstocks. In contrast, organic fertilizer not only supplies available nutrients but also improves soil health by increasing organic matter, enhancing soil structure, and boosting water and nutrient retention capacity [8]. These benefits create a more conducive soil environment for cherry tomato growth. Furthermore, under the warm and humid subtropical conditions in this study, nutrient mineralization from organic fertilizers is further accelerated, improving N availability and uptake. As a result, the combined effect of improved soil fertility and favorable climate conditions justifies the significant fruit yield gains of cherry tomatoes observed with organic fertilizer application.
Increasing the N fertilizer application rate further enhanced the fruit yield of cherry tomatoes, regardless of whether biochar or organic fertilizer was applied. This positive yield response can be primarily attributed to the beneficial role of N fertilizer in increasing SPAD values and N uptake, which subsequently improved fruit number and aboveground biomass (Table 3 and Figure 1 and Figure 2). However, a high N application rate (e.g., 320 kg N ha−1) significantly reduced several NUE indicators, including PFP, NAE, and NRE. Previous studies have shown that the lower NUE at higher N rates is largely due to increased residual 15N in the soil, leading to reduced 15N recovery efficiency, as also revealed by stable isotope 15N tracing techniques [32]. In this study, the lower NUE observed under high N application could be explained by the imbalance between the N supply from the soil and the N demand of cherry tomato plants. Such an asynchronous N supply and demand results in substantial N losses through ammonia volatilization, denitrification, nitrate leaching, and surface runoff [33]. Among the four tested N application rates, 160 kg N ha−1 showed higher average values for PFP, NAE, and NRE compared to the 320 kg N ha−1 treatment, while no significant difference was observed between the 160 kg N ha−1 and 240 kg N ha−1 treatments. Therefore, combining 160 kg N ha−1 with organic fertilizer was identified as the optimal fertilization strategy for sustainable cherry tomato production, effectively balancing yield performance and NUE.

4.2. Environmental Assessment as Influenced by Biochar and Organic Fertilizer

While fertilizer management strategies are often designed to maximize crop yields, the associated environmental risks are frequently overlooked. In this study, we found that environmental risks per hectare were 16.4% and 66.4% higher under biochar and organic fertilizer applications, respectively, compared to CK. This suggests that, although both soil amendments contribute to soil improvement and increased crop productivity, organic fertilizer application poses a higher environmental risk than biochar, particularly in categories such as ecotoxicity, global warming potential, and human toxicity. The enhanced environmental burden associated with organic fertilizer is primarily due to increased N leaching and runoff losses, as well as higher gaseous N emissions following its application [34]. Furthermore, the organic fertilizer used in this study was mainly composted chicken manure, containing residual heavy metals and antibiotics, which contributes to elevated ecotoxicity and human toxicity [35]. In contrast, the high porosity and large specific surface area of biochar improved soil pore structure, reduced the decomposition of soil organic matter, and suppressed nitrous oxide and carbon dioxide (CO2) emissions [14]. These properties collectively lower the environmental risks associated with biochar amendment.
To better reflect the environmental assessment of biochar and organic fertilizer, we also evaluated the environmental impacts on a yield-scaled basis (per kilogram of fruit yield). This approach, with a yield-scaled basis as a function unit, emphasizes the importance of producing more yield with less environmental impact, a crucial aspect for balancing food security and sustainability. Notably, some environmental impact categories, especially global warming potential and ecotoxicity, were comparable between biochar and organic fertilizer treatments on a yield-scaled basis. These findings suggested that organic fertilizer application, despite higher per-hectare environmental risks, could provide sufficient yield return to offset its environmental risk. Therefore, organic fertilizer could still be regarded as a promising strategy for balancing high productivity with environmental sustainability.
Effective N fertilizer management is key to unlocking high crop yields. The current study confirmed a positive yield response to increasing N application [36]. However, consistent with previous findings [37], we observed that greenhouse gas (GHG) emissions and environmental risk per unit of yield produced increased with increasing N application rates. Specifically, the application of 240 and 320 kg N ha−1 significantly increased environmental risks both per hectare and kg of fruit yield produced, particularly in environmental categories such as global warming, human toxicity, and terrestrial acidification (Table 5 and Table 6). This elevated environmental burden can be partly attributed to the energy-intensive processes involved in the upstream production of synthetic N fertilizers. The manufacture of ammonia, a key precursor for N fertilizers, relies heavily on fossil fuels such as natural gas, coal, and oil, whose extraction and combustion release GHGs, heavy metals, and toxic byproducts [38]. Previous studies have estimated that approximately one-third of total GHG emissions from chemical N fertilizers occur during the industrial production phase [39]. Additionally, field-level emissions further exacerbate this concern; for instance, CO2 is released during the decomposition of urea after N fertilizer application [40]. Given these findings, the elevated N application rates of 240 and 320 kg N ha−1 are not recommended in combination with biochar or organic fertilizer application. The reason is that these higher N application rates failed to provide proportionate yield gains and instead led to substantial environmental impacts. Notably, the environmental burden per kg of fruit yield produced under these two rates increased by 38.9% and 56.8%, respectively, compared to the moderate N application rate of 160 kg N ha−1. Therefore, a moderate N application rate of 160 kg N ha−1 combined with organic fertilizer emerges as an appropriate method that can balance crop productivity and environmental sustainability in cherry tomato production.

4.3. Comparative Assessment of Biochar and Organic Fertilizer via Z-Score Analysis

Integrated assessment of yield performance, NUE, and environmental impact for biochar and organic fertilizer is critical for the sustainable development of cherry tomato production [41]. In the current study, the standardized Z-score method was employed. The results revealed that the application of organic fertilizer plus 160 kg N ha−1 achieved the highest total Z-score among all treatments (Figure 4). This finding aligns with the results of Hu et al., who reported that organic fertilizer significantly improves ecosystem multifunctionality and enhances soil microbial functions related to C-N-P-S cycling [42]. When each treatment was analyzed separately, the average Z-score for organic fertilizer at 160 kg N ha−1 was higher than that at 240 kg N ha−1, suggesting that the higher N input may have exceeded the crop’s nutrient requirements, resulting in diminishing returns. In contrast, for biochar treatments, the average Z-score at 160 kg N ha−1 was lower than that at 240 kg N ha−1, indicating that the lower N rate may have been insufficient to meet crop N demand, and that yield improvements could be achieved with higher N inputs in biochar-amended systems. These contrasting patterns between biochar and organic fertilizer highlight the importance of aligning chemical N fertilizer inputs with crop demand. Future studies should incorporate a broader range of indicators, such as soil nutrient availability and microbial community composition, to generate more comprehensive data for guiding fertilizer management practices in cherry tomato cropping systems.

5. Conclusions

This study demonstrates that the combined application of organic fertilizer and chemical N fertilizer at an appropriate rate, in particular 160 kg N ha−1, significantly improves cherry tomato yield, N uptake, and NUE. While biochar alone does not markedly enhance fruit yield, its combination with increased N fertilizer positively improves N uptake and SPAD value. However, excessive N application (≥240 kg N ha−1) leads to diminished NUE and elevated environmental risks, including higher global warming potential, ecotoxicity, and resource depletion. A comprehensive evaluation system using Z-scores for integrating yield performance, NUE, and environmental risk indicates that the combination of organic fertilizer with a chemical N application rate of 160 kg N ha−1 is the most balanced and sustainable fertilization strategy under the current experimental conditions.

Author Contributions

Conceptualization, W.W.; methodology, W.W.; software, Z.L. and S.Z.; validation, F.S. and L.X.; formal analysis, Z.L. and S.Z.; investigation, Z.L. and S.Z.; resources, W.W.; data curation, Z.L. and S.Z.; writing—original draft preparation, Z.L. and S.Z.; writing—review and editing, F.S., L.X. and W.W.; project administration, W.W.; funding acquisition, W.W. All authors have read and agreed to the published version of the manuscript.

Funding

This research received no external funding.

Data Availability Statement

The raw data supporting the conclusions of this article will be made available by the authors on request.

Conflicts of Interest

The authors declare no conflicts of interest.

References

  1. Kopittke, P.M.; Menzies, N.W.; Wang, P.; McKenna, B.A.; Lombi, E. Soil and the intensification of agriculture for global food security. Environ. Int. 2019, 132, 105078. [Google Scholar] [CrossRef] [PubMed]
  2. Zhang, X.; Davidson, E.A.; Mauzerall, D.L.; Searchinger, T.D.; Dumas, P.; Shen, Y. Managing nitrogen for sustainable development. Nature 2015, 528, 51–59. [Google Scholar] [CrossRef] [PubMed]
  3. Steffen, W.; Richardson, K.; Rockström, J.; Cornell, S.E.; Fetzer, I.; Bennett, E.M.; Biggs, R.; Carpenter, S.R.; de Vries, W.; de Wit, C.A.; et al. Planetary boundaries: Guiding human development on a changing planet. Science 2015, 347, 6223. [Google Scholar] [CrossRef] [PubMed]
  4. Elbadrawy, E.; Sello, A. Evaluation of nutritional value and antioxidant activity of tomato peel extracts. Arab. J. Chem. 2016, 9, S1010–S1018. [Google Scholar] [CrossRef]
  5. Guo, X.X.; Zhao, D.; Zhuang, M.H.; Wang, C.; Zhang, F.S. Fertilizer and pesticide reduction in cherry tomato production to achieve multiple environmental benefits in Guangxi, China. Sci. Total Environ. 2021, 793, 148527. [Google Scholar] [CrossRef]
  6. Xu, J.M.; Ren, C.C.; Zhang, X.M.; Wang, C.; Wang, S.T.; Ma, B.; He, Y.; Hu, L.F.; Liu, X.M.; Zhang, F.Z.; et al. Soil health contributes to variations in crop production and nitrogen use efficiency. Nat. Food 2025, 6, 597–609. [Google Scholar] [CrossRef]
  7. Govindasamy, P.; Muthusamy, S.K.; Bagavathiannan, M.; Mowrer, J.; Jagannadham, P.T.K.; Maity, A.; Halli, H.M.; Sujayananad, G.K.; Vadivel, R.; Das, T.K.; et al. Nitrogen use efficiency-a key to enhance crop productivity under a changing climate. Front. Plant Sci. 2023, 14, 1121073. [Google Scholar] [CrossRef]
  8. Iqbal, A.; He, L.; Khan, A.; Wei, S.Q.; Akhtar, K.; Ali, I.; Ullah, S.; Munsif, F.; Zhao, Q.; Jiang, L.G. Organic manure coupled with inorganic fertilizer: An approach for the sustainable production of rice by improving soil properties and nitrogen use efficiency. Agronomy 2019, 9, 651. [Google Scholar] [CrossRef]
  9. Bremner, J.M. Recent research on problems in the use of urea as a nitrogen fertilizer. Fertil. Res. 1995, 42, 321–329. [Google Scholar] [CrossRef]
  10. Dawson, J.C.; Huggins, D.R.; Jones, S.S. Characterizing nitrogen use efficiency in natural and agricultural ecosystems to improve the performance of cereal crops in low-input and organic agricultural systems. Field Crops Res. 2008, 107, 89–101. [Google Scholar] [CrossRef]
  11. Zhang, M.; Yao, Y.L.; Tian, Y.H.; Ceng, K.; Zhao, M.; Zhao, M.; Yin, B. Increasing yield and N use efficiency with organic fertilizer in Chinese intensive rice cropping systems. Field Crops Res. 2018, 227, 102–109. [Google Scholar] [CrossRef]
  12. Duan, Y.H.; Xu, M.G.; Wang, B.R.; Yang, X.Y.; Huang, S.M.; Gao, S.D. Long–term evaluation of manure application on maize yield and nitrogen use efficiency in China. Soil Sci. Soc. Am. J. 2011, 75, 1562–1573. [Google Scholar] [CrossRef]
  13. Neves, D.; Thunman, H.; Matos, A.; Tarelho, L.; Gómez-Barea, A. Characterization and prediction of biomass pyrolysis products. Prog. Energy Combust. Sci. 2011, 37, 611–630. [Google Scholar] [CrossRef]
  14. Zhang, K.; Sui, Y.H.; Gao, J.P.; Zhang, Z.C.; Chen, L.L.; Tang, S.Y.; Wan, X.; Jiang, H.F.; Zhao, Y.Z.; Zhang, W.Z. Different roles of biochar in mitigating greenhouse gas emissions from paddy fields in northern and southern China. Crop Environ. 2025; in press. [Google Scholar] [CrossRef]
  15. Liu, Y.; Li, H.D.; Hu, T.S.; Mahmoud, A.; Li, J.; Zhu, R.; Jiao, X.Y.; Jing, P.R. A quantitative review of the effects of biochar application on rice yield and nitrogen use efficiency in paddy fields: A meta-analysis. Sci. Total Environ. 2022, 830, 154792. [Google Scholar] [CrossRef]
  16. Shahzadi, A.; Noreen, Z.; Alamery, S.; Zafar, F.; Haroon, A.; Rashid, M.; Aslam, M.; Younas, A.; Attia, K.A.; Mohammed, A.A.; et al. Effects of biochar on growth and yield of Wheat (Triticum aestivum L.) under salt stress. Sci. Rep. 2024, 14, 20024. [Google Scholar] [CrossRef]
  17. Cong, M.F.; Hu, Y.; Sun, X.; Yan, H.; Yu, G.L.; Tang, G.M.; Chen, S.H.; Xu, W.L.; Jia, H.T. Long-term effects of biochar application on the growth and physiological characteristics of maize. Front. Plant Sci. 2023, 14, 1172425. [Google Scholar] [CrossRef] [PubMed]
  18. Shah, F.; Wu, W. Soil and crop management strategies to ensure higher crop productivity within sustainable environments. Sustainability 2019, 11, 1485. [Google Scholar] [CrossRef]
  19. Agathokleous, E.; Frei, M.; Knopf, O.M.; Muller, O.; Xu, Y.S.; Nguyen, T.H.; Gaiser, T.; Liu, X.Y.; Liu, B.; Saitanis, C.J.; et al. Adapting crop production to climate change and air pollution at different scales. Nat. Food 2023, 4, 854–865. [Google Scholar] [CrossRef]
  20. Alhashim, R.; Deepa, R.; Anandhi, A. Environmental impact assessment of agricultural production using LCA: A review. Climate 2021, 9, 164. [Google Scholar] [CrossRef]
  21. Afshar, R.K.; Dekamin, M. Sustainability assessment of corn production in conventional and conservation tillage systems. J. Clean. Prod. 2022, 351, 131508. [Google Scholar] [CrossRef]
  22. Bremner, J.M. Determination of nitrogen in soil by the Kjeldahl method. J. Agric. Sci. 1960, 55, 11–33. [Google Scholar] [CrossRef]
  23. Guinée, J.B. (Ed.) Handbook on Life Cycle Assessment: Operational Guide to the ISO Standards; Kluwer Academic Publishers: Dordrecht, The Netherlands, 2002; ISBN 1-4020-0557-1. [Google Scholar]
  24. EC-JRC, European Commission—Joint Research Centre. (2011). ILCD Handbook: Recommendations for Life Cycle Impact Assessment in the European Context. EUR 24571 EN. Publications Office of the European Union, Luxembourg. Available online: https://publications.jrc.ec.europa.eu/repository/handle/JRC61049 (accessed on 30 June 2025).
  25. ISO, 2006a. ISO 14040: Environmental Management—Life Cycle Assessment—Principles and Framework. International Organization for Standardization, Geneva. Available online: https://www.iso.org/standard/37456.html (accessed on 30 June 2025).
  26. ISO, 2006b. ISO 14044: Environmental Management—Life Cycle Assessment—Requirements and Guidelines. International Organization for Standardization, Geneva. Available online: https://www.iso.org/standard/38498.html (accessed on 30 June 2025).
  27. Xiong, L.; Liang, C.; Ma, B.L.; Shah, F.; Wu, W. Carbon footprint and yield performance assessment under plastic film mulching for winter wheat production. J. Clean. Prod. 2020, 270, 122468. [Google Scholar] [CrossRef]
  28. Xiong, L.; Li, Z.J.; Shah, F.; Wang, P.; Yuan, Q.H.; Wu, W. Biodegradable mulch film enhances the environmental sustainability compared with traditional polyethylene film from multidimensional perspectives. Chem. Eng. J. 2024, 492, 152219. [Google Scholar] [CrossRef]
  29. Gelardi, D.L.; Lazicki, P.A.; Rath, D.; Leinfelder-Miles, M.M.; Scow, K.M.; Geisseler, D.J.; Parikh, S.J. Three-year field trials with seven biochars reveal minor changes in soil chemical properties but no impact on crop yield. Field Crops Res. 2025, 325, 109807. [Google Scholar] [CrossRef]
  30. Xu, H.; Cai, A.D.; Wu, D.; Liang, G.P.; Xiao, J.; Xu, M.G.; Colinet, G.; Zhang, W.J. Effects of biochar application on crop productivity, soil carbon sequestration, and global warming potential controlled by biochar C: N ratio and soil pH: A global meta-analysis. Soil Tillage Res. 2021, 213, 105125. [Google Scholar] [CrossRef]
  31. Leng, L.J.; Xu, S.Y.; Liu, R.F.; Yu, T.; Zhuo, X.M.; Leng, S.Q.; Xiong, Q.; Huang, H.J. Nitrogen containing functional groups of biochar: An overview. Bioresour. Technol. 2020, 298, 122286. [Google Scholar] [CrossRef]
  32. Wan, X.J.; Wu, W.; Liao, Y.C. Mitigating ammonia volatilization and increasing nitrogen use efficiency through appropriate nitrogen management under supplemental irrigation and rain–fed condition in winter wheat. Agric. Water Manag. 2021, 255, 107050. [Google Scholar] [CrossRef]
  33. Mao, X.P.; Gu, J.L.; Wang, F.; Wang, K.; Liu, R.L.; Hong, Y.; Wang, Y.; Han, F.P. Yield, quality, and nitrogen leaching of open-field tomato in response to different nitrogen application measures in Northwestern China. Plants 2024, 13, 924. [Google Scholar] [CrossRef]
  34. Wei, Z.B.; Hoffland, E.; Zhuang, M.H.; Hellegers, P.; Cui, Z.L. Organic inputs to reduce nitrogen export via leaching and runoff: A global meta-analysis. Environ. Pollut. 2021, 291, 118176. [Google Scholar] [CrossRef]
  35. Deng, W.W.; Zhang, A.Y.; Chen, S.J.; He, X.P.; Jin, L.; Yu, X.M.; Yang, S.Z.; Li, B.; Fan, L.Q.; Ji, L.; et al. Heavy metals, antibiotics and nutrients affect the bacterial community and resistance genes in chicken manure composting and fertilized soil. J. Environ. Manag. 2020, 257, 109980. [Google Scholar] [CrossRef] [PubMed]
  36. Duan, J.Z.; Shao, Y.H.; He, L.; Li, X.; Hou, G.G.; Li, S.N.; Feng, W.; Zhu, Y.J.; Wang, Y.H.; Xie, Y.X. Optimizing nitrogen management to achieve high yield, high nitrogen efficiency and low nitrogen emission in winter wheat. Sci. Total Environ. 2019, 697, 134088. [Google Scholar] [CrossRef] [PubMed]
  37. Guo, C.; Liu, X.F.; He, X.F. A global meta-analysis of crop yield and agricultural greenhouse gas emissions under nitrogen fertilizer application. Sci. Total Environ. 2022, 831, 154982. [Google Scholar] [CrossRef]
  38. Li, Y.F.; Zhang, Z.Y.; Wang, Q.R.; Long, X.T.; Cao, Y.W.; Yang, H.P.; Yang, Q. The nitrogen and carbon footprints of ammonia synthesis in China based on life cycle assessment. J. Environ. Manag. 2023, 345, 118848. [Google Scholar] [CrossRef]
  39. Menegat, S.; Ledo, A.; Tirado, R. Greenhouse gas emissions from global production and use of nitrogen synthetic fertilisers in agriculture. Sci. Rep. 2022, 12, 14490. [Google Scholar] [CrossRef]
  40. Duan, T.Z.; Zhao, J.T.; Zhu, L.Z. Insights into CO2 and N2O emissions driven by applying biochar and nitrogen fertilizers in upland soil. Sci. Total Environ. 2024, 929, 172439. [Google Scholar] [CrossRef]
  41. Yu, S.; Mu, Y.T. Sustainable agricultural development assessment: A comprehensive review and bibliometric analysis. Sustainability 2022, 14, 11824. [Google Scholar] [CrossRef]
  42. Hu, W.; Zhang, Y.P.; Rong, X.M.; Zhou, X.; Fei, J.C.; Peng, J.W.; Luo, G.W. Biochar and organic fertilizer applications enhance soil functional microbial abundance and agroecosystem multifunctionality. Biochar 2024, 6, 3. [Google Scholar] [CrossRef]
Figure 1. The nitrogen (N) uptake for whole plant (a,b), fruit (c,d), and stem and leaf tissues (e,f) at five N fertilizer application rates under different soil amendments: biochar, organic fertilizer, and CK (without biochar or organic fertilizer) during 2022–2023 and 2023–2024 cropping seasons. Means with different small alphabetical letters show significant differences among the five inorganic N treatments according to the least significant difference test at the 95% level of confidence. Means with different capital alphabetical letters show significant differences among CK, biochar, and organic fertilizer treatments according to the least significant difference test at the 95% level of confidence.
Agronomy 15 01623 g001
Figure 2. The SPAD value at five nitrogen (N) fertilizer application rates under different soil amendments: biochar, organic fertilizer, and CK (without biochar or organic fertilizer) during the 2022–2023 (a) and 2023–2024 (b) cropping seasons. Means with different small alphabetical letters show significant differences among the five inorganic N treatments according to the least significant difference test at the 95% level of confidence. Means with different capital alphabetical letters show significant differences among CK, biochar, and organic fertilizer treatments according to the least significant difference test at the 95% level of confidence.
Agronomy 15 01623 g002
Figure 3. Principal component analysis (PCA) of yield-related parameters (a,b), and N use efficiency (c,d) related parameters at five nitrogen (N) fertilizer application rates under different soil amendments: biochar, organic fertilizer, and CK (without biochar or organic fertilizer) over two experimental years.
Agronomy 15 01623 g003
Figure 4. Z-score assessment representing the specific variable (fruit yield, nitrogen use efficiency, and environmental risk) score (ad) and average score (e) at five nitrogen (N) fertilizer application rates under different soil amendments: biochar, organic fertilizer, and CK (without biochar or organic fertilizer).
Agronomy 15 01623 g004aAgronomy 15 01623 g004b
Table 1. Life cycle inventories for cherry tomato production at five nitrogen (N) fertilizer application rates under different soil amendments: biochar, organic fertilizer, and CK (without biochar or organic fertilizer).
Items UnitCK Biochar Organic Fertilizer
Nkg/ha0/80/160/240/3200/80/160/240/3200/80/160/240/320
Phosphorus (P2O5)kg/ha120120120
Potassium (K2O)kg/ha180180180
Biochart/ha0200
Organic fertilizert/ha0020
Irrigationm3/ha800800800
Electricity kWh58.658.658.6
HDPE pipeline kg/ha16.7416.7416.74
Herbicidekg/ha2.252.252.25
Insecticidekg/ha0.30.30.3
DieselL/ha142142142
Machinerykg/ha161616
Transportationtkm/ha147/165/182/199/2172147/2165/2182/2199/22172147/2165/2182/2199/2217
Table 2. Analysis of variance (ANOVA) for yield-related parameters, N uptake, and use efficiency-related parameters.
ParametersYear
(Y)
Treatments (T)N Rates
(N)
Y × TY × NT × NY × T × N
Yield-related parameters
Fruit yield92.15 **48.58 **72.11 **5.09 **1.68 ns14.36 **1.05 ns
Fruit number20.27 **47.35 **31.89 **1.68 ns2.65 *3.79 **1.04 ns
Fruit weigh486.1 **9.59 **17.63 **1.3 ns3.32 **15.99 **3.58 **
Aboveground biomass1.37 ns20.7 **29.28 **1.82 ns1.31 ns1.37 ns0.47 ns
N uptake and use efficiency
N uptake for the whole plant0.45 ns30.57 **62.28 **1.09 ns0.84 ns7.11 **0.83 ns
N uptake for fruit 31.62 **12.64 **26.8 **0.17 ns0.64 ns10.58 **0.81 ns
N uptake for stem and leaf tissue11.8 **15.21 **30.6 **1.6 ns0.87 ns2.19*1.04 ns
SPAD119.0 **17.9 **77.35 **2.21 ns3.9 **25.39 **2.61 *
PFP69.8 **37.48 **931.7 **5.23**5.88 **0.63 ns1.19 ns
NAE126.9 **3.55 *18.62 **2.16 ns1.55 ns2.85 *0.79 ns
NRE29.38 **3.96 *21.04 **1.61 ns0.52 ns1.03 ns1.72 ns
NPE94.5 **0.72 ns2.2 ns0.48 ns1.08 ns0.98 ns1.88 ns
NHI27.2 **0.24 ns1.02 ns1.35 ns0.79 ns4.4 **1.03 ns
All values presented are F-values from the ANOVA. * Significant difference at p < 0.05; ** significant difference at p < 0.01; “ns” non-significant difference; PFP: partial factor productivity of applied nitrogen; NAE: nitrogen agronomic efficiency; NRE: nitrogen recovery efficiency; NPE: nitrogen physiological efficiency; and NHI: nitrogen harvest index.
Table 3. The fruit yield, fruit number, fruit weight, and aboveground biomass at five nitrogen (N) fertilizer application rates under different soil amendments: biochar, organic fertilizer, and CK (without biochar or organic fertilizer) during 2022–2023 and 2023–2024 cropping seasons.
TreatmentsN Rates
(kg N ha−1)
Fruit Yield
(t ha−1)
Fruit Number
(no. m−2)
Fruit Weight (g)Aboveground
Biomass (t ha−1)
2022–2023
CK015.1 c 108 c 14.0 bc 3.97 b
8017.1 b 119 bc 14.4 abc 5.02 a
16017.8 ab 117 bc 15.2 a 5.35 a
24019.0 a 127 ab 14.9 ab 5.05 a
32018.7 ab 139 a 13.5 c 5.04 a
Mean17.5 B122 B14.4 A4.89 B
Biochar014.7 b 112 a 13.1a 3.39 b
8016.4 ab 118 a 13.9a 5.49 a
16018.3 a 132 a 14.0a 5.21 a
24018.4 a131 a 14.1a 5.25 a
32017.4 a 127 a 13.8a 5.65 a
Mean17.1 B124 B13.8 A5.00 AB
Organic 016.9 b 118 c 14.4 a 4.84 c
fertilizer8019.3 a 156 a 12.3 b 5.05 bc
16020.1 a 138 b 14.6 a 6.07 a
24020.1 a 146 ab 13.8 a 5.74 ab
32021.0 a 150 a 14.0 a 5.93 a
Mean19.5 A142 A13.8 A5.52 A
2023–2024
CK013.2 c 91 c 14.5 c 3.62 b
8017.7 b 97 bc 18.3 b 4.59 ab
16019.0 b 107 b 17.7 b 4.98 a
24022.0 a 123 a 17.8 b 5.25 a
32023.9 a 121 a 19.7 a 5.21 a
Mean19.2 B108 B17.6 A4.73 B
Biochar014.0 d 98 d 14.3 c 3.12 c
8018.4 c111 c 16.6 b 4.64 b
16021.1 b 124 b 17.0 ab 4.57 b
24023.6 a 136 a 17.4 ab 5.37 a
32022.2 ab 123 b 18.0 a 5.33 a
Mean19.9 B118 B16.7 A4.61 B
Organic 016.3 c 101 b 16.2 a 4.29 b
fertilizer8022.6 b 127 a 17.8 a 5.46 ab
16026.4 a 148 a 17.9 a 5.94 a
24025.7 ab 147 a 17.5 a 6.11 a
32025.7 ab 150 a 17.2 a 6.55 a
Mean23.3 A135 A17.3 A5.67 A
Within a column for CK, biochar, and organic fertilizer treatments, means followed by different small alphabetical letters show significant differences among the five inorganic N treatments according to the least significant difference test at the 95% level of confidence. Similarly, means followed by different capital alphabetical letters show significant differences among CK, biochar, and organic fertilizer treatments.
Table 4. The partial factor productivity of applied nitrogen (PFP), nitrogen agronomic efficiency (NAE), nitrogen recovery efficiency (NRE), nitrogen physiological efficiency (NPE), and nitrogen harvest index (NHI) at five nitrogen (N) fertilizer application rates under different soil amendments: biochar, organic fertilizer, and CK (without biochar or organic fertilizer) during 2022–2023 and 2023–2024 cropping seasons.
TreatmentsN Rates
(kg N ha−1)
PFP
(kg kg−1)
NAE
(kg kg−1)
NRE
(%)
NPE
(kg kg−1)
NHI
(%)
2022–2023
CK0////25.7 a
80214 a 25.9 a 24.1 a 111 a28.2 a
160111 b 16.9 b 16.8 ab 114 a19.6 a
24079 c 16.5 b 10.7 b 167 a20.1 a
32058 d 11.4 b 9.0 b 131 a23.6 a
Mean116 A17.7 A15.1 A131 A23.4 A
Biochar0////28.4 a
80205 a 21.5 a 33.8 a 62.6 a19.9 b
160115 b 22.8 a18.1 b 178 a25.3 ab
24077 c 15.5 a 11.4 b 164 a19.4 b
32054 c 8.6 a 12.2 b 72.3 a19.2 b
Mean113 A17.1 A18.9 A119 A22.4 A
Organic 0////26.4 a
fertilizer80241 a 29.4 a 22.1 a 139 a23.5 a
160126 b 20.0 ab 26.7 a 75.6 a24.8 a
24084 c 13.2 b 10.6 b 152 a26.2 a
32066 d 12.9 b 11.0 b 131 a26.9 a
Mean129 A18.9 A17.6 A124 A25.6 A
2023–2024
CK0////18.4 b
80221 a 56.1 a 26.5 a 211 a29.7 a
160119 b 36.5 b 27.3 a 133 a30.7 a
24092 c 36.6 b 18.4 ab 227 a33.2 a
32075 d 33.6 b 14.6 b 242 a37.4 a
Mean127 A40.7 A21.7 B203 A29.9 A
Biochar0////24.5 a
80230 a 54.6 a 28.8 a 193 a34.3 a
160132 b 43.9 ab 24.8 a 178 ab35.7 a
24099 c 40.0 b 24.9 a 164 ab34.3 a
32069 d 25.5 c 18.9 a 135 b31.8 a
Mean132 A41.0 A24.3 AB167 A32.1 A
Organic 0////25.5 b
fertilizer80282 a 79.0 a 39.7 a 199 ab31.8 ab
160165 b 63.7 ab 29.3 ab223 a35.5 a
240107 c 39.3 b 25.0 ab 163 ab28.3 ab
32080 c 29.5 c 22.2 b 135 b29.0 ab
Mean159 A52.9 A29.1 A135 A30.0 A
Within a column for CK, biochar, and organic fertilizer, means followed by the different small alphabetical letters show significant differences among the five inorganic N treatments according to the least significant difference test at the 95% level of confidence. Similarly, means followed by different capital alphabetical letters show significant differences among CK, biochar, and organic fertilizer treatments.
Table 5. The seven environmental impact categories per hectare (area-scaled functional unit) in terms of ecotoxicity (kg 1,4-DCB/ha), global warming (kg CO2 eq/ha), fossil resource scarcity (kg oil eq/ha), human toxicity (kg 1,4-DCB/ha), water consumption (m3/ha), terrestrial acidification (kg SO2 eq/ha), and mineral resource scarcity (kg Cu eq/ha) at five nitrogen (N) fertilizer application rates under different soil amendments: biochar, organic fertilizer, and CK (without biochar and organic fertilizer).
TreatmentsN Rates
(kg N ha−1)
EcotoxicityGlobal WarmingFossil Resource ScarcityHuman ToxicityWater ConsumptionTerrestrial AcidificationMineral Resource Scarcity
CK01.58 × 1054.32 × 1031.27 × 1039.16 × 1028.30 × 1021.65 × 1014.18 × 101
802.31 × 1055.56 × 1031.40 × 1039.72 × 1028.45 × 1026.38 × 1014.29 × 101
1603.04 × 1056.79 × 1031.53 × 1031.03 × 1038.60 × 1021.11 × 1024.40 × 101
2403.76 × 1058.03 × 1031.66 × 1031.08 × 1038.75 × 1021.58 × 1024.51 × 101
3204.49 × 1059.27 × 1031.79 × 1031.14 × 1038.90 × 1022.06 × 1024.62 × 101
Mean3.04 × 1056.79 × 1031.53 × 1031.03 × 1038.60 × 1021.11 × 1024.40 × 101
Biochar02.02 × 1051.15 × 1042.63 × 1031.44 × 1038.50 × 1025.10 × 1015.27 × 101
802.75 × 1051.27 × 1042.76 × 1031.49 × 1038.65 × 1029.82 × 1015.39 × 101
1603.47 × 1051.40 × 1042.89 × 1031.55 × 1038.80 × 1021.45 × 1025.50 × 101
2404.20 × 1051.52 × 1043.03 × 1031.60 × 1038.95 × 1021.93 × 1025.61 × 101
3204.93 × 1051.64 × 1043.16 × 1031.66 × 1039.10 × 1022.40 × 1025.72 × 101
Mean3.47 × 1051.40 × 1042.89 × 1031.55 × 1038.80 × 1021.45 × 1025.50 × 101
Organic 03.54 × 1051.75 × 1044.67 × 1033.01 × 1038.71 × 1026.99 × 1016.86 × 101
fertilizer804.27 × 1051.88 × 1044.80 × 1033.06 × 1038.86 × 1021.17 × 1026.97 × 101
1604.99 × 1052.00 × 1044.93 × 1033.12 × 1039.01 × 1021.64 × 1027.08 × 101
2405.72 × 1052.12 × 1045.06 × 1033.17 × 1039.16 × 1022.12 × 1027.20 × 101
3206.45 × 1052.25 × 1045.19 × 1033.23 × 1039.31 × 1022.59 × 1027.31 × 101
Mean4.99 × 1052.00 × 1044.93 × 1033.12 × 1039.01 × 1021.64 × 1027.08 × 101
Table 6. The seven environmental impact categories per kg of fruit yield produced (yield-scaled functional unit) in terms of ecotoxicity (kg 1,4-DCB/ha), global warming (kg CO2 eq/ha), fossil resource scarcity (kg oil eq/ha), human toxicity (kg 1,4-DCB/ha), water consumption (m3/ha), terrestrial acidification (kg SO2 eq/ha), and mineral resource scarcity (kg Cu eq/ha) at five nitrogen (N) fertilizer application rates under different soil amendments: biochar, organic fertilizer, and CK (without biochar or organic fertilizer).
TreatmentsN Rates
(kg N ha−1)
EcotoxicityGlobal WarmingFossil Resource ScarcityHuman ToxicityWater ConsumptionTerrestrial AcidificationMineral Resource Scarcity
CK01.12 × 1013.05 × 10−17.21 × 10−18.98 × 10−26.47 × 10−25.87 × 10−21.17 × 10⁻³
801.33 × 1013.20 × 10−15.86 × 10−18.05 × 10−25.59 × 10−24.86 × 10−23.67 × 10⁻³
1601.65 × 1013.69 × 10−15.54 × 10−18.32 × 10−25.60 × 10−24.67 × 10−26.03 × 10⁻³
2401.97 × 1014.22 × 10−15.35 × 10−18.71 × 10−25.67 × 10−24.59 × 10−28.29 × 10⁻³
3202.11 × 1014.35 × 10−14.79 × 10−18.40 × 10−25.35 × 10−24.18 × 10−29.67 × 10⁻³
Mean1.64 × 1013.70 × 10−15.75 × 10−18.49 × 10−25.74 × 10−24.83 × 10−25.77 × 10⁻³
Biochar01.41 × 1018.01 × 10−17.25 × 10−11.83 × 10−11.00 × 10−15.92 × 10−23.55 × 10⁻³
801.58 × 1017.30 × 10−15.98 × 10−11.59 × 10−18.56 × 10−24.97 × 10−25.64 × 10⁻³
1601.76 × 1017.11 × 10−15.28 × 10−11.47 × 10−17.87 × 10−24.47 × 10−27.36 × 10⁻³
2402.00 × 1017.24 × 10−14.95 × 10−11.44 × 10−17.62 × 10−24.26 × 10−29.19 × 10⁻³
3202.49 × 1018.28 × 10−15.25 × 10−11.60 × 10−18.38 × 10−24.60 × 10−21.21 × 10⁻²
Mean1.85 × 1017.59 × 10−15.74 × 10−11.58 × 10−18.49 × 10−24.84 × 10−27.57 × 10⁻³
Organic 02.13 × 1011.05× 1006.51 × 10−12.81 × 10−11.81 × 10−15.25 × 10−24.21 × 10−3
fertilizer802.04 × 1018.97 × 10−15.16 × 10−12.29 × 10−11.46 × 10−14.23 × 10−25.58 × 10⁻³
1602.15 × 1018.60 × 10−14.65 × 10−12.12 × 10−11.34 × 10−13.88 × 10−27.05 × 10⁻³
2402.50 × 1019.26 × 10−14.72 × 10−12.21 × 10−11.38 × 10−14.00 × 10−29.26 × 10⁻³
3202.76 × 1019.64 × 10−14.63 × 10−12.22 × 10−11.38 × 10−13.99 × 10−21.11 × 10⁻²
Mean2.32 × 1019.40 × 10−15.13 × 10−12.33 × 10−11.48 × 10−14.27 × 10−27.44 × 10⁻³
Disclaimer/Publisher’s Note: The statements, opinions and data contained in all publications are solely those of the individual author(s) and contributor(s) and not of MDPI and/or the editor(s). MDPI and/or the editor(s) disclaim responsibility for any injury to people or property resulting from any ideas, methods, instructions or products referred to in the content.

