Article

Anaerobic Co-Digestion of Dairy Manure and Cucumber Residues: Methane Production Efficiency and Microbial Community Characteristics

State Key Laboratory of Nutrient Use and Management/Key Laboratory of Agri-Environment of Huang-Huai-Hai Plain, Ministry of Agriculture and Rural Affairs, Institute of Agricultural Resources and Environment, Shandong Academy of Agricultural Sciences, Jinan 250100, China
*
Author to whom correspondence should be addressed.
Agronomy 2025, 15(7), 1610; https://doi.org/10.3390/agronomy15071610
Submission received: 23 May 2025 / Revised: 24 June 2025 / Accepted: 25 June 2025 / Published: 1 July 2025
(This article belongs to the Section Agricultural Biosystem and Biological Engineering)

Abstract

Anaerobic digestion for biogas production represents a crucial approach to achieving the high-value utilization of agricultural solid waste. The adoption of multi-material co-digestion offers a viable solution to overcome the inherent constraints associated with single-substrate digestion, thereby significantly enhancing the efficiency of resource utilization. This study explored a co-digestion system using dairy manure and cucumber vines as substrates, uncovering how total solids (TS) influence the methane yield and microbial community characteristics. All treatments exhibited swift methane fermentation, with daily production initially increasing before declining. Cumulative methane production increased with the increasing TS contents. These results may be linked to pH value and the concentration of volatile fatty acids (VFAs). Except for the 6% TS treatment, digesters across different TS levels maintained a favorable final pH of 7.4–8.4, while VFA concentrations exhibited a downward trend as TS contents increased. The treatment with the highest TS concentration (25%) demonstrated superior performance, achieving the maximum volumetric methane yield. This yield was 1.6 to 9.1 times higher than those obtained at low (6–10%) and medium (12–18%) TS concentrations. Microbial community analysis revealed that during the peak methane production phase, Firmicutes and Methanoculleus were the predominant bacterial and archaeal phyla, respectively. The microbial community structure changed with different TS levels. This study offers valuable scientific insights for enhancing biogas production efficiency in co-digestion systems.

1. Introduction

The rapid development of intensive livestock farming and high-density crop cultivation has led to a substantial increase in organic waste generation, including livestock manure and vegetable residues [1,2]. Anaerobic digestion (AD) has emerged as a critical pathway for synergistic methane recovery and carbon emission reduction [3,4]. The total solids (TS) content, a core parameter in AD system design and operation, directly governs methanogenic performance by regulating substrate mass transfer efficiency and microbial activity [5,6]. The optimization of TS content must align with feedstock characteristics. For instance, swine manure with a low TS content (~5%) typically undergoes wet digestion, while high-solids materials (e.g., straw, sludge) are better suited for dry digestion systems, which enhance organic loading rates while minimizing water consumption for dilution [7]. Notably, although low-TS systems (<10%) offer superior mass transfer homogeneity, recent studies demonstrate that digestion at medium-to-high TS concentrations (10–20%) significantly improves methane yield by accelerating hydrolysis rates [8,9]. Nevertheless, current engineering practices predominantly rely on empirical TS thresholds, lacking dynamic regulation strategies tailored to feedstock compositional variations, thereby compromising system resilience against operational shocks.
In biogas engineering, single-raw-material digestion has been extensively adopted due to advantages such as centralized raw material management and standardized technological processes [10,11]. However, its technical limitations have become increasingly prominent in complex production scenarios. The metabolic diversity of microbial communities is restricted by the constant C/N ratio of a single raw material, increasing the risk of acidification due to volatile fatty acid (VFA) accumulation, especially under high TS conditions [12,13,14,15]. Thus, the TS content of AD systems using cucumber vines as single substrates was generally below 10%, and the cumulative methane yield was only 142.0  mL/g VS [16]. The methane production efficiency in dairy manure AD systems was also limited due to the low C/N ratio [17]. In contrast, the co-digestion of multiple materials has demonstrated remarkable potential in regulating the C/N ratio of materials and enhancing the buffering performance of the system [2,15]. For example, Zhang et al. (2017) found that when corn straw and vegetable waste were combined at a TS ratio of 14:1, the rigid fiber structure of the straw created a three-dimensional mass transfer network, increasing the hydrolysis rate by 18.6% [18]. Meanwhile, the soluble sugars in vegetable waste served as an immediate carbon source for fermentative bacteria, which rapidly converted them into methanogenic substrates (such as H2, CO2, and acetate) for archaea. Finally, a methane yield of 323.4 mL/g VS was achieved, which was 23.7% higher than that of the single-raw-material system. Tian et al. investigated the optimal conditions for biogas production in an anaerobic co-digestion system of rice straw and pig manure [19]. They found that when the TS content was 12% and the mixing ratio of pig manure to rice straw was 1:5, the methane yield was the highest. The maximum methane yield was 553.79 mL/g VS, suggesting that co-digestion significantly improves the bioconversion efficiency of livestock manure and crop straw [19].
This study innovatively addresses a critical gap in agricultural waste valorization by establishing a high-efficiency co-digestion system for dairy manure and cucumber vines—two underutilized yet abundant facility agriculture wastes. Previous research explored the co-digestion of tomato vines and dairy manure but achieved suboptimal biogas production efficiency, with a maximum cumulative methane yield of only 117.4 mL/g VS [20]. Therefore, it is crucial to identify two suitable co-substrates for AD to achieve efficient methane production. Central to our approach is the hypothesis that the dairy manure–cucumber vine mixture optimizes the C/N ratio and modulates microbial communities, thereby maintaining robust system buffering capacity across a broad TS range (6–25%). To validate this mechanistic framework, a comprehensive TS gradient experiment was implemented to evaluate impacts on methane production efficiency. Critical metabolic parameters, including VFA levels, ammonia nitrogen concentrations, and pH values, were analyzed to elucidate system performance. Meanwhile, combined with microbiological indicators, the effects of the TS content on the microbial community characteristics in the anaerobic co-digestion system were studied. The optimal TS content was determined to enhance biogas productivity, providing actionable technical guidance for agricultural parks and cucumber-intensive regions to improve waste management. This research establishes a scientifically robust and operationally feasible paradigm for high-value utilization of facility agricultural wastes, contributing to sustainable agro-industrial development.

2. Materials and Methods

2.1. Raw Materials and Inoculum

Fresh dairy manure was sourced from the dairy barn of Yinxiang Weiye Group (Heze, China), while cucumber vines were collected from the Jinan Modern Agricultural Demonstration Park (Jinan, China). The sludge was obtained from the Complete Stirred Tank Reactor (CSTR) systems of the Hengyuan agricultural biogas project (using vegetable residues and swine manure as feedstock) in Changqing District (Jinan, China). All materials were stored at 4 °C in a refrigerator until further processing, with the pre-treatment details outlined in Text S1.
The chemical properties of the raw materials and inoculants are presented in Table S1.

2.2. Experimental Design

In this study, the raw materials for fermentation were dairy manure and cucumber vines, and their wet base mass ratio was 1:1. The volatile solids (VS) ratio of raw material to inoculum is 1:1. The mass of each material added during processing is shown in Table S2. Nine experimental groups were established based on varying initial TS contents, i.e., 6%, 8%, 10%, 12%, 15%, 18%, 20%, 22%, and 25% (Table 1). Additionally, a control group (CK) was established using inoculum as the sole substrate, and the tests were conducted in triplicates. Deionized water and inoculum were homogenized with the feedstock using a hand blender (Braun-MQ705, Braun GmbH, Bayreuth, Germany), followed by 1 min nitrogen gas purging of the fermentation bottles (1.0 L) to establish strict anaerobic conditions. The anaerobic fermentation bottles were incubated in a programmable incubator (DHZ-D, Jiangsu Huamei Co., Xuzhou, China) for 50 days, with the temperature maintained at 35 ± 1 °C. Biogas production was collected using 5 L gas collection bags (Dalian Plait Co., Dalian, China) connected to the reactors through glass tubing. Daily measurements of biogas volume were conducted at fixed time intervals, while biogas composition was analyzed every 2–4 days.

2.3. Measurement Indicators and Methods

Gas measurement methods: The volume of biogas generated and collected in the gas bags was measured using a biogas flow meter (Ritter, Bochum, Germany). Gas composition analysis (CO2, CH4, N2, and O2) was conducted using a gas chromatograph with a thermal conductivity detector (TCD detector) (Beijing Spectrum Analysis Company, Beijing, China). Detailed information regarding the gas chromatograph is given in Text S2. The methodologies for calculating daily methane production and cumulative methane yield have been detailed in our previous study [20].
Liquid-phase analysis: pH values were measured using a digital pH meter with a 1:10 solid–liquid ratio (w/v). Total ammonia nitrogen (TAN) concentrations, encompassing both NH3 and NH4+-N species, were analyzed through optimized distillation–titration procedures [21]. For volatile fatty acids (VFAs), measurements were conducted on a ZDJ-5B alkalinity titrator (Leici, Shanghai) following the established protocol by Wang et al. [22]. The same instrument was employed for determining alkalinity (ALK) levels.
Solid parameter determination: Total solids (TS) and volatile solids (VS) contents were measured using the dry weight method. For elemental analysis, a carbon–nitrogen analyzer (Element Analysis system, Hanau, Germany) was utilized to determine the carbon and nitrogen concentrations.

2.4. Statistical Analysis

Statistical processing was conducted using SAS software (version 9.2; SAS Institute Inc., Cary, NC, USA). All treatments were carried out in triplicate, and the data are presented as the mean value ± standard error. Statistically significant differences between mean values were determined using one-way analysis of variance (ANOVA) with LSD. A p-value < 0.05 indicates a statistically significant difference (within 95% confidence intervals). Data processing and visualization were performed using the Origin 2018 program. Detailed information on the statistical analysis of microbial community data is provided in Text S3.

2.5. Microbial Community Analysis

The total genomic DNA was extracted from the biological replicate samples (n = 3) at the initial and peak phases of the anaerobic co-digestion system of dairy manure and cucumber vines via the cetyltrimethyl ammonium bromide (CTAB) method [23]. Genomic DNA from these replicate samples was used for library preparation and sequencing. DNA integrity was verified by 1% agarose gel electrophoresis, while purity was assessed using a Nanodrop 2000 spectrophotometer (Thermo Scientific, Waltham, MA, USA); A260/A280 ratios of 1.8–2.0 were deemed acceptable. Quantification of qualified DNA was subsequently performed with a Qubit 4.0 fluorometer (Invitrogen, Carlsbad, CA, USA).
Qualified DNA samples were selected for PCR amplification using 338F/806R for the bacterial V3-V4 region and 344F/806R for the archaea 16S rRNA gene. Amplified products were purified with AMPure XP beads (Beckman Coulter, Brea, CA, USA), followed by library construction and paired-end sequencing on the Ion S5™ XL platform (Novogene, Beijing, China). Raw sequencing data underwent quality control through Cutadapt (v3.4) for adapter trimming and low-quality sequence removal. Processed reads were denoised, merged, and filtered for chimeras using the QIIME 2 pipeline (v2021.11). Operational Taxonomic Units (OTUs) were clustered at a 97% sequence similarity threshold with VSEARCH (v2.15.1). Taxonomic annotation was performed against the SILVA 138 (for bacteria) and Greengenes 13_8 (for archaea) reference databases. Finally, community composition and relative abundance data at the phyla, class, order, family and genus levels were obtained.

3. Results

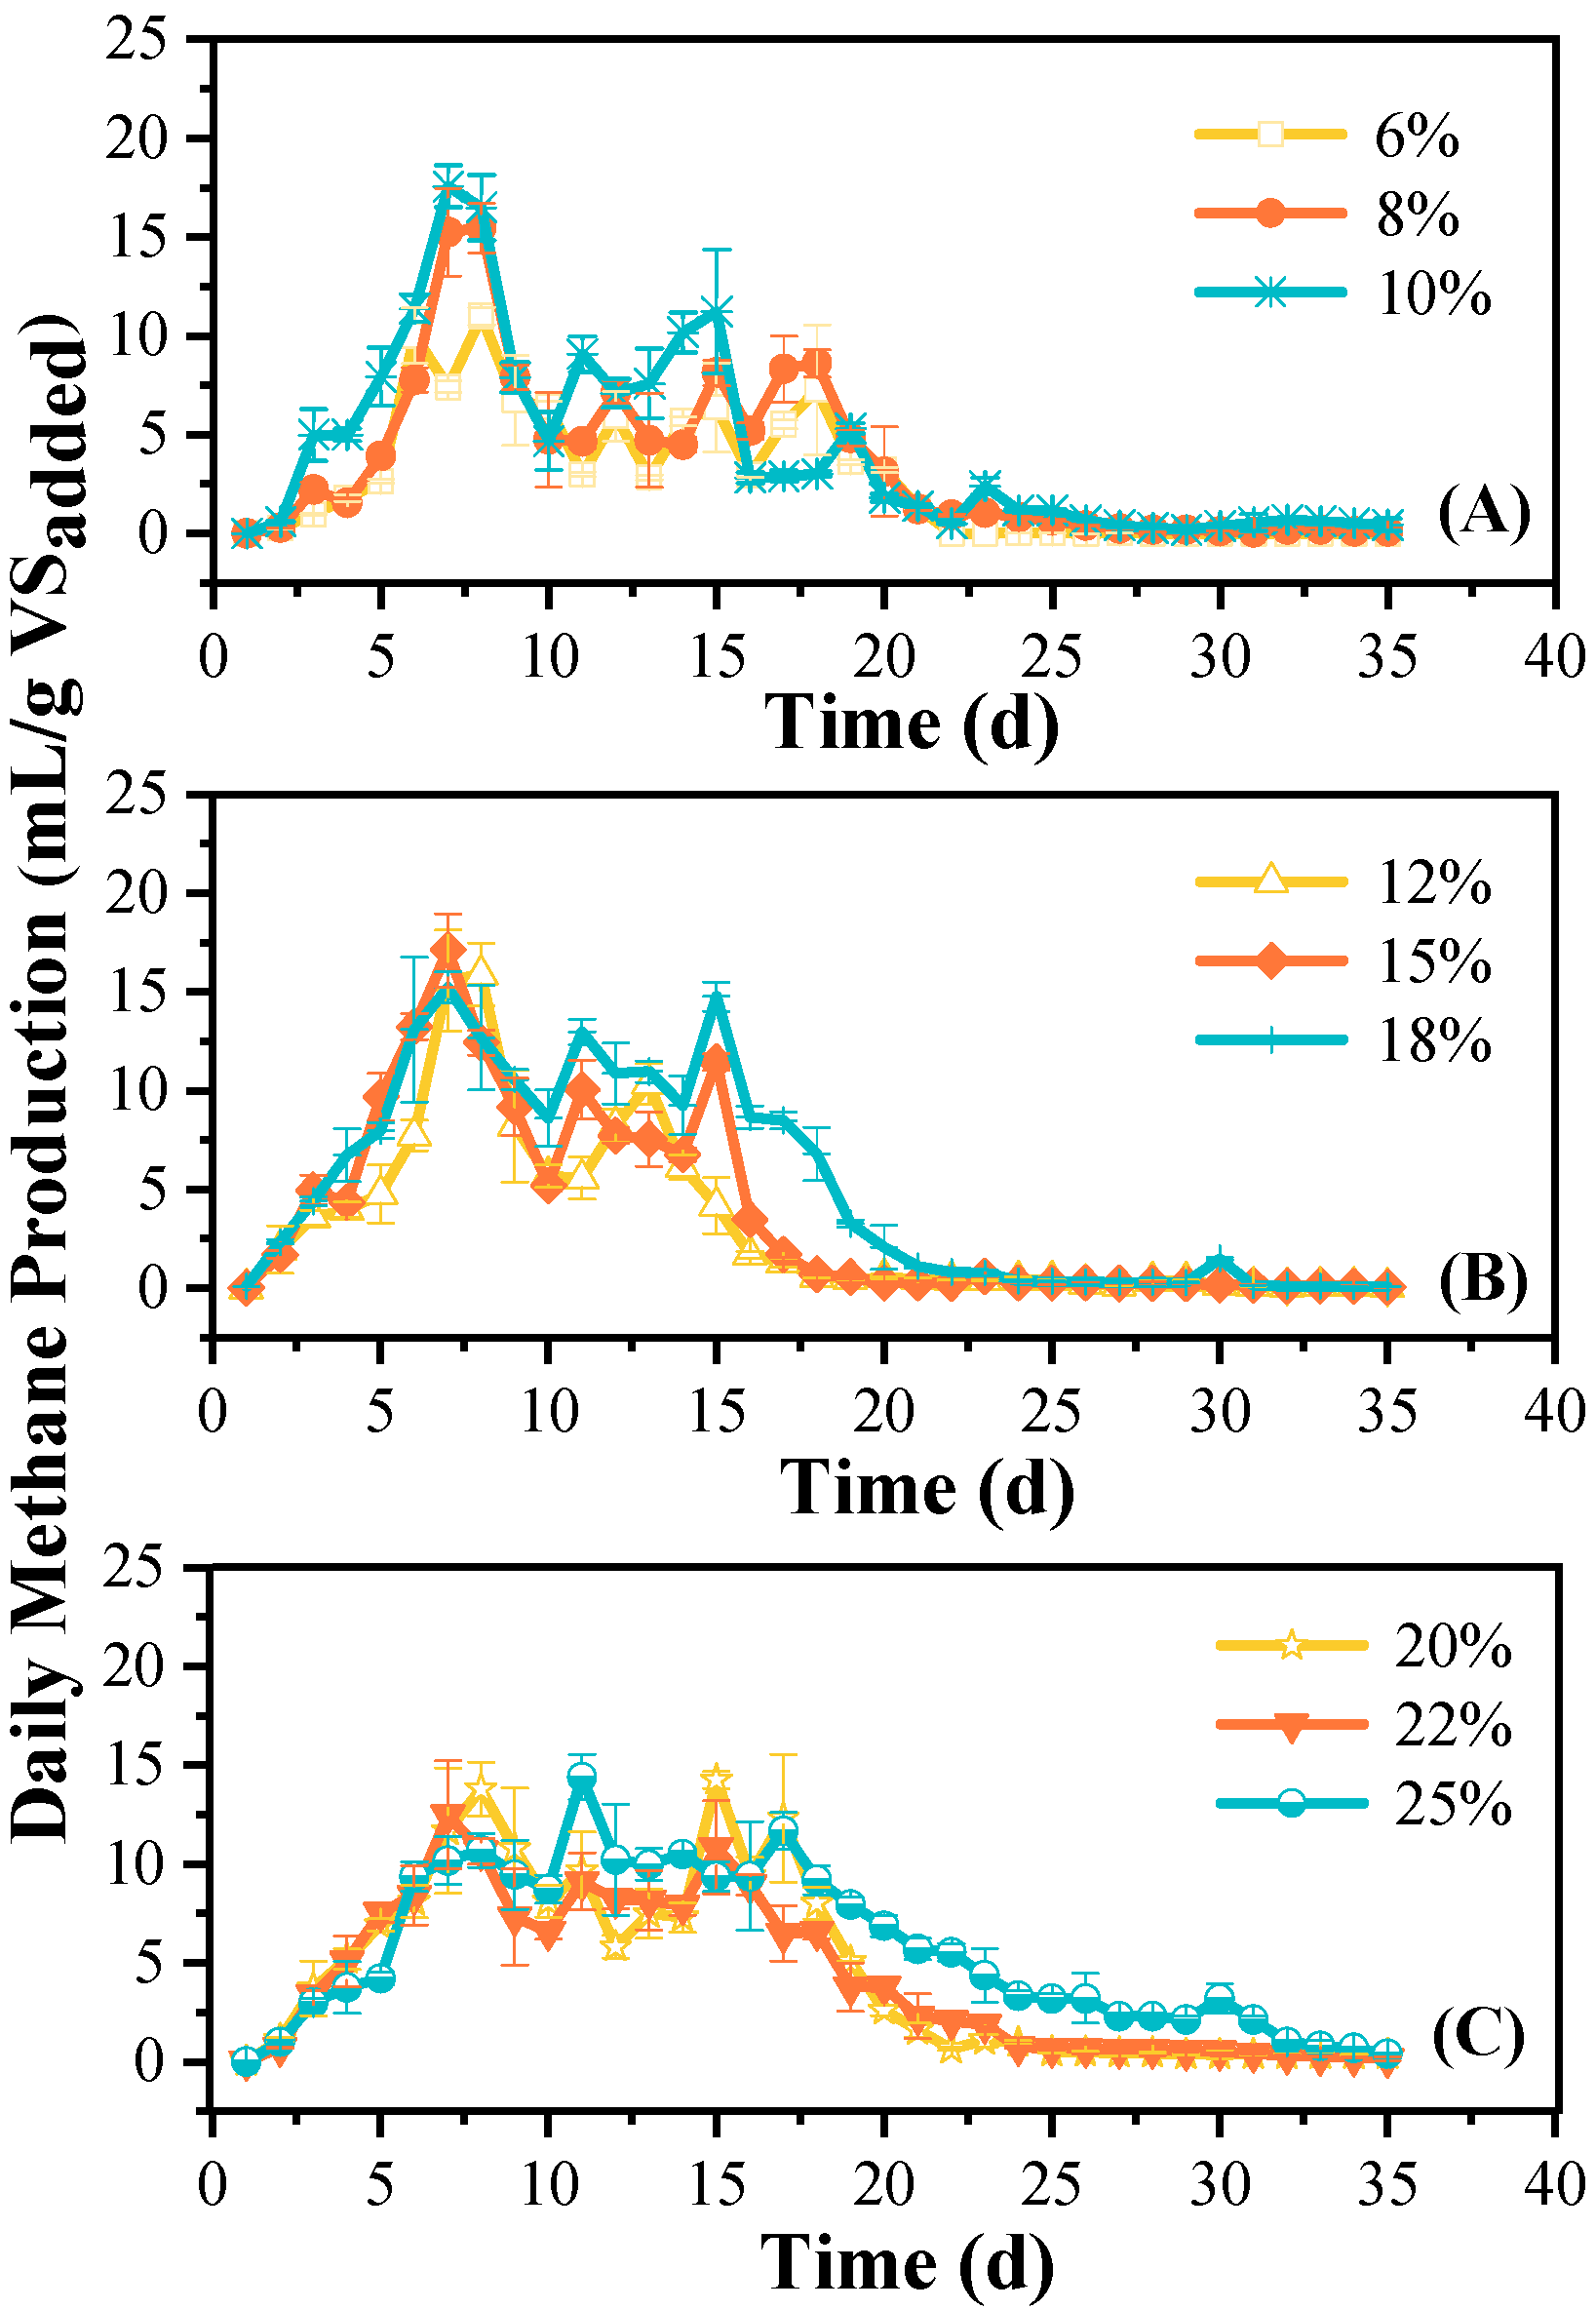
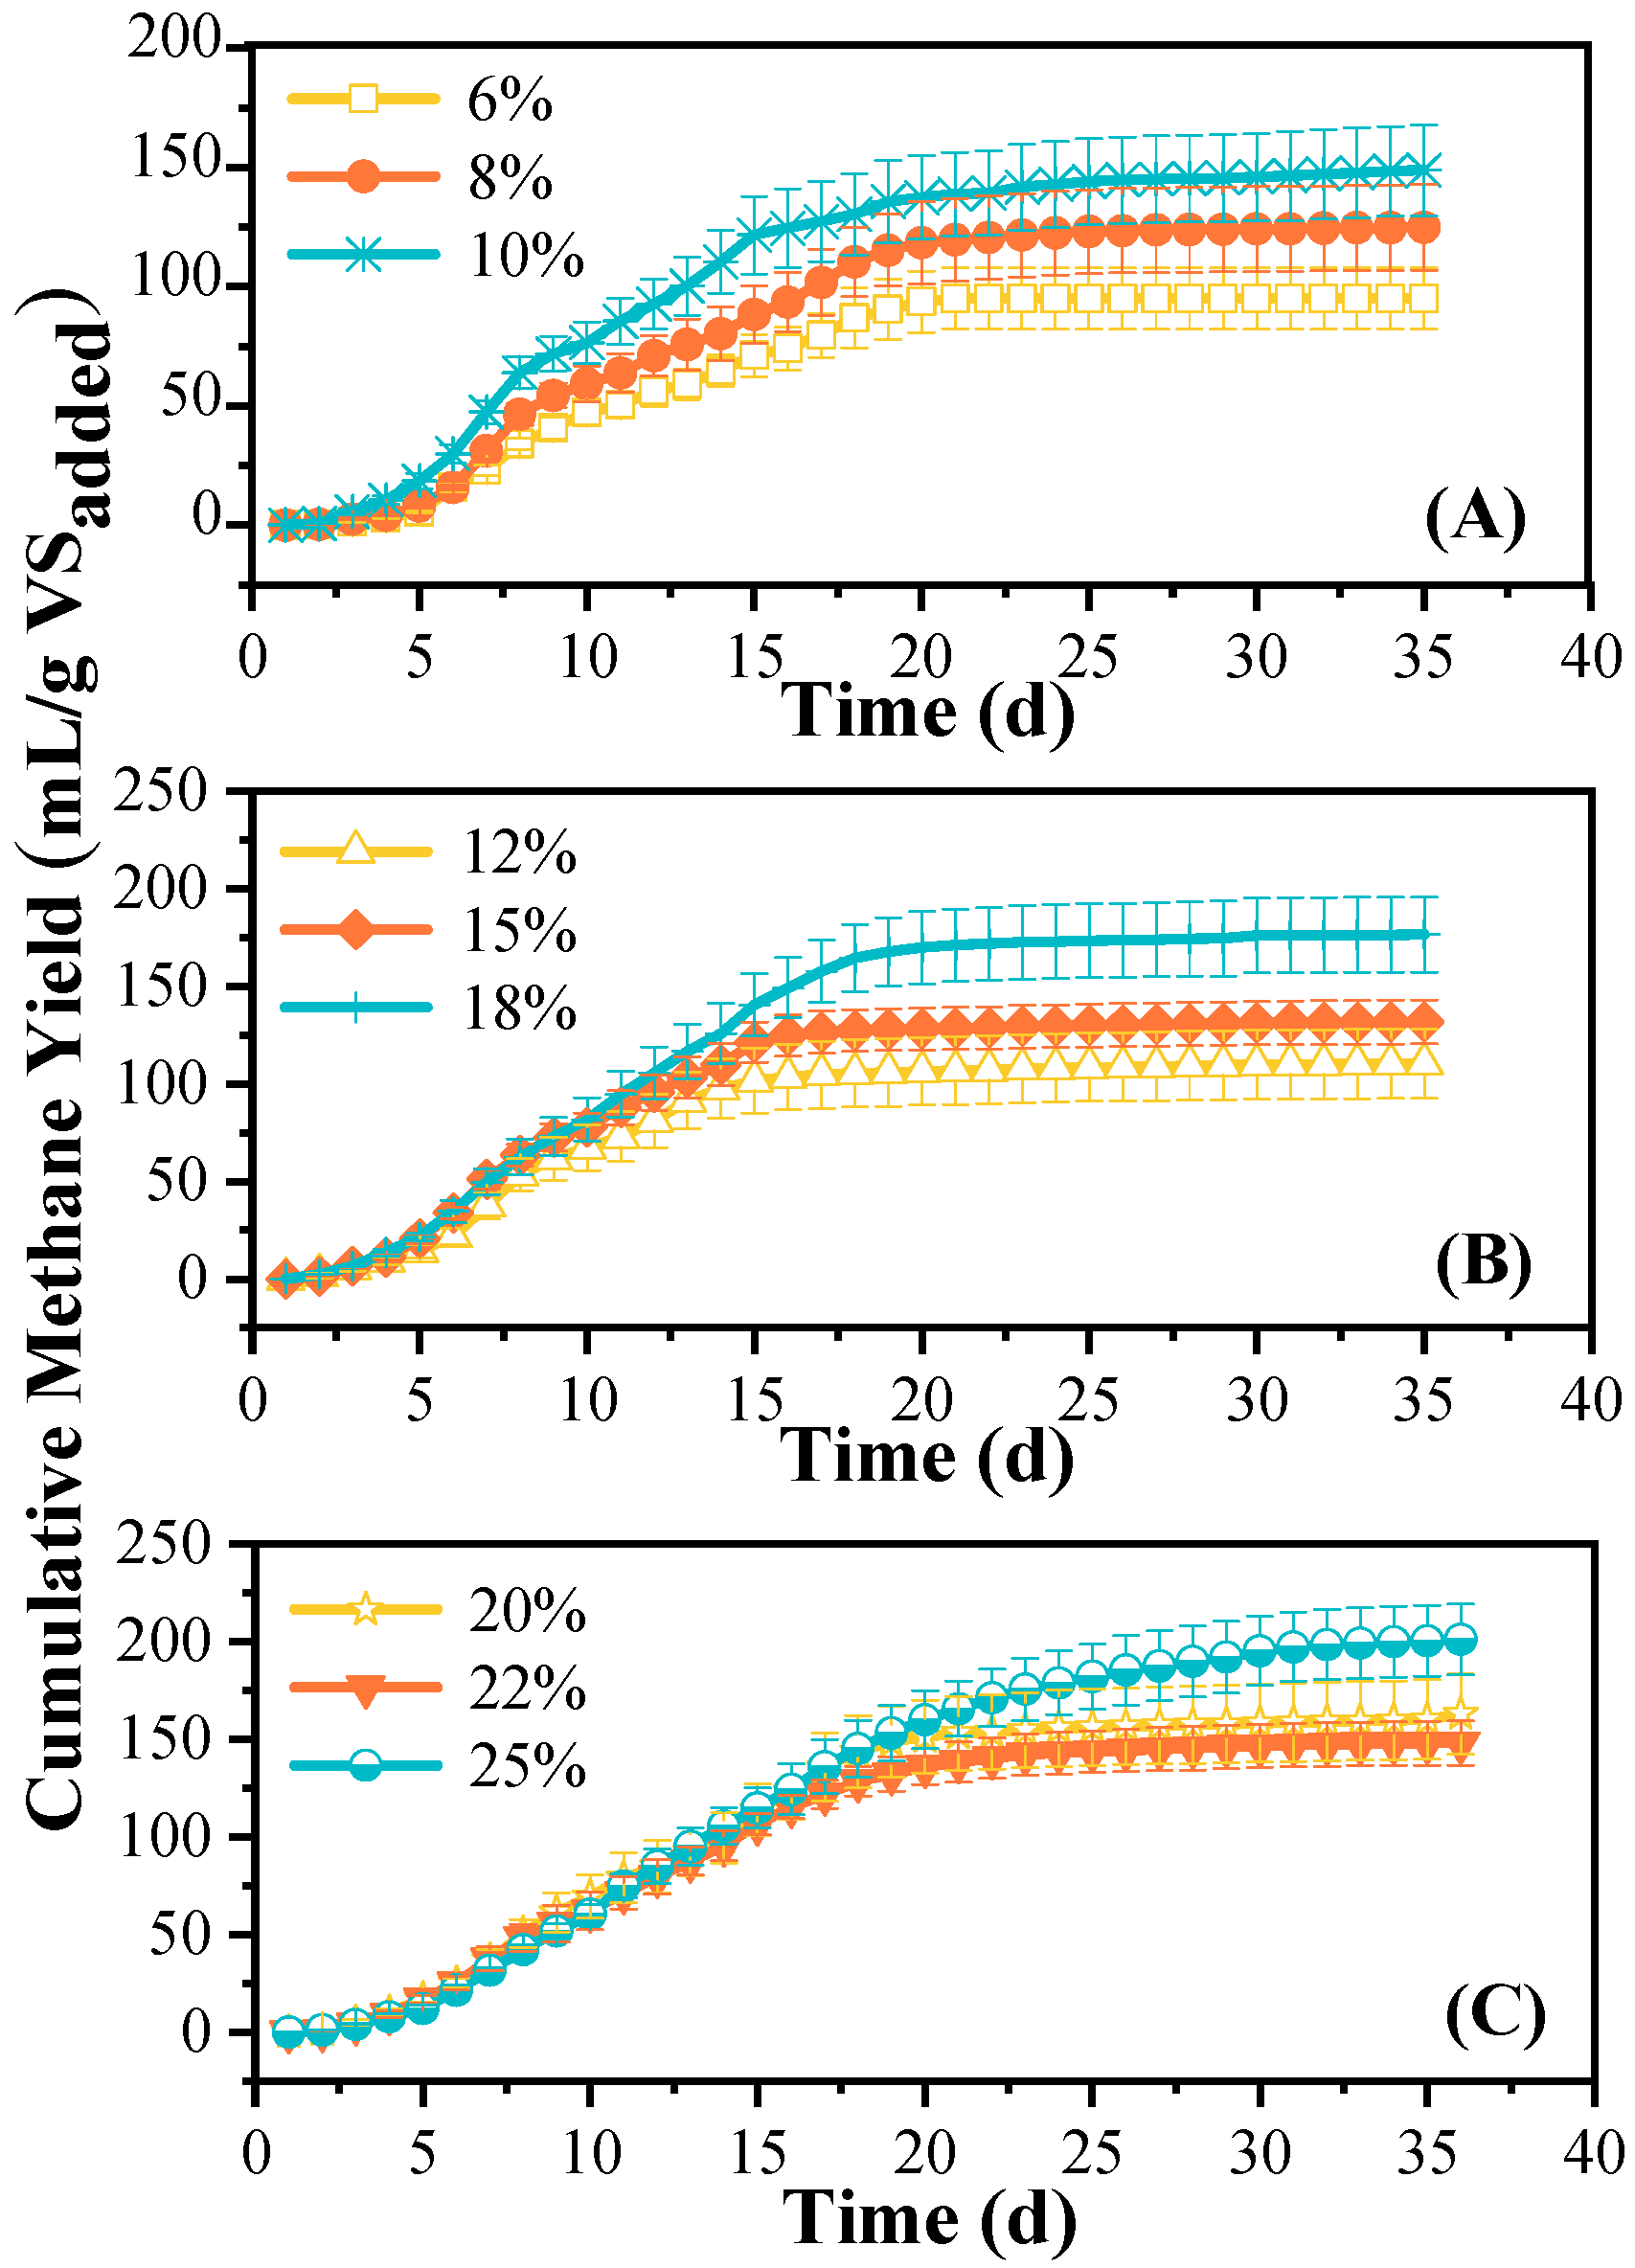
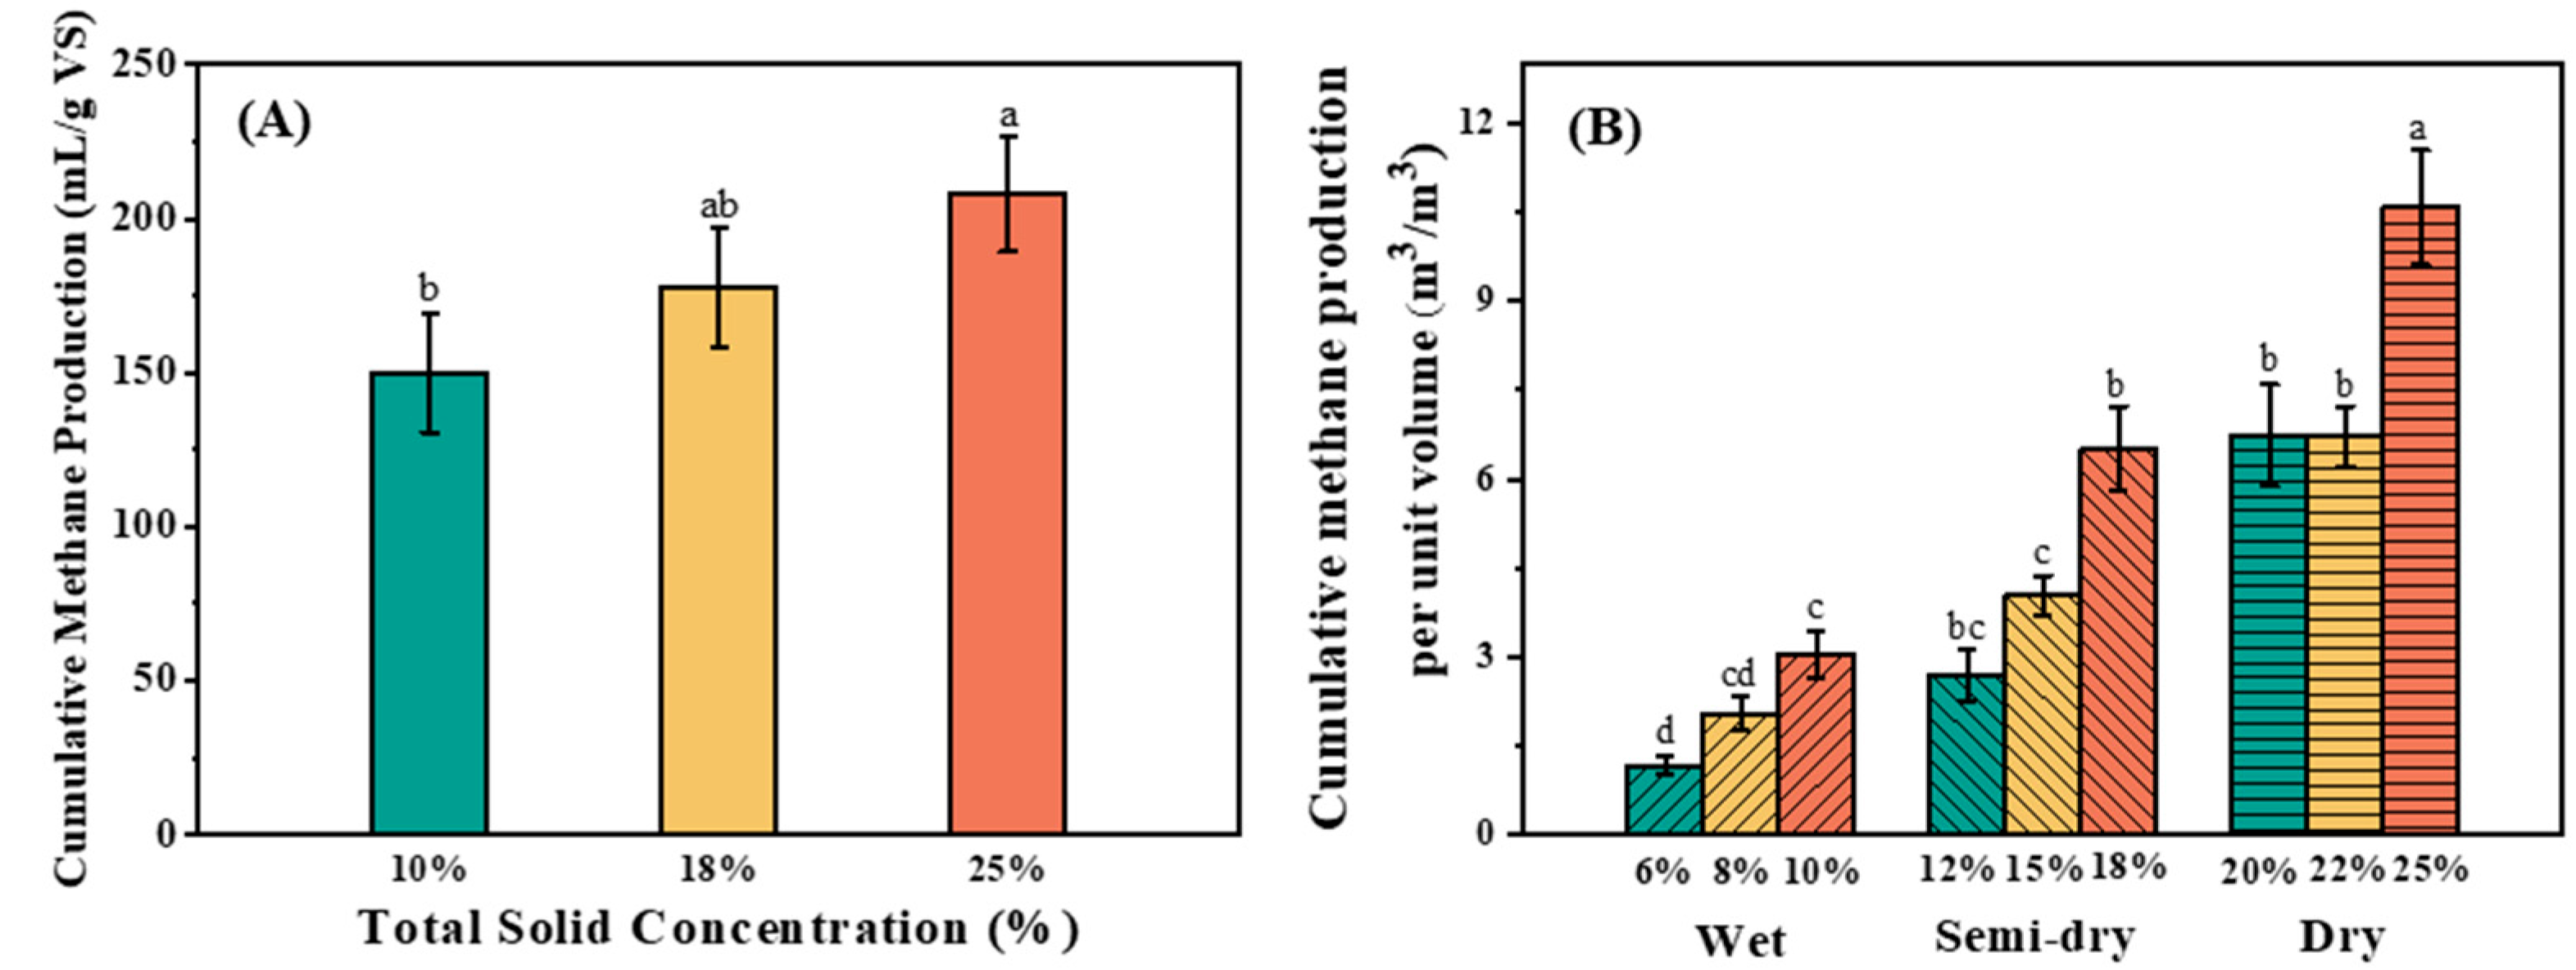
3.1. Methane Production

The daily methane production from anaerobic co-digestion under varying TS concentrations is illustrated in Figure 1. Methane production is initiated from the onset in all AD treatments, exhibiting a rapid upward trend in daily methane yield during the 0~8 days period. During days 6~18, the daily methane production across different treatments exhibited fluctuations. In this study, the TS content primarily influenced the peak time of daily methane production. As demonstrated in Figure 1A, daily methane yields rapidly reached the peak on days 7–8, with the maximum value ranging from 10.99 ± 0.44 to 17.55 ± 1.95 mL/g VS. However, after the peak of daily methane production, the yield began to decline rapidly. In the treatments with TS contents of 6% and 9%, the daily production remained above 10 mL/g VS for only two days. In treatments with medium TS concentrations (12–18%, Figure 1B), the timing of peak methane production closely aligned with that observed at low TS concentrations (6–10%), occurring within the same experimental phase. The maximum daily methane yields for these medium-TS treatments ranged from 15.23 ± 0.76 to 17.10 ± 1.86 mL/g VS. By contrast, the highest TS treatment (25%, Figure 1C) exhibited a 3–8-day delay in peak production timing compared to both the low- and medium-TS treatments. In addition, the daily methane production remained above 9.4 mL/g VS during days 11~17 in the treatment with a TS content of 25%.
Figure 2 illustrates the temporal dynamics of cumulative methane yield (mL/g VS) in batch anaerobic reactors fed with dairy manure–cucumber vine mixtures. As shown in Figure 2, the highest cumulative methane production (208.0 mL/g VS) was achieved at 25% TS, reaching 1.17 to 2.2 times the production of the other treatments. This result shows that cumulative methane production was enhanced with increasing TS concentration, which was also consistent with the results in our previous study [20]. This result suggested that using specific mixed fermentation substrates could overcome diffusion limitations at high-TS concentrations, offering new insights into co-digestion engineering. Among all tested TS contents, the lowest cumulative methane yields (95.0–149.8 mL/g VS) were observed at low TS levels (6–10%), with the absolute minimum occurring at 6% TS. These results align with those of Yang et al. (2014), who reported optimal methane production at 20–23% TS in various feedstocks. Notably, our higher TS treatments (20–25%) showed significantly enhanced productivity compared to low-TS conditions, consistent with this established optimum range [24].
Figure 3 compares the optimal cumulative methane yields achieved across low (6–10%), medium (12–18%), and high (20–25%) TS contents for dairy manure–cucumber vine co-digestion. As illustrated in Figure 3A, the treatment with the 25% TS content demonstrated significantly higher cumulative methane production compared to the 10% TS treatment (p < 0.05), while no statistically significant difference was observed when compared with the 18% TS treatment. Moreover, the volumetric methane production rate (m3methane/m3reactor volume) for dairy manure–cucumber vines co-digestion at high TS concentrations (20–25%) was significantly higher (p < 0.01) than at low TS concentrations (6–10%) (Figure 3B). However, there was no significant difference in methane yield per unit volume at the 10, 12, and 15% TS concentrations (p > 0.05). The treatment with a 25% TS concentration demonstrated the highest volumetric methane productivity, achieving 10.6 m3methane/m3reactor volume, representing a 60% to 810% increase over the other treatments. This finding validates that increasing the TS concentration of the feedstock within an optimal range can reduce the anaerobic reactor volume and capital costs while enhancing volumetric methane productivity. Interestingly, we found that within the range of 6–25% TS, the cumulative methane production per unit system increased linearly with the increase in TS content (Figure S1). According to this rule, the methane production under different TS contents can be predicted.

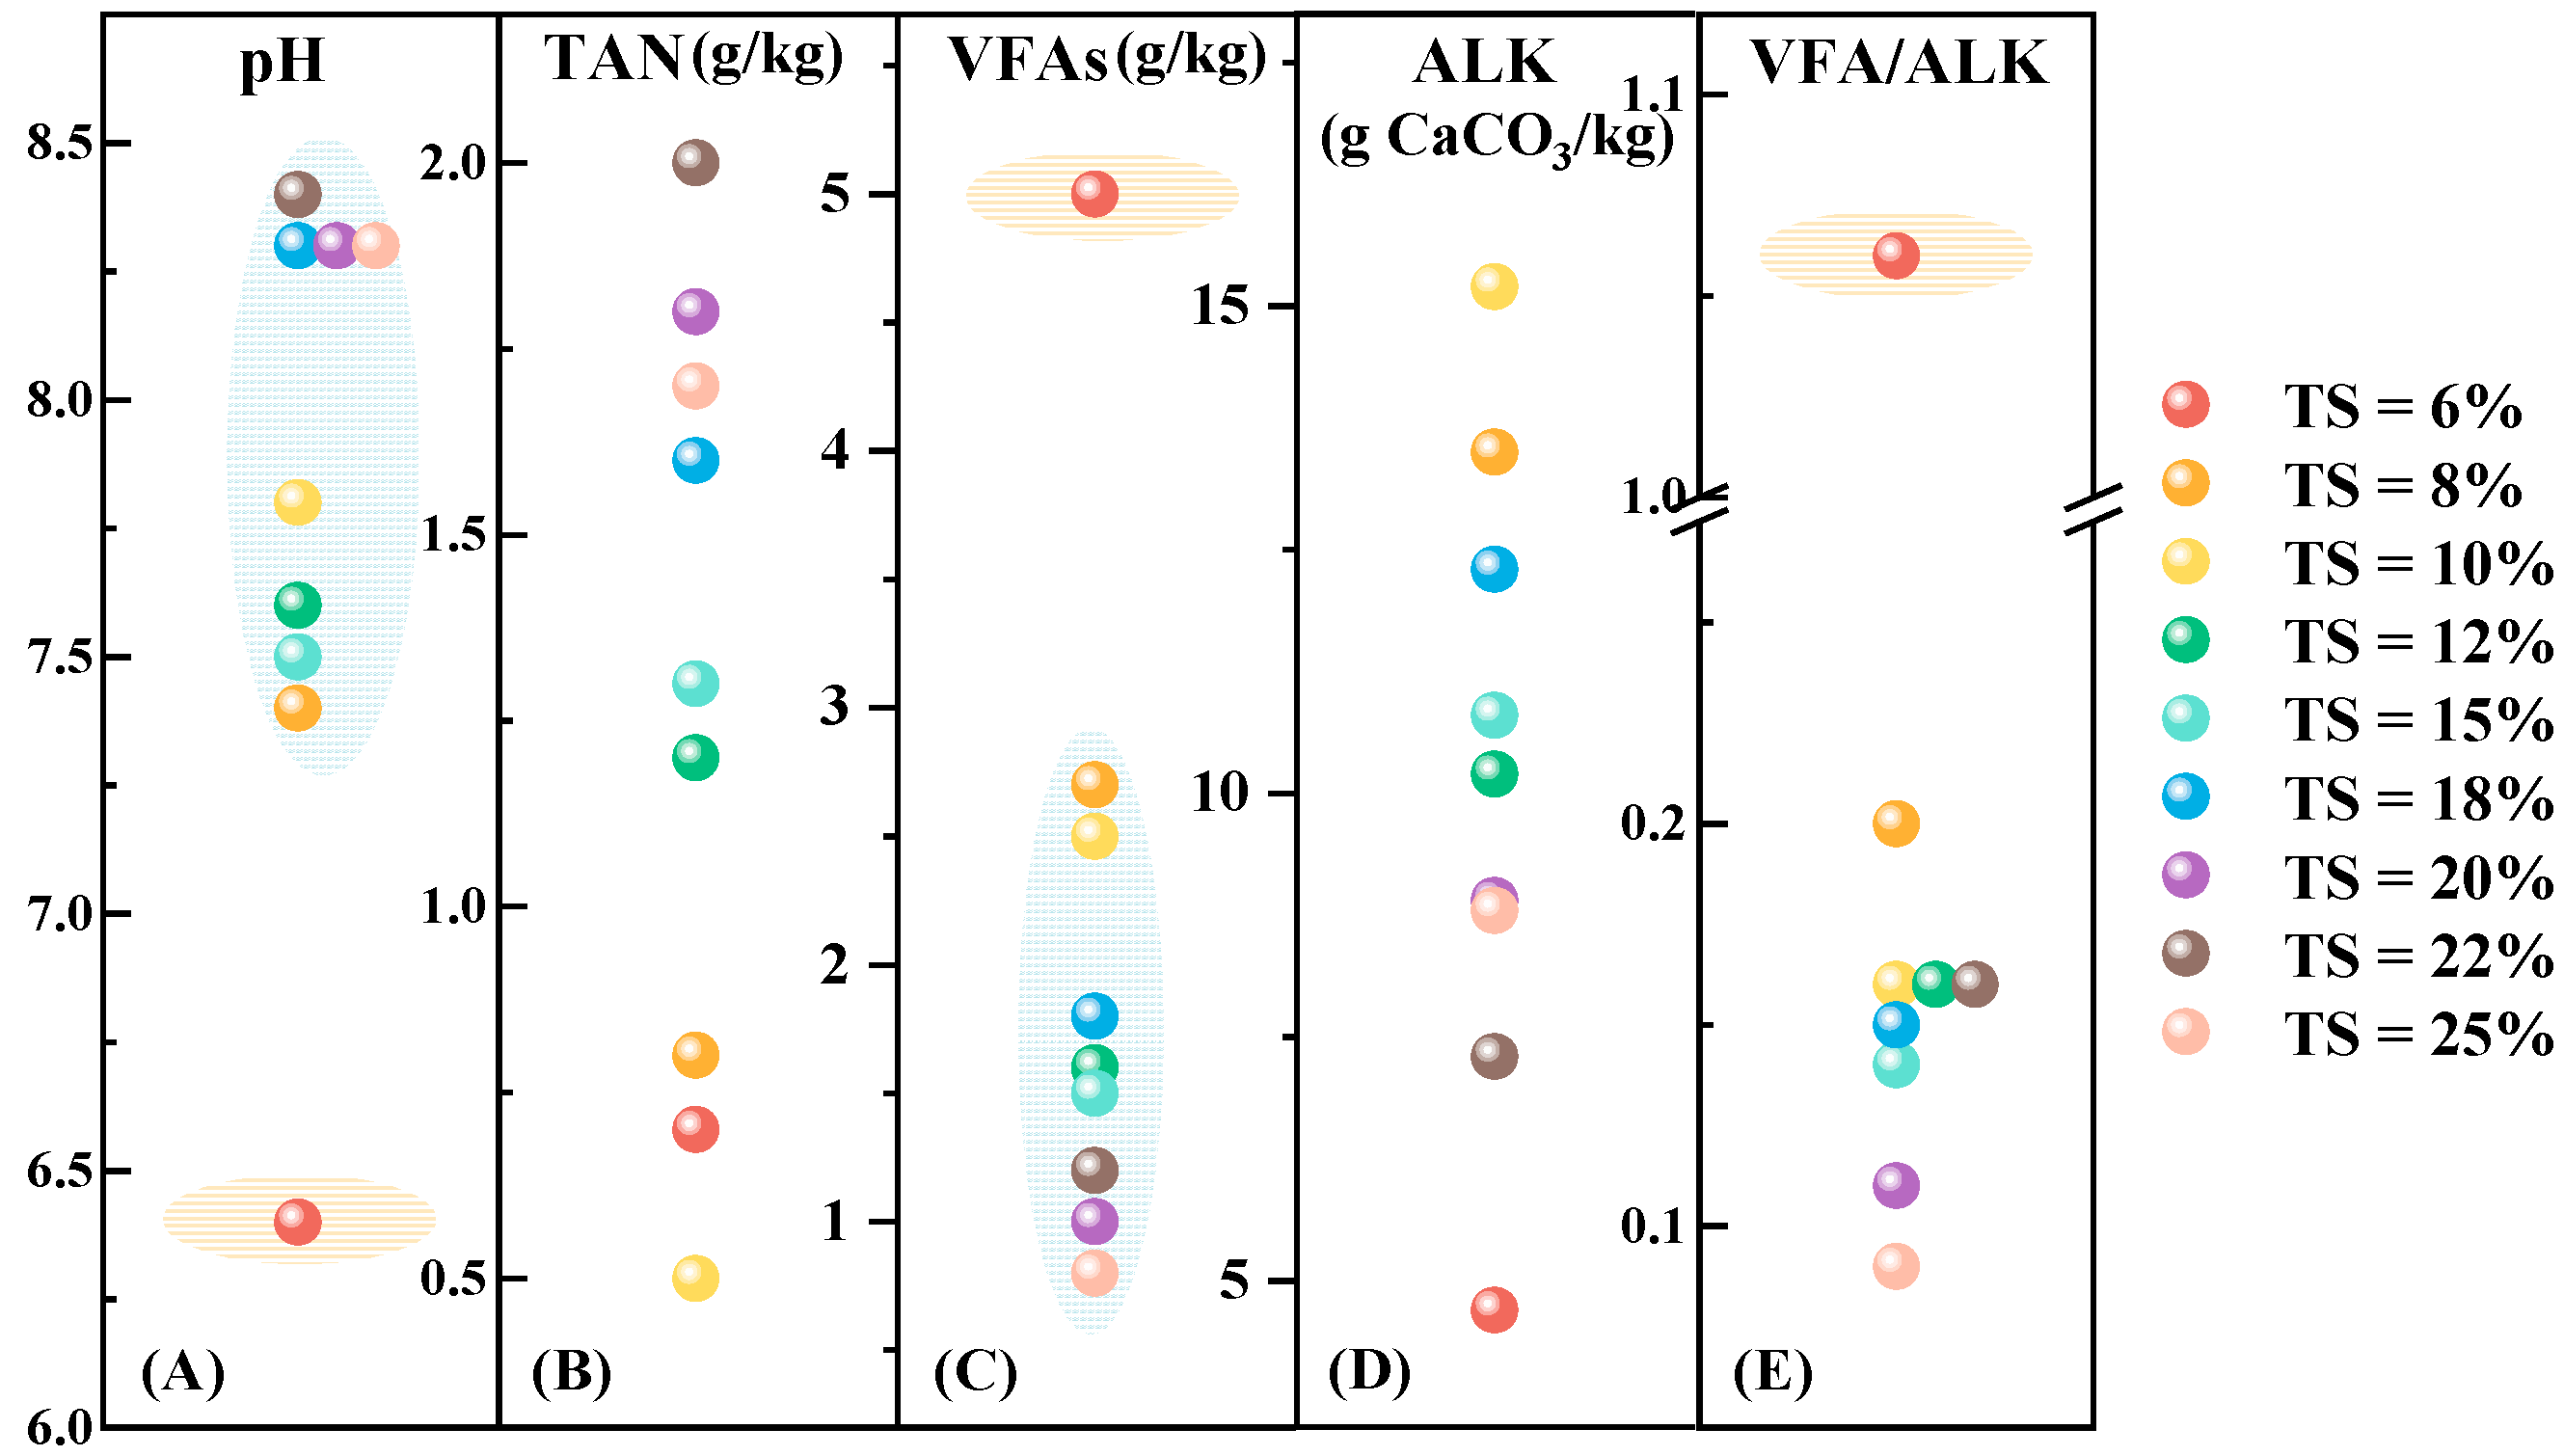
3.2. Anaerobic Digestion Physicochemical Properties

As illustrated in Figure 4, when the TS content reached 6%, the final pH of the AD system dropped to 6.4 (below the methanogenesis inhibition threshold of pH 6.5) [25], with the VFA concentration reaching 5.0 g/L, which was markedly higher than in other treatment groups. The VFA/ALK ratio (1.06) in this treatment surpassed the critical threshold of 0.8, signaling excessive VFA accumulation in the anaerobic co-digestion system of dairy manure and cucumber vines under the 6% TS condition. This phenomenon may be ascribed to the dilution of buffering agents in the low-TS treatment, resulting in the lowest ALK and, consequently, compromised buffer capacity. As Al-Sulaimi et al. (2022) noted, excessive VFA accumulation impedes methane production during the AD process, a finding consistent with the lowest methane yield observed under this condition in this study (Figure 3B, TS = 6%) [26]. With the exception of the treatment with a 6% TS content, the final pH values of all other treatments fell within the range of 7.4 to 8.4, which aligned with the conclusion proposed by a previous study that neutral and weakly alkaline conditions were conducive to methane production in AD [27,28]. Moreover, the VFA concentrations in these treatments ranged from 0.8 to 2.7 g/kg, staying below the VFA thresholds reported in previous studies on stable anaerobic reactors (< 3.0 g/kg) [29]. The final VFA/ALK ratios ranged from 0.1 to 0.2 (all below 0.3), indicating stable reactor operation and robust buffering capacity. The final TAN concentrations across all treatments ranged from 0.5 to 2.0 g/kg, well below the inhibitory threshold of 2.8 g N/kg [30]. Additionally, the TS content showed a linear positive correlation with TAN content (R2 = 0.834) (Figure S2). Across the tested TS range (6–25%), VFA concentrations generally decreased with increasing TS content, with the notable exception of the 6% TS treatment. Linear regression confirmed a significant negative correlation between the TS content and VFA accumulation (R2 = 0.814) (Figure S3). Specifically, reactors operating at high TS concentrations (20–25%) exhibited significantly lower VFA accumulation than those at low (6–10%) and medium (12–18%) TS levels. This indicates enhanced VFA degradation efficiency under high-solids conditions, corresponding to the observed improvements in both daily and cumulative methane production at elevated TS concentrations (Figure 3).

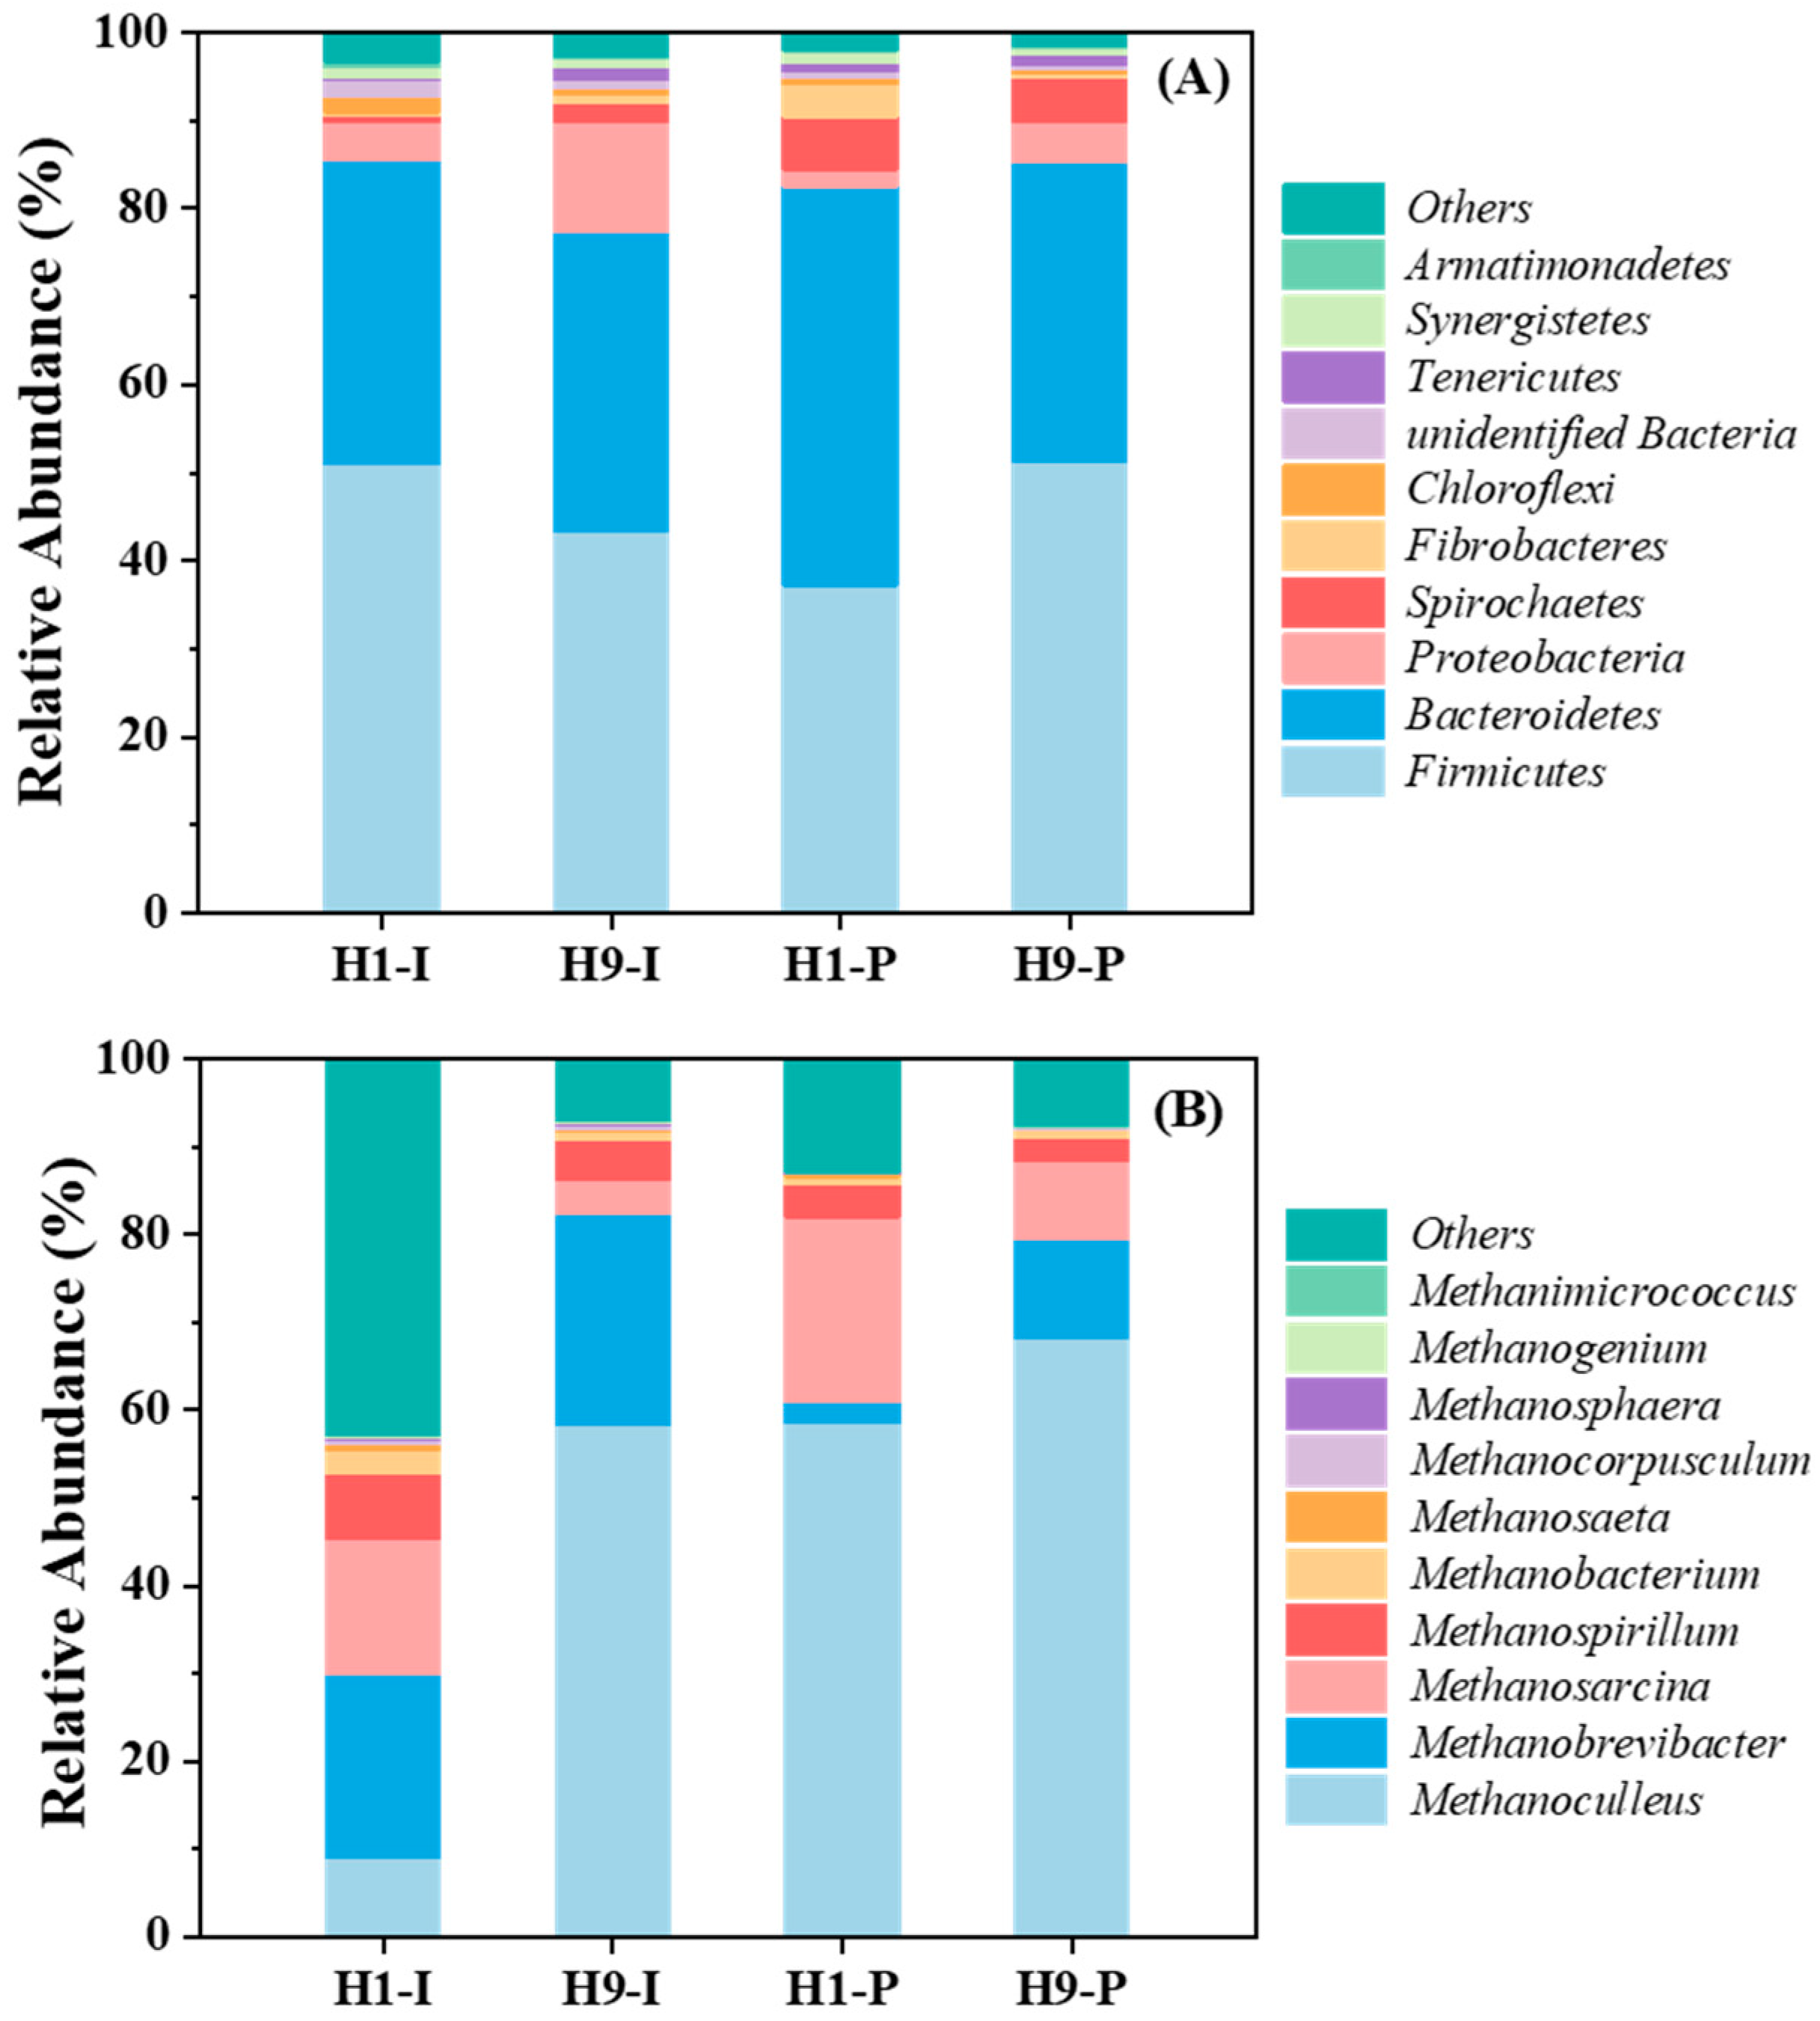
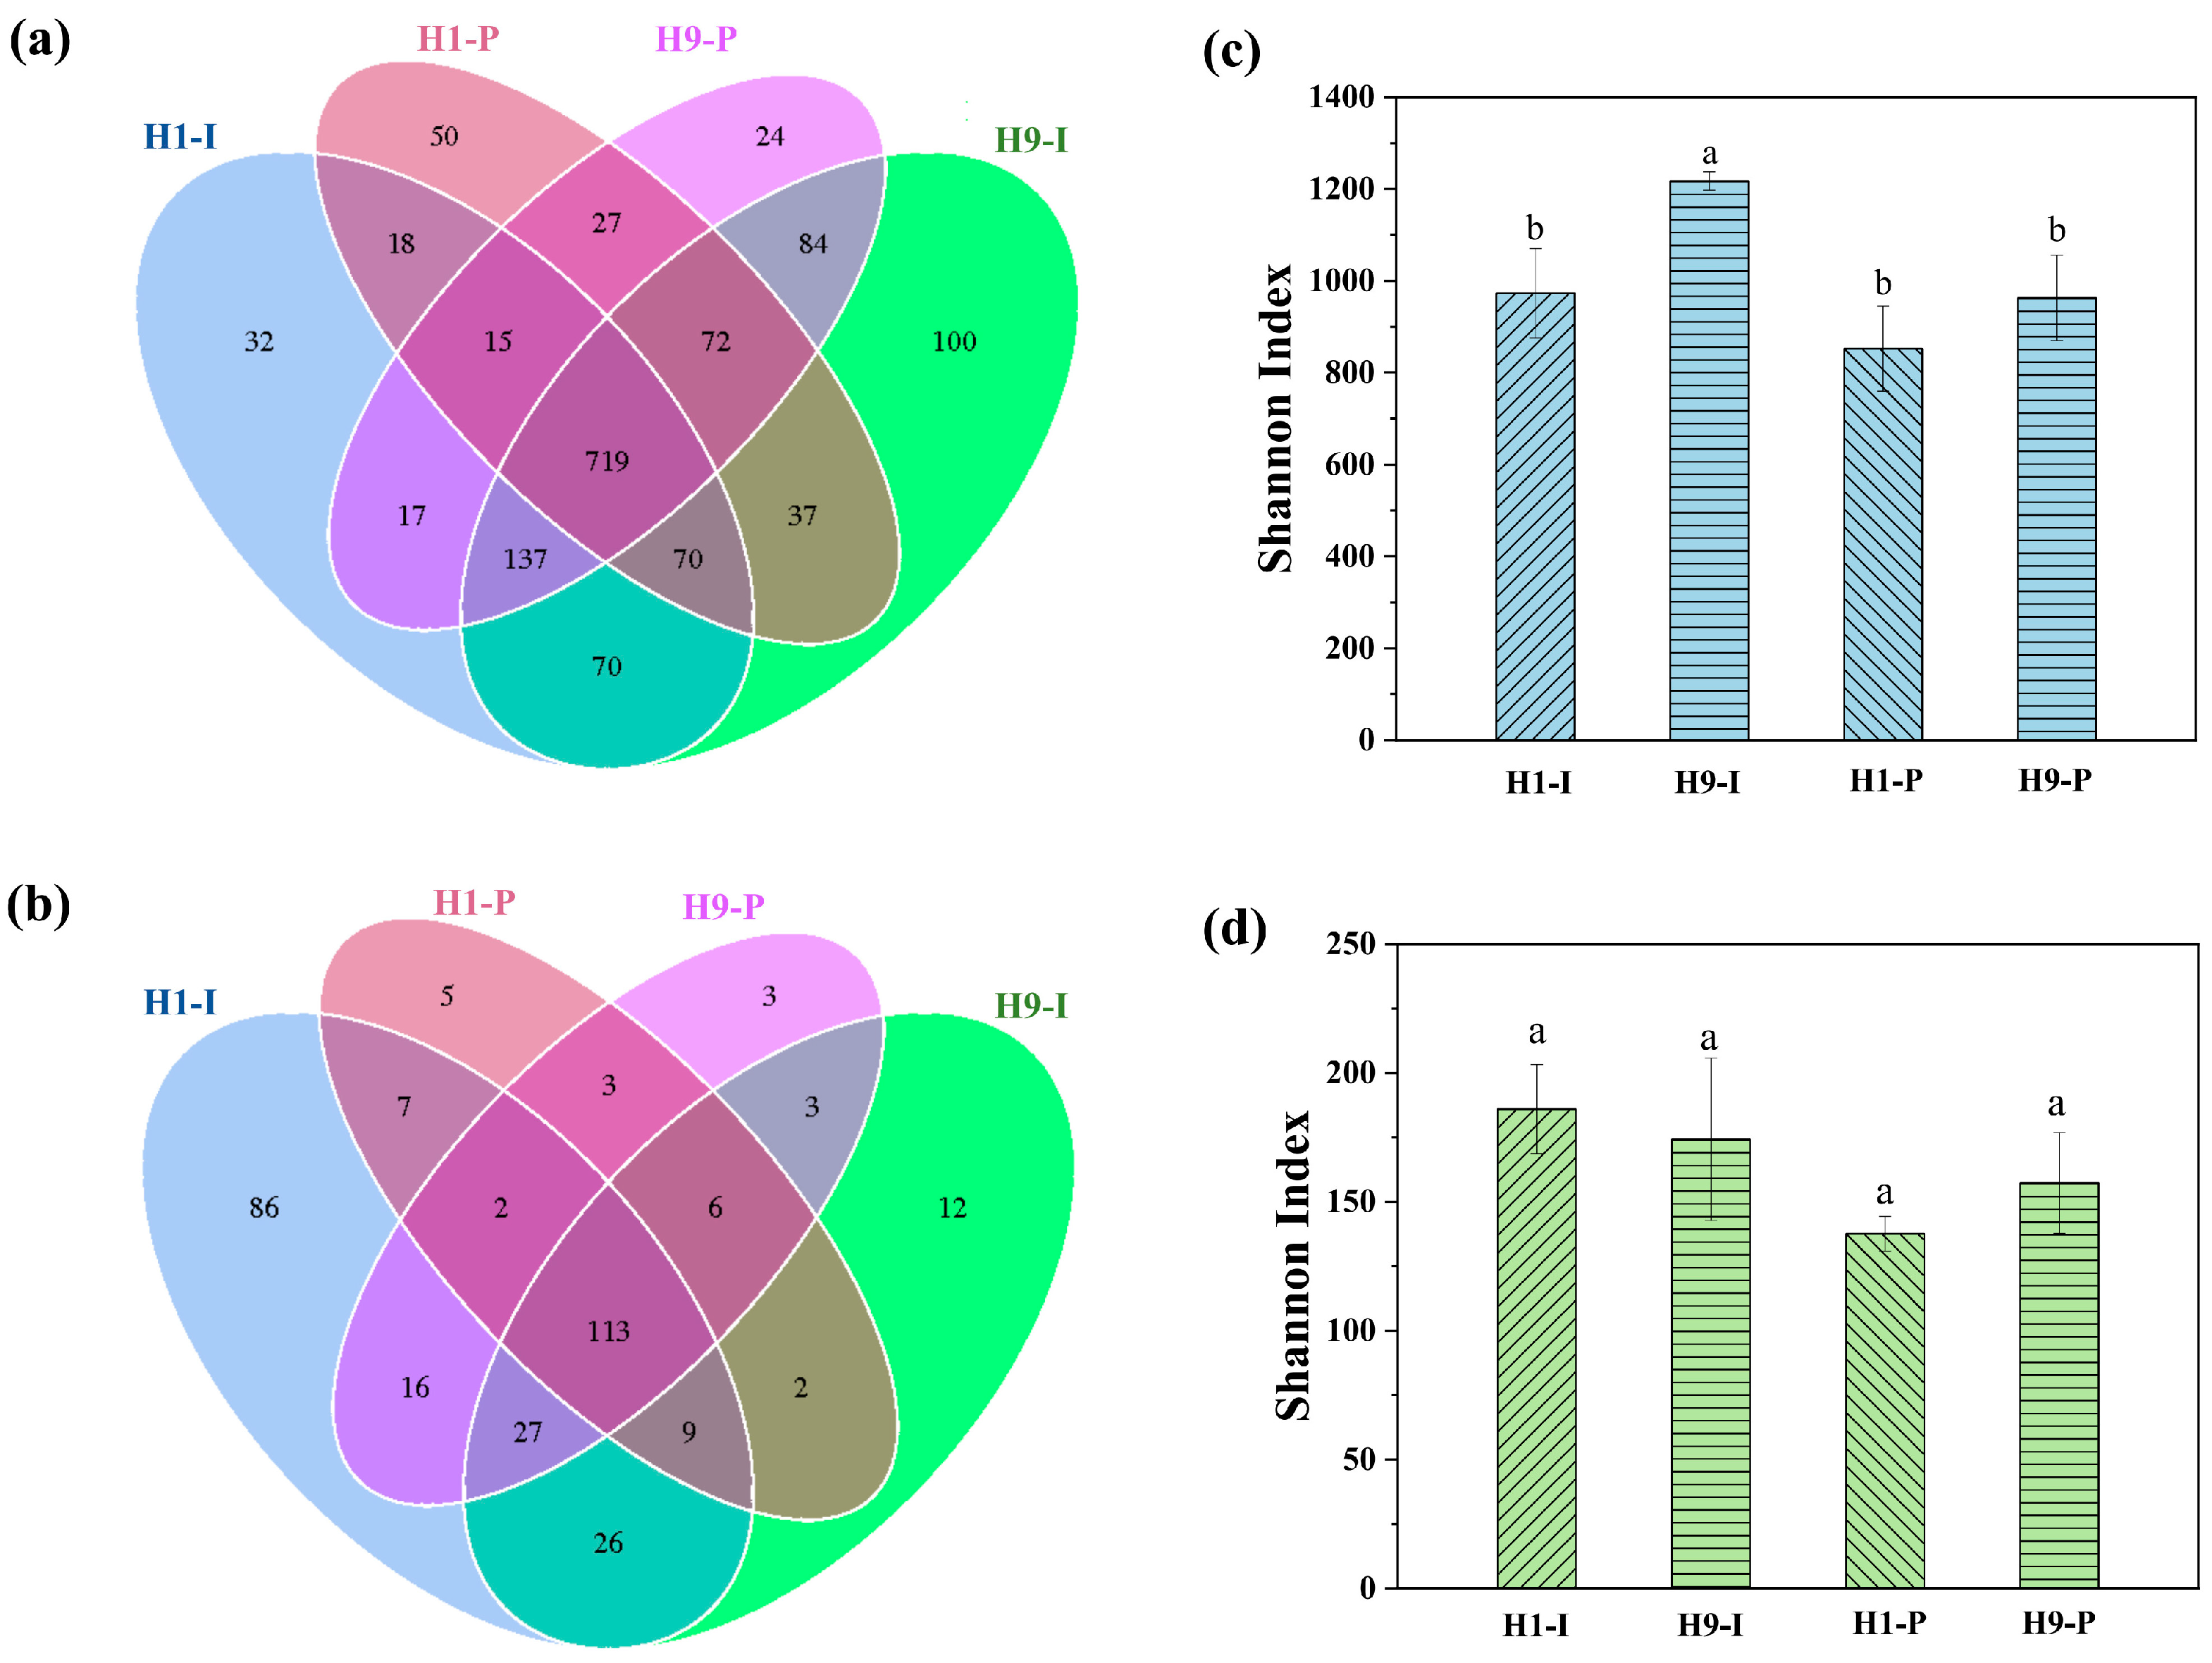
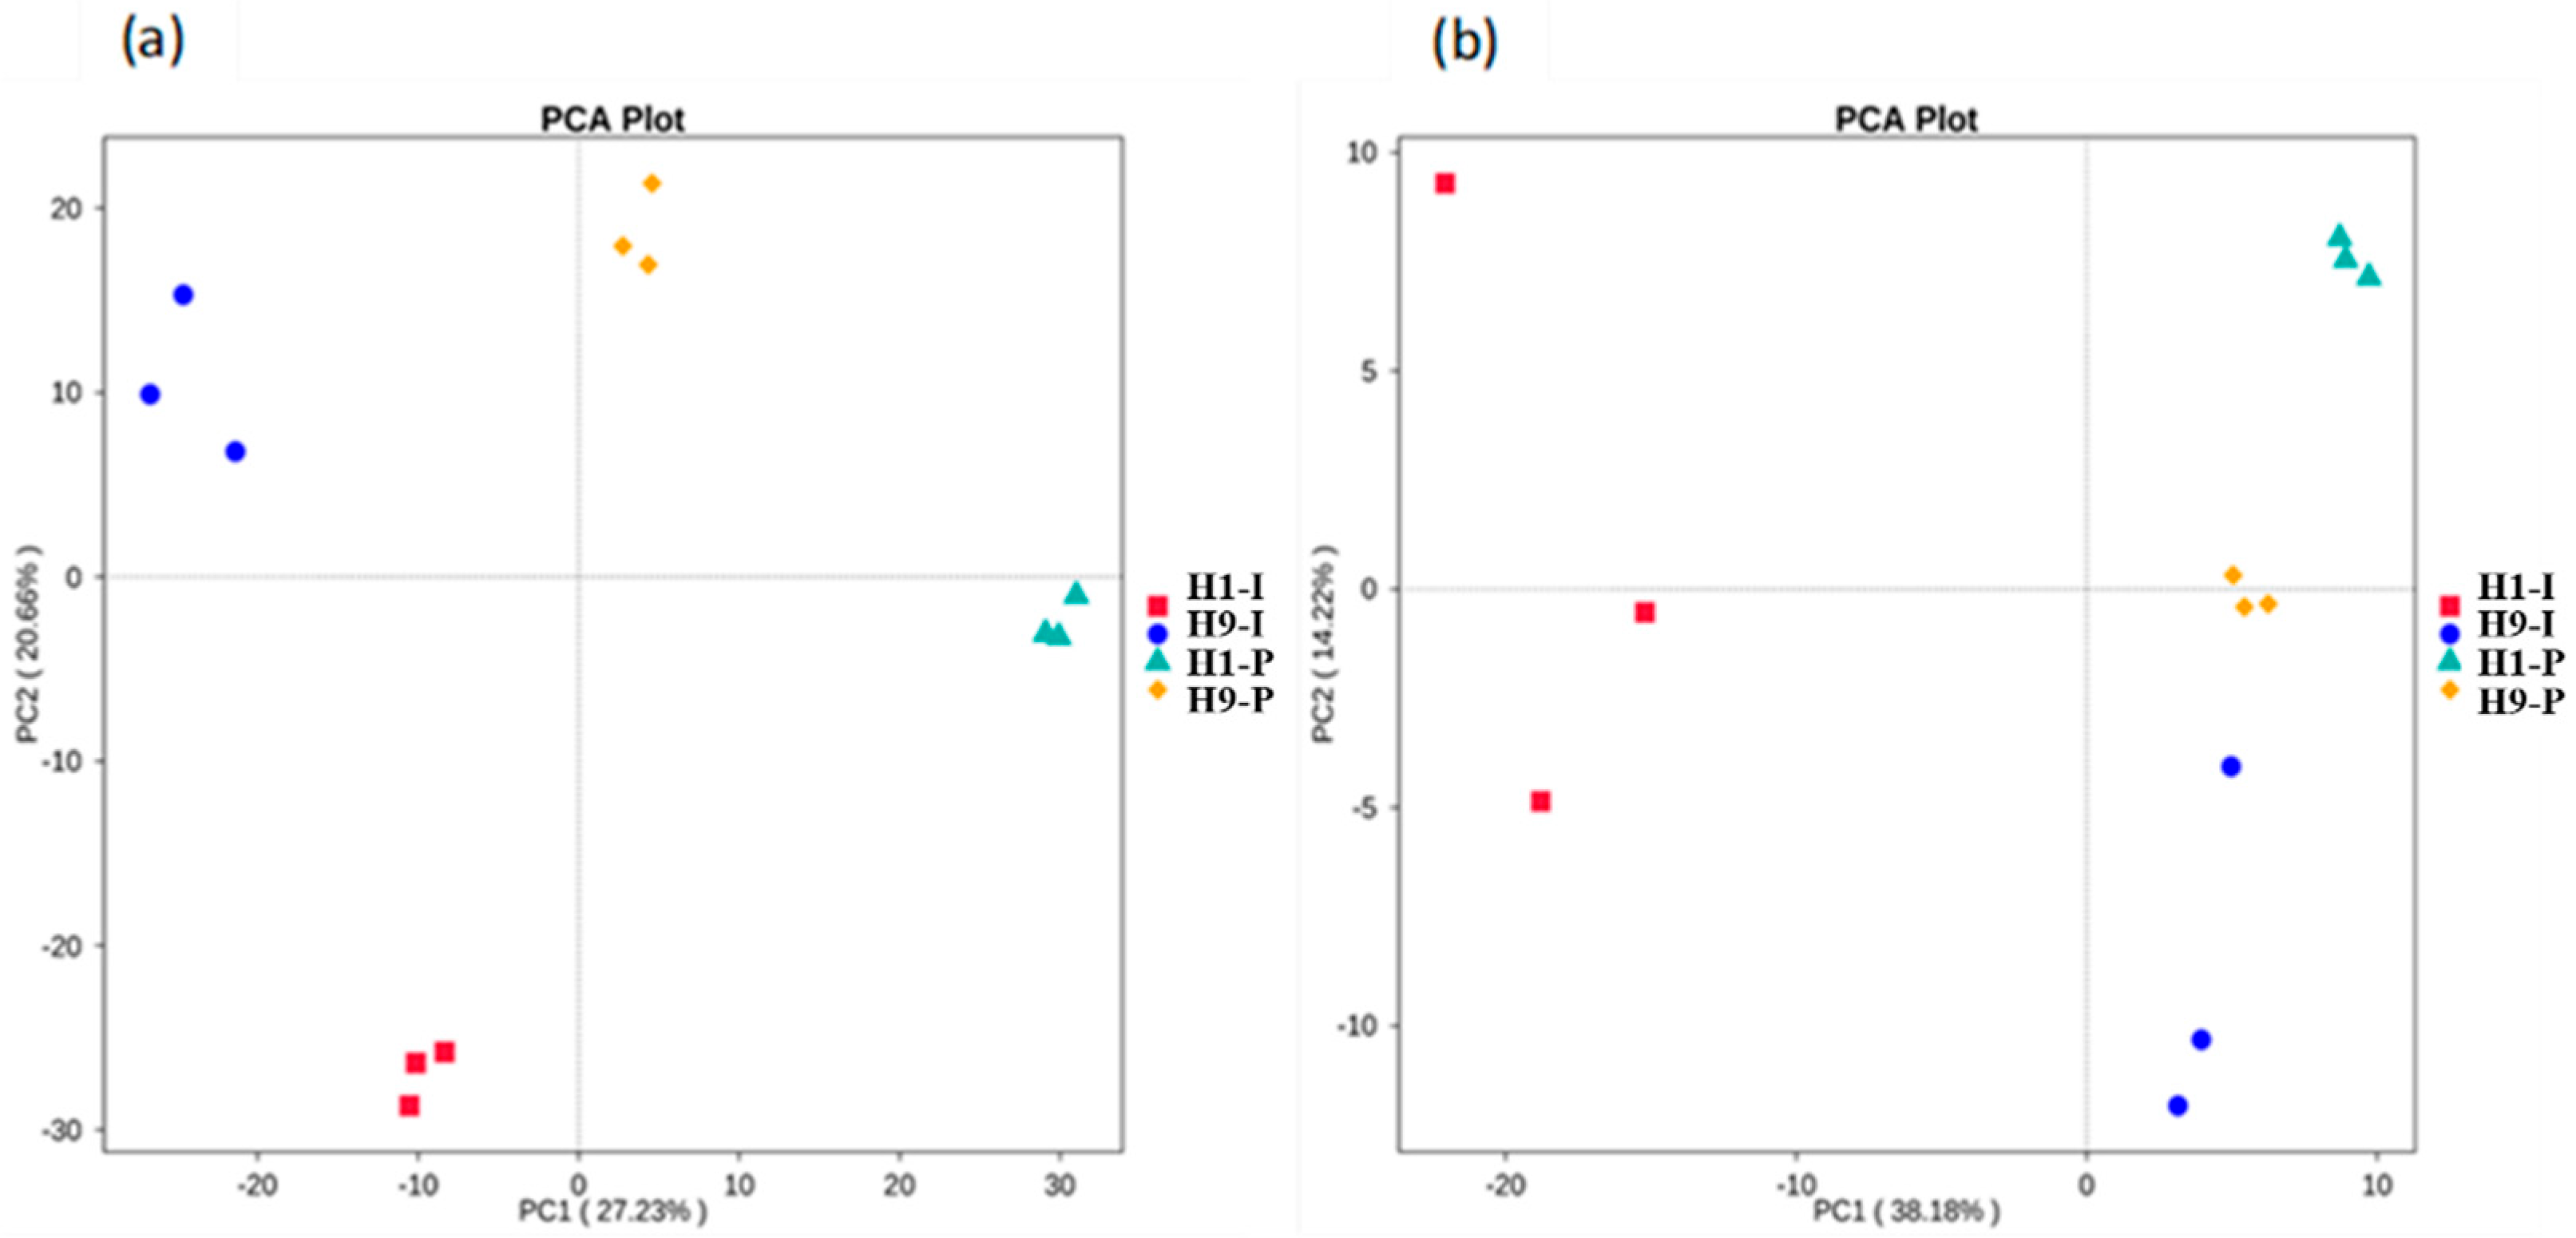
3.3. Microbial Community Structure Analysis

During the anaerobic co-fermentation of dairy manure and cucumber vines, the highest cumulative methane yield was achieved at 25% TS (H9), while the lowest yield was recorded at 6% TS (H1) (Figure 3B). Although the daily methane production for both the H1 and H9 treatments reached their peaks on day 7 of fermentation (Figure 1), marked disparities were evident in their daily and cumulative methane yields (Figure 1 and Figure 2). Therefore, a microbial community analysis was conducted for the H1 and H9 treatments, comparing initial samples (H1-I, H9-I) with samples collected after 7 days of fermentation (H1-P, H9-P).
As illustrated in Figure 5A and Table S3, the bacterial community structure in anaerobic co-digestion systems involving cow manure and cucumber vines at two different TS concentrations was predominantly characterized by four core phyla—Firmicutes, Bacteroidetes, Proteobacteria, and Spirochaetes—collectively accounting for over 90% of the total prokaryotic sequences at the phylum level. Consistent with our previous findings in cow manure–tomato vine co-digestion systems [20], Firmicutes (37.1–51.2% relative abundance) and Bacteroidetes (34.1–45.4%) consistently emerged as the dominant bacterial phyla throughout the fermentation process in this study. At the peak of AD biogas production, the relative abundance of Firmicutes reached 37.13% in the treatment with 6% TS and surged to 57.27% in the treatment with 25% TS, and the bacterial flora abundance was significantly higher in the high-TS (25%) treatment compared to the low-TS (6%) treatment (Table S3) (p < 0.05). In contrast, during peak gas production in the H1 treatment (6% TS), Bacteroidetes achieved a relative abundance of 45.36%, significantly surpassing Firmicutes (37.13%) and indicating their dominance in this system (p < 0.05) [31].
The archaeal community structure in anaerobic co-digestion systems at different TS concentrations is depicted in Figure 5B and Table S3. At the genus classification level, the predominant archaea in the treatment systems with 6% (H1) and 25% (H9) TS concentrations, both at the initial fermentation stage and during the peak period of the biogas production period, were Methanoculleus, Methanobrevibacter, and Methanosarcina. During the AD process, Methanoculleus primarily harnessed formate and CO2 in the system to generate methane [32,33]. During the methanogenic phase characterized by peak biogas yield, the relative abundances of Methanoculleus in the treatments with 6% TS (H1-P) and 25% TS (H9-P) were 58.42% and 68.26%, respectively (Figure 5B), and the abundance was significantly higher in the 25% TS treatment compared to the 6% TS treatment (p < 0.05), aligning with the cumulative methane production trends (Figure 2). Methanosarcina, unlike other archaea, is known for its lower environmental sensitivity and can thrive in conditions with relatively high concentrations of acetic acid and VFAs. Despite the acidification observed in the 6% TS treatment system (H1-P) during the peak biogas production phase, Methanosarcina maintained a high relative abundance of 21.09% (Table S3), underscoring its metabolic resilience under acidic conditions.
Venn diagrams derived from OTU profiles provide a visual depiction of microbial taxa shared or unique to the experimental groups, serving as a fundamental analytical approach for elucidating microbial diversity patterns in samples. As illustrated in Figure 6a, the number of shared bacterial OTUs between the initial fermentation stage and the peak methane production stage varied across different TS concentrations, with 996 and 833 core OTUs identified under low-TS (e.g., 6%) and high-TS (e.g., 25%) conditions, respectively. As illustrated in Figure 6b, Venn analysis revealed 175 and 124 shared archaeal OTUs between the initial fermentation stage and the peak methane production stage under 6% TS and 25% TS conditions, respectively, underscoring the differences in methanogenic communities across varying solid concentrations. Notably, the 6% TS treatment displayed a substantially higher numbers of unique archaeal OTUs (86 OTUs) during the initial stage (H1-I) compared to the 25% TS group (12 OTUs). This indicates greater archaeal community complexity under low-solids conditions. We attribute this phenomenon to enhanced fluidity and mass transfer at 6% TS, where higher moisture content likely promotes microbial diversity.
Alpha diversity analysis quantifies the within-sample microbial richness and evenness, providing critical insights into community complexity and ecosystem stability under experimental treatments. At 25% TS, the Shannon diversity of bacteria significantly declined from the initial stage to the peak stage, as indicated by distinct letters in Figure 6c (p < 0.05). Archaeal communities exhibited a higher Shannon index in the initial period at 6% TS, suggesting that the initial archaeal community was more abundant under wet digestion conditions, which was consistent with the analysis results from the Venn diagram (Figure 6b).
Principal component analysis (PCA) serves as a robust statistical method for elucidating variations in community structure [34]. By leveraging variance decomposition based on Euclidean distances, PCA effectively reduces the dimensionality of multivariate datasets, thereby extracting key patterns. Samples positioned closer together in the PCA ordination space share a more comparable species composition, reflecting a higher degree of similarity in their community structures. Conversely, samples with greater structural differences are placed farther apart in the ordination space.
The initial TS content of the fermentation raw materials significantly influences the bacterial microbial community structure. As illustrated in Figure 7a, when the initial TS content was 6%, the Euclidean distance between the peak gas production phase (HI-P) and the initial reaction phase (H1-I) was notably greater, indicating a substantial transformation in the microbial community structure. For the treatment with a TS content of 25%, the Euclidean distance during the peak period of AD biogas production (H9-P) was closer to that of the initial reaction stage (H9-I), suggesting a less pronounced change in the microbial community structure.
Similarly, the TS content was found to significantly impact the composition of archaeal microbial communities throughout the digestion process (Figure 7b). At a lower TS concentration (TS = 6%), notable shifts in archaeal community composition were observed between the initial fermentation stage (H1-I) and the methanogenic peak phase (H1-P). Under a high TS concentration (25%), the archaeal community composition exhibited relatively minor changes from the initial fermentation phase (H9-I) to the methanogenic peak stage (H9-P).
PCA analysis demonstrated that a lower initial TS concentration could induce substantial shifts in microbial community composition during the digestion process, while a higher initial TS concentration exerted a comparatively minor influence on the microbial community.

4. Discussion

4.1. Methane Production Efficiency

It is well established that optimizing the co-substrate ratio is a critical strategy for maximizing synergistic effects and biogas yield in anaerobic co-digestion systems [35,36]. However, this study employed a fixed ratio of cucumber vines to dairy manure (1:1) based on typical farm waste availability, as its primary focus was to elucidate the potentially dominant role of the TS content on process performance and microbial ecology. Our results demonstrate that even at a fixed co-substrate ratio, manipulating the TS content significantly modulated methane production (Figure 1, Figure 2 and Figure 3) and microbial community structure (Figure 5, Figure 6 and Figure 7), highlighting TS as a key operational parameter warranting precise control.
The methane production peak occurred 3–8 days later at a high TS concentration (25%) compared to low- (6–10%) and medium- (12–18%) TS treatments. The possible reason for this phenomenon is that the low mass transfer efficiency leads to slow hydrolysis. In some local areas, VFAs cannot be obtained by methanogens in sufficient time due to the low mass transfer efficiency, resulting in local acidification. Moreover, methanogens also need more time to colonize, grow, and establish dominant communities in a viscous substrate environment [37,38].
In this study, the maximum cumulative methane production was achieved at 25% TS. In single-material AD systems using either cucumber vine or cow manure as the substrate, the optimal TS contents were 9% and 17%, respectively, achieving cumulative methane production of approximately 140 mL/g VS and 100 mL/g VS [16,17]. These values are significantly lower than the cumulative methane yield attained at 25% TS in the co-digestion system.
At 6% TS, the pH and VFA levels exceeded the optimal range for anaerobic digestion, while other TS concentrations maintained suitable conditions. When the TS content falls below 20%, excessive moisture in the anaerobic reactors may compromise nutrient accessibility for microbial communities, thereby diminishing methane production efficiency [39]. However, when the TS concentration exceeded the optimal threshold, the deteriorated rheological properties of the fermentation substrate may induce localized accumulation of inhibitors and restrict microbial-substrate accessibility, ultimately suppressing methane production [40,41].

4.2. Microbial Community Characteristics

Bacteria are pivotal in numerous processes and aspects of anaerobic fermentation [42,43]. For instance, the decomposition of materials including proteins, polysaccharides, and cellulose, as well as the transformation of small-molecule organic substances like acetic acid, are all outcomes of the concerted action of diverse bacteria [44]. These interdependent biochemical pathways collectively drive the phased progression of AD systems. Within anaerobic digestion systems, archaeal communities are primarily dominated by methanogens, which facilitate the terminal methanogenic steps through pathways such as interspecies electron transfer or acetate cleavage [45]. The quantity and type of methanogenic archaea are closely related to the health and methanogenic ability of anaerobic fermentation systems [46].
In the bacterial community structure analysis, Firmicutes exhibited the highest relative abundance at the highest TS content (25%), while Bacteroidetes dominated when the TS content was low (6–10%). This TS-dependent phylum distribution aligns with prior studies reporting similar feedstock-responsive shifts [20,47]. As indispensable participants in the methanogenic food web, Firmicutes, despite being unable to produce methane directly, indirectly promote methanogenesis by supplying essential substrates (H2, acetate, formate, etc.) through their fermentative metabolism, thus supporting methanogenic archaea [47]. Notably, the H9 treatment group achieved the highest methane yield and the relative abundance of Firmicutes progressively increased throughout the fermentation process, exhibiting a consistent trend with methane yield patterns. Bacteroidetes are responsible for the decomposition of macromolecular organic substances, and their abundance directly affects hydrolysis efficiency. According to previous studies, Bacteroidetes play a leading role in cellulose degradation during the AD of cattle manure [48]. In the AD system, methanogenic archaea are the core bacterial community for methane production. In the high-ammonia environment of dry fermentation, hydrogen-nutritive methanobacterium (e.g., Methanoculleus) gain an advantage due to their stronger ammonia tolerance [49].
In AD systems with lower TS contents, notable structural transformations were observed in both bacterial and archaeal communities, likely stemming from the synergistic impacts of reduced pH and the accumulation of VFAs. Under acidic conditions, acid-tolerant bacteria may predominate in the bacterial community as an adaptive response, while fermentative bacteria might adjust their metabolic pathways to preferentially produce VFAs like propionate and butyrate, which are resistant to direct utilization by methanogens [50]. This metabolic shift further exacerbates VFA accumulation, establishing a feedback loop that intensifies system acidification. Meanwhile, the activity of acid-sensitive methanogenic archaea is compromised in such acidic conditions, leading to diminished methane production [51]. These intertwined microbial and biochemical dynamics highlight the critical role of pH homeostasis in sustaining functional stability and methanogenic efficiency in low-TS AD systems.

5. Conclusions

This study systematically explored the impact of TS concentration on methanogenic performance and microbial community dynamics during the AD process. Anaerobic digestion of dairy manure and cucumber vines at a high TS content (25%) showed the highest cumulative methane yield (10.6 m3/m3), outperforming other TS conditions by 0.6–8.1 times. The system demonstrated robust operational stability, maintaining low VFA concentrations (0.8–2.7 g/kg) and VFA/ALK ratios <0.3, with VFA accumulation inversely correlated with TS content. Microbial analysis revealed Firmicutes (57.27%) and Methanoculleus (68.26%) as the dominant taxa under 25% TS conditions, significantly higher than at 6% TS (37.13% and 58.42%, respectively), directly correlating with the enhanced methanogenic performance observed in high-solids AD systems. This study establishes the TS content as a decisive factor controlling methanogenic efficiency during the co-digestion of cucumber vines and dairy manure at a fixed ratio (1:1). Building on this foundational insight, the future optimization of co-substrate ratios will be essential to maximize process synergy, thereby enabling scalable, high-efficiency valorization of facility agricultural wastes.

Supplementary Materials

The following supporting information can be downloaded at: https://www.mdpi.com/article/10.3390/agronomy15071610/s1, Text S1: Raw Materials and Inoculum; Text S2: Determination and Methodology of Gas Phase; Text S3: Statistical Analysis; Figure S1: The linear relationship between TS content and volumetric cumulative methane production; Figure S2: The linear relationship between TS content and TAN concentration; Figure S3: The linear relationship between TS content and VFA concentration; Table S1: Characteristics of feedstocks and inoculums for anaerobic co-digestion; Table S2: The mass of materials added for different treatments; Table S3: Relative abundance of bacteria and archaea on the initial and peak periods.

Author Contributions

Conceptualization, Y.W., Y.L., and Y.Q.; Methodology, L.F.; Software, Z.L.; Validation, Z.L.; Formal Analysis, G.L.; Investigation, L.F.; Resources, G.L.; Data Curation, L.B. and Y.J.; Writing—Original Draft Preparation, Y.W.; Writing—Review and Editing, Y.Q.; Visualization, Y.L.; Supervision, Y.L.; Project Administration: L.B. and Y.J.; Funding Acquisition, Y.W. and Y.Q. All authors have read and agreed to the published version of the manuscript.

Funding

This research was funded by the Shandong Agricultural Technology System-Cattle System (SDAIT-09-22), the Taishan Scholars Program (tsqnz20240846), and the Agricultural Scientific and Technological Innovation Project of Shandong Academy of Agricultural Sciences (CXGC2025F04, CXGC2025C04).

Data Availability Statement

The original contributions presented in the study are included in the article/Supplementary Materials, further inquiries can be directed to the corresponding author.

Conflicts of Interest

The authors declare no conflicts of interest. The funder was not involved in the study design, collection, analysis, interpretation of data, the writing of this article, or the decision to submit it for publication.

References

  1. Chen, B.; Azman, S.; Dewil, R.; Appels, L. Alkaline anaerobic digestion of livestock manure: Unveiling mechanisms, applications, and perspective. Chem. Eng. J. 2023, 477, 146852. [Google Scholar] [CrossRef]
  2. Liu, E.; Liu, S. Process optimization and study of biogas fermentation with a mixture of duck manure and straw. Renew. Sust. Energ. Rev. 2017, 72, 439–444. [Google Scholar] [CrossRef]
  3. Hu, Y.Y.; Wu, J.; Li, H.Z.; Poncin, S.; Wang, K.J.; Zuo, J.E. Study of an enhanced dry anaerobic digestion of swine manure: Performance and microbial community property. Bioresour. Technol. 2019, 282, 353–360. [Google Scholar] [CrossRef] [PubMed]
  4. Sillero, L.; Solera, R.; Perez, M. Anaerobic co-digestion of sewage sludge, wine vinasse and poultry manure for bio-hydrogen production. Int. J. Hydrogen Energy. 2022, 47, 3667–3678. [Google Scholar] [CrossRef]
  5. Liu, C.; Li, H.; Zhang, Y.Y.; Chen, Q.W. Characterization of methanogenic activity during high-solids anaerobic digestion of sewage sludge. Biochem. Eng. J. 2016, 109, 96–100. [Google Scholar] [CrossRef]
  6. Yao, L.; Wang, Y.; Li, R.; Fu, L.; Liu, Z.; Gao, X. Effects of Total Solid Content on Anaerobic Fermentation Performance and Biogas Productivity of Tail Vegetables. Fermentation 2024, 10, 437. [Google Scholar] [CrossRef]
  7. Guo, E.; Chen, G.; Yu, D.; Qiu, Y.; Li, S.; Yu, Y. Optimization of dry anaerobic co-fermentation of sludge and corn straw with magnetite (Fe3O4). J. Environ. Chem. Eng. 2022, 10, 108618. [Google Scholar] [CrossRef]
  8. Pakarinen, O.; Lehtomaki, A.; Rissanen, S.; Rintala, J. Storing energy crops for methane production: Effects of solids content and biological additive. Bioresour. Technol. 2008, 99, 7074–7082. [Google Scholar] [CrossRef]
  9. Wang, Z.; Lv, Z.; Du, J.; Mo, C.; Yang, X.; Tian, S. Combined process for ethanol fermentation at high-solids loading and biogas digestion from unwashed steam-exploded corn stover. Bioresour. Technol. 2014, 166, 282–287. [Google Scholar] [CrossRef]
  10. Abu Yazid, N.; Barrena, R.; Komilis, D.; Sanchez, A. Solid-State Fermentation as a Novel Paradigm for Organic Waste Valorization: A Review. Sustainability 2017, 9, 224. [Google Scholar] [CrossRef]
  11. Gervasi, T.; Mandalari, G. Valorization of Agro-Industrial Orange Peel By-Products through Fermentation Strategies. Fermentation 2024, 10, 224. [Google Scholar] [CrossRef]
  12. Wu, D.; Liu, H.; Xing, T.; Xiao, F.; Liu, Y.; Zhen, F.; Sun, Y. An integrated evaluation strategy for anaerobic digestion monitoring based on acid-base balance and thermodynamics of volatile fatty acid degradation. Chem. Eng. J. 2024, 486, 150340. [Google Scholar] [CrossRef]
  13. Gao, Q.; Zhang, Y.; Li, L.; Zhou, H.; Wang, K.; Ding, J.; Jiang, J.; Wei, L.; Zhao, Q. The stress of bioactive compounds on microbes in anaerobic digestion of food waste and mitigation strategies: A critical review. Chem. Eng. J. 2024, 493, 152764. [Google Scholar] [CrossRef]
  14. Yang, F.; Li, W.; Sun, M.; Li, Q.; Wang, M.; Sun, Y. Improved Buffering Capacity and Methane Production by Anaerobic Co-Digestion of Corn Stalk and Straw Depolymerization Wastewater. Energies 2018, 11, 1751. [Google Scholar] [CrossRef]
  15. Mata-Alvarez, J.; Macé, S.; Llabrés, P. Anaerobic digestion of organic solid wastes: An overview of research achievements and perspectives. Bioresour. Technol. 2000, 74, 3–16. [Google Scholar] [CrossRef]
  16. Cai, F.; Gu, Y.; Yan, H.; Chen, C.; Liu, G. Impact of different pretreatments on the anaerobic digestion performance of cucumber vine. Environ. Sci. Pollut. R 2022, 29, 88507–88518. [Google Scholar] [CrossRef]
  17. Nleya, Y.; Young, B.; Nooraee, E.; Baroutian, S. Anaerobic digestion of dairy cow and goat manure: Comparative assessment of biodegradability and greenhouse gas mitigation. Fuel 2025, 381, 133458. [Google Scholar] [CrossRef]
  18. Zhang, Y.; Xu, L.; Liang, Y.; Yang, S.; Liu, X. Evaluation of Semi-dry Mesophilic Anaerobic Co-digestion of Corn Stover and Vegetable Waste by a Single-Phase Process. Waste. Biomass. Valori. 2019, 10, 1159–1166. [Google Scholar] [CrossRef]
  19. Tian, P.; Gong, B.; Bi, K.; Liu, Y.; Ma, J.; Wang, X.; Ouyang, Z.; Cui, X. Anaerobic Co-Digestion of Pig Manure and Rice Straw: Optimization of Process Parameters for Enhancing Biogas Production and System Stability. Int J Env. Res Public Health. 2023, 20, 804. [Google Scholar] [CrossRef]
  20. Wang, Y.; Li, Y.; Yao, L.; Fu, L.; Liu, Z. The Biogas Production Potential and Community Structure Characteristics of the Co-Digestion of Dairy Manure and Tomato Residues. Agronomy 2024, 14, 881. [Google Scholar] [CrossRef]
  21. ISO-5664; Water Quality-Determination of Ammonium-Distillation and Titration Method. International Organization for Standardization: Geneva, Switzerland, 1984.
  22. Wang, Y.Y.; Li, G.X.; Chi, M.H.; Sun, Y.B.; Zhang, J.X.; Jiang, S.X.; Cui, Z.J. Effect of co-digestion of cucumber residues to corn stover and pig manure ratio on methane production in solid state anaerobic digestion. Bioresour. Technol. 2018, 250, 328–336. [Google Scholar] [CrossRef] [PubMed]
  23. Martins, R.M.M.; Fonseca, Y.A.; Faria, M.V.; Aquino, S.F.de.; Herrera Adarme, O.F.; Baêta, B.E.L. Methane production by anaerobic co-digestion of dairy manure and cassava wastes for energy recovery. J. Chem. Technol. Biotechnol. 2022, 98, 797–806. [Google Scholar] [CrossRef]
  24. Yang, L.; Li, Y. Anaerobic digestion of giant reed for methane production. Bioresour. Technol. 2014, 171, 233–239. [Google Scholar] [CrossRef] [PubMed]
  25. Park, S.; Li, Y.B. Evaluation of methane production and macronutrient degradation in the anaerobic co-digestion of algae bio-mass residue and lipid waste. Bioresour. Technol. 2012, 111, 42–48. [Google Scholar] [CrossRef]
  26. Al-Sulaimi, I.N.; Nayak, J.K.; Alhimali, H.; Sana, A.; Al-Mamun, A. Production by Sludge-Feeding Thermophilic Anaerobic Digester and Predicting Process Parameters. Fermentation 2022, 8, 184. [Google Scholar] [CrossRef]
  27. Lahav, O.; Morgan, B. Titration methodologies for monitoring of anaerobic digestion in developing countries: A review. J. Chem. Technol. Biotechnol. 2004, 79, 1331–1341. [Google Scholar] [CrossRef]
  28. He, S.; Deng, Q.; Xian, P.; Li, Z.; Tan, S.; Liu, Q. Volatile fatty acid (VFA) and methane generation from sewage sludge and banana straw: Influence of pH and two-phase anaerobic fermentation. Desalin. Water. Treat. 2019, 152, 208–213. [Google Scholar] [CrossRef]
  29. Meng, L.Y.; Xie, L.; Suenaga, T.; Riya, S.; Terada, A.; Hosomi, M. Eco-compatible biochar mitigates volatile fatty acids stress in high load thermophilic solid-state anaerobic reactors treating agricultural waste. Bioresour. Technol. 2020, 309, 123366. [Google Scholar] [CrossRef]
  30. Poggi-Varaldo, H.M.; Rodriguez-Vazquez, R.; Fernandez-Villagomez, G.; Esparza-Garcia, F. Inhibition of mesophilic solid-substrate anaerobic digestion by ammonia nitrogen. Appl. Microbiol. Biotechnol. 1997, 47, 284–291. [Google Scholar] [CrossRef]
  31. Ren, J.W.; Yuan, X.F.; Li, J.; Ma, X.G.; Zhao, Y.; Zhu, W.B.; Wang, X.F.; Cui, Z.J. Performance and microbial community dynamics in a two-phase anaerobic co-digestion system using cassava dregs and pig manure. Bioresour. Technol. 2014, 155, 342–351. [Google Scholar] [CrossRef]
  32. Woraruthai, T.; Kunno, J.; Pongsopon, M.; Yansakon, K.; Phoopraintra, P.; Chantiwas, R.; Leartsakulpanich, U.; Chaiyen, P.; Wongnate, T. Identification and cultivation of hydrogenotrophic methanogens from palm oil mill effluent for high methane production. Int. J. Energy Res. 2020, 44, 10058–10070. [Google Scholar] [CrossRef]
  33. Halim, M.F.A.; Day, L.A.; Costa, K.C. Formate-Dependent Heterodisulfide Reduction in a Methanomicrobiales Archaeon. Appl. Environ. Microbiol. 2021, 87, e02698–20. [Google Scholar]
  34. Liu, W.; Chen, L. Community Detection in Disease-Gene Network Based on Principal Component Analysis. Tsinghua. Sci. Technol. 2013, 18, 454–461. [Google Scholar] [CrossRef]
  35. Ma, G.; Ndegwa, P.; Harrison, J.H.; Chen, Y. Methane yields during anaerobic co-digestion of animal manure with other feedstocks: A meta-analysis. Sci. Total. Environ. 2020, 728, 138224. [Google Scholar] [CrossRef] [PubMed]
  36. Ma, X.; Yu, M.; Yang, M.; Gao, M.; Wu, C.; Wang, Q. Synergistic effect from anaerobic co-digestion of food waste and Sophora flavescens residues at different co-substrate ratios. Environ. Sci. Pollut. Res. 2019, 26, 37114–37124. [Google Scholar] [CrossRef]
  37. Lim, E.Y.; Lee, J.T.E.; Zhang, L.; Tian, H.L.; Ong, K.C.; Tio, Z.K.; Zhang, J.X.; Tong, Y.W. Abrogating the inhibitory effects of volatile fatty acids and ammonia in overloaded food waste anaerobic digesters via the supplementation of nano-zero valent iron modified biochar. Sci. Total. Environ. 2022, 817, 152968. [Google Scholar] [CrossRef]
  38. Chen, Y.; Cheng, J.J.; Creamer, K.S. Inhibition of anaerobic digestion process: A review. Bioresour. Technol. 2008, 99, 4044–4064. [Google Scholar] [CrossRef]
  39. Yi, J.; Dong, B.; Jin, J.; Dai, X. Effect of increasing total solids contents on anaerobic digestion of food waste under mesophilic conditions: Performance and microbial characteristics analysis. PLoS ONE 2014, 9, e102548. [Google Scholar] [CrossRef]
  40. Wang, Z.; Jiang, Y.; Wang, S.; Zhang, Y.; Hu, Y.; Hu, Z.; Wu, G.; Zhan, X. Impact of total solids content on anaerobic co-digestion of pig manure and food waste: Insights into shifting of the methanogenic pathway. Waste. Manage. 2020, 114, 96–106. [Google Scholar] [CrossRef]
  41. Abbassi-Guendouz, A.; Brockmann, D.; Trably, E.; Dumas, C.; Delgenès, J.P.; Steyer, J.P.; Escudié, R. Total solids content drives high solid anaerobic digestion via mass transfer limitation. Bioresour. Technol. 2012, 111, 55–61. [Google Scholar] [CrossRef]
  42. Vavilin, V.; Fernandez, B.; Palatsi, J.; Flotats, X. Hydrolysis kinetics in anaerobic degradation of particulate organic material: An overview. Waste Manag. 2008, 28, 939–951. [Google Scholar] [CrossRef] [PubMed]
  43. Kallistova, A.Y.; Goel, G.; Nozhevnikova, A.N. Microbial diversity of methanogenic communities in the systems for anaerobic treatment of organic waste. Microbiology 2014, 83, 462–483. [Google Scholar] [CrossRef]
  44. Magdalena, J.A.; González-Fernández, C. Microalgae Biomass as a Potential Feedstock for the Carboxylate Platform. Molecules. 2019, 24, 4404. [Google Scholar] [CrossRef] [PubMed]
  45. Hassan, A.N.; Nelson, B.K. Invited review: Anaerobic fermentation of dairy food wastewater. J. Dairy Sci. 2012, 95, 6188–6203. [Google Scholar] [CrossRef]
  46. Liu, J.; Zhang, L.; Zhang, P.; Zhou, Y. Quorum quenching altered microbial diversity and activity of anaerobic membrane bioreactor (AnMBR) and enhanced methane generation. Bioresour. Technol. 2020, 315, 123862. [Google Scholar] [CrossRef] [PubMed]
  47. Schulz, K.; Hunger, S.; Brown, G.; Tsai, S.; Cerri, C.; Conrad, R.; Drake, H.L. Methanogenic food web in the gut contents of methane-emitting earthworm Eudrilus eugeniae from Brazil. ISME J. 2015, 9, 1778–1792. [Google Scholar] [CrossRef]
  48. Ziganshin, A.M.; Liebetrau, J.; Pröter, J.; Kleinsteuber, S. Microbial community structure and dynamics during anaerobic digestion of various agricultural waste materials. Appl. Microbiol. Biotechnol. 2013, 97, 5161–5174. [Google Scholar] [CrossRef]
  49. Song, Y.; Qiao, W.; Zhang, J.; Dong, R. Process Performance and Functional Microbial Community in the Anaerobic Digestion of Chicken Manure: A Review. Energies 2023, 16, 4675. [Google Scholar] [CrossRef]
  50. Huang, Z.; Yu, X.; Miao, H.; Ren, H.; Zhao, M.; Ruan, W. Enzymatic dynamics of microbial acid tolerance response (ATR) during the enhanced biohydrogen production process via anaerobic digestion. Int. J. Hydrog. Energy. 2012, 37, 10655–10662. [Google Scholar] [CrossRef]
  51. Wang, C.; Li, Y.; Sun, Y. Acclimation of Acid-Tolerant Methanogenic Culture for Bioaugmentation: Strategy Comparison and Microbiome Succession. ACS Omega. 2020, 5, 6062–6068. [Google Scholar] [CrossRef]
Figure 1. Effect of total solids concentration on daily methane yields from dairy manure and cucumber vines in digesters: (A) 6% to 10% TS, (B) 12% to 18% TS, (C) 20% to 25% TS.
Agronomy 15 01610 g001
Figure 2. Cumulative methane yields from dairy manure and cucumber seedlings digesters at different TS concentrations: (A) 6% to 10% TS, (B) 12% to 18% TS, (C) 20% to 25% TS.
Agronomy 15 01610 g002
Figure 3. (A) Optimum cumulative methane yields and (B) cumulative methane yields per volume at different TS contents. Note: Different lowercase letters indicate significant differences between treatments at p < 0.05.
Agronomy 15 01610 g003
Figure 4. Changes in the final (A) pH, (B) TAN, (C) total VFAs, (D) ALK, and (E) VFA/ALK ratio under different TS concentrations.
Agronomy 15 01610 g004
Figure 5. The relative abundance of (A) bacteria and (B) archaea on the initial and peak period.
Agronomy 15 01610 g005
Figure 6. Venn diagram of microbial community: (a) bacteria and (b) archaea. The Shannon index of the (c) bacteria and (d) archaea. Different lowercase letters above the bars indicate statistically significant differences among treatments (p < 0.05).
Agronomy 15 01610 g006
Figure 7. Principal component analysis of bacteria and archaea in anaerobic co-digestion systems: (a) bacteria and (b) archaea.
Agronomy 15 01610 g007
Table 1. Setups of anaerobic co-digestion at different TS contents.
GroupTreatmentTS (%)
Low TSH16
H28
H310
Medium TSH412
H515
H618
High TSH720
H822
H925
Disclaimer/Publisher’s Note: The statements, opinions and data contained in all publications are solely those of the individual author(s) and contributor(s) and not of MDPI and/or the editor(s). MDPI and/or the editor(s) disclaim responsibility for any injury to people or property resulting from any ideas, methods, instructions or products referred to in the content.

