Article

Evaluation of the Effect of Different Soil Surface Treatments in the Vineyard Inter-Row on the CO2 Emissions

1
Department of Horticultural Machinery, Faculty of Horticulture, Mendel University in Brno, Valtická 337, 691 44 Lednice, Czech Republic
2
Czech Agrifood Research Center, Drnovská 507/73, 161 00 Praha 6—Ruzyně, 161 00 Praha, Czech Republic
3
Department of Breeding and Propagation of Horticultural Plants, Faculty of Horticulture, Mendel University in Brno, Valtická 337, 691 44 Lednice, Czech Republic
4
Faculty of Technical Sciences, University of Warmia and Mazury in Olsztyn, Michala Oczapowskiego 11, 11-729 Olsztyn, Poland
*
Author to whom correspondence should be addressed.
Agronomy 2025, 15(7), 1611; https://doi.org/10.3390/agronomy15071611
Submission received: 17 May 2025 / Revised: 19 June 2025 / Accepted: 27 June 2025 / Published: 1 July 2025
(This article belongs to the Section Soil and Plant Nutrition)

Abstract

In recent years, increasing efforts have been directed towards reducing greenhouse gas emissions from agriculturally managed soils to mitigate their negative environmental impacts. The total emissions released are influenced by the chosen farming practices, including soil surface treatment methods. While numerous studies have focused on arable cropping systems, research in permanent crops, such as vineyards, remains limited. For this reason, our study aimed to assess the effects of different soil surface management strategies in vineyard inter-rows on CO2 emissions. Five treatments were examined: cultivation to a depth of 70 mm (C70); cultivation to a depth of 150 mm (C150); compost application (50 t·ha−1) incorporated into the soil at 150 mm depth (C+C150); mulching with plant residues left on the soil surface (M) and an untreated control (Co). Results from two-year measurements indicated the highest CO2 emissions in the C+C150 treatment (42–76% higher) and C150 (34–53% higher) compared to the control (Co). The impact of soil surface treatment on CO2 emissions is further substantiated by cumulative values recorded over 120 days, ranging from 11–24 g C-CO2·m−2·h−1, corresponding to 9.64–21.03 Mg C-CO2·ha−1·y−1.

1. Introduction

The United Nations’ Sustainable Development Goals (SDGs) provide a framework encompassing 17 themes for the 2015–2030 period. Goal 13: Climate Action focuses on urgent action to combat climate change and mitigate its negative effects. Climate change primarily results from human activities, including fossil fuel combustion, land-use changes, and industrial processes [1]. These factors contribute to global warming, glacial melting, sea levels rising, increased extreme weather events, and ecosystem disruptions [2].
A significant source of greenhouse gas (GHG) emissions is agricultural soil. Numerous studies have sought to identify farming practices that can reduce soil-derived GHG emissions [3,4,5,6]. Plants release CO2 through root respiration, while soil macro-, meso-, and microfauna contribute to CO2 fluxes to sustain their metabolic needs [7,8].
Viticulture is among the most widespread horticultural sectors in Europe, with vineyard areas covering approximately 3.2 million hectares [9]. Vineyard management systems include conventional, integrated, and organic farming, each employing distinct inter-row soil management strategies [10,11]. The chosen soil treatment method and operational frequency significantly influence GHG emissions. Studies indicate that soil physicochemical and biological properties also affect soil GHG fluxes [12,13].
In recent decades, vineyard soil management has undergone a notable shift, particularly in response to concerns about climate change mitigation and soil degradation. Traditional deep tillage is increasingly being replaced by reduced or no-till practices to improve soil structure, reduce erosion and enhance carbon sequestration [14,15].
Cover crops, both spontaneous and sown, play a central role in vineyard inter-row management. These crops contribute to improved soil aggregation and infiltration, as well as suppressing erosion, while also competing with the vines for water and nutrients [16,17]. The selection of cover crop species (e.g., legumes versus grasses), their management (e.g., mowing or incorporation) and regional climatic conditions all influence the resulting soil biochemical processes and greenhouse gas (GHG) fluxes [18].
Importantly, inter-row management can indirectly affect vine growth and grape yield. Studies have shown that reduced tillage and permanent vegetation cover can limit vegetative vigour due to competition for water in drier climates, but may lead to more balanced vine growth and improved grape quality in temperate regions [19,20]. These interactions are particularly relevant when assessing the sustainability of viticulture.

1.1. Physical Soil Properties

Soil texture, porosity, water-holding capacity, and temperature are critical determinants of GHG emissions [21,22,23]. These parameters influence microbial activity, organic matter decomposition, and water and air dynamics in the soil. Fine-textured, clay-rich soils typically exhibit lower permeability, leading to higher water saturation and anaerobic conditions, which favour methane (CH4) production [24,25]. Conversely, sandy soils allow greater aeration, promoting aerobic respiration and increased CO2 emissions [26]. Soil porosity and permeability regulate oxygen availability in the soil profile. Greater porosity enhances aeration, reducing anaerobic processes responsible for CH4 and nitrous oxide (N2O) production [27,28]. In contrast, soil compaction or excessive irrigation can limit gas diffusion, elevating N2O emissions via denitrification [29]. Water-holding capacity also strongly affects GHG production. High water retention promotes anaerobic conditions conducive to CH4 emissions, while well-drained soils generally produce less CH4 but higher CO2 emissions due to enhanced microbial respiration.
Soil temperature is another influential factor in GHG emissions, affecting microbial metabolism and biochemical processes such as nitrification and denitrification. Elevated temperatures accelerate organic matter decomposition and microbial respiration, leading to increased CO2 and CH4 fluxes, particularly under anaerobic conditions [30]. Research shows that the effect of temperature on microbial processes is often non-linear and can be modified by other edaphic factors [31]. For instance, in extremely dry or wet conditions, an increase in temperature may not result in the anticipated rise in emissions, potentially even suppressing microbial activity [8]. Studies show that different soil management practices and climatic conditions can significantly alter GHG emission rates. Soil compaction further exacerbates emission rates by restricting water infiltration and gas exchange [32]. Impaired gas diffusion fosters anaerobic conditions, enhancing denitrification and associated N2O emissions [33,34].

1.2. Chemical Soil Properties

Chemical properties, including soil organic carbon content, pH, nitrogen levels, and other elemental compositions, significantly influence GHG emissions [35,36]. Higher organic matter concentrations enhance microbial activity, increasing CO2 emissions via organic matter decomposition. Microbial degradation of organic carbon is particularly pronounced at elevated temperatures and under well-aerated conditions [37].

1.3. Biological Soil Properties

Soil microbial respiration is a key determinant of GHG fluxes, largely influenced by soil moisture and oxygen availability [26,38,39]. Microbial metabolism converts soil organic carbon into CO2 and nitrogenous compounds into N2O [8]. The chosen inter-row soil treatment method affects microbial biomass and activity [40]. Young vineyards typically undergo shallow tillage in the initial 3–4 years to minimize weed competition and improve water infiltration. In mature vineyards, inter-row vegetation cover is common, either spontaneous or managed [41]. Liebhard et al. and Lipiec et al. [41,42] observed increased emissions in soils with higher organic matter content under temperate climate conditions, where inter-row vegetation contributed to higher soil moisture and biological activity. This potentially created favourable conditions for denitrification. The study also suggests that differences in emissions may depend on the type of vegetation, management intensity, and local climatic conditions. However, inter-row vegetation is not limited to spontaneous weed growth or grass covers; it also includes deliberately sown cover crops, which are increasingly used in modern viticulture to improve soil structure, enhance water infiltration and support biodiversity. However, inter-row vegetation encompasses more than just spontaneous weed growth or grass covers; it also includes deliberately sown cover crops, which are increasingly being used in modern viticulture to improve soil structure, enhance water infiltration and support biodiversity. The impact of cover crops on greenhouse gas emissions varies depending on the species of plant used, how they are managed (e.g., mowing or incorporation into the soil) and local conditions. Some studies suggest that carefully selected cover crops can reduce N2O emissions and increase soil carbon sequestration. [43,44].
This study aims to evaluate the impact of different vineyard inter-row soil management strategies on CO2 emissions, with the goal of identifying practices that result in lower greenhouse gas emissions under Central European conditions.

2. Materials and Methods

2.1. The Hypothesis

The hypothesis assumes that the different methods of soil surface treatment in the vineyard inter-rows have a statistically significant effect on CO2 emissions.

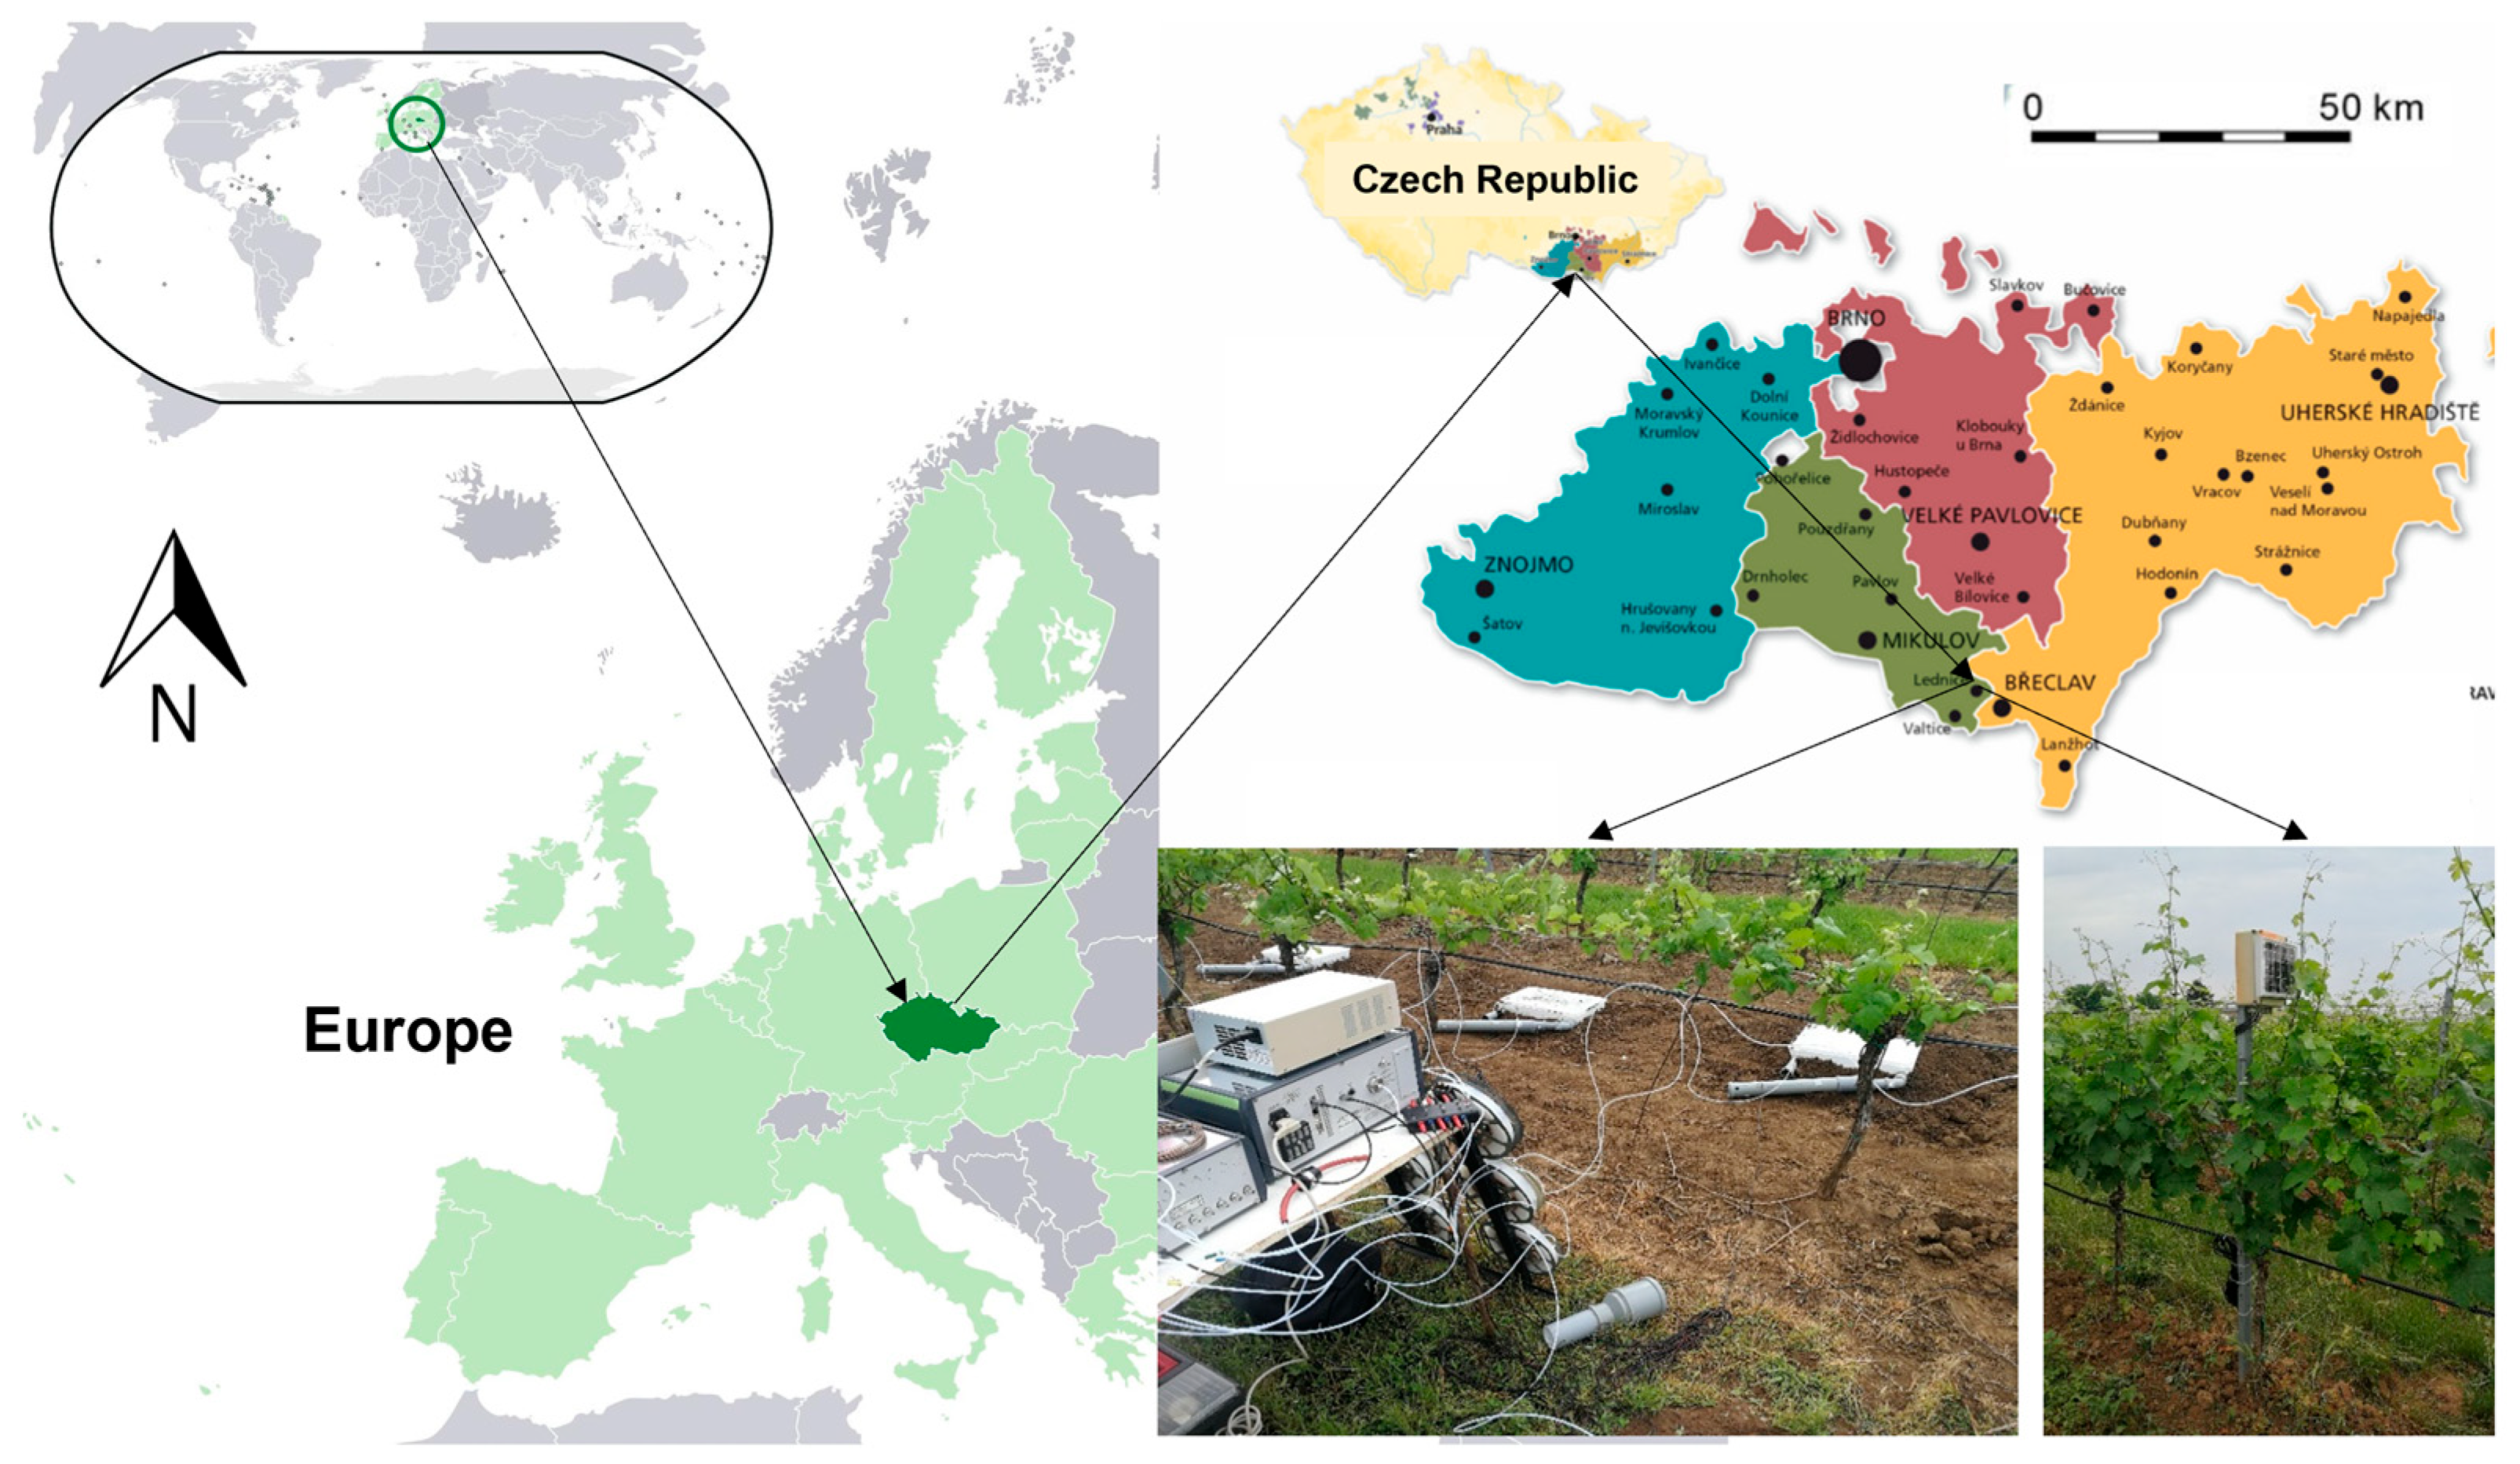
2.2. Description of the Experimental Site

Experimental measurements were conducted in 2023 and 2024 under the environmental conditions of the South Moravian region in the Czech Republic. The study site (coordinates: 48° 47′ 30″ N, 16° 47′ 56″ E) is located 1.5 km southwest of the village of Lednice, in the vineyard block “Na Valtické” (Figure 1).
The region is classified as a T4 warm climatic zone, characterised by a very warm and dry climate with a moderately dry winter. The long-term mean annual temperature is 9 °C, while the average annual precipitation is approximately 500 mm. The climatic conditions during the experimental period are detailed in Figure 2 and Figure 3. The average relative humidity is around 80%. Soil temperature and moisture were recorded at each sampling point to help interpret CO2 flux trends. However, due to the limited number of measurement events and the study’s focus on treatment-related differences, correlation and regression analyses were not performed on these variables. The dominant soil types are modal black soil and carbonate black soil, with loess as the parent material. The soil texture is loamy-sandy, classified as medium-heavy, with no skeletal content, high depth, and a predominantly favourable water regime. The topsoil depth ranges between 0.3 and 0.4 m, while the groundwater table is located at a depth of 0.9 to 1.2 m. The vineyard block is situated on level terrain.

2.3. Characteristics of the Experimental Vineyard

The vineyard under study is 15 years old and is established in a high-training system with a single curtain. The total vineyard area is 2.0 ha. The experimental research focused on the white grape variety Vitis vinifera L. cv. Veltliner, grafted onto Kober 5BB rootstock. The vineyard is planted in a spacing pattern of 2.3 × 0.9 m, employing a grass cover in every alternate inter-row. The trellis system consists of steel posts, and the vine canopy reaches a total height of 1.8 m. For the purpose of measurements, two vine rows were selected from the central part of the vineyard block to minimize environmental variability. One inter-row was maintained with natural vegetation, while the other was cultivated and kept weed free. From a phytocoenological perspective, the natural vegetation cover consisted predominantly of common species of perennial and annual grasses, as well as dicotyledonous weeds. The main species present were as follows: Lolium perenne L., Poa pratensis L., Festuca rubra L., Trifolium repens L., Taraxacum officinale F.H. Wigg., and Capsella bursa-pastoris (L.) Medik. The average amount of aboveground fresh biomass at the time of mulching was approximately 0.8 t·ha−1, equivalent to 0.8 kg·m−2. Phenologically, the vegetation was in full growth phase at the time of intervention (end of May), with flowering and vegetative stages predominant. Mulching was carried out using a standard tractor-mounted mulcher. The cut plant material was left on the soil surface and was not subsequently removed or harvested.
The study examined the effects of different soil treatments on CO2 emissions. The experimental setup consisted of five treatments, each with three replicates, covering an area of 23 m2 (2.3 × 10 m):
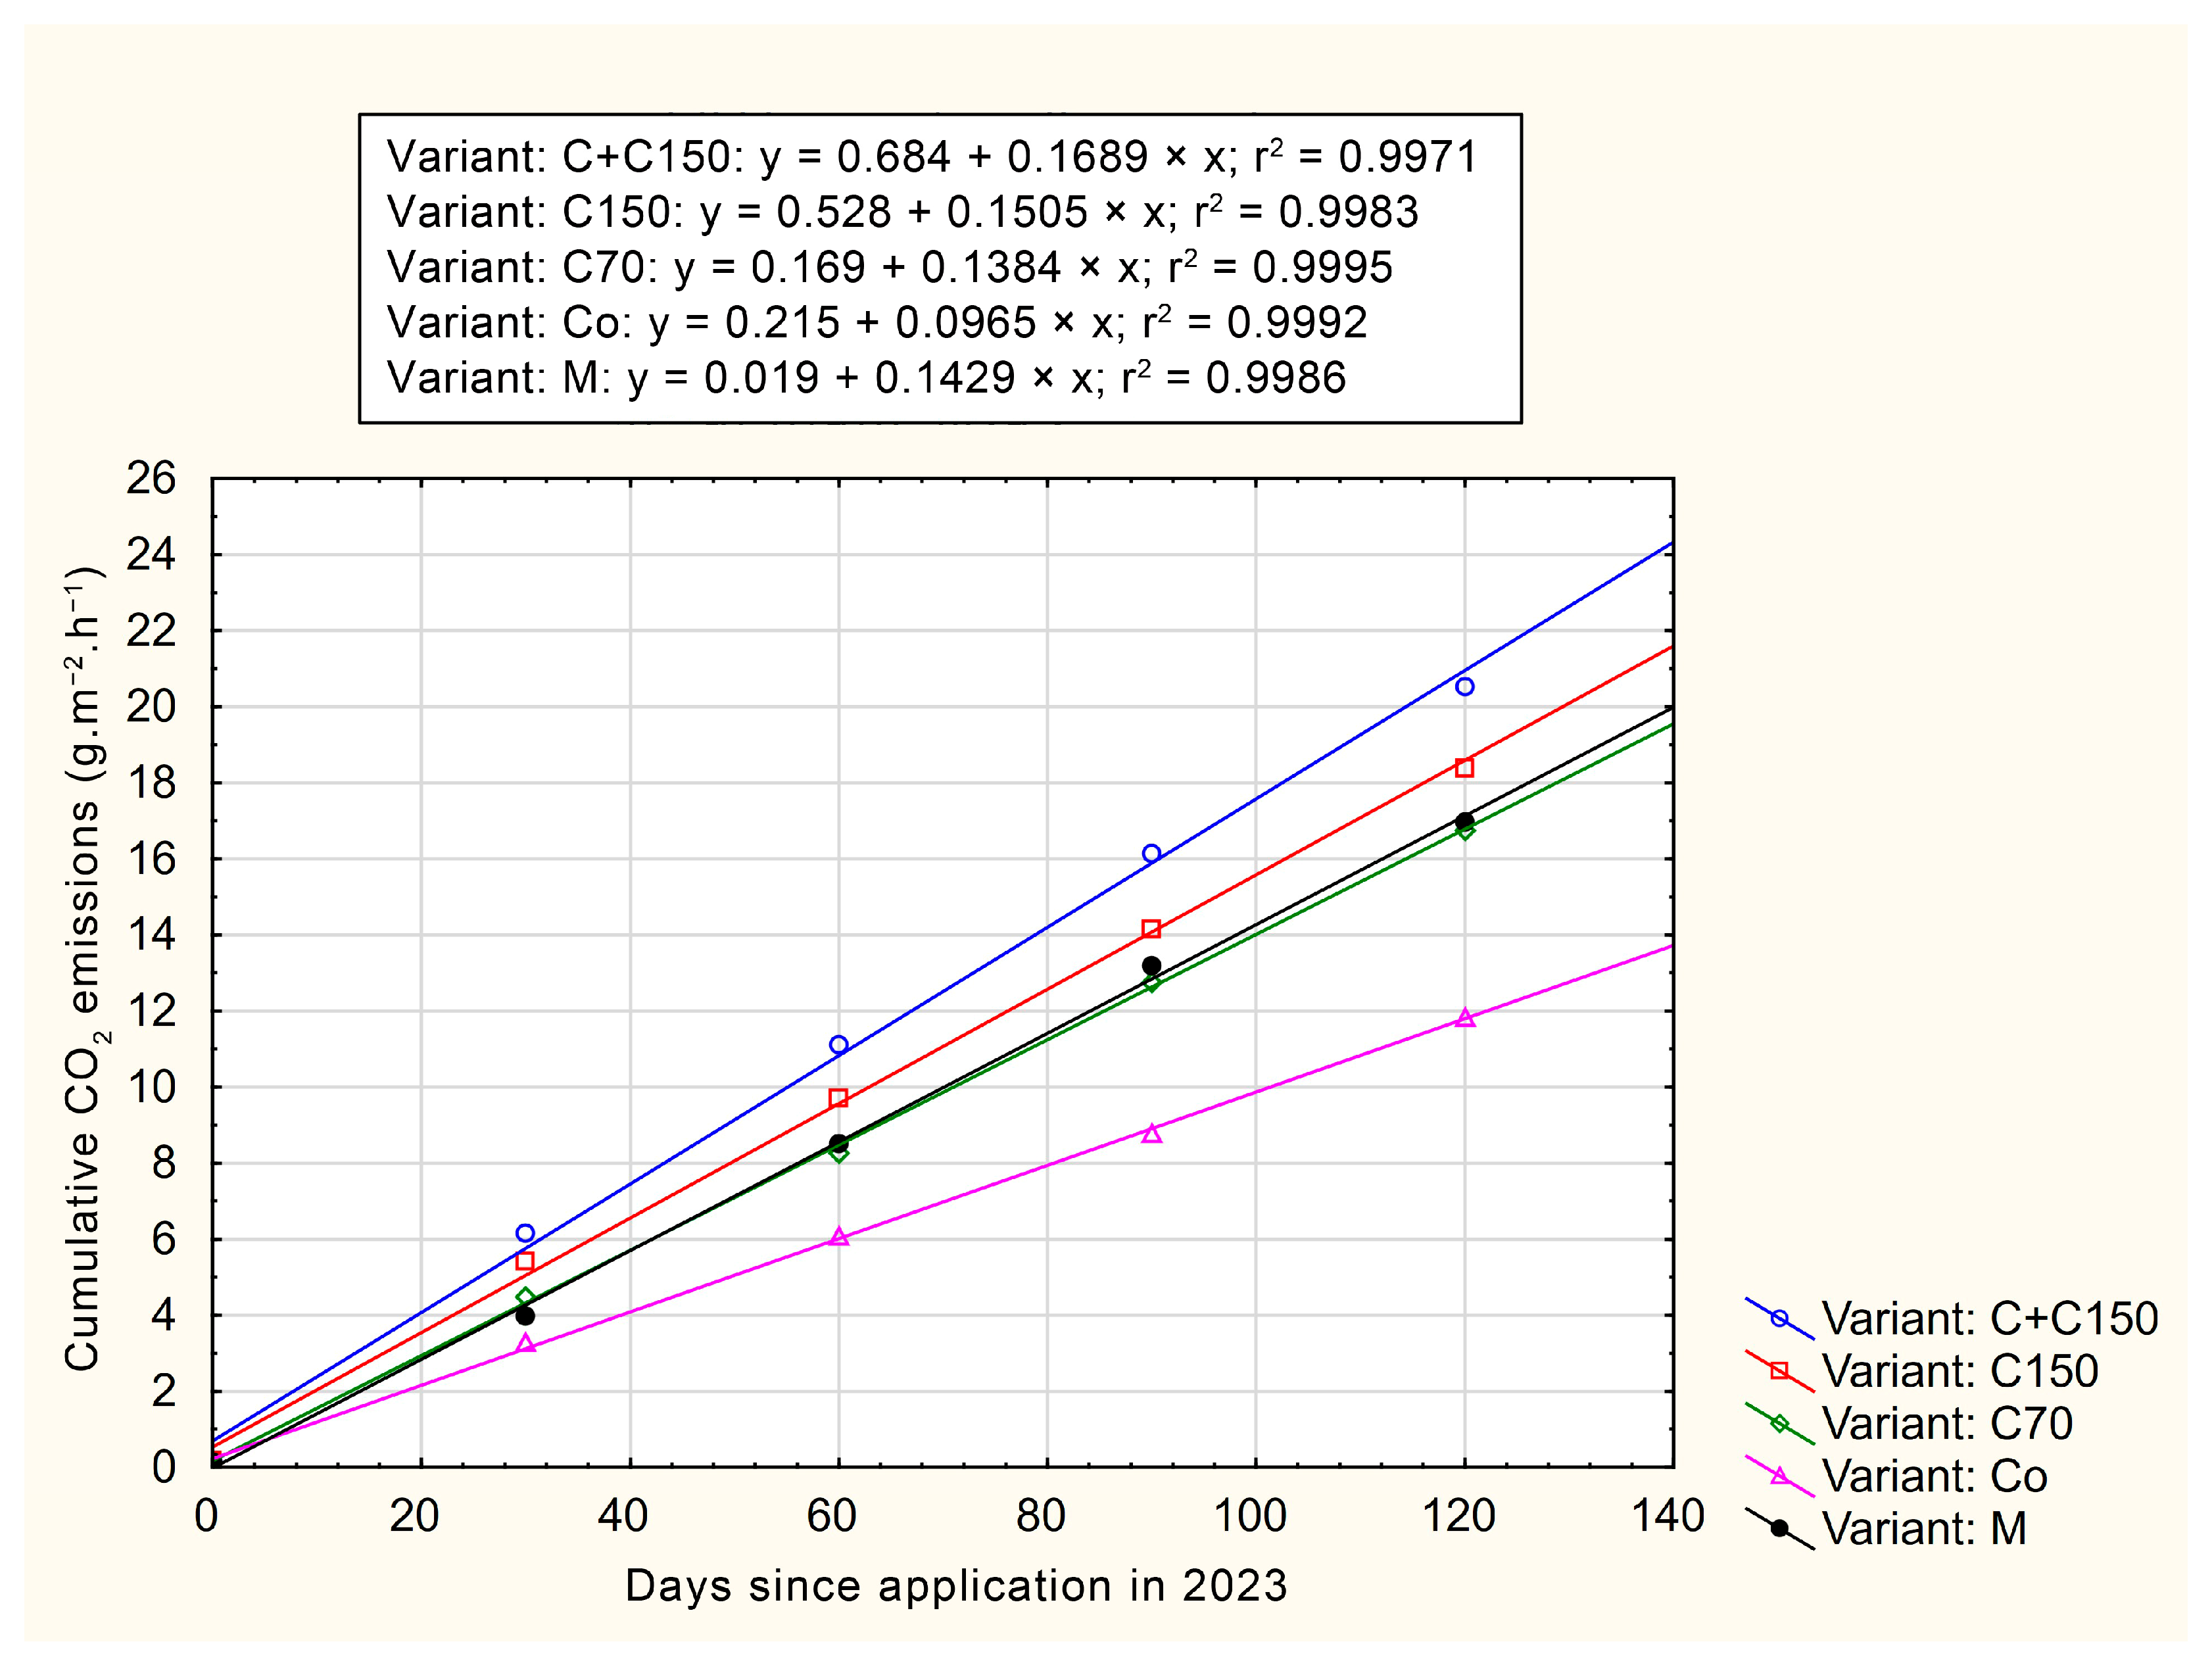
  • Var.1 (C70): Shallow cultivation to a depth of 70 mm;
  • Var.2 (C150): Deep cultivation to a depth of 150 mm;
  • Var.3 (C+C150): Compost application (50 t·ha−1) incorporated to a depth of 150 mm;
  • Var.4 (M): Mulching of plant cover, with mulch retained on the soil surface;
  • Var.5 (Co): Control treatment with no soil cultivation, fertilization, or plant cover modification; managed with herbicide application.
The fifteen experimental plots (5 treatments × 3 replicates) were arranged in a randomized complete block design (RCBD) to account for potential spatial variability within the vineyard. Each block included one replicate of each treatment, and the blocks were distributed along the central part of the vineyard to minimise environmental gradients (e.g., soil heterogeneity, microclimate variation, etc.). To reduce edge effects, the experimental plots were positioned at least one full inter-row distance from the vineyard margins and adjacent roadways. Additionally, the two vine rows selected for measurement were flanked by buffer rows that were not included in the experiment. There were no significant drainage patterns or artificial water flows present in the study area. The site has a relatively uniform slope and soil texture, and drainage was not expected to cause plot-specific bias.
The compost used in treatment Var.3 (C+C150) was mature, plant-based, and produced through the aerobic fermentation of green waste (primarily grass matter, grape pomace and wood chips from pruning). The compost was free of contaminants and complied with national standards for agricultural use. It was applied at a rate of 30 t·ha−1 (fresh weight) and incorporated into the soil to a depth of 150 mm using a disc harrow. The compost was applied in spring (April), prior to the onset of the main growing season.
The basic characteristics of the compost were as follows:
  • Dry matter content: ~40%;
  • Organic matter: ~65% (of dry matter);
  • Total nitrogen: 1.2% (of dry matter);
  • C/N ratio: approximately 15:1;
  • pH (H2O): 7.3.

2.4. Soil Property Assessment

Soil samples were collected in April 2023 and 2024 to evaluate their physical and chemical properties. Samples were taken from the centre of the inter-row to eliminate the influence of soil compaction in wheel tracks.

2.5. Physical Properties

Bulk density, total porosity, instantaneous water and air content, maximum capillary water capacity, and minimum air capacity were determined using Kopecky’s cylinders [45]. Samples were collected from two depths (0.00–0.15 m and 0.15–0.30 m) with three replicates per depth.

2.6. Chemical Properties

Soil samples from five locations at depths of 0.00–0.15 m and 0.15–0.30 m were homogenised and analysed according to Mehlich III extraction for phosphorus (P), potassium (K), magnesium (Mg), and calcium (Ca). Exchangeable soil pH was measured potentiometrically in a KCl extract, and oxidisable carbon content (Cox) was determined via oximetric titration Nelson and Sommer [46].

2.7. Measurement of CO2 Emissions from Soil

Greenhouse gas emissions were measured using the INNOVA 1512 photoacoustic gas analyser (LumaSense Technologies GmbH, Frankfurt am Main, Germany). During measurements, gas was drawn from the sampling point through an inlet filter into the analyser’s measuring chamber by an internal pump. After sufficient flushing with sampled air for 1 min, the chamber was sealed using solenoid valves. Infrared radiation, intermittently interrupted by a mechanical screen, passed for 5 s through an optical filter with a wavelength specific to the monitored gas. The gas molecules absorbed the radiation energy, altering their molecular kinetic energy. As the infrared radiation was periodically interrupted, the kinetic energy of the molecules oscillated, inducing periodic pressure changes within the chamber. These pressure fluctuations, proportional to the concentration of the monitored gas, were detected by built-in measuring microphones. The signal was processed electronically, and the calculated gas concentration was stored in the device. Once the gas analysis was complete, the carousel with optical filters rotated to the next position, allowing measurement of another gas. The INNOVA 1512 analyser is capable of simultaneously measuring concentrations of up to five gases, with an additional sixth filter for water vapor to compensate for humidity effects.
For the experimental measurements, the analyser was equipped with filters for CO2 concentration determination. The instrument is characterised by long-term stability, high accuracy, and a concentration measurement range up to 1:10,000. The resolution for CO2 is 5 ppm, with a sampling interval of approximately one minute. Despite its high performance, the instrument is compact and robust, making it well-suited for field applications. Multiple sampling points were connected to the INNOVA 1512 via the INNOVA 1409 multipoint sampler, which cyclically switched between sampling tubes, ensuring that all gases were analysed by a single instrument. This approach minimised measurement errors associated with the variability of multiple independent analysers. Measurements were conducted during daylight hours, typically between 08:00 and 18:00, in order to capture the period of peak soil biological activity and gas flux. The gas sampling system was allowed to stabilise for approximately one minute prior to each reading to ensure signal accuracy and consistency. The measurement chambers were static (closed), enabling the detection of temporal changes in gas concentration within a defined headspace volume. Depending on the total number of chambers connected, the analyser cycled through all sampling points every 15 min.
The experiment was conducted in chambers measuring 400 × 600 mm and with an effective height of 140 mm, with a constant airflow maintained over the soil surface throughout the measurement period. During measurements, each chamber was embedded into the soil at a depth of 50 mm. Airflow through the chambers was regulated using fans with adjustable speeds. Fans were positioned at the inlet openings, while air samples were collected at the outlet openings for analysis. The airflow through the chamber was set to 4 L/s, corresponding to a flow rate of 14.4 m3/h. The air velocity above the soil surface was 0.6 m/s. A complete air exchange within the chamber occurred every 8.4 s. For the emission calculations, gas concentration values measured in the sampling chambers were corrected by subtracting the gas concentrations in the outside air, which was blown into the chambers by the fans.
Various methodologies suggest continuous year-round measurements at intervals of 7–10 days, though longer intervals of 15–30 days are permissible based on previous studies [47,48]. Given the number of experimental variants, the frequency of measurements, and the lack of an automated system for large-scale experimental coverage, five measurement dates were selected annually. An overview of the measurement dates and their correspondence to vine phenological stages, based on the BBCH scale, is provided in Table 1.
Measured emissions were expressed in g C-CO2·m−2·h−1 and as cumulative g C-CO2·m−2 over time. The cumulative emission value was calculated using the Wilson and Al-Kaisi [48] equation:
C O 2 C k g h a 1 = n = i a s t i = f i r s t x i + x i + 1 N + x i + x i + 2 N + + x i + n N
where
  • i is the first week of the growing season when the first CO2 rate was measured;
  • n is the last week of the growing season when the last CO2 rate was measured;
  • x is CO2 rate (g·m−2·h−1);
  • N is the number of days between two consecutive CO2 rate measurements.

2.8. Statistical Analysis

Specifically, soil CO2 emissions were measured both as instantaneous emission rates (g C-CO2·m−2·h−1) and cumulative emissions over the growing season (g C-CO2·m−2). Instantaneous measurements were taken at five time points (t1–t5) during each growing season (2023 and 2024), across five treatment variants (C70, C150, C+C150, M, Co). Cumulative emissions were calculated according to the method proposed by Wilson and Al-Kaisi [48], integrating the emission rate over time intervals between measurements. Prior to analysis, data were tested for normality using the Shapiro–Wilk test and for homogeneity of variances using Levene’s test. A one-way ANOVA with replication was conducted at each time point to assess differences among treatment variants, followed by Tukey’s Honestly Significant Difference (HSD) test at a significance level of p ≤ 0.05. Results are reported as means ± standard deviation. All analyses were carried out using Statistica 14.0 (TIBCO Software Inc., Palo Alto, CA, USA).

3. Results and Discussion

The physical and chemical properties of the soil at the experimental site are summarised in Table 2 and Table 3.
Table 2 outlines the soil’s physical properties in spring, revealing compaction throughout the profile (up to 0.30 m depth), indicated by elevated bulk density values [49]. High compaction levels were further supported by low porosity values in the vineyard inter-rows. The year-on-year decrease in bulk density and increase in total porosity may be influenced by a combination of factors, including differences in management practices, particularly in the depth and intensity of soil tillage [15], as well as climatic conditions such as varying precipitation totals and temperatures during the growing season [50]. Increased porosity combined with lower bulk density indicates improved conditions for water infiltration capacity and better soil aeration, which can have a positive effect on root system growth and microbial processes [51]. Maximum capillary water capacity was determined using Kopecky’s cylinders after water saturation and 24 h of free drainage under laboratory conditions [45]. The critical threshold indicating the onset of structural degradation was set at >40% vol., in accordance with Hůla et al. [52] and similar studies on loamy soils under compaction stress.
Table 3 presents the average values of selected soil chemical parameters determined in the experimental sites. When compared with critical threshold values, the total nitrogen content can be classified as medium to well-supplied, phosphorus content as good to very high, potassium content as good to very high, magnesium content as good to high, and calcium content as good. The soil reaction is neutral, and the oxidisable carbon content (Cox) is low.
The average CO2 emissions measured for each experimental variant during the monitoring period (T1–T5) in 2023 and 2024 are presented in Table 4. The 2023 growing season was characterised by higher precipitation, particularly in May (V), August (VIII), and September (IX). In March (III) of the same year, compost was applied at a rate of 50 t·ha−1 and incorporated into the soil to a depth of 150 mm (C+C150). As shown in Table 4, these conditions influenced the total CO2 emissions.
The highest CO2 production was recorded for the C+C150 variant, with emissions significantly exceeding those of the control variant (Co), demonstrating an increase of 87–89%. Among the other treatments, CO2 emissions were also high in the C150 and C70 variants, where soil disturbance occurred due to cultivation throughout the growing season. By contrast, lower CO2 emissions were observed in the M variant, where the grassed inter-row was mulched. The lowest emissions overall were recorded in the control variant.
The 2024 growing season exhibited a different precipitation pattern, with higher precipitation in May (V), June (VI), and September (IX), while July (VII) and August (VIII) experienced below-average precipitation. A notable decrease in CO2 emissions was recorded during August (VIII). The highest emission values were measured for the C+C150 and M variants, whereas the lowest values were recorded for the unfertilised control variant Co. This contrasts with the previous year, when the M variant exhibited reduced CO2 emissions in line with expectations for mulched systems. The increase in emissions observed in 2024 may be attributed to the higher precipitation recorded during the early and late parts of the growing season. This likely enhanced microbial activity and the decomposition of grass mulch in the inter-row area. This process can temporarily elevate soil CO2 fluxes, as reported by Rogovska et al. [53]. These results highlight the significant impact of seasonal weather variations and the turnover of organic matter on soil respiration dynamics.
The results indicate that soil CO2 emissions are influenced by multiple factors, primarily the method of soil surface management, soil moisture and temperature, and the developmental stage of the vines. Quantifying the impact of these factors is essential for addressing uncertainties related to spatial and temporal variations in CO2 emissions from soil at both small and large scales.
Several authors, such as Sosulski and Korc [54], Smith et al. [55], and Sosulski et al. [56], have reported that the adoption of reduced tillage techniques leads to a significant reduction in CO2 emissions compared to conventional tillage practices. This reduction is primarily attributed to the lower levels of organic matter and readily mineralizable organic compounds in soils. Similarly, Smith et al. [55] observed that conventional tillage methods, particularly those employing conventional tillage tools, result in higher CO2 emissions compared to minimal tillage techniques. In such cases, CO2 emissions are predominantly associated with the mineralization of crop residues, which remain on the soil surface in reduced tillage systems, whereas in conventional tillage systems, these residues are incorporated into the soil through ploughing.
The magnitude of CO2 emissions is determined by several interrelated factors, including organic carbon content, soil temperature and moisture, microbial activity, and the method and intensity of soil cultivation. Rogovska et al. [53] found that soil cultivation significantly influences microbial respiration, with pronounced effects during the spring and summer months. This microbial activity is further amplified following manure application, leading to increased CO2 fluxes.
Figure 4 and Figure 5 illustrate cumulative CO2 emissions, expressed in g C-CO2·m−2·h−1, as a function of time since the initiation of measurements. Both graphs indicate that the highest cumulative CO2 emissions were observed in the C+C150 variant. Over a 120-day period, the cumulative CO2 emission values for each variant range from 11 to 24 g C-CO2·m−2·h−1, which, when recalculated, correspond to 9.64–21.03 Mg C-CO2·ha−1·y−1. These values represent the means of three replicates per treatment and are intended to illustrate cumulative trends rather than to provide statistical comparisons at each time point.
In both years, the highest values are achieved by the variant using the application of compost with a depth of 150 mm. On the other hand, the lowest values were measured for the CO control variant (9.64 Mg C-CO2·ha−1·y−1). When comparing the two variants, the difference was up to 118%. These values correspond to those reported by Zumkeller et al. [57] for conventionally treated vineyard conditions in Oakville, CA, USA. The cumulative CO2 emission values observed in this study ranged from 9.64 to 21.03 Mg C-CO2·ha−1·y−1, which falls within the lower third of the broad range reported in the literature (e.g., Rutkowska et al. [58] reported 1.8–47.2 Mg C-CO2·ha−1·y−1).
This narrower and lower range of values can be explained by several site-specific and methodological factors. Firstly, the experiment was conducted on loamy soils with moderate organic carbon content, whereas Rutkowska et al. [58] included a wide spectrum of soil types, including sandy and organic soils, which tend to exhibit greater variability and extremes in CO2 emissions. Secondly, our study was situated in a temperate Central European climate with relatively stable temperature and moisture regimes. In contrast, the wider literature includes measurements from different climate zones where freeze–thaw cycles, drought–rewetting events, and more intense precipitation may lead to sharp emission peaks.
Additionally, the vineyards in this study were managed with relatively low-intensity soil disturbance and without the application of high doses of organic amendments (except for one treatment), which limits microbial decomposition and associated CO2 fluxes.
Unlike studies that employed continuous, high-frequency measurements throughout the entire year, our measurements focused on five phenologically relevant points during the vegetation period. This approach may have missed short-term flux spikes driven by extreme weather or management events. Consequently, while our emission estimates are robust under standard growing conditions, they do not capture the full range of variability possible under different climates or soil types.

4. Conclusions

This paper has assessed CO2 emissions in vineyard intercropping under Central European conditions over a two-year period (2023–2024). Five variants of soil surface treatment were investigated in the experiments carried out: cultivation to a depth of 70 mm (C70); cultivation to a depth of 150 mm (C150); application of compost (dose of 50 t·ha−1) with incorporation to a depth of 150 mm (C+C150); mulching of the plant cover leaving the mulch on the surface area (M) and an unfertilised control variant (Co). The results confirmed that intensive tillage combined with organic inputs significantly increases CO2 emissions, particularly during the warm summer months.
However, the study also revealed variability between years: while mulching reduced emissions in 2023, this treatment resulted in higher emissions in 2024, likely due to altered precipitation and temperature patterns. These findings suggest that the emission potential of each treatment depends on the interaction between soil management and weather conditions.
From a practical vineyard management perspective, treatments involving minimal soil disturbance, such as mulching or shallow cultivation (C70), appear to be more effective at reducing CO2 emissions while maintaining soil structure and moisture. Although beneficial for soil fertility, compost application may cause temporary emission spikes and should therefore be timed carefully, particularly in wet years.
These results highlight the importance of integrating emission monitoring with broader soil health indicators (e.g., SOC, compaction and root development) and vine performance data (e.g., yield and vigour). Future research should explore these links more explicitly.
Furthermore, adopting precision viticulture tools, such as remote sensing to track changes in soil organic carbon and vine responses, can support site-specific management that balances productivity with carbon mitigation.
In conclusion, the inter-row soil management strategy should be tailored not only for erosion control and fertility, but also for optimising the carbon footprint. Monitoring should be extended to include rutting zones and automated year-round sampling to improve understanding of seasonal emission dynamics. Taking these steps will contribute to climate-smart vineyard management and support the wine sector’s progress towards carbon neutrality.

Author Contributions

Conceptualization, P.B. and V.M.; methodology, M.Č. and P.Z.; software, M.Č. and P.Z.; validation, A.L., P.B. and P.M.; formal analysis, V.M.; investigation, J.J. and J.B.; resources, J.J., J.B. and V.M.; data curation, J.J. and J.B.; writing—original draft preparation, P.B. and V.M.; writing—review and editing, P.M., V.M. and P.B.; visualization, A.L. and P.M.; supervision, A.L. and M.Č.; project administration, P.B.; funding acquisition, P.Z. All authors have read and agreed to the published version of the manuscript.

Funding

This research was funded by the grant No. IGA-ZF/2023-ST2-010 of the Grant Agency of the Faculty of Horticulture at Mendel University in Brno and by the project CZ.02.1.01/0.0/0.0/16_017/0002334 Research Infrastructure for Young Scientists, co-financed by Operational Programme Research, Development and Education and within the institutional support MZE-RO0425 by the Ministry of Agriculture of the Czech Republic for the long-term conceptual development of the Czech Agrifood Research Center.

Data Availability Statement

Data are contained within the article.

Conflicts of Interest

The authors declare no conflicts of interest.

References

  1. Rounsevell, M.D.A.; Reay, D.S. Land use and climate change in the UK. Land Use Policy 2009, 26, S160–S169. [Google Scholar] [CrossRef]
  2. Bolan, S.; Padhye, L.P.; Jasemizad, T.; Govarthanan, M.; Karmegam, N.; Wijesekara, H.; Amarasiri, D.; Hou, D.; Zhou, P.; Biswal, B.K.; et al. Impacts of climate change on the fate of contaminants through extreme weather events. Sci. Total Environ. 2024, 909, 168388. [Google Scholar] [CrossRef] [PubMed]
  3. Behnke, G.D.; Zuber, S.M.; Pittelkow, C.M.; Nafziger, E.D.; Villamil, M.B. Long-term crop rotation and tillage effects on soil greenhouse gas emissions and crop production in Illinois, USA. Agric. Ecosyst. Environ. 2018, 261, 62–70. [Google Scholar] [CrossRef]
  4. Feng, Q.; An, C.; Chen, Z.; Wang, Z. Can deep tillage enhance carbon sequestration in soils? A meta-analysis towards GHG mitigation and sustainable agricultural management. Renew. Sustain. Energy Rev. 2020, 133, 110293. [Google Scholar] [CrossRef]
  5. Ogle, S.M.; Alsaker, C.; Baldock, J.; Bernoux, M.; Breidt, F.J.; McConkey, B.; Regina, K.; Vazquez-Amabile, G.G. Climate and Soil Characteristics Determine Where No-Till Management Can Store Carbon in Soils and Mitigate Greenhouse Gas Emissions. Sci. Rep. 2019, 9, 11665. [Google Scholar] [CrossRef]
  6. Shakoor, A.; Pendall, E.; Arif, M.S.; Farooq, T.H.; Iqbal, S.; Shahzad, S.M. Does no-till crop management mitigate gaseous emissions and reduce yield disparities: An empirical US-China evaluation. Sci. Total Environ. 2024, 917, 170310. [Google Scholar] [CrossRef]
  7. Balogh, J.; Papp, M.; Pintér, K.; Fóti, S.; Posta, K.; Eugster, W.; Nagy, Z. Autotrophic component of soil respiration is repressed by drought more than the heterotrophic one in dry grasslands. Biogeosciences 2016, 13, 5171–5182. [Google Scholar] [CrossRef]
  8. Butterbach-Bahl, K.; Baggs, E.M.; Dannenmann, M.; Kiese, R.; Zechmeister-Boltenstern, S. Nitrous oxide emissions from soils: How well do we understand the processes and their controls? Philos. Trans. R. Soc. B-Biol. Sci. 2013, 368, 13. [Google Scholar] [CrossRef]
  9. Eurostat. Vineyards in the EU—Statistics, Statistics Explained. Available online: https://ec.europa.eu/eurostat/statistics-explained/index.php?title=Vineyards_in_the_EU_-_statistics#million_hectares_of_vineyards_in_the_EU (accessed on 10 May 2024).
  10. Visconti, F.; López, R.; Olego, M.Á. The Health of Vineyard Soils: Towards a Sustainable Viticulture. Horticulturae 2024, 10, 154. [Google Scholar] [CrossRef]
  11. Ghiglieno, I.; Simonetto, A.; Facciano, L.; Tonni, M.; Donna, P.; Valenti, L.; Gilioli, G. Comparing the Carbon Footprint of Conventional and Organic Vineyards in Northern Italy. Sustainability 2023, 15, 5252. [Google Scholar] [CrossRef]
  12. Dencso, M.; Horel, A.; Bogunovic, I.; Tóth, E. Effects of Environmental Drivers and Agricultural Management on Soil CO2 and N2O Emissions. Agronomy 2021, 11, 54. [Google Scholar] [CrossRef]
  13. Gelybó, G.; Barcza, Z.; Dencső, M.; Potyó, I.; Kása, I.; Horel, Á.; Pokovai, K.; Birkás, M.; Kern, A.; Hollós, R.; et al. Effect of tillage and crop type on soil respiration in a long-term field experiment on chernozem soil under temperate climate. Soil Tillage Res. 2022, 216, 105239. [Google Scholar] [CrossRef]
  14. Lazcano, C.; Gonzalez-Maldonado, N.; Yao, E.H.; Wong, C.T.F.; Falcone, M.; Dodson Peterson, J.; Casassa, L.F.; Malama, B.; Decock, C. Assessing the Short-Term Effects of No-Till on Crop Yield, Greenhouse Gas Emissions, and Soil C and N Pools in a Cover-Cropped, Biodynamic Mediterranean Vineyard. Aust. J. Grape Wine Res. 2022, 8100818. [Google Scholar] [CrossRef]
  15. Ferreira, C.S.; Veiga, A.; Caetano, A.; Gonzalez-Pelayo, O.; Karine-Boulet, A.; Abrantes, N.; Keizer, J.; Ferreira, A.J. Assessment of the Impact of Distinct Vineyard Management Practices on Soil Physico-Chemical Properties. Air Soil Water Res. 2020, 13, 1178622120944847. [Google Scholar] [CrossRef]
  16. Celette, F.; Gary, C. Dynamics of water and nitrogen stress along the grapevine cycle as affected by cover cropping. Eur. J. Agron. 2013, 45, 142–152. [Google Scholar] [CrossRef]
  17. García-Díaz, A.; Marqués, M.J.; Sastre, B.; Bienes, R. Labile and stable soil organic carbon and physical improvements using groundcovers in vineyards from central Spain. Sci. Total Environ. 2018, 621, 387–397. [Google Scholar] [CrossRef]
  18. Steenwerth, K.; Guerra, B. Influence of floor management technique on grapevine growth, disease pressure, and juice and wine composition: A review. Am. J. Enol. Vitic. 2012, 63, 149–164. [Google Scholar] [CrossRef]
  19. Buesa, I.; Mirás-Avalos, J.M.; De Paz, J.M.; Visconti, F.; Sanz, F.; Yeves, A.; Guerra, D.; Intrigliolo, D.S. Soil management in semi-arid vineyards: Combined effects of organic mulching and no-tillage under different water regimes. Eur. J. Agron. 2021, 123, 126198. [Google Scholar] [CrossRef]
  20. Monteiro, A.; Lopes, C.M. Influence of cover crop on water use and performance of vineyard in Mediterranean Portugal. Agric. Ecosyst. Environ. 2007, 121, 336–342. [Google Scholar] [CrossRef]
  21. Ball, B.C. Soil structure and greenhouse gas emissions: A synthesis of 20 years of experimentation. Eur. J. Soil Sci. 2013, 64, 357–373. [Google Scholar] [CrossRef]
  22. Roy, A.; McCabe, B.Y.; Saxe, S.; Posen, I.D. Review of factors affecting earthworks greenhouse gas emissions and fuel use. Renew. Sustain. Energy Rev. 2024, 194, 114290. [Google Scholar] [CrossRef]
  23. Mäkipää, R.; Abramoff, R.; Adamczyk, B.; Baldy, V.; Biryol, C.; Bosela, M.; Casals, P.; Curiel Yuste, J.; Dondini, M.; Filipek, S.; et al. How does management affect soil C sequestration and greenhouse gas fluxes in boreal and temperate forests?—A review. For. Ecol. Manag. 2023, 529, 120637. [Google Scholar] [CrossRef]
  24. Conrad, R. Methane Production in Soil Environments-Anaerobic Biogeochemistry and Microbial Life between Flooding and Desiccation. Microorganisms 2020, 8, 881. [Google Scholar] [CrossRef] [PubMed]
  25. Shi, T.; Liu, W.; Yang, Y.; Liu, Y.; Li, M.; Liu, T.; Wu, Z.; Wang, Q. Low-Permeability Layered Clay Soil Hinders Organic Macromolecular Pollutant Migration in the Transition Zone of the Jianghan Plain–Dabie Mountain Area. Water 2024, 16, 1522. [Google Scholar] [CrossRef]
  26. Oertel, C.; Matschullat, J.; Zurba, K.; Zimmermann, F.; Erasmi, S. Greenhouse gas emissions from soils—A review. Geochemistry 2016, 76, 327–352. [Google Scholar] [CrossRef]
  27. Harrison-Kirk, T.; Thomas, S.M.; Clough, T.J.; Beare, M.H.; van der Weerden, T.J.; Meenken, E.D. Compaction influences N2O and N2 emissions from 15N-labeled synthetic urine in wet soils during successive saturation/drainage cycles. Soil Biol. Biochem. 2015, 88, 178–188. [Google Scholar] [CrossRef]
  28. Pulido-Moncada, M.; Petersen, S.O.; Munkholm, L.J. Soil compaction raises nitrous oxide emissions in managed agroecosystems. A review. Agron. Sustain. Dev. 2022, 42, 38. [Google Scholar] [CrossRef]
  29. Litskas, V.; Mandoulaki, A.; Vogiatzakis, I.N.; Tzortzakis, N.; Stavrinides, M. Sustainable Viticulture: First Determination of the Environmental Footprint of Grapes. Sustainability 2020, 12, 8812. [Google Scholar] [CrossRef]
  30. Hao, Y.; Mao, J.; Bachmann, C.M.; Hoffman, F.M.; Koren, G.; Chen, H.; Tian, H.; Liu, J.; Tao, J.; Tang, J.; et al. Soil moisture controls over carbon sequestration and greenhouse gas emissions: A review. npj Clim. Atmos. Sci. 2025, 8, 16. [Google Scholar] [CrossRef]
  31. Davidson, E.A.; Janssens, I.A. Temperature sensitivity of soil carbon decomposition and feedbacks to climate change. Nature 2006, 440, 165–173. [Google Scholar] [CrossRef]
  32. Capello, G.; Biddoccu, M.; Ferraris, S.; Cavallo, E. Effects of Tractor Passes on Hydrological and Soil Erosion Processes in Tilled and Grassed Vineyards. Water 2019, 11, 2118. [Google Scholar] [CrossRef]
  33. Bessou, C.; Mary, B.; Léonard, J.; Roussel, M.; Gréhan, E.; Gabrielle, B. Modelling soil compaction impacts on nitrous oxide emissions in arable fields. Eur. J. Soil Sci. 2010, 61, 348–363. [Google Scholar] [CrossRef]
  34. Hénault, C.; Grossel, A.; Mary, B.; Roussel, M.; Léonard, J. Nitrous Oxide Emission by Agricultural Soils: A Review of Spatial and Temporal Variability for Mitigation. Pedosphere 2012, 22, 426–433. [Google Scholar] [CrossRef]
  35. Della Chiesa, T.; Piñeiro, G.; Yahdjian, L. Gross, Background, and Net Anthropogenic Soil Nitrous Oxide Emissions from Soybean, Corn, and Wheat Croplands. J. Environ. Qual. 2019, 48, 16–23. [Google Scholar] [CrossRef] [PubMed]
  36. Fontaine, S.; Bardoux, G.; Abbadie, L.; Mariotti, A. Carbon input to soil may decrease soil carbon content. Ecol. Lett. 2004, 7, 314–320. [Google Scholar] [CrossRef]
  37. Karhu, K.; Alaei, S.; Li, J.; Merilä, P.; Ostonen, I.; Bengtson, P. Microbial carbon use efficiency and priming of soil organic matter mineralization by glucose additions in boreal forest soils with different C:N ratios. Soil Biol. Biochem. 2022, 167, 108615. [Google Scholar] [CrossRef]
  38. Han, X.; Doménech-Pascual, A.; Pere Casas-Ruiz, J.; Donhauser, J.; Jordaan, K.; Ramond, J.-B.; Priemé, A.; Romaní, A.M.; Frossard, A. Soil organic matter properties drive microbial enzyme activities and greenhouse gas fluxes along an elevational gradient. Geoderma 2024, 449, 116993. [Google Scholar] [CrossRef]
  39. Steenwerth, K.L.; Pierce, D.L.; Carlisle, E.A.; Spencer, R.G.M.; Smart, D.R. A Vineyard Agroecosystem: Disturbance and Precipitation Affect Soil Respiration under Mediterranean Conditions. Soil Sci. Soc. Am. J. 2010, 74, 231–239. [Google Scholar] [CrossRef]
  40. Garcia, L.; Krafft, G.; Enard, C.; Bouisson, Y.; Metay, A. Adapting service crop termination strategy in viticulture to increase soil ecosystem functions and limit competition with grapevine. Eur. J. Agron. 2024, 156, 127161. [Google Scholar] [CrossRef]
  41. Liebhard, G.; Winter, S.; Zaller, J.G.; Bauer, T.; Fantappiè, M.; Strauss, P. Effects of vineyard inter-row management on soil physical properties and organic carbon in Central European vineyards. Soil Use Manage. 2024, 40, e13101. [Google Scholar] [CrossRef]
  42. Lipiec, J.; Kuś, J.; Słowińska-Jurkiewicz, A.; Nosalewicz, A. Soil porosity and water infiltration as influenced by tillage methods. Soil Tillage Res. 2006, 89, 210–220. [Google Scholar] [CrossRef]
  43. Abad, F.J.; Marín, D.; Imbert, B.; Virto, I.; Garbisu, C.; Santesteban, L.G. Under-vine cover crops: Impact on physical and biological soil proprieties in an irrigated Mediterranean vineyard. Sci. Hortic. 2023, 311, 111797. [Google Scholar] [CrossRef]
  44. Abad, J.; Marín, D.; Santesteban, L.G.; Cibriain, J.F.; Sagüés, A. Under-vine cover crops: Impact on weed development, yield and grape composition. OENO One 2020, 54, 881–889. [Google Scholar] [CrossRef]
  45. Kopecký, J. Soil Science. Agrophysical Part, 1st ed.; Ministry of Agriculture: Prague, Czech Republic, 1928. (In Czech) [Google Scholar]
  46. Nelson, D.W.; Sommers, L.E. Total Carbon, Organic Carbon, and Organic Matter. In Methods of Soil Analysis; Wiley: Hoboken, NJ, USA, 1982; pp. 539–579. [Google Scholar]
  47. Dong, Y.S.; Zhang, S.; Qi, Y.C.; Chen, Z.Z.; Geng, Y.B. Fluxes of CO2, N2O and CH4 from a typical temperate grassland in Inner Mongolia and its daily variation. Chin. Sci. Bull. 2000, 45, 1590–1594. [Google Scholar] [CrossRef]
  48. Wilson, H.M.; Al-Kaisi, M.M. Crop rotation and nitrogen fertilization effect on Soil CO2 emissions in central lowa. Appl. Soil Ecol. 2008, 39, 264–270. [Google Scholar] [CrossRef]
  49. Hamza, M.A.; Anderson, W.K. Soil compaction in cropping systems: A review of the nature, causes and possible solutions. Soil Tillage Res. 2005, 82, 121–145. [Google Scholar] [CrossRef]
  50. Kulawardhana, R.W. Remote sensing of vegetation: Principles, techniques and applications. By Hamlyn G. Jones and Robin A Vaughan. J. Veg. Sci. 2011, 22, 1151–1153. [Google Scholar] [CrossRef]
  51. Nair, P.K.R. The Nature and Properties of Soils, 13th ed.; Brady, N.C., Weil, R.R., Eds.; Prentice Hall: Upper Saddle River, NJ, USA, 2002; Volume 54, p. 249. [Google Scholar] [CrossRef]
  52. Hůla, J.; Procházková, B.; Badalíková, B.; Dryšlová, T.; Horáček, J.; Javůrek, M.; Kovaříček, P.; Kroulík, M.; Kumhála, F.; Smutný, V.; et al. The Impact of Non-Traditional Soil Cultivation Technologies on the Soil Environment: Certified Methodology Applied; The Research Institute of Agricultural Engineering: Prague, Czech Republic, 2010. (In Czech) [Google Scholar]
  53. Rogovska, N.; Laird, D.; Cruse, R.; Fleming, P.; Parkin, T.; Meek, D. Impact of Biochar on Manure Carbon Stabilization and Greenhouse Gas Emissions. Soil Sci. Soc. Am. J. 2011, 75, 871–879. [Google Scholar] [CrossRef]
  54. Sosulski, T.; Korc, M. Effects of different mineral and organic fertilization on the content of nitrogen and carbon in soil organic matter fractions. Ecol. Chem. Eng. A 2011, 18, 601–609. [Google Scholar]
  55. Smith, K.; Watts, D.; Way, T.; Torbert, H.; Prior, S. Impact of Tillage and Fertilizer Application Method on Gas Emissions in a Corn Cropping System. Pedosphere 2012, 22, 604–615. [Google Scholar] [CrossRef]
  56. Sosulski, T.; Niedzinski, T.; Jadczyszyn, T.; Szymanska, M. Influence of Reduced Tillage, Fertilizer Placement, and Soil Afforestation on CO2 Emission from Arable Sandy Soils. Agronomy 2022, 12, 3102. [Google Scholar] [CrossRef]
  57. Zumkeller, M.; Yu, R.Z.; Torres, N.; Marigliano, L.E.; Zaccaria, D.; Kurtural, S.K. Site characteristics determine the effectiveness of tillage and cover crops on the net ecosystem carbon balance in California vineyard agroecosystems. Front. Plant Sci. 2022, 13, 14. [Google Scholar] [CrossRef] [PubMed]
  58. Rutkowska, B.; Szulc, W.; Sosulski, T.; Skowronska, M.; Szczepaniak, J. Impact of reduced tillage on CO2 emission from soil under maize cultivation. Soil Tillage Res. 2018, 180, 21–28. [Google Scholar] [CrossRef]
Figure 1. Location of study site and CO2 measurement equipment.
Agronomy 15 01611 g001
Figure 2. Weather conditions in experimental sites in year 2023 and the soil temperature and VWC levels at the time of measurement.
Agronomy 15 01611 g002
Figure 3. Weather conditions in experimental sites in year 2024 and the soil temperature and VWC levels at the time of measurement.
Agronomy 15 01611 g003
Figure 4. Cumulative CO2 emissions, expressed in g C-CO2·m−2·h−1, in year 2023.
Agronomy 15 01611 g004
Figure 5. Cumulative CO2 emissions, expressed in g C-CO2·m−2·h−1, in year 2024.
Agronomy 15 01611 g005
Table 1. Dates of emission measurements.
Measurement PeriodPhenological Stage (BBCH Scale)
t1—Early May2023: 13 (3 leaves unfolded), 2024: 17 (7 leaves unfolded)
t2—Early June2023: 17 (7 leaves unfolded), 2024: 69 (end of flowering)
t3—Early July2023: 71 (berry development begins), 2024: 79 (end of grape closure)
t4—Early August2023 & 2024: 81 (beginning of ripening, colour change)
t5—Early September2023: 85 (ripening), 2024: 89 (harvest maturity)
Table 2. Average values of selected soil physical parameters (n = 3).
ParameterVariant
C70C150C+C150MCo
Year 2023
Bulk Density (g·cm−3)1.631.561.601.661.68
Total Porosity (%)39.5241.9340.7738.3537.73
Instantaneous Content of water (vol%)27.8427.6028.2727.7926.29
Instantaneous Content of air (vol%)11.6814.3312.5510.5611.44
Year 2024
Bulk Density (g·cm−3)1.451.421.381.461.48
Total Porosity (%)46.0447.1548.8445.8645.11
Instantaneous Content of water (vol%)21.6617.4618.3915.6819.16
Instantaneous Content of air (vol%)24.3829.6930.4530.1825.95
Table 3. Average values of selected soil chemical parameters (n = 3).
ParameterVariant
C70C150C+C150MCo
Year 2023
Nc total (%)0.110.140.150.150.13
P-p (mg·kg−1)124125127231144
K-p (mg·kg−1)251632359687257
Mg-p (mg·kg−1)632326307314342
Ca-p (mg·kg−1)27692365255022382582
pHKCl6.86.97.36.86.7
Cox (%)1.221.111.021.071.02
Year 2024
Nc total (%)0.170.180.160.140.14
P-p (mg·kg−1)166188213242210
K-p (mg·kg−1)532365750600697
Mg-p (mg·kg−1)333319333320287
Ca-p (mg·kg−1)30513107316630162947
pHKCl7.37.37.27.17.0
Cox (%)0.860.850.931.020.55
Table 4. Overview of CO2 emissions produced by each variant.
Average Emission Value CO2 (g·m−2·h−1)Variant
C70C150C+C150MCo
Year 2023
t10.127 ± 0.01 acd0.162 ± 0.02 abd0.180 ± 0.01 ab0.137 ± 0.01 abcd0.095 ± 0.01 c
t20.145 ± 0.02 abc0.175 ± 0.02 abc0.199 ± 0.02 ab0.128 ± 0.02 ac0.106 ± 0.01 c
t30.126 ± 0.01 bc0.143 ± 0.01 abc0.165 ± 0.02 acd0.151 ± 0.02 abc0.093 ± 0.00 b
t40.150 ± 0.01 ab0.148 ± 0.01 ab0.168 ± 0.01 b0.156 ± 0.02 ab0.090 ± 0.01 a
t50.133 ± 0.01 a0.141 ± 0.01 a0.146 ± 0.01 ab0.126 ± 0.01 a0.102 ± 0.02 a
Year 2024
t10.159 ± 0.02 abcd0.186 ± 0.01 ab0.196 ± 0.01 b0.140 ± 0.01 abcd0.108 ± 0.02 cd
t20.186 ± 0.01 ab0.206 ± 0.00 b0.189 ± 0.01 ab0.173 ± 0.02 abc0.160 ± 0.00 abc
t30.200 ± 0.01 ad0.221 ± 0.01 d0.213 ± 0.01 d0.202 ± 0.01 ad0.143 ± 0.02 abc
t40.120 ± 0.01 ab0.147 ± 0.01 ab0.153 ± 0.02 ab0.146 ± 0.01 ab0.106 ± 0.01 ab
t50.160 ± 0.02 ab0.170 ± 0.01 ab0.222 ± 0.01 b0.172 ± 0.02 ab0.136 ± 0.02 a
Note: Data are expressed as means ± standard deviation; means values accompanied by a letter in the column are significantly different, according to Tukey’s test (p ≤ 0.05).
Disclaimer/Publisher’s Note: The statements, opinions and data contained in all publications are solely those of the individual author(s) and contributor(s) and not of MDPI and/or the editor(s). MDPI and/or the editor(s) disclaim responsibility for any injury to people or property resulting from any ideas, methods, instructions or products referred to in the content.

