Article

Study on Soil Nutrients and Microbial Community Diversity in Ancient Tea Plantations of China

1
College of Horticulture, South China Agricultural University, Guangzhou 510642, China
2
Guangdong Provincial Engineering Technology Research Center for Southern Specialty Tea, Guangzhou 510642, China
*
Author to whom correspondence should be addressed.
Agronomy 2025, 15(7), 1608; https://doi.org/10.3390/agronomy15071608
Submission received: 11 June 2025 / Revised: 24 June 2025 / Accepted: 28 June 2025 / Published: 30 June 2025
(This article belongs to the Section Soil and Plant Nutrition)

Abstract

Ancient tea plantations possess extremely important economic and cultivation value. In China, ancient tea plantations with trees over 100 years old have been preserved. However, the status of soil microorganisms, soil fertility, and soil heavy metal pollution in these ancient tea plantations remains unclear. This study took four Dancong ancient tea plantations in Fenghuang, Chaozhou City, and Guangdong Province as the research objects. Soil samples were collected from the surface layer (0–20 cm) and subsurface layer (20–40 cm) of the ancient tea trees. The rhizosphere soil microbial diversity and soil nutrients were determined. On this basis, the soil fertility was evaluated by referring to the soil environmental quality standards so as to conduct a comprehensive evaluation of the soil in the Dancong ancient tea plantations. This study found that Proteobacteria, Acidobacteriota, Chloroflexi, and Actinobacteria were the dominant bacteria in the rhizosphere soil of the Dancong ancient tree tea plantation. Ascomycota and Mortierellomycota are the dominant fungal phyla. Subgroup_2, AD3, Acidothermus, and Acidibacter were the dominant bacterial genera. Saitozyma, Mortierella, and Fusarium are the dominant fungal genera. The redundancy analysis (RDA) revealed that at the bacterial phylum level, Verrucomicrobia showed positive correlations with alkali-hydrolyzable nitrogen (AN), available potassium (AK), and total nitrogen (TN); Proteobacteria exhibited a positive correlation with available phosphorus (AP); and Gemmatimonadetes was positively correlated with total potassium (TK). At the fungal phylum level, Ascomycota demonstrated a positive correlation with TK. TN, AN, and TK were identified as key physicochemical indicators influencing soil bacterial diversity, while TN, AN, AP, and AK were the key physicochemical indicators affecting soil fungal diversity. This study revealed that the soil of Dancong ancient tea plantations has reached Level I fertility in terms of TN, TP, SOM, and AP. TK and AN show Level I or near-Level I fertility, but AK only meets Level III fertility for tea planting, serving as the main limiting factor for soil fertility quality. Considering the relatively abundant TK content in the tea plantations, potassium-solubilizing bacteria should be prioritized over blind potassium fertilizer application. Meanwhile, it is particularly noteworthy that AN and SOM are at extremely high levels. Sustained excess of AN and SOM may lead to over-proliferation of dominant microorganisms, inhibition of other functional microbial communities, and disruption of ecological balance. Therefore, optimizing nutrient input methods during fertilization is recommended.

1. Introduction

The environment, soil microorganisms, and tea plants engage in unique interactions that collectively form the tea plantation ecosystem [1]. An ancient tea tree refers to wild ancient tea trees and their communities in natural forests, semi-domesticated wild tea trees, or tea trees in ancient tea plantations cultivated for more than 100 years [2]. The soil environment in tea plantations is one of the primary factors influencing both tea yield and quality [3,4]. Soil microbial community dynamics, shaped by both environmental factors and anthropogenic management practices, significantly influence tea plant growth, quality parameters, and yield potential [5]. Rhizosphere microbiota play pivotal roles in regulating soil ecosystems through direct and indirect participation in nutrient cycling. These root-associated microbial communities enhance tea plant growth and quality, mitigate biotic and abiotic stresses, and improve soil fertility [6,7,8]. Research has revealed that the soil bacterial communities in Yunnan’s ancient tea plantations demonstrate significantly higher diversity and abundance compared to both natural forests and modern tea plantations. In terms of fertility improvement, Arbuscular Mycorrhizal Fungi play a key role in acidic tea plantations soils by improving phosphorus absorption efficiency and regulating the soil microenvironment [9]. In terms of disease resistance, Trichoderma has made significant contributions by inhibiting fungal diseases through space competition, secretion of antibiotics (such as Trichodermin), and hyperparasitism [10]. After long-term cultivation in modern tea plantations, the composition and structure of soil microbial communities undergo changes, with the diversity of bacterial communities significantly decreasing. This leads to a reduction in beneficial microorganisms and an increase in soil pathogenic microorganisms [11,12,13,14]. The abundance and diversity of bacterial communities in ancient tea plantations remained stable despite long-term cultivation, and the bacterial diversity of ancient tea trees was greater than that of terrace tea plantations due to the relatively high soil fertility maintained by natural cultivation methods [15,16]. Due to the differences among tea plantations, it is necessary to carry out microbial analysis on the soil of regional ancient tea plantations.
Soil quality is mainly evaluated by soil pH and SOM, TN, total phosphorus (TP), TK, AN, AP, and AK content [17,18]. In the process of long-term ecological adaptation, the tea tree became a perennial crop that prefers acidic soils [12,15]. In recent years, with the improvement in production intensification level in modern tea plantations and the influence of organic acids secreted by tea tree roots and their rhizosphere microorganisms, the soil in modern tea plantations has gradually acidified with the increase in tea planting years. This has triggered a series of problems, such as the decrease in the number and diversity of soil microorganisms, the reduction in soil enzyme activity, the decline in soil organic matter accumulation, and the impact on the availability of nitrogen, phosphorus, potassium, and various nutrient elements in tea plantations soil [19,20,21].
The Fenghuang tea region in Chaozhou, Guangdong Province, is endowed with rich and diverse ancient tea tree resources, which provide valuable materials for research on soil fertility and quality evaluation of tea plantations. The altitude of Fenghuang Mountain in Chaozhou ranges from 350 to 1498 m, with an annual average temperature of 20 °C and an average yearly rainfall of 2160 mm. Addressing the supply and demand of nutrients to ancient tea trees is the key to prolonging the vigor of their lives [22,23]. Existing studies have shown that the suitable soil pH value for ancient tea trees is 4.00–6.09. Compared with modern tea plantations, the soil acidification trend in ancient tea plantations is not obvious. Meanwhile, the contents of soil SOM, AN, and AP in ancient tea plantations are all higher than those in modern tea plantations [24,25,26]. In addition, the unique community structure and ecological environment of the ancient tea plantations enable their soil fertility to be self-sustaining [27]. However, due to the lack of management and protection for ancient tea trees, the destruction of ancient tea tree resources has been increasingly aggravated, and the germplasm resource pool of ancient tea trees is facing a serious crisis, with continuous decline and death of ancient tea trees. Precisely for this reason, ancient tea plantations have extremely important economic and cultivation value. Therefore, carrying out work such as analysis of soil microorganisms, soil fertility, and fertility characteristics in ancient tea plantations is particularly important for the development, utilization, cultivation, and management of ancient tea trees.
The objectives of this study are as follows: (1) to analyze the soil fertility of Dancong ancient tea plantations; (2) to characterize the rhizosphere soil microbial community in Dancong ancient tea plantations; (3) to explore the correlation between rhizosphere soil microorganisms and soil fertility quality in Dancong ancient tea plantations. The research findings can fill the gap in local soil nutrient data for the regional characteristic variety Dancong in ancient tea plantations. Meanwhile, the results provide practical references for evaluating the environmental quality of other ancient tea plantations and offer reliable data support for local governments in cultivating and managing ancient tea plantations.

2. Materials and Methods

2.1. Study Area and Soil Sampling

The samples were collected in April 2022. Within the Phoenix production area of Chaozhou City, Guangdong Province, ancient tea trees over 100 years old growing in four Dancong ancient tea plantations (Zimao ZM, Baixiang BX, Xialiao HSK, Daan DA, four tea plantations that are all sandy yellow clay) were selected for the experiment, and those with uniform height, uniform canopy width, and no signs of pests and diseases were chosen. The relevant information of the four tea plantations is shown in Table 1. In each tea plantation, soil sampling was conducted at three different sites. Additionally, the soils of the four tea plantations were either unfertilized or received minimal fertilization. At each sampling site, approximately 1 kg of surface soil (0–20 cm) and subsurface soil (20–40 cm) was collected using the method of coning and quartering. After mixing, impurities such as stones, roots, leaves, and insect bodies were removed, and the samples were packed into polyethylene bags. After mixing soil samples at each sampling point, impurities such as stones, roots, leaves, and insect bodies were removed. Approximately 1 kg of soil was obtained using the quartering method and packed into polyethylene bags. In the laboratory, the soil was spread on white paper for natural air-drying, and fine plant roots and stones were picked out, ground with a wooden stick, and passed through a nylon sieve for standby. The collected rhizosphere soil was immediately frozen in liquid nitrogen and then stored at −80 °C.

2.2. Soil Chemical Analysis and Indicator Selection

2.2.1. Indicators of Soil Fertility

The soil pH value was determined by the potentiometric method; SOM was determined by the potassium dichromate oxidation–external heating method; soil AN was determined by the alkali hydrolysis method; soil AP was determined by sodium bicarbonate extraction–molybdenum antimony resistance spectrophotometry; soil AK content was determined by flame photometry after ammonium acetate extraction; soil TN content was determined by the automatic nitrogen determinator method; soil TP content was determined by alkali fusion–molybdenum antimony resistance spectrophotometry; and soil TK content was determined by hydrofluoric acid digestion–flame photometry. Each soil sample was subjected to three replicate experiments during measurement to reduce experimental errors.

2.2.2. Standardization for Soil Fertility Assessment

The physicochemical indices of soil were converted into soil fertility indices. Taking the soil fertility indices of tea plantation environment stipulated by the Ministry of Agriculture of China as the critical values, after the same crop variety is planted in different soils, the ratio of the actual measured value of the soil to the critical value is used as the evaluation index to reflect the soil fertility index. The calculation formula is as follows:
P i = c i s t
where Pi is the fertility index of different soils, P is the fertility index, and i represents different soils; ci is the actual measured value of fertility indicators for different soils, c is the actual measured value of fertility indicators, and i represents different soils; st is the critical value of different fertility indicators for the soil, s is the critical value, and t represents different fertility indicators. The calculation results refer to the ratio of the soil Grade I fertility index values stipulated in the agricultural industry standard of the People’s Republic of China—“Environmental requirement for growing area of tea”. The Grade I fertility index values are TN > 1.0 g/kg, TP > 0.6 g/kg, TK > 10 g/kg, AN > 100 mg/kg, AP > 10 mg/kg, AK > 120 mg/kg, and SOM > 15 g/kg.

2.3. Determination of Rhizosphere Soil Microbial Community Diversity

2.3.1. Extraction of Total DNA from Microbiome

Total DNA extraction methods were performed on the rhizosphere soils of tea plants in the surface and subsurface layers. Meanwhile, DNA was quantified using a Nanodrop micro-spectrophotometer (Thermo Fisher Scientific, Waltham, MA, USA), and the extraction quality was detected by 1.2% agarose gel electrophoresis.

2.3.2. PCR Amplification of Target Fragments

Target sequences that reflect microbial community composition and diversity, such as microbial ribosomal RNA or specific gene fragments, were selected as targets. Corresponding primers were designed based on the conserved regions of these sequences, and sample-specific Barcode sequences were added for subsequent PCR amplification of the variable regions of rRNA genes or specific gene fragments. PCR amplification was performed using TransGen Biotech’s Pfu High-Fidelity DNA Polymerase (TransGen Biotech, Beijing, China), with strict control over the number of amplification cycles to ensure consistent amplification conditions for all samples in the same batch. Negative controls were also included.

2.3.3. Purification and Recovery of Amplified Products Using Magnetic Beads

First, add 0.8× volume of magnetic beads Vazyme VAHTSTM DNA Clean Beads (Vazyme Biotech, Nanjing, China) to 25 μL of the PCR product. Vortex thoroughly to resuspend the beads, then place the tube on a magnetic rack for 5 min to allow adsorption. Carefully aspirate and discard the supernatant. Next, add 20 μL of 0.8× magnetic bead washing buffer, vortex again to fully resuspend the beads, and place on the magnetic rack for another 5 min before removing the supernatant. Subsequently, add 200 μL of 80% ethanol and invert the PCR tube on the magnetic rack to adsorb the beads to the opposite wall. After complete adsorption, aspirate and discard the ethanol. Allow the tube to air-dry at room temperature for 5 min until all ethanol evaporates and the beads exhibit visible cracking. Following evaporation, add 25 μL of Elution Buffer for nucleic acid elution. Finally, place the tube on the magnetic rack for 5 min to facilitate full adsorption, then transfer the supernatant to a sterile 1.5 mL centrifuge tube for long-term storage.

2.3.4. Fluorescence Quantification of Amplified Products

The PCR amplification recovery products were quantified by fluorescence using the Quant-iT PicoGreen dsDNA Assay Kit, with a Microplate reader BioTek, FLx800 (BioTek, Winooski, VT, USA) as the quantitative instrument. According to the fluorescence quantification results, each sample was mixed in the corresponding proportion according to the sequencing volume requirement of each sample.

2.3.5. Sequencing Library Preparation

The sequencing libraries were prepared using Illumina’s TruSeq Nano DNA LT Library Prep Kit.
First, the End Repair Mix 2 (Illumina, CA, USA) from the kit was used to perform end repair on the aforementioned amplified products, which involved trimming the overhanging bases at the 5′ end of the DNA sequence, adding a phosphate group, and filling in the missing bases at the 3′ end. Next, an A base was added to the 3′ end of the DNA sequence to prevent self-ligation of DNA fragments and ensure the target sequence could ligate to the sequencing adapters. Then, sequencing adapters containing library-specific barcodes were added to the 5′ end to enable DNA molecules to bind to the Flow Cell. Subsequently, BECKMAN AMPure XP Beads (Illumina, San Diego, CA, USA) were used to remove self-ligated adapter fragments through magnetic bead purification, yielding a purified post-adapter-ligation library system. The adapter-ligated DNA fragments were then PCR-amplified to enrich the sequencing library templates, followed by another round of purification using BECKMAN AMPure XP Beads. Finally, the library underwent final size selection and purification via 2% agarose gel electrophoresis.

2.3.6. High-Throughput Sequencing Operation

Before loading onto the sequencer, the libraries need to be quality-controlled on an Agilent Bioanalyzer using the Agilent High Sensitivity DNA Kit (Agilent Technologies, Santa Clara, CA, USA). Subsequently, the libraries were quantified using the Quant-iT PicoGreen dsDNA Assay Kit (Agilent Technologies, CA, USA) on a Promega QuantiFluor fluorometric quantification system. Finally, the qualified sequencing libraries were gradient-diluted, mixed in proportion to the required sequencing output, denatured into single strands with NaOH, and then loaded onto the sequencer for high-throughput sequencing.

2.4. Statistical Analyses

In this study, the alpha diversity indices were calculated using the “qiime diversity alpha-rarefaction” command in QIIME2 2025.4. Statistical analyses of the data were performed using SPSS 19.0. For data visualization, Venn diagrams, bar charts, heatmaps, and PCoA analyses were generated in R 4.2.3 software using packages such as plotrix, ggplot2, pheatmap, and vegan. RDA and NMDS analyses were conducted on the chiplot (https://www.chiplot.online/ (accessed on 22 May 2025)).

3. Results

3.1. Soil Fertility Status

The key indicators of surface soil fertility in the ancient Dancong tea plantations are shown in Table 2. The soil fertility index presented no significant differences among the four ancient tea plantations in terms of the three indicators: pH value, AN, and AP. However, in terms of AK, HSK was significantly higher than ZM and BX but showed no significant difference from DA. For SOM, BX was considerably higher than ZM but showed no significant difference from HSK and DA. In terms of AN, BX, HSK, and DA were significantly higher than ZM. For AP, DA was significantly higher than BX and HSK but showed no significant difference from ZM. Finally, in terms of AK, BX was significantly higher than ZM, HSK, and DA.
Table 3 shows that in the surface soil of the four ancient tea plantations, only a few indicators were below the Grade I fertility level. Specifically, these were TK in the BX tea plantation and AK in all four plantations. The TK content in the BX tea plantation was close to the Grade I fertility level but still fell within Grade II. AK in all four plantations was at the Grade III fertility level.
The key indicators of subsurface soil fertility in the ancient Dancong tea plantations are shown in Table 4, and the soil fertility index is presented in Table 5. The fertility levels of subsurface soils in the four ancient tea plantations all reached Grade I except for AK, with only the TK content in the ZM tea plantation at the Grade II level. Regarding the AK indicator, all four tea plantations showed Grade III fertility. No significant differences were found among the tea plantations in pH, TN, TP, or AK values. For TK content, HSK was significantly higher than ZM and BX but showed no significant difference from DA. In SOM content, BX and HSK were significantly higher than ZM and DA. For AN content, BX, HSK, and DA were significantly higher than ZM. Regarding AP content, DA was significantly higher than HSK but showed no significant difference from BX and ZM.

3.2. Diversity and Composition of Microbial Communities

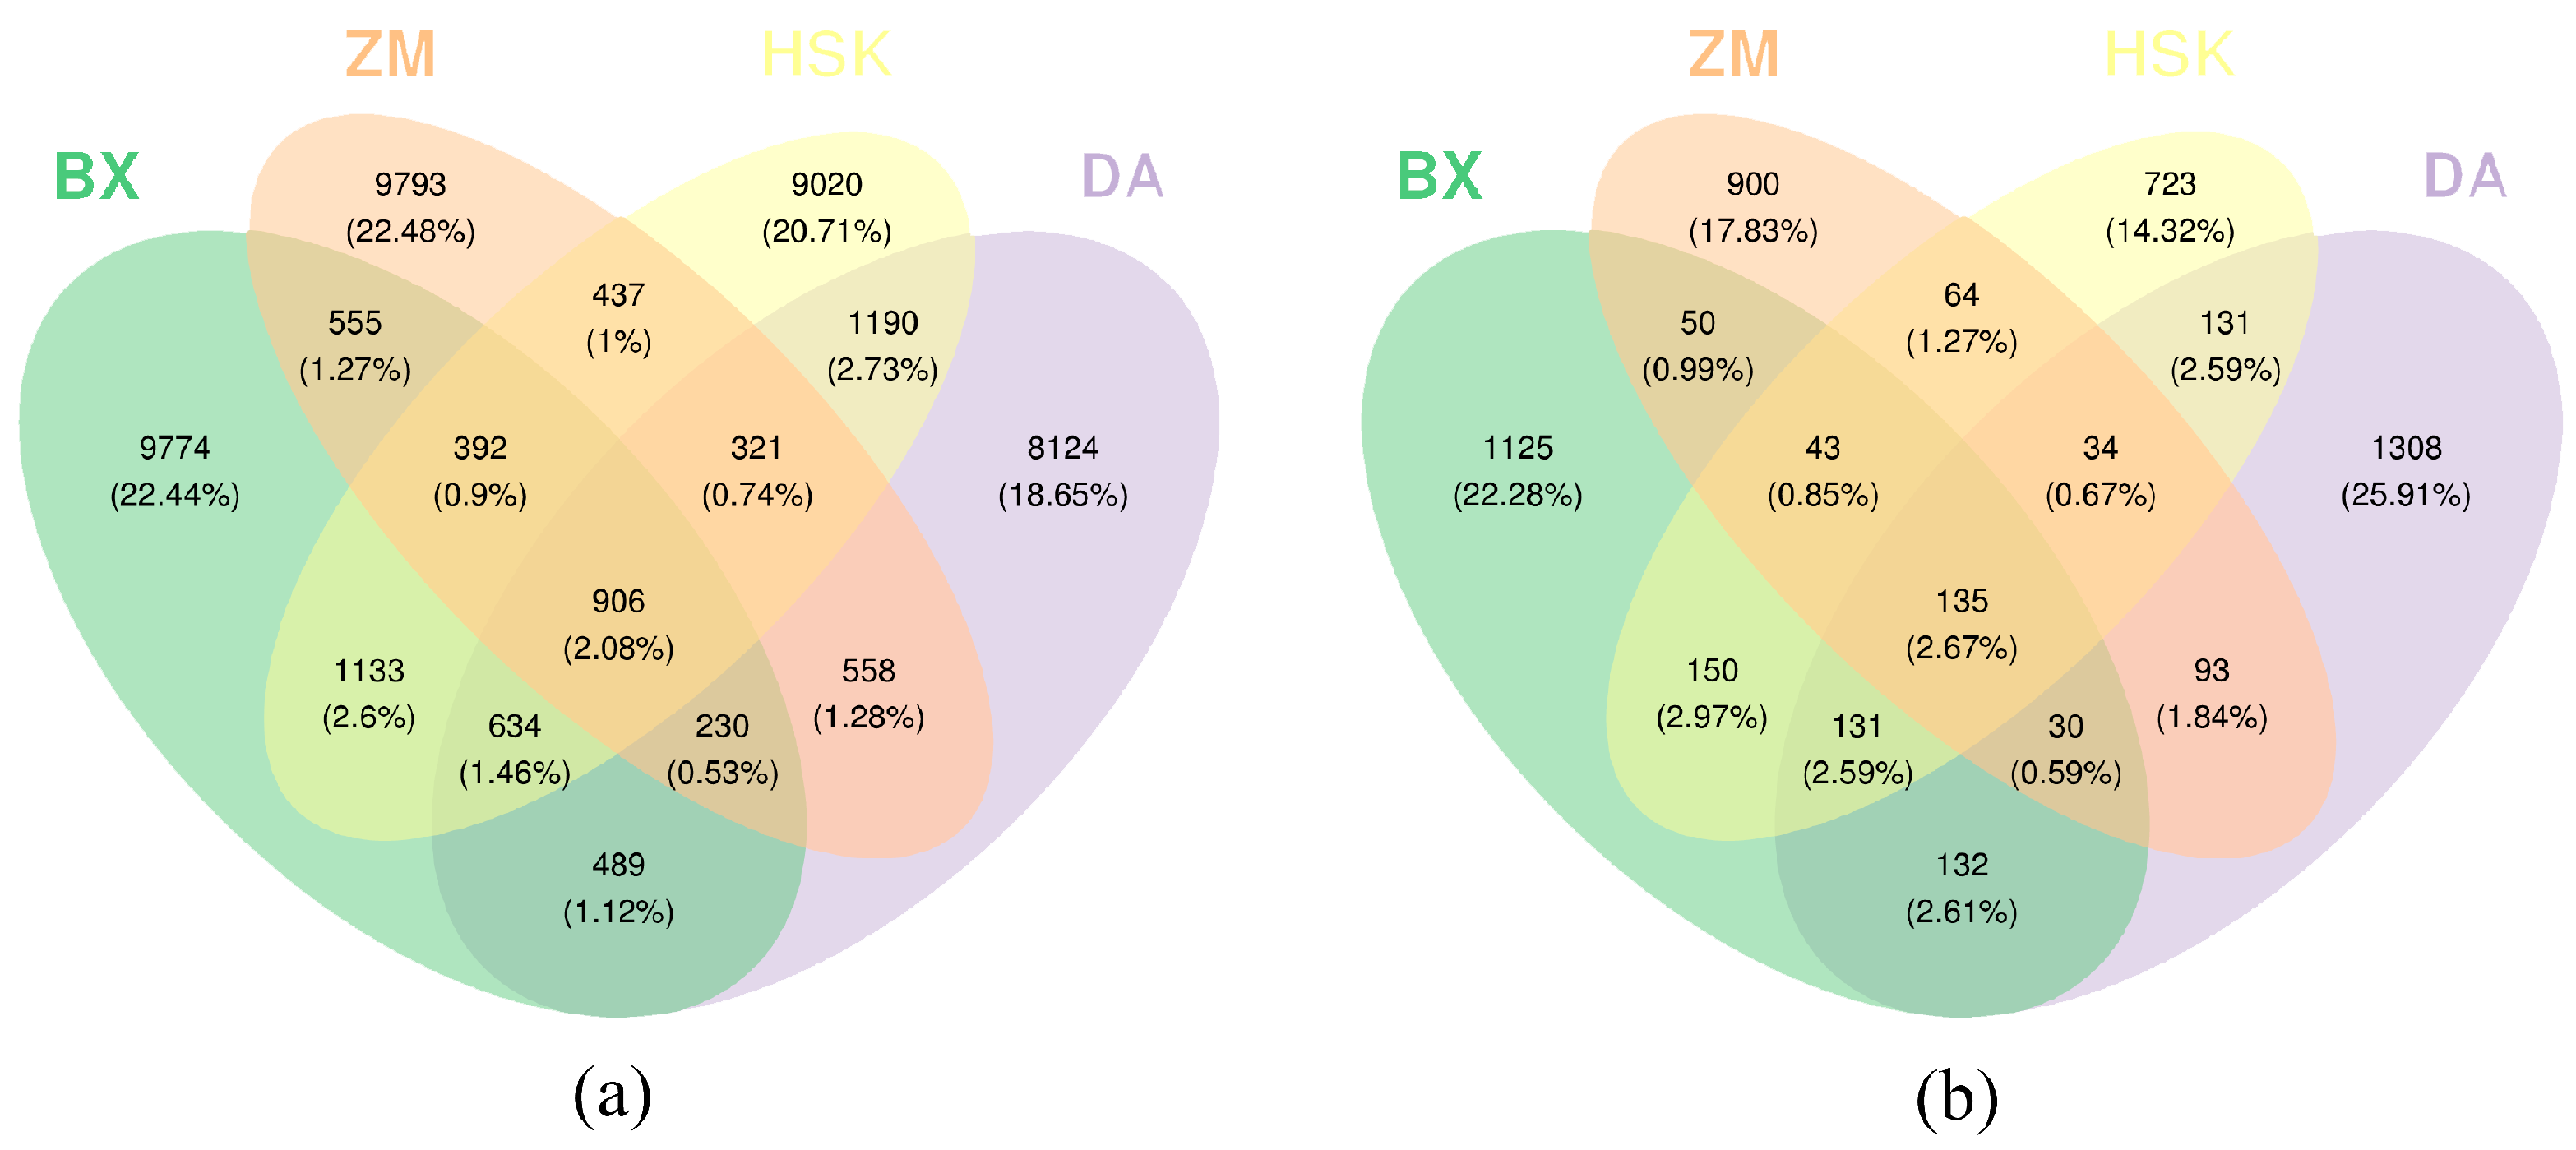
3.2.1. OTU Distribution in Rhizosphere Microbial Communities

The classification results of bacterial OTUs in the rhizosphere soil of different ancient tea plantations are shown in Figure 1a. A total of 43,556 bacterial OTUs were detected across all samples. Among them, 906 OTUs were shared by the four tea plantation samples, accounting for varying proportions of their respective total OTU counts: 6.87% in ZM (13,192 OTUs), 6.42% in BX (14,113 OTUs), 6.46% in HSK (14,033 OTUs), and 7.28% in DA (12,452 OTUs). The number of unique OTUs was 9793 in ZM, 9774 in BX, 9020 in HSK, and 8124 in DA, representing 74.23%, 69.26%, 64.28%, and 65.24% of their respective total OTUs. These data indicate that the rhizosphere soil bacteria in the ZM tea plantation had the highest proportion of unique species. The BX tea plantation exhibited the highest number of bacterial OTUs in the rhizosphere soil, while the DA tea plantation had the lowest.
The classification results of the analysis of fungal OTUs in the rhizosphere soil of different ancient tea plantations are shown in Figure 1b. A total of 5049 fungal OTUs were detected in all samples. The four tea plantation samples shared 135 OTUs, accounting for different proportions of their respective total OTU counts: 10.01% of ZM (1349 OTUs), 7.52% of BX (1796 OTUs), 9.57% of HSK (1411 OTUs), and 6.77% of DA (1994 OTUs). The number of unique OTUs was 900 in ZM, 1125 in BX, 723 in HSK, and 1308 in DA, accounting for 66.72%, 62.64%, 51.24%, and 65.60% of their respective total OTUs. These data also indicate that the rhizosphere soil fungi in the ZM tea plantation have the highest proportion of unique species. The DAF tea plantation has the highest number of fungal OTUs in the rhizosphere soil, while the ZM tea plantation has the lowest number of bacterial.

3.2.2. Soil Microbial Alpha Diversity

The alpha diversity indices of soil bacteria across different sampling sites are presented in Table 6. Alpha diversity indices can effectively assess the richness and diversity of bacterial communities in tea plantation soils. Specifically, the observed species and Chao1 indices, which reflect community richness, are widely applied in ecological studies [28,29]. Among the four ancient tea plantations, DA exhibited superior alpha diversity compared to other sampling sites. As shown in the table, DA recorded the highest values for both the Shannon and Pielou indices, indicating greater soil bacterial diversity at this site. HSK and BX followed in diversity ranking, while ZM demonstrated the lowest Shannon and Pielou index values, reflecting its comparatively reduced soil bacterial diversity. The alpha diversity indices of soil fungi across different sampling sites are presented in Table 7. The DA soil samples exhibited the highest richness index values, followed by BX and HSK, while ZM showed the lowest richness values. The Shannon index, Simpson index, and Pielou index reflect both the richness and evenness of the samples. Higher values of the Shannon index, Simpson index, and Pielou index indicate greater community diversity. DA demonstrated the highest values for the Shannon index, Simpson index, and Pielou index, indicating superior soil fungal diversity at this site.

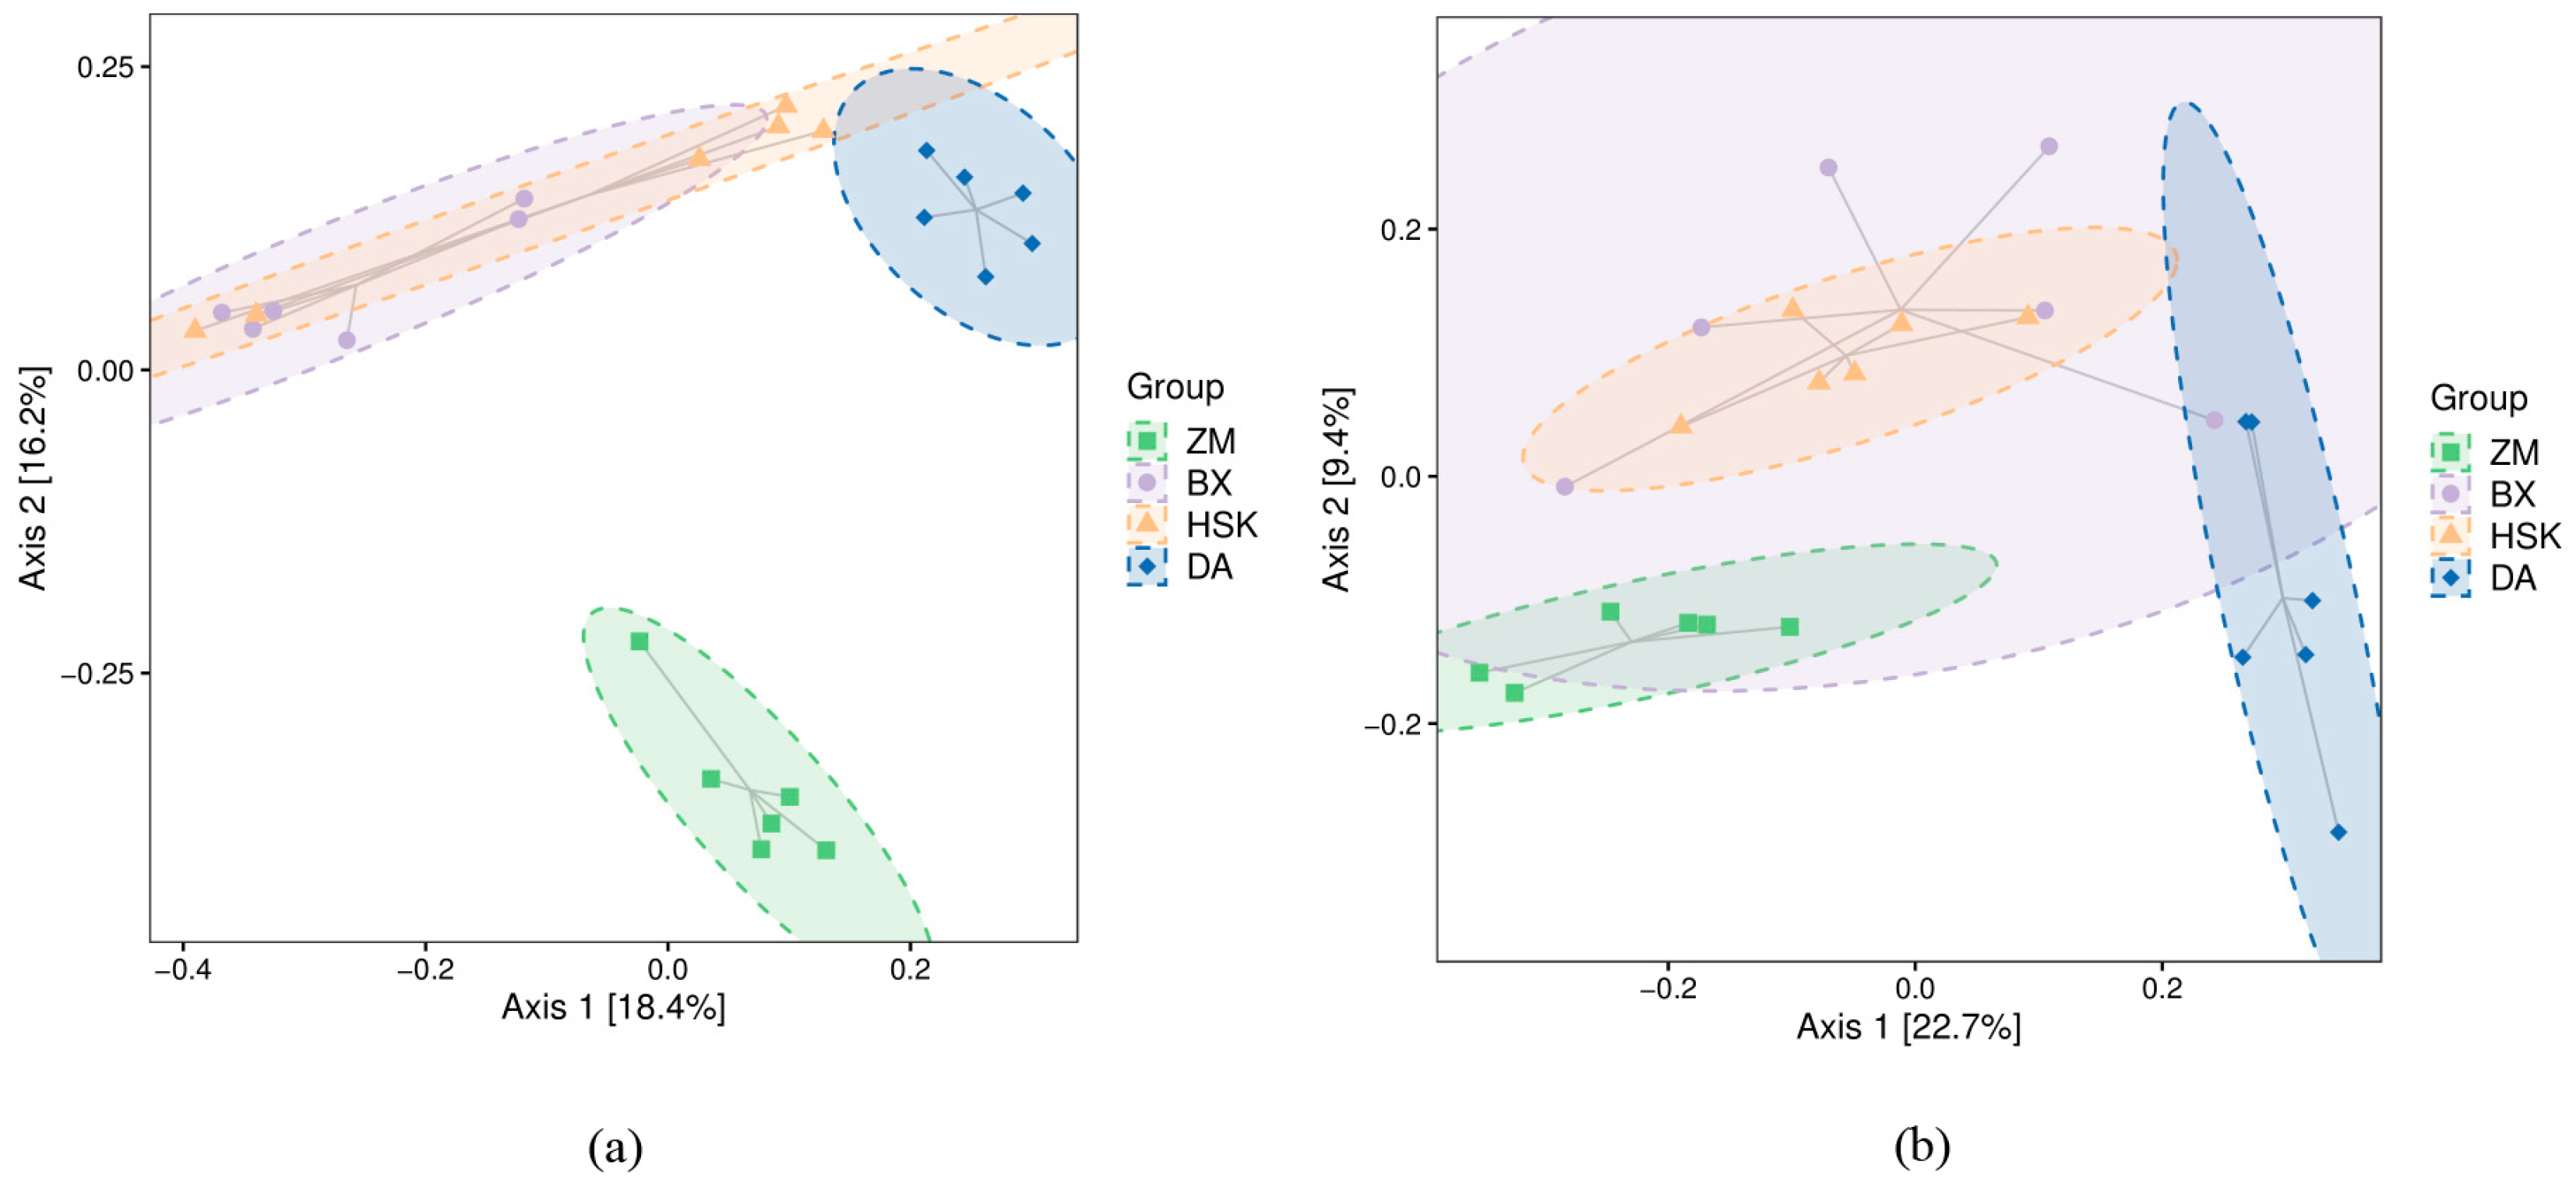
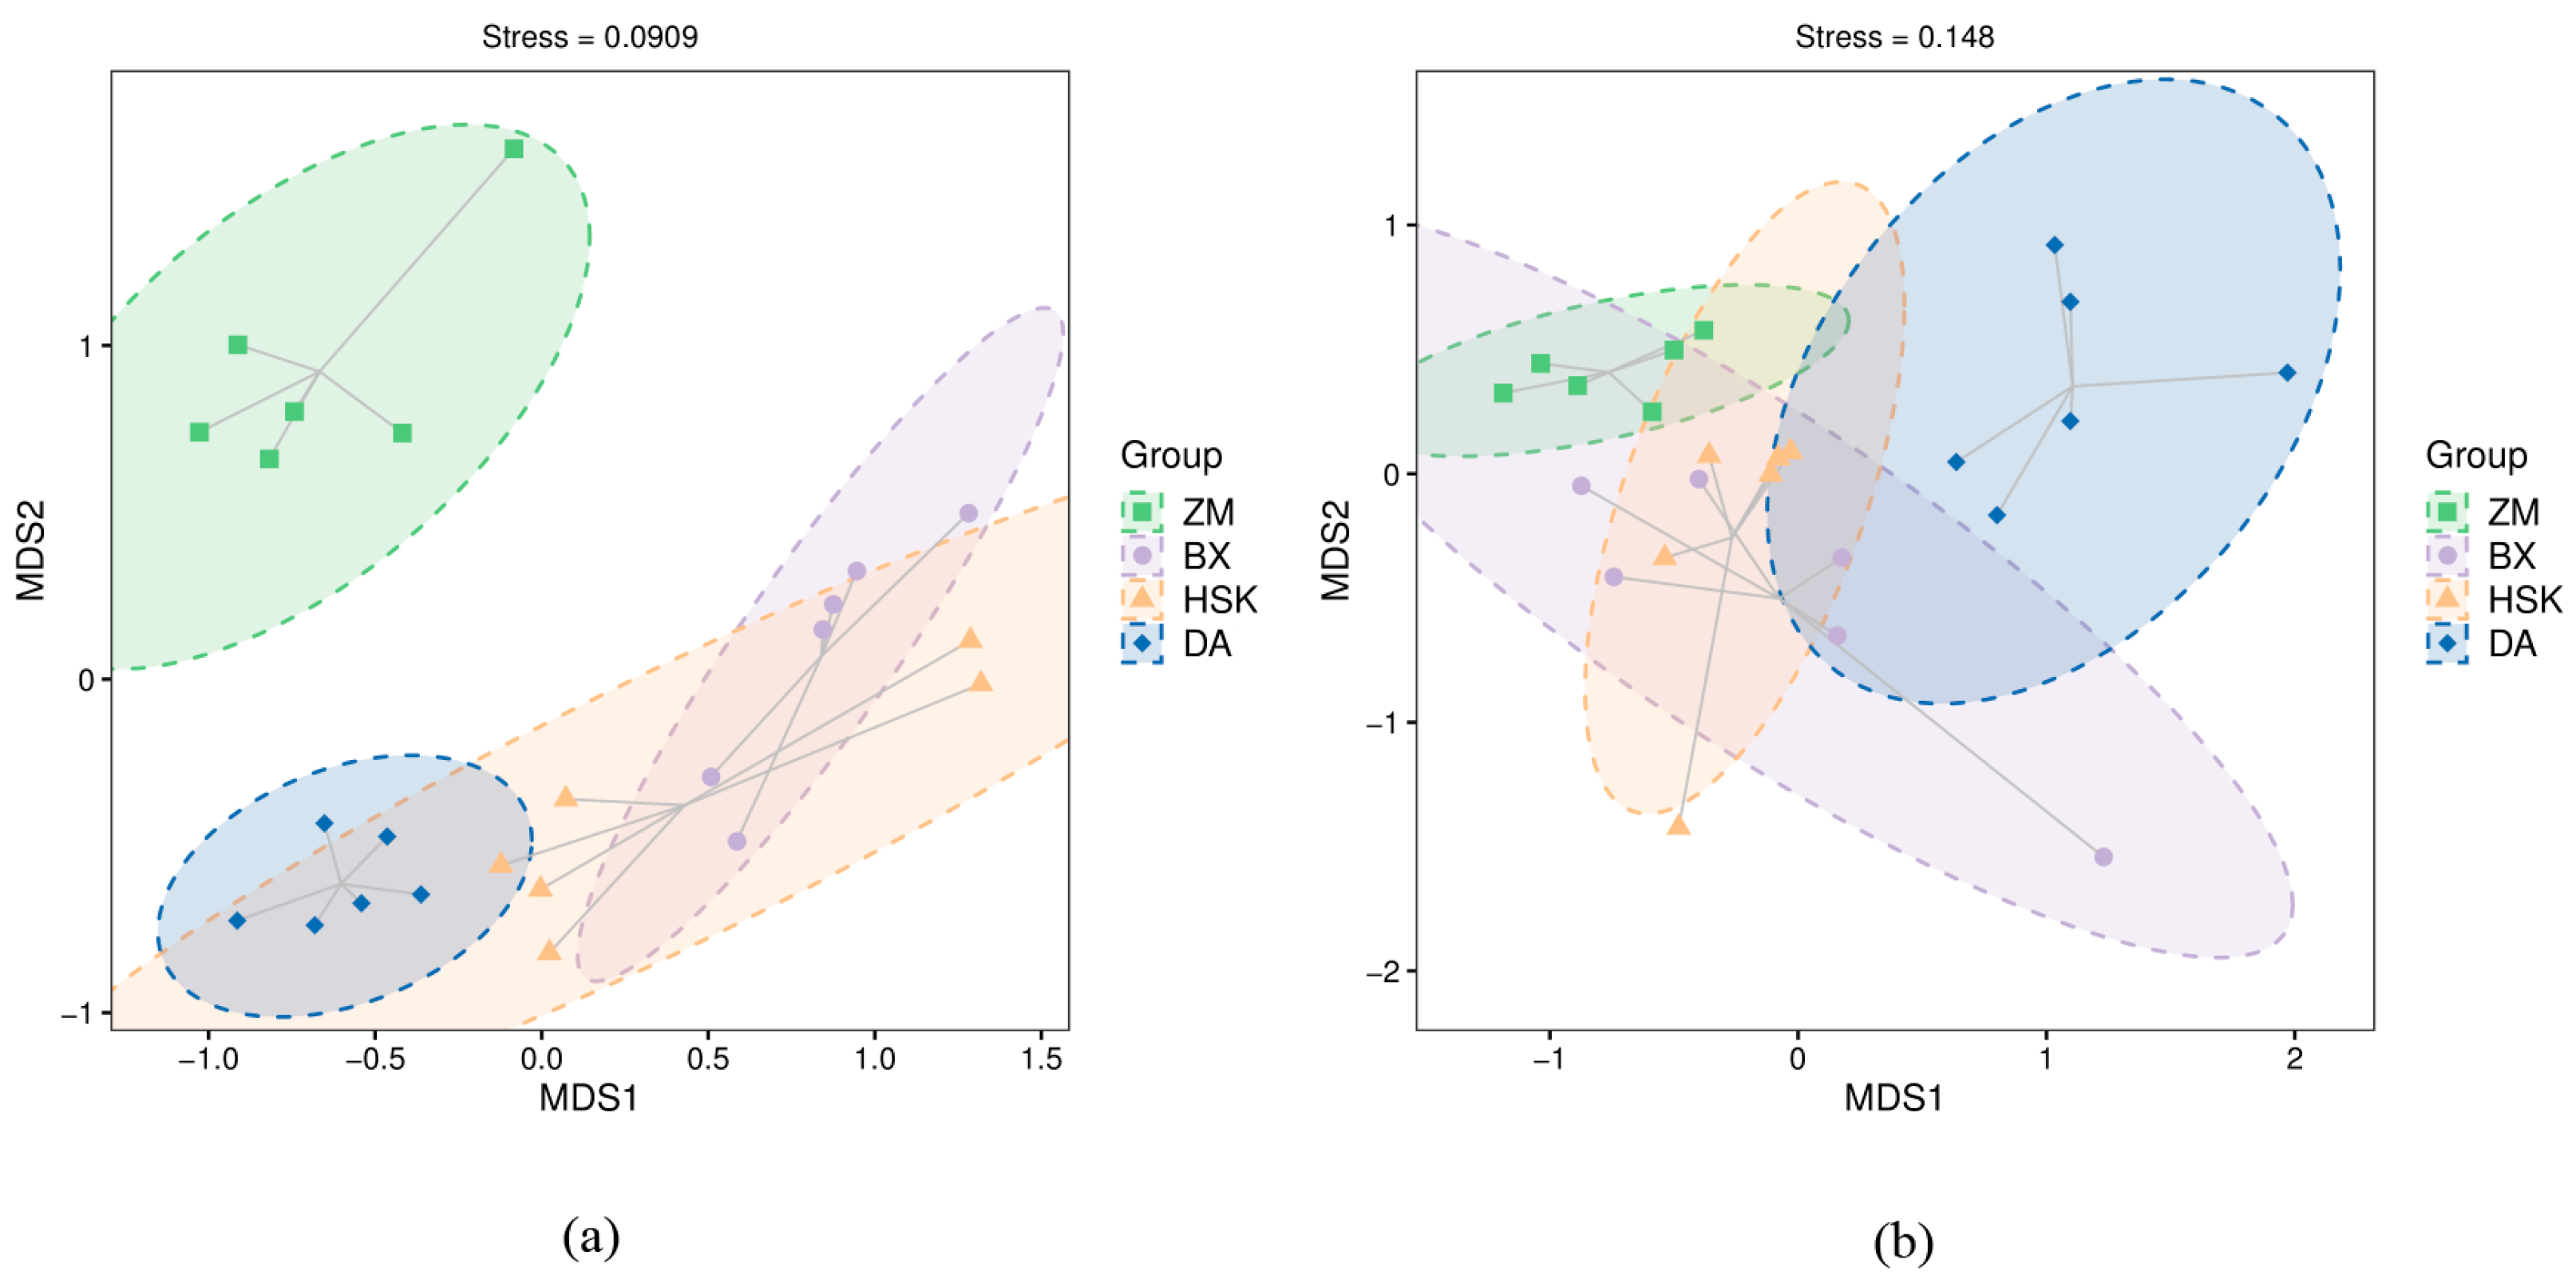
3.2.3. Soil Microbial Beta Diversity

Figure 2a shows the principal coordinate analysis (PCoA) of soil bacteria using Bray-Curtis distance. The PCoA analysis of all treatments reveals that the contribution rate of axis 1 is 18.4% and that of axis 2 is 16.2%. The closer the projection distance of two points on the coordinate axis, the more similar the community composition of the two samples in the corresponding dimension. Axis 1 can distinguish the differences between BX and DA tea plantations, while axis 2 can distinguish the differences between ZM and DA tea plantations. ZM has the farthest distance from other treatments, indicating that the soil bacteria in ZM are most different from those in other tea plantations. BX and HSK have a high overlap rate. Figure 3a presents the non-metric multidimensional scaling (NMDS) of bacteria using the Bray-Curtis algorithm, with a stress value of 0.0909. BX, ZM, and DA are clearly distinguished, while BX and HSK show a high overlap rate.
Figure 2b shows the PCoA of fungi using Bray-Curtis distance. The PCoA analysis of all treatments indicates that the contribution rate of axis 1 is 22.7% and that of axis 2 is 9.4%. Axis 1 can distinguish the differences between ZM and DA tea plantations, while axis 2 can distinguish the differences between ZM and HSK tea plantations. BX and HSK have a high overlap rate. Figure 3b shows the NMDS of fungi using the Bray-Curtis algorithm, with a stress value of 0.148. BX, HSK, and DA have a high overlap rate, while ZM and DA are relatively clearly distinguished.

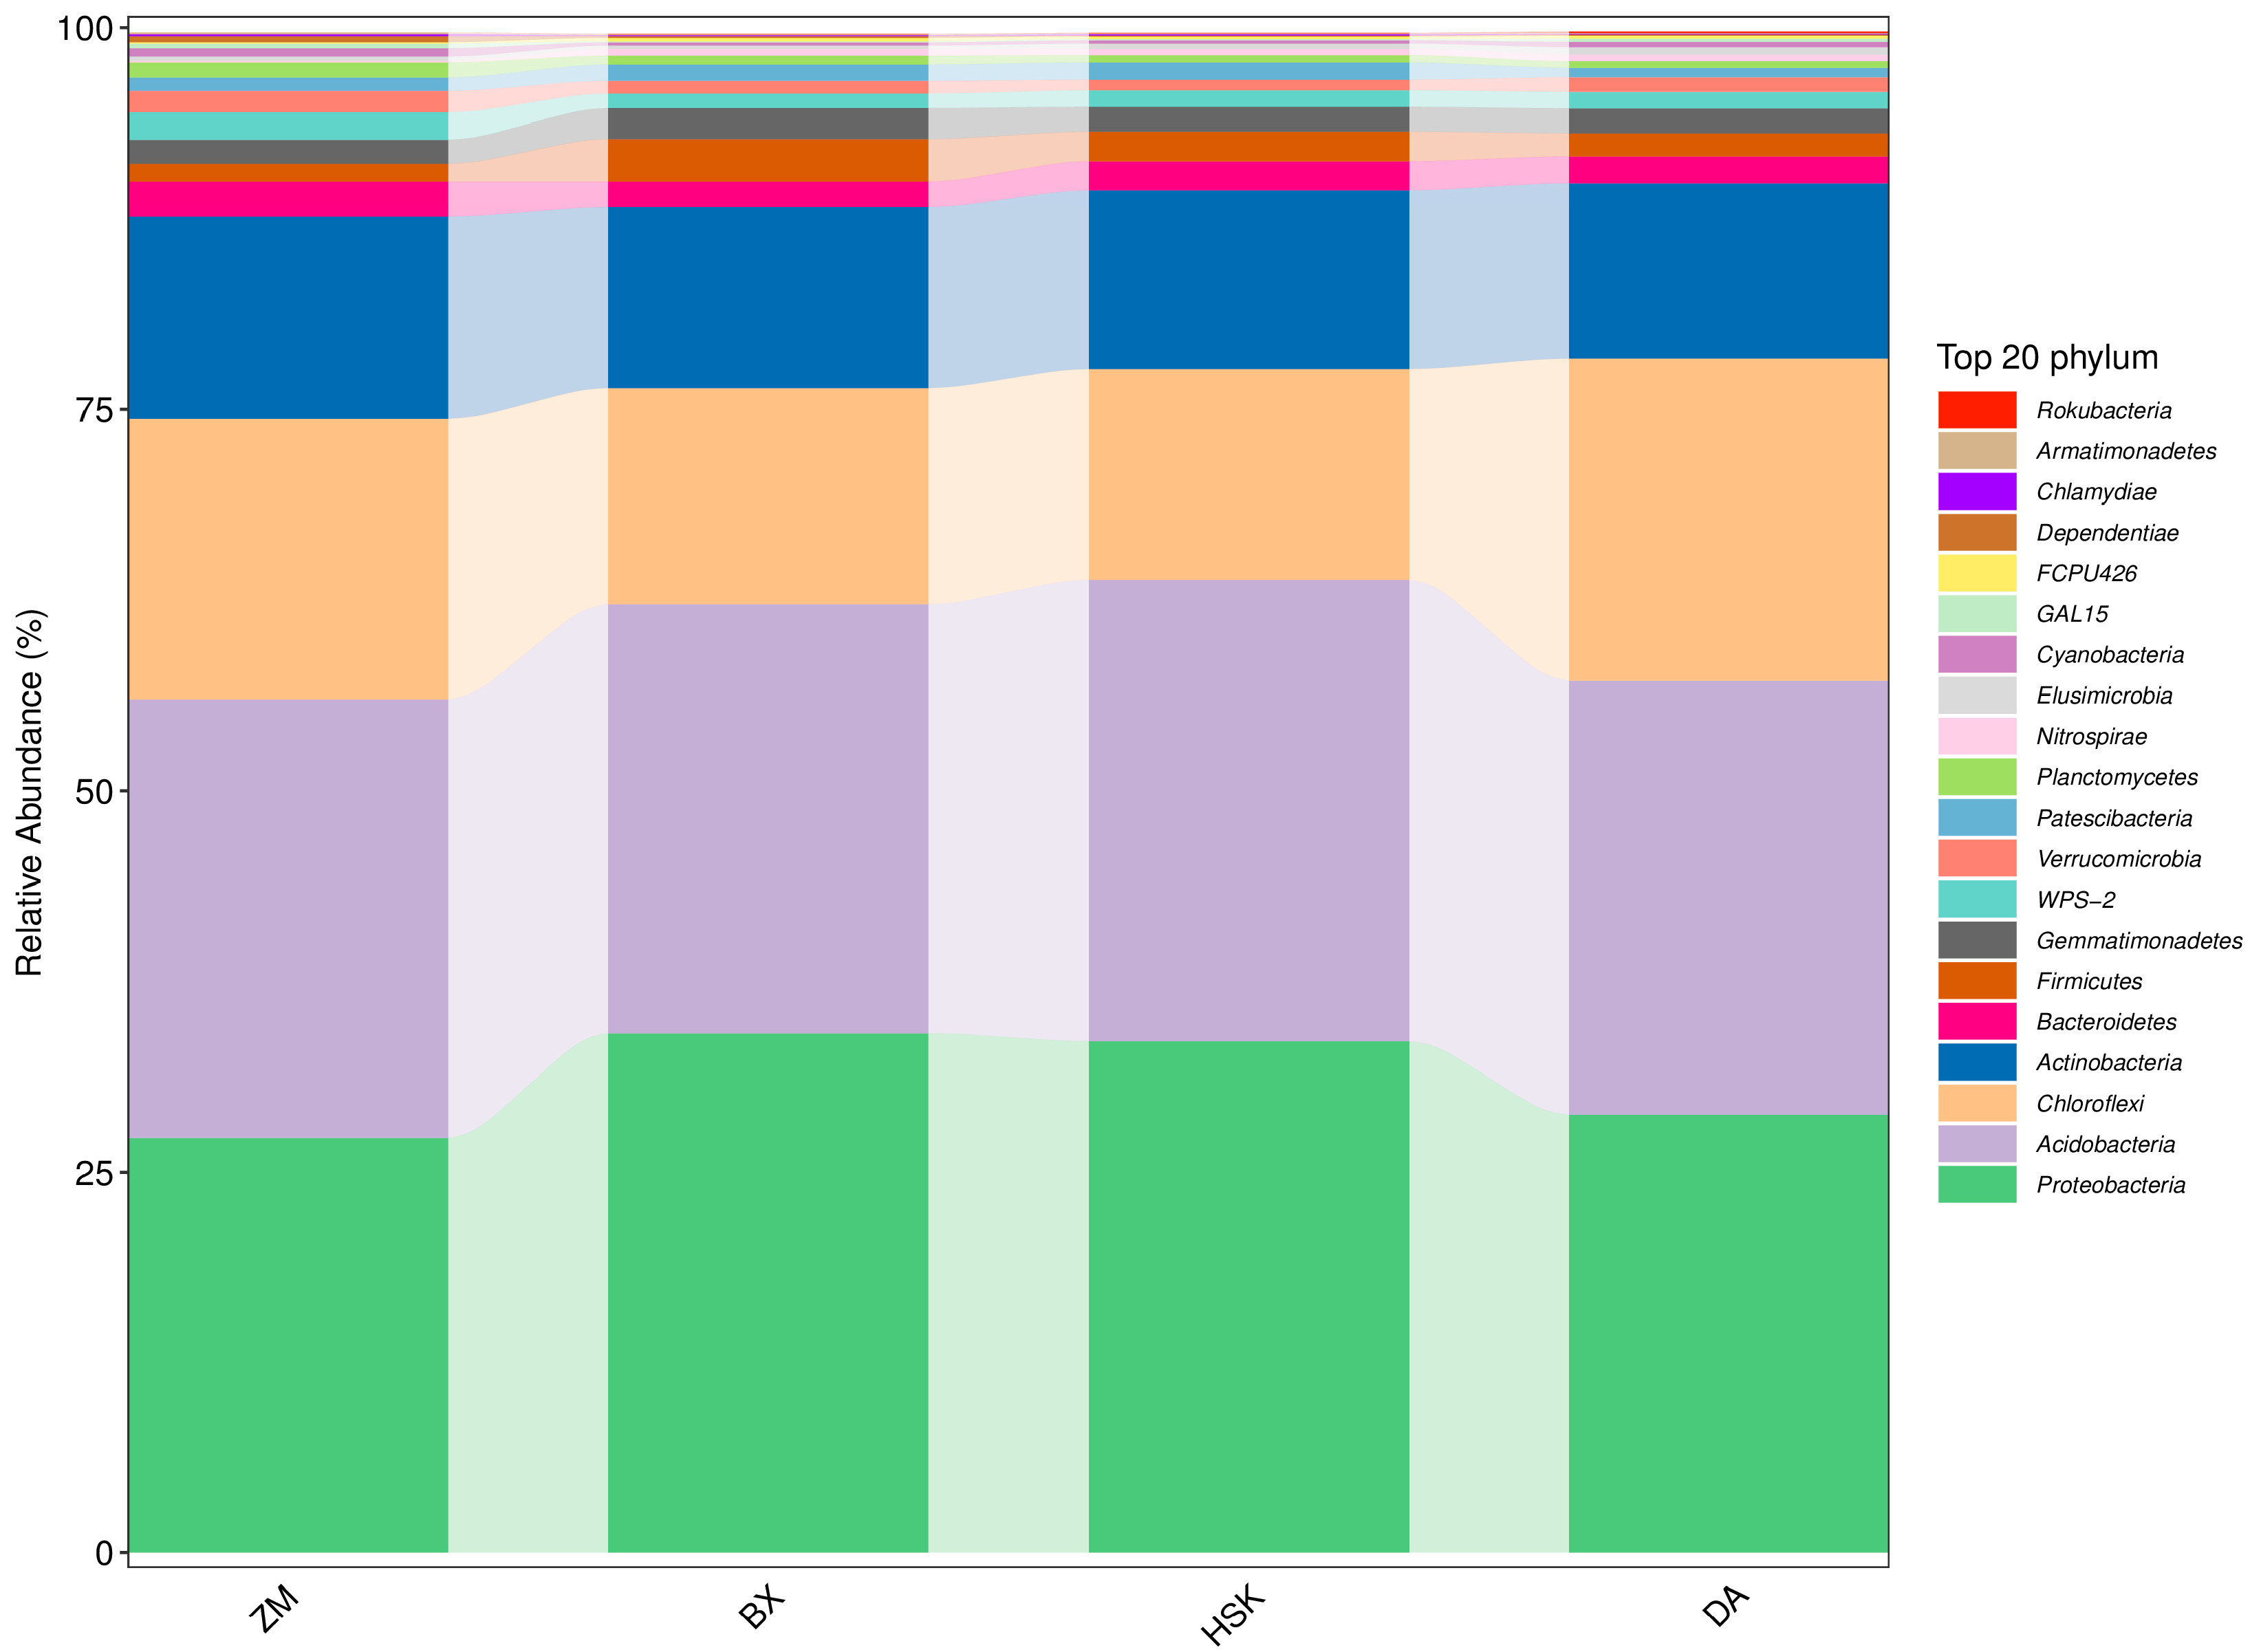
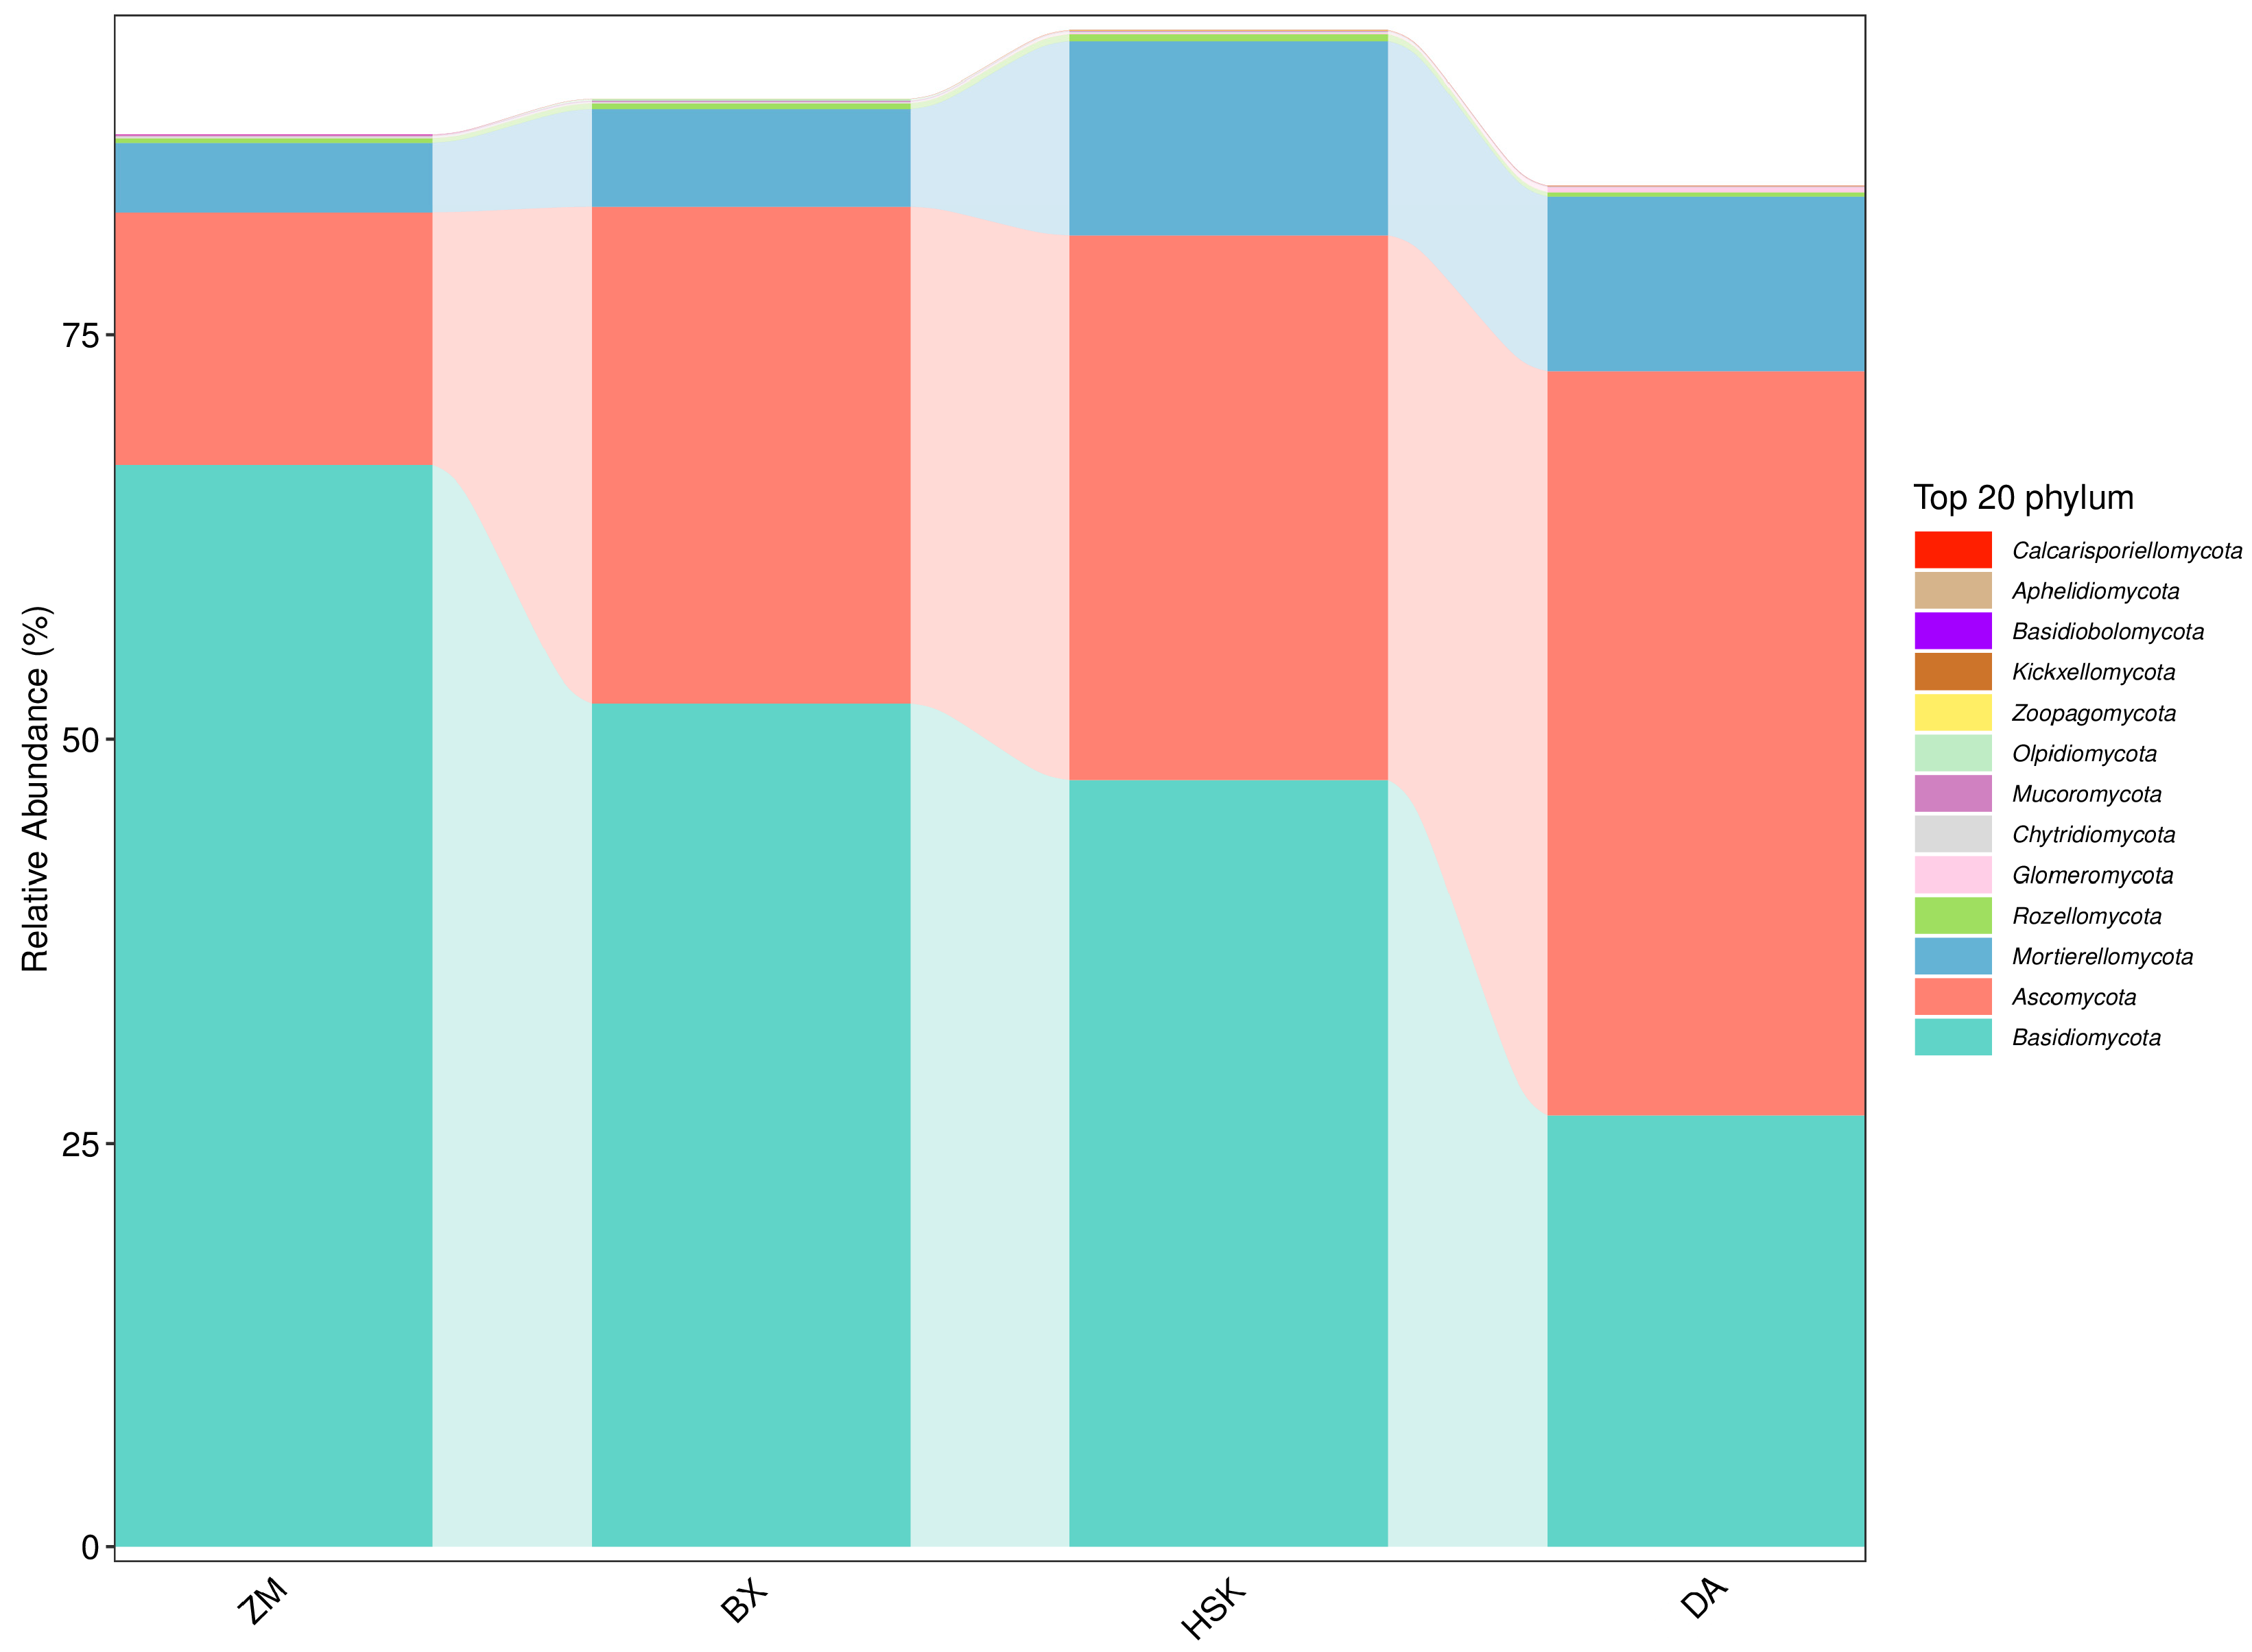
3.2.4. Structural Composition of Soil Bacteria and Fungi at the Phylum Level

At the phylum level, sequencing analysis detected the top 20 bacterial phyla present in the samples, as shown in Figure 4. The dominant bacterial phyla included Proteobacteria (28.12~30.25%), Acidobacteriota (27.26~34.11%), Chloroflexi (13.81~21.12%), and Actinobacteria (11.49~13.25%), all with relative abundances exceeding 10%. These four phyla represented the shared dominant bacterial phyla in the ancient tea plantations. Bacteroidetes (1.57~2.01%), Gemmatimonadetes (1.67~2.29%), and Verrucomicrobia (1.18~2.79%) accounted for more than 1% abundance. Other top 20 phyla included Firmicutes, WPS-2, Patescibacteria, Planctomycetes, Nitrospirae, Cyanobacteria, GAL15, Dependentiae, Elusimicrobia, Chlamydiae, Armatimonadetes, FCPU426, and Rokubacteria.
The results of dominant bacterial phyla in the soil of ancient tea tree plantations are similar to those of previous studies. Proteobacteria, Acidobacteriota, Actinobacteria, and Chloroflexi are the dominant bacterial phyla in the soil of tea plantations [30,31]. The richness of Proteobacteria and Actinobacteria is related to soil nutrient levels. Proteobacteria grow rapidly and prefer environments rich in nitrogen nutrients [32,33].
At the phylum level, sequencing analysis detected the fungal phyla present in the samples, as shown in Figure 5, with the dominant fungal phyla in the soil being Basidiomycota (26.75~66.93%), Ascomycota (15.61~45.98%), and Mortierellomycota (4.32~12.01%), all exhibiting relative abundances above 10%. These three phyla represent the shared dominant fungal phyla in the ancient tea plantations. Other phyla, including Rozellomycota, Glomeromycota, Chytridiomycota, Mucoromycota, Olpidiomycota, Zoopagomycota, Kickxellomycota, Basidiobolomycota, Calcarisporiellomycota, and Aphelidiomycota, each accounted for less than 1% abundance. Additionally, Olpidiomycota was only detected at the BX sampling site, Basidiobolomycota and Calcarisporiellomycota were only found in ZM, and Aphelidiomycota was only detected in BX and HSK.
Ascomycota and Basidiomycota are the dominant fungal phyla in the soil of tea plantations under conventional management, while the dominant fungal groups in the soil of tea plantations under organic management shift to Ascomycota, Mortierellomycota, and Basidiomycota [30,34]. The predominant presence of Ascomycota significantly enhances the decomposition of decaying organic matter and facilitates cellulose degradation [34]. The dominant phylum Basidiomycota, in the samples may serve as a critical factor for plant growth as it colonizes plant roots and facilitates nutrient acquisition from the soil, particularly phosphorus [35].

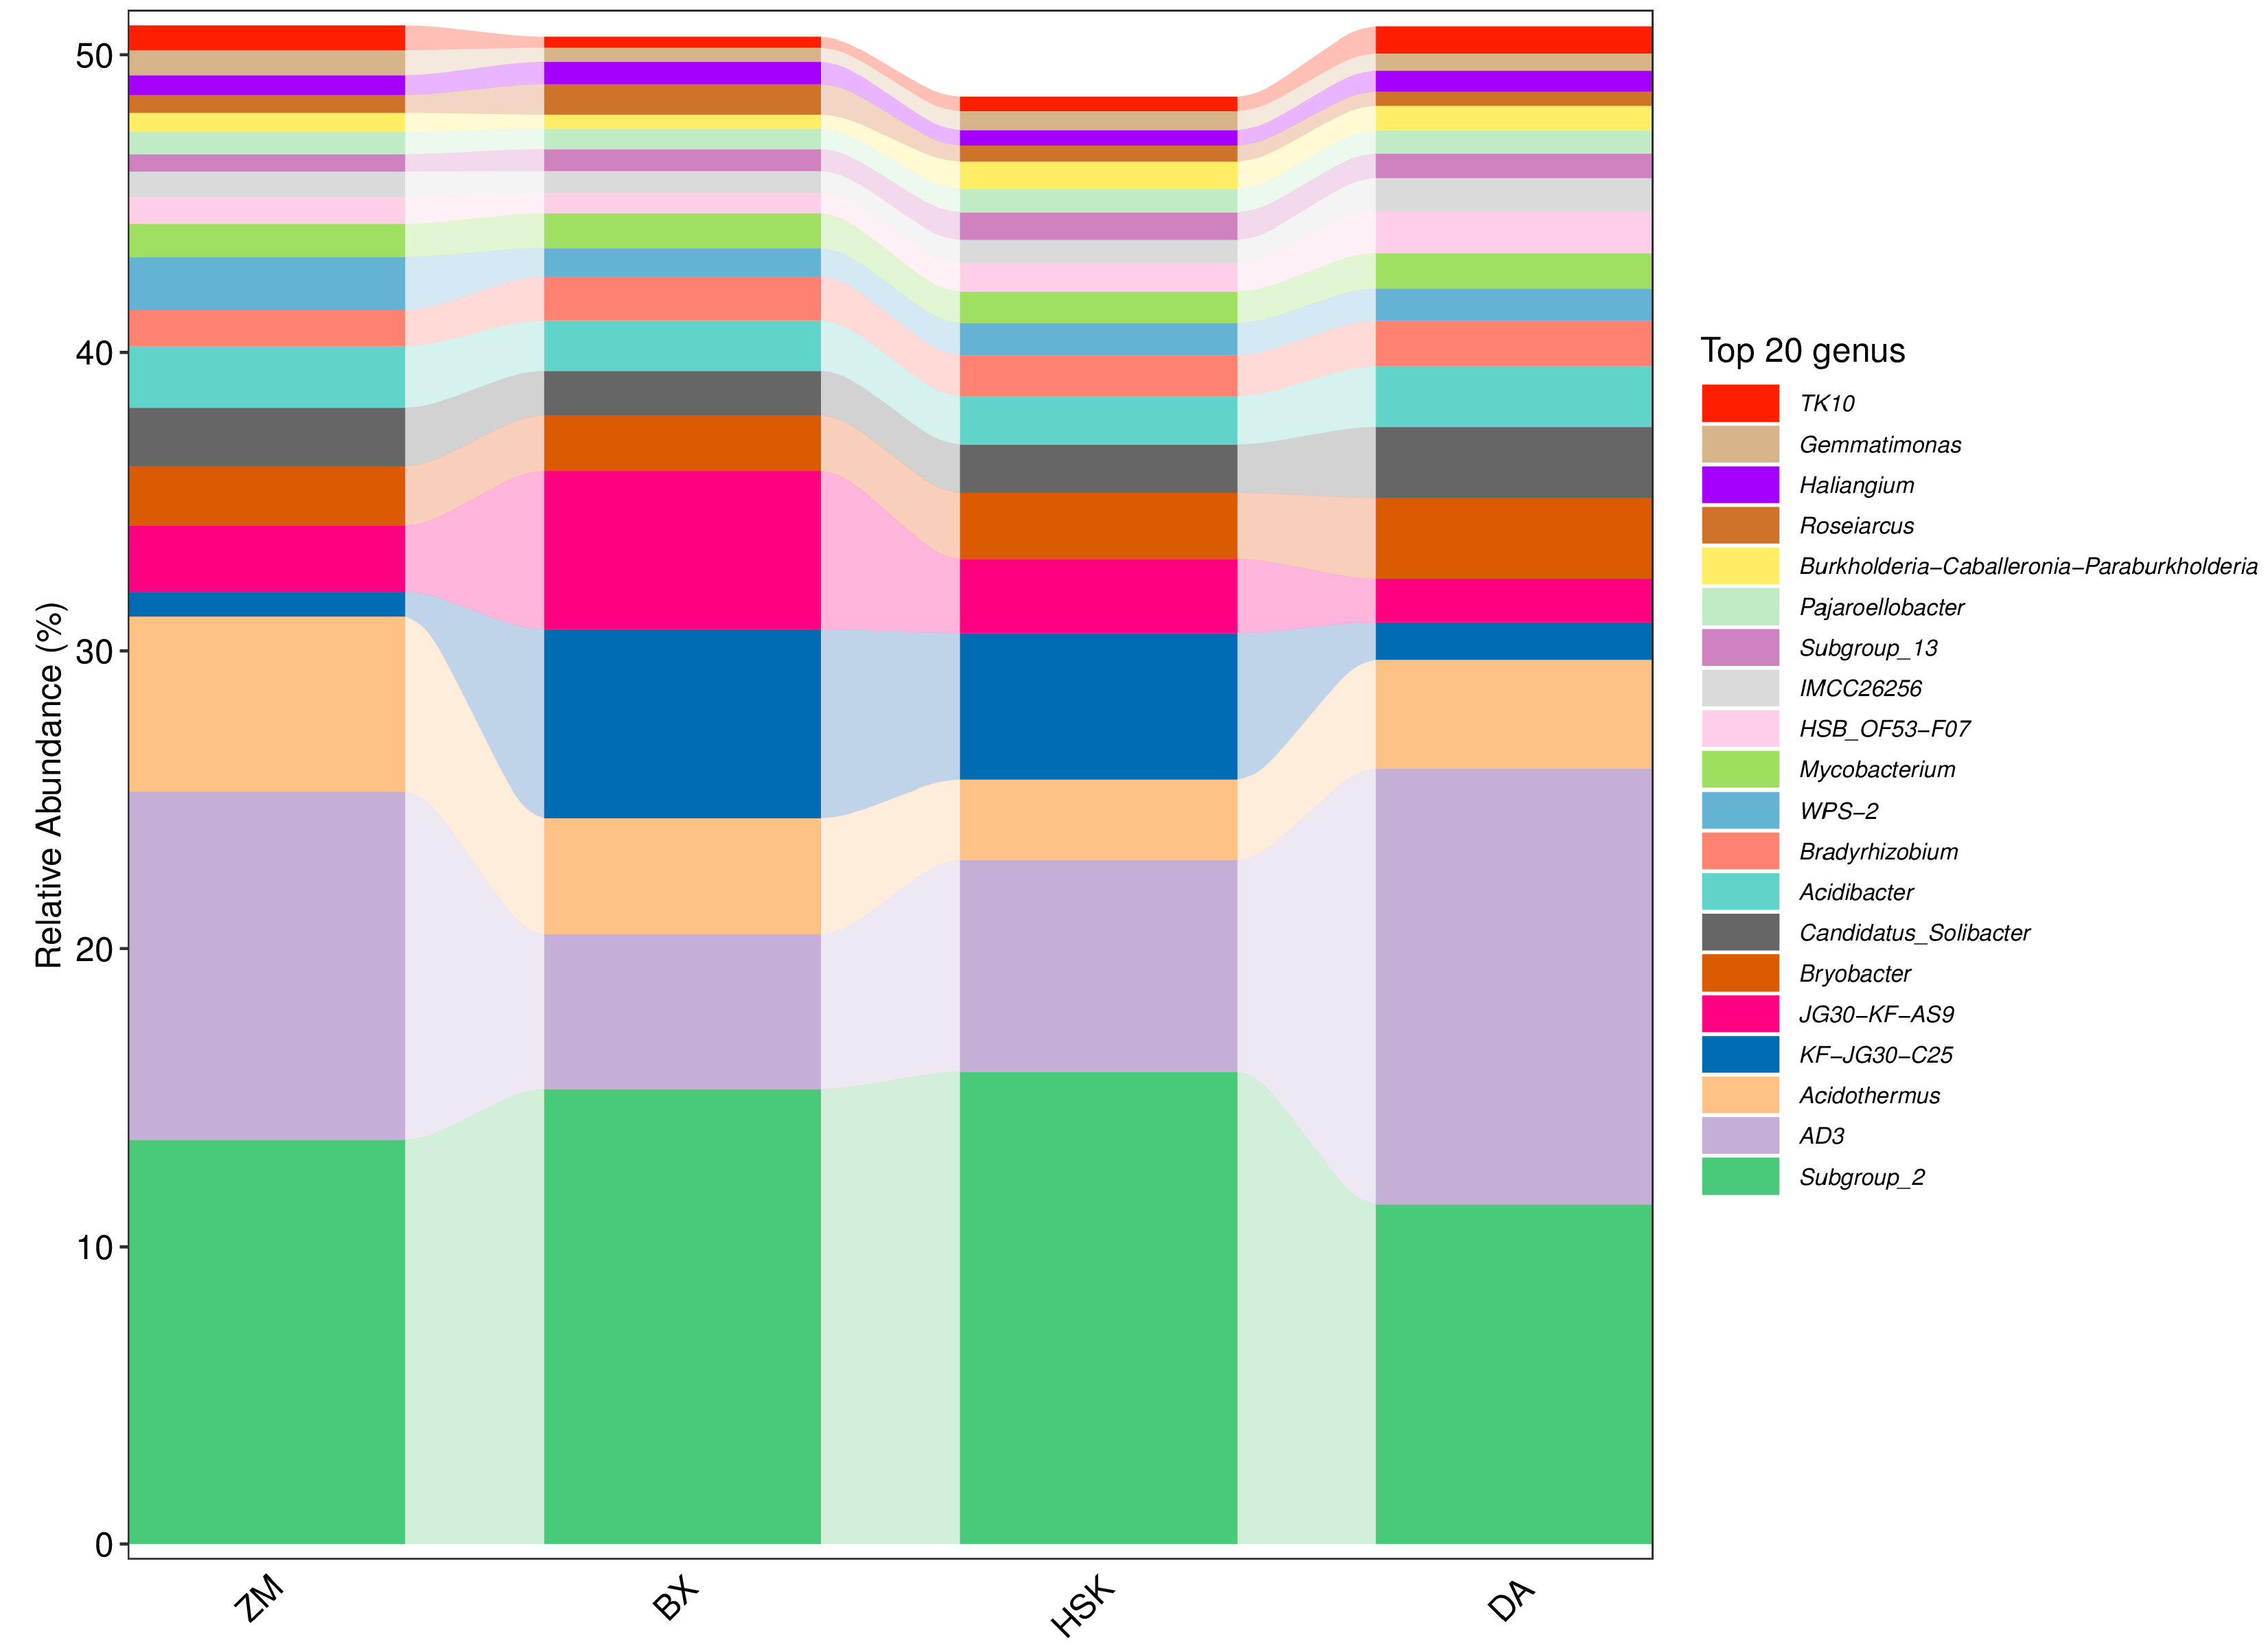
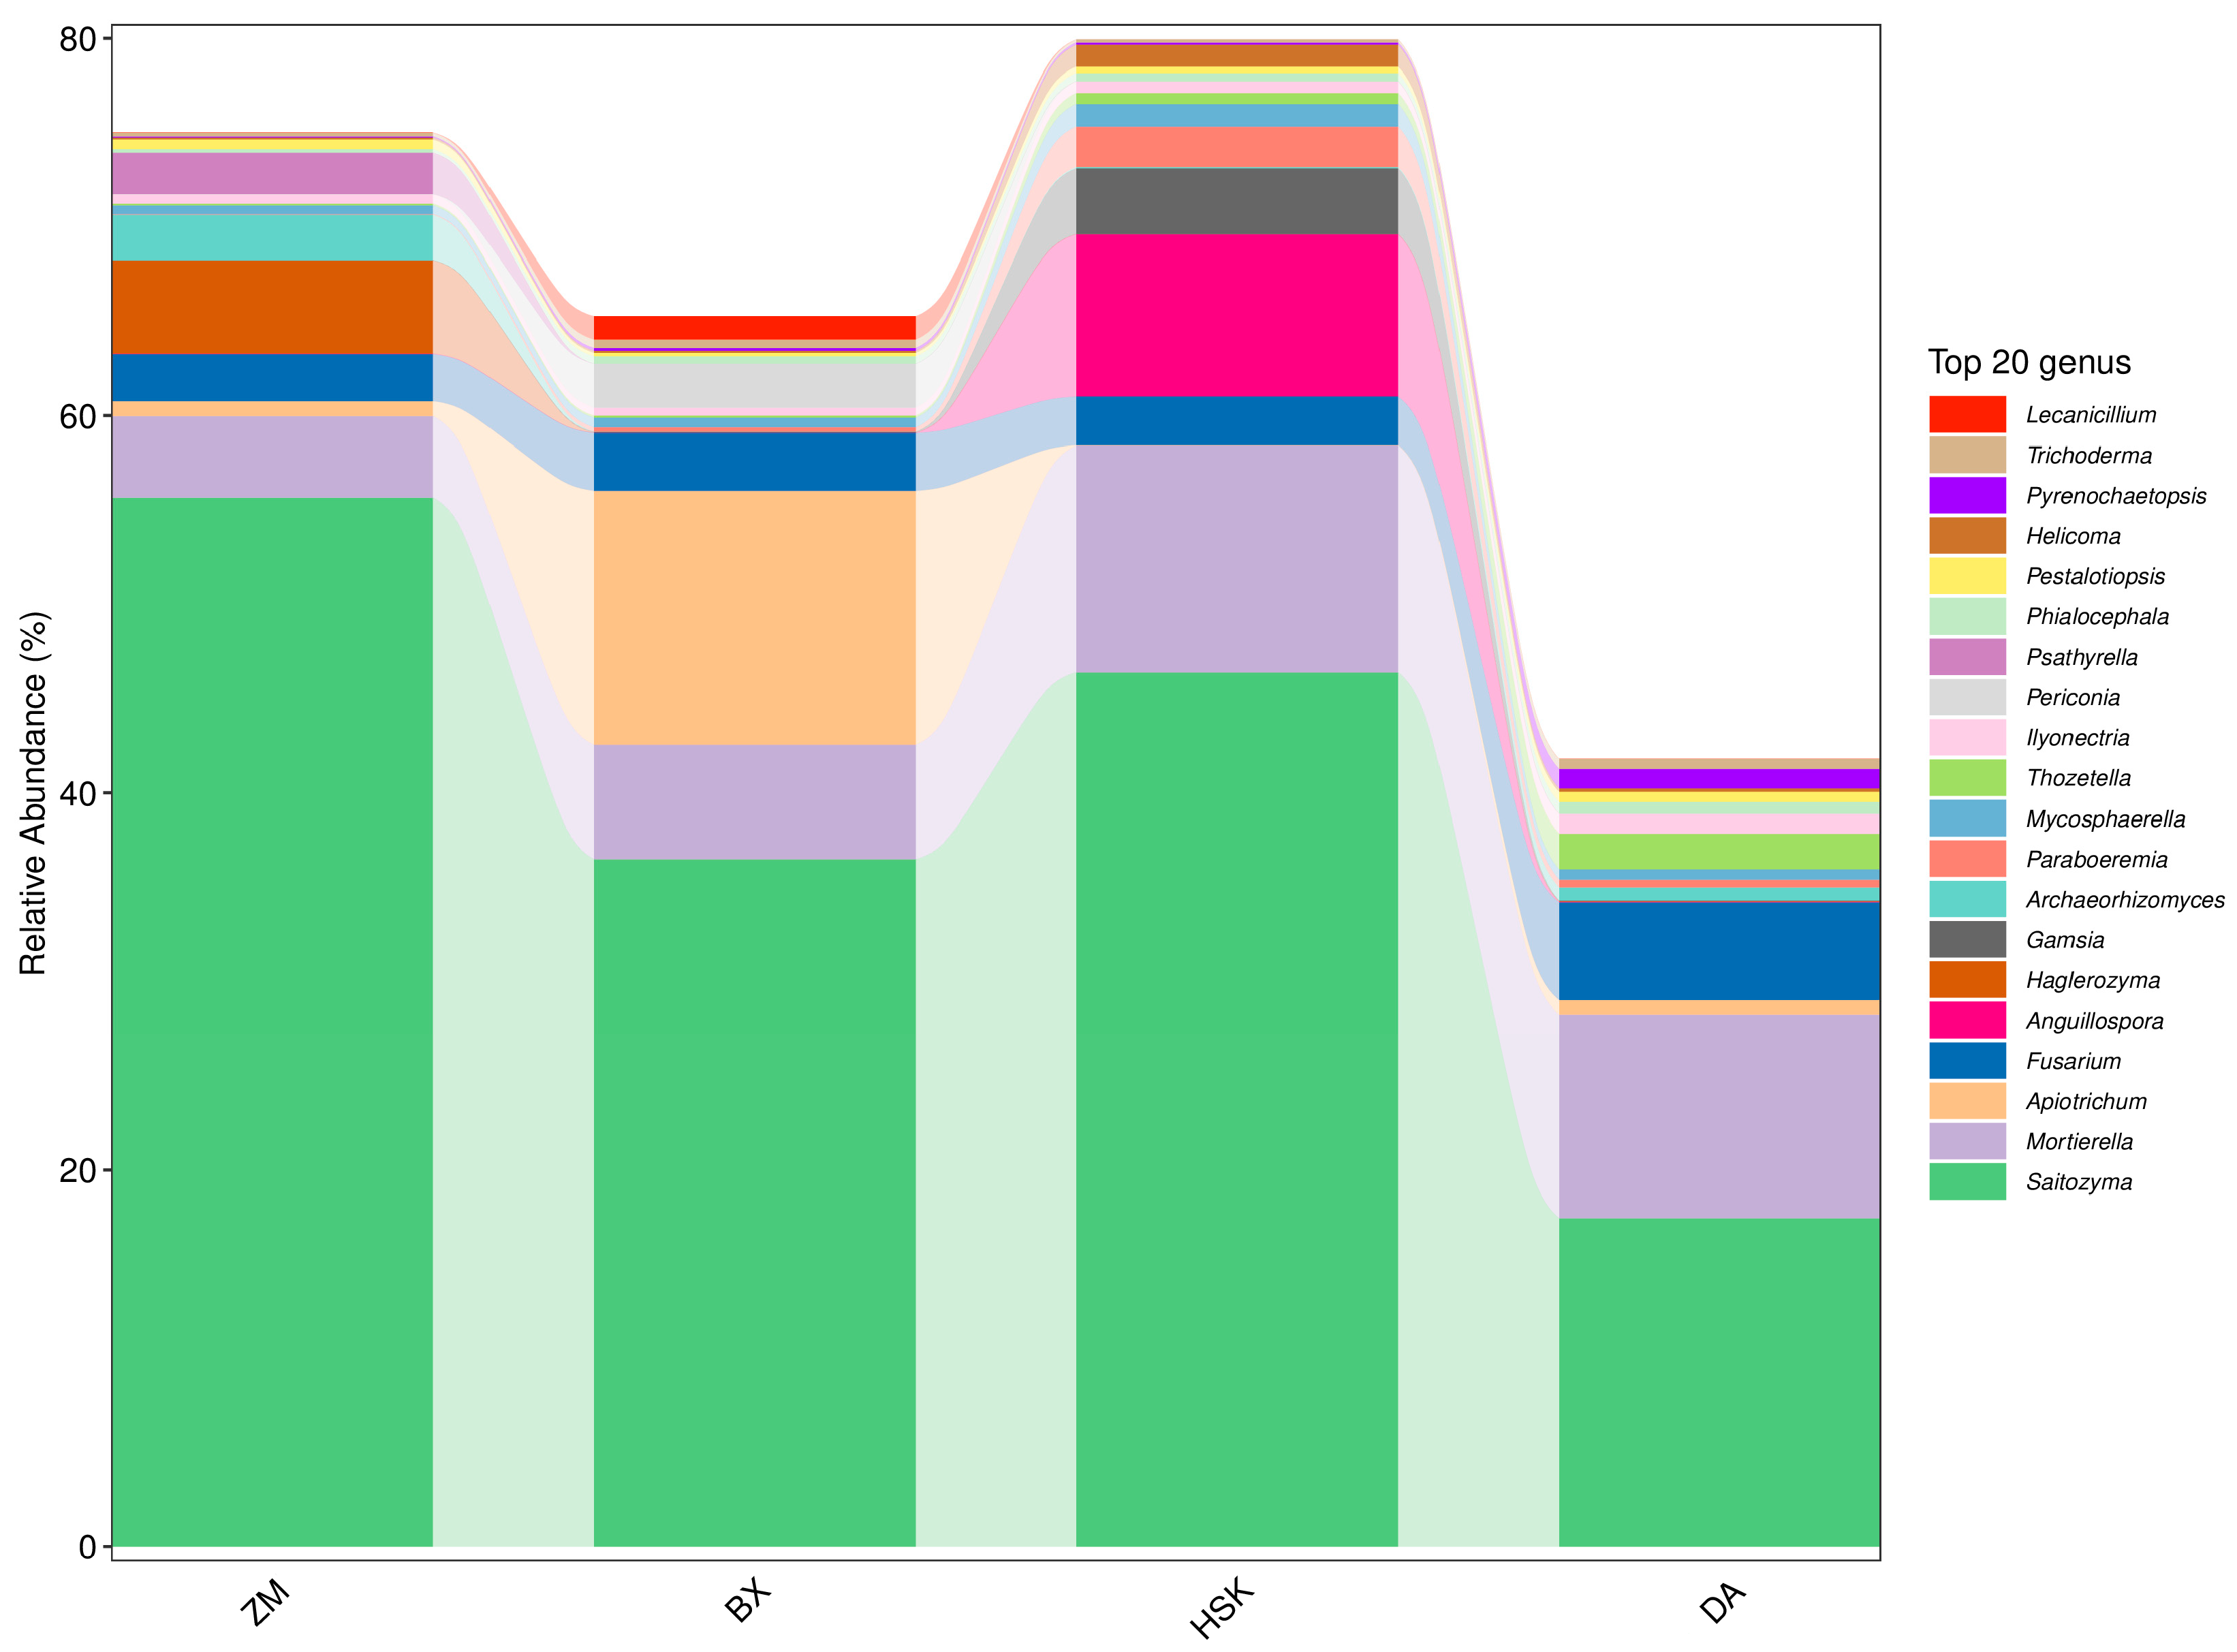
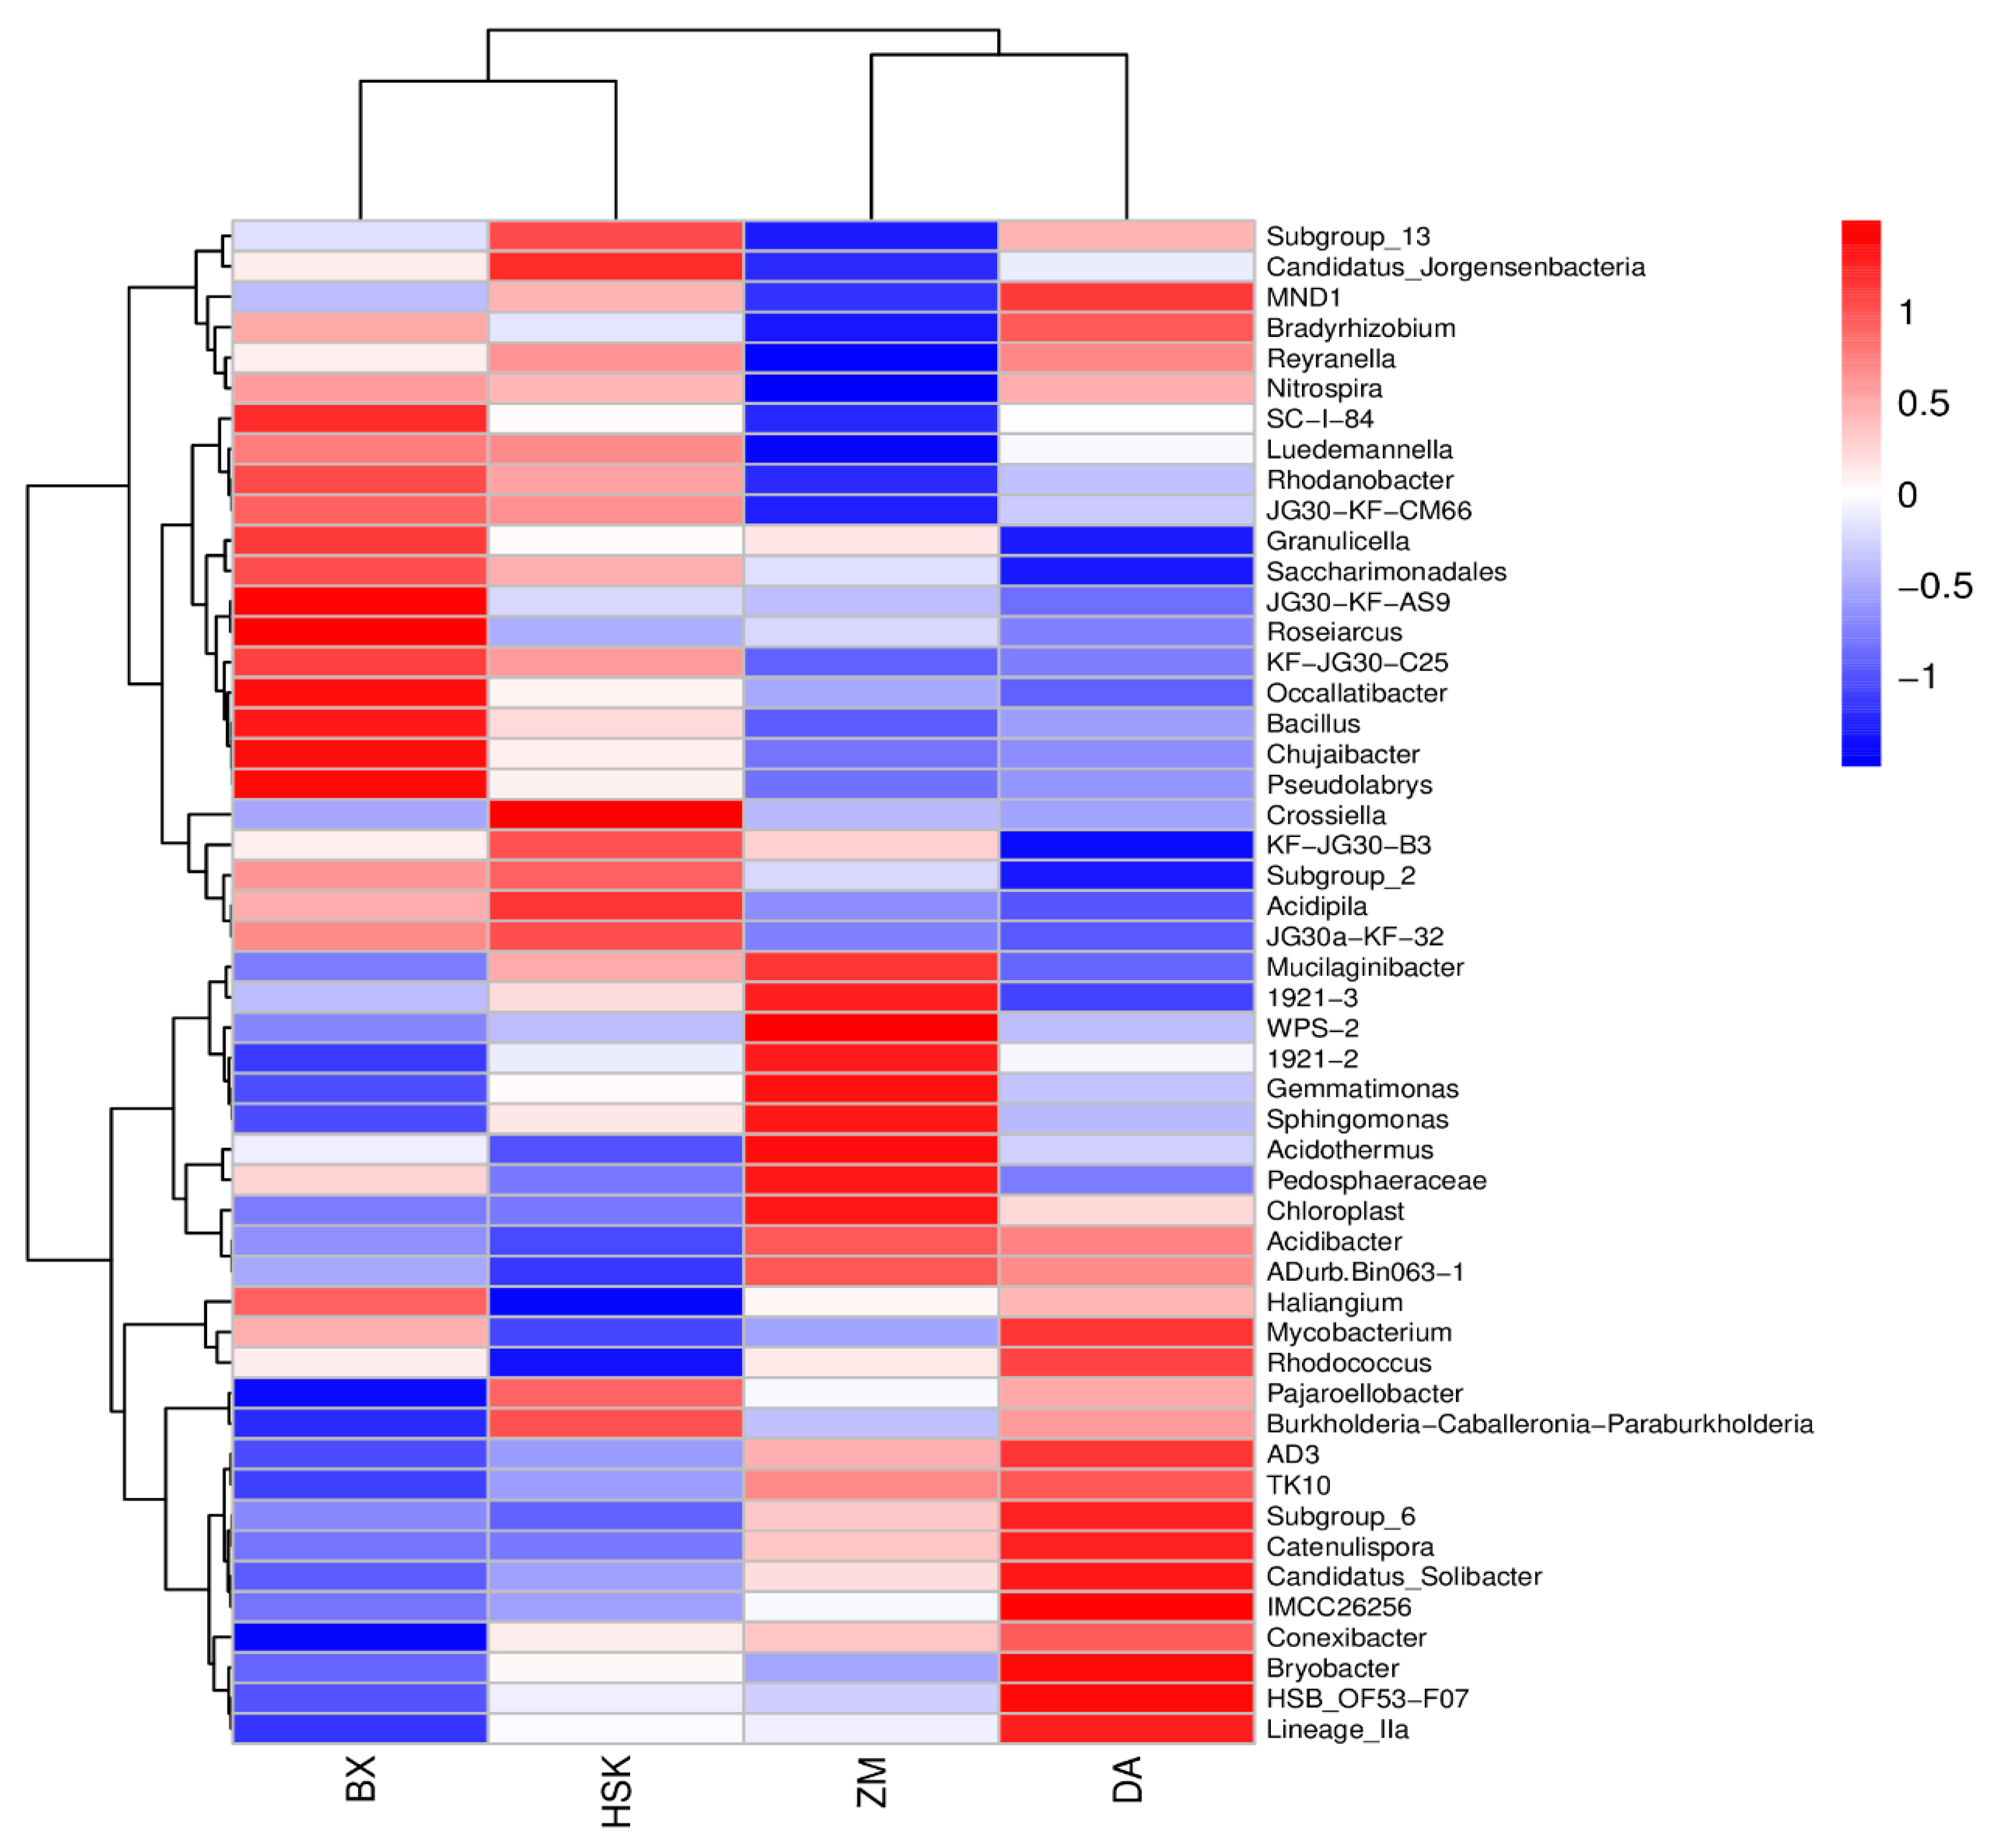
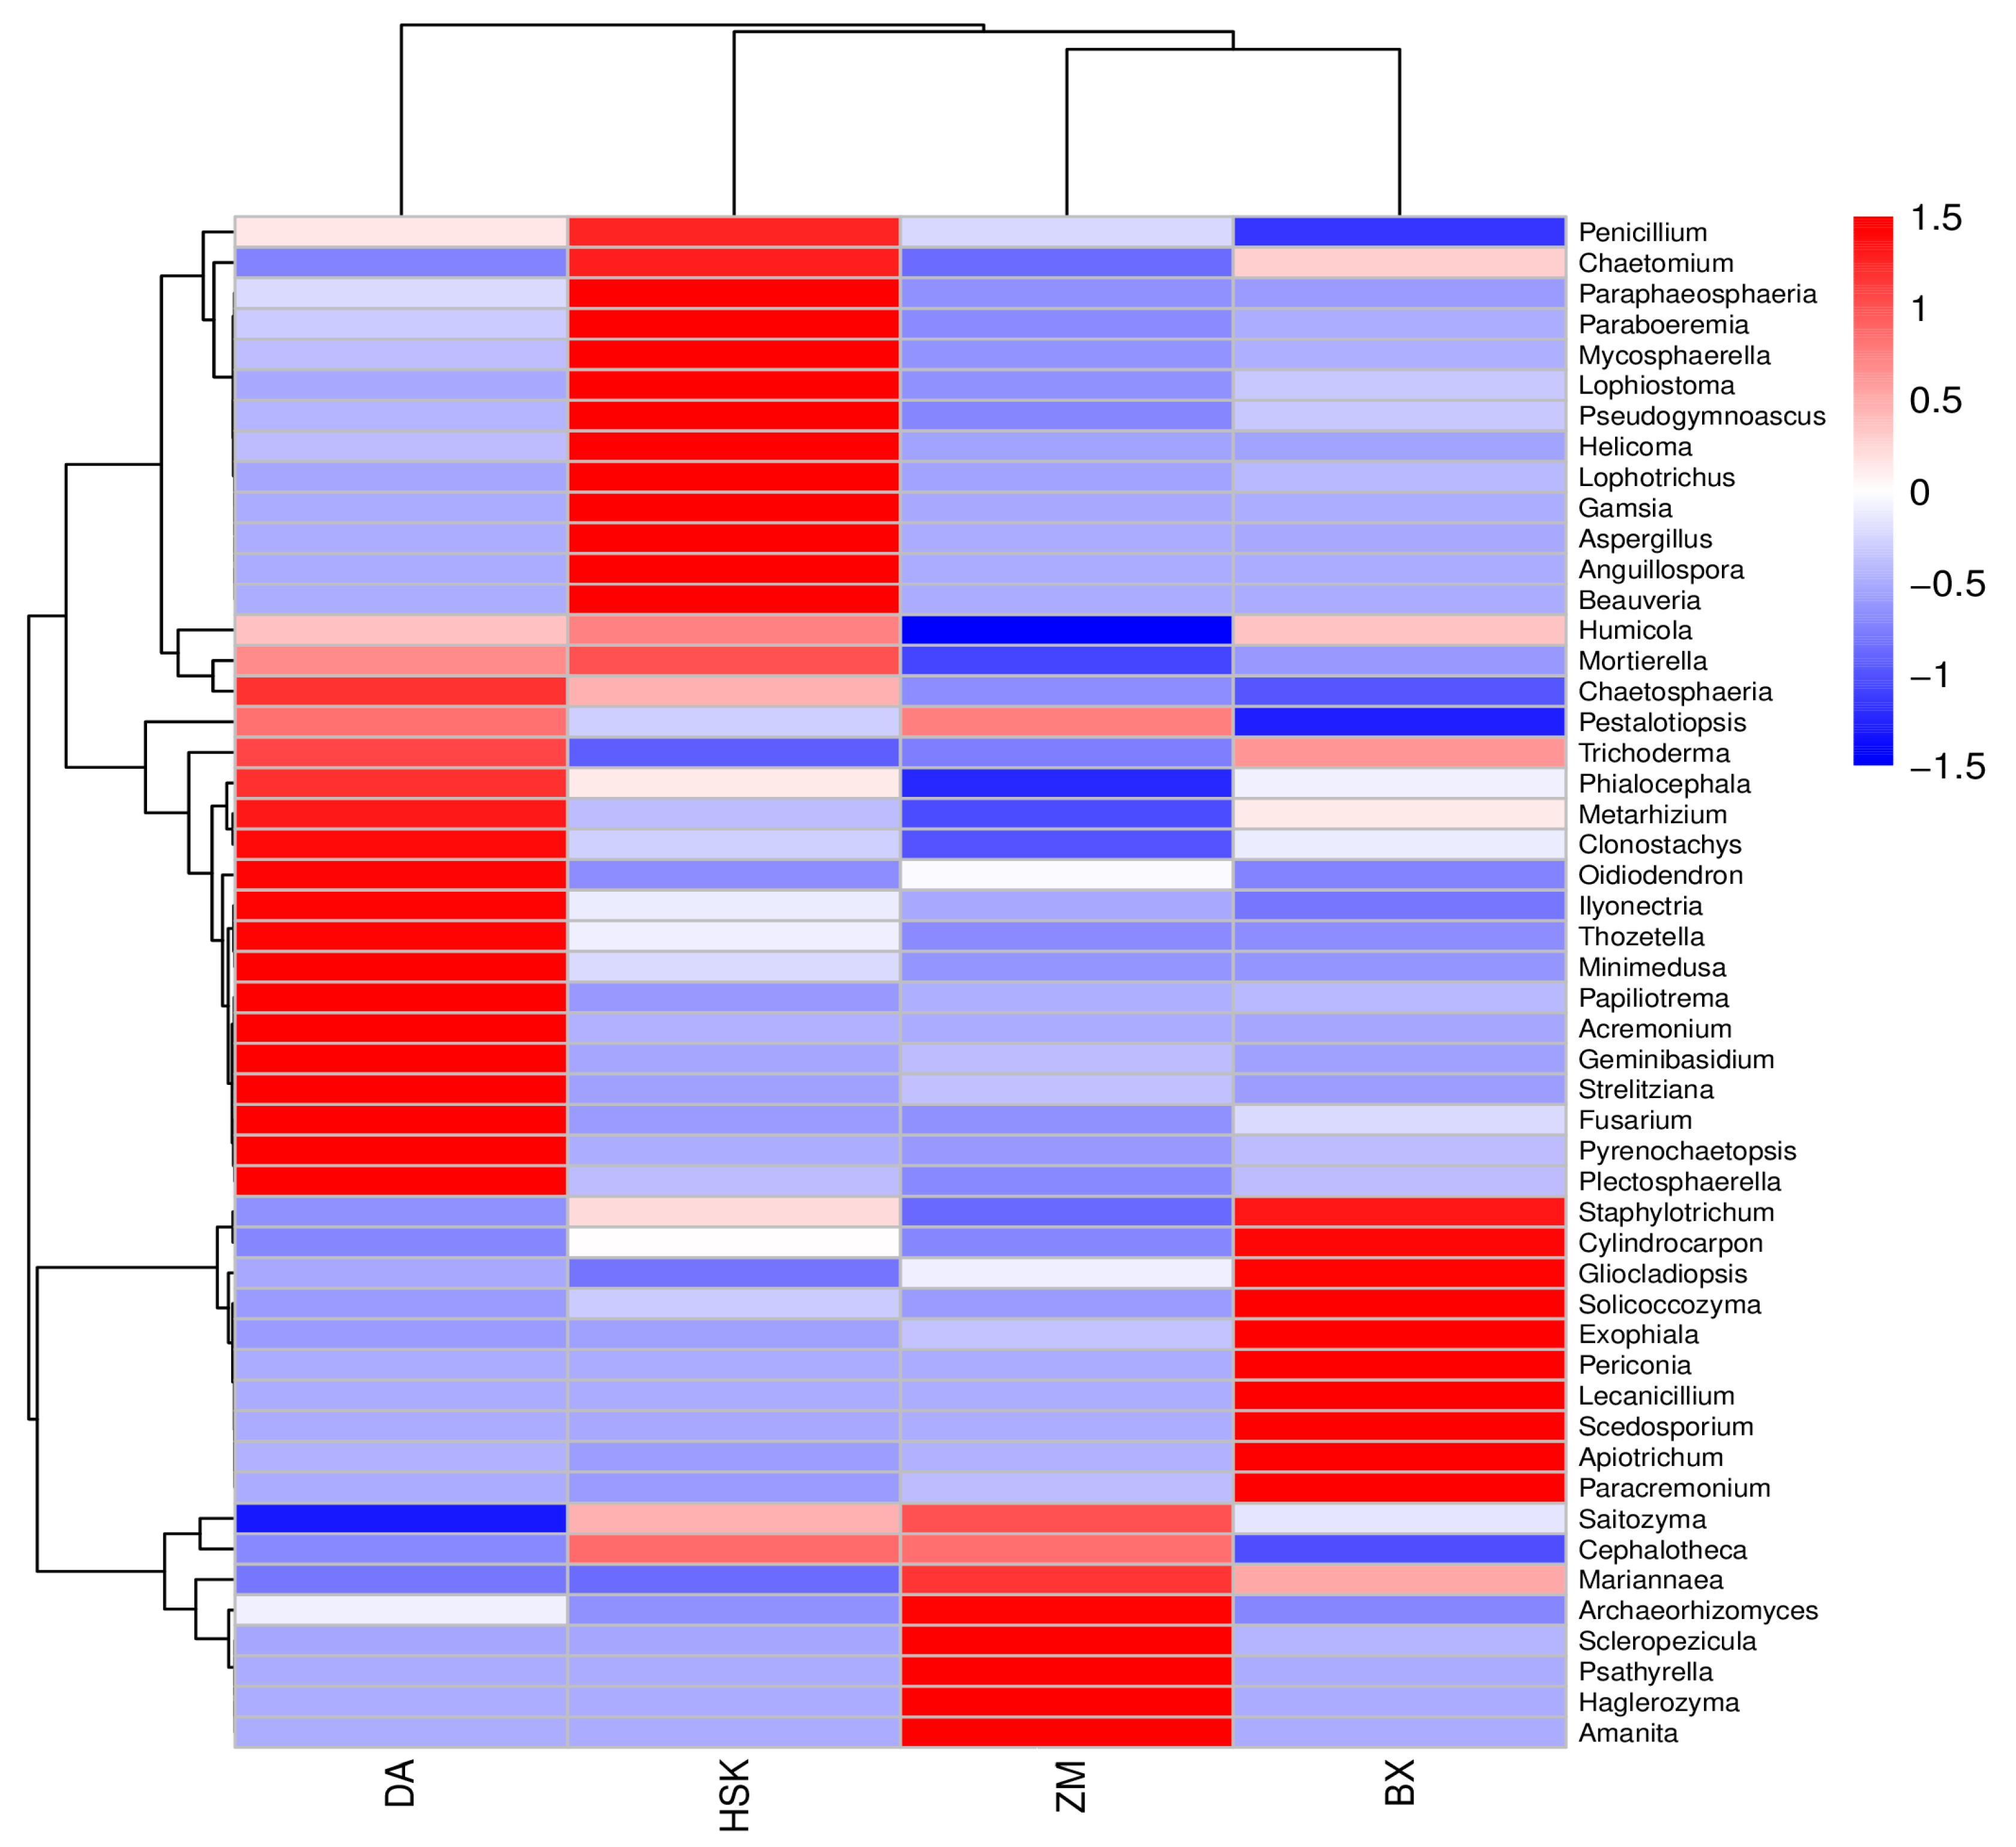
3.2.5. Structural Composition of Soil Bacteria and Fungi at the Genus Level

The results of sequencing analysis of samples showed that the top 20 dominant bacterial genera are as shown in Figure 6. Subgroup_2 (11.43–15.87%), AD3 (5.19–14.61%), and Acidothermus (2.68–5.87%) are the three dominant bacterial genera shared by all ancient tea tree plantations. The dominant bacterial genera in the ancient tea plantations soil are consistent with previous studies. The dominant genera of soil bacterial communities in tea plantations are mainly Subgroup_2, AD3, Acidothermus, Acidibacter, Rhizomicrobium, and Bradyrhizobium [34,36]. Acidothermus is a dominant microbial species in tea plantations, and it is significantly correlated with the physicochemical indices of tea plantations soils [37].
The results of sequencing analysis of samples showed that the top 20 dominant fungal genera are as shown in Figure 7. Saitozyma (17.47–55.66%) and Mortierella (4.32–12.01%) are the two dominant fungal genera shared by all ancient tea plantations. Additionally, the abundance of Apiotrichum in the BX ancient tea plantation was significantly higher than that in other ancient tea plantations. The dominant fungal genera in the ancient tea plantations soil are also consistent with previous studies. Saitozyma, Mortierella, and Fusarium are the three major dominant genera in the rhizosphere soil of tea plantations [36,38,39]. Paraboeremia, a genus specific to the rhizosphere soil of alpine grasslands, and Trichoderma can enrich beneficial microbial communities, improve soil nutrient status, promote plant growth, and enhance plant drought resistance [40].
A hierarchical clustering heatmap analysis at the genus level was performed based on the top 50 bacterial taxa with the highest average abundances across 24 samples, as shown in Figure 8. BX and HSK exhibited similar bacterial community structures and compositions at the genus level, while ZM and DA showed analogous structural patterns and abundance compositions. The abundances of SC-1–84, Luedemannella, Rhodanobacter, JG30-KF-CM66, Granulicella, Saccharimonadales, JG30-KF-AS9, Roseiarcus, KF-JG30-C25, Occallatibacter, Bacillus, Chujaibacter, and Pseudolabrys in BX were higher than those in other tea plantations. The abundances of Subgroup_13, Candidatus_Jorgensenbacteria, Pajaroellobacter, Burkholderia-Caballeronia-Paraburkholderia, Crossiella, KF-JG30-B3, Subgroup_2, Acidipila, and JG30a-KF-32 in HSK were higher than those in other tea plantations. Additionally, the abundances of Mucilaginibacter, 1921-3, WPS-2, 1921-2, Gemmatimonas, Sphingomonas, Acidothermus, Pedosphaeraceae, Chloroplast, Acidibacter, and ADurb. Bin063-1 in ZM were higher than those in other tea plantations, while the abundances of MND1, Bradyrhizobium, Mycobacterium, Rhodococcus, AD3, TK10, Subgroup_6, Catenulispora, Candidatus_Solibacte, IMCC26256, Conexibacter, Bryobacter, HSB OF53-F07, and Lineage_lla in DA were higher than those in other tea plantations.
The dominant bacterial genera in tea plantation soils were primarily Subgroup_2, AD3, Acidothermus, Acidibacter, Rhizomicrobium, and Bradyrhizobium, which is consistent with previous research findings [37,41].
A hierarchical clustering heatmap analysis at the genus level based on the top 50 fungal taxa with the highest average abundances across 24 samples is shown in Figure 9. ZM and BX exhibited similar structures and abundance compositions of fungal communities at the genus level, which were significantly different from those of HSK and DA. The abundances of Penicillium, Chaetomium, Paraphaeosphaeria, Paraboeremia, Mycosphaerella, Lophiostoma, Pseudogymnoascus, Helicoma, Lophotrichus, Gamsia, Aspergillus, Anguillospora, Beauveria, Humicola, Mortierella and Cephalotheca in HSK were higher than those in other tea plantations, while the abundances of Chaetosphaeria, Pestalotiopsis, Trichoderma, Phialocephala, Metarhizium, Clonostachys, Oidiodendron, Ilyonectria, Thozetella, Minimedusa, Papiliotrema, Acremonium, Geminibasidium, Strelitziana, Fusarium, Pyrenochaetopsis and Plectosphaerella in DA were higher than those in other tea plantations. The abundances of Saitozyma, Mariannaea, Archaeorhizomyces, Scleropezicula, Psathyrella, Haglerozyma and Amanita in ZM were higher than those in other tea plantations, and the abundances of Staphylotrichum, Cylindrocarpon, Gliocladiopsis, Solicoccozyma, Exophiala, Periconia, Lecanicillium, Scedosporium, Apiotrichum, and Paracremonium in BX were higher than those in other tea plantations. Saitozyma, Mortierella, and Fusarium were the three dominant genera in the rhizosphere soil of tea plantations.

3.3. Correlation Analysis

3.3.1. Correlation Between Soil Fertility Indicators and Rhizosphere Microbial Diversity Metrics

The Pearson correlation analysis between soil physicochemical properties and bacterial microbial diversity is presented in Table 8. Soil pH and TN showed significant positive correlations with both the Shannon and Pielou indices, indicating that higher soil pH and greater TN content promote better bacterial community diversity and evenness. AN was significantly positively correlated with the Simpson index and Observed species, suggesting that increased AN content enhances the richness of bacterial diversity in soil. TK exhibited significant positive correlations with the Simpson, Pielou, and Shannon indices, demonstrating that higher TK levels improve both the richness and evenness of soil bacterial communities. Among the surveyed ancient tea plantations, soil pH, TN, AN, and TK emerged as key environmental indicators influencing soil bacterial diversity.
The correlation analysis revealed that soil pH, TN, AN, and TK serve as key environmental factors influencing bacterial diversity in tea plantation soils. Specifically, in acidic tea plantations, soil pH demonstrated a strong positive correlation with the alpha diversity of soil bacterial communities, which aligns with findings from previous studies [42,43].
The Pearson correlation analysis between soil physicochemical properties and fungal microbial diversity is presented in Table 9. AN showed significant positive correlations with both the Shannon and Pielou indices, indicating that higher AN content promotes greater richness and evenness in soil fungal communities. SOM and TN exhibited highly significant positive correlations with the Simpson index, along with significant positive correlations with the Shannon and Pielou indices, demonstrating that increased SOM and TN levels enhance the richness of fungal diversity. TN, SOM, and AN emerged as key physicochemical indicators influencing fungal diversity across different tea plantations.
The findings from Dancong ancient tea plantations align with previous research, demonstrating that soil pH and AN serve as primary environmental determinants of bacterial diversity [44,45,46], while SOM and AP emerge as dominant factors governing fungal community diversity and structure [1,47,48].

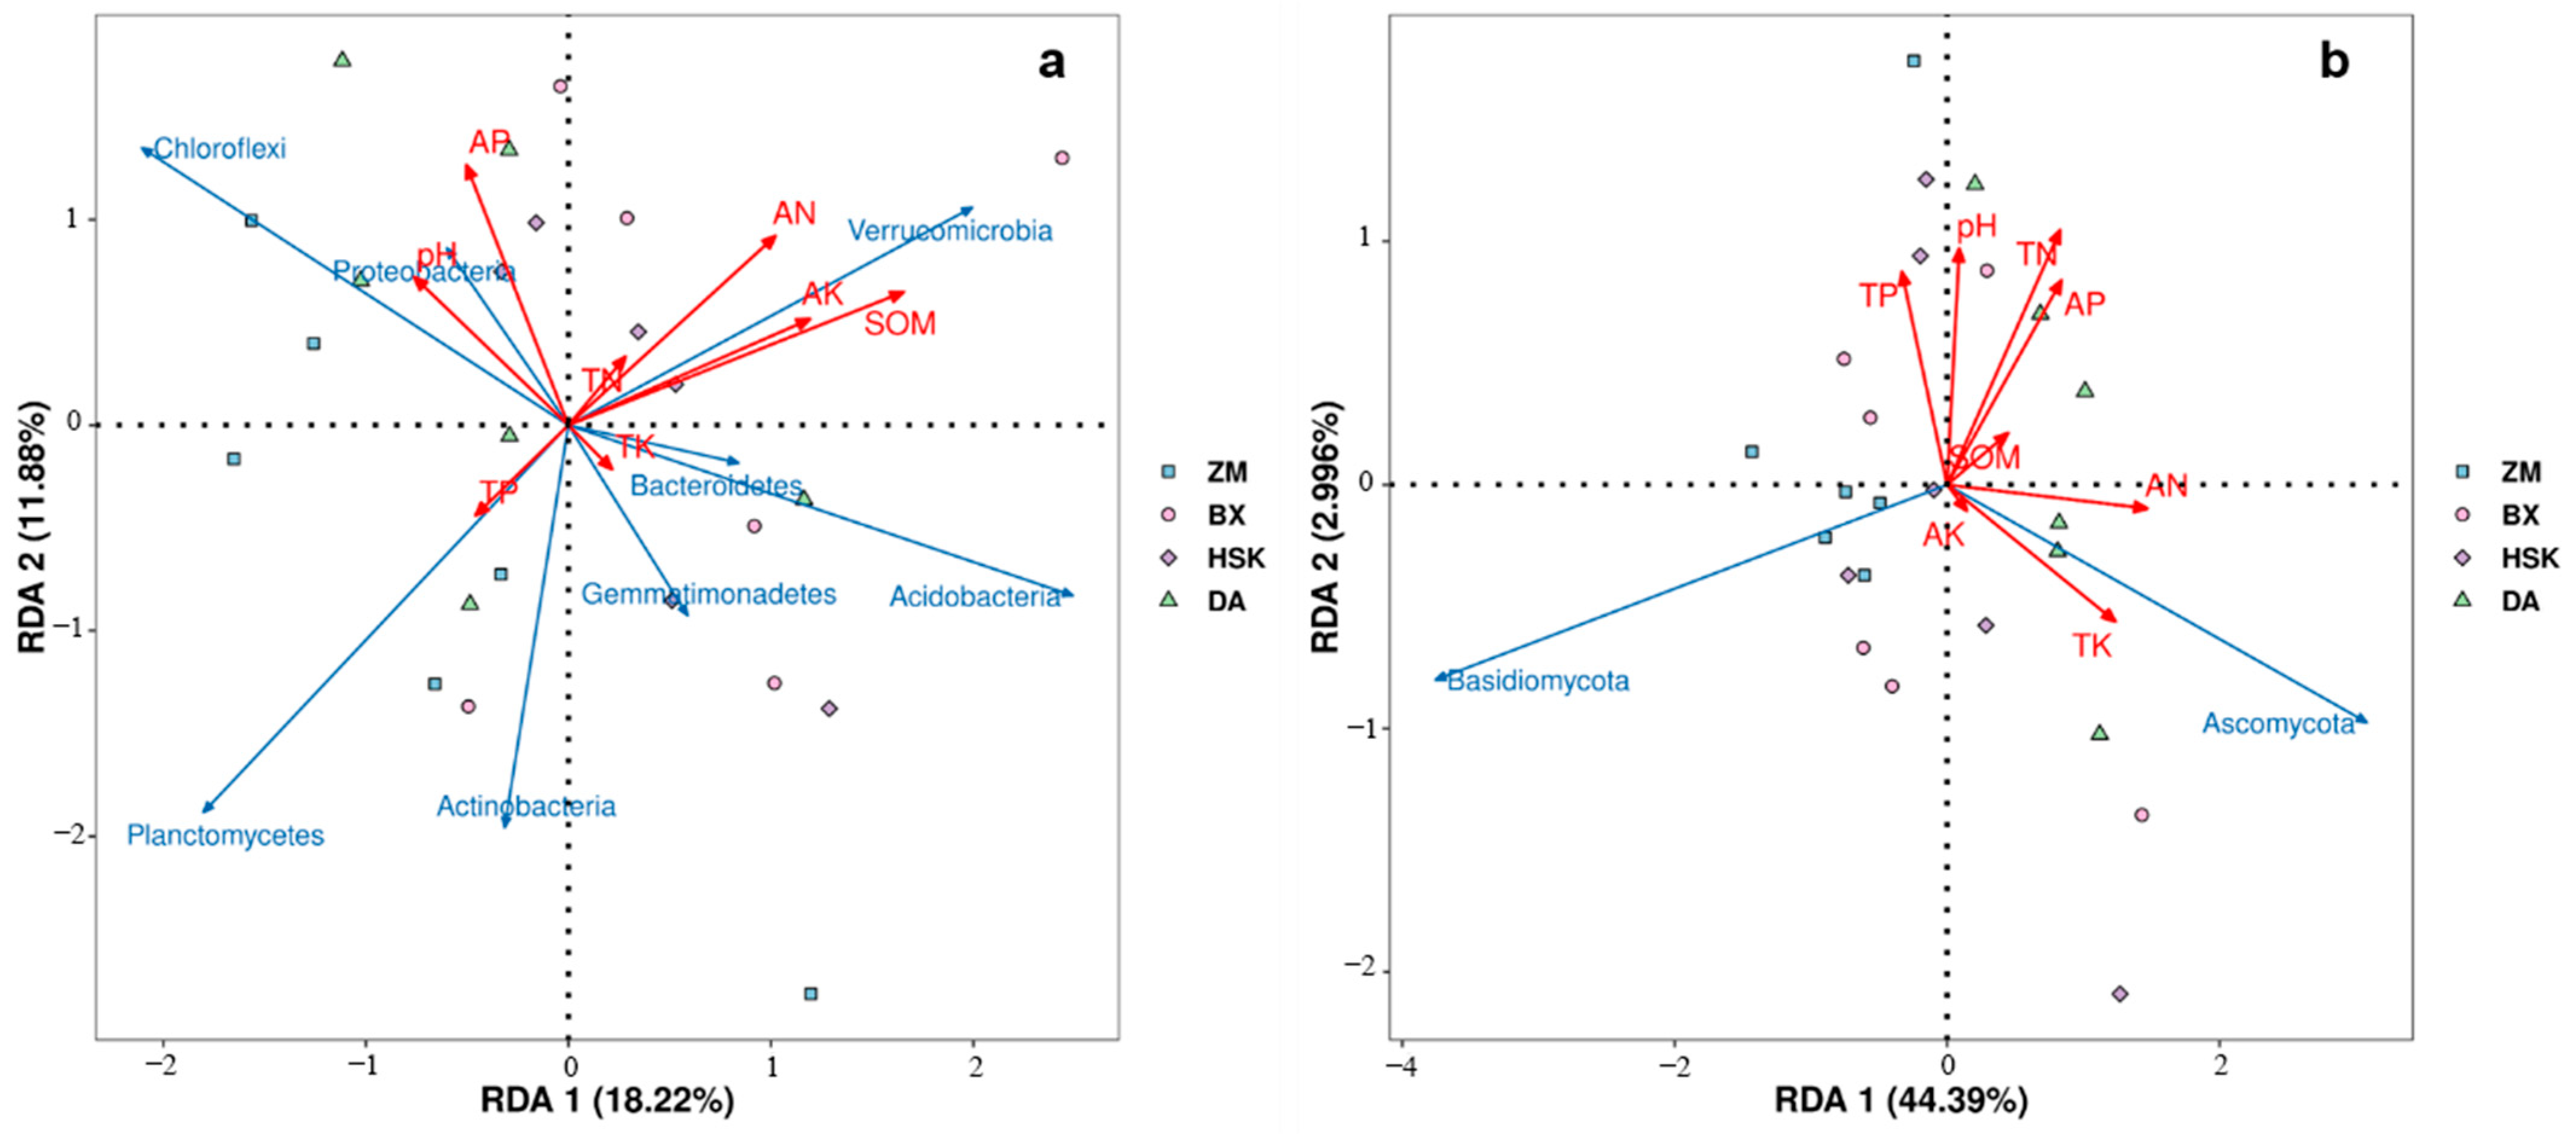
3.3.2. Redundancy Analysis of Rhizosphere Soil Microorganisms and Soil Fertility Indicators

To investigate the influence of soil physicochemical properties on rhizosphere microbial communities, redundancy analysis (RDA) was conducted on the rhizosphere community structure and soil fertility indicators in Dancong ancient tea plantations. The effects of soil physicochemical properties on bacterial communities are shown in Figure 10a and Figure 11a, while their impacts on fungal communities are presented in Figure 10b and Figure 11b.
At the bacterial phylum level, the first axis explained 18.22% of the variance, and the second axis explained 11.88%, cumulatively accounting for 30.10% of the species-environment variation, indicating that soil physicochemical properties were closely associated with 30.10% of the changes in rhizosphere soil bacterial community structure at the phylum level. pH was positively correlated with AP and TP, and negatively correlated with other physicochemical properties. Chloroflexi was positively correlated with pH, Proteobacteria was positively correlated with pH and AP, Verrucomicrobia was positively correlated with TN, AN, AK, and SOM. Gemmatimonadetes was positively correlated with TK, and Planctomycetes was positively correlated with TP. At the fungal phylum level, the first axis explained 44.39% of the variance, and the second axis explained 3.00%, cumulatively accounting for 47.39% of the species–environment variation, indicating that soil physicochemical properties were closely associated with 47.39% of the changes in rhizosphere soil fungal community structure at the phylum level. pH was negatively correlated with AN, AK, and TK, and positively correlated with other physicochemical properties. Ascomycota was positively correlated with AN, AK, and TK.
At the bacterial genus level, the first axis explained 20.24% of the variance, and the second axis explained 13.17%, cumulatively accounting for 33.41% of the species–environment variation. This indicates that soil physicochemical properties were significantly correlated with 33.41% of the variation in rhizosphere bacterial community structure. pH was positively correlated with AP, TP, TK, and TN. AK showed a positive correlation with JG30-KF-AS9. AN was positively associated with Bradyrhizobium. Both TK and TN were positively correlated with Mycobacterium. pH and AP were positively linked to Bryobacter, while TP was positively correlated with AD3. At the fungal genus level, the first axis explained 19.05% of the variance, and the second axis explained 13.73%, cumulatively accounting for 32.78% of the species–environment variation. This suggests that soil physicochemical properties were closely associated with 32.78% of the variation in rhizosphere fungal community structure at the genus level. pH was positively correlated with SOM, TN, AP, and TP, while it was negatively correlated with TP, AN, TK, and AK. AK was positively correlated with Anguillospora and Apiotrichum. pH showed a positive correlation with Fusarium, and Mortierella was positively associated with TN, TP, AP, and SOM.

4. Discussion

4.1. Soil pH in Dancong Ancient Tea Plantations

Soil pH significantly influences nutrient availability, tea plant absorption and utilization, as well as microbial activity. In addition, the pH level of tea plantations soil directly affects tea plant growth, as well as the quality and yield of tea leaves [49]. Tea plants are acidophilic and thrive in soil with a pH range of 4.0~6.5, with their optimal growth occurring at pH 4.5~5.5 [50]. When the pH exceeds 6.5, tea plants exhibit stunted growth, whereas pH levels dipping below 4.0 cause deterioration of the soil’s physical and chemical properties, reduced soil nutrient availability, and inhibited growth of tea seedlings [18]. Relevant research demonstrates that maintaining the soil pH around 5 optimally promotes root development in tea plants while concurrently enhancing rhizosphere soil fertility [20,51]. This study found that the soil pH in the Dancong ancient tea plantations of the Fenghuang tea region ranged from 4.77 to 5.38, and the soil pH of the ancient tea plantations is suitable for the growth of tea plants. Generally, fertilization is the leading cause of soil acidification in tea plantations [50]. Even if the current soil pH is suitable, subsequent fertilization still requires special attention. Substantial factors, including tea plant metabolism, acid rain, and inherent soil properties, can exacerbate soil acidification [52]. Thus, periodic pH monitoring in ancient tea plantations becomes imperative. If soil acidification occurs due to factors such as improper fertilization in the future, acidification can be alleviated by applying organic fertilizers, alkaline fertilizers, and other means to ensure the growth of tea plants.

4.2. Soil Nutrients of Dancong Ancient Tea Plantations

The soil fertility index can eliminate the influence of subjective factors and objectively reflect the comprehensive level of soil fertility in tea plantations. The total soil nutrients and their available forms are a direct reflection of the soil fertility capacity in tea plantations. Tea plants continuously absorb nutrients such as nitrogen, phosphorus, and potassium at all growth stages to maintain their normal growth and development [50,53]. Nitrogen deficiency impairs the synthesis of proteins, nucleic acids, and chlorophyll within tea plants, resulting in stunted elongation of new shoots and compromised tea yield and quality [54]. Phosphorus affects the photosynthesis, respiration, and growth of tea plants. Meanwhile, various enzymatic reactions and energy transfer in tea plants are also closely related to phosphorus [55]. Potassium can enhance photosynthesis in tea plants, regulate their water absorption and utilization, and improve drought resistance. When soil potassium content is extremely low, potassium application can enhance the quality of tea [56]. This study found that in terms of TN, TP, SOM, and AP, both the surface soil and subsurface soil of the Dancong ancient tea plantations were at Level I fertility. For the TK index, only the surface soil of BX tea plantations (0.93) and the subsurface soil of ZM tea plantations (0.97) were close to Level I fertility, while other tea plantations had already reached Level I fertility. However, since the TK index of the subsurface soil in BX tea plantations (1.05) and the surface soil in ZM tea plantations (1.12) met the Level I standard, the TK of Dancong ancient tea plantations can be classified as Level I or near Level I fertility. The AN index showed similar results: most tea plantations were at Level I fertility, with only a few approaching this level. However, none of the four tea plantations achieved Level I fertility in terms of AK, indicating an overall potassium deficiency. It is recommended to apply appropriate potassium fertilizers and potassium-solubilizing bacteria to increase the available potassium content in tea plantations soil and maintain the balance of various potassium forms so as to improve the overall soil fertility level.

4.3. Diversity of Soil Microbial Communities in Ancient Tea Plantations

Alpha diversity analysis showed that the alpha diversity of bacteria and fungi in DA was higher than that in the other three tea plantations. Beta diversity analysis showed that the bacteria and fungi in the rhizosphere soil of ZM were the most different from those in other tea plantations. Correlation analysis showed that soil pH, TN, AN, and TK were the key environmental factors affecting soil bacterial diversity. Previous studies have shown that in acidic tea plantations, soil pH was strongly positively correlated with the alpha diversity of soil bacterial communities [42,43]. TN, AN, AP, and AK are the key physicochemical factors affecting soil fungal diversity in different tea plantations. Previous studies have also shown that AN, AP, and AK may be the main factors affecting soil fungal diversity and community composition in tea plantations [20].
The dominant bacterial phyla in the rhizosphere soil of ancient Dancong tea plantations are Proteobacteria, Acidobacteriota, Chloroflexi, Actinobacteria, Bacteroidetes, Gemmatimonadetes, and Verrucomicrobia. Similar to previous studies, Proteobacteria, Acidobacteriota, and Actinobacteria are the most abundant phyla in tea plantation soils [40,57]. Tea plantations with shorter ages exhibit higher abundances of Proteobacteria and Actinobacteria, and the relative abundance of Proteobacteria increases with the increase in nitrogen application, which is associated with the abundant available nutrients in the soil [58]. The Acidobacteriota demonstrates higher abundance in soils with extremely low resource availability, yet interestingly shows increased prevalence in long-established tea plantations [59,60]. The dominant genera of soil bacterial communities in tea plantations are mainly Subgroup_2, AD3, Acidothermus, Acidibacter, Rhizomicrobium, and Bradyrhizobium [41]. The dominant fungal phyla in the rhizosphere soil of ancient Dancong tea plantations are Basidiomycota, Ascomycota, and Mortierellomycota [58,61]. Saitozyma, Mortierella, and Fusarium are the three dominant fungal genera in the rhizosphere soil of tea plantations. Mortierella is positively correlated with TN, TP, AP, and SOM. SOM plays a crucial role in explaining the unique soil fungal community in tea plantations.

5. Conclusions

Subgroup_2, AD3, Acidothermus, Acidibacter, Rhizomicrobium, and Bradyrhizobium are the dominant genera of soil bacterial communities in the Dancong ancient tea tree plantations of Fenghuang Mountain, while the three major dominant fungal genera in the rhizosphere soil of tea plantations are Saitozyma, Mortierella, and Fusarium. pH, total nitrogen, alkali-hydrolyzable nitrogen, and total potassium in the soil of Dancong ancient tea tree plantations are the key physicochemical properties affecting soil bacterial diversity, whereas total nitrogen, alkali-hydrolyzable nitrogen, available phosophorus, and available potassium are the key physicochemical properties influencing soil fungal diversity in different tea plantations.
The planting soil of Dancong ancient tea plantations in the Fenghuang Mountain has reached Level I fertility in terms of total nitrogen, total phosphorus, soil organic matter, and available phosophorus. Total potassium and alkali-hydrolyzable nitrogen show Level I or near-Level I fertility, but soil available potassium only meets Level III fertility for tea planting, serving as the main limiting factor for soil fertility quality.
In view of the fact that available potassium in tea plantations generally remains at the Grade III fertility level, water-soluble potassium fertilizers should be topdressed before spring tea sprouting and after summer tea picking, combined with the application of Arbuscular Mycorrhizal Fungi inoculants to expand the potassium absorption range. This approach can effectively improve the fertility level of soil available potassium in tea plantations. However, persistently excessive alkali-hydrolyzable nitrogen and soil organic matter may lead to disproportionate proliferation of dominant microbial taxa while suppressing functional microbial groups and disrupting ecological balance; therefore, optimized nutrient application strategies should be implemented during fertilization.

Author Contributions

Conceptualization, J.L.; methodology, W.H. and X.L.; validation, J.L. and W.H.; formal analysis, J.L. and W.H.; investigation, W.H.; resources, P.Z. and S.L.; data curation, J.L.; writing—original draft preparation, J.L.; writing—review and editing, W.K. and P.Z.; supervision, P.Z.; project administration, B.S., H.Z. and P.Z.; funding acquisition, S.L. All authors have read and agreed to the published version of the manuscript.

Funding

This work was supported by the Innovative team construction project of modern agricultural industrial technology system in Guangdong Province with agricultural products as unit (tea industry technology system) (2024CXTD11).

Institutional Review Board Statement

Not applicable.

Data Availability Statement

The datasets used or analyzed during the current study are available from the corresponding author upon reasonable request.

Acknowledgments

The authors would like to thank the anonymous reviewers for their critical comments and suggestions for improving this manuscript.

Conflicts of Interest

The authors declare no conflicts of interest.

References

  1. Tan, L.; Gu, S.; Li, S.; Ren, Z.; Deng, Y.; Liu, Z.; Gong, Z.; Xiao, W.; Hu, Q. Responses of Microbial Communities and Interaction Networks to Different Management Practices in Tea Plantation Soils. Sustainability 2019, 11, 4428. [Google Scholar] [CrossRef]
  2. Zhang, S.; Liu, W.; Cheng, X.; Wang, Z.; Yuan, F.; Wu, W.; Liao, S. Evaluating the Productivity of Ancient Pu’er Tea Trees (Camellia sinensis Var. Assamica): A Multivariate Modeling Approach. Plant Methods 2022, 18, 95. [Google Scholar] [CrossRef] [PubMed]
  3. Jahan, I.; Shopan, J.; Rahman, M.M.; Sarkar, A.; Baset, M.A.; Zhang, Z.; Li, X.; Ahammed, G.J.; Hasan, M.K. Long-Term Traditional Fertilization Alters Tea Garden Soil Properties and Tea Leaf Quality in Bangladesh. Agronomy 2022, 12, 2128. [Google Scholar] [CrossRef]
  4. Ran, W.; Li, Q.; Hu, X.; Zhang, D.; Yu, Z.; Chen, Y.; Wang, M.; Ni, D. Comprehensive Analysis of Environmental Factors on the Quality of Tea (Camellia sinensis Var. Sinensis) Fresh Leaves. Sci. Hortic. 2023, 319, 112177. [Google Scholar] [CrossRef]
  5. Xin, W.; Zhang, J.; Yu, Y.; Tian, Y.; Li, H.; Chen, X.; Li, W.; Liu, Y.; Lu, T.; He, B.; et al. Root Microbiota of Tea Plants Regulate Nitrogen Homeostasis and Theanine Synthesis to Influence Tea Quality. Curr. Biol. 2024, 34, 868–880.e6. [Google Scholar] [CrossRef]
  6. Chen, Y.; Fu, W.; Xiao, H.; Zhai, Y.; Luo, Y.; Wang, Y.; Liu, Z.; Li, Q.; Huang, J. A Review on Rhizosphere Microbiota of Tea Plant (Camellia sinensis L): Recent Insights and Future Perspectives. J. Agric. Food Chem. 2023, 71, 19165–19188. [Google Scholar] [CrossRef]
  7. Shang, J.; Sheng, Z.; Deng, M. A Microbial Consortium Enhances Tea Yield and Quality in a Field Study. Rhizosphere 2023, 26, 100691. [Google Scholar] [CrossRef]
  8. Wang, T.; Duan, Y.; Lei, X.; Cao, Y.; Liu, L.; Shang, X.; Wang, M.; Lv, C.; Ma, Y.; Fang, W.; et al. Tea Plantation Intercropping Legume Improves Soil Ecosystem Multifunctionality and Tea Quality by Regulating Rare Bacterial Taxa. Agronomy 2023, 13, 1110. [Google Scholar] [CrossRef]
  9. Zhang, Z.; Ge, S.; Fan, L.-C.; Guo, S.; Hu, Q.; Ahammed, G.J.; Yan, P.; Zhang, L.-P.; Li, Z.-Z.; Zhang, J.-Y.; et al. Diversity in Rhizospheric Microbial Communities in Tea Varieties at Different Locations and Tapping Potential Beneficial Microorganisms. Front. Microbiol. 2022, 13, 1027444. [Google Scholar] [CrossRef]
  10. Wang, Q.; Yang, R.; Peng, W.; Yang, Y.; Ma, X.; Zhang, W.; Ji, A.; Liu, L.; Liu, P.; Yan, L.; et al. Tea Plants with Gray Blight Have Altered Root Exudates That Recruit a Beneficial Rhizosphere Microbiome to Prime Immunity against Aboveground Pathogen Infection. Front. Microbiol. 2021, 12, 774438. [Google Scholar] [CrossRef]
  11. Chen, Y.; Wang, F.; Wu, Z.; Jiang, F.; Yu, W.; Yang, J.; Chen, J.; Jian, G.; You, Z.; Zeng, L. Effects of Long-Term Nitrogen Fertilization on the Formation of Metabolites Related to Tea Quality in Subtropical China. Metabolites 2021, 11, 146. [Google Scholar] [CrossRef]
  12. Yan, P.; Wu, L.; Wang, D.; Fu, J.; Shen, C.; Li, X.; Zhang, L.; Zhang, L.; Fan, L.; Wenyan, H. Soil Acidification in Chinese Tea Plantations. Sci. Total Environ. 2020, 715, 136963. [Google Scholar] [CrossRef]
  13. Li, Y.C.; Li, Z.; Li, Z.W.; Jiang, Y.H.; Weng, B.Q.; Lin, W.X. Variations of Rhizosphere Bacterial Communities in Tea (Camellia sinensis L.) Continuous Cropping Soil by High-Throughput Pyrosequencing Approach. J. Appl. Microbiol. 2016, 121, 787–799. [Google Scholar] [CrossRef]
  14. Arafat, Y.; Ud Din, I.; Tayyab, M.; Jiang, Y.; Chen, T.; Cai, Z.; Zhao, H.; Lin, X.; Lin, W.; Lin, S. Soil Sickness in Aged Tea Plantation Is Associated with a Shift in Microbial Communities as a Result of Plant Polyphenol Accumulation in the Tea Gardens. Front. Plant Sci. 2020, 11, 601. [Google Scholar] [CrossRef] [PubMed]
  15. Kui, L.; Xiang, G.; Wang, Y.; Wang, Z.; Li, G.; Li, D.; Yan, J.; Ye, S.; Wang, C.; Yang, L.; et al. Large-Scale Characterization of the Soil Microbiome in Ancient Tea Plantations Using High-Throughput 16S rRNA and Internal Transcribed Spacer Amplicon Sequencing. Front. Microbiol. 2021, 12, 745225. [Google Scholar] [CrossRef] [PubMed]
  16. Kaiyang, L. Bacteria Distribution Diversity in Tea Rhizospheric Soil from Different Habitats at Nannuo Mountain Based on 16S rRNA Sequence Analysis. J. Kunming Univ. Sci. Technol. 2016, 41, 89–95. [Google Scholar]
  17. Cao, H.-L.; Cai, F.-Y.; Jiao, W.-B.; Liu, C.; Zhang, N.; Qiu, H.-Y.; Rensing, C.; Lü, J. Assessment of Tea Garden Soils at an’xi County in Southeast China Reveals a Mild Threat from Contamination of Potentially Harmful Elements. R. Soc. Open Sci. 2018, 5, 180050. [Google Scholar] [CrossRef]
  18. Liu, J.; Zhang, N.-M.; Deng, H. Soil Nutrient Status and Fertility Evaluation of Tea Gardens in Menghai County. J. Agric. Resour. Environ. 2021, 38, 79–86. [Google Scholar]
  19. Ma, W.; Zhu, K.; Zhuo, Z. Effects of Acidification on Mineral Transformation and Potassium Supply Capacity of Tea Garden Soils. J. Tea Sci. 2023, 43, 17–26. [Google Scholar]
  20. Wang, Y.; Zhang, Q.; Li, J.; Lin, S.; Jia, X.; Zhang, Q.; Ye, J.; Wang, H.; Wu, Z. Study on the Effect of pH on Rhizosphere Soil Fertility and the Aroma Quality of Tea Trees and Their Interactions. Agriculture 2023, 13, 1739. [Google Scholar] [CrossRef]
  21. Yan, P.; Han, W.; Li, X.; Zhang, L.; Zhang, L. Present Situation and Analysis of Soil Acidification in Chinese Tea Garden. Sci. Agric. Sin. 2020, 53, 795–801. [Google Scholar]
  22. Ruan, L.; Li, X.; Song, Y.; Li, J.; Palansooriya, K.N. Effects of Tea Plant Varieties with High- and Low-Nutrient Efficiency on Nutrients in Degraded Soil. Plants 2023, 12, 905. [Google Scholar] [CrossRef]
  23. Tang, S.; Liu, Y.; Zheng, N.; Li, Y.; Ma, Q.; Xiao, H.; Zhou, X.; Xu, X.; Jiang, T.; He, P.; et al. Temporal Variation in Nutrient Requirements of Tea (Camellia sinensis) in China Based on QUEFTS Analysis. Sci. Rep. 2020, 10, 1745. [Google Scholar] [CrossRef] [PubMed]
  24. Su, N.I.U.; Qin, S.; Wei, F.A.N. Analysis on Site Soil Nutrients of Ancient Tea Trees in the Southwest State of Guizhou Province. Acta Agric. Zhejiangensis 2013, 25, 1348–1353. [Google Scholar]
  25. Yang, G.; Zhou, D.; Wan, R.; Wang, C.; Xie, J.; Ma, C.; Li, Y. HPLC and High-Throughput Sequencing Revealed Higher Tea-Leaves Quality, Soil Fertility and Microbial Community Diversity in Ancient Tea Plantations: Compared with Modern Tea Plantations. BMC Plant Biol. 2022, 22, 239. [Google Scholar] [CrossRef]
  26. Yang, G.R.; Wang, X.Q.; Li, Y.M.; Xie, J.; Lv, C.Y. Study on Soil Nutrients and Tea Quality of Ancient Tea Arboretum and Modern Terrace Tea Garden in Jingmai Mountain. J. Yunnan Agric. Univ. (Nat. Sci.) 2016, 31, 519–527. [Google Scholar]
  27. Yang, X.; Huang, X.; Hu, X.; Cheng, X.; Luo, Y. Changes in Rhizosphere and Bulk Soil Microbial Communities of Tableland Tea Garden and Ancient Tea Plantation in Southwest China. Agronomy 2024, 14, 1388. [Google Scholar] [CrossRef]
  28. Xu, L.; Wang, G.; Zhang, S.; Li, T.; Xu, X.; Gong, G.; Zhou, W.; Pu, Y.; Jia, Y.; Li, Y.; et al. Inhibition of High Sulfur on Functional Microorganisms and Genes in Slightly Contaminated Soil by Cadmium and Chromium. Environ. Pollut. 2024, 344, 123421. [Google Scholar] [CrossRef]
  29. Wang, S.; Li, T.; Zheng, Z.; Chen, H.Y.H. Soil Aggregate-Associated Bacterial Metabolic Activity and Community Structure in Different Aged Tea Plantations. Sci. Total Environ. 2019, 654, 1023–1032. [Google Scholar] [CrossRef]
  30. Yang, Y.; Wu, H.; Wang, Sh. Comparison of Microbial Communities in the Rhizosphere Soils from Two Varieties of Camellia sinensis in Yunnan Province, China. Microbiology 2021, 90, 801–804. [Google Scholar] [CrossRef]
  31. Yergeau, E.; Bokhorst, S.; Kang, S.; Zhou, J.; Greer, C.W.; Aerts, R.; Kowalchuk, G.A. Shifts in Soil Microorganisms in Response to Warming Are Consistent across a Range of Antarctic Environments. ISME J. 2012, 6, 692–702. [Google Scholar] [CrossRef] [PubMed]
  32. Song, L.; Niu, Z.; Chen, S.; Zhao, S.; Qiu, Z.; Wang, Y.; Hua, X.; Ding, Z.; Ma, Q. Effects of Pea-Tea Intercropping on Rhizosphere Soil Microbial Communities. Plant Soil 2025, 506, 125–135. [Google Scholar] [CrossRef]
  33. Dai, Z.; Su, W.; Chen, H.; Barberán, A.; Zhao, H.; Yu, M.; Yu, L.; Brookes, P.C.; Schadt, C.W.; Chang, S.X.; et al. Long-term Nitrogen Fertilization Decreases Bacterial Diversity and Favors the Growth of Actinobacteria and Proteobacteria in Agro-ecosystems across the Globe. Glob. Change Biol. 2018, 24, 3452–3461. [Google Scholar] [CrossRef] [PubMed]
  34. Wang, F.; Chen, Y.; Wu, Z.; You, Z.; Yu, W.; Yu, X.; Yang, Z. Effects of Organic Management Mode on Soil Fungal Community Structure and Functions in Tea Gardens. J. Tea Sci. 2022, 42, 672–688. [Google Scholar]
  35. Lim, Y.W.; Kim, B.K.; Kim, C.; Jung, H.S.; Kim, B.-S.; Lee, J.-H.; Chun, J. Assessment of Soil Fungal Communities Using Pyrosequencing. J. Microbiol. 2010, 48, 284–289. [Google Scholar] [CrossRef]
  36. Zhang, Y.; Yang, W.; Zhou, B.; Yang, J.; Xing, S. Effect of Biochar-Based Fertilizer on Soil Bacteria and Fungi Quantity and Community Structure in Acidified Tea Garden. J. Fujian Agric. For. Univ. 2023, 52, 247–257. Available online: https://kns.cnki.net/kcms2/article/abstract?v=UThtwiquHbf-e5kACKb-sFO5LYXiGprNU7x_D5W645hheug2KbWutw5N-n2rLVXJ9R6mjNhTb9tCOvD9-tZq8Y0qK5rXAxRR3G4subIULWaMP1lcJf7UL6CyJbWcKitEUxyitL3zcIZcw4ZpwBVTTM8XnjUEDt-GbfvIJGp9XZ6eOwwo0RD2Fw==&uniplatform=NZKPT&language=CHS (accessed on 27 June 2025).
  37. Fu, H.; Li, H.; Yin, P.; Mei, H.; Li, J.; Zhou, P.; Wang, Y.; Ma, Q.; Jeyaraj, A.; Thangaraj, K.; et al. Integrated Application of Rapeseed Cake and Green Manure Enhances Soil Nutrients and Microbial Communities in Tea Garden Soil. Sustainability 2021, 13, 2967. [Google Scholar] [CrossRef]
  38. Wang, Y.; Huang, J.; Ye, J.; Ye, Y.; Lin, Y.; Liu, C. Effects of Biochar Application on Soil Properties and Fungi Community Structure in Acidified Tea Gardens. J. Tea Sci. 2021, 41, 419–429. [Google Scholar]
  39. Fu, H.P.; Zhou, P.Q.; Wang, Y.J.; Mo, Z.D.; Li, Z.H.; Ma, Q.P.; Hoang, H.N.; Li, X.H. Effects of Intercropping Different Green Manures on Fungal Community Characteristics in Rhizosphere Soil of Tea Plant. J. Tea Commun. 2020, 47, 406–415. [Google Scholar]
  40. Hu, Z.; Ji, L.; Wan, Q.; Li, H.; Li, R.; Yang, Y. Short-Term Effects of Bio-Organic Fertilizer on Soil Fertility and Bacterial Community Composition in Tea Plantation Soils. Agronomy 2022, 12, 2168. [Google Scholar] [CrossRef]
  41. Bhattacharyya, C.; Imchen, M.; Mukherjee, T.; Haldar, S.; Mondal, S.; Mukherji, S.; Haldar, A.; Kumavath, R.; Ghosh, A. Rhizosphere Impacts Bacterial Community Structure in the Tea (Camellia sinensis (L.) O. Kuntze.) Estates of Darjeeling, India. Environ. Microbiol. 2022, 24, 2716–2731. [Google Scholar] [CrossRef]
  42. Gui, H.; Fan, L.; Wang, D.; Yan, P.; Li, X.; Pang, Y.; Zhang, L.; Zamanian, K.; Shi, L.; Xu, J.; et al. Variations in Soil Nutrient Dynamics and Bacterial Communities after the Conversion of Forests to Long-Term Tea Monoculture Systems. Front. Microbiol. 2022, 13, 896530. [Google Scholar] [CrossRef]
  43. Griffiths, R.I.; Thomson, B.C.; James, P.; Bell, T.; Bailey, M.; Whiteley, A.S. The Bacterial Biogeography of British Soils. Environ. Microbiol. 2011, 13, 1642–1654. [Google Scholar] [CrossRef] [PubMed]
  44. Wang, L.; Wang, Y.; Xiu, W.; Tan, B.; Li, G.; Zhao, J.; Yang, D.; Zhang, G.; Zhang, Y. Responses of Soil Microbial and Nematode Communities to Various Cover Crop Patterns in a Tea Garden of China. Int. J. Environ. Res. Public Health 2022, 19, 2695. [Google Scholar] [CrossRef]
  45. Wang, H.B.; Chen, X.T.; Ding, L.; Qiu, F.; Ye, J.; Jia, X.; Kong, X.; He, H. Effect of Soil Acidity on Microbial Diversity in Rhizospheric Soils of Tea Plants. Chin. J. Trop. Crops 2018, 39, 448–454. [Google Scholar]
  46. Kong, C.; Li, Y.; Sun, Y.; Shang, W.; Liu, B.; Yang, T. Variance of Nitrogen, Phosphorus and Potassium Content in New Shoots of Different Tea Tree Varieties and Diversity of Rhizosphere Soil Bacterial Communities. Southwest China J. Agric. Sci. 2023, 12, 2763–2770. [Google Scholar]
  47. Arafat, Y.; Tayyab, M.; Khan, M.U.; Chen, T.; Amjad, H.; Awais, S.; Lin, X.; Lin, W.; Lin, S. Long-Term Monoculture Negatively Regulates Fungal Community Composition and Abundance of Tea Orchards. Agronomy 2019, 9, 466. [Google Scholar] [CrossRef]
  48. Yan, P.; Shen, C.; Zou, Z.; Fan, L.; Li, X.; Zhang, L.; Zhang, L.; Dong, C.; Fu, J.; Han, W.; et al. Increased Soil Fertility in Tea Gardens Leads to Declines in Fungal Diversity and Complexity in Subsoils. Agronomy 2022, 12, 1751. [Google Scholar] [CrossRef]
  49. Jia, M.; Wang, Y.; Zhang, Q.; Lin, S.; Zhang, Q.; Chen, Y.; Hong, L.; Jia, X.; Ye, J.; Wang, H. Effect of Soil pH on the Uptake of Essential Elements by Tea Plant and Subsequent Impact on Growth and Leaf Quality. Agronomy 2024, 14, 1338. [Google Scholar] [CrossRef]
  50. Ye, J.; Wang, Y.; Wang, Y.; Hong, L.; Jia, X.; Kang, J.; Lin, S.; Wu, Z.; Wang, H. Improvement of Soil Acidification in Tea Plantations by Long-Term Use of Organic Fertilizers and Its Effect on Tea Yield and Quality. Front. Plant Sci. 2022, 13, 1055900. [Google Scholar] [CrossRef]
  51. Jia, X.; Zhang, Q.; Wang, Y.; Zhang, Y.; Li, M.; Cheng, P.; Chen, M.; Lin, S.; Zou, J.; Ye, J.; et al. Changes of Physiological Characteristics, Element Accumulation and Hormone Metabolism of Tea Leaves in Response to Soil pH. Front. Plant Sci. 2023, 14, 1266026. [Google Scholar] [CrossRef]
  52. Song, M. Effect of Biogeochemical Cycle in Tea Garden on the Soil Acidification. J. Tea Sci. 1990, 10, 19–26. [Google Scholar]
  53. Dang, M.V. Soil–Plant Nutrient Balance of Tea Crops in the Northern Mountainous Region, Vietnam. Agric. Ecosyst. Environ. 2005, 105, 413–418. [Google Scholar] [CrossRef]
  54. Zhang, W.; Ni, K.; Long, L.; Ruan, J. Nitrogen Transport and Assimilation in Tea Plant (Camellia sinensis): A Review. Front. Plant Sci. 2023, 14, 1249202. [Google Scholar] [CrossRef]
  55. Liu, X.; Tian, J.; Liu, G.; Sun, L. Multi-Omics Analysis Reveals Mechanisms of Strong Phosphorus Adaptation in Tea Plant Roots. Int. J. Mol. Sci. 2023, 24, 12431. [Google Scholar] [CrossRef]
  56. Huang, W.; Lin, M.; Liao, J.; Li, A.; Tsewang, W.; Chen, X.; Sun, B.; Liu, S.; Zheng, P. Effects of Potassium Deficiency on the Growth of Tea (Camelia sinensis) and Strategies for Optimizing Potassium Levels in Soil: A Critical Review. Horticulturae 2022, 8, 660. [Google Scholar] [CrossRef]
  57. Zhao, J.; Wu, X.; Nie, C.; Wu, T.; Dai, W.; Liu, H.; Yang, R. Analysis of Unculturable Bacterial Communities in Tea Orchard Soils Based on Nested PCR-DGGE. World J. Microbiol. Biotechnol. 2012, 28, 1967–1979. [Google Scholar] [CrossRef] [PubMed]
  58. Tang, S.; Zhou, J.; Pan, W.; Tang, R.; Ma, Q.; Xu, M.; Qi, T.; Ma, Z.; Fu, H.; Wu, L. Impact of N Application Rate on Tea (Camellia sinensis) Growth and Soil Bacterial and Fungi Communities. Plant Soil 2022, 475, 343–359. [Google Scholar] [CrossRef]
  59. Kalam, S.; Basu, A.; Ahmad, I.; Sayyed, R.Z.; El-Enshasy, H.A.; Dailin, D.J.; Suriani, N.L. Recent Understanding of Soil Acidobacteria and Their Ecological Significance: A Critical Review. Front. Microbiol. 2020, 11, 580024. [Google Scholar] [CrossRef]
  60. Fierer, N.; Bradford, M.A.; Jackson, R.B. Toward an Ecological Classification of Soil Bacteria. Ecology 2007, 88, 1354–1364. [Google Scholar] [CrossRef]
  61. Zheng, N.; Yu, Y.; Wang, J.; Chapman, S.J.; Yao, H.; Zhang, Y. The Conversion of Subtropical Forest to Tea Plantation Changes the Fungal Community and the Contribution of Fungi to N2O Production. Environ. Pollut. 2020, 265, 115106. [Google Scholar] [CrossRef]
Figure 1. (a) Venn diagram of rhizosphere bacterial OTUs. (b) Venn diagram of rhizosphere fungal OTUs.
Agronomy 15 01608 g001
Figure 2. PCoA analysis of soil microbial communities: (a) bacteria, (b) fungi.
Agronomy 15 01608 g002
Figure 3. NMDS analysis of soil microbial communities: (a) bacteria, (b) fungi.
Agronomy 15 01608 g003
Figure 4. Relative abundances of major bacterial phyla in rhizosphere soil.
Agronomy 15 01608 g004
Figure 5. Relative abundances of major fungal phyla in rhizosphere soil.
Agronomy 15 01608 g005
Figure 6. Relative abundances of major bacterial genera in rhizosphere soil.
Agronomy 15 01608 g006
Figure 7. Relative abundances of major fungal genera in rhizosphere soil.
Agronomy 15 01608 g007
Figure 8. Genus-level heatmap of bacterial community composition with clustering.
Agronomy 15 01608 g008
Figure 9. Genus-level heatmap of fungal community composition with clustering.
Agronomy 15 01608 g009
Figure 10. Redundancy analysis plots of soil fertility and rhizosphere soil microorganisms at the phylum level. (a) Bacteria, (b) fungi.
Agronomy 15 01608 g010
Figure 11. Redundancy analysis plots of soil fertility and rhizosphere soil microorganisms at the genus level. (a) Bacteria, (b) fungi.
Agronomy 15 01608 g011
Table 1. Geographical distribution of Dancong ancient tea plantations.
Locality NameSite IDLongitude (°E)Latitude (°N)Altitude (m)
ZimaoZM116.6823.95578.13
BaixiangBX116.6523.961131.63
XialiaoHSK116.6523.961066.77
DaanDA116.6423.97965.91
Table 2. Statistical characteristics of soil pH, total nitrogen (TN), total phosphorus (TP), total potassium (TK), soil organic matter (SOM), available nitrogen (AN), available phosphorus (AP), available potassium (AK) in the surface soil (0–20 cm).
ZMBXHSKDA
pH4.91 ± 0.00 a4.89 ± 0.11 a5.03 ± 0.27 a5.01 ± 0.08 a
TN/(g/kg)1.47 ± 0.31 a1.82 ± 0.10 a1.74 ± 0.12 a1.75 ± 0.22 a
TP/(g/kg)0.89 ± 0.10 a0.83 ± 0.03 a0.97 ± 0.09 a0.84 ± 0.03 a
TK/(g/kg)9.67 ± 0.88 c10.50 ± 0.76 bc15.00 ± 0.76 a12.83 ± 0.33 ab
SOM/(g/kg)24.97 ± 1.67 b36.51 ± 1.57 a36.51 ± 2.32 a30.20 ± 0.97 b
AN/(mg/kg)89.95 ± 2.94 b139.30 ± 4.13 a170.68 ± 17.57 a149.22 ± 2.94 a
AP/(mg/kg)36.52 ± 11.58 ab54.32 ± 28.00 ab21.22 ± 7.54 b82.66 ± 9.23 a
AK/(mg/kg)46.67 ± 7.69 a79.33 ± 20.00 a47.00 ± 9.29 a62.00 ± 5.29 a
Different lowercase letters stand for significant differences at the p < 0.05 level (n = 3). There were no significant differences among the four ancient tea plantations in terms of the three indicators: pH value, AN, and AP. However, in terms of AK, HSK was significantly higher than ZM and BX but showed no significant difference from DA. For SOM, BX was considerably higher than ZM but showed no significant difference from HSK and DA. In terms of AN, BX, HSK, and DA were significantly higher than ZM. For AP, DA was significantly higher than BX and HSK but showed no significant difference from ZM. Finally, in terms of AK, BX was significantly higher than ZM, HSK, and DA.
Table 3. Assessment of surface soil fertility in Dancong ancient tea plantations. The Grade I fertility index values are TN > 1.0 g/kg, TP > 0.6 g/kg, TK > 10 g/kg, AN > 100 mg/kg, AP > 10 mg/kg, AK > 120 mg/kg, and SOM > 15 g/kg.
ZMBXHSKDA
TN1.561.952.102.19
TP1.491.331.461.39
TK1.120.931.421.27
SOM1.932.702.462.51
AN1.041.471.881.48
AP3.802.542.926.51
AK0.580.950.460.57
Table 4. Statistical characteristics of soil pH, total nitrogen (TN), total phosphorus (TP), total potassium (TK), soil organic matter (SOM), available nitrogen (AN), available phosphorus (AP), available potassium (AK) in the subsurface soil (20–40 cm).
ZMBXHSKDA
pH4.91 ± 0.00 a4.89 ± 0.11 a5.03 ± 0.27 a5.01 ± 0.08 a
TN/(g/kg)1.47 ± 0.31 a1.82 ± 0.10 a1.74 ± 0.12 a1.75 ± 0.22 a
TP/(g/kg)0.89 ± 0.10 a0.83 ± 0.03 a0.97 ± 0.09 a0.84 ± 0.03 a
TK/(g/kg)9.67 ± 0.88 c10.50 ± 0.76 bc15.00 ± 0.76 a12.83 ± 0.33 ab
SOM/(g/kg)24.97 ± 1.67 b36.51 ± 1.57 a36.51 ± 2.32 a30.20 ± 0.97 b
AN/(mg/kg)89.95 ± 2.94 b139.30 ± 4.13 a170.68 ± 17.57 a149.22 ± 2.94 a
AP/(mg/kg)36.52 ± 11.58 ab54.32 ± 28.00 ab21.22 ± 7.54 b82.66 ± 9.23 a
AK/(mg/kg)46.67 ± 7.69 a79.33 ± 20.00 a47.00 ± 9.29 a62.00 ± 5.29 a
Different lowercases stand for significant differences at the p < 0.05 level (n = 3).
Table 5. Assessment of Subsurface soil fertility in Dancong ancient tea plantations.
ZMBXHSKDA
TN1.471.821.741.75
TP1.481.381.611.40
TK0.971.051.501.28
SOM1.662.432.432.01
AN0.301.391.711.49
AP3.655.432.128.27
AK0.390.660.390.52
Table 6. Bacterial alpha diversity in the rhizosphere soil of ancient Dancong tea plantations.
Chao1SimpsonShannonPielouObserved SpeciesFaith pdGoods Coverage
ZM3386.95 ± 127.391.00 ± 0.009.92 ± 0.130.86 ± 0.013067.57 ± 123.07212.46 ± 6.270.98 ± 0.00
BX3594.65 ± 85.141.00 ± 0.0010.05 ± 0.090.86 ± 0.013254.68 ± 64.19231.85 ± 6.860.98 ± 0.00
HSK3566.98 ± 173.181.00 ± 0.0010.16 ± 0.140.87 ± 0.013272.92 ± 148.59227.85 ± 8.480.98 ± 0.00
DA3483.27 ± 145.61.00 ± 0.0010.24 ± 0.110.88 ± 0.013135.93 ± 126.3213.49 ± 10.540.98 ± 0.00
Table 7. Fungal alpha diversity in the rhizosphere soil of ancient Dancong tea plantations.
Chao1SimpsonShannonPielouObserved SpeciesFaith pdGoods Coverage
ZM353.02 ± 62.950.66 ± 0.093.47 ± 0.610.41 ± 0.06352.18 ± 62.841.00 ± 0.000.98 ± 0.00
BX456.79 ± 49.270.83 ± 0.044.64 ± 0.350.53 ± 0.03456.23 ± 49.341.00 ± 0.000.98 ± 0.00
HSK394.58 ± 32.750.82 ± 0.034.31 ± 0.190.50 ± 0.02393.58 ± 32.721.00 ± 0.000.98 ± 0.00
DA523.55 ± 37.270.93 ± 0.015.53 ± 0.240.61 ± 0.02522.9 ± 37.361.00 ± 0.000.98 ± 0.00
Table 8. Pearson’s correlation between soil fertility and bacterial microbial diversity.
Chao1SimpsonShannonPielouObserved SpeciesGoods Coverage
pH0.130.000.060.040.13−0.06
AN0.160.47 *0.370.41 *0.16−0.37
AP0.380.130.330.300.380.06
AK0.210.190.220.210.21−0.02
SOM0.310.52 *0.43 *0.45 *0.31−0.09
TN0.260.52 *0.41 *0.44 *0.26−0.03
TP0.020.160.080.100.020.00
TK0.080.340.210.240.08−0.55 *
* Indicates a significant correlation at the p < 0.05 level.
Table 9. Pearson’s correlation between soil fertility and fungal microbial diversity.
Chao1SimpsonShannonPielouObserved SpeciesGoods Coverage
Ph0.130.000.060.040.13−0.06
AN0.160.47 *0.370.41 *0.16−0.37
AP0.380.130.330.300.380.06
AK0.210.190.220.210.21−0.02
SOM0.310.52 *0.43 *0.45 *0.31−0.09
TN0.260.52 *0.41 *0.44 *0.26−0.03
TP0.020.160.080.100.020.00
TK0.080.340.210.240.08−0.55 *
* Indicates a significant correlation at the p < 0.05 level.
Disclaimer/Publisher’s Note: The statements, opinions and data contained in all publications are solely those of the individual author(s) and contributor(s) and not of MDPI and/or the editor(s). MDPI and/or the editor(s) disclaim responsibility for any injury to people or property resulting from any ideas, methods, instructions or products referred to in the content.

