Article

Effects of Partial Organic Fertilizer Substitution on Grain Yield, Nitrogen Use Efficiency, and Physiological Traits of Rice in Northeastern China

1
College of Agronomy, Shenyang Agricultural University, Shenyang 110866, China
2
Queensland Alliance for Agriculture and Food Innovation, The University of Queensland, Brisbane 4067, Australia
3
Liaoning Institute of Saline-Alkali Land Utilization, Panjin 124010, China
4
Liaoning Agriculture Vocationaland Technical College, Yingkou 115009, China
*
Author to whom correspondence should be addressed.
Agronomy 2025, 15(7), 1576; https://doi.org/10.3390/agronomy15071576
Submission received: 28 May 2025 / Revised: 23 June 2025 / Accepted: 25 June 2025 / Published: 27 June 2025
(This article belongs to the Section Soil and Plant Nutrition)

Abstract

In China, agriculture is currently highly dependent on chemical nitrogen. This leads to low nitrogen use efficiency and high nitrogen losses. Considering the issues caused by excessive chemical fertilizer, integrated nutrient management using organic and chemical fertilizer sources is important. To clarify how partial substitution of chemical fertilizer by organic fertilizer affects rice yield, physiological traits, and nitrogen use efficiency, we conducted a two-year field trial in 2021 and 2022, and used two rice cultivars, Shendao47 (SD47) and Shendao505 (SD505), which were grown in the field with five fertilization treatments: (1) CK (zero N application); (2) CF (100% chemical fertilizer); (3) OR10 (10% organic fertilizer + 90% chemical fertilizer); (4) OR20 (20% organic fertilizer + 80% chemical fertilizer); and (5) OR30 (30% organic fertilizer + 70% chemical fertilizer). The results show that the partial organic substitution (OR) treatments improved the yield by 1–10% for two cultivars by increasing effective panicles and grain filling. The increase in grain filling was related to the photosynthetic parameters, including LAI, chlorophyll content, and net photosynthetic rate during the grain-filling stage. The photosynthetic parameters of OR treatments were higher than those of CF treatment. Additionally, with the increase in organic fertilizer application rates, the grain yield, agronomic N use efficiency, partial factor productivity of applied N, and physiological N use efficiency increased at first and then decreased, peaking in OR20 treatment. Conclusively, the 20% organic fertilizer with 80% chemical fertilizer is a promising option for higher yield and improved N utilization for both cultivars. This study provides a sustainable nutrient management strategy to improve crop yield with high nutrient use efficiency.

1. Introduction

Rice (Oryza sativa L.) is an essential staple food for over half of the world’s population, including nearly 60% of the Chinese population [1]. Peng et al. [2] predicted in 2009 that if per capita rice consumption continues at the current rate, China will need to produce 20% more rice by 2030 to meet domestic demands. To increase crop yield, Chinese farmers are using the chemical N fertilizer extensively, making China the largest N fertilizer consumer in the world [3,4]. A surplus of N fertilizer application, without an associated rise in crop yield, results in low N use efficiency [5,6]. Unabsorbed chemical N is lost to the environment, which led to many adverse effects on the environment, including the pollution of air and water, and the degradation of land [7,8,9].
In recent years, improved N management techniques have been proposed to increase the N use efficiency and reduce N loss, such as site-specific N management [10], optimal N management [11], controlled-release fertilizer [12], deep placement [13], and integrated management practices [14]. However, adopting these practices has been constrained by the knowledge requirements, high costs, and increased labor inputs. Some of them were still limited by the existing technologies; for example, the coating materials of controlled-release [15] and the machine of deep placement [16]. Combining chemical and organic nitrogen has been shown to significantly increase nitrogen use efficiency [17], requiring fewer resources than other improved N management techniques, making it a more practical approach for paddy fields [18]. In addition to making application easier, this technique improves microbial activity and nutrient cycling, enhancing soil nutrition and structure [19,20]. More importantly, the combined application of organic fertilizer and chemical fertilizer can increase rice yield [21], resulting in significant financial benefits [22]. As a result, combining chemical and organic fertilizer offers a practical way to increase the yield, addressing global food demands by optimizing resource use on limited arable land, which is crucial both now and in the future [23].
Although many studies explored the combined application of chemical and organic fertilizers, the majority focused on increasing organic input amounts [24,25,26] rather than examining partial substitution strategies that balance yield and environmental sustainability. Only a few studies typically evaluated basic agronomic outcomes (such as yield quality and growth) [27,28,29,30,31,32], while the underlying physiological mechanisms driving nitrogen use efficiency remain largely unexplored. However, such studies are still limited in northeast China, especially on partial substitution treatments. The physiological mechanisms underlying nitrogen use efficiency (NUE) improvements under partial substitution strategies have not been fully elucidated. Previous research largely overlooked the interaction between substitution ratio and physiological trait expression under field conditions. Agronomic and physiological performance of rice is closely linked to the yield and nutrient use efficiency [33]. Numerous agronomic and physiological characteristics, including more spikelets, high leaf area index, and dry matter accumulation, have been linked to high yield [34]. For the development of high-yield, high-quality, green rice production in northeast China, it is necessary to understand the agronomic and physiological characteristics and N use efficiency of rice under chemical fertilizer substituted for organic fertilizer.
Therefore, we conducted a two-year period field in Shenyang City, Liaoning Province, China in 2021 and 2022. This study used two cultivars under five fertilization treatments, with the following research objectives: (i) assess how partial substitution of organic fertilizer affects yield, especially the primary yield components; and (ii) illustrate how the application of organic fertilizer and chemical fertilizer impacts agronomic and physiological characteristics and N use efficiency in each growth period under different substitution ratios; and (iii) investigate how the shoot physiological traits of yield and N use efficiency and the relationships between them. Such a study would help us understand the effects of partial organic fertilizer substitution on rice physiological characteristics, and determine the optimal ratio, in order to offer both theoretical and operational strategies for creating sustainable crop management strategies for high-yield and green rice production.

2. Materials and Methods

2.1. Experimental Site and Soil Properties

A field experiment was conducted at the Teaching and Research Institute of Shenyang Agricultural University, Shenyang, Liaoning Province, China (41°48′ N,123°24′ E) in 2021 and 2022. This site has a warm, temperate, semi-humid climate. The loam soil contains organic matter 28 g kg−1, total nitrogen 1.22 g kg−1, available nitrogen 110 mg kg−1, available phosphorus 24.69 mg kg−1, and available potassium 158 mg kg−1 in 0–20 cm layer.

2.2. Tested Material

Shendao 47 (SD47, normal length of time from sowing to physiological maturity is 155 d) and Shendao 505 (SD505, normal length of time from sowing to physiological maturity is 156 d), two japonica inbred rice cultivars, served as the experimental materials. Local farmers are enthusiastic about both varieties and cultivate them extensively. In both years, seeds were sown on April 14 and transplanted on 25 May. Plants were harvested on 10–12 October.
The experiment was a 5 × 2 (five treatments and two cultivars) factorial design with ten combinations. For each combination, there were three plots as replicates. The size of each combination was 9.5 × 5 m. The chemical fertilizer used in the experiment was urea (46% N), calcium superphosphate (12% P2O5), and potassium sulphate (50% K2O). The bio-organic fertilizer was produced by Shenyang ShuXin Company, China. The organic fertilizer was made from cattle manure. It contains organic matter (≥45%), N (1%), P2O5 (1.16%), and K2O (1.1%). The fertilizer applications of phosphorus and potassium were based on the original values of the soil and local empirical values. In total, 90 kg ha−1 of P and 75 kg ha−1 of K and organic fertilizer were applied and incorporated before sowing as basal fertilizer. The five fertilizations were as follows: CK (no N fertilizer), CF (100% chemical N fertilizer), OR10 (10% OF + 90% CF), OR20 (20% OF + 80% CF), and OR30 (30% OF + 70% CF). The total nitrogen application rate of CF and OR treatments (nitrogen, the same level) is 150 kg N ha−1, and chemical N fertilizer was applied in a split of 5:3:2 at the stage of pre-sowing, tillering, and jointing. To prevent fertilizer and water movement between neighboring plots, 50 cm-wide ridges with plastic film inserted to a depth of 20 cm were used to separate the plots. The field was flooded after transplanting, and a flood water depth of 3–5 cm was maintained until the tillering stage, and then the water was drained at the maximum tillering stage to reduce unproductive tillers; re-watering at the booting stage with the water layer of 3–5 cm until the heading stage; and performing wetting–drying alternation irrigation during grain filling duration; and draining water a week before maturity. Weeds, pest insects, and diseases were intensively controlled using chemicals to avoid biomass and yield losses.

2.3. Measurement and Sampling

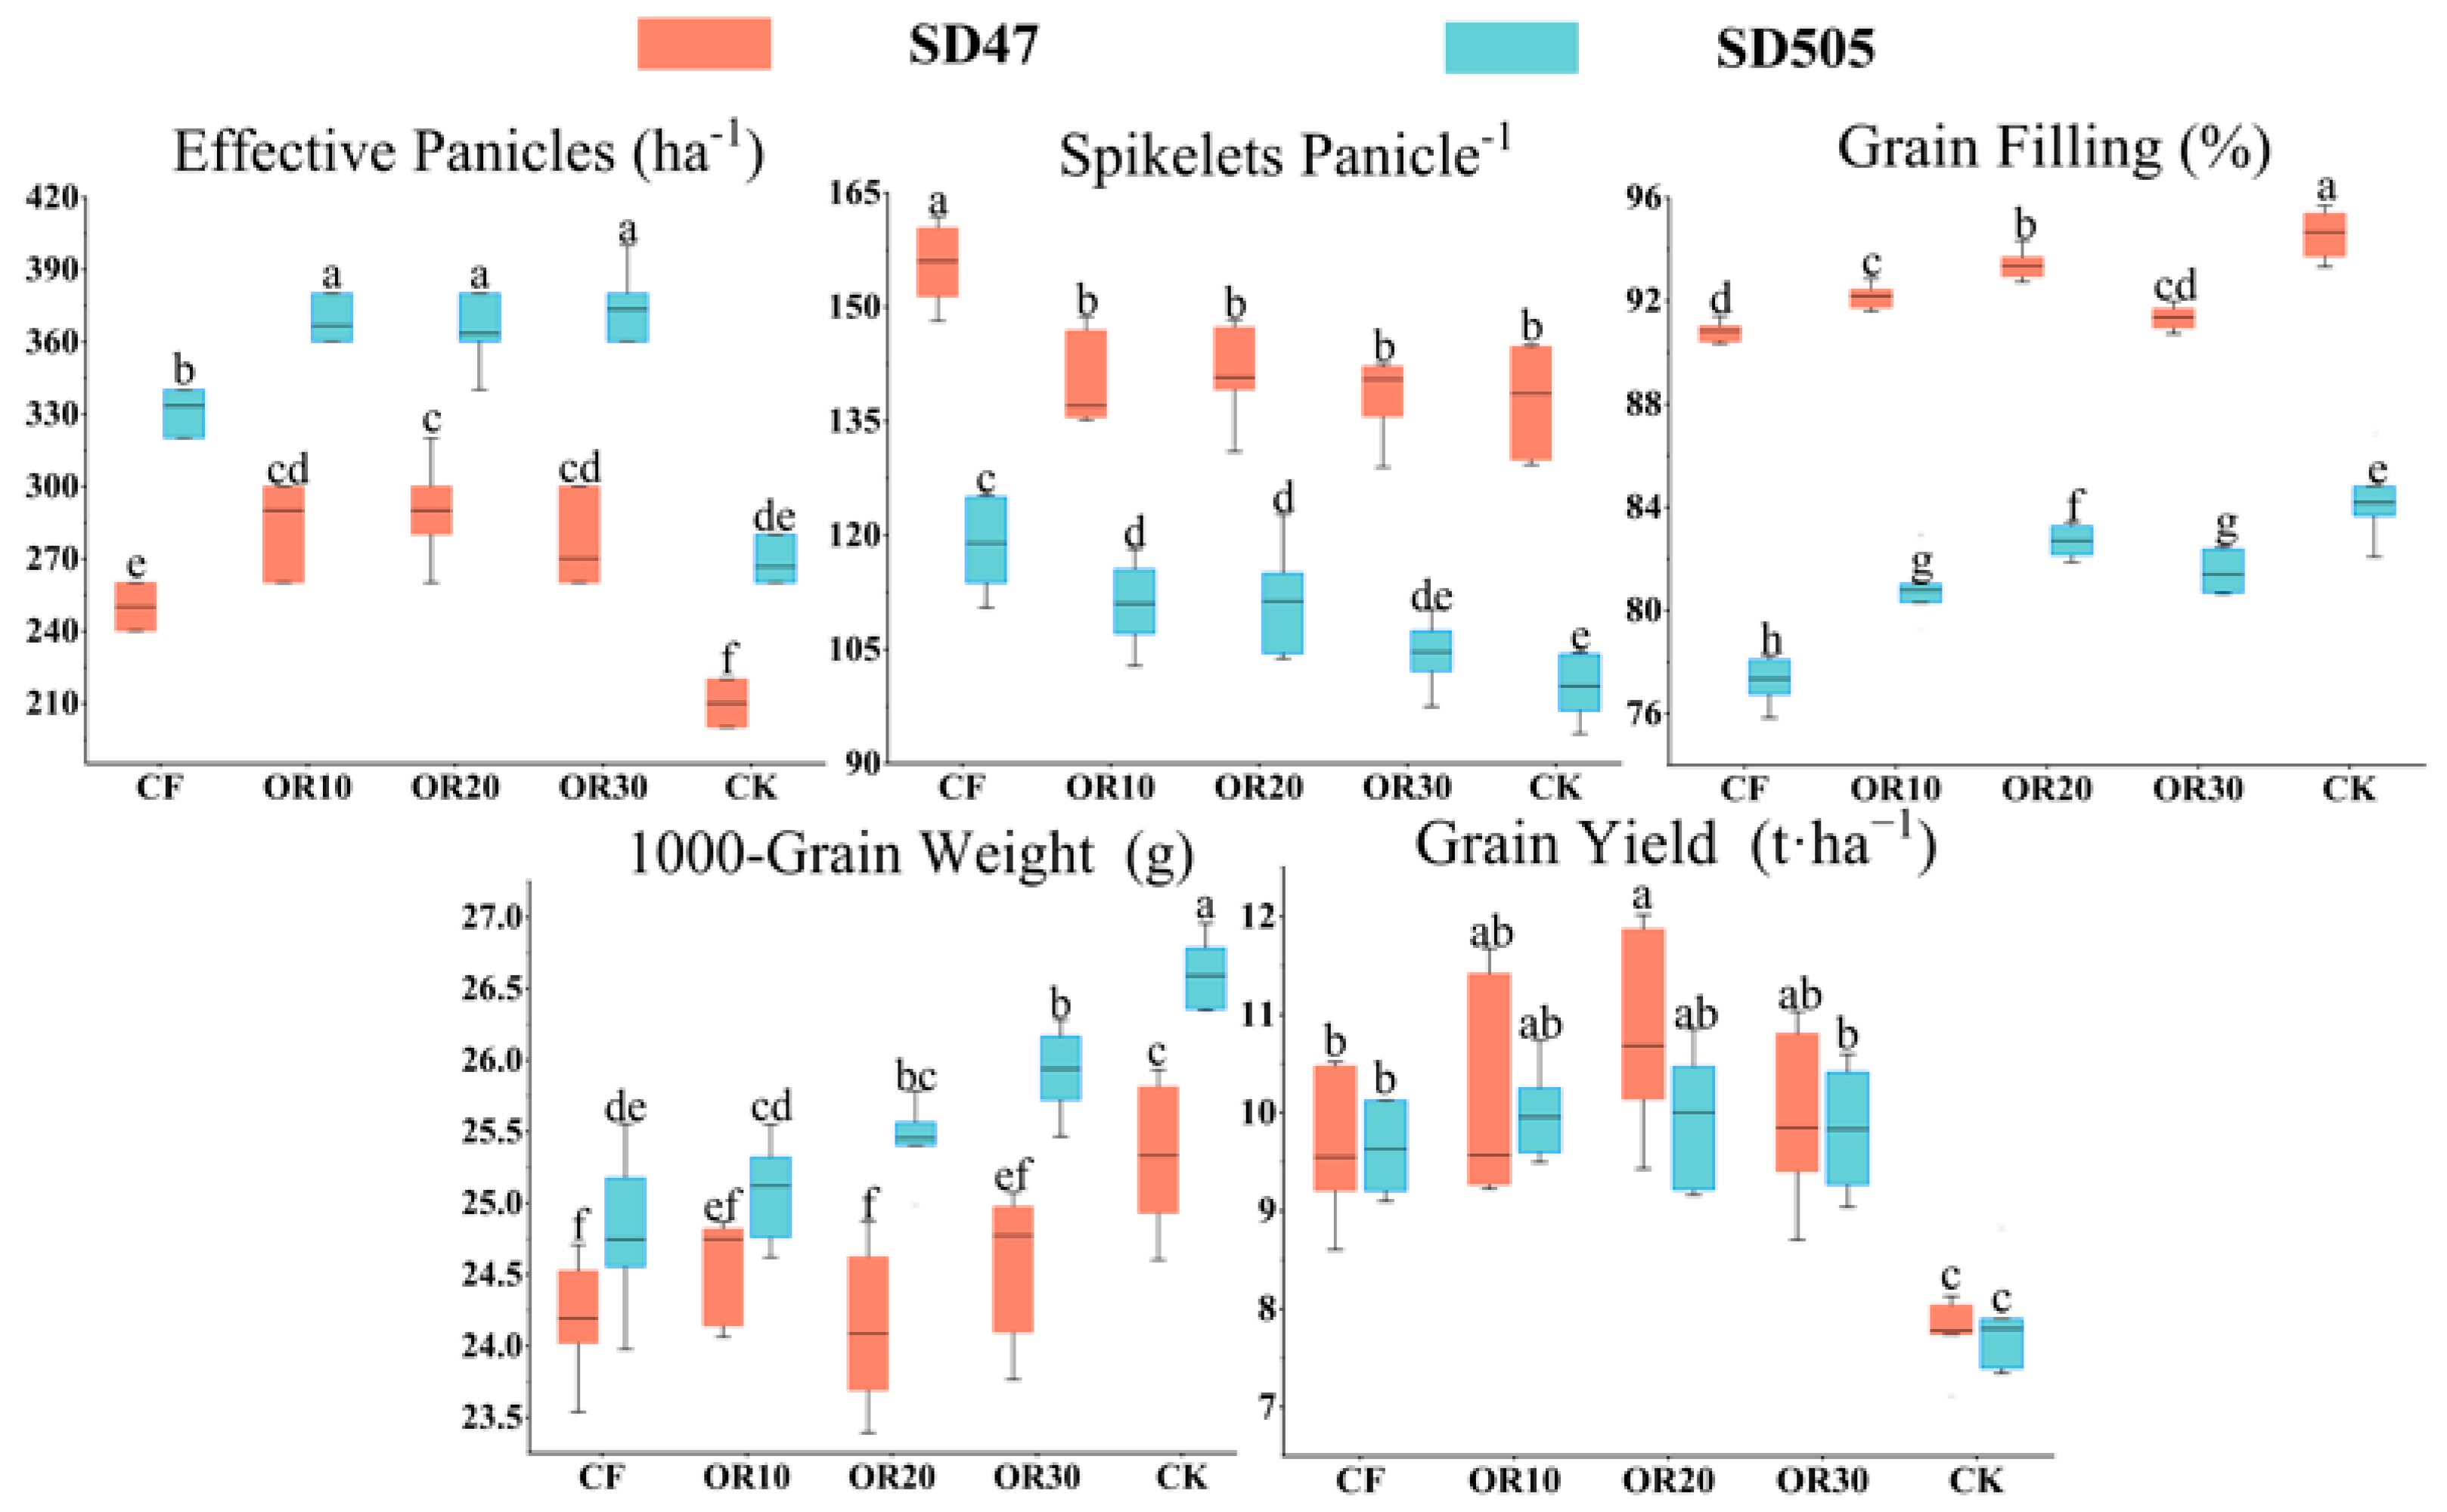
2.3.1. Yield and Yield Components

To gather data on rice yield, plants were sampled from a 1 m2 site (except border ones and sampling area) in each plot at the maturity stage. The plants were separated and threshed after natural air drying. The yield was transformed using the 14.5% water content standard. Thirty plants (without the border plants) were randomly selected from each plot to determine the yield components (effective panicles, spikelets panicle−1, grain filling, and 1000-grain weight).

2.3.2. Relative Chlorophyll Content (SPAD)

Based on the random sampling of 30 rice plants, the mean panicle number per hill was calculated. To determine the relative chlorophyll content, ten representative rice plants (the mean panicle numbers per hill) were chosen from each plot at the jointing stage, 7, 14, 21, 28, 35, 42, and 49 days after jointing to assess the relative chlorophyll content. The chlorophyll content of flag leaves was measured using a SPAD-502 chlorophyll meter.

2.3.3. Photosynthetic Rate of Flag Leaf

Based on the random sampling of 30 rice plants, the mean panicle number per hill was calculated. Ten representative rice plants (the mean panicle numbers per hill) were collected from each plot at the heading stage, 15th, and 30th day after the heading stage (the day after jointing 21st day, 35th day, and 49th day). Flag leaf Pn was measured using a TARGAS-1 portable photosynthesizer (TARGAS-1, Lufthansa Technik Group Ltd., Miami Lakes, FL, USA) at 9:00–11:00 a.m. on a sunny day. Natural light conditions were used for these measurements.

2.3.4. Determination of Dry Matter Weight

To estimate the mean panicle numbers per plot at each stage in both years, at the jointing, heading, and maturity stages, the numbers of tillers and panicles on 30 randomly selected hills per plot were counted. Three hills were sampled at full heading and maturity stages for each plot. After counting the number of panicles, the plant samples were separated into three categories: leaves, stems (culm plus sheath), and panicles. Each organ was oven-dried to a consistent weight at 70 °C at a constant weight.
The following formulae were used to determine the net assimilation rate (NAR) and crop growth rate (CGR) [35]:
CGR (g m−2 d−1) = (W2 − W1)/(t2 − t1)
NAR (g m−2 d−1) = (W2 − W1)/[(LAI2 − LAI1) × (t2 − t1)]
where W1 and W2 and LAI1 and LAI2 indicate the shoot biomass (dry weight) and leaf area measured at the first (t1) and the second measurement times (t2), respectively.

2.3.5. Determination of N Uptake

Samples for the determination of dry matter accumulation of the plant part (sheath, leaf at the jointing stage; sheath, leaf, and panicle at the heading stage; and sheath, leaf, and grain at the maturity stage) were ground, digested in concentrated sulfuric acid, and the N content of the plants was determined using the micro Kjeldahl method. The formula for calculating N uptake and use is as follows [25,36]:
N accumulation = N content (%) × dry matter accumulation
Agronomic N use efficiency (NAE) = (N applied area grain yield − N free area yield)/N Applied
Partial factor productivity of N fertilizer (NPFP) = Grain yield with N application (kg)/Amount of N (kg)
Nitrogen recovery efficiency (NRE) = [N accumulation with applied nitrogen N − N accumulation with N free area (kg)]/Amount of fertilizer (kg) × 100
Physiological N use efficiency (NPE) = [N applied area grain yield − N free area yield (kg)]/[N applied area N accumulation − N free area N accumulation (kg)]
N harvest index (NHI) = total grain N accumulation/total plant N accumulation.

2.4. Statistical Analysis

Analysis of variance was performed on the data (ANOVA). At a 5% probability level, Tukey’s honest significant difference test was used to compare mean values between treatments. SPSS 29.0.1 software was used for data analysis. To find out how different N management techniques affected yield formation, nutrient uptake, and utilization efficiency, a principal component analysis (PCA) was used [22].

3. Results

3.1. Grain Yield and Yield Components

Figure 1 demonstrates the impact of partial organic fertilizer substitution for chemical fertilizer on rice yield and yield components over two consecutive years. As the amount of organic fertilizer increased, the yield showed a trend of increasing and then decreasing for both cultivars; the yield performance sequence was OR20 > OR10 > OR30 > CF > CK. The yield of applying N fertilizer treatments ranged from 9.0 to 11.7 t ha−1. Notably, the OR20 treatment produced the highest yield of both cultivars, outperforming the other treatments. Over two years, the average yield of organic fertilizer treatments increased by 1–10%, depending on the substitution ratio; a high substitution ratio treatment (OR30) produced a lower yield than low and middle substitution ratio treatments (OR10 and OR20). This implies that an overly high substitution ratio may lower rice yield.
Over these two years, grain filling exhibited a trend of initially increasing and then decreasing with increased organic fertilizer application. This suggests that an overly high substitution ratio may lower the grain filling. With organic fertilizer substitution ratios increasing, effective panicles increased, and the spikelet panicle decreased. This pattern suggests that the increase in effective panicles and grain filling, rather than the spikelet panicle, was mostly responsible for the production improvement.

3.2. Shoot Physiological Traits

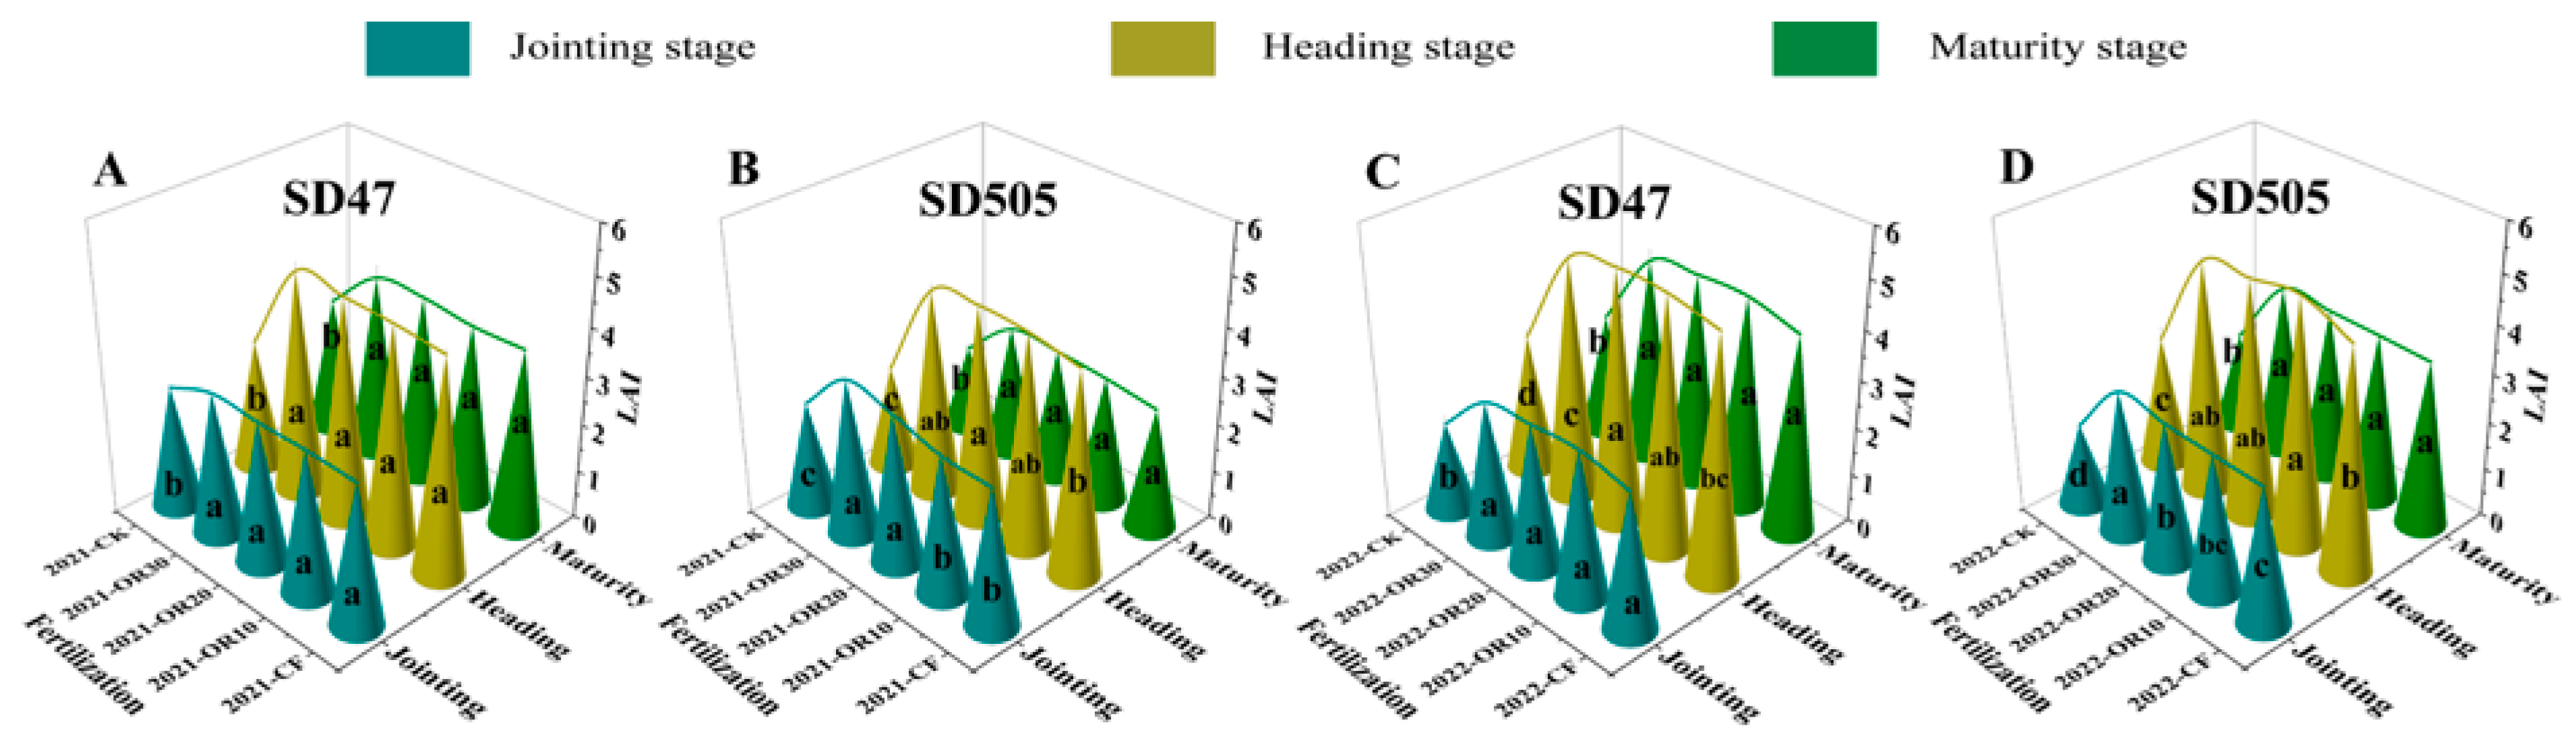
3.2.1. Leaf Area Index

Effects of the partial organic fertilizer substitution for chemical fertilizer on the leaf area index over the two years are shown in Figure 2. Applying N fertilizer significantly increased LAI at all stages. The LAI of each treatment increased rapidly in a large range from the jointing stage to the heading stage and decreased in a small range from the heading stage to the maturity stage. For SD47, there was an insignificant difference in LAI between applying N treatments (OR and CF) at the jointing stage and maturity stage. At the heading stage, the LAI of OR10 and OR20 treatment was higher than that of CF for both years. For SD505, the LAI of OR was higher than CF at all stages. Thus, LAI at the heading stage plays a pivotal role in yield formation, as a larger leaf area at this stage enhances the interception of light energy by the plants. OR is characterized by higher LAI at the heading stage (except OR30 for SD47 in 2022).

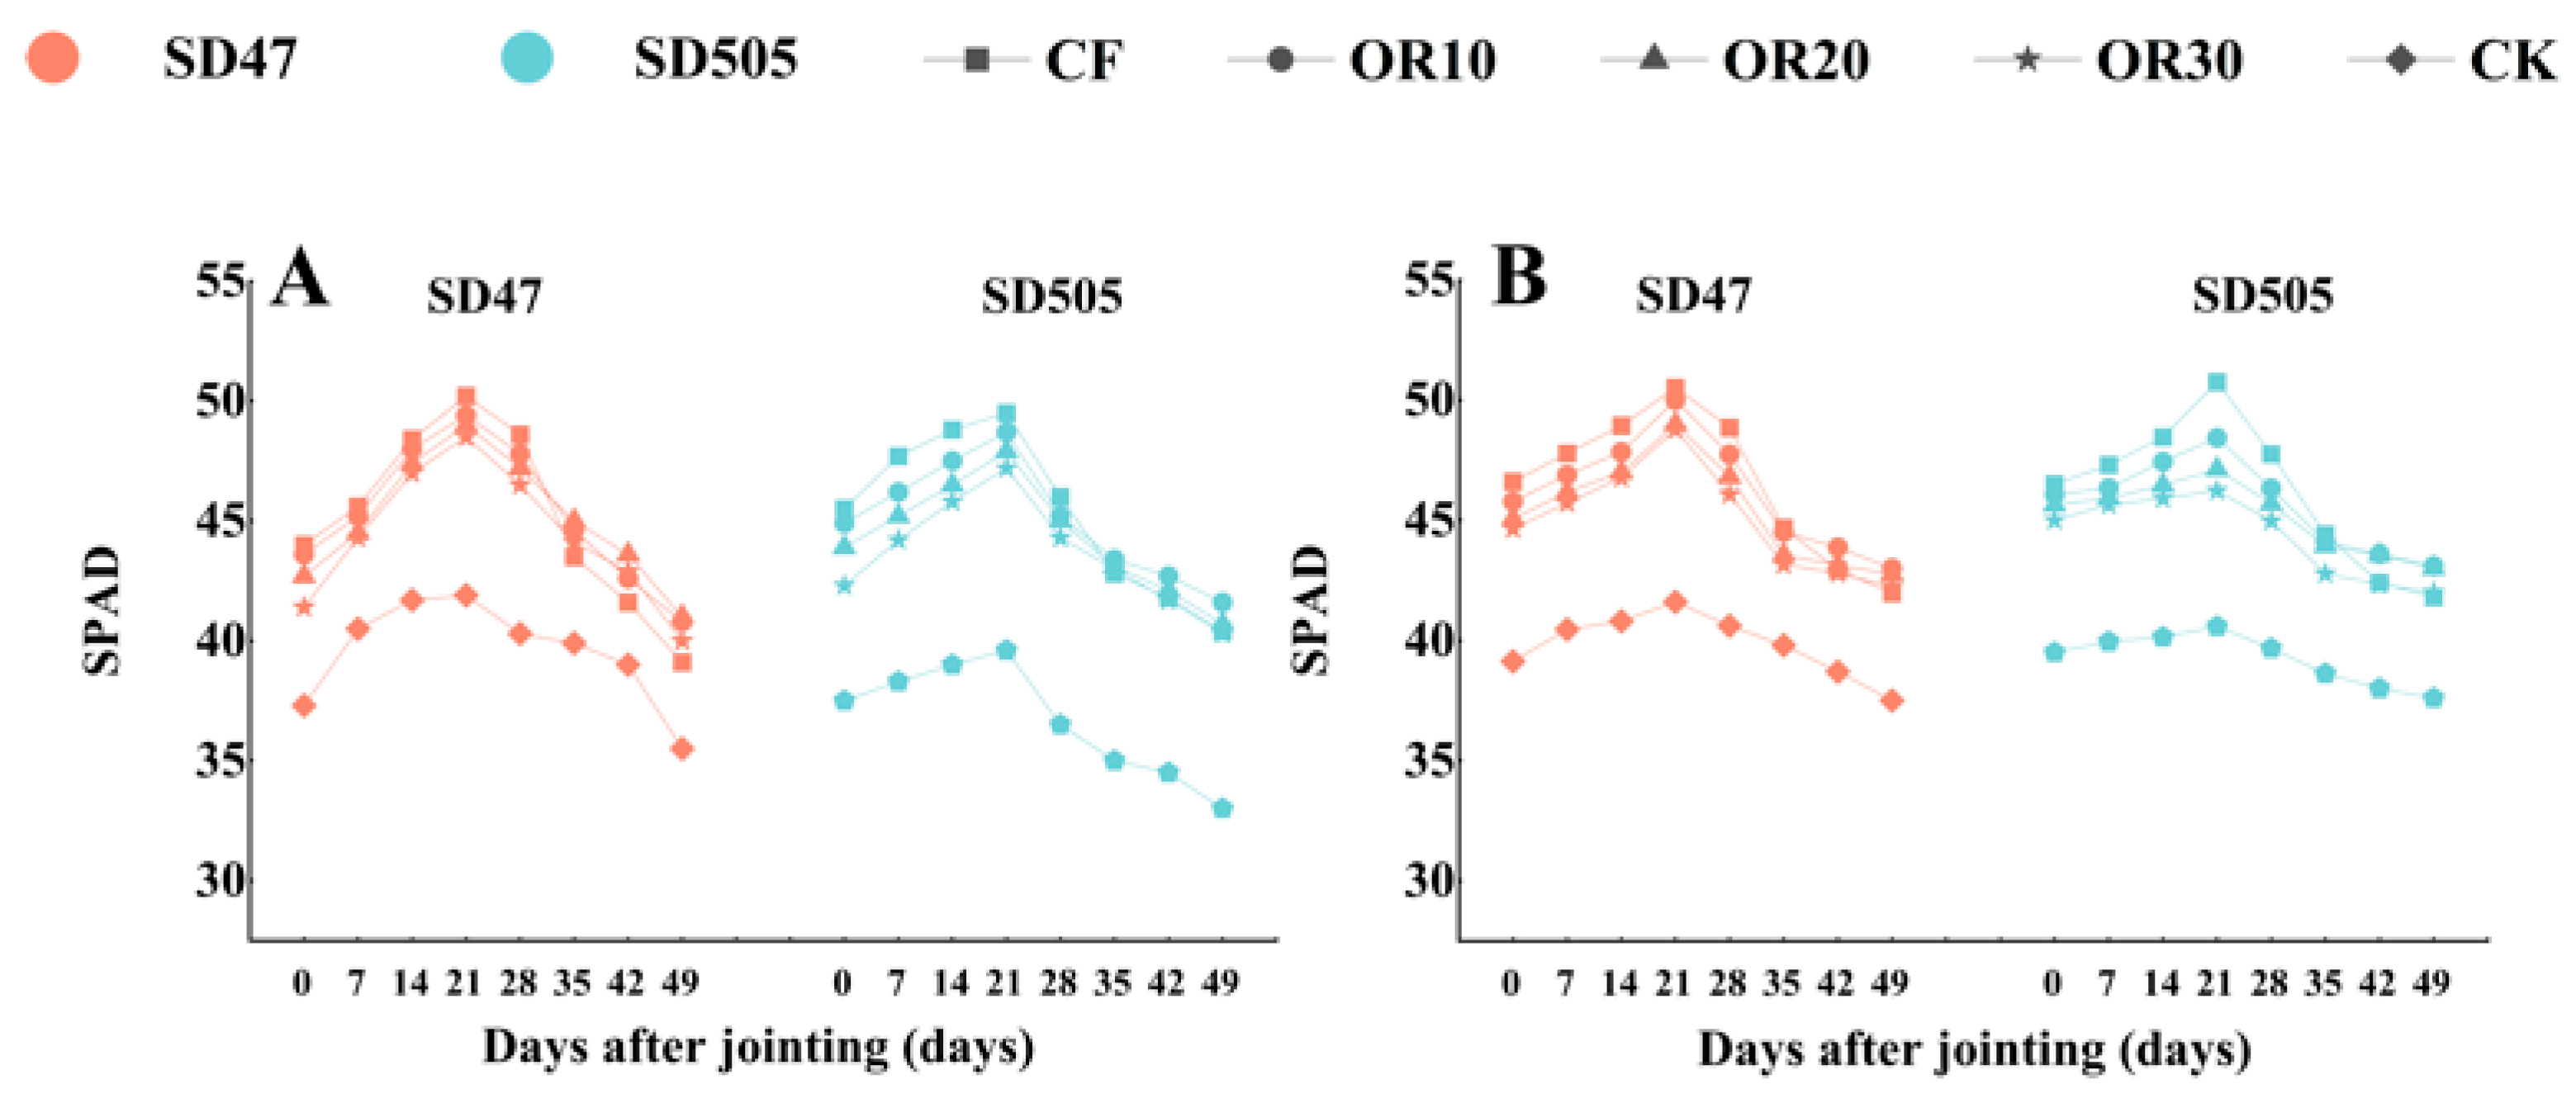
3.2.2. Chlorophyll Content (SPAD Value) in Flag Leaves

The dynamic pattern in chlorophyll content, which generally increased initially and decreased over time, is depicted in Figure 3. All treatments’ chlorophyll content peaked at 21 days after jointing (heading stage) in both years, gradually decreasing from 28 to 49 days. OR and CF treatments significantly surpassed the CK treatment during the two years. The SPAD value of CF treatment decreases from 28 to 35 days, much more than that of OR. Before 35 days, CF treatment had a higher SPAD than OR. However, the SPAD of CF treatment was lower than that of OR between 35 and 49 days after jointing. This implies that the decrease in chlorophyll content during the late growth period was considerably slowed by organic fertilizer.

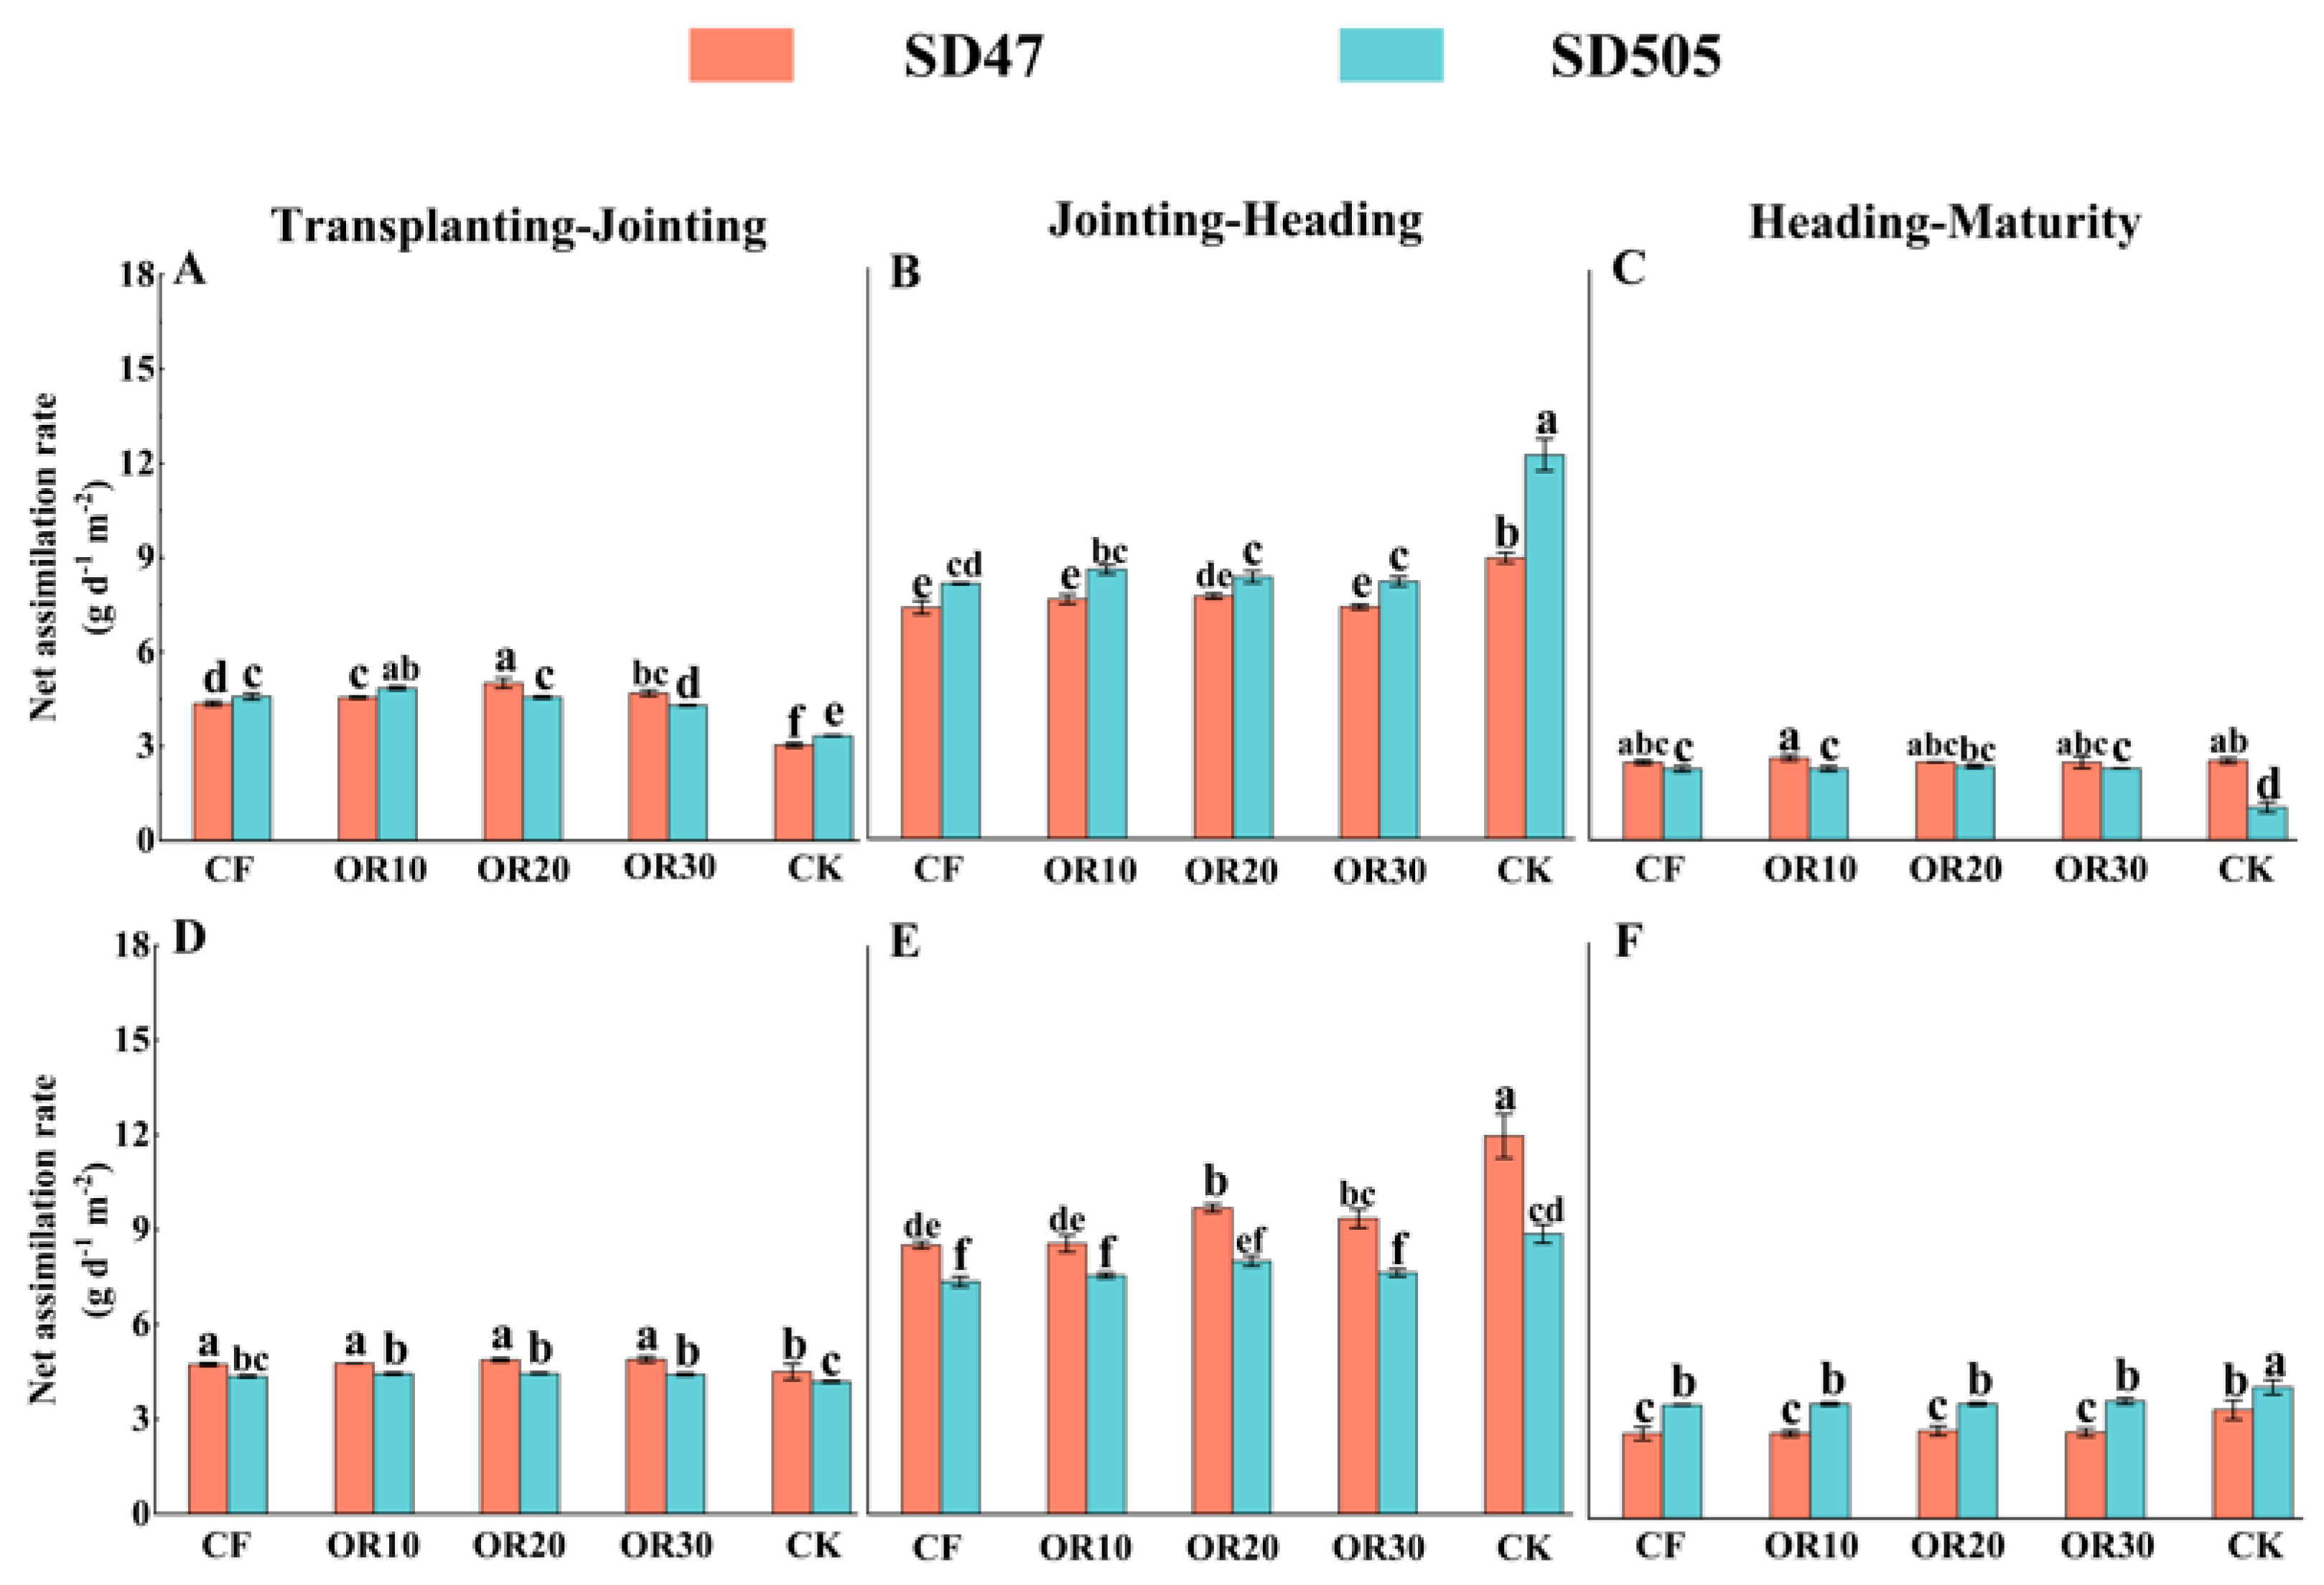
3.2.3. Net Photosynthetic Rate in Flag Leaves

Nitrogen application considerably increased the Pn of flag leaves, as seen in Figure 4. For the two-year trial, the Pn of flag leaves dropped as processing days after heading increased. At the heading stage, the Pn peak was observed. At the beginning of heading, the Pn for each treatment showed the following pattern for both cultivars in both years: CF > OR10 > OR20 > OR30 > CK. At DAH15 in 2021, the trend altered slightly. For both cultivars, the Pn for OR treatments was greater than that for CF treatment. The Pn of the OR20 treatment was the highest for SD47, whereas the OR10 treatment was the highest for SD505. There were similar trends in the Pn of DAH30, which was associated with the Pn of DAH15. In 2022, the Pn of OR was higher than that of CF in DAH15 and DAH30, but there was no significant distinction between nitrogen treatments (OR and CF). These results indicate that OR had greater utilization efficiency at the late growth stage (after heading stage).

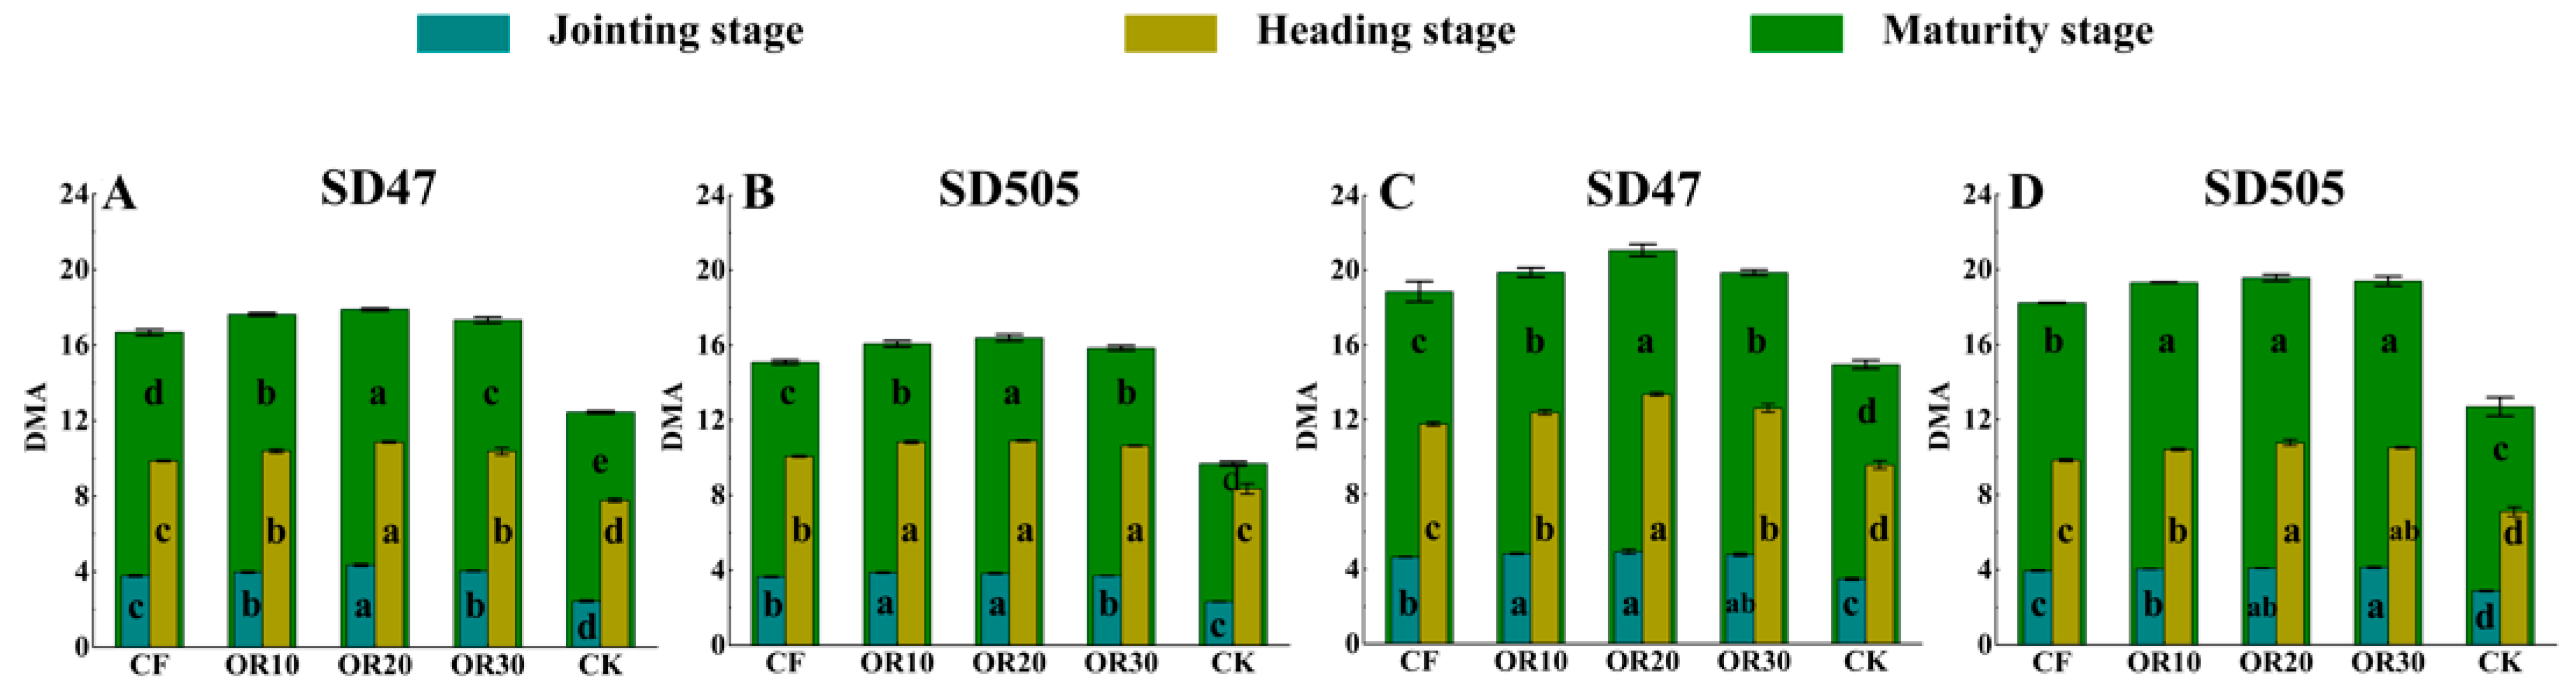
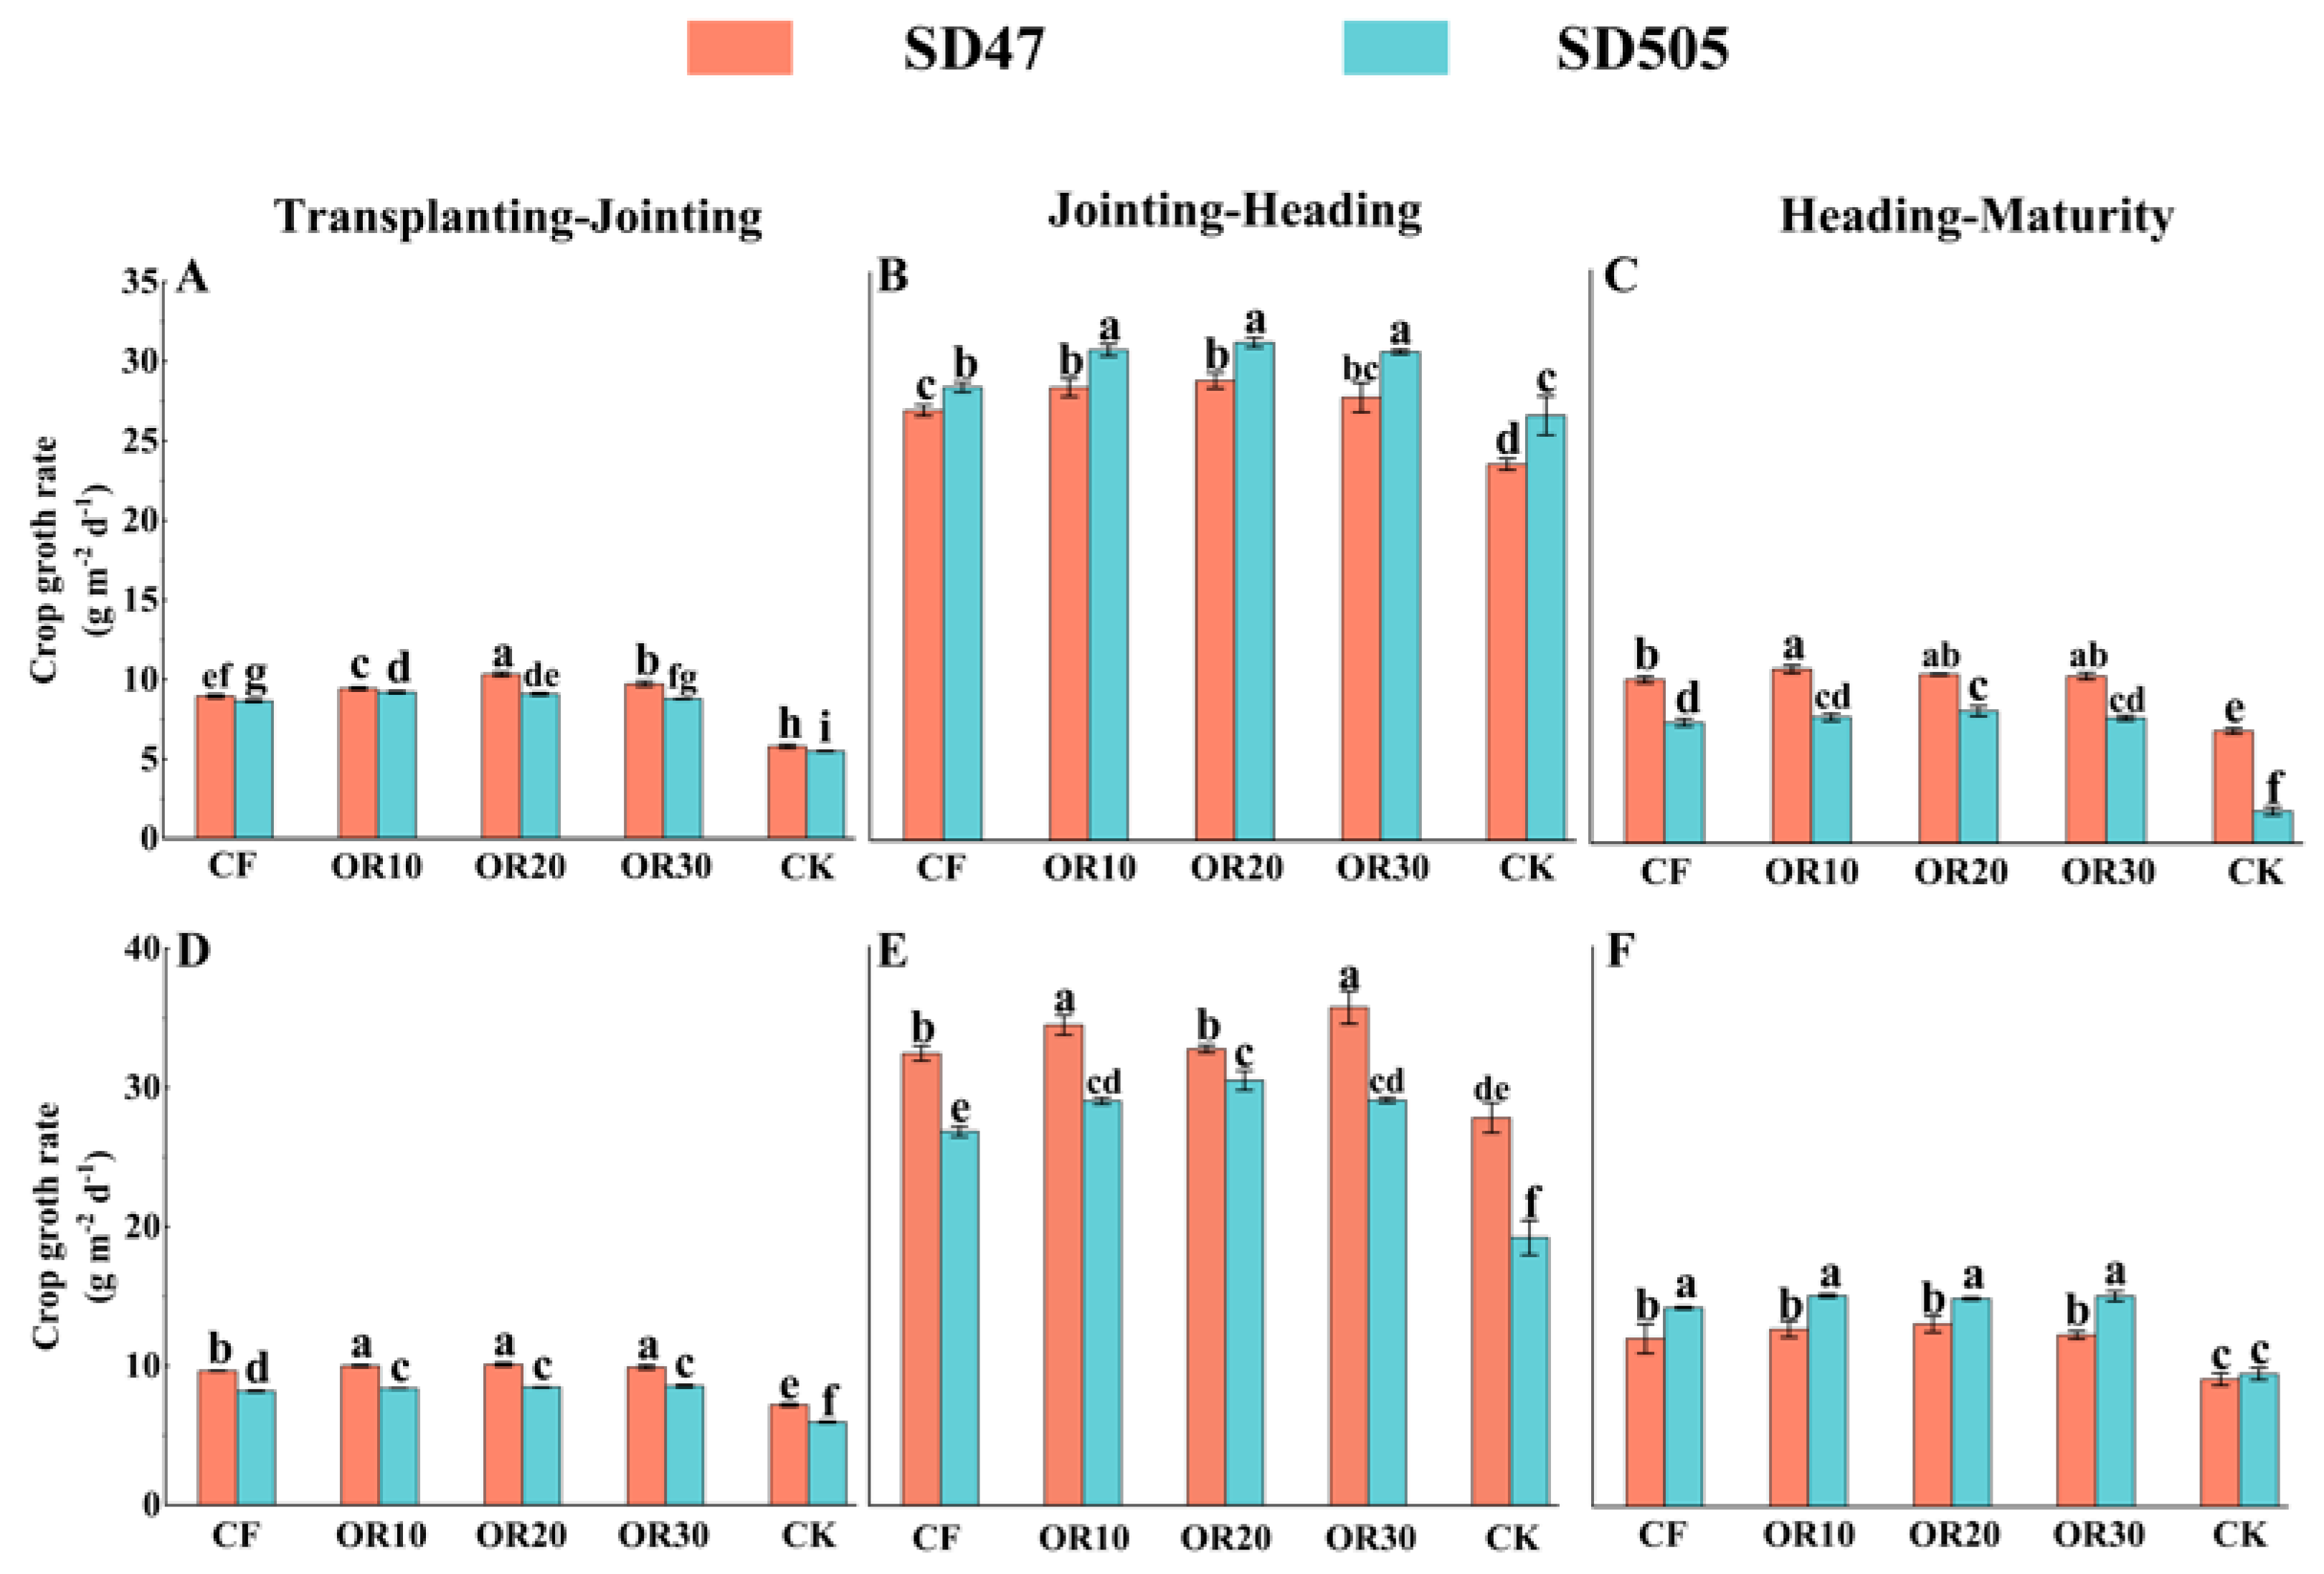
3.2.4. Dry Matter Accumulation and Translocation

Figure 5 presents the trends in dry matter accumulation (DMA). The DMA showed an upward trend that was followed by the passing of the days. Throughout all stages, the DMAs in treatments OR and CF were consistently and significantly higher than those in the CK treatment. Differences in DMA were observed among the fertilization treatments at different growth stages. OR treatments exhibited considerably increased dry matter accumulation at each stage compared to CF treatments, except at the heading stage in 2021, when OR20 was insignificantly higher than CF. Thus, strong matter production of OR is a characteristic after the heading stage.
The study indicated that nitrogen application significantly enhances the crop growth rate (CGR), as shown in Figure 6. Across all evaluated stages, a tendency of first rising and subsequently falling CGR has been observed for N application treatments (CF and OR). For 2021 and 2022, at all stages, the CGR across different N application treatments showed that ORs were higher than CF, and exhibited the following consistent order: OR20 > OR10 > OR30 > CF, with the excepting of the heading–maturity stage in 2021 and the jointing–heading stage for SD47 in 2022.
Figure 7 illustrates the variation in the net assimilation rate (NAR), which initially increased and then decreased as the days progressed. The peak NAR was observed at the jointing–heading stage. For SD47, from the transplanting–jointing and jointing–heading stages, the NAR of OR was higher than CF, and the trend in NAR was OR20 > OR10 > OR30 > CF in both years. For SD505, from the transplanting–jointing to jointing–heading stages, the NAR of OR was higher than that of CF, except NAR at transplanting–jointing stage, with no significant differences noted among OR10, OR20, OR30, and CF treatments in both years. Notably, the NAR of CK was higher than that of others at the heading stage in both years and at the maturity stage in 2022, which was different from CGR.

3.3. Nitrogen Parameters

3.3.1. Nitrogen Index

The N harvest index showed a gradually increasing trend with the increase in organic fertilizer substitution ratio over two years, which was manifested as OR30 > OR20 > OR10 > CF (Table 1). The nitrogen index, including agronomic N use efficiency, partial factor productivity of applied N, and physiological N use efficiency, increased and then decreased with the increasing organic fertilizer substitution ratio, showing OR20 > OR10 > OR30 > CF. Thus, organic fertilizer substitution can enhance N utilization.

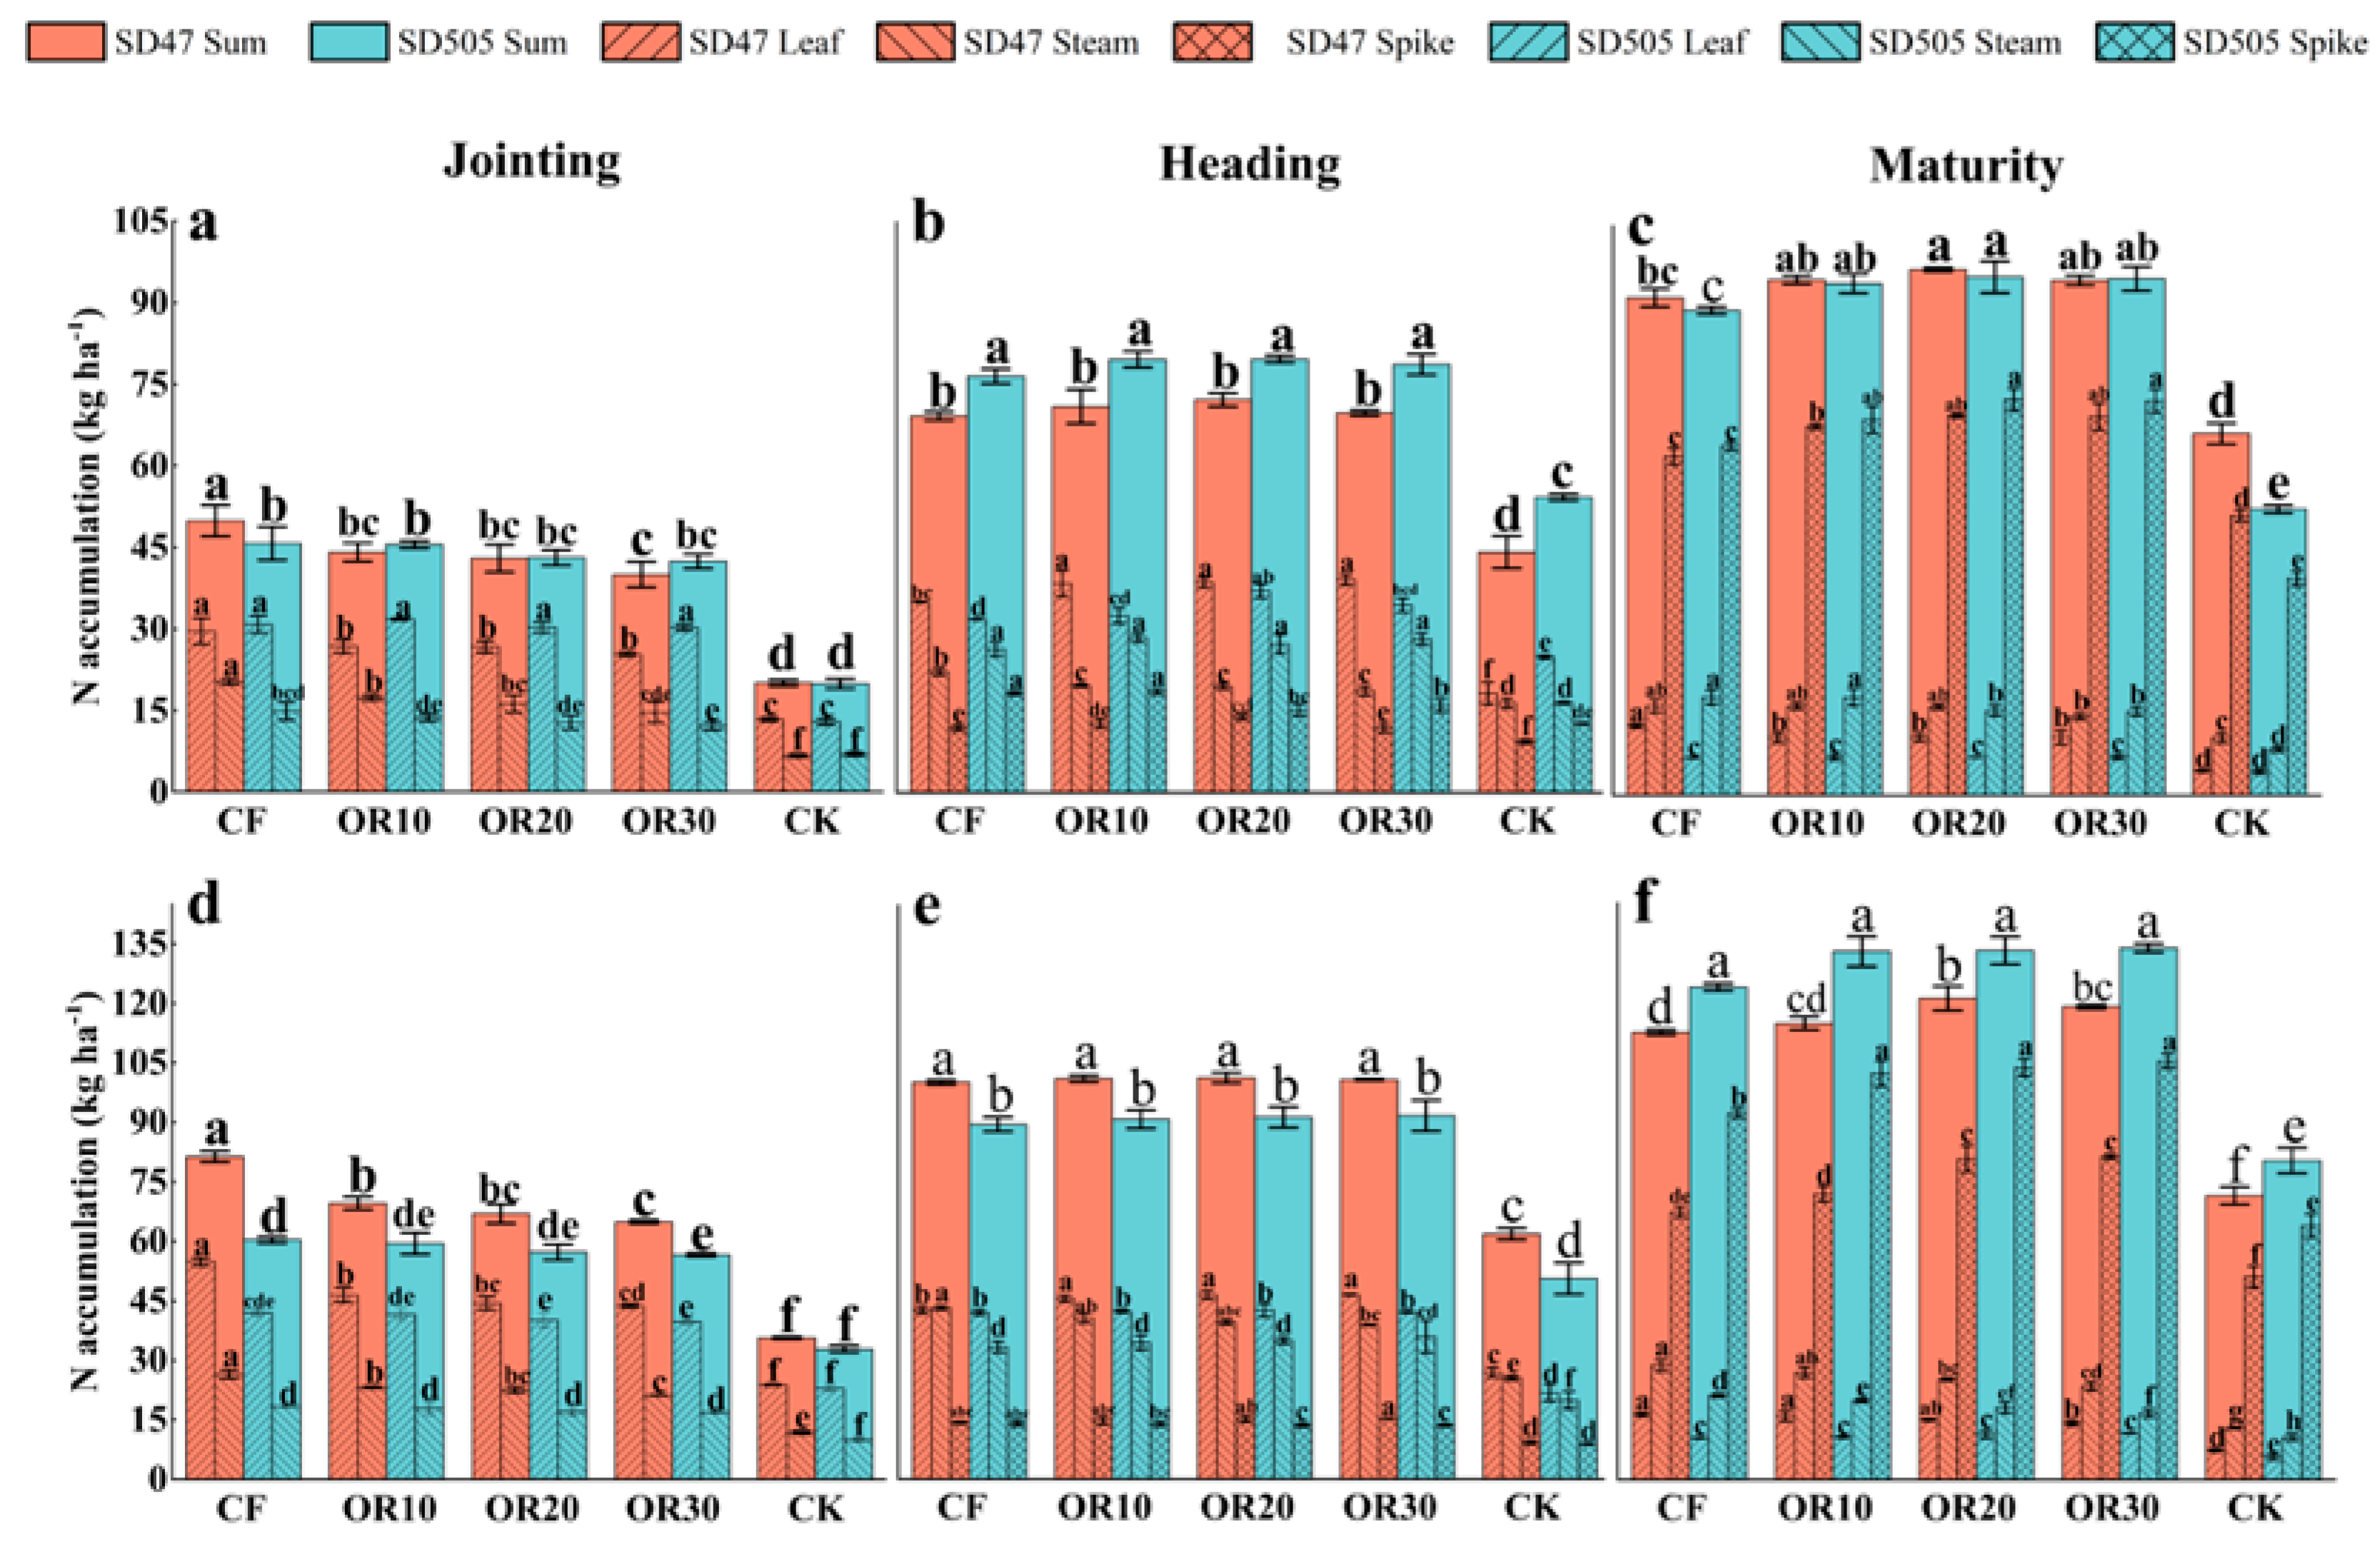
3.3.2. N Accumulation in Main Growth Periods

Similar patterns of N accumulation were observed in both test cultivars across different growth stages (Figure 8). Total N accumulation increased and peaked at the maturity stage. N accumulation in the two cultivars was higher under CF than the others (OR and CK) at jointing stages, especially in SD47, where N accumulation was the highest in both leaf and stem. At the heading stage, there was no difference in total N accumulation among different fertilization treatments (CF and OR). The difference between N accumulation at the jointing stage and N accumulation at the heading stage indicated that OR treatments accumulated more N than CF from the jointing to heading stage. For SD47, N accumulation in the leaf under OR treatments was significantly higher than CF, but N accumulation in the stem under OR treatments was significantly lower than CF. At the maturity stage, generally, treatment with combined organic fertilizer application resulted in higher N accumulation in total at the same N rate, which highlighted higher accumulation in the spike, but lower levels in the leaf and stem compared to CF. This suggests that N accumulation under OR treatments in the leaf and stem can be more efficiently transferred to the spike.

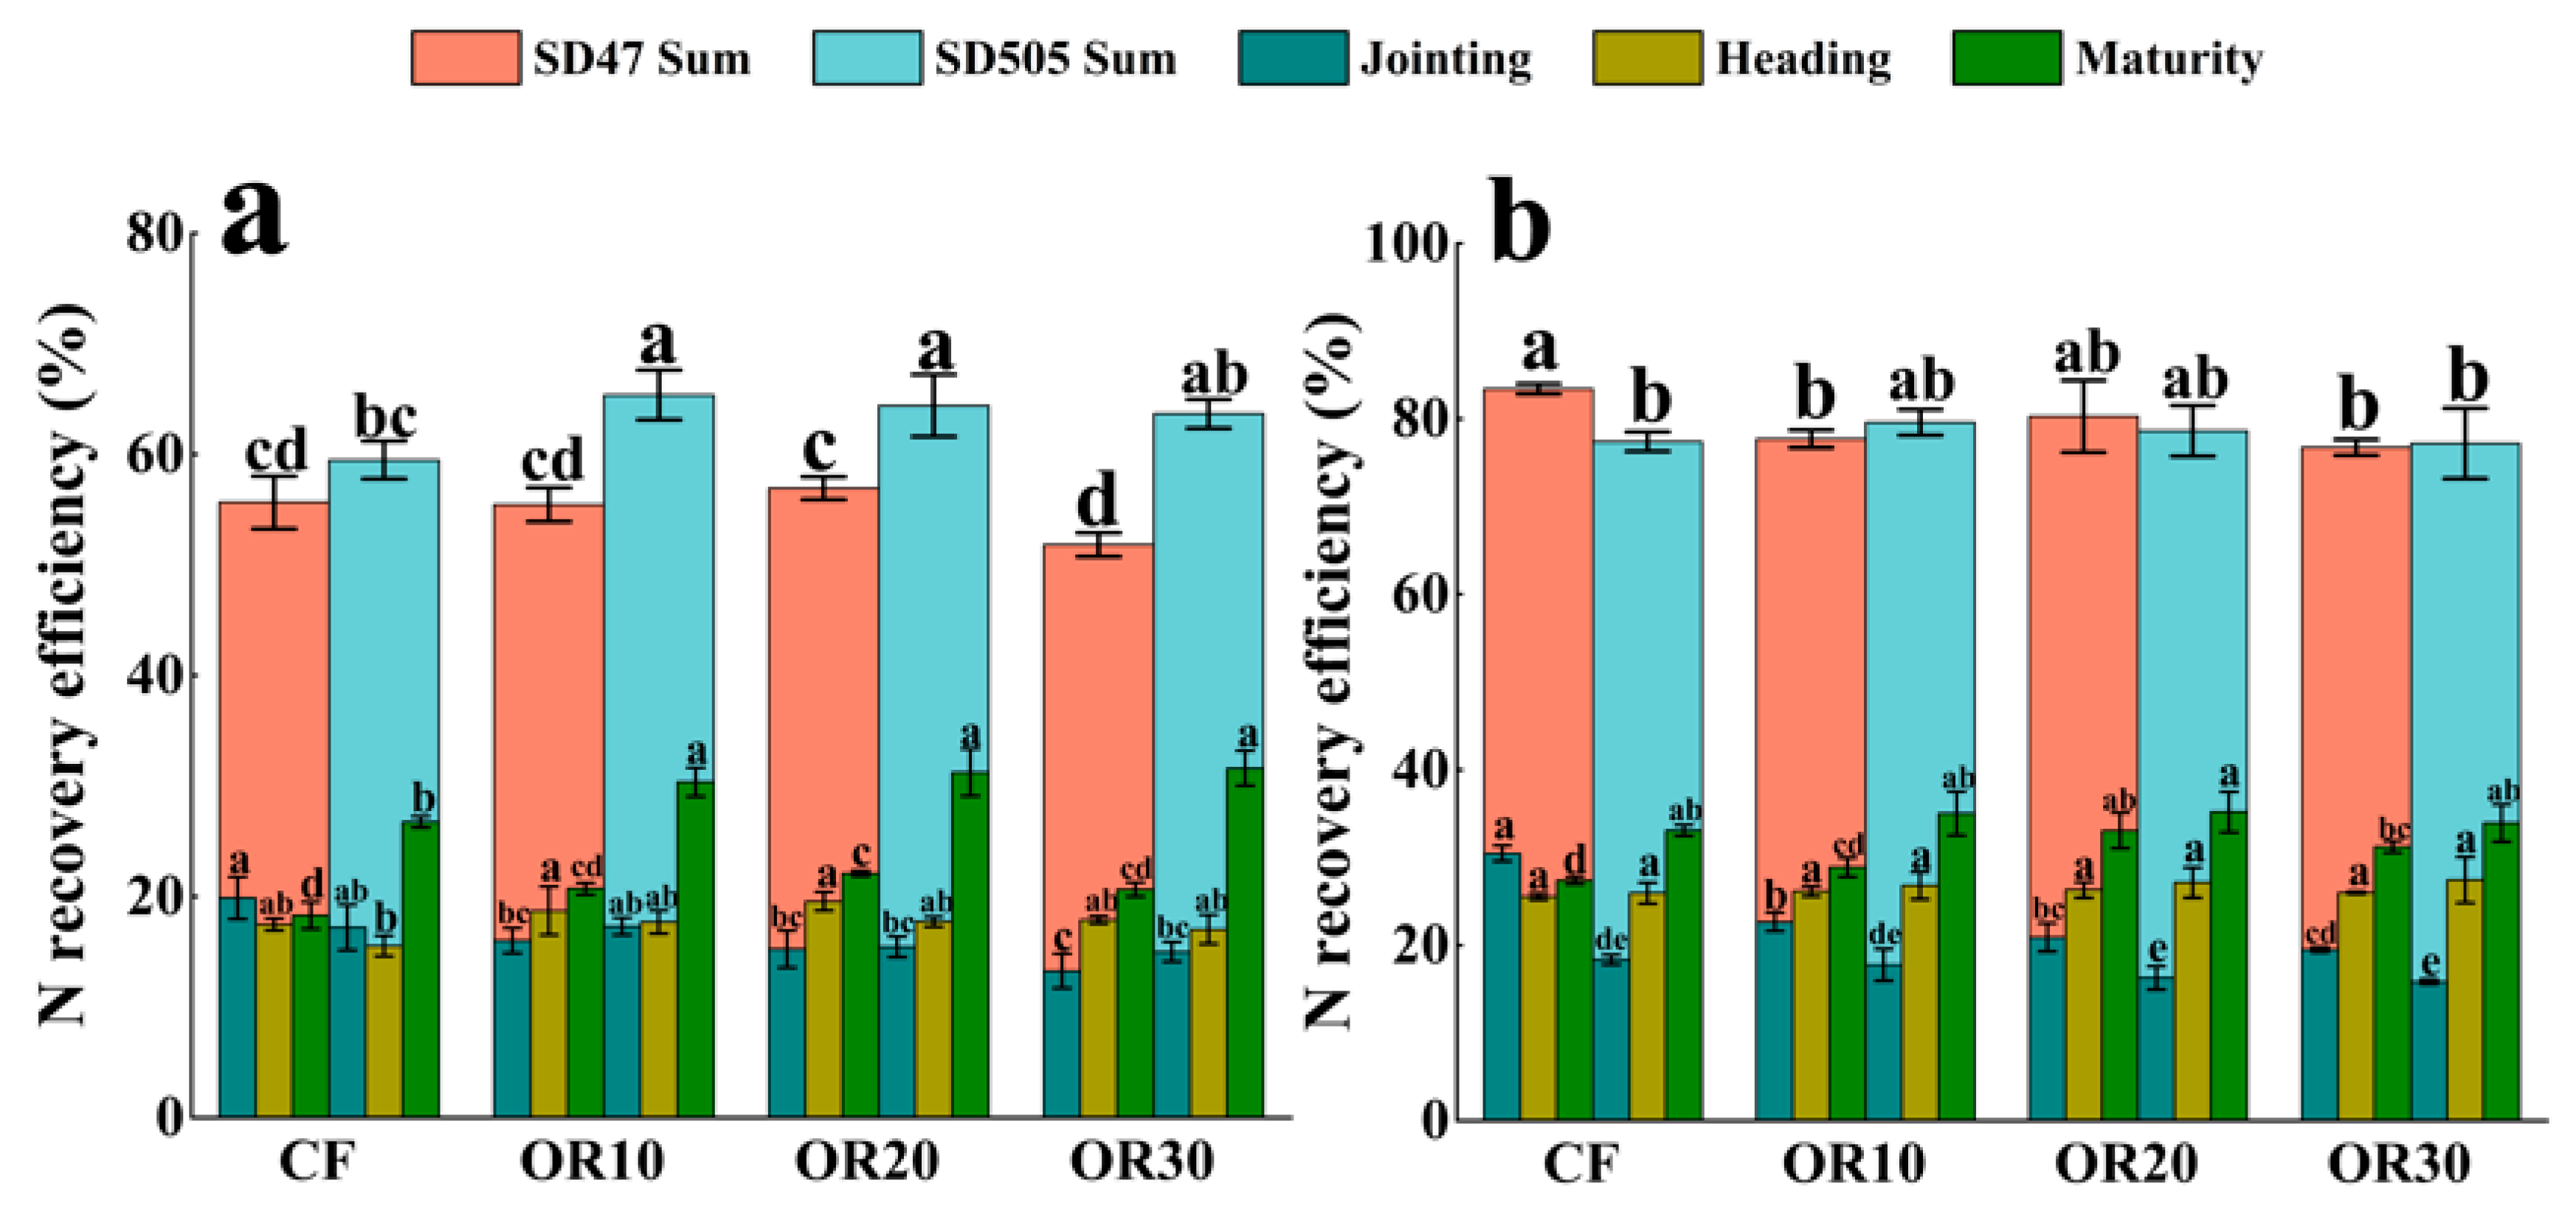
3.3.3. NRE (N Recovery Efficiency) in Main Growth Periods

The trends in N recovery efficiency (NRE) showed variations across the three growth stages. During the transplanting–jointing stage, the NRE was higher in the CF treatment than in the other treatments, which ranked as CF > OR10 > OR20 > OR30. At the jointing–heading stage, the trend of NRE displays a difference between two years. In 2021, the NRE of OR was higher than CF, and with the increase in the proportion of organic fertilizer, NRE exhibited a trend of an initial increase followed by a decrease. In 2022, the NRE of fertilization treatment (OR and CF) showed no significant difference. At the heading stage and maturity stage, it was observed that organic fertilizer treatments had significantly higher NRE than the CF treatment for each period during both years (Figure 9). These results indicate that OR had higher N recovery efficiency from the heading stage to the maturity stage.

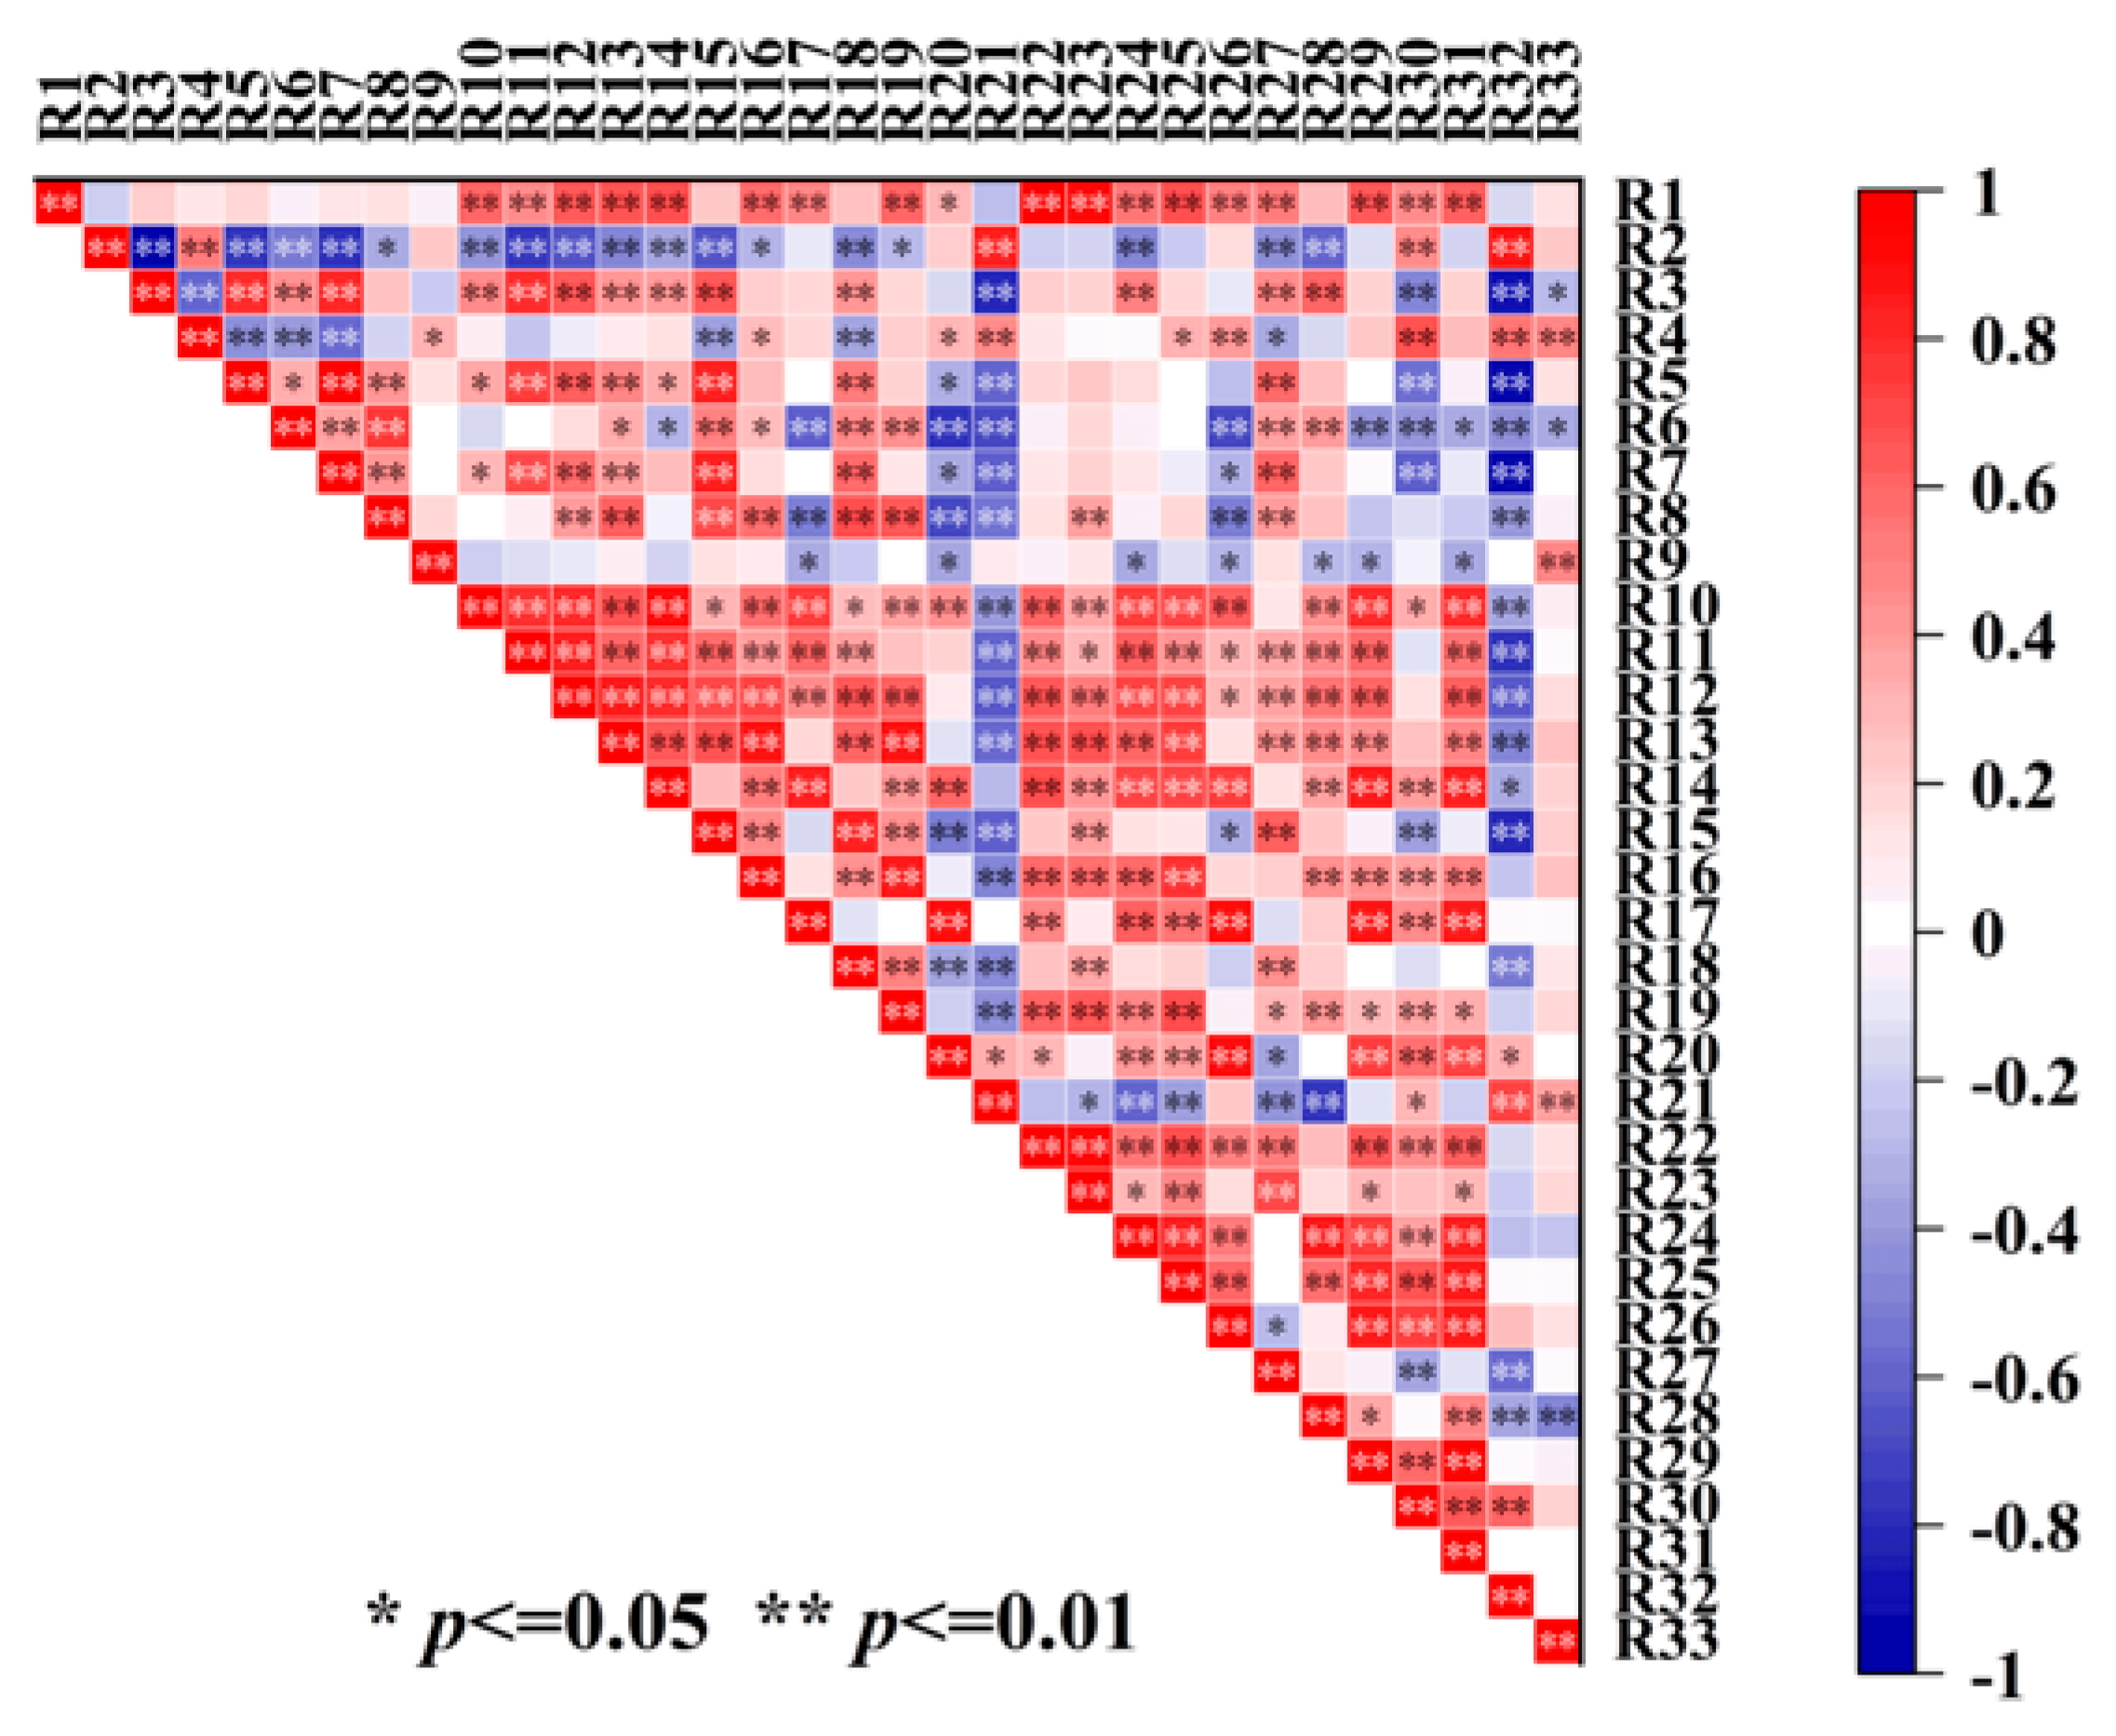
3.4. Correlation of Shoot Traits with Grain Yield and Nitrogen Parameters

Pearson correlation analyses revealed that variables such as 1000-grain weight, LAI at the jointing stage, and N harvest index, were significantly positively correlated with grain yield (Figure 10). In contrast, there was a significant negative correlation between the proportion of organic fertilizer application from spikelets per panicle, Pn at the heading stage, and N recovery efficiency at the jointing stage. Thus, the enhancement of 1000-grain weight and the N harvest index was key to promoting the combined application of organic and chemical fertilizer for yield optimization.

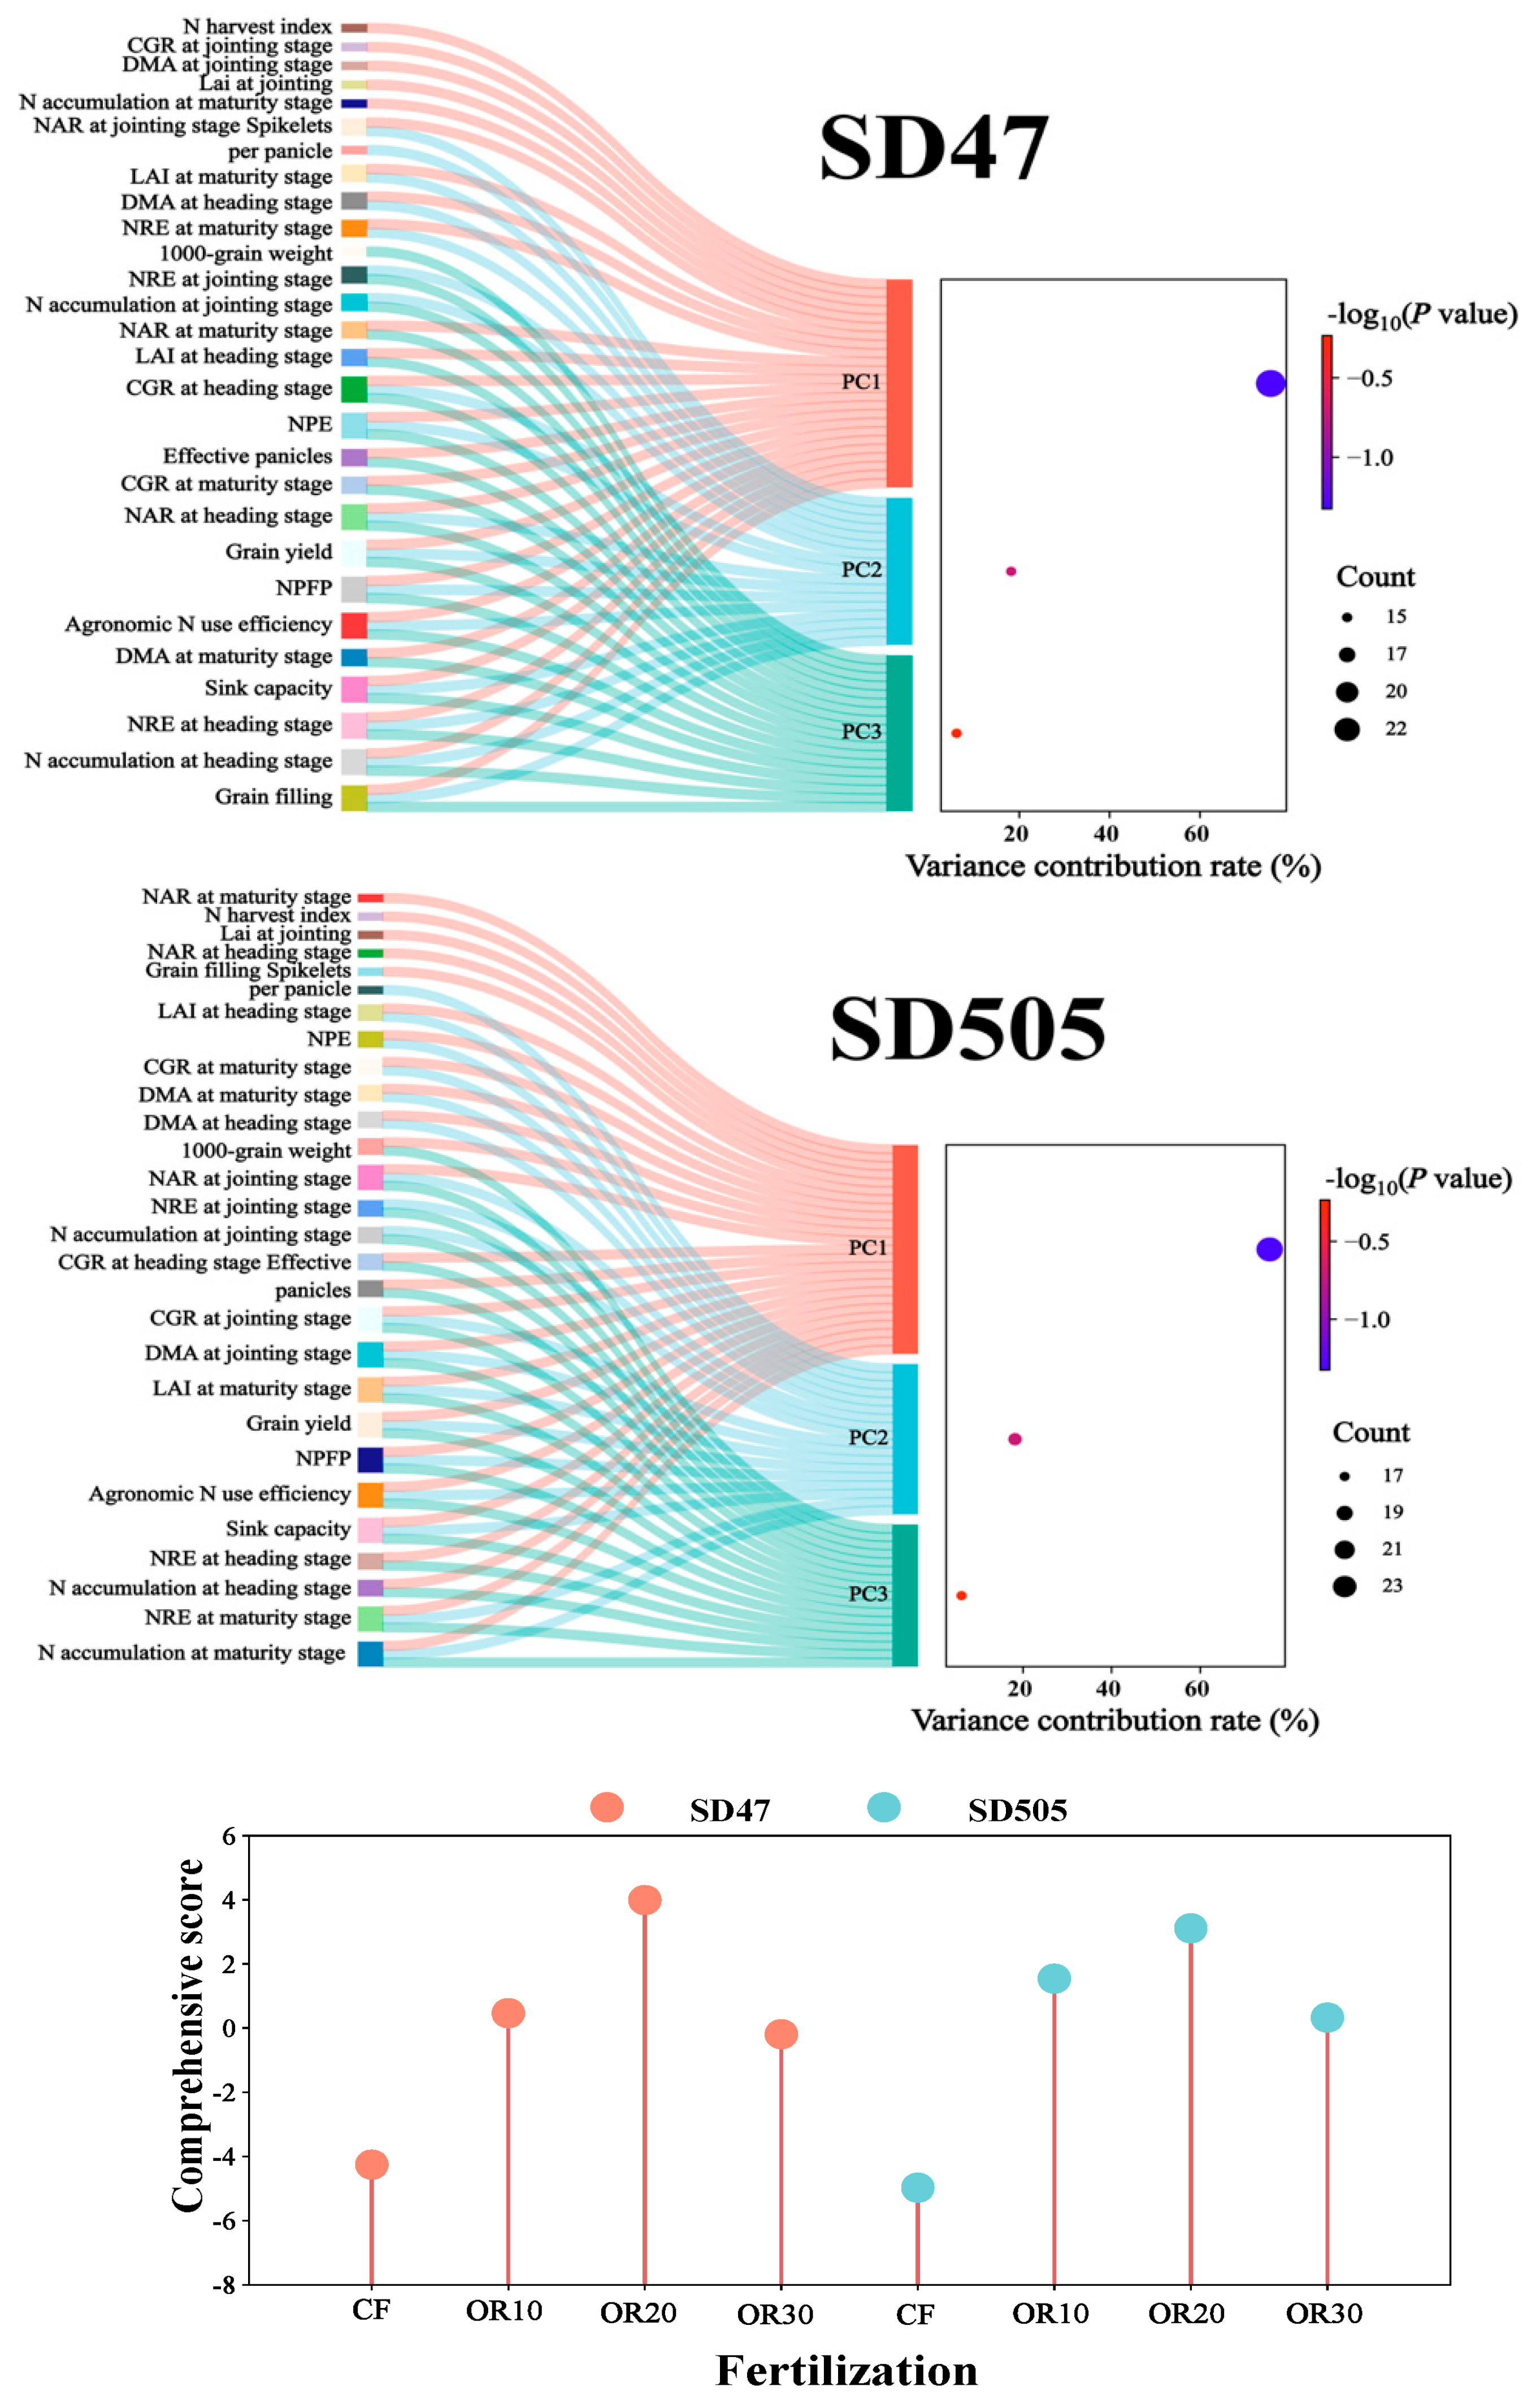
3.5. Comprehensive Assessment of the Different N Fertilizer Management Strategies

The correlations between yield formation, nutrient uptake, and utilization efficiency under different N fertilizer management strategies were evaluated using principal component analysis (PCA). The three principal components (PCs) explained the entire variance of the dataset. For SD47, the first principal component (PC1) explained 73.84%, the second principal component (PC2) explained 17.654%, and the third principal component (PC3) explained 8.502% of the total variance (Table 2). For each fertilization treatment (Figure 11), a comprehensive analysis of rice yield, nutrient uptake, and utilization indicated that OR20 emerged as the optimal N fertilizer management strategy, followed by OR10, OR30, and CF. For SD505, PC1 explained 75.673%, PC2 accounted for 18.201%, and PC3 accounted for 6.125% of the total variance. The comprehensive score showed OR20 > OR10 > OR30 > CF, highlighting that OR10 and OR20 are more suitable for partial organic fertilizer substitution by a chemical fertilizer in terms of yield and nutrient uptake performance for both cultivars in rice (Figure 8).

4. Discussion

Partial organic fertilizer substitution chemical fertilizer can increase yield and enhance N use efficiency [37,38,39]. It is a promising option for rice production in China and other countries. Prior to this study, limited information was available on the synergistic effects of organic fertilizer in enhancing grain yield and N use efficiency when replacing chemical fertilizer. Based on the observed results, this study identifies specific mechanisms to explain this synergistic improvement. Firstly, yield components, such as effective panicles, spikelets per panicle, 1000-grain weight, and grain filling, play a critical role in determining rice yield. N fertilizer is the key factor that can interactively affect the grain yield of rice [40]. Many studies observed that organic fertilizer combined with chemical fertilizer can enhance the rice yield at an appropriate proportion [32,41,42]. In this study, the partial organic fertilizer substitution by chemical fertilizer can enhance effective panicles and grain filling, which leads to a 1–10% increase in ORs compared to CF, and the yield-increasing effect was remarkable. The enhancement of effective panicles and grain filling of ORs aligns with previous studies demonstrating that organic fertilizer substitution improves tillering efficiency and grain filling by providing a stable nutrient supply at the panicle initiation and grain filling stages [31]. Although the number of spikelets per panicle under OR treatment was observed to be lower than CF, Ggrain yield is influenced not only by spikelets per panicle, but also by the number of effective panicles, grain filling, and 1000-grain weight [30]. Overall, ORs had a higher yield than CF.
Secondly, photosynthesis is the basis of crop production [43], with yield being the result of the accumulation of photosynthates in plant organs [44], and photosynthesis accounts for 90–95% of rice yield either directly or indirectly. Chlorophyll is the primary site of photosynthesis, and the synthesis of organic matter depends on chlorophyll. Chlorophyll concentration is an excellent indicator of plant growth and development, as described by the SPAD index [36]. Numerous studies emphasize nitrogen’s essential function in the growth and development of the leaves [45]. Proper nitrogen fertilization enhances the flag leaf’s photosynthetic efficiency and chlorophyll content (SPAD). It improves the leaf area index and maximizes light energy interception by extending its senescence during the grain-filling period [36]. This improvement extends to the growth and development of rice’s stems, leaves, and other nutrient organs, fostering better photosynthesis and nutrient accumulation. In this study, compared to CF treatment, OR treatments enhance the canopy structure after the heading stage, as evidenced by effective panicles and LAI (Figure 1 and Figure 2). OR treatments also maintained a higher photosynthetic rate. These observations found that chlorophyll content (SPAD) declined relatively more slowly than that of CF, which could sustain higher photosynthetic efficiency (Figure 3 and Figure 4). The efficiency of photosynthesis plays an important role, influencing the pace of grain filling, consequently impacting 1000-grain weight and final yield.
Thirdly, the photosynthetic productivity required for grain filling not only comes from photosynthesis after anthesis, but also from the accumulation of assimilates stored in stems and sheaths before heading [46]. Dry matter accumulation directly indicates crop growth [47], and dry matter accumulation was related to leaf, grain sink, photosynthesis, and nitrogen metabolic [48]. Many studies suggested that dry matter accumulation has a noteworthy positive correlation with yield, which means that high dry matter accumulation has a high yield potential [49,50,51]. This study demonstrated that the OR treatments had markedly higher total dry matter accumulation than CF treatment at all stages. OR treatments promote dry matter accumulation in stems and sheaths before the heading stage and enhance its remobilization to grains during grain filling, which differs from CF treatments (Figure 5). In long-term rice cultivation, partial substitution of an organic fertilizer for a chemical fertilizer optimizes nutrient distribution and enhances the transfer of nutrients to the harvestable product (grain), thus increasing the harvest index and improving total biomass [52].
Fourthly, enhancing rice yield potential must come from biomass accumulation, as we mentioned earlier. Biomass accumulation can be increased by increasing crop growth rate [53]. Higher crop growth rate can accumulate higher biomass, which can produce more yield under the same conditions. Crop growth rate (CGR) is a dynamic character that determines the final yield in rice. Net assimilation rate (NAR) is considered a major crop growth component [54]. In this study, the OR treatment exhibited stronger shoot activity, as indicated by its higher CGR, and NAR is compared to CF treatments at the same N application rate from the transplanting to heading stage (Figure 6 and Figure 7). On the one hand, high CGR and NAR were helpful in providing more sufficient assimilates for grain filling. On the other hand, higher CGR and NAR can produce more dry matter accumulation and grain yield with less N input [49,55,56], which is beneficial to improve N use efficiency [57].
Fifthly, about OR treatments enhancing the nitrogen parameters, there were two speculations: (i) The N content of the crop is primarily affected by the form of nitrogen fertilizer [40]. The forms of nitrogen in organic fertilizer are diverse, and when combined with chemical fertilizer, provide varied nutrition sources that enhance nitrogen absorption and transport in crops [56]. (ii) Characteristics of nitrogen are released from organic fertilizer and chemical fertilizer. In the current study, CF treatment had more N uptake than OR treatments at the jointing stage, whereas at the heading and maturity stages, OR treatments significantly enhanced N uptake compared to CF (Figure 8). This might be because, in comparison to chemical fertilizer, organic fertilizer does not supply enough nutrients for plant development in the early stages of growth. Chemical fertilizer releases nutrients quickly, making them readily available to plants during early growth, whereas the gradual and consistent release of nutrients from organic fertilizer ensures that plants have enough nutrients throughout growth, especially during the grain-filling stage. (iii) More tillers could reduce the N applied during the early growing season [58]. For our study, compared to CF, OR treatments increase tillers; increasing tillers could reduce N losses and increase rice yield and NUE. In this study, organic fertilizer and chemical fertilizer significantly increased the N harvest index, agronomic N use efficiency, partial factor productivity of applied N, and physiological N use efficiency, particularly when applying 20% organic fertilizer and 80% chemical fertilizer (OR20) compared to sole urea fertilization (CF). Moreover, organic fertilizer application enhanced the nutrient-preserving capability of the soil and reduced N leaching [59]. Similar to our study, Ye et al. [60] stated that using organic fertilizer with chemical fertilizer improved nutrient uptake and plant growth.

5. Conclusions

In this study, 0–30% organic fertilizer substitution with chemical fertilizer could achieve both high grain yield and NUE of rice in the northeast of China. The increase in rice yield under OR treatments was the result of improvements in effective panicle and grain filling under combined organic and chemical fertilizers. The increase in grain filling in the OR treatments resulted from higher photosynthesis efficiency, dry matter accumulation, crop growth rate (CGR), and net assimilation rate (NAR). Furthermore, the increases in rice yield and N uptake under OR treatments were associated with improved dry matter accumulation and leaf photosynthesis after the heading stage. These findings demonstrate the substantial impact of optimal, balanced fertilization on the enhancement of rice yield, physiological characteristics, photosynthesis, and nutrient absorption. Conclusively, regarding a comprehensive assessment, combining the application of organic fertilizer with chemical fertilizer at a 20:80% ratio is a good model for higher rice grain yield and N utilization. Based on these findings, it is recommended that more multi-year field experimentation is conducted regarding the partial substitution of chemical fertilizer by organic fertilizer to determine how it effects the improvement of rice productivity, physiological performance, and yield, with maximizing human benefits.

Author Contributions

Conceptualization, S.W.; software, J.L. (Junfeng Liu); validation, Z.W. and Y.W.; formal analysis, S.G. and J.L. (Jiaxin Liu); investigation, S.G., Z.W., J.L. (Jiaxin Liu), C.L. and Y.W.; resources, J.L. (Junfeng Liu) and J.M.; data curation, S.G. and Y.L.; writing—original draft, S.G.; Writing—review and editing, S.G., Y.L., C.L., S.W. and C.Z.; visualization, J.M.; supervision, S.W.; project administration, C.Z.; funding acquisition, S.W. All authors have read and agreed to the published version of the manuscript.

Funding

This study was supported by the National Key Research and Development Program of China (2016YFD0300104) and Liaoning Province’s Key Scientific and Technological Project: ‘Leading the Charge with Open Competition’.

Data Availability Statement

The data presented in this study are available upon request from the corresponding author.

Acknowledgments

We fully appreciate the editors and all anonymous reviewers for their constructive comments on this manuscript.

Conflicts of Interest

The authors declare no conflict of interest.

References

  1. Xiong, J.; Ding, C.Q.; Wei, G.B.; Ding, Y.F.; Wang, S.H. Characteristic of Dry-Matter Accumulation and Nitrogen-Uptake of Super-High-Yielding Early Rice in China. Agron. J. 2013, 105, 1142–1150. [Google Scholar] [CrossRef]
  2. Peng, S.B.; Tang, Q.Y.; Zou, Y.B. Current Status and Challenges of Rice Production in China. Plant Prod. Sci. 2009, 12, 3–8. [Google Scholar] [CrossRef]
  3. Chen, Z.K.; Liu, F.D.; Cai, G.Y.; Peng, X.S.; Wang, X.L. Responses of soil carbon pools and carbon management index to nitrogen substitution treatments in a sweet maize farmland in south China. Plants 2022, 11, 2194. [Google Scholar] [CrossRef]
  4. Hu, J.Y.; Yang, Y.; Zhang, H.Y.; Li, Y.H.; Zhang, S.H.; He, X.H.; Huang, Y.F.; Ye, Y.L.; Zhao, Y.N.; Yan, J.Y. Reduction in nitrogen rate and improvement of nitrogen use efficiency without loss of peanut yield by regional mean optimal rate of chemical fertilizer based on a multi-site field experiment in the north China plain. Plants 2023, 12, 1326. [Google Scholar] [CrossRef]
  5. Dong, J.S.; Shen, X.J.; Li, Q.; Xue, Z.; Hou, X.F.; Miao, H.C.; Ning, H.F. Irrigation and fertilization scheduling for peanut cultivation under mulched drip irrigation in a desert–oasis area. Plants 2024, 13, 144. [Google Scholar] [CrossRef] [PubMed]
  6. Zhao, C.; Ni, H.F.; Zhao, L.; Zhou, L.; Hidalgo, O.B.; Cui, R.Z. High nitrogen concentration alter microbial community in allium fistulosum rhizosphere. PLoS ONE 2020, 15, e0241371. [Google Scholar] [CrossRef]
  7. Galloway, J.N.; Townsend, A.R.; Erisman, J.W.; Bekunda, M.; Cai, Z.; Freney, J.R.; Martinelli, L.A.; Seitzinger, S.P.; Sutton, M.A. Transformation of the Nitrogen Cycle: Recent Trends, Questions, and Potential Solutions. Science 2008, 320, 889–892. [Google Scholar] [CrossRef]
  8. Chen, X.M.; Wo, F.; Chen, C.; Fang, K. Seasonal changes in the concentrations of nitrogen and phosphorus in farmland drainage and groundwater of the Taihu Lake region of China. Environ. Monit. Assess. 2010, 169, 159–168. [Google Scholar] [CrossRef] [PubMed]
  9. Zhang, M.; Tian, Y.; Zhao, M.; Yin, B.; Zhu, Z.L. The assessment of nitrate leaching in a rice–wheat rotation system using an improved agronomic practice aimed to increase rice crop yields. Agric. Ecosyst. Environ. 2017, 241, 100–109. [Google Scholar] [CrossRef]
  10. Xu, J.Z.; Peng, S.Z.; Yang, S.H.; Wang, W.G. Ammonia volatilization losses from a rice paddy with different irrigation and nitrogen managements. Agric. Water Manag. 2012, 104, 184–192. [Google Scholar] [CrossRef]
  11. Chen, X.; Zhang, F.; Romheld, V.; Horlacher, D.; Schulz, R.; Zilkens, M.B.; Wang, P.; Claupein, W. Synchronizing N supply from soil and fertilizer and N demand of winter wheat by an improved Nmin method. Nutr. Cycl. Agroecosyst. 2006, 74, 91–98. [Google Scholar] [CrossRef]
  12. Yang, Y.C.; Zhang, M.; Li, Y.C.; Fan, X.H.; Geng, Y.Q. Controlled Release Urea Improved Nitrogen Use Efficiency, Activities of Leaf Enzymes, and Rice Yield. Soil Sci. Soc. Am. J. 2012, 76, 2307–2317. [Google Scholar] [CrossRef]
  13. Yao, Z.S.; Zheng, X.H.; Wang, R.; Liu, C.Y.; Lin, S.; Bahl, K.B. Benefits of integrated nutrient management on N2O and NO mitigations in water-saving ground cover rice production systems. Sci. Total Environ. 2019, 646, 1155–1163. [Google Scholar] [CrossRef] [PubMed]
  14. Cao, Y.S.; Tian, Y.H.; Yin, B.; Zhu, Z.L. Assessment of ammonia volatilization from paddy fields under crop management practices aimed to increase grain yield and N efficiency. Field Crops Res. 2013, 147, 23–31. [Google Scholar] [CrossRef]
  15. Lawrencia, D.; Wong, S.K.; Low, D.Y.S.; Goh, B.H.; Goh, J.K.; Ruktanonchai, U.R.; Soottitantawat, A.; Lee, L.H.; Tang, S.Y. Controlled release fertilizers: A review on coating materials and mechanism of release. Plants 2021, 10, 238. [Google Scholar] [CrossRef]
  16. Yin, Y.H.; Peng, X.Z.; Guo, S.F.; Zhai, L.M.; Hua, L.L.; Wang, H.Y.; Liu, H.B. How to improve the light-simplified and cleaner production of rice in cold rice areas from the perspective of fertilization. J. Clean. Prod. 2022, 361, 131694. [Google Scholar] [CrossRef]
  17. Hayatu, N.G.; Liu, Y.R.; Han, T.F.; DABA, N.A.; Zhang, L.; Shen, Z.; Li, J.W.; Muazu, H.; Lamlom, S.F.; Zhang, H.M. Carbon sequestration rate, nitrogen use efficiency and rice yield responses to long-term substitution of chemical fertilizer by organic manure in a rice–rice cropping system. J. Integr. Agric. 2023, 22, 2848–2864. [Google Scholar] [CrossRef]
  18. Pan, G.X.; Zhou, P.; Li, Z.P.; Smitch, P.; Li, L.Q.; Qiu, D.S.; Zhang, X.H.; Xu, X.B.; Shen, S.Y.; Chen, X.M. Combined inorganic/organic fertilization enhances N efficiency and increases rice productivity through organic carbon accumulation in a rice paddy from the Tai Lake region, China. Agric. Ecosyst. Environ. 2009, 131, 274–280. [Google Scholar] [CrossRef]
  19. Ghosh, S.; Wilson, B.; Ghoshal, S.; Senapati, N.; Mandal, B. Organic amendments influence soil quality and carbon sequestration in the Indo-Gangetic plains of India. Agric. Ecosyst. Environ. 2012, 156, 134–141. [Google Scholar] [CrossRef]
  20. Dai, X.L.; Zhou, W.; Liu, G.R.; Liang, G.Q.; He, P.; Liu, Z.B. Soil C/N and pH together as a comprehensive indicator for evaluating the effects of organic substitution management in subtropical paddy fields after application of high-quality amendments. Geoderma 2019, 337, 1116–1125. [Google Scholar] [CrossRef]
  21. Fei, L.W.; Pan, Y.H.; Ma, H.L.; Guo, R.J.; Wang, M.; Ling, N.; Shen, Q.R. Optimal organic-inorganic fertilization increases rice yield through source-sink balance during grain filling. Field Crops Res. 2024, 308, 109285. [Google Scholar] [CrossRef]
  22. Yang, G.Y.; Ji, H.T.; Liu, H.J.; Zhang, Y.F.; Chen, L.G.; Zheng, J.C.; Guo, Z.; Sheng, J. Assessment of productivity, nutrient uptake and economic benefits of rice under different nitrogen management strategies. Peer J. 2020, 8, e9596. [Google Scholar] [CrossRef]
  23. Xie, Z.J.; Tu, S.X.; Shah, F.; Xu, C.X.; Chen, J.R.; Han, D.; Liu, G.R.; Li, H.L.; Muhammad, I.; Cao, W.D. Substitution of fertilizer-N by green manure improves the sustainability of yield in double-rice cropping system in south China. Field Crops Res. 2016, 188, 142–149. [Google Scholar] [CrossRef]
  24. Kumar, U.; Kumar, N.A.; Shahid, M.; Gupta, V.V.; Panneerselvam, P.; Mohanty, S.; Kaviraj, M.; Kumar, A.; Chatterjee, D.; Lal, B.; et al. Continuous application of inorganic and organic fertilizers over 47 years in paddy soil alters the bacterial community structure and its influence on rice production. Agric. Ecosyst. Environ. 2018, 262, 65–75. [Google Scholar] [CrossRef]
  25. Zhou, T.Y.; Chen, L.; Wang, W.L.; Xu, Y.J.; Zhang, W.Y.; Zhang, H.; Liu, L.J.; Wang, Z.Q.; Gu, J.F.; Yang, J.C. Effects of application of rapeseed cake as organic fertilizer on rice quality at high yield level. J. Sci. Food Agric. 2022, 102, 1832–1841. [Google Scholar] [CrossRef]
  26. Yang, J.; Liao, B.; Fang, C.Y.; Sheteiwy, M.S.; Yi, Z.X.; Liu, S.C.; Li, C.; Ma, G.Z.; Tu, N.M. Effects of Applying Different Organic Materials on Grain Yield and Soil Fertility in a Double-Season Rice Cropping System. Agronomy 2022, 12, 2838. [Google Scholar] [CrossRef]
  27. Xu, Y.G.; Peng, Z.P.; Tu, Y.T.; Huang, J.C. Combining organic and inorganic fertilization increases rice yield and soil nitrogen and carbon: Dissolved organic matter chemodiversity and soil microbial communities. Plant Soil 2023, 492, 557–571. [Google Scholar] [CrossRef]
  28. Iqbal, A.; Xie, H.M.; He, L.; Ahmad, S.; Hussain, I.; Raza, H.; Khan, A.; Wei, S.Q.; Quan, Z.; Wu, K.; et al. Partial substitution of organic nitrogen with synthetic nitrogen enhances rice yield, grain starch metabolism and related genes expression under the dual cropping system. Saudi J. Biol. Sci. 2021, 28, 1283–1296. [Google Scholar] [CrossRef]
  29. Tang, H.M.; Li, C.; Shi, L.H.; Xiao, X.P.; Cheng, K.K.; Wen, L.; Li, W.Y. Effect of different long-term fertilizer managements on soil nitrogen fixing bacteria community in a double-cropping rice paddy field of southern China. PLoS ONE 2021, 16, e0256754. [Google Scholar] [CrossRef]
  30. Iqbal, A.; He, L.; Khan, A.; Wei, S.Q.; Akhtar, K.; Ali, I.; Ullah, S.; Munsif, F.; Zhao, Q.; Jiang, L.G. Organic Manure Coupled with Inorganic Fertilizer: An Approach for the Sustainable Production of Rice by Improving Soil Properties and Nitrogen Use Efficiency. Agronomy 2019, 9, 651. [Google Scholar] [CrossRef]
  31. Moe, K.; Moh, S.M.; Htwe, A.Z.; Kajihara, Y.; Yamakawa, T. Effects of Integrated Organic and Inorganic Fertilizers on Yield and Growth Parameters of Rice Varieties. Rice Sci. 2019, 26, 309–318. [Google Scholar] [CrossRef]
  32. Gao, P.; Zhang, T.; Lei, X.Y.; Cui, X.W.; Lu, Y.X.; Fan, P.F.; Long, S.P.; Huang, J.; Gao, J.S.; Zhang, Z.H.; et al. Improvement of soil fertility and rice yield after long-term application of cow manure combined with inorganic fertilizers. J. Integr. Agric. 2023, 22, 2221–2232. [Google Scholar] [CrossRef]
  33. Chu, G.; Wang, Z.Q.; Zhang, H.; Yang, J.C.; Zhang, J.H. Agronomic and physiological performance of rice under integrative crop management. Agron. J. 2016, 108, 117–128. [Google Scholar] [CrossRef]
  34. Ying, J.C.; Peng, S.B.; He, Q.R.; Yang, H.; Yang, C.D.; Visperas, R.M.; Cassman, K.G. Comparison of high-yield rice in tropical and subtropical environments I. Determinants of grain and dry matter yields. Field Crops Res. 1998, 57, 71–84. [Google Scholar] [CrossRef]
  35. Zhou, Q.; Yuan, R.; Zhang, W.Y.; Gu, J.F.; Liu, L.J.; Zhang, H.; Wang, Z.Q.; Yang, J.C. Grain yield, nitrogen use efficiency and physiological performance of indica/japonica hybrid rice in response to various nitrogen rates. J. Integr. Agric. 2023, 22, 63–79. [Google Scholar] [CrossRef]
  36. Meng, F.G.; Zhao, L.D.; Li, W.L.; Zhao, C.X. Optimizing nitrogen application for enhanced yield and quality of strong-gluten wheat: A case study of Zhongmai 578 in the North China Plain. Agronomy 2024, 14, 1301. [Google Scholar] [CrossRef]
  37. Paramesh, V.; Kumar, P.; Bhagat, T.; Nath, A.J.; Manohara, K.K.; Das, B.; Desai, B.F.; Jha, P.K.; Prasad, P.V.V. Integrated Nutrient Management Enhances Yield, Improves Soil Quality, and Conserves Energy under the Lowland Rice–Rice Cropping System. Agronomy 2023, 13, 1557. [Google Scholar] [CrossRef]
  38. Amanullah; Hidayatullah. Influence of Organic and Inorganic Nitrogen on Grain Yield and Yield Components of Hybrid Rice in Northwestern Pakistan. Rice Sci. 2016, 23, 326–333. [Google Scholar] [CrossRef]
  39. Dai, X.L.; Song, D.L.; Zhou, W.; Liu, G.R.; Liang, G.Q.; He, P.; Sun, G.; Yuan, F.S.; Liu, Z.B.; Yao, Y.K.; et al. Partial substitution of chemical nitrogen with organic nitrogen improves rice yield, soil biochemical indictors and microbial composition in a double rice cropping system in south China. Soil Tillage Res. 2021, 205, 104753. [Google Scholar] [CrossRef]
  40. Zhou, C.C.; Huang, Y.C.; Jia, B.Y.; Wang, S.; Dou, F.G.; Samonte, S.O.P.; Chen, K.; Wang, Y. Optimization of Nitrogen Rate and Planting Density for Improving the Grain Yield of Different Rice Genotypes in Northeast China. Agronomy 2019, 9, 555. [Google Scholar] [CrossRef]
  41. Moridani, M.J.; Sadeghi, S.M.; Roshan, N.M.; Ashouri, M.; Doroudian, H.R. Effects of Organic and Chemical Fertilizers on Yield and Yield Components of Rice in Different Moisture Stress Conditions. Gesunde Pflanz. 2023, 75, 1799–1811. [Google Scholar] [CrossRef]
  42. Shang, B.; Tian, T.T.; Mo, Y.T.; Zhang, H.; Zhang, K.; Agathokleous, E.; Ji, Y.; Feng, Z.Z. Combined application of organic and inorganic fertilizers sustained rice yields and N accumulation and decreased soil-canopy system NH3 emission. Agric. Ecosyst. Environ. 2025, 377, 109260. [Google Scholar] [CrossRef]
  43. Xu, X.M.; Li, G.; Su, Y.; Wang, X.L. Effect of weedy rice at different densities on photosynthetic characteristics and yield of cultivated rice. Photosynthetica 2018, 56, 520–526. [Google Scholar] [CrossRef]
  44. Liang, C.; Li, Y.M.; Zhang, K.H.; Wu, Z.Z.; Liu, J.X.; Zhou, C.C.; Wang, S.; Li, F.H.; Sui, G.M. Selection and Yield Formation Characteristics of Dry Direct Seeding Rice in Northeast China. Plants 2023, 12, 3496. [Google Scholar] [CrossRef]
  45. Peng, J.F.; Feng, Y.H.; Wang, X.K.; Li, J.; Xu, G.L.; Phonenasay, S.; Luo, Q.X.; Han, Z.L.; Lu, W. Effects of nitrogen application rate on the photosynthetic pigment, leaf fluorescence characteristics, and yield of indica hybrid rice and their interrelations. Sci. Rep. 2021, 11, 7485. [Google Scholar] [CrossRef] [PubMed]
  46. Ercoli, L.; Lulli, L.; Mariotti, M.; Masoni, A.; Arduini, I. Post-anthesis dry matter and nitrogen dynamics in durum wheat as affected by nitrogen supply and soil water availability. Eur. J. Agron. 2008, 28, 138–147. [Google Scholar] [CrossRef]
  47. Li, T.Y.; Ullah, S.; Liang, H.; Ali, I.; Zhao, Q.; Iqbal, A.; Wei, S.Q.; Shah, T.; Luo, Y.Q.; Jiang, L.G. The Enhancement of Soil Fertility, Dry Matter Transport and Accumulation, Nitrogen Uptake and Yield in Rice via Green Manuring. Phyton 2021, 90, 223–243. [Google Scholar] [CrossRef]
  48. Xiao, Z.L.; Zhang, Y.; Wang, C.R.; Wen, Y.; Wang, W.L.; Zhu, K.Y.; Zhang, W.Y.; Gu, J.F.; Liu, L.J.; Zhang, J.H.; et al. Optimized controlled-release nitrogen strategy achieves high yield and nitrogen use efficiency of wheat following rice in the lower reaches of yangtze river of China. Field Crops Res. 2024, 317, 109567. [Google Scholar] [CrossRef]
  49. Cheng, F.W.; Bin, S.Y.; Iqbal, A.; He, L.J.; Wei, S.Q.; Zheng, H.; Yuan, P.; Liang, H.; Ali, I.; Xie, D.J.; et al. High Sink Capacity Improves Rice Grain Yield by Promoting Nitrogen and Dry Matter Accumulation. Agronomy 2022, 12, 1688. [Google Scholar] [CrossRef]
  50. Yang, T.R.; Zhao, J.H.; Hong, M.; Ma, M.J.; Ma, S.J.; Yuan, Y.Y. Optimizing water and nitrogen supply can regulate the dynamics of dry matter accumulation in maize, thereby promoting dry matter accumulation and increasing yield. Field Crops Res. 2025, 326, 109837. [Google Scholar] [CrossRef]
  51. Monzon, J.P.; Menza, N.C.L.; Cerrudo, A.; Canepa, M.; Edreira, J.I.R.; Specht, J.; Andrade, F.H.; Grassini, P. Critical period for seed number determination in soybean as determined by crop growth rate, duration, and dry matter accumulation. Field Crops Res. 2021, 261, 108016. [Google Scholar] [CrossRef]
  52. Yang, J.C.; Zhang, J.H. Crop management techniques to enhance harvest index in rice. J. Exp. Bot. 2010, 61, 3177–3189. [Google Scholar] [CrossRef]
  53. Li, S.B.; Zhang, Z.H.; Hu, Y.; Li, C.Y.; Jiang, X.; Mao, T.; Li, Y.S.; Zhu, Y.G. Genetic dissection of developmental behavior of crop growth rate and its relationships with yield and yield related traits in rice. Plant Sci. 2006, 170, 911–917. [Google Scholar] [CrossRef]
  54. Dou, Z.; Li, Y.Y.; Guo, H.; Chen, L.R.; Jiang, J.L.; Zhou, Y.C.; Xu, Q.; Xing, Z.P.; Gao, H.; Zhang, H.C. Effects of mechanically transplanting methods and planting densities on yield and quality of Nanjing 2728 under rice-crayfish continuous production system. Agronomy 2021, 11, 488. [Google Scholar] [CrossRef]
  55. Dan, X.Q.; He, M.Q.; Meng, L.; He, X.X.; Wang, X.G.; Chen, S.D.; Cai, Z.C.; Zhang, J.B.; Zhu, B.; Müller, C. Strong rhizosphere priming effects on N dynamics in soils with higher soil N supply capacity: The ‘Matthew effect’ in plant-soil systems. Soil Biol. Biochem. 2023, 178, 108949. [Google Scholar] [CrossRef]
  56. Makino, A.; Suzuki, Y.; Ishiyama, K. Enhancing photosynthesis and yield in rice with improved N use efficiency. Plant Sci. 2022, 325, 111475. [Google Scholar] [CrossRef] [PubMed]
  57. Wang, Z.Q.; Zhang, W.Y.; Beebout, S.S.; Zhang, H.; Liu, L.J.; Yang, J.C.; Zhang, J.H. Grain yield, water and nitrogen use efficiencies of rice as influenced by irrigation regimes and their interaction with nitrogen rates. Field Crops Res. 2016, 193, 54–69. [Google Scholar] [CrossRef]
  58. Zhang, H.; Yu, C.; Kong, X.S.; Hou, D.P.; Gu, J.F.; Liu, L.J.; Wang, Z.Q.; Yang, J.C. Progressive integrative crop managements increase grain yield, nitrogen use efficiency and irrigation water productivity in rice. Field Crops Res. 2018, 215, 1–11. [Google Scholar] [CrossRef]
  59. Li, X.Y.; Li, B.; Chen, L.; Liang, J.Y.; Huang, R.; Tang, X.Y.; Zhang, X.; Wang, C.Q. Partial substitution of chemical fertilizer with organic fertilizer over seven years increases yields and restores soil bacterial community diversity in wheat–rice rotation. Eur. J. Agron. 2022, 133, 126445. [Google Scholar] [CrossRef]
  60. Ye, L.; Zhao, X.; Bao, E.C.; Li, J.S.; Zou, Z.R.; Cao, K. Bio-organic fertilizer with reduced rates of chemical fertilization improves soil fertility and enhances tomato yield and quality. Sci. Rep. 2020, 10, 177. [Google Scholar] [CrossRef]
Figure 1. Yield and yield components under different fertilization treatments. Different letters indicate a significant difference (p < 0.05, Tukey’s test).
Agronomy 15 01576 g001
Figure 2. The leaf area index ((A,B) in 2021; (C,D) in 2022) under different fertilization treatments. Different letters indicate a significant difference (p < 0.05, Tukey’s test) within the same stage.
Agronomy 15 01576 g002
Figure 3. The chlorophyll content (SPAD value) ((A) in 2021; (B) in 2022) of flag leaves of rice under different fertilization treatments.
Agronomy 15 01576 g003
Figure 4. The net photosynthetic rate (Pn) ((A) and (B) in 2021; (C) and (D) in 2022) under different fertilization treatments. Different letters indicate a significant difference (p < 0.05, Tukey’s test) within the same stage period.
Agronomy 15 01576 g004
Figure 5. The dry matter accumulation ((A,B) in 2021; (C,D) in 2022) of rice under different fertilization treatments. Different letters indicate a significant difference (p < 0.05, Tukey’s test) within the same stage period for the same cultivar.
Agronomy 15 01576 g005
Figure 6. Crop growth rate ((AC) in 2021; (DF) in 2022) of rice under different fertilization treatments. Different letters indicate a significant difference (p < 0.05, Tukey’s test) within the same stage for both cultivars.
Agronomy 15 01576 g006
Figure 7. Net assimilation rate ((AC) in 2021; (DF) in 2022) of rice under different fertilization treatments. Different letters indicate a significant difference (p < 0.05, Tukey’s test) within the same stage for both cultivars.
Agronomy 15 01576 g007
Figure 8. N accumulation ((ac) in 2021; (df) in 2022) of rice under fertilization treatments. Different letters indicate a significant difference (p < 0.05, Tukey’s test) within the same stage for both cultivars.
Agronomy 15 01576 g008
Figure 9. N recovery efficiency of applied N in the main growth periods ((a) in 2021; (b) in 2022) under different fertilization treatments. Different letters indicate a significant difference (p < 0.05, Tukey’s test) within the same stage for both cultivars.
Agronomy 15 01576 g009
Figure 10. Pearson correlations of agronomic and physiological traits with grain yield, yield components, and nitrogen use efficiency of rice. R1, grain yield; R2, effective panicles; R3, spikelets per panicle; R4, 1000-grain weight; R5, grain filling; R6, Pn at the heading stage; R7, Pn at DAH15; R8, Pn at DAH30; R9, LAI at the jointing stage; R10, LAI at the heading stage; R11, LAI at maturity stage; R12, dry matter accumulation at the jointing stage; R13, dry matter accumulation at the heading stage; R14, dry matter accumulation at the maturity stage; R15, crop growth rate at the jointing stage; R16, crop growth rate at the heading stage; R17, crop growth rate at the maturity stage; R18, net assimilation rate at the jointing stage; R19, net assimilation rate at the heading stage; R20, net assimilation rate at the maturity stage; R21, N harvest index; R22, partial factor productivity of applied N; R23, agronomic N use efficiency; R24, N accumulation at the jointing stage; R25, N accumulation at the heading stage; R26, N accumulation at the maturity stage; R27, physiological N use efficiency at the jointing stage; R28, N recovery efficiency at the jointing stage; R29, N recovery efficiency at the heading stage; R30, N recovery efficiency at the maturity stage; R31, year; R32, cultivar; and R33, organic fertilizer replacement ratio of chemical fertilizer. Positive or negative correlations between parameters are shown by the blue and red blocks, respectively. The correlation increases with the color’s darkness.
Agronomy 15 01576 g010
Figure 11. Principal components under the different nitrogen fertilizer management strategies.
Agronomy 15 01576 g011
Table 1. Nitrogen harvest index, agronomic N use efficiency, partial factor productivity of applied N, and physiological N use efficiency under different fertilization treatments.
YearCultivar FertilizationN Harvest IndexAgronomic N Use EfficiencyPartial Factor Productivity of Applied NPhysiological N Use Efficiency
2021SD47CF0.6810 c10.2721 b60.5969 b56.154 ab
OR100.7156 b12.6912 ab63.016 ab61.4209 ab
OR200.7226 b16.2431 a66.5678 a73.4262 a
OR300.7352 b11.7806 ab62.1054 ab56.6943 ab
SD505CF0.7205 b12.3176 ab61.6984 ab46.0793 b
OR100.7341 b14.5276 ab63.9084 ab47.9076 b
OR200.7636 a14.7221 ab64.1029 ab48.1682 b
OR300.7634 a14.4544 ab63.8352 ab46.5445 b
2022SD47CF0.5985 e14.8932 b68.0725 b54.2246 abc
OR100.6262 d18.7289 ab71.9082 ab65.1464 ab
OR200.6662 c24.3131 a77.4924 a73.3086 a
OR300.6813 c17.26 ab70.4393 ab55.1050 abc
SD505CF0.7467 b12.0983 b66.6958 b36.5168 c
OR100.7690 a14.2474 b68.8450 b41.112 bc
OR200.7791 a14.6534 b69.2510 ab41.8749 bc
OR300.7840 a12.6838 b67.2814 b36.8480 c
Note: Values with a column followed by different letters were significantly different at p < 0.05 in the same year for both cultivars.
Table 2. Principal components analysis under different nitrogen fertilizer management strategies.
SD47SD505
Statistical parametersPC1PC2PC3PC1PC2PC3
Eigen value20.6764.9432.38121.1895.0961.715
% of Variance73.84417.6548.50275.67318.2016.125
Cumulative variance%73.84491.498100.00075.67393.875100.000
Factor loadingSD47 Eigen vectorsSD505 Eigen vectors
N accumulation at the maturity stage0.958−0.024−0.2870.9950.0170.095
NRE at the maturity stage0.9660.019−0.2570.9950.0170.095
Grain filling0.9050.3840.1830.990−0.116−0.080
N accumulation at the heading stage0.9310.2610.2540.984−0.0610.166
NRE at the heading stage0.9310.2610.2540.984−0.0610.166
Sink capacity0.7540.4590.4710.9800.1750.091
DMA at the heading stage0.9980.007−0.0540.9770.021−0.213
DMA at the maturity stage0.977−0.1680.1320.9620.114−0.247
Agronomic N use efficiency0.9180.3950.0240.9600.2770.044
NPFP0.9180.3950.0240.9600.2770.044
Grain yield0.9180.3950.0240.9600.2770.044
LAI at the maturity stage0.8070.175−0.5630.9550.2810.089
NAR at the heading stage0.9370.3480.0390.903−0.226−0.365
CGR at the maturity stage0.731−0.5010.4630.8960.319−0.308
Lai at jointing 0.523−0.706−0.4770.896−0.444−0.026
DMA at the jointing stage0.956−0.023−0.2920.8950.4320.113
CGR at the jointing stage0.957−0.008−0.2910.8870.4470.121
Effective panicles0.970−0.1370.1990.876−0.2830.391
N harvest index0.796−0.461−0.3920.865−0.493−0.094
NPE0.8240.5290.2010.7650.635-0.111
CGR at the heading stage0.9960.0250.0870.762−0.3650.535
LAI at the heading stage0.824−0.3330.4580.7250.676−0.132
Spikelets per panicle-0.8280.555−0.080−0.7250.575−0.380
NAR at the maturity stage0.360−0.7860.5030.715−0.105−0.691
N accumulation at the jointing stage-0.8320.5280.169−0.6940.6910.205
NRE at the jointing stage-0.8320.5280.169−0.6940.6910.205
NAR at the jointing stage0.9640.153−0.2160.3080.9210.238
1000-grain weight 0.022−0.9590.2830.682−0.7250.101
Disclaimer/Publisher’s Note: The statements, opinions and data contained in all publications are solely those of the individual author(s) and contributor(s) and not of MDPI and/or the editor(s). MDPI and/or the editor(s) disclaim responsibility for any injury to people or property resulting from any ideas, methods, instructions or products referred to in the content.

