Article

Optimizing Sulfur Fertilization for Yield and Aroma Enhancement in Fragrant Rice Under Varying Soil Sulfur Conditions

by
Sirilak Chaiboontha
1,2,
Chananath Chanauksorn
3,
Choochad Santasup
1,
Fapailin Chaiwan
1,* and
Chanakan Prom-u-thai
1,4,*
1
Department of Plant and Soil Sciences, Faculty of Agriculture, Chiang Mai University, Chiang Mai 50200, Thailand
2
Chiang Rai Rice Research Center, Rice Department, Chiang Rai 57120, Thailand
3
Surin Rice Research Center, Rice Department, Surin 32000, Thailand
4
Lanna Rice Research Center, Chiang Mai University, Chiang Mai 50200, Thailand
*
Authors to whom correspondence should be addressed.
Agronomy 2025, 15(7), 1569; https://doi.org/10.3390/agronomy15071569 (registering DOI)
Submission received: 30 May 2025 / Revised: 20 June 2025 / Accepted: 25 June 2025 / Published: 27 June 2025

Abstract

Sulfur (S) fertilizer is routinely applied together with other macronutrients by farmers across all regions to improve grain yield and quality, but its distinct effects on grain yield and aroma intensity in fragrant rice remain inadequately studied, especially when applied under varying existing soil S levels. This study aimed to determine the effects of S fertilizer application on grain yield and aroma intensity (2-Acetyl-1-Pyrroline, 2AP) in fragrant rice grown under varying soil S levels (very low, low, and medium). The premium Thai fragrant rice cultivar KDML105 was grown under field conditions during two cropping seasons in 2021 and 2022 in Surin province, northeastern Thailand. Sulfur fertilizer in the form of (NH4)2SO4 was applied at 0, 30, 60, 90, and 120 kg S ha−1 at one time with the basal fertilizers phosphorus (P) and potassium (K) under varying soil S levels, using the same protocol in both cropping seasons. Plant growth parameters were evaluated at the tillering stage, and grain samples were harvested at maturity to evaluate grain yield and aroma intensity. The results showed that applying S at rates between 60 and 90 kg ha−1 to soils with very low and low S increased grain yield from 4 to 20% compared to no S application, while no effect of S application was observed for the medium soil S level. The results were primarily attributed to the number of tillers and panicles per hill and the 1000-grain weight in both cropping seasons. Dissimilar effects of S application rates and soil S level were found for grain 2AP content. There was a higher grain 2AP content in the low and medium soil S levels compared to very low S, but the pattern varied according to the S application rate. Applying the appropriate rate of S fertilizer can significantly improve rice productivity, especially when cultivated under S-deficient soil, and higher soil S levels can promote the grain 2AP content of fragrant rice.

1. Introduction

Sulfur is an essential macronutrient for plant growth and development and is recognized as the fourth major nutrient after nitrogen (N), phosphorus (P), and potassium (K), involving not only productivity but protein quality through cystine, cysteine, and methionine, as well as some hormones and vitamins [1,2]. Besides enhancing productivity, applying S fertilizer has been found to mitigate abiotic stress and reduce heavy metal accumulation in rice plants [3,4]. Additionally, S is involved in aroma intensity in fragrant rice as a major component of methionine in 2AP compound biosynthesis, as it was found that applying S at 6.4–8.8 kg S ha−1 increased the 2AP content in grains by 0.5–0.9%, depending on rice cultivar and soil properties [5]. Although S fertilizer is routinely applied together with macronutrients such as N, P, and K by farmers across all regions to improve grain yield and quality, its distinct effects on grain yield and aroma intensity in fragrant rice remain inadequately studied. This is particularly true under practical field conditions with varying existing soil S levels in northeastern Thailand, where premium jasmine rice is cultivated for export to global markets. We hypothesize that grain yield and 2AP content vary with the S application rate and the existing soil S levels in rice fields. Therefore, this study aimed to determine the effect of S fertilizer application on grain yield and 2AP content in fragrant rice grown under different existing soil S rates. The results will be useful for rice growers in managing S fertilizer based on specific soil S levels at each cropping location to maximize productivity and thereby enhance aroma intensity in fragrant rice.

2. Materials and Methods

2.1. Field Experiment and Soil Analysis

The field experiment was conducted at three locations in Surin province, representing the main areas of fragrant rice production in northeastern Thailand. The rice crops were grown during the rainy season (July–November) over the course of two cropping seasons in 2021 and 2022. The three locations were selected based on soil S concentration and were designated as (1) very low soil S (0–9 mg kg−1), located at 14°56′47.7″ N 103°30′40.0″ E, (2), low soil S (10–19 mg kg−1), located at 14°56′56.3″ N 103°32′20.9″ E, and (3) medium soil S (20–29 mg kg−1), located at 14°53′27.6″ N 103°30′15.1″ E. The distance from location 1 to 2 is 6.5 km, that from 1 to 3 is 13.3 km, and that from 2 to 3 is 12.5 km. In April 2021, before planting and fertilization, soil samples from all three field locations were collected and analyzed for physical and chemical properties. The pH (1:1 soil/water) range was 4.5–5.7; organic matter (OM) [6] ranged from 0.8 to 3.8%; NH4+-N was determined by the incubation method [7] and ranged from 1.2 to 174.6 mg kg−1; available P was determined using the Bray-II method [8] and ranged from 4.3 to 70.8 mg kg−1. Exchangeable K was determined by flame photometry after extraction with ammonium acetate (pH 7.0) and ranged from 38.5 to 392.2 mg kg−1 (Table 1). The agrometeorological data were recorded during the rice-growing season (July–November) in Surin provinces by Agromet Station. The maximum temperature ranged from 31.2 to 33.5 °C in 2021 and from 31.6 to 33.7 °C in 2022, while the minimum temperature ranged from 20.5 to 24.1 °C in 2021 and from 21.9 to 24.8 °C in 2022. The maximum relative humidity range was 90.0–97.0% in 2021 and 93.0–96.0% in 2022. The minimum relative humidity ranged from 57.0 to 72.0% in 2021 and from 54.0 to 70.0% in 2022, while the rainfall ranged from 16.8 to 262.3 mm in 2021 and from 44.3 to 643.4 mm in 2022.
The experiment was carried out in a randomized complete block design (RCBD) with two factors and four replications. The first factor consisted of five S fertilizer application rates at 0 (control), 30, 60, 90, and 120 kg S ha−1 in the form of (NH4)2SO4. The S fertilizer rates were applied one time as the basal fertilizer, along with 57 kg P ha and 57 kg K ha−1. Each treatment plot covered an area of 15 m2, with a total plot area of 300 m2 for each soil S level at each location. Ridges of 0.5 m in both width and height were constructed to separate the S application rate treatments at each soil S level site. To prevent cross-contamination, water outlets were constructed in each plot to ensure that drained water would not enter the inlets of neighboring plots. The popular premium Thai fragrant rice cultivar KDML105 was used in this experiment by preparing germinated seeds in a seedbed to obtain 30-day-old seedlings. The seeds were germinated on the same day in each cropping season, on 1–2 July in 2021 and 3–4 July in 2022. The seedlings were transplanted into the fields with three seedlings per hill, 25 × 25 cm spacing between hills, on the 30–31 July in 2021 and 2–3 August in 2022. Each treatment plot was surrounded by two guard rows to minimize the impact of unexpected effects. Plants from all treatments were 75% flowered at the same time, on 25–26 October in both cropping seasons in 2021 and 2022. Nitrogen in the form of urea was applied at 138 kg N ha−1 (together with NH4+-N) as recommended by the Rice Department of Thailand by splitting application into two. The first split (50%) took place at the beginning of the experiment, on 6–7 August in 2021 and 9–10 August in 2022. The second split (50%) was applied at the panicle initiation stage, on 22–23 September in 2021 and 25 September in 2022. A similar protocol was carried out in the two cropping seasons in 2021 and 2022.

2.2. Data Collection and Chemical Analysis

The growth of rice plants was evaluated during plant development by measuring plant height, the number of tillers, and the number of panicles per hill at the maximum tillering and maturity stages. At maturity (30 days after flowering), an area of 8 m2 of plants was manually harvested by hand from the center of each treatment plot, avoiding the guard rows. Grain yield was sun-dried and evaluated at 14% moisture content. The 10 panicles from each treatment were subsampled and evaluated for the number of tillers per hill, no. of panicles per hill, percentage of filled grain, and 1000-grain weight.
The leaf and grain samples were subsampled for S concentration analysis by washing gently to avoid contamination and were separately packed in paper bags before being oven-dried at 75 °C for 3 days to a constant weight. The samples were ground and analyzed for total S concentration using the combustion method [9]. The grain 2AP content was evaluated based on the fresh extract of uncooked brown rice (husk removed) via capillary gas chromatography–mass spectrometry (GC-MS) [10]. The fused silica capillary columns were used and the temperature was increased from 45 to 200 °C. The GC injector was in a split mode with a 1:10 split ratio at 200 °C. The effluent from the capillary column went directly into the mass spectrometer.

2.3. Data Analysis

Statistical analyses were performed using R software (version 4.2.0). Analysis of variance (ANOVA) was conducted to determine the significance effect of S application rate, soil S level, and their interaction on all measured traits in each cropping season. The least significant difference (LSD) test, at the 0.05 significance level, was used for mean comparisons among treatments. Additionally, Pearson correlation analysis was carried out to evaluate the relationships among the measured parameters.

3. Results

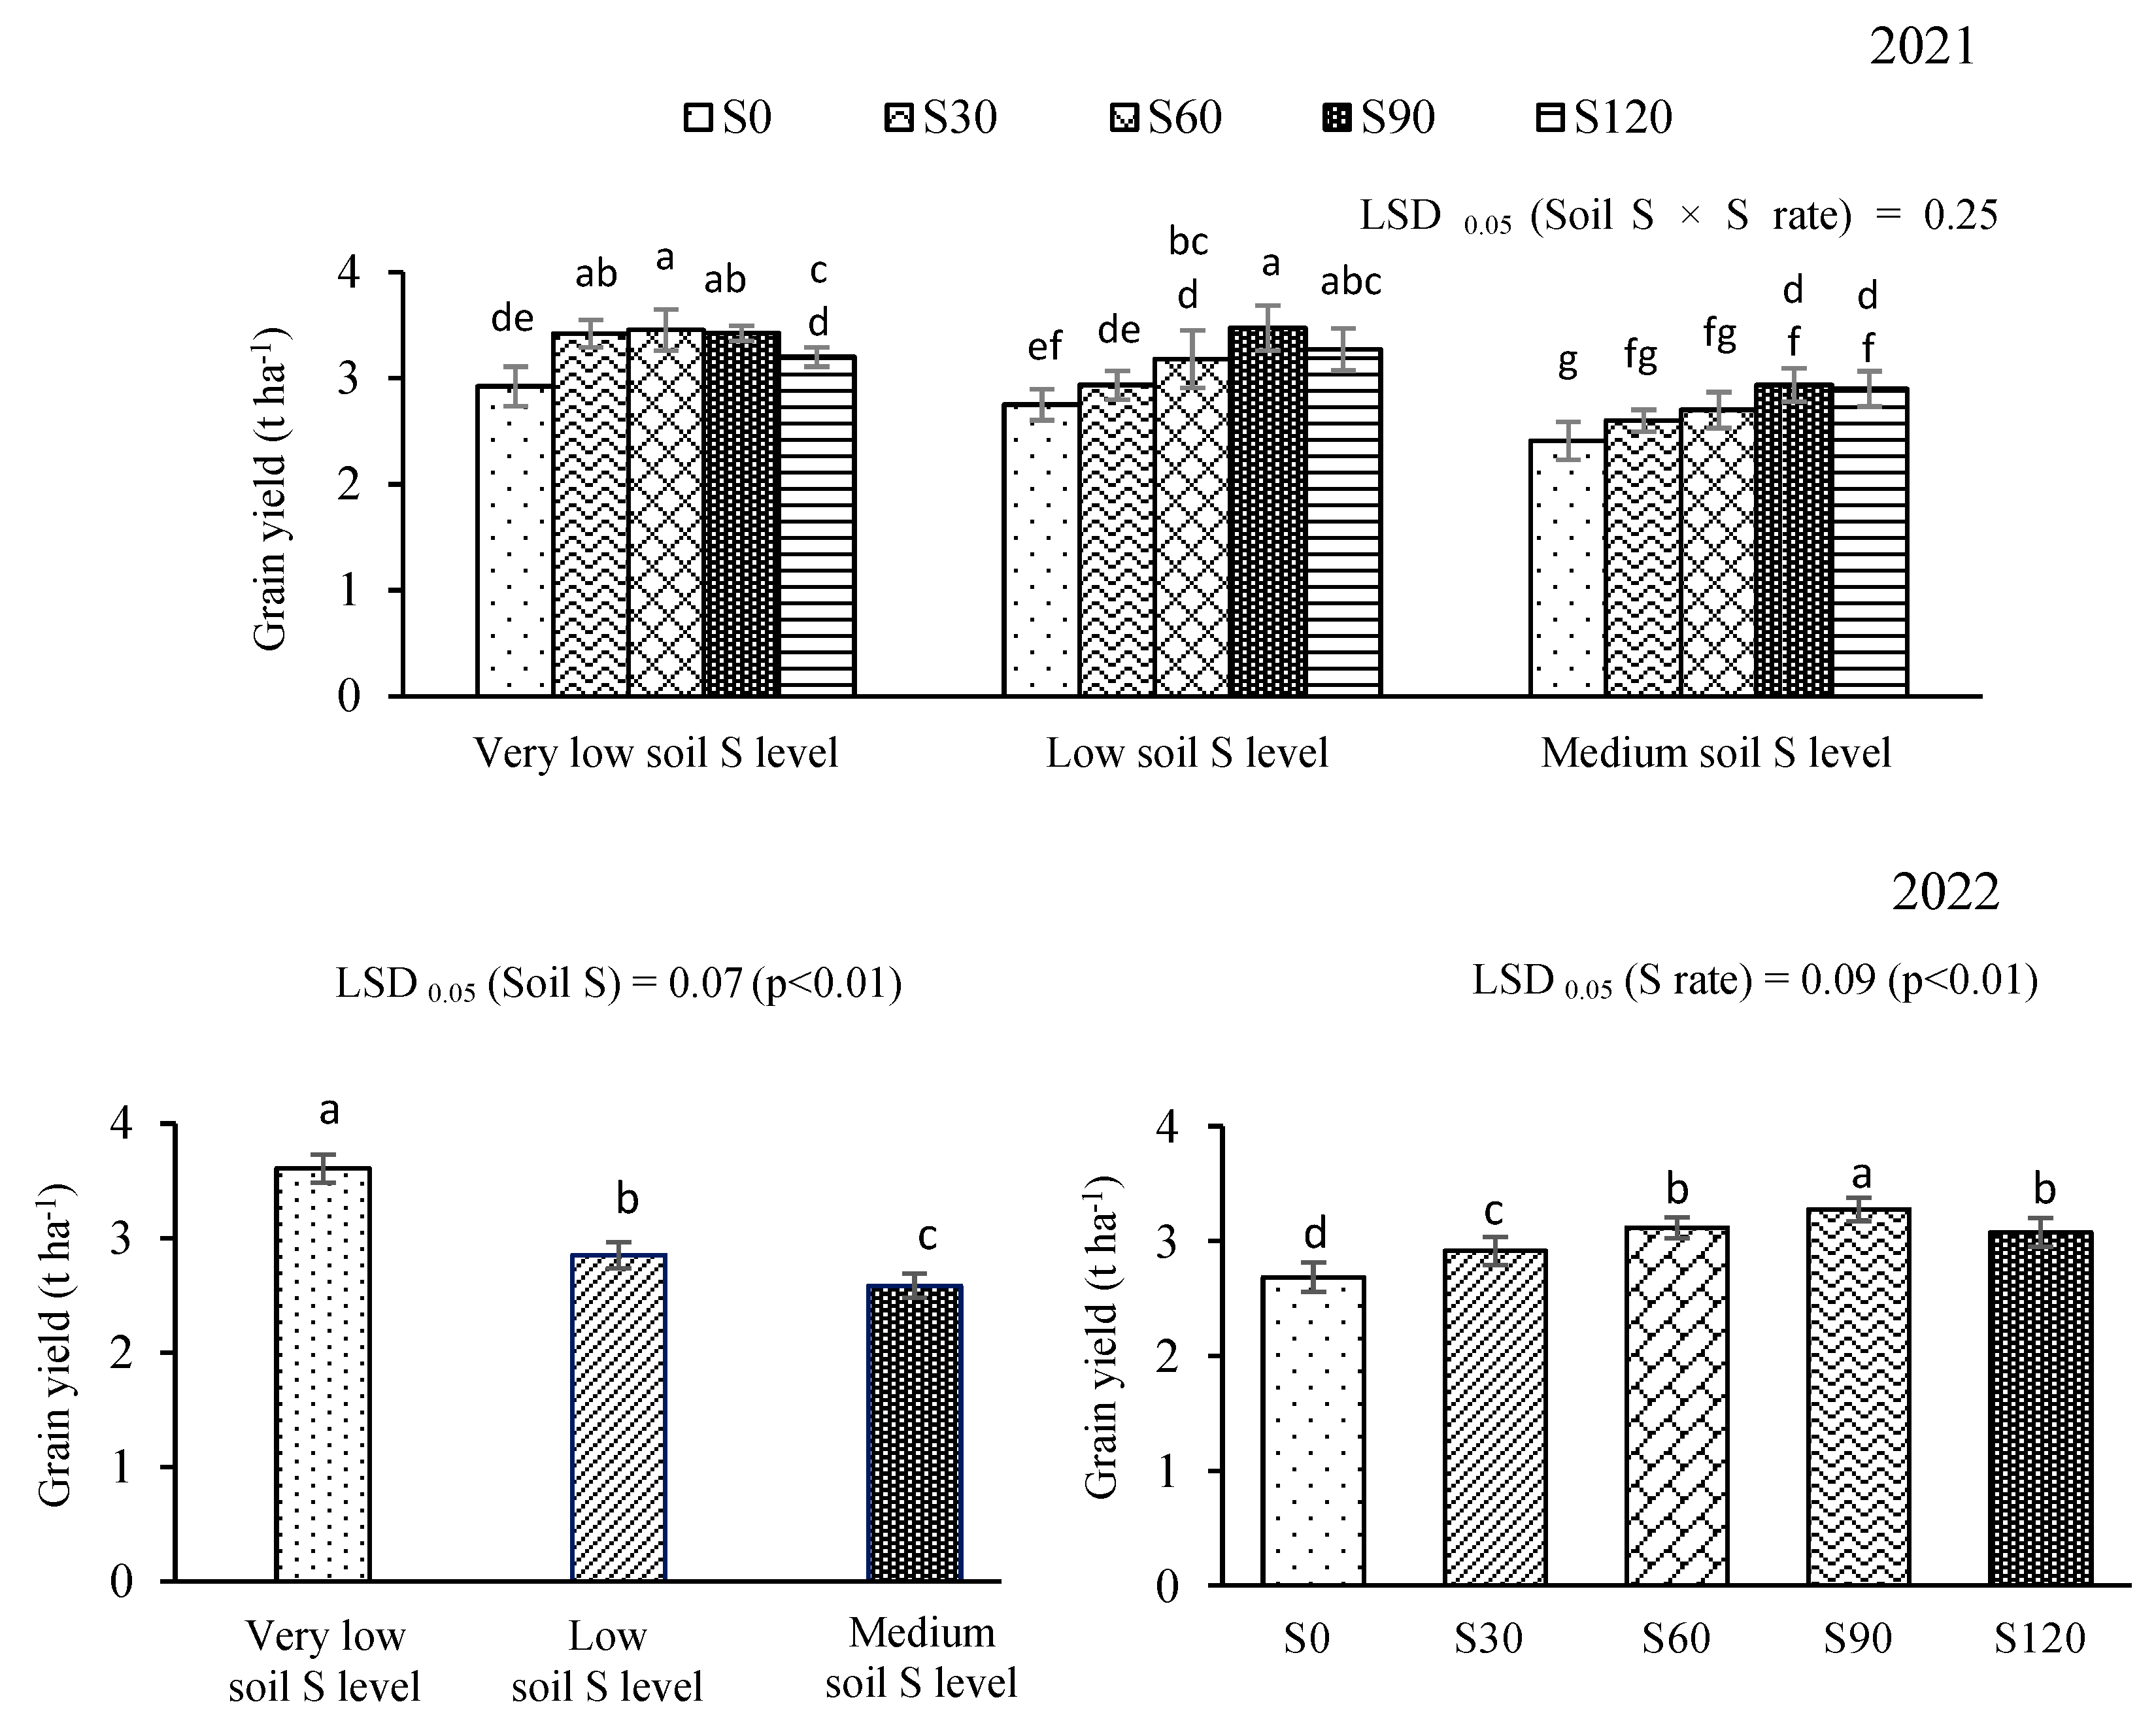
3.1. Grain Yield and Yield Component

Grain yield varied significantly among the soil S levels with varying S application rates (Figure 1). In 2021, there was an interaction effect between soil S level and S application rate. Grain yield in the control treatments (0 kg S ha−1) was the lowest among all soil S levels, ranging from 2.4 to 2.8 t ha−1, but was increased by applying S fertilizer. The highest grain yield in response to S fertilizer in soil with very low S levels was 30–90 kg S ha−1, with an average grain yield of 3.4 t ha−1, and in soil with a low S level, it was 90–120 kg S ha−1, with a similar average grain yield of 3.4 t ha−1. The medium soil S level had a lesser response to S application. In 2022, there was no interaction effect between soil S level and S application rate, while grain yield varied significantly with soil S level and the rate of S application (Figure 1). The highest grain yields recorded in the very-low-, low-, and medium-S soils were 3.6, 2.9, and 2.6 t ha−1, respectively. The highest grain yield was 3.3 t ha−1 with S applied at 90 kg S ha−1, followed by 3.1 t ha−1 with 60 and 120 kg S ha−1, 2.9 t ha−1 with 30 kg S ha−1, and 2.7 t ha−1 for the control with no S application.
The yield components in 2021 were affected by soil S level and S application rate (Table 2a). The number of tillers per hill was affected by an interaction between soil S level and S application rate. The highest number of tillers was produced by S application of 60–120 kg S ha−1 to low-S soil, with an average of 16.6 tillers hill−1. Medium-S soil yielded the lowest tiller number at all S application rates. There were similar responses for the number of panicles per hill. In contrast, there were no effects of soil S level or S application rate on the percentage of filled grains, but the soil S level affected 1000-grain weight, without a significant effect of S application. The highest 1000-grain weight (29 g) was observed in low-S soil, and very-low- and medium-S soil had equal 1000-grain weights (27 g). In 2022, there was no interaction effect between different soil S levels and S application rates on tiller or panicle numbers per plant or 1000-grain weight, but there was an interaction between the two factors in the percentage of filled grains (Table 2b). The number of tillers varied significantly among soil S levels, the highest number being in soil with very low S at 11.7 tillers hill−1, followed by soils with low and medium S levels, which had similar averages of 8.2 tillers hill−1, while S application did not affect the number of tillers. The number of panicles varied significantly among soil S levels and S application rates. The highest number of panicles was recorded in soils with very low S levels, at 8.9 panicles hill−1, compared with the low and medium soil S levels, which had equal averages of 6.2 panicles hill−1. In contrast, applying S at 90 and 120 kg ha−1 produced the highest panicle number, at an average of 7.6 panicles hill−1, followed by S application rates of 60, 30, and 0 kg ha−1. For the percentage of filled grains, the highest percentages were quite random; applying the highest S rate of 120 kg ha−1 yielded the highest percentage of filled grains in all soil S levels, but the effect was not the same for the other soil S levels. For 1000-grain weight, the very low soil S level produced the highest 1000-grain weight (29.2 g), while the low and medium soil S levels had similar 1000-grain weights of 26.3 g.

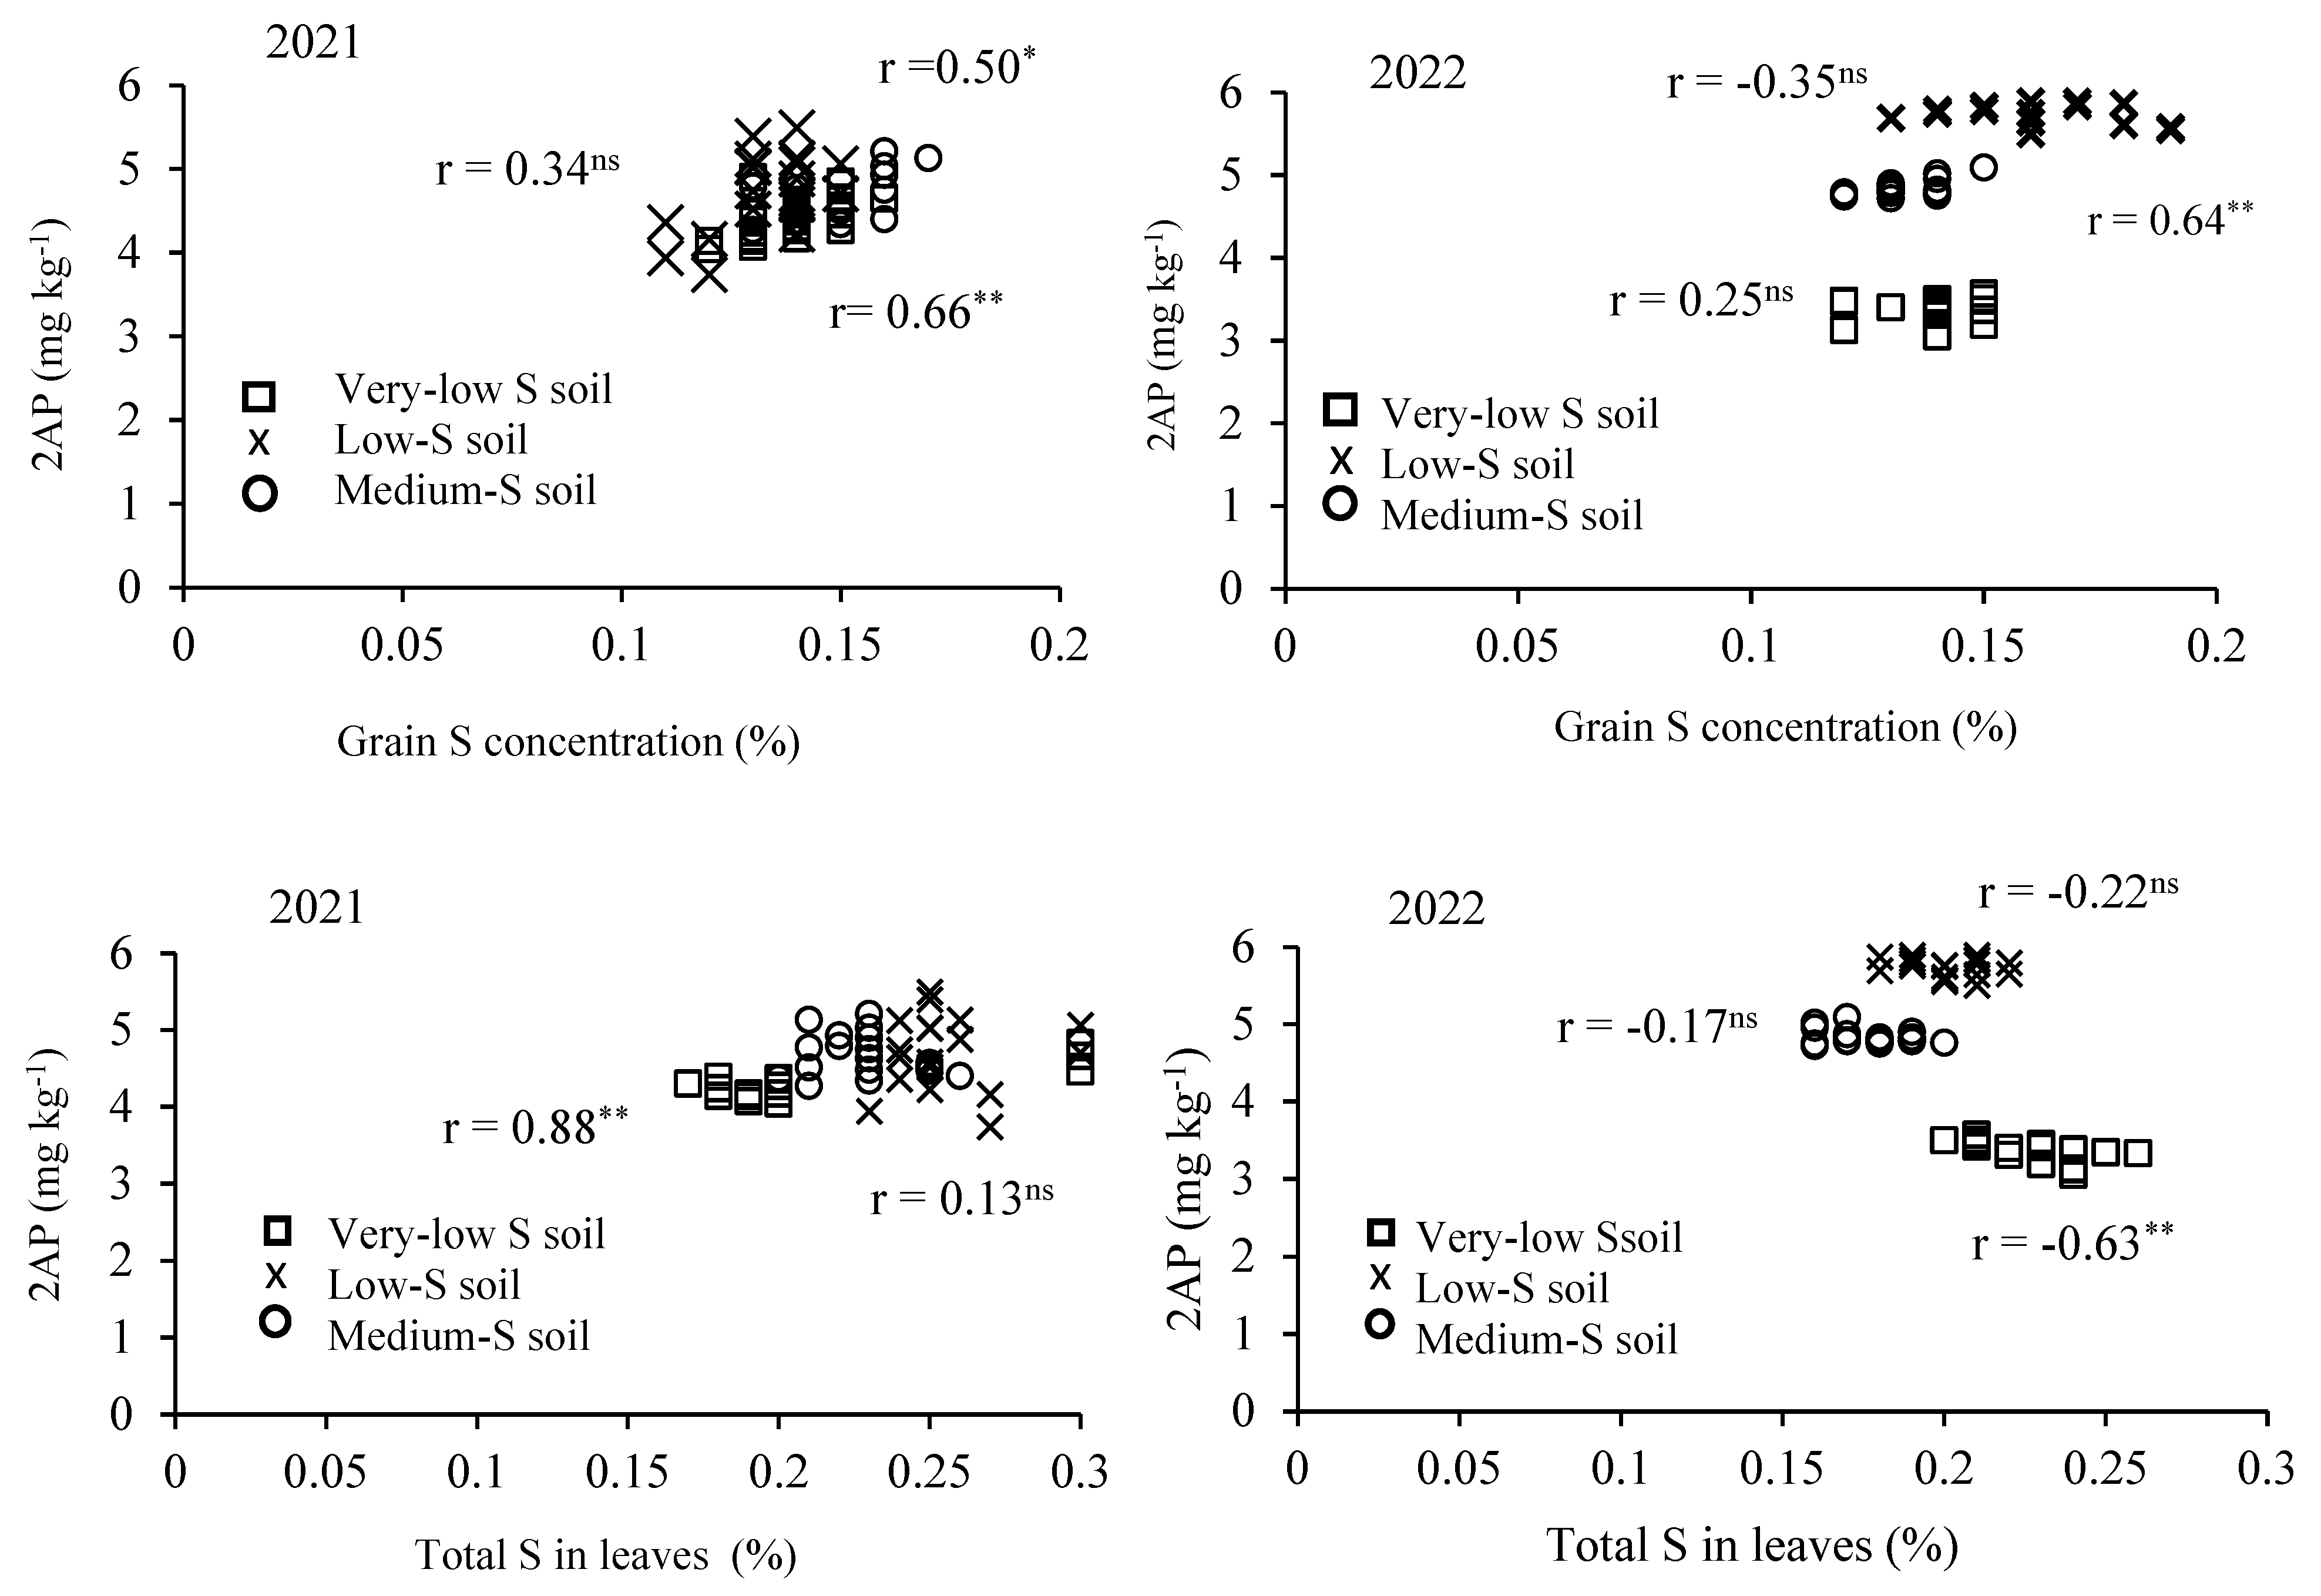
3.2. Grain 2AP and S Concentration

The 2AP content varied significantly among soil S levels with varying S application rates in 2021 and 2022 (Figure 2). In 2021, there was an interaction effect between different soil S levels and S application rates. The control with no S application in all soil S levels had the lowest grain 2AP content, ranging from 3.1 to 5.7 mg kg−1, and was slightly increased by S application. The highest 2AP content (5.3 mg kg−1) was obtained under the application of 120 kg S ha−1 in low-S soil, which was not different from the 90 kg S ha−1 (5.1 mg kg−1) in medium-S soil. In 2022, there was an interaction effect between soil S level and S application rate on the 2AP content (Figure 2). The highest 2AP content was recorded in low-S soil when applying 0, 30, and 120 kg S ha−1, with similar average grain 2AP contents of 5.8 mg kg−1, while 2AP slightly declined when S was applied at 60 and 90 kg S ha−1. Nevertheless, the grain 2AP content was still higher than under all applications of S in very-low- and medium-S soils, especially in very-low-S soil, which had a lower 2AP content than medium-S soil, but the level varied according to the rate of S application.
For grain S concentration, the data for 2021 showed that soil S level and S application rates affected grain S concentration, but there were no significant interaction effects between the two factors (Table 3). The highest grain S concentration occurred in the medium-S soil, at 0.147%, followed by the grain S concentration in the very-low- and low-S soils, which had similar average grain S concentrations of 0.136%, while applying S at 60–120 kg S ha−1 resulted in the highest grain S concentration (0.145%), compared to S application at 0 and 30 kg S ha−1, which had the lowest grain S concentrations of 0.126% and 0.136%, respectively. In 2022, there was a significant interaction between soil S levels and S application rates on the grain S concentration (Table 3). The highest grain S concentration was 60 kg S ha−1 under low-S soil (0.193%), while the effect was not consistent among S application rates or soil S levels.
An interaction effect between soil S level and S application rate was observed in leaf S concentration in 2021 and 2022 (Table 3). In general, leaf S concentration increased with S application for all soil S levels. The highest leaf S concentration was recorded when applying 90 kg S ha−1 (0.360%), followed by 120 kg S ha−1 (0.303%) in soil with very low S and 90 kg S ha−1 (0.303%) mg kg−1 in soil with low S, while the lowest S concentration in leaves occurred under 30 kg S ha−1 (0.177%) in soil with very low S. In 2022, similar results were observed for the leaf S concentration; the highest value was associated with 120 kg S ha−1 (0.250%) in soil with a very low S level, while the lowest grain S concentration was recorded in the control (0 kg S ha−1) treatment (0.163%) in soil with a medium S level.

3.3. Correlation Analysis

In 2021, grain yield was significantly correlated with 1000-grain weight in very-low-S soil and with the numbers of tillers and panicles per hill and 1000-grain weight, but not with yield components in the medium-S soil. In 2022, grain yield was only correlated with the number of panicles per plant in the medium-S soil (Table 4). In 2021, grain yield was correlated with grain 2AP content and with the grain and leaf S concentration in the low-S and medium-S soils; grain yield was correlated with the grain 2AP content, but not with the other parameters. In 2022, grain yield was correlated with the grain 2AP content in very-low-S soil, with grain and leaf S concentration in low-S soil, and with leaf S concentration in medium-S soil (Table 4).
On the other hand, in 2021, grain 2AP content was significantly correlated with grain S concentration in very low (r = 0.66 **) and low soil S levels (r = 0.50 *), but such a relationship was not found in medium-S soil (r = 0.34ns). In 2022, a relationship was observed between grain 2AP content and grain S concentration in soil with medium S level (r = 0.64 **), but not in soil with very low (r = 0.25ns) and low (r = −0.35ns) S levels (Figure 3). In contrast, grain 2AP content was correlated with leaf S concentration in very-low-S soil in both 2021 and 2022 (Figure 3).

4. Discussion

Grain yield was increased by applying S up to 90 kg S ha−1 and gradually declined when the application reached 120 kg S ha−1 in both cropping years, particularly in soils with very low and low S levels compared to soils with medium S levels. Thus, the grain yield of rice is highly responsive to S application under S-deficient soil, as indicated by the results for very low and low soil S levels in a recent study demonstrating that S was the limiting factor for plant growth and productivity [3,11]. The soil S levels were categorized into very low (0–9 mg kg−1), low (10–19 mg kg−1) and medium (20–29 mg kg−1) soil S levels [12], and the critical level of soil S was identified as 9.0 mg kg−1 using 0.01M Ca(H2PO4)2 [13]. Applying S fertilizer improved the grain yield of rice crop cultivated under soil S deficiency by increasing the numbers of tillers and panicles per hill through uptake, assimilation, and metabolism of S during plant growth [1,4]. Sulfur plays critical roles in the catalytic or electrochemical functions of the biomolecules in cells, and cysteine (Cys) is the first organic compound synthesized in the SO42− assimilatory pathway and is a precursor of metabolites such as methionine, S-adenosylmethionine (SAM), S-methyl methionine, iron–S clusters, hormones, vitamins, and enzyme cofactors [14,15]. External SO42− conditions directly influence SO42− uptake within the plant, especially under soil S deficiency [16,17]. Conversely, an excessive application of S can cause sulfide toxicity and damage the rice plant, resulting in reduced grain yield and quality, as observed in the present study. On the other hand, the differing effects of S fertilizer application rates at varying soil S levels between the two cropping seasons may be attributed to variations in rainfall, which ranged from 16.8 to 262.3 mm in 2021 and from 44.6 to 643.4 mm in 2022. Overall, plant growth parameters such as the number of tillers per hill and the number of panicles per hill were higher in 2021 than in 2022, although a predominant effect on grain yield was not observed between the seasons. These findings suggest that the responses of plant growth and productivity to S fertilizer application rates under different soil S levels should be considered in relation to rainfall regimes across cropping seasons.
The present study also demonstrated that applying S affected grain 2AP content differently among the variations in soil S levels. In 2021, grain 2AP increased with increasing S application rates in all soils regardless of the S level, but growing rice plants under low and medium levels of S in the soil yielded higher grain 2AP content compared to very low soil S, with little effect of the rate of S application. Existing soil S may have promoted tissue S concentration and influenced grain 2AP synthesis, as suggested by the positive correlation between grain and leaf S concentrations and grain 2AP content, particularly under low and medium soil S levels. A previous study reported that grain 2AP content in rice increased with increasing S levels from 0.507% to 0.959% when applying S from 6.4 to 8.8 kg S ha−1 [2]. Although soil properties may have a significant impact on grain 2AP content, no clear conclusions have been drawn regarding the soil conditions for the maximum grain 2AP accumulation. In addition to plant growth parameters and yield, as mentioned above, variation in rainfall between cropping seasons may also influence the response of aroma intensity to S fertilizer application rates and soil S levels in this study. Thus, the appropriate rate of S fertilizer should be carefully applied when rice crops are cultivated under different existing soil S level and soil properties, as well as with variations in rainfall, for the maximum yield and aroma intensity of fragrant rice.
The present results provide useful information for the development of rice production and should help rice growers increase production in both grain yield and 2AP content. However, there is limited information regarding the effects of varying S application rates across a wide range of soil S levels and properties on yield and aroma intensity in different fragrant rice varieties. The results of this study should be further confirmed by identifying the effect of S application at a wider range of soil S levels, soil properties, and fragrant rice varieties.

5. Conclusions

Applying the appropriate rate of S fertilizer can significantly improve rice productivity, especially when cultivated under S-deficient soil, and that higher soil S levels would promote the grain 2AP content of fragrant rice. The optimal application rate of S fertilizer, between 60 and 90 kg ha−1, enhanced grain yield by 12.0–18.0% and 15.0–16.5% under very low and low soil S levels, respectively, but for the medium soil S level, applying S fertilizer had little effect on grain yield. On the other hand, the effects of S application rates and soil S levels on grain 2AP content were not the same as those on grain yield. The application of S fertilizer increased grain 2AP content by up to 40% compared to no S application. Higher 2AP levels were observed in soils with low and medium S levels compared to very low S, although the pattern varied depending on the S application rate. However, it is important to assess the existing soil S concentration and other soil properties through soil analysis before applying S fertilizer in fragrant rice production in order to optimize grain yield and 2AP content. Additionally, other environmental factors affecting grain yield and aroma intensity should be further investigated in future studies.

Author Contributions

Conceptualization, C.S., F.C. and C.P.-u.-t.; methodology, S.C., C.C. and C.S.; formal analysis, S.C.; investigation, S.C. and C.C.; resources, C.C.; writing—original draft, S.C.; writing—review and editing, C.P.-u.-t.; visualization, C.S., F.C. and C.P.-u.-t.; supervision, C.S., F.C. and C.P.-u.-t.; funding acquisition, S.C. All authors have read and agreed to the published version of the manuscript.

Funding

This research was financially supported by the Agricultural Research Development agency (ARDA) and the Lanna Rice Research and Innovation Center, Chiang Mai University, Thailand.

Data Availability Statement

Data are available on request.

Acknowledgments

The authors would like to acknowledge Duangjai Suriyaarunroj for advice and guidance throughout this research and Dale Taneyhill for English editing throughout the manuscript.

Conflicts of Interest

The authors declare no conflicts of interest.

References

  1. Lu, Z.; Zhang, S.; Li, G.; Ge, Y.; Haim, P.G.; Mey-Tal, S.; Magen, H.; Huang, C. Sulfur fertilization contributes to China’s food security: A meta-analysis. Eur. J. Agron. 2025, 164, 127510. [Google Scholar] [CrossRef]
  2. Zenda, T.; Liu, S.; Dong, A.; Duan, H. Revisiting sulphur-the once neglected nutrient: It’s roles in plant growth, metabolism, stress tolerance and crop production. Agriculture 2021, 11, 626. [Google Scholar] [CrossRef]
  3. He, Q.; He, C.; Hou, W.; Mou, H.; Chen, W.; Zhou, X. Quantitative study on reducing arsenic concentration in rice by sulfur fertilizer based on meta-analysis. Environ. Monit. Assess. 2025, 197, 531. [Google Scholar] [CrossRef] [PubMed]
  4. Zhao, J.; Deng, H.; Song, Z.; Wu, S.; Liang, B.; Luo, J.; Xiao, T. Excess supply of sulfur mitigates thallium toxicity to rice (Oryza sativa L.) growth in hydroponic experiment. Sci. Total Environ. 2024, 954, 176216. [Google Scholar] [CrossRef] [PubMed]
  5. Renuka, N.; Barvkar, V.T.; Ansari, Z.; Zhao, C.; Wang, C.; Zhang, Y.; Nadaf, A.B. Co-functioning of 2AP precursor amino acids enhances 2-acetyl-1-pyrroline under salt stress in aromatic rice (Oryza sativa L.) cultivars. Sci. Rep. 2022, 12, 3911. [Google Scholar] [CrossRef] [PubMed]
  6. Walkley, A.; Black, I.A. An examination of Degtjareff method for determining soil organic matter and a proposed modification of the chromic acid titration method. Soil Sci. 1934, 37, 29–37. [Google Scholar] [CrossRef]
  7. Sahrawat, K.L. Short-term incubation method for mineralizable nitrogen. Arid. Land Res. Manag. 1998, 12, 291–295. [Google Scholar] [CrossRef]
  8. Bray, R.H.; Kurtz, L.T. Determination of total organic and available forms of phosphorus in soils. J. Soil Sci. 1945, 59, 39–45. [Google Scholar] [CrossRef]
  9. Analytik Jena, A.G. Multi EA 4000 Elementary Analyzer C, S and Cl Solids Analysis: TS Analysis. Documentation Number: 11–889.729 Version 01.16. 2016. Available online: http://www.analytik-jena.com (accessed on 15 August 2023).
  10. Mahatheeranont, S.; Keawsa-Ard, S.; Dumri, K. Quantification of the rice aroma compound, 2-acetyl-1-pyrroline, in uncooked Khao Dawk Mali 105 brown rice. J. Agri. Food Chem. 2001, 49, 773–779. [Google Scholar] [CrossRef] [PubMed]
  11. Miao, F.; Zhang, X.; Fu, Q.; Hu, H.; Islam, S.; Fang, L.; Zhu, J. Sulfur enhances iron plaque formation and stress resistance to reduce the transfer of Cd and As in the soil-rice system. Sci. Total Environ. 2004, 927, 171689. [Google Scholar] [CrossRef] [PubMed]
  12. Clark, J.; Gerwing, J.; Gelderman, R. Fertilizer Recommendations Guide. 2024. Available online: https://www.nrcs.usda.gov/sites/default/files/2023-06/EC750_2023.pdf (accessed on 17 December 2024).
  13. Shah, S.H.; Islam, S.; Mohammad, F. Sulphur as a dynamic mineral element for plants: A review. J. Soil Sci. Plant Nutri. 2022, 22, 2118–2143. [Google Scholar] [CrossRef]
  14. Aula, L.; Dhillon, J.S.; Omara, P.; Wehmeyer, G.B.; Freeman, K.W.; Raun, W.R. World Sulfur Use Efficiency for Cereal Crops. Agron. J. 2019, 111, 2485–2492. [Google Scholar] [CrossRef]
  15. Diakite, S.; Saquee, F.S.; Kavhiza, N.J.; Pakina, E.N.; Norman, P.E.; Chudinova, E.M.; Tsindeliani, A.A.; Pototskaya, I.V. Plant growth and development responses to sulfur nutrition and disease attack under climate change: Role of sulfur and management strategies for wheat and barley. Pedosphere 2024, in press. [Google Scholar] [CrossRef]
  16. Murad, M.A.; Razi, K.; Benjamin, L.K.; Lee, J.H.; Kim, T.H.; Muneer, S. Ethylene regulates sulfur acquisition by regulating the expression of sulfate transporter genes in oilseed rape. Physiol. Plant. 2021, 171, 533–545. [Google Scholar] [CrossRef] [PubMed]
  17. Singh, A.; Khare, K.N.; Gupta, P. Sulfur and phosphorus transporters in plants: Integrating mechanisms for optimized nutrient supply. Plant Physiol. Biochem. 2025, 224, 109918. [Google Scholar] [CrossRef] [PubMed]
Figure 1. Effects of sulfur application on grain yield of KDML105 rice grown under different soil S application rates at different locations with varying degrees of S in Surin province in 2021 and 2022. Different lowercase letters above the bars indicate least significant difference (LSD) at p < 0.05.
Agronomy 15 01569 g001
Figure 2. Effects of sulfur application on 2AP content of KDML105 rice grown under different soil S application rates at different locations with varying degrees of S in Surin province in 2021 and 2022. Different lowercase letters above the bars indicate least significant difference (LSD) at p < 0.05.
Agronomy 15 01569 g002
Figure 3. Correlations between grain 2AP content and grain S concentration and between grain 2AP content and leaf S concentration in KDML105 rice variety grown under different soil S application rates at different locations with varying degrees of S in Surin province in 2021 and 2022. r = correlation coefficient; * = significant (p < 0.05); ** = highly significant (p < 0.01); ns = not significant.
Agronomy 15 01569 g003
Table 1. Soil physical and chemical properties in the three locations in Surin province with varying soil S levels where fragrant rice variety KDML105 was grown in 2021 and 2022.
LocationS LevelpHOMNH4+-NAvailableExchangeableSoil Texture
PSK
(%)(mg kg−1)(mg kg−1)(mg kg−1)
2021
1Very low4.91.36.610.11.457.6Sandy Loam
2Low4.71.210.218.010.638.5Sandy Loam
3Medium5.71.625.24.321.145.3Sandy Loam
2022
1Very low4.40.922.32.99.014.5Sandy Loam
2Low4.71.340.88.811.720.1Sandy Loam
3Medium5.41.035.02.827.123.5Sandy Loam
Table 2. (a) Effects of sulfur application rate on the growth and yield components of KDML105 rice variety grown under different soil application S rates at different locations with varying degrees of S in Surin province in 2021. (b) Effects of sulfur application rate on the growth and yield components of KDML105 rice variety grown under different soil application S rates at different locations with varying degrees of S in Surin province in 2022.
Parameter/Soil S LevelSulfur Application Rate (kg ha−1)Mean
0306090120
(a)
No. of tillers hill−1
  Very low S14.2 cd14.6 bc13.5 cd14.5 c13.5 cd14.0
  Low S13.1 cd12.9 d16.4 a17.3 a16.1 ab15.2
  Medium S6.6 e7.6 e7.4 e7.3 e6.8 e7.1
Mean11.311.712.413.012.1
F-testSoil S **S rate **Soil S × S rate **
LSD0.05 (Soil S)0.72
LSD0.05 (S rate)0.93
LSD0.05 (Soil S × S rate)1.61
No. of panicles hill−1
  Very low S9.8 bc10.5 ab9.5 bcd9.8 bc10 bc9.9
  Low S8.5 d9.0 cd10 bc10.5 ab11.3 a9.4
  Medium S6.6 e6.6 e6.2 e6.1 e6.4 e6.4
Mean8.28.78.58.89.2
F-testSoil S **S rate nsSoil S × S rate **
LSD0.05 (Soil S)0.53
LSD0.05 (S rate)-
LSD0.05 (Soil S × S rate)1.19
Filled grain (%)
  Very low S90.289.291.089.690.090.0 a
  Low S89.590.591.391.190.790.6 a
  Medium S91.992.291.690.591.091.4 a
Mean90.5 A90.6 A91.3 A90.4 A90.5 A
F-testSoil S nsS rate nsSoil S × S rate ns
LSD0.05 (Soil S)-
LSD0.05 (S rate)-
LSD0.05 (Soil S × S rate)-
1000-grain weight (g)
  Very low S27.727.928.428.127.627.9 b
  Low S29.028.828.829.528.829.0 a
  Medium S27.928.127.427.827.327.7 b
Mean28.2 A28.3 A28.2 A28.5 A27.9 A
F-testSoil S **S rate nsSoil S × S rate ns
LSD0.05 (Soil S)0.48
LSD0.05 (S rate)-
LSD0.05 (Soil S × S rate)-
(b)
No. of tillers hill−1
  Very low S10.711.610.712.413.311.7 a
  Low S7.17.77.47.19.87.8 b
  Medium S8.08.18.49.48.68.5 b
Mean8.6 B9.1 AB8.8 B9.6 AB10.6 A
F-testSoil S **S rate nsSoil S × S rate ns
LSD0.05 (Soil S)1.20
LSD0.05 (S rate)-
LSD0.05 (Soil S × S rate)-
No. of panicles hill−1
  Very low S8.48.48.29.89.58.9 a
  Low S5.75.96.26.06.36.0 b
  Medium S5.66.26.67.06.66.4 b
Mean6.6 C6.9 B7.0 BC7.6 A7.5 AB
F-testSoil S **S rate **Soil S × S rate ns
LSD0.05 (Soil S)0.43
LSD0.05 (S rate)0.56
LSD0.05 (Soil S × S rate)-
Filled grain (%)
  Very low S92.8 ab90.9 bcd91.7 ab93.1 a92.1 ab92.1
  Low S92.1 ab87.1 f91.3 abc88.8 def92.4 ab90.3
  Medium S89.3 cde92.9 ab88.0 ef89.3 cde93.2 a90.5
Mean91.490.390.390.492.6
F-testSoil S **S rate **Soil S × S rate **
LSD0.05 (Soil S)0.95
LSD0.05 (S rate)1.23
LSD0.05 (Soil S × S rate)2.13
1000-grain weight (g)
  Very low S29.329.329.129.129.129.2 a
  Low S26.626.726.726.626.626.7 b
  Medium S26.226.326.526.526.126.3 b
Mean27.3 A27.4 A27.4 A27.4 A27.3 A
F-testSoil S **S rate nsSoil S × S rate ns
LSD0.05 (Soil S)0.38
LSD0.05 (S rate)-
LSD0.05 (Soil S × S rate)-
Soil S = soil sulfur level; S rate = sulfur fertilizer rate; Soil S × S rate = interaction effects between soil sulfur level and sulfur fertilizer rate; ** = highly significant (p < 0.01); ns = not-significant (p > 0.05). Means in the same row followed by different letters indicate significant differences at p < 0.05.
Table 3. Effects of sulfur application rates on grain S and leaf S concentration of KDML105 rice grown under different soil application S rates at different locations with varying degrees of S in Surin province in 2021 and 2022.
Parameter/Soil S LevelSulfur Application Rate (kg ha−1)Mean
0306090120
Grain S concentration (%)
2021
  Very low S0.1270.1300.1430.1470.1470.139 b
  Low S0.1130.1330.1370.1470.1370.133 b
  Medium S0.1370.1430.1530.1630.1400.147 a
Mean0.126 D0.136 C0.144 AB0.152 A0.141 BC
F-testSoil S **S rate **Soil S × S rate ns
LSD0.05 (Soil S)0.006
LSD0.05 (S rate)0.008
LSD0.05 (Soil S × S rate)-
2022
  Very low S0.137 cd0.140 cde0.137 de0.130 e0.143 cde0.137
  Low S0.137 de0.170 b0.193 a0.157 bc0.15 cd0.161
  Medium S0.127 e0.143 cde0.130 e0.130 e0.127 e0.131
Mean0.1330.1510.1530.1390.140
F-testSoil S **S rate **Soil S × S rate **
LSD0.05 (Soil S)0.007
LSD0.05 (S rate)0.009
LSD0.05 (Soil S × S rate)0.017
Leave S concentration (%)
2021
  Very low S0.193 gh0.177 h0.200 fg0.360 a0.303 b0.247
  Low S0.247 cd0.243 cd0.253 c0.303 b0.253 c0.260
  Medium S0.220 e0.230 de0.247 cd0.220 e0.213 ef0.226
Mean0.2200.2170.2330.2940.257
F-testSoil S **S rate **Soil S × S rate **
LSD0.05 (Soil S)0.008
LSD0.05 (S rate)0.011
LSD0.05 (Soil S × S rate)0.018
2022
  Very low S0.237 b0.210 cd0.230 b0.210 cd0.250 a0.227
  Low S0.190 ef0.187 fg0.200 de0.213 c0.213 c0.201
  Medium S0.163 i0.170 hi0.180 fgh0.190 ef0.177 gh0.176
Mean0.1970.1890.2030.2040.213
F-testSoil S **S rate **Soil S × S rate **
LSD0.05 (Soil S)0.006
LSD0.05 (S rate)0.007
LSD0.05 (Soil S × S rate)0.013
Soil S = soil sulfur level; S rate = sulfur fertilizer rate; Soil S × S rate = interaction effects between soil sulfur level and sulfur fertilizer rate; ** = highly significant (p < 0.01); ns = not-significant (p > 0.05). Means in the same row followed by different letters indicate significant differences at p < 0.05.
Table 4. The correlations between grain yield, yield component, and grain and leaf S concentration of KDML105 rice grown under different soil S application rates at different locations with varying degrees of S in Surin province in 2021 and 2022.
Year/Degree of SNo. of Tillers hill−1No. of Panicles hill−11000-Grain Weight (g)2AP Content
(mg kg−1)
Grain S
Concentration
(%)
Leave S
Concentration
(%)
2021
Very low soil Sr = 0.17r = −0.064r = 0.47r = 0.19r = 0.20r = 0.12
(p > 0.05)(p > 0.05)(p < 0.05)(p > 0.05)(p > 0.05)(p > 0.05)
Low soil Sr = 0.69r = 0.55r = 0.43r = 0.45r = 0.51r = 0.52
(p < 0.01)(p < 0.05)(p < 0.05)(p < 0.05)(p < 0.05)(p < 0.05)
Medium soil Sr = −0.009r = 0.094r = −0.11r = 0.52r = 0.37r = −0.28
(p > 0.05)(p > 0.05)(p > 0.05)(p < 0.05)(p > 0.05)(p > 0.05)
2022
Very low soil Sr = 0.12r = 0.42r = 0.22r = 0.74r = 0.18r = −0.21
(p > 0.05)(p > 0.05)(p > 0.05)(p < 0.01)(p > 0.05)(p > 0.05)
Low soil Sr = 0.064r = 0.28r = −0.034r = −0.37r = 0.47r = 0.54
(p > 0.05)(p > 0.05)(p > 0.05)(p > 0.05)(p < 0.05)(p < 0.05)
Medium soil Sr = 0.15r = 0.6r = 0.20r = 0.11r = 0.097r = 0.75
(p > 0.05)(p < 0.01)(p > 0.05)(p > 0.05)(p > 0.05)(p < 0.01)
Highly significant (p < 0.01), significant (p < 0.05), and non-significant (p > 0.05) differences.
Disclaimer/Publisher’s Note: The statements, opinions and data contained in all publications are solely those of the individual author(s) and contributor(s) and not of MDPI and/or the editor(s). MDPI and/or the editor(s) disclaim responsibility for any injury to people or property resulting from any ideas, methods, instructions or products referred to in the content.

