Article

Carob–Thyme Intercropping Systems Can Improve Yield Efficiency and Environmental Footprint Compared to Conservation Tillage

1
Department of Biological Sciences, University of Cyprus, Nicosia 1678, Cyprus
2
KES Research Centre, Nicosia 1055, Cyprus
3
KES College, Nicosia 1055, Cyprus
4
V.L. Sustainability Metrics Ltd., Nicosia 2416, Cyprus
*
Author to whom correspondence should be addressed.
Agronomy 2025, 15(7), 1560; https://doi.org/10.3390/agronomy15071560 (registering DOI)
Submission received: 21 May 2025 / Revised: 18 June 2025 / Accepted: 23 June 2025 / Published: 26 June 2025

Abstract

Living mulch intercropping systems are considered as nature-based solutions with a low environmental footprint for managing weeds, improving biodiversity and agroecosystem sustainability. In drylands, however, they may increase intra/inter-specific competition for water, reducing crop productivity. We tested conservation tillage (TLG) carob plots with and without irrigation (TLGirr; TLGdry) vs. rainfed intercropping systems of carob and (i) thyme (Thymbra capitata; T-System) or (ii) clover (Trifolium squarrosum; C-System), strategically planted on the south (sun)-exposed soil side (SES) of carobs, to reduce soil temperature/evaporation. Carob water relations, productivity and environmental footprints were examined for three years under semi-arid, low weed-competition (Skarinou-SKR) and arid high weed-competition (Vrysoules-VRY) conditions in Cyprus. Carob yield efficiency (kg/m3) in SKR, was >27% higher for the T-System (p < 0.05; SES cover ca. 85%; year-3), matching a higher leaf water content (p < 0.001) compared to TLGdry. The T-System reached 28% and 56% of TLGirr yields during very dry and normal rainfall years; TLGdry yields approached zero. For VRY, no negative impacts on carob leaf water, at 25% SES cover, were found. SKR’s C-System improved leaf water content (p < 0.05) for only one year. The T-System also outperformed TLGirr and TLGdry in terms of reducing irrigation needs and energy consumption, breaking new grounds for dryland agroforestry.

1. Introduction

As climate change-related aridity is increasing worldwide [1], drylands are predicted to cover half of the global land surface by the end of the century [2]. Given that 41 percent of the Earth’s surface is already drylands, protecting soils in these lands from desertification is critical for ecosystems and human wellbeing [3]. Agroecosystems in Mediterranean drylands are considered particularly vulnerable to drought [4]. Average temperatures in the region will likely increase by 20 percent, precipitation is expected to decline between 4 and 22 percent, while droughts are expected to become 5–10 times more frequent as a result of climate change [5]. Such changes can lead to an about 18 percent increase in irrigation requirements [4], while droughts can negatively affect the quality and yield of agricultural crops [5]. However, soil degradation can also result from intensive agricultural practices such as tillage, monocultures and the application of synthetic pesticides and fertilizers. Such unsustainable practices can lead to soil degradation, soil erosion, the impairment of water infiltration and the loss of biodiversity, among other outcomes [4,6,7,8].
On the other hand, regenerative agricultural practices focusing on soil health, such as the application of intercropping systems and reducing tillage to zero, are promising nature-based farming solutions [9] shown to increase carbon sequestration, enhance biodiversity, facilitate nutrient cycling, prevent soil erosion and increase water availability [7,10,11,12,13,14]. Such a nature-based approach can, thus, improve agricultural production and resilience, mitigate climate change and protect biodiversity [15,16].
Intercropping, the practice of concurrently growing two or more crop species on the same agricultural plot [16] is a nature-based farming approach gaining increased attention. Intercropped agroecosystems include annual and perennial cover crops (grains, grasses, leguminous plants) or rows of perennial herbaceous plants planted with productive trees. Diversification through intercropping can provide farmers with diverse income streams [16,17], manage weeds [18,19,20], improve biodiversity [21,22] and achieve better land use efficiency compared to monocrops [23]. The adoption of intercropping systems becomes even more critical under conditions of reduced agricultural inputs, when diversified agroecosystems are able to obtain higher yields compared to monocrops [24,25].
Intercropping with nitrogen-fixing leguminous plants, such as Trifolium sp., can increase soil fertility and enhance the yields of the main crop [6,26]. The application of legume cover crops as mulch, such as T. squarrosum, has been noted to efficiently control weeds [27] as well as benefit other crops’ growth possibly due to increased available nitrogen [28]. Furthermore, establishing intercropping systems with drought-adapted perennial herbs can be an efficient way to mitigate climate change and aridification in agroecosystems. Incorporating aromatic plants in tree-based agroforestry can achieve better pest and weed control [19], improve soil properties and water content [29,30,31] and maintain [31] or significantly increase yields [20,32]. Overall, intercropping systems based on aromatic plants can diversify income and provide economic returns through increased land use efficiency [19,33].
However, intercropping systems composed of fruit trees and aromatic plants have very sparsely been studied in the Mediterranean region. Most studies conducted come from China, India and Iran [19,30,32]. Moreover, in drier climates, it has been reported that intercropping methods can increase water and nutrient competition with the main crop [34,35], negatively impacting the main crop’s productivity [29]. One approach could be to strategically plant living mulch systems on the south (sun)-exposed soil side (SES) of trees, to reduce soil temperature/evaporation via shading without fueling competition for water and nutrients with the fruit tree. Niche differentiation between intercropped species, such as taking advantage of shading effects between species, can lead to reduced evaporation and increased soil moisture, resulting in higher overall yields for the intercropped system [19].
More research is needed on dryland intercropping systems to identify the conditions under which they could benefit overall agroecosystems and farmland productivity. Moreover, intercropping in Cyprus is still in its first steps, with only a questionnaire-based assessment available [36]. This is particularly relevant when compared to conservation tillage approaches (1–2 tillage applications per year at the end of the wet season) that appear to be more attractive to farmers for combating weeds, but are still energy demanding and do not promote soil regeneration [37,38,39]. Although conservation tillage has been promoted as a sustainable alternative to conventional tillage, the effect it has on weeds is not always beneficial for crops [40].
Carob (Ceratonia siliqua L.) is an evergreen species that belongs to the Fabaceae family. Since antiquity, carob trees have been wide-spread in most countries of the Mediterranean basin, usually growing in mild and dry places with marginal and calcareous soils [41]. Today carob fruit has found a diverse number of uses in the food and pharmaceutical industries including in gluten-free health products, stabilizers, thickeners and anti-cancer and anti-diabetes drugs and supplements [41,42,43,44]. Carob-based agroforestry has been wide-spread in the arid/semi-arid Mediterranean region including Tunisia [45] and Greece [46]. In Cyprus, carob trees have traditionally been part of sheep-grazing and cereal silvopasture systems [47].
Carob is increasingly recognized as a strategic crop for sustainable agricultural development in arid and semi-arid regions, due to its drought tolerance, low nutrient requirements, and capacity to stabilize degraded soils. These characteristics make it particularly suitable for addressing some of the challenges of water scarcity and land degradation in Mediterranean and other dryland environments [48]. However, ensuring the sustainability of carob production systems requires a comprehensive evaluation of key environmental indicators, including the water footprint (WF), energy intensity (EI), and carbon footprint (CF). These metrics are essential for assessing the efficiency of water use, energy demand, and greenhouse gas emissions associated with production practices [49]. Recent studies have emphasized that integrating such sustainability indicators can support the development of low-input, climate-resilient farming systems, providing valuable insights for both producers and policymakers seeking to optimize resource management in arid areas [50]. Furthermore, life cycle assessment approaches applying these indicators have proven effective in identifying trade-offs between productivity and environmental impacts, enabling more informed decision-making for the sustainable management of carob-based agroecosystems [51].
Thymbra capitata [(L.) Cav.], [synonym of Thymus capitatus (L.) Hoffmanns. et Link.], is an aromatic plant adapted to extreme drought stress found in the thermo-Mediterranean vegetation belt and is typical of garrigue or phrygana vegetation. T. capitata makes very conservative use of soil moisture [52], enabling it to grow on marginal and saline soils [53]. Such properties make it ideal for dryland agroforestry systems as its competition with the tree crop is likely to be low. Thyme, when intercropped with fruit trees, has been found to increase soil organic carbon [31,54], improve soil aggregate stability and water availability in both the top and subsoil [55], provide efficient weed management as a living mulch [22] and provide better soil cover compared to other aromatic plants due to its cushion life form [56].
In this study, rainfed intercropping systems of carob with thyme and clover were tested under arid and semi-arid conditions to address the following research questions:
(1) Can rainfed (i) thyme (Thymbra capitata; T-System) or (ii) clover (Trifolium squarrosum; C-System) intercropped with carob at the SES of the tree, improve carob leaf water content and tree productivity (yield efficiency and wood production) compared to rainfed conservation tillage carob plots (TLGdry) in both semi-arid/low weed-competition and arid/high weed-competition conditions?
Our first hypothesis is that in semi-arid, low weed-competition conditions, both thyme- and clover-based intercropping systems, when strategically planted in the SES of carobs, may reduce soil temperature/evaporation and retain higher levels of soil moisture during the dry season, with low competition pressure on carob trees. This may alleviate drought stress on carob trees and improve productivity compared to rainfed conservation tillage systems.
Our second hypothesis is that the T-System may perform better than the C-System, due to thymes’ capacity for using less water, while providing SES cover all year round, thus lowering evapotranspiration rates compared to the C-System.
Our third hypothesis is that in arid high weed-competition conditions, we expect higher evapotranspiration and lower SES establishment rates for the T- and the C-Systems due to weed competition. This in turn may not benefit soil moisture availability for carob, leading to reduced tree productivity compared to conservation tillage.
(2) What are the pros and cons of the T-System compared to TLGdry and to irrigated conservation tillage carob plots (TLGirr) in terms of yields and environmental performance (CO2 emissions, energy and water demand) in semi-arid low weed-competition conditions?
We hypothesize that the T-System may outperform TLG systems in terms of environmental performance, while providing satisfactory yields, as a low-input nature-based approach for the adaptation of dryland agroforestry to climatic change.

2. Materials and Methods

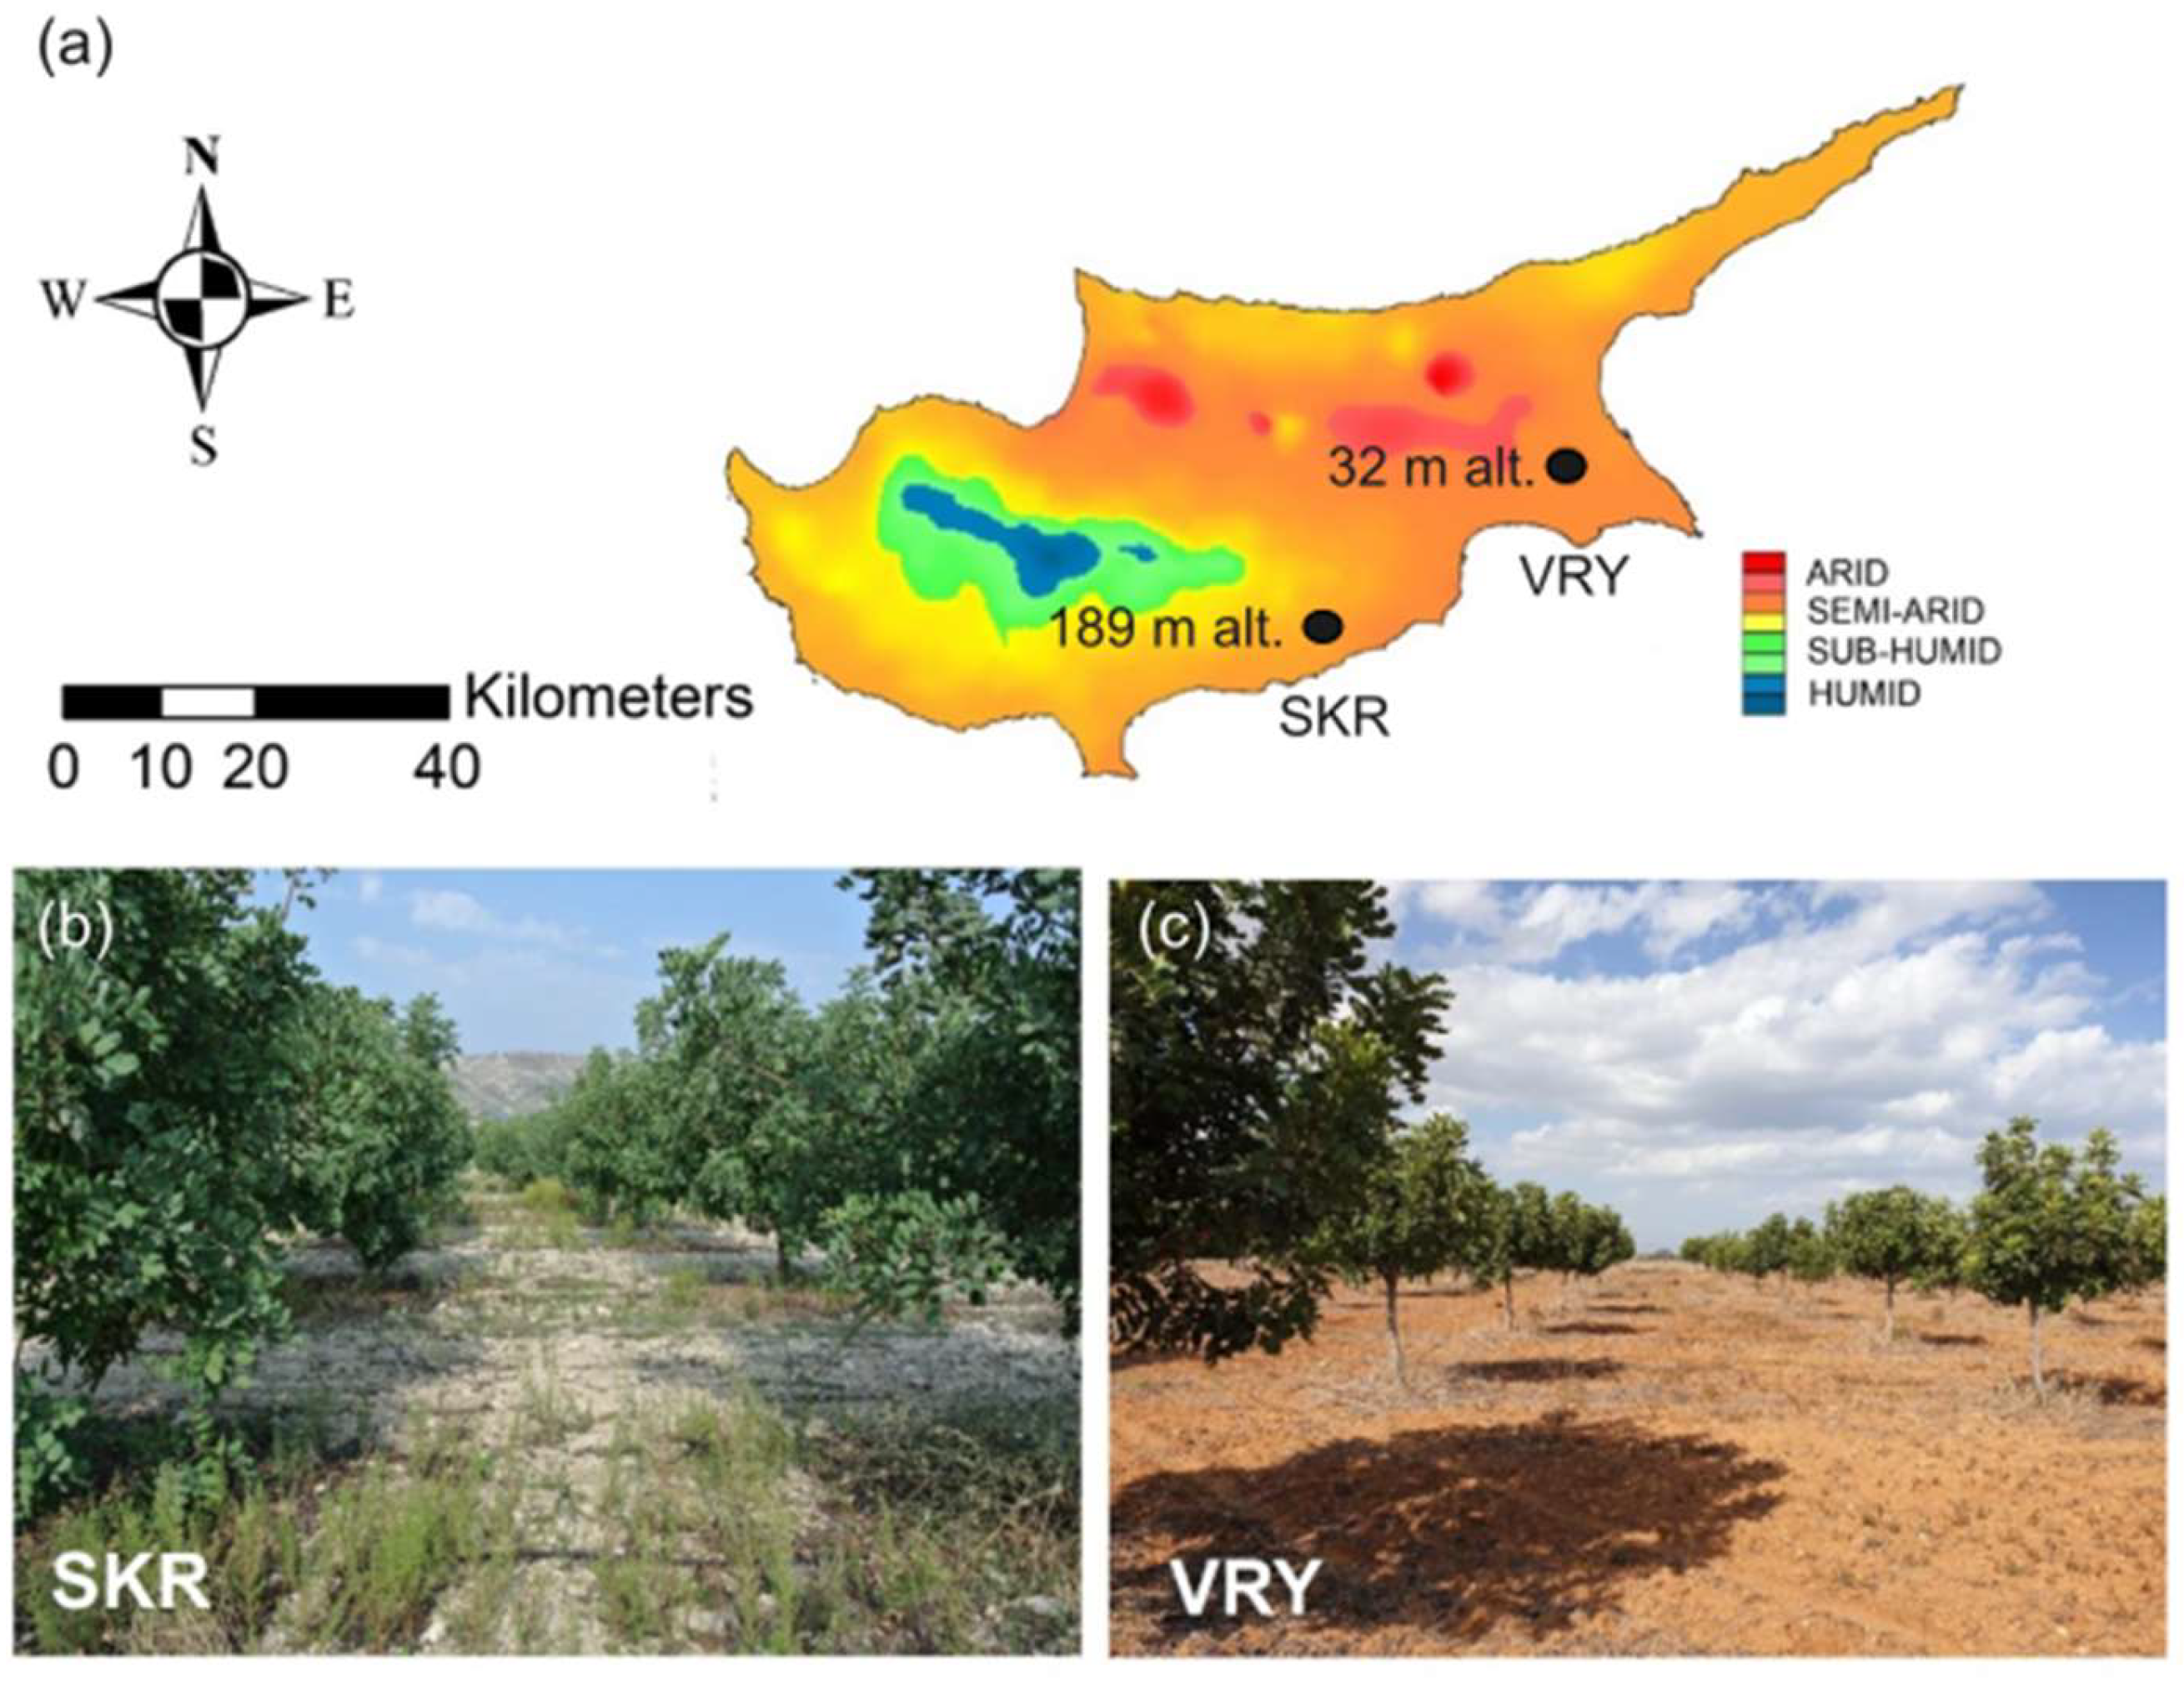
2.1. Experimental Sites and Tree Selection

The field experiments were conducted under rainfed conditions from 2019 till 2022, covering three dry seasons. Selected fields were from two sites on the island of Cyprus in the southeast Mediterranean that had been planted with carob trees at 7 m of distance from each other (7 × 7 m planting density: 204 trees/ha) (Figure 1). The first site, named Skarinou (SKR), included two neighboring agricultural plots in the Larnaca district [(i) 34°48′37.68″ N 33°21′20.57″ E, (ii) 34°48′40.75″ N 33°21′14.62″ E] at ca. 189 m above sea level, with a semi-arid climate (Table 1). The second site, named Vrysoulles (VRY), was in the Ammochostos district (35°04′42.2″ N 33°52′46.7″ E) at 32 m above sea level, experiencing an arid climate. Both regions have been classified as desertification prone (Figure 1; see also Table 1).
In total, 303 trees at the SKR site and 319 at the VRY site were available. Selection of trees was based on the following criteria: weaker/smaller-in-size trees as well as those located at the edge of fields were excluded; therefore, neighboring trees were of similar vigor and size. Thus, competition for water and nutrients between the remaining trees was similar. Out of the tree populations that fulfilled the above criteria, trees were randomly selected and assigned to each treatment. In SKR, 8 trees were assigned to the T-System treatment, 12 to the C-System, 4 to conservation tillage without irrigation (TLGdry), while 213 trees were assigned to conservation tillage with irrigation (TLGirr; monitored for their carob yield and environmental impact). At the VRY site, 11 trees were assigned to the T-System, 12 trees to the C-System, and 4 trees to the TLGdry treatment.
At the SKR site, selected trees were 20 years old and had been drip irrigated up to summer 2019, only during the dry months (April to October). Then, irrigation stopped for the non-irrigated treatments (T-System, C-System, and TLGdry). At the VRY site, the carob trees selected were 18 years old. They had only been irrigated during the first two years of establishment. Prior to the experiment, conventional soil and weed management were performed in both locations, with 3 to 4 plowing applications every year depending on seasonal rainfall and the growth of weeds.

2.2. Intercropping Experimental Design

Around each of the 42 selected carob trees, a ca. 22–25 m2 rectangular surface plot was delimitated. Within each plot, at the south-sun-exposed soil side (SES) of each tree, a smaller surface area of ca. 3.6 m2 (3 × 1.2 m) was selected (Figure 2) for the application of thyme (Thymbra capitata [(L.) Cav.]) or clover (Trifolium squarrosum L.) to create a carob–thyme intercropping system (T-System; 19 plots in both sites) or a carob–clover intercropping system (C-System; 24 plots in total). The SES plot area was ca. 1.5 m away from the trunk (no midday shading from the tree on the intercropped crop). The remaining plot surface was dominated by wild annual vegetation (see [58] for floristic composition) and by vetch Lathyrus ochrus (L.) DC in less than 20%. No weeding took place in the plots throughout the duration of the experiment. The intercropping system was strategically planted at the SES of carob trees to cover only ca. 15% out of the total surface plot around each monitored tree. The aim was to (a) minimize any competition effects for soil water with the carob trees, (b) provide soil cover at the location where it would be the highest around the tree to reduce thermal stress and evaporation, and (c) keep the installation cost of the application low. The remaining 85% of land around the carob trees was left unmanaged in order to increase the systems’ biodiversity compared to conservation tillage.

2.2.1. Carob–Thyme Intercropping System (T-System)

In each SES area, 60 thymes (ca. 3–5 cm tall) at a density of ca. 16 seedlings per m2, were planted in late December 2019 till early January 2020, adding up to a total of 1140 T. capitata plants in 19 plots (8 plots in SKR; 11 plots in VRY). Prior to planting each thyme the soil within each planting hole was ecologically engineered by using a beneficial microbe complex and a water retaining mineral as described in [58].

2.2.2. Carob–Clover Intercropping System (C-System)

In addition to the 19 T-System plots, another 24 plots were planted with thyme (as described in Section 2.2.1) and sown annually with T. squarrosum (55 g/m2 of seed) in late autumn as described in (Figure S1). The initial aim was to produce a carob–thyme–clover intercropping system. However, after the first dry season, the thyme survival rate was below 2% (Table 2). It appears that the ecologically engineered soil combined with the very wet climate of Y1 produced a clover overgrowth that outcompeted with the thyme. Therefore, these 24 plots were considered as carob–clover plots (C-system, 12 plots per site), since any actual effect of thyme on carob was negligible. However, clover’s establishment in the following years highly depended on climate conditions. During Y2, the very dry winter (December 2020–February 2021; annual rainfall: SKR = 425.3 mm, VRY = 331.1 mm, approx. 50% less than normal precipitation, Table 1) did not permit clover to germinate and establish in any plot. As compensation, a layer of clover hay was applied at a biomass of 320–400 g/m2 at the SES of each tree to retain a clover mulch layer for the following dry season (Figure S1 and Table 2). Moreover, in Y3, not all plots included clover since in some cases weeds appeared to outcompete it. Thus, the C-System had two variations: (A) the CCC C-System, where SES plots with clover-based living mulch were available to the carob trees in all three monitoring years; and (B) the CCW C-System, where clover-based living mulch covered the SES plots in Y1 and Y2, while in Y3 weeds dominated the SES plot area. No weeding or management of clover, such as the termination of the crop through cutting or plowing, took place throughout the monitoring period.

2.3. Control Plots

The T- and C-Systems’ performance was compared to two types of control plots. In Control 1 plots, conservation tillage was applied within the entire plot once a year without irrigation (TLGdry, 8 plots in total; 4 per site). Control 2 included all remaining trees that complied with the tree selection criteria within site SKR (213 trees) where irrigation and conservation tillage were applied (TLGirr).

2.3.1. Conservation Tillage Control Plots Without Irrigation (TLGdry)

Wild vegetation in TLGdry plots was managed by plowing the plots down to a maximum of 15–20 cm once, during springtime for each experiment year. The aim was to reduce vegetation’s soil cover to below ca. 30% during summertime (average soil cover in TLGdry plots for all three monitoring summer seasons was 21% in the SKR site and 33% for the VRY site). No irrigation was provided to TLGdry plots throughout the duration of the experiment.

2.3.2. Irrigated Conservation Tillage Carob Trees (TLGirr)

Wild vegetation in TLGirr was managed by plowing the trees down to a maximum of 15–20 cm once during springtime for each experiment year. Supplemented irrigation was provided to the trees during the dry months (May–October) throughout the experiment. In total, 213 trees at the SKR site were monitored.

2.4. Experimental Monitoring

2.4.1. Thyme Survival Rate

All living thyme plants (baring green leaves) were counted in each T- and C-System plot, and measured three times during the duration of the experiment (February 2021, May 2022 and December 2022) to cover plant recovery from the dry seasons of 2020, 2021 and 2022. The thyme plant survival rate (TSR) was estimated as the percentage of living thyme plants compared to the total number of thyme plants planted during establishment. Note that the TSR was below 2% after the first dry season (February 2021 assessment) for the C-System plots.

2.4.2. Thyme Biomass/Thyme Soil Cover/Total Soil Cover

Thyme biomass (TB) and thyme soil cover (TSC) were assessed following each dry season (in May of 2021, 2022 and 2023). For TB, an estimation was provided based on sampling thyme plants within the SES plots, aiming not to remove biomass amounts that could significantly disrupt any possible effects of thyme on the soil microclimate. Thus, the minimum number of thyme plants, e.g., 3 plants per SES plot at each site, was randomly selected (57 plants in total) and their biomass above 4–5 cm from the ground was cut, dried and weighed (with a two-decimal digital scale) in all T-System plots. The thyme dry biomass per site was averaged and calculated per m2 (multiplying by 16, i.e., the number of planted thyme plants per m2). Since not all thyme plants survived, a correction was applied by multiplying the above biomass by the average TSR % per site during the corresponding monitoring period. After thyme cutting, the remaining shrub volume still on the ground (mostly xylem of the stems’ bases) was 40% (Y1), 30% (Y2) and 20% (Y3), based on the entire shrub’s volume assessment before the cutting. This biomass was estimated by multiplying the above % with the biomass measured from the remaining shrub and then added to that measured to produce the final TB per site.
TSC was estimated by measuring the elliptic cross section area of each thyme plant’s canopy as projected onto the soil for all thyme plants within a 1 m2 quadrat. The quadrat was randomly placed within each of the T-System SES plots in each site location. To estimate the TSC, the distance between the thyme branches extending furthest from the central stem (D1) and the distance perpendicular to D1 (D2) were used for calculating the surface of the canopy [59] of thyme projected onto the ground. The projection resembles the shape of an ellipse. The surface of this ellipse was calculated based on its standard equation, π × D1 × D2/4, to produce the TSC per plant. From this, the average TSC per site was calculated and multiplied by the site’s TSR during that same monitoring period. During each thyme canopy monitoring session, the % of area covered by wild vegetation was also estimated in each quadrat. This permitted us to estimate the total soil cover by vegetation in each quadrat, i.e., the soil covered by both thyme and wild vegetation (TWSC).

2.4.3. Clover Biomass and Soil Cover

During each dry season (in June 2020, 2021 and 2022), clover biomass (CB) and total biomass from clover and weeds (CWB) present in a 1 m2 quadrat randomly placed in SES plots were measured for 4–6 C-System plots. The CB/CWB ratio (in %) was calculated (Table 2). The total soil cover by clover and weeds on soil (CWSC) was also measured using a 1 m2 quadrat for 3–5 SES plots at each site.

2.4.4. Water Potential

The carob trees’ leaf water potential (Ψ) was monitored using a Schölander pressure chamber. Twigs with leaf samples were collected at midday from the southwestern (sun-exposed) side of each sampled tree at 1.70–2 m from the ground. At least two samples were taken from each monitored tree (N sampled trees: SKR = 15–17, VRY = 13–15 each season). Water potential was monitored once at the beginning of the dry season (i, mid-June) and once at the end of the dry season and prior to the rainfall period (ii, beginning–mid-October). A baseline measurement was also conducted prior to experimental establishment (October 2019). Recorded values (in bar) were transformed to MPa using the equation Ψ (MPa) = Ψ (bar) × (−0.1). During the dry season, soil moisture declines which may affect tree water content. As a measure of dry season water stress on the carob trees, the leaf water potential difference ΔΨ between the beginning (i) and the end of the dry season (ii) (ΔΨ = Ψii − Ψi) [60] for each monitored year was calculated.

2.4.5. Wood Production

To monitor the wood production (secondary xylem growth) of each carob tree, the circumference of each experimental tree was recorded at a distance of 40 cm perpendicular from the ground. Circumference (C, cm) was transformed to basal area (BA, cm2) using the equation BA (cm2) = C2/4 × π [61]. To estimate the percentage of wood production over the span of the three-year experiment (ΔBA22–19), the difference in tree basal area between the third (BA22: December 2022) and the baseline year (prior to experimental establishment—BA19: October 2019) was calculated and then divided by the baseline value based on the equation ΔBA22–19 (%) = (BA22 − BA19) × 100/BA19. Values were then normalized based on the site’s average ΔBA (multiplied by 100 and divided by the site’s average) for comparison purposes between the two sites.

2.4.6. Carob Yield Efficiency

Carob fruit (pod) from each plot was collected and weighed at the end of August of each experiment year. The total carob yield per tree for all 3 years of production was then divided by canopy volume (CV) of the particular tree to estimate the trees’ yield efficiency in kg/m3 [62]. This correction was necessary to account for any differences in tree size. Trees were at a productive phase during the first 2 years of the experiments only in site SKR. Carob pod productivity at site VRY appeared to have been delayed, since these trees had been growing in more arid conditions and without irrigation apart from their first 2 years of establishment. Canopy volume (CV) was calculated based on the following equation: CV (m3) = π × D1 × D2 × [(Ht1 − Hs1) + (Ht2 − Hs2)]/12 [63]; with D1 being the distance of tree branches furthest extending from the trunk; D2 is the distance perpendicular to D1; Ht is tree height and Hs is the lowest point of the canopy’s height from the ground. Measurements were made with the Nikon Forestry Pro II laser meter.

2.4.7. Soil Moisture Measurements

Soil moisture was monitored at the end of the third-year dry season (October 2022) down to 5 cm of soil using an EC5 Soil Moisture Smart Sensor with a HOBO USB Micro Station Data Logger (Onset, Cape Cod, MA, USA). Soil moisture measurements were taken between 7:00 am–12:30 pm from 3 to 4 sun-exposed spots positioned within the SES plots (N sampled trees: SKR = 16, VRY = 11). Measurements per spot were recorded every 10 s for a total of 5 min. Values were recorded in m3/m3 and were multiplied by a factor of a 100 to be expressed in %.

2.4.8. Surface Temperature Measurements

Surface infrared radiation was recorded during the peak of the third dry season (July 2022) using a Grade Thermal Camera (FLIR ONE Pro LT Pro, FLIR Systems, Tallinn, Estonia) with a thermal resolution of 80 × 60 (4800 px) and a thermal pixel size of 17 μm. One photo of the south-facing side of each monitored plot was recorded between the hours of 11:30–13:30. Thermal images were later processed using the FLIR Thermal Studio Starter Software (Version 2.0.32). Experimental plot surface temperature was considered the average temperature of a 350 px (width) by 97 px (height) box frame (33,950 px area). The box frame was always placed in the SES plot covering at least 50% of its surface, while avoiding any non-treatment-related objects (e.g., large rocks).

2.5. Climate Data

As described in [58], climate data were used from the three meteorological stations closest to the SKR and VRY sites. They belonged to the network of the Cyprus Department of Meteorology and were <5 km away from each experimental site. The 3 stations were Skarinou (station number: 628, 34°49′17.22″, 33°21′19.45″), Dipotamos (station number: 633, 34°51′08.24″, 33°21′40.47″), and Frenaros (station number: 1845, 35°02′32.64″, 33°55′03.414″) at 180, 175 and 78 m above sea level (a.s.l.). Due to missing data at Dipotamos station, temperature data for the SKR site was estimated based on regression analysis (R2 = 0.997) in 2022 using temperature data from the closest station (ca. 2 km distance from Dipotamos station, namely Kakoratzia station; number: 1634, 34°51′40.55″, 33°22′57.10″, at 231 m a.s.l).

2.6. Environmental Indicators

The environmental performance indicators of (1) water footprint (WF—L of water per kg of carobs), (2) energy intensity (EI—MJ energy used per kg of carobs) and (3) carbon footprint (CF—kg CO2-equivalent per kg of carobs) were calculated based on experimental data. The calculations were made for the SKR site and the treatments TLGirr, TLGdry and T-system for two years (2021, 2022). In the experiment, the inputs that are related to quantifiable indicators are tillage and irrigation, where energy is consumed in the form of fuel and electricity to power the irrigation pump. In the case of thyme-based living mulch, these inputs were zero, as tillage and irrigation were not applied. Additionally, the C stored in the wood biomass and the soil C balance were not considered. In the case of TLGirr, data were obtained from the producer, related to the irrigation schedule, network, water application and electricity consumption by the motor pump employed. The irrigation is typically applied every 2 weeks from May to October, and the applied irrigation dose is 100–200 L per tree, based on the seasonal variation in rainfall, which is also accounted for in the WF estimations, as the effective rainfall, which is 30% of the annual precipitation. For the EI, electricity and fuel use were considered. Total values were estimated for C emissions, water and energy consumption and then expressed per kg of yield. For electricity use, the emission factor of the electricity production in Cyprus, using the country’s energy mix (e.g., renewable, crude oil) was used, equal to 0.627 kg CO2 per kWh (data from the Electricity Authority of Cyprus). For the energy use and emissions related to tillage, data from Ecoinvent were used, adjusted to the equipment and time needed for soil cultivation in the SKR site. Therefore, per tree, 4.404 MJ of energy are related to soil cultivation, which corresponds to emissions of 0.571 kg CO2 eq. Table S1 provides the data used for the estimation of the environmental impact indicators.

2.7. Statistical Analysis

To test for the normality of the data sets, the One-Sample Kolmogorov–Smirnov Test was used. When data were non-normal, the Kruskal–Wallis test was conducted to compare medians. To compare means for normally distributed data, one-way ANOVA was used followed by Tukey’s Honestly Significant Difference test (HSD) and the Bonferroni test to analyze multiple comparisons between homogenous groups. The level of significance used was set at p < 0.05. All statistical analysis was carried out using SPSS Statistics 29 (SPSS, Chicago, IL, USA).

3. Results

3.1. Climatic Conditions

Our experiment spanned over a three-year monitoring period. The SKR site was classified as having a semi-arid climate under normal conditions with average Oct–Sep rainfall of 425 mm during 1981–2010. However, plants in SKR experienced very wet conditions during Y1, i.e., 2019–20 (+54% more than normal rainfall; 655 mm Oct–Sep rainfall; De Martone’s Aridity Index, DMAI = 21.29; Table 1). This was followed by a very dry climate in 2020–21 (Y2; 27% less than normal rainfall; 311 mm Oct–Sep rainfall; DMAI = 9.96), creating arid conditions. In Y3 (2021–22), the climate was close to normal (17% more than normal rainfall; 496 mm Oct–Sep rainfall; DMAI = 15.77). Climate at the site classified as arid (VRY) (averaged Oct–Sep rainfall of 331 mm during 1981–2010) was likewise very wet during the year of 2019–20 (Y1; 55% more than normal rainfall; 513 mm Oct–Sep rainfall; DMAI = 16.9), but arid for the two years that followed (Y2: 2020–21; 13% less than normal; 289 mm Oct–Sep rainfall; DMAI = 9.4; and Y3: 2021–22; dry year, 15% less than normal; 283 mm Oct–Sep rainfall; DMAI = 9.3; Table 1). Preceding our experiment, very wet conditions prevailed at both sites (SKR: 60% more than normal rainfall; 678 mm Oct–Sep rainfall; DMAI = 22.28. VRY: 42% more than normal rainfall; 469 mm Oct–Sep rainfall; DMAI = 15.35; Table 1).

3.2. Establishment and Performance of T- and C-Systems

The T-System at the SKR site maintained relatively the same TSR during the three-year experiment, starting from a 97% TSR (Y1) and ending with a 94% TSR (Y3) (Figure 3 and Table 2). At VRY, the TSR dropped from 72 to 40% three years after T-System establishment (Figure 3 and Table 2; [58]). Thyme biomass for the T-System in SKR increased from 43 g/m2 (Y1), and 335 g/m2 (Y2) to 420 g/m2 (Y3). Soil cover within the SES plots included thyme and unmanaged weeds (TWSC). It measured >40% (Y1), 55% (Y2) and 85% (Y3). TSC within the SES plots increased from 15% in Y1 and 35% in Y2 to 83% in Y3.
The T-System at the VRY site yielded a thyme biomass of 28 g/m2 in Y1, increasing to 45 g/m2 in Y3, reaching only ca. 10% of that in site SKR. Soil cover of both thyme plants and wild vegetation (TWSC) in SES plots in VRY reached >97% in Y3, from >55% in Y1 (Table 2). TSC within the SES plots increased from 11% in Y1 and 9% in Y2 to 25% in Y3. Thus, unlike site SKR, wild vegetation (mostly Avena sp.) dominated SES plots in the VRY site ([58] For the C-System in site SKR, the average biomass for 3 years in CCC plots (clover + weeds) was 288 g/m2 (Table 2: Y1 = 215 g/m2, Y2 = 329 g/m2, Y3 > 320 g/m2), with 70% of biomass therein produced by clover in Y1 and 55% during Y3. Soil cover (clover and weeds; CWSC) remained over 90% in CCC plots for all years of the experiment (Table 2: Y1 > 90, Y2 = 97, Y3 = 100%). Total plant biomass (clover and weeds) in the C-System plots at VRY (CCW plots) remained higher than 300 g/m2 during all experiment years (Table 2; Y1 = 305 g/m2, Y2 > 400 g/m2 and Y3 = 316 g/m2), with clover biomass therein dropping from 50% in Y1 to 7% in Y3. In CCW plots, soil cover (clover and weeds; CWSC) remained higher than 95% during all three years of the experiment (Table 2; Y1 = 97, Y2 > 95, Y3 = 100%).

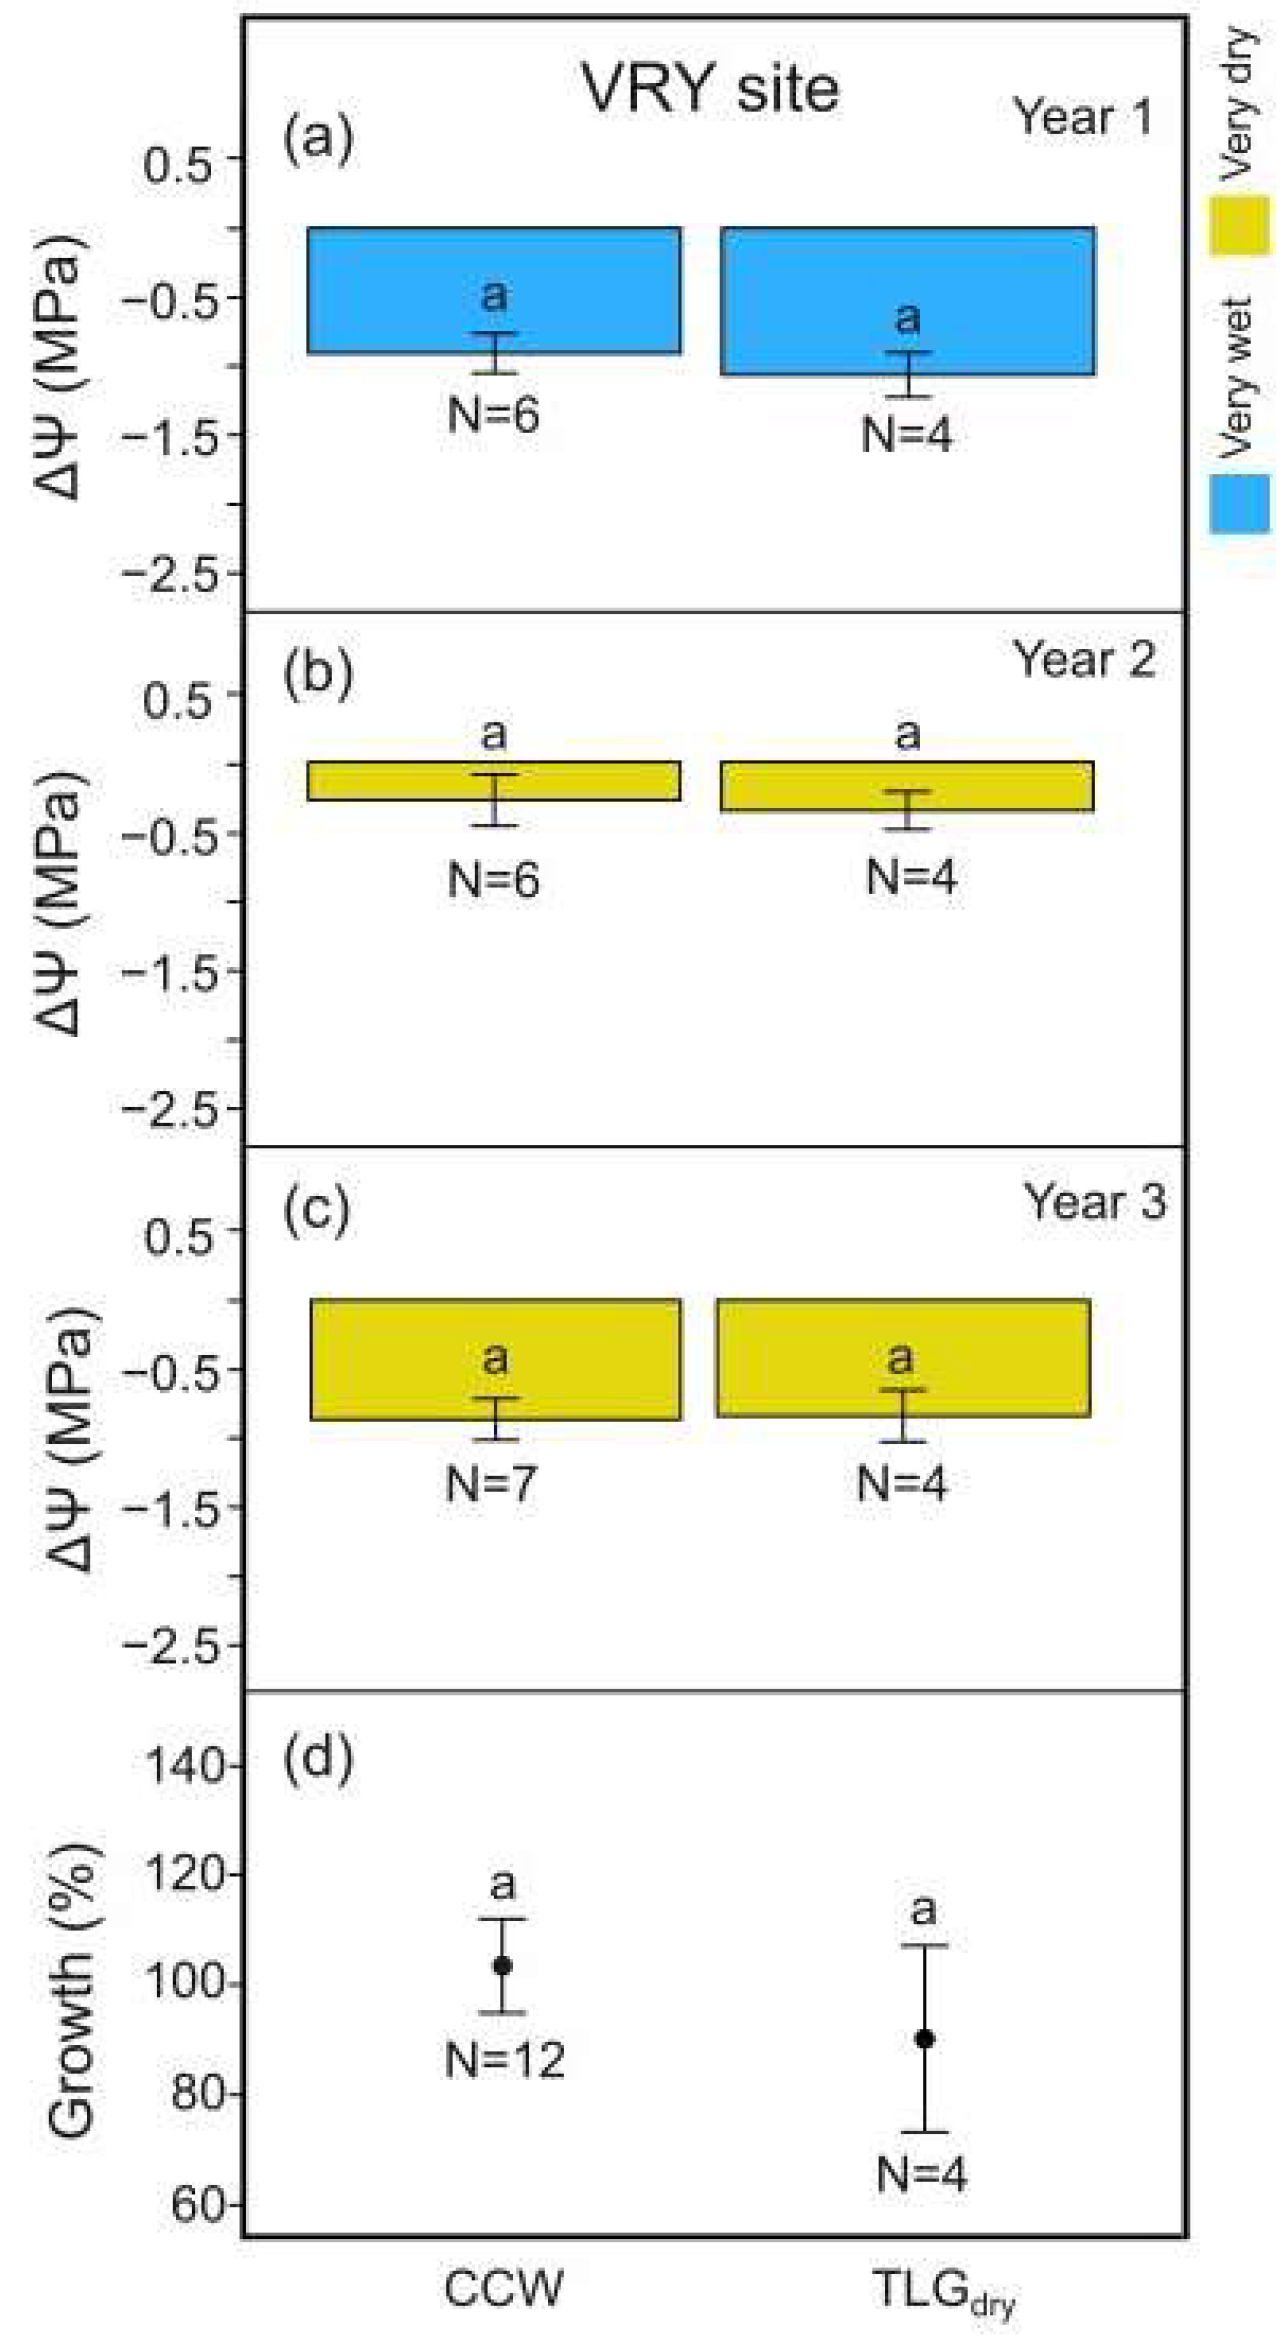
3.3. Effects on Yield Efficiency, Leaf Water Potential, and Tree Growth

In our three-year experiment, one heavy (Y1), one poor (Y2) and one medium (Y3) fruit-bearing year were recorded (Table S2). During the harvest of 2020 at the end of a very wet hydrological year (Y1; Table 1), carob yield efficiency was greater for the TLGdry (1.27 kg/m3) and the T-System carob trees (1.11 kg/m3), with irrigated conservation tillage plots (TLGirr) coming last (0.95 kg/m3). However, for the harvests of 2021 and 2022, towards the end of a very dry (Y2) and a normal hydrological year (Y3), the carob yield efficiency of TLGirr appeared to be related to the water supply (Table S3: TLGirr; Yield efficiency: 2021 = 0.92 kg/m3, 2022 = 0.59 kg/m3; Irrigation water: 2021 = 43.23 mm, 2022 = 62.27 mm). Yield efficiency for the T-System during the very dry Y2 was 0.26 kg/m3, amounting to 28% that of TLGirr plots (Table S3). Nevertheless, at Y3, when climate was normal, the yield efficiency of the T-System reached 0.33 kg/m3, which equaled 56% of that of TLGirr carob tree productivity. Note that during Y2 and Y3, carob pod production was practically zero for TLGdry plots (Table S3; Yield efficiency 2021< 0.01 kg/m3; 2022, no production).
Prior to treatment initiation, midday leaf water potential of the trees belonging to the three carob tree groups tested (T-System, C-System and TLGdry) was measured at the end of the dry season (October 2019—Y0). No significant differences were identified in tree water status among the three groups at both sites (Figure 4a,b). However, in Y3 (October 2022) at the SKR site, carob trees of the T- and C- Systems’ plots had significantly improved tree water content compared to the TLGdry carob plots (Figure 4c, p < 0.001). At the VRY site, no significant differences in the trees’ water contents were identified between the intercropping systems and the TLGdry plots (Figure 4d). Similar results were produced when the same trees were compared during the Y0 and Y3 monitoring periods (N for SKR: T = 3, CCC = 3, TLGdry = 3; and for VRY: T = 4, CCW = 4, TLGdry = 3).
For the wet (Y1) and the normal (Y3) climate year, midday leaf water potential differences, ΔΨ, between the beginning and the end of the dry season for T-System carob trees at the SKR site were significantly higher compared to TLGdry, i.e., the unirrigated trees under conservation tillage (Figure 5a, p < 0.01; Figure 5c, p < 0.001). During the very dry year (Y2), no difference in the trees’ water content was identified between the two systems (Figure 5b, p > 0.05). Carob tree yield efficiency added up for Y1, Y2 and Y3 at SKR was significantly greater for the T-System compared to TLGdry, with a productivity increase ranging from 27% to 71% (based on standard error margins; mean 47%; Figure 5d, p < 0.05). It coincided with 12.5% higher carob wood production over the 3-year period (based on carob stem basal area change) compared to TLGdry, although this was not statistically different (Figure 5e, p > 0.05).
At SKR, midday leaf water potential differences, ΔΨ, between the beginning and the end of the dry season for C-System carob trees growing under the effect of clover-based living mulch in all 3 years of monitoring (CCC) were significantly higher (Figure 6c, p < 0.05) in Y3, with no negative impact for Y1 and Y2 compared to TLGdry (Figure 6a,b, p > 0.05). CCC carob trees appeared to produce a tendency towards improved yield efficiency compared to TLGdry considering all 3 years of monitoring, although this was not statistically significant (Figure 6d, p > 0.05). Carob wood production for both systems was again not statistically different over the 3-year monitoring period (Figure 6e, p > 0.05).
At the VRY site, no significant differences in midday leaf water potential, ΔΨ, between the beginning and the end of the dry season were recorded for the T-System carob trees compared to TLGdry, for all 3 years of monitoring (Figure 7a–c, p > 0.05), as was also the case for carob wood production (Figure 7d, p > 0.05). C-System carob trees growing under the effect of clover-based living mulch in 2 out of the 3 years of monitoring (CCW) exhibited the same pattern as shown above (Figure 8, p > 0.05).
During Y1 and following a very wet year (Y0 = 2018–2019, 60% more than normal rainfall, Table 1) at site SKR, no differences in carob tree yield efficiency were recorded among all systems investigated (Figure 9a, p > 0.05). Following a second very wet hydrological year (Y1 = 2019–2020, 54% more than normal rainfall, Table 1), during Y2 of monitoring, carob tree yield efficiency was significantly higher at T- System plots compared to C-System and TLGdry plots (Figure 9b, p < 0.05). In Y3 and after a very dry wet season (Y2 = 2020–2021, 27% less than normal rainfall, Table 1), a tendency for higher carob tree yield efficiency was noted for T-System and C-System CCC plots, although this was not statistically significant compared to TLGdry (Figure 9c, p > 0.05). For Y1 and Y2, the C-System included trees growing under the influence of clover as a cover crop within the SES plots (Figure 9a,b). However, since no clover sprouted in 8 of the 11 plots in Y3, the C-System was separated into two groups, CCC (N = 3) and CCW (N = 8) (Figure 9c).

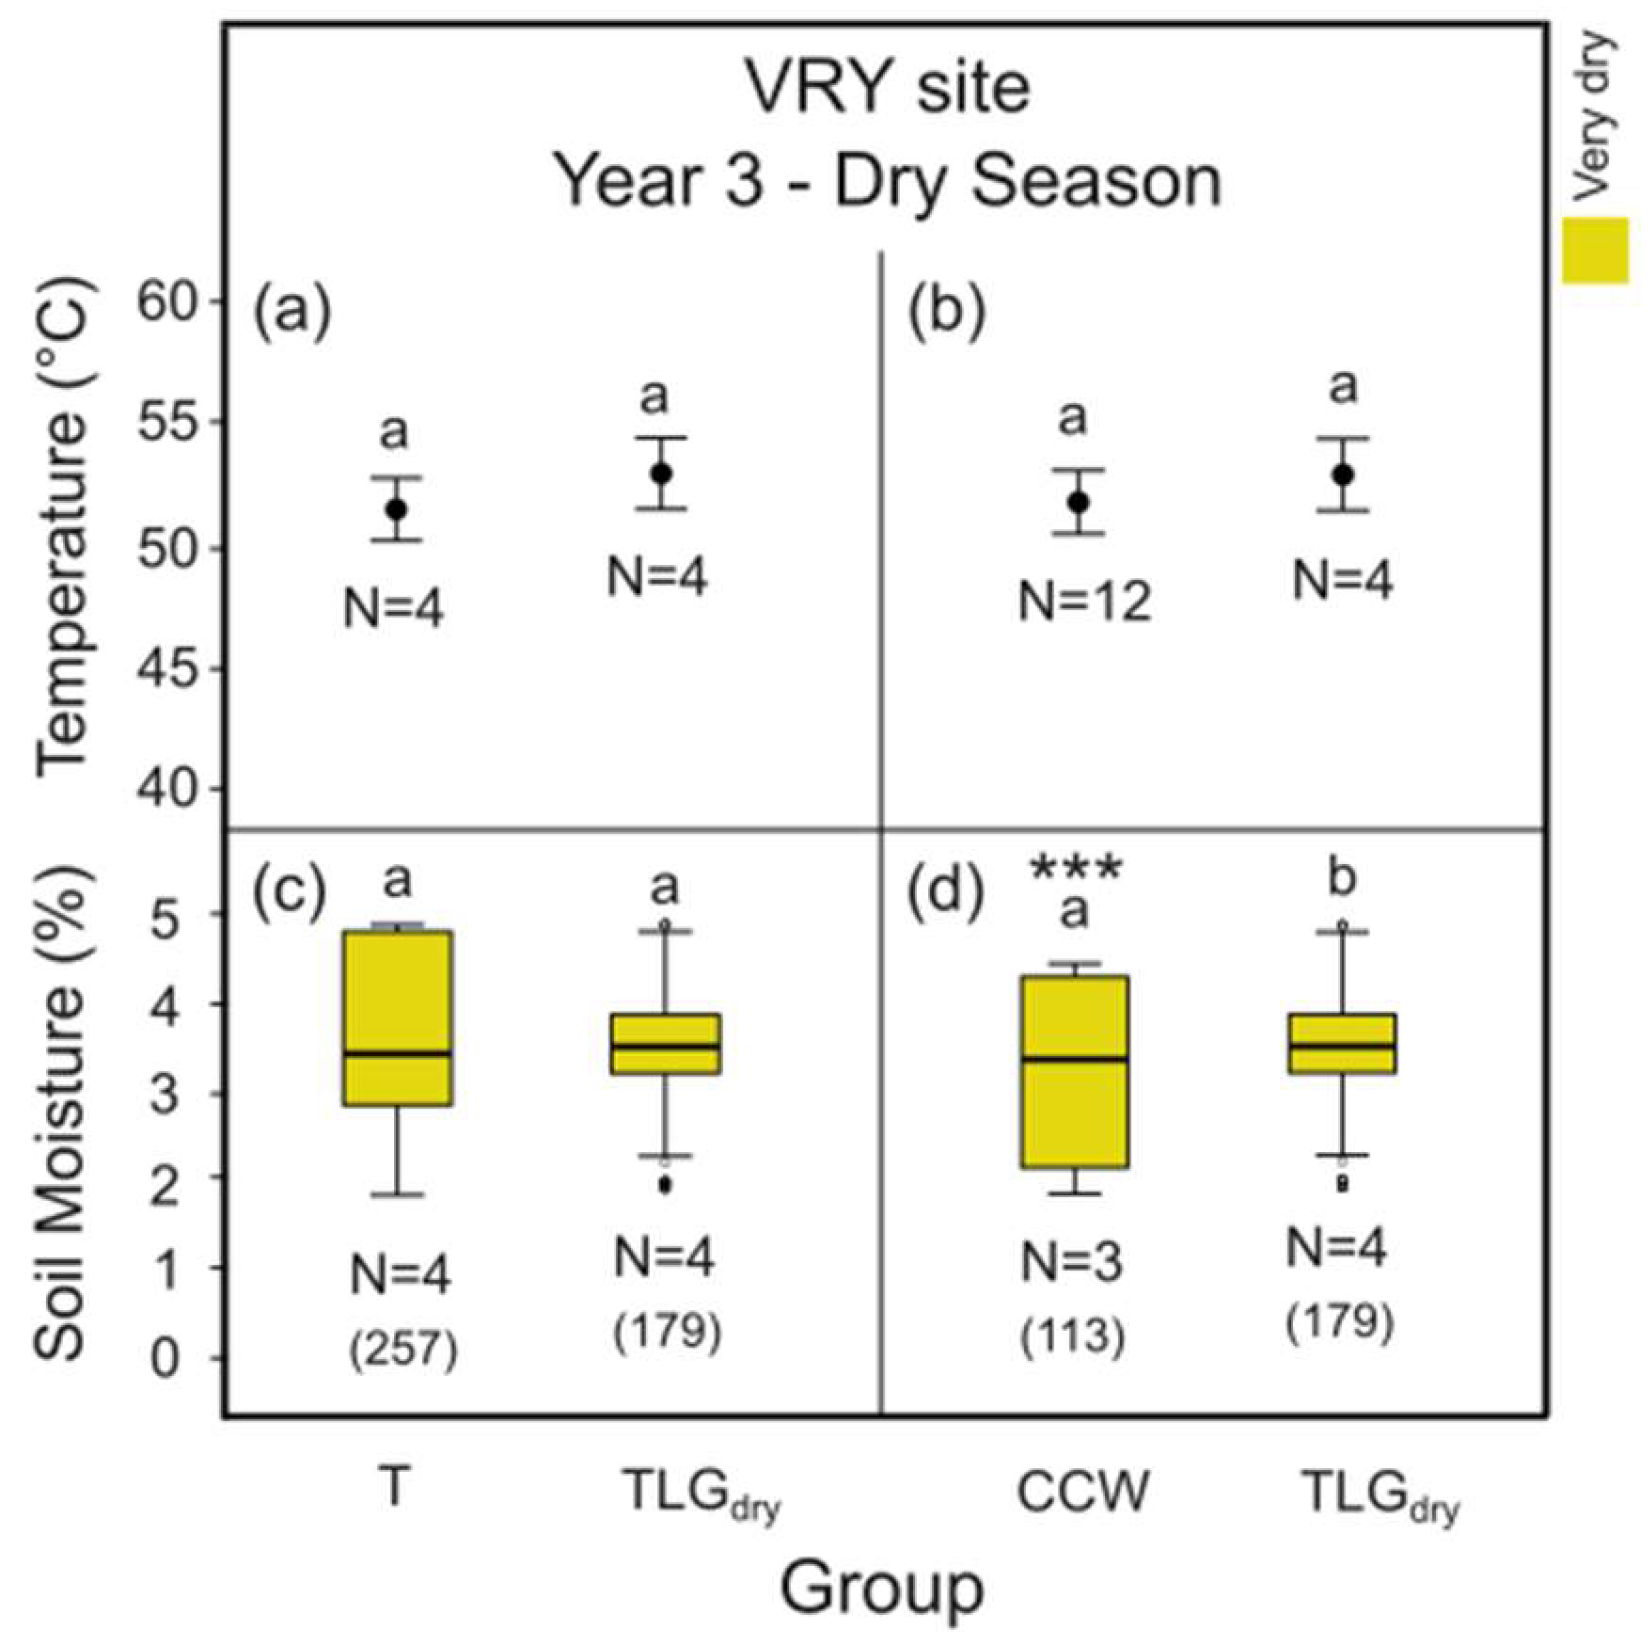
3.4. Thermal Stress on Soil and Soil Moisture

Measurements within the dry season of Y3 indicated that both the T-System and the C-System CCC at the SKR site can significantly reduce the plots’ midday thermal stress by 9 °C and 13 °C compared to TLGdry (Figure 10a, p < 0.001, Figure 10b, p < 0.01). However, no such effect was detected in site VRY (Figure 11a,b, p > 0.05). At site SKR, at the end of the same dry season, soil moisture in both the T- and the C- Systems’ plots was found to be significantly higher by 18% and 3%, respectively (Figure 10c, p < 0.001, Figure 10d p < 0.001) compared to TLGdry plots. In site VRY, the opposite was detected for plots of the C-System CCW, with soil moisture found to be significantly lower by 4% compared to TLGdry plots (Figure 11d, p < 0.001), while no significant difference in soil moisture was recorded between T-System plots and TLGdry plots (Figure 11c, p > 0.05).

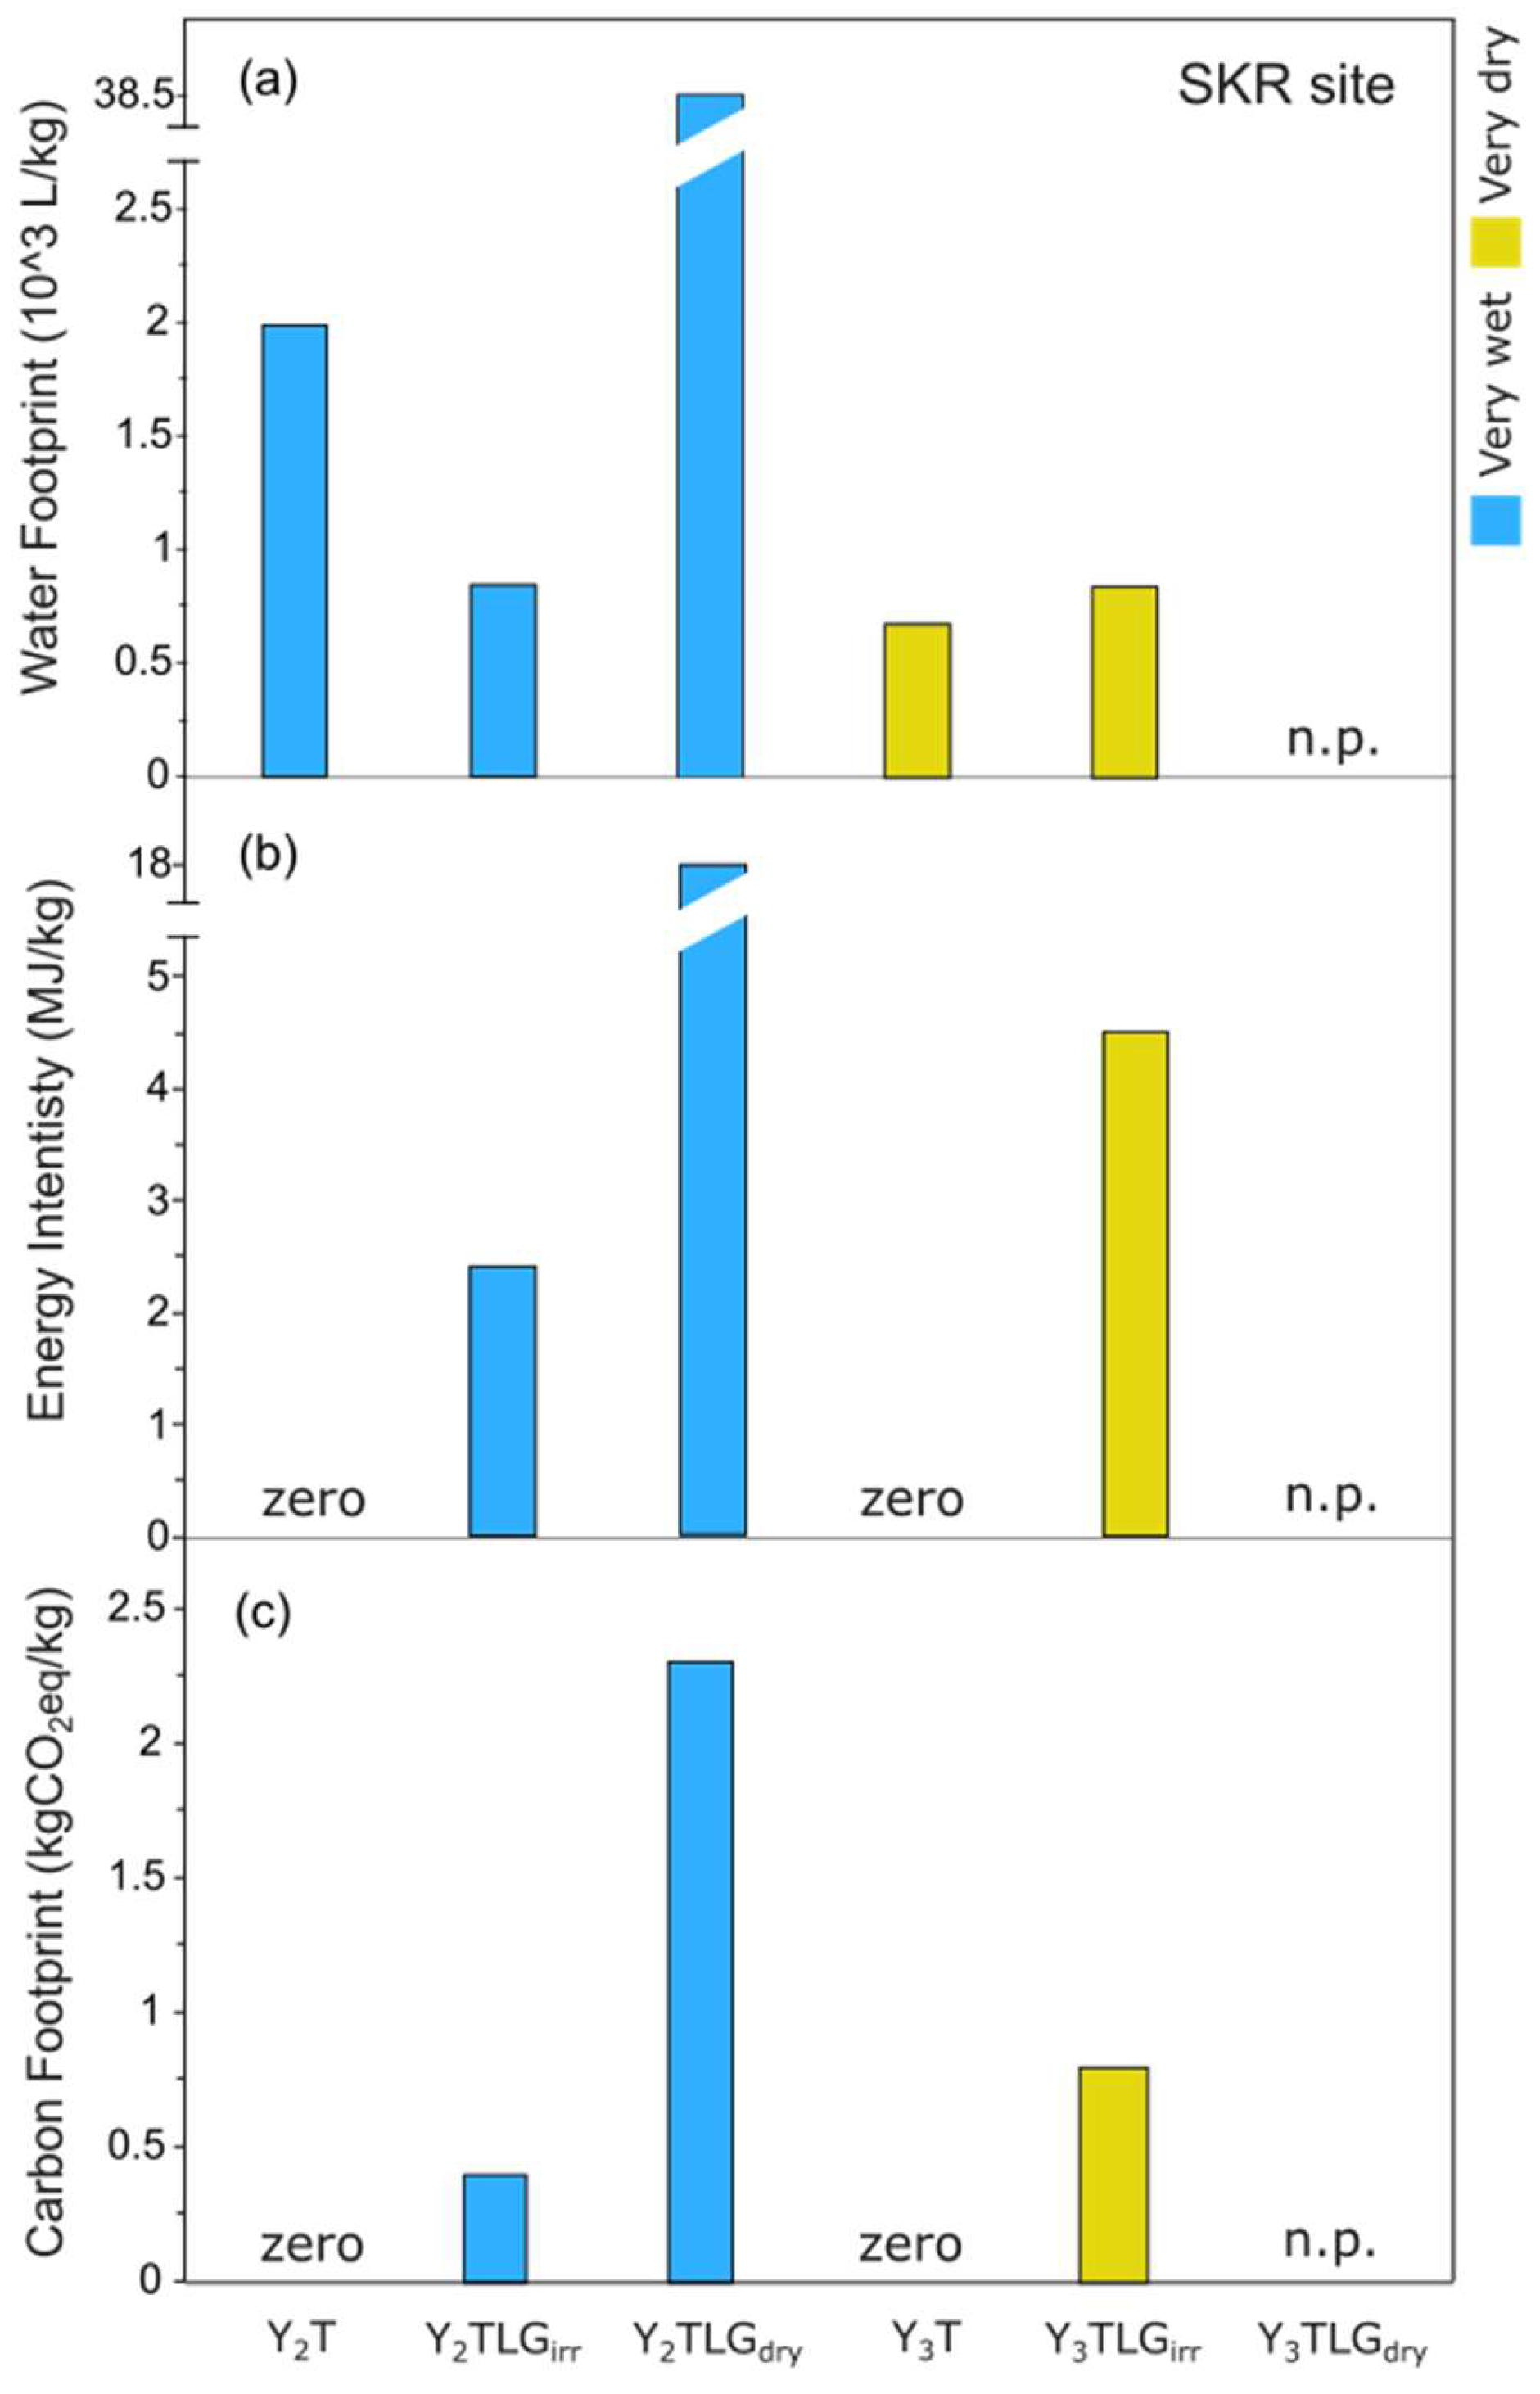
3.5. Environmental Performance Indicators of Carob Yield

For the WF, the values for Y2 were 2.0, 0.8 and 38.5 × 10³ L/kg carob pods for the treatments T, TLGirr and TLGdry (Figure 12a). The respective values for Y3 were 0.7 and 0.8 x 10³ L/kg carob pods for T and TLGirr. Regarding EI, the values for Y2 were 0, 2 and 18 MJ/kg carob pods for the treatments T, TLGirr and TLGdry (Figure 12b). The respective values of Y3 were 0 and 5 MJ/kg carob pods for T and TLGirr. The WF, EI and CF for TLGdry could not be determined for Y3, as there was no production (n.p.). Finally, the CF values for Y2 were 0, 0.4 and 2.3 kg CO2-eq/kg carob pods for the treatments T, TLGirr and TLGdry (Figure 12c). For Y3, these were 0 and 0.8 kg CO2-eq/kg carob pods for the treatments T and TLGirr. Note that in Y3, the T-System outperformed all other systems for all indicators evaluated.

4. Discussion

Although conservation tillage is often praised for its benefits compared to conventional plowing [64], it is still based on disrupting the soil structure, a practice that is far from sustainable when it comes to promoting soil health and to exploiting the ecosystem services of the soil food web [65]. More efficient nature-based farming solutions are currently available that can help conserve water and soil resources [6,31], enhance yields [19,26] and make better use of land overall [23]. Complementarity in resource use, and water and nutrient uptake are the foundations for the benefits in intercropping systems [66,67]. The alignment of root system traits, in both space and time, for intercropped species can be key in explaining how facilitation can outweigh competition [66], similarly to how plant facilitation in unmanaged dryland ecosystems is based on both root and canopy traits, which can be capable of combating desertification phenomena [68,69,70,71].
For promoting alternatives to soil tillage, we designed agroforestry systems based on perennial (thyme) and annual (clover) living mulch. They were established only on the sun-south-exposed soil side (SES) of carob trees and in only ca. 15% out of a total surface plot around each monitored tree. This would reduce any competition effects for soil water with the carob trees as much as possible, while providing soil cover that would reduce thermal stress and evaporation where it would be the highest around the tree (Figure 2 and Figure 3). Our systems would also promote wild vegetation establishment around the trees, which, if left unmanaged at least for a large part of the year, can contribute to increasing the systems’ biodiversity [72,73] compared to conservation tillage. Moreover, the more perennial cover from aromatic plants expands in the SES of carobs, the more reduced weed competition and increase in beneficial insects can be expected as shown for Mediterranean olive intercropped systems [22]. Finally, this approach minimizes the installation cost of the living mulch systems to encourage farmers/policymakers to adopt it.

4.1. The Drivers for the Greater Carob Tree Productivity in T-System Plots

Our findings are in line with our first hypothesis that in semi-arid low weed-competition conditions, as is the case for site SKR, the thyme intercropping system, strategically planted at the SES of carob trees (T-System), may reduce soil temperature/evaporation and retain higher levels of soil moisture during the dry season without putting too much competition pressure on carob trees. This may alleviate drought stress on carob trees and improve productivity compared to rainfed conservation tillage systems (TLGdry). However, this was not found to be the case for the clover living mulch system (C-System).
At site SKR, T. capitata at the SES of carob trees achieved very high thyme establishment rates (Table 2: TSR > 90%) due to less weed competition and a more favorable climate. This living mulch appears to have contributed towards significantly improving carob yield efficiency compared to TLGdry (Figure 5d, p < 0.05). Thyme biomass in SES plots surpassed 300 g/m2 in Y2, 400 g/m2 in Y3 and dominated plant–soil cover, achieving from 35% TSC in Y2 to more than 80% TSC in Y3 (Table 2). Using perennial species planted in high densities seems to be key for the significant improvement of soil properties and water content in intercropping systems under semi-arid rainfed conditions [31] which is in line with our findings.
However, in Y1 during the T-System’s establishment, the >40% soil cover was achieved mostly from wild vegetation (>25%) with the contribution of thyme at 15%. The dominant type of wild vegetation at site SKR in Y1 (above 10% plant population abundance; p. ab.) was composed of Avena sterilis subsp. ludoviciana with p. ab. of 33.3 % and presence in 63% of the sampled plots, Crepis foetida subsp. foetida with p. ab. of 18.1 % and presence in 50% of the sampled plots, followed by Lactuca serriola (p. ab. of 10.9 % and presence in 63% of the sampled plots) and Lolium perenne (p. ab. of 9.4 % and presence in 100% of the sampled plots; see [58] for details). Such plant species and abundances combined with T. capitata do not appear to have produced a negative effect on carob yields.
For T-System carob trees at site SKR, we recorded an improvement in carob yield efficiency by at least 27% and up to 71% compared to TLGdry control plots (based on the standard error range of yields, mean 47%; Figure 5d), when considering performance from all 3 years of monitoring. This coincided with a 12.5% higher carob wood production over the 3-year period (based on carob stem basal area change) compared to TLGdry (Figure 5e). However, in Y1 during the T-System’s establishment and in a very wet year, no significant yield increase was evident compared to TLGdry. The improvement occurred in Y2 and Y3 (Figure 9). To explain these results, it is critical to comprehend the phenology of carob pod production. It appears that in carob trees, flower induction occurs at the beginning of the dry season, while blooming and pollination take place towards its end, one year in advance of the carob pods’ harvesting year (Figure 2a). We consider that the water made available to the tree in the winter months before the dry season determines the number of flowers produced for fertilization thereafter. Thus, it can be related to the number of mature pods that can be harvested the next dry season. Considering though, that flower production and pollination remain relatively undisturbed by other environmental factors, the soil is well supplied in nutrients [74,75] and the hydrological year just before pod harvesting provides a minimum amount of soil moisture needed for pod elongation [74]. It appears that the above criteria are met in our experiments. Trees in our study were regularly supplied with manure, and extreme rainfall events did not occur during the dry season, whereas rainfall during the hydrological year coinciding with the year of harvest was above 300 mm (a threshold above which carob survival does not appear to be threatened). Thus, plenty of rainfall during the wet season of Y0, i.e., the year before experiments were initiated, would be expected to provide abundant flowering and the potential to produce a high carob yield during the harvest of Y1. This hypothesis is fully in line with our findings.
The very high yields of the Y1 (2020) harvest (Tables S2 and S3, Figure 9) can be explained by the very wet year of Y0 (on top of which irrigation also took place during the dry season). No difference was recorded between the T-System and TLGdry carob pod harvests in Y1. It coincided with no difference in leaf water potential between the two systems at the end of the dry season of Y0 (Figure 4). Considering the above carry-over effect, the Y2 harvest of 2021 is actually the first year’s harvest on which our experimental trials could have had an impact on productivity, by effecting the soil moisture of Y1. The significant improvement in carob leaf water content in T-System plots compared to those of TLGdry during the dry season of Y1 reflects the soil moisture conditions the trees experienced during the wet and dry season of Y1. It coincided with a significant carob yield efficiency increase by 0.256 kg/m3 (p < 0.05), on average, in Y2 for T-System plots compared to those of TLGdry (Table S3; Figure 9b). Soil cover at the SES of T-System plots was >40% during the dry season of Y1, when considering both thyme and the type of wild vegetation present at site SKR that produces low competition pressure, as mentioned above. Moreover, an improvement in carob leaf water content was recorded during the dry season of Y2 in T-System plots compared to those of TLGdry, at the end of a very dry hydrological year. It coincided with a higher carob yield efficiency by 0.331 kg/m3 on average in Y3 (Table S3 and Figure 9c). Soil cover at the SES of T-System plots was 55% during the dry season of Y2, when considering both thyme and the SKR site wild vegetation.
The above findings are in line with the significantly improved leaf water content during the dry season for trees growing under the effect of the T-System compared to TLGdry in Y3 at a TSC of > 80% (Figure 5). In Y3, the contribution of wild vegetation on plant–soil cover was negligible (ca. 2%); with T. capitata practically eliminating any competition from wild vegetation in site SKR conditions (Figure 3 and Figure 5c, Table 2). Therefore, it appears that T. capitata-based living mulch most likely has the potential to reduce the loss of soil moisture due to evaporation during the dry season, which the carob trees can benefit from.
T. capitata in its mature life form develops into a typical dryland cushion plant. The ability of cushion plants to buffer ecological extremes is a well-known ecological principal [76,77,78,79]. In an alley cropping experiment of thyme and almond trees conducted under rainfed Mediterranean conditions, thyme plants contributed to a significant increase in soil moisture compared to tillage application [31]. In our case, thyme-based living mulch measured within the dry season of Y3 displayed its ability to significantly reduce the plots’ midday thermal stress by 15% (−9 °C) and improve soil moisture content by 18%, compared to TLGdry (Figure 10a and c, p < 0.001). Except from any cooling produced from the evaporation of essential oils (water transpiration being less likely due to leaf stomata closing in mid-day or leaf desiccation in summer) [80], the reflectance of solar radiation by stems/brown leaves and the shading of soils appears to be the most likely mechanism that protects soil from extreme heat stress in summertime. This in turn most likely leads to less evaporative forcing on soil, explaining its significantly higher soil moisture content in the dry season compared to TLGdry soil. The T-System’s performance could even be compared with that of irrigated conservation tillage plots (TLGirr). In Y2, yield efficiency for the T-System equaled almost a third of the yield of TLGirr (Table S3: 2021—Yield efficiency = 0.26 kg/m3, TLGirr = 0.91 kg/m3). As the T-System’s soil cover became further established, yield efficiency of T-System carob trees in Y3 was more than 50% of that provided by TLGirr plots (Table S3: 2022—Yield efficiency: T = 0.33 kg/m3, TLGirr = 0.58 kg/m3).
However, the above effect may become even stronger as the thyme canopy further closes up, permitting more efficient soil shading, while acting as an excellent means to control weeds [19]. Our preliminary analysis of comparing soil temperature on thyme canopies vs. bare soil between thyme rows, indicated surface temperatures that were lower 22% on thyme rows (40.3 °C median), compared to the 51.4 °C (median) recorded on the bare soil surface in between rows at site SKR in July 2022 (Table S4 and Figure S4), which is a significant difference of 11.1 °C (p < 0.05). At site VRY, these differences were even greater with 30% lower surface temperatures (45.3 °C median) monitored on the surface of thyme plants compared to the 64.7 °C (median) recorded on bare soil in between thyme rows, which is a recorded difference of 19.4 °C (p < 0.05; Table S4). Thus, as the canopy of the aromatic living mulch grows, its ability to mitigate soil temperature extremes should increase [81,82].
In terms of explaining wood production, one needs to consider that the rooting strategy of carob permits the uptake of water from deep soil layers ([83,84] and references therein). Deep moisture pools may be supplied by long integration periods of rainfall, even those of multiple years, as is the case for other tree species of the same climate zone (e.g., pines; [85,86]). One of the first dendroclimatological analyses ever performed on carob tree rings was conducted in Cyprus based on trees from sites SKR and VRY [87]. It indicated that although annual rainfall could explain part of tree growth variability in site SKR, a significant effect of accumulated precipitation of four consecutive years, before and including the year of tree growth, could also be found in trees of both sites. Thus, apart from annual or inter-annual precipitation [88], it could be that multiple years of past rainfall [89,90,91] may also influence carob productivity. This may explain why the tree growth increase observed at site SKR was not as great as the carob yield efficiency for our 3-year monitoring period; with a 4th monitoring year likely needed to capture the full effect of our experiments on carob tree growth. It could also be the case that the T-System carob trees first invest in fruit productivity, and thus fewer resources may be allocated for simultaneous wood growth. Research conducted on carobs by von Haselberg [92] demonstrated that increased fruit yield came at a cost for vegetative growth. Specifically, during years of heavy fruit bearing (“on” years), trunk growth was significantly lower compared to years of light carob yield (“off” years). It is not yet well known how extended periods of drought impact carob yields [74]. Results of a recent review on carob tree publications of the last 40 years indicate the need for further research on the correlation between carob yield and climate [48].
Carob’s alternate bearing is a known phenomenon [62,93]. However, our results do not appear to be determined by it primarily. After a heavy fruit-baring year (Y1: “on” year), we would expect yields to decline (Y2: “off” year) and then increase again during the third monitoring period (Y3). Despite Y1 being a heavy yield year for TLGdry plots, their yields for the following two years approached zero. These results are in line with the significant reduction in SES soil moisture and leaf water content in TLGdry plots compared to our living mulch experiments (Figure 5, Figure 6 and Figure 10). More specifically, the significant difference recorded in yield efficiency between the T-System and TLGdry control plots in Y2 could be attributed to T-System plots being in “on” and TLGdry plots being in “off” statuses (Figure 9b and Table S3). If that would have been the case though, we would expect TLGdry control plots to have an “on” year in Y3—something we did not note (Figure 9c and Table S3). Therefore, although carob yield has been mostly explained by the status of the trees’ alternate bearing [94], environmental stress, such as intense drought stress, can also significantly reduce carob fruit yield [93]. In our case, water availability seems to be the limiting factor for carob productivity. When irrigating conservation tillage plots (TLGirr), carobs at site SKR were able to maintain a relatively stable yield efficiency through fluctuating climatic conditions (Table S3: Yield efficiency: Y1 = 0.93 kg/m3, Y2 = 0.92 kg/m3, Y3 = 0.58 kg/m3). Hence, under specific conditions, out of which the lack of water and nutrient uptake are key, the status of the tree’s alternate bearing can have a weaker effect on carob yield [93].
Our second hypothesis was that the T-System may perform better than the C-System, due to the thyme plants’ capacity to consume less water, while providing SES cover all year round, thus lowering evapotranspiration rates compared to the C-System. Although the T-System did outperform the C-System in terms of improving leaf water content and carob tree yield efficiency, the handicap of the C-System does not appear to be the high competition for water with the carob tree. In fact, the SES plot covers a small surface for such potential effects to become evident. It is more likely that the C-System’s handicap is related to its high dependence on soil moisture in order for it to produce enough biomass/soil cover to efficiently protect soil from high thermal stress and evaporation. In this sense, the perennial T-System with its all-year capacity to provide soil cover has the advantage.
More specifically, carobs of the CCC version of the C-System at the SKR site retained more leaf water during the dry season compared to TLGdry only during the normal climate year (Y3) (Figure 4 and Figure 6c). Competition for water between the carob and clover does not appear to be a problem, since in Y3 the highest clover biomass (CB) and clover–weed biomass (CWB) were observed (>180 g/m2 for CB and >320 g/m2 for CWB; Table 2). The 3-year cumulative effect led to greater carob yields compared to rainfed conservation tillage plots, but the difference was not significant (Figure 6d). No significant improvement in carob yield efficiency for the C-System could be found in Y2 nor in Y3 (Figure 9), while no increase in carob wood production could be identified (Figure 6d). Hence, T. squarosum failed to propagate autonomously and create living mulch in all climate conditions tested, while adding dry clover mulch to compensate for this deficiency did not improve carob leaf water content during Y2, the driest of the years tested. It could be a theme of further investigation if other, more drought-adapted clovers or legumes, particularly perennial ones, could perform better in order for the carobs or other dryland tree crop systems to be able to benefit from the legumes’ nitrogen fixing capacity [95,96].
Our third hypothesis was that in arid, high weed-competition conditions of site VRY, we expected higher evapotranspiration and lower SES establishment rates for the T- and the C-Systems due to weed competition. This in turn may not benefit soil moisture availability for carob, leading to reduced tree productivity compared to conservation tillage. Although both systems’ establishment was poor (Table 2 and Figure 3), carob leaf water content did not appear to be significantly affected (Figure 7 and Figure 8) at 25% SES soil cover and 45 g/m2 T. capitata biomass nor at 7% clover abundance (Y3). No negative impacts on carob productivity could also be identified. Overall, our interventions cannot be considered as detrimental for carob systems even in arid conditions when it comes to somewhat improving the systems’ biodiversity or in providing some biologically fixed nitrogen to the carob trees. The coexistence of trifolium and unmanaged wild vegetation in the plots improves biodiversity indices compared to conservation plowed plots [97,98]. Moreover, low weed-competition conditions seem to be key for the successful establishment of a rainfed carob–thyme intercropping system [58].
There is evidence to suggest that the stress gradient hypothesis is not only limited to natural ecosystems, but also applies to agroecosystems [99], proposing that the benefits of intercropping can be further accentuated under conditions of environmental stress [100,101,102]. When comparing intercropped to monoculture systems under equal nutrient inputs, the first achieved higher resource use efficiency and yields—almost 50% more [99]. The difference, though, significantly declines as inputs become more abundant. Intercropping seems to become even more critical under water-stressed conditions [101]. In a water-limited environment, an intercropped system was able to improve productivity by more than 90% compared to monoculture. In the case, though there was high water availability, the same study identified only a 14% improvement in the intercropped system yields in comparison to monoculture [102].

4.2. Overall Yield and Environmental Performance

We hypothesized that the T-System may outperform TLG systems in terms of environmental performance, while securing satisfactory yields, as a low-input nature-based solution for the adaptation of dryland agroforestry to climatic change. Our results fully support our original hypothesis. The productivity of rainfed carobs can range between 6000 and 7400 kg/ha under arid and semi-arid conditions [93] with as low as 400 kg/ha in drier sites [92]. Average carob pod yield efficiency in a four-year experiment conducted in rainfed carobs in Portugal under soil tillage management ranged between 0.20 and 0.54 kg of pods per m3 of canopy with less than 0.13 kg/m3 recorded in the site with the lowest annual rainfall [92]. In Y2, yield efficiency for the T-System at site SKR was 0.26 kg/m3 and increased to 0.33 kg/m3 in Y3 (Table S3), which is very well within the range or even above the performance of the tillage system reported above.
However, it is the environmental performance indicators of the carob production system that reveal the distinct profiles for each treatment. For the water footprint (WF) calculated considering both rainwater and irrigation, the TLGdry treatment demonstrated great water waste during the harvest of Y2, with yield efficiency as low as <0.01 kg/m2 (Figure 12a). The following year, the T-System’s yield efficiency was the greatest, while TLGdry had no production at all (Table S3). Therefore, for the latter, the WF could not be determined (Figure 12). WF data for carob trees are scarce. Yet, the WF values observed in this study for the T-System were lower than those presented in [103] for rainfed olive trees in Apulia, Italy. For energy efficiency (EI), the T-System consumed zero energy for its operation (Figure 12b), since no tillage and irrigation were applied, and the same was observed for its carbon footprint (CF), measuring zero (Figure 12c). Nonetheless as the T-System has the potential to capture and store carbon in the soil, its long term carbon footprint is most likely to be negative [31].
The range of EI reported for grapes (2.5–4.2 MJ/kg) [104] is similar to that observed for TLGirr, while the CF estimated for carob pods in the case of TLGirr is comparable with the values estimated for indigenous grape varieties in Cyprus [104]. The TLGdry treatment had the highest CF and EI values (Figure 12b,c), indicating a non-sustainable management system characterized by inputs but practically no yield under our experimental testing. Overall, our results highlight a clear trade-off between environmental impacts and yield stability. While irrigation increases water, energy, and carbon inputs, it supports more consistent productivity. However, irrigation water is in short supply in Cyprus as it is in dryland regions of the Mediterranean and beyond, comprising a significant limiting factor for carob production.
Hence, the intercropping strategy provided by the T-System should be further investigated for its promising performance in optimizing soil management and irrigation inputs, and balancing resource efficiency with yield stability, parameters which are critical for sustainable carob and similar crop (e.g., olive) production in drylands under climate change.

5. Conclusions

Among the intercropping systems evaluated, the T-system clearly outperformed conservation tillage and provided better results compared to the C-system. However, both the thyme- and the clover-based systems require further investigation.
Clovers or other legumes that are better adapted to drought compared to T. squarosum, particularly perennial ones, could be tested as living mulches, within the SES plot approach, as their nitrogen fixing capacity is a valuable trait for the soil fertilization of tree crops. On the other hand, Thymbra capitata’s T-System appears as a more “mature” nature-based solution for dryland agroforestry. The fact that the T-System was strategically established only on the sun-south-exposed soil side of carob trees and in only ca. 15% out of a total surface plot around each monitored tree permits farmers to easily apply it as (1) a buffer against high thermal stress on soils in summertime under semi-arid low weed-competition conditions, to reduce soil evaporation and retain higher levels of soil moisture during the dry season, which tree productivity can benefit from; (2) an additional crop, with potential to increase both the agroecosystems’ biodiversity, above and below the ground, the ecosystem services it provides, and farmer income via herb and honeybee production; and (3) a means to reduce irrigation and energy inputs, while increasing soil organic matter, potentially contributing to carbon farming.
Hence, the intercropping strategy provided by the T-System can be readily upscaled for further investigation based on its promising performance in optimizing soil management and irrigation inputs, and balancing resource efficiency with yield stability, parameters which are critical for sustainable carob and similar crop (e.g., olive) production, combating desertification in drylands under climate change.

Supplementary Materials

The following supporting information can be downloaded at: https://www.mdpi.com/article/10.3390/agronomy15071560/s1: Figure S1: Development of experiment for C-System plots throughout the three-year monitoring period; Figure S2: Carob tree phenology in reference to the wet and dry season of Cyprus; Figure S3: Example of the SES of carob trees’ surface temperature measurement using FLIR thermal camera imaging in SKR plots; Figure S4: (a) Infrared spectrum image of thyme rows; Figure S5: (a) Leaf water potential difference ΔΨ between the beginning (i) and the end of the dry season (ii) (ΔΨ = Ψii − Ψi) for carob tree CCW plots at site SKR of Y3; Figure S6: Monitored surface temperature at the SES of carob trees; Table S1: Data used for the calculations related to the CF, WF and EI for the experiment in SKR; Table S2. Annual carob yield efficiency (kg/m3) for all experimental treatments (T, CCC, CCW and TLGdry) during the 3 years of monitoring (2020–2022) at the SKR site; Table S3: Annual carob yield (kg) and yield efficiency (kg/m3) for irrigated conservation tillage carob trees; Table S4: Surface temperature (Temp, °C) for ca. 3-year-old thyme plants and for soil between thyme rows towards the end of a normal wet (SKR) and a very dry (VRY) hydrological year.

Author Contributions

Conceptualization, D.S.; methodology, D.S. and S.M.; software, S.M.; formal analysis, D.S., S.M. and V.L.; investigation, D.S. and S.M.; writing—original draft preparation, D.S. and S.M.; writing—review and editing, D.S., S.M. and V.L.; visualization, D.S. and S.M.; supervision, D.S.; project administration, D.S. and S.M.; funding acquisition, D.S. All authors have read and agreed to the published version of the manuscript.

Funding

This research was co-funded by the European Regional Development Fund and the Republic of Cyprus through the Cyprus Research and Innovation Foundation (Project: BlackGold INTEGRATED/0916/0019).

Data Availability Statement

The data set is available on request from the authors.

Acknowledgments

We would like to thank the post- and undergraduate students of the Department of Biological Sciences (UCY) for their contribution, namely A. Economou, E. Hadjispyrou, V. Hajjar; M. Konstantinou, S. Kyriakidou, L. Markou, C. Pavlou, and M. Pieri. We also thank S. Sfenthourakis (UCY) for logistic support, and are immensely grateful to K. Kyratzis for offering his carob plantations and for supporting this work.

Conflicts of Interest

Author Vassilis Litskas was employed by the company V.L. Sustainability Metrics Ltd. The remaining authors declare that the research was conducted in the absence of anycommercial or financial relationships that could be construed as a potential conflict ofinterest. The authors declare that this study received funding from European Regional DevelopmentFund and the Republic of Cyprus through the Cyprus Research and innovation Foundation(BlackGold INTEGRATED/0916/0019). The funder was not involved in the study design, collection, analysis, interpretation of data, the writing of this article or the decision to submit it for publication.

Abbreviations

The following key abbreviations are used in this manuscript:
CBClover biomass
CCCC-system with clover-based living mulch in 3 out of 3 years of monitoring
CCWC-system with clover-based living mulch in 2 out of 3 years of monitoring
CFCarbon Footprint
CRClover to clover plus weeds ratio
C-systemClover (Trifolium squarossum)-based intercropping system with carob trees
CWBClover-and-weed biomass
CWSCSoil cover by clover and wild vegetation
EIEnergy Intensity
SESSouth (sun)-exposed soil side of carob trees
SKRSkarinou site
TBThyme biomass
TLGdryConservation tillage carob trees without irrigation (control)
TLGirrConservation tillage carob trees with irrigation
TSCSoil cover only by thyme
TSRThyme survival rate
T-SystemThyme (Thymbra capitata)-based intercropping system with carob trees
TWSCSoil cover by thyme and wild vegetation
VRYVrysoulles site
WFWater Footprint

References

  1. Berdugo, M.; Delgado-Baquerizo, M.; Soliveres, S.; Hernández-Clemente, R.; Zhao, Y.; Gaitán, J.J.; Gross, N.; Saiz, H.; Maire, V.; Lehman, A.; et al. Global ecosystem thresholds driven by aridity. Science 2020, 367, 787–790. [Google Scholar] [CrossRef] [PubMed]
  2. Huang, J.; Yu, H.; Guan, X.; Wang, G.; Guo, R. Accelerated dryland expansion under climate change. Nat. Clim. Change 2015, 6, 166–171. [Google Scholar] [CrossRef]
  3. IUCN. Drylands and climate change. Issues Brief. International Union for Conservation of Nature and Natural Resources. Available online: https://www.iucn.org/resources/issues-brief/drylands-and-climate-change (accessed on 5 February 2025).
  4. Aguilera, E.; Díaz-Gaona, C.; García-Laureano, R.; Reyes-Palomo, C.; Guzmán, G.I.; Ortolani, L.; Sánchez-Rodríguez, M.; Rodríguez-Estévez, V. Agroecology for adaptation to climate change and resource depletion in the Mediterranean region. A review. Agric. Syst. 2020, 181, 102809. [Google Scholar] [CrossRef]
  5. Azzopardi, B.; Balzan, M.V.; Cherif, S.; Doblas-Miranda, E.; dos Santos, M.; Dobrinski, P.; Falder, M.; Hassoun, A.E.R.; Giupponi, C.; Koubi, V.V.; et al. Climate and Environmental Change in the Mediterranean Basin–Current Situation and Risks for the Future. First Mediterranean Assessment Report. 2020. Available online: https://www.medecc.org/medecc-reports/climate-and-environmental-change-in-the-mediterranean-basin-current-situation-and-risks-for-the-future-1st-mediterranean-assessment-report/ (accessed on 5 February 2025).
  6. Merino, A.; Doni, S.; Evelpidou, N.; Ferreira, T.; García-Arias, A.I.; Masciandaro, G.; Rodríguez-González, P.M. Best Practices in Evaluation and Restoration of Degraded Mediterranean Environments; London Library: London, UK, 2019; p. 327. [Google Scholar]
  7. Palm, C.; Blanco-Canqui, H.; DeClerck, F.; Gatere, L.; Grace, P. Conservation agriculture and ecosystem services: An overview. Agric. Ecosyst. Environ. 2014, 187, 87–105. [Google Scholar] [CrossRef]
  8. Wittwer, R.A.; Dorn, B.; Jossi, W.; Van Der Heijden, M.G.A. Cover crops support ecological intensification of arable cropping systems. Sci. Rep. 2017, 7, 41911. [Google Scholar] [CrossRef]
  9. Iseman, T.; Miralles-Wilhelm, F. Nature-Based Solutions in Agriculture: The Case and Pathway for Adoption; Food & Agriculture Organization: Rome, Italy, 2021. [Google Scholar]
  10. Almagro, M.; de Vente, J.; Boix-Fayos, C.; García-Franco, N.; Melgares de Aguilar, J.; González, D.; Solé-Benet, A.; Martínez-Mena, M. Sustainable land management practices as providers of several ecosystem services under rainfed Mediterranean agroecosystems. Mitig. Adapt. Strateg. Glob. Change 2016, 21, 1029–1043. [Google Scholar] [CrossRef]
  11. Lee, H.; Lautenbach, S.; Nieto, A.P.G.; Bondeau, A.; Cramer, W.; Geijzendorffer, I.R. The impact of conservation farming practices on Mediterranean agro-ecosystem services provisioning—A meta-analysis. Reg. Environ. Change 2019, 19, 2187–2202. [Google Scholar] [CrossRef]
  12. McLennon, E.; Dari, B.; Jha, G.; Sihi, D.; Kankarla, V. Regenerative agriculture and integrative permaculture for sustainable and technology driven global food production and security. Agron. J. 2021, 113, 4541–4559. [Google Scholar] [CrossRef]
  13. Rehman, S.; Ijaz, S.S.; Din, A.M.U.; Al-Dosary, M.A.; Ansar, M.; Fatima, S.; Siddiqa, A.; Ashraf, M.N.; Haider, I.; Junaid, M.B.; et al. Combined Effects of Reduced Tillage and Strip Intercropping on Soil Carbon Sequestration in Semi-Arid Environment. J. Soil Sci. Plant Nutr. 2025, 25, 3124–3139. [Google Scholar] [CrossRef]
  14. Mrunalini, K.; Behera, B.; Jayaraman, S.; Abhilash, P.C.; Dubey, P.K.; Swamy, G.N.; Prasad, J.V.N.S.; Rao, K.V.; Krishnan, P.; Pratibha, G.; et al. Nature-based solutions in soil restoration for improving agricultural productivity. Land Degrad. Dev. 2022, 33, 1269–1289. [Google Scholar] [CrossRef]
  15. Conti, J.; Cummins, N.; Gentry, B. Strategies for Operationalizing Nature-Based Solutions in the Private Sector. The Nature Conservancy Business Council-Natural Infrastructure Working Group 2019. (Whitepaper). Available online: https://www.preventionweb.net/publication/strategies-operationalizing-nature-based-solutions-private-sector (accessed on 5 February 2025).
  16. Lv, W.; Zhao, X.; Wu, P.; Lv, J.; He, H. A scientometric analysis of worldwide intercropping research based on web of science database between 1992 and 2020. Sustainability 2021, 13, 2430. [Google Scholar] [CrossRef]
  17. Maitra, S.; Hossain, A.; Brestic, M.; Skalicky, M.; Ondrisik, P.; Gitari, H.; Brahmachari, K.; Shankar, T.; Bhadra, P.; Palai, J.B.; et al. Intercropping—A low input agricultural strategy for food and environmental security. Agronomy 2021, 11, 343. [Google Scholar] [CrossRef]
  18. Gu, C.; Bastiaans, L.; Anten, N.P.R.; Makowski, D.; van der Werf, W. Annual intercropping suppresses weeds: A meta-analysis. Agric. Ecosyst. Environ. 2021, 322, 107658. [Google Scholar] [CrossRef]
  19. Marotti, I.; Whittaker, A.; Bağdat, R.B.; Akin, P.A.; Ergün, N.; Dinelli, G. Intercropping Perennial Fruit Trees and Annual Field Crops with Aromatic and Medicinal Plants (MAPs) in the Mediterranean Basin. Sustainability 2023, 15, 12054. [Google Scholar] [CrossRef]
  20. Restuccia, A.; Scavo, A.; Lombardo, S.; Pandino, G.; Fontanazza, S.; Anastasi, U.; Abbate, C.; Mauromicale, G. Long-term effect of cover crops on species abundance and diversity of weed flora. Plants 2020, 9, 1506. [Google Scholar] [CrossRef]
  21. Tziolas, E.; Ispikoudis, S.; Mantzanas, K.; Koutsoulis, D.; Pantera, A. Economic and Environmental Assessment of Olive Agroforestry Practices in Northern Greece. Agriculture 2022, 12, 851. [Google Scholar] [CrossRef]
  22. Casas, G.L.; Ciaccia, C.; Iovino, V.; Ferlito, F.; Torrisi, B.; Lodolini, E.M.; Giuffrida, A.; Catania, R.; Nicolosi, E.; Bella, S. Effects of Different Inter-Row Soil Management and Intra-Row Living Mulch on Spontaneous Flora, Beneficial Insects, and Growth of Young Olive Trees in Southern Italy. Plants 2022, 11, 545. [Google Scholar] [CrossRef]
  23. Li, C.; Stomph, T.J.; Makowski, D.; Li, H.; Zhang, C.; Zhang, F.; Van der Werf, W. The productive performance of intercropping. Proc. Natl. Acad. Sci. USA 2023, 120, e2201886120. [Google Scholar] [CrossRef]
  24. Li, C.; Hoffland, E.; Kuyper, T.W.; Yu, Y.; Zhang, C.; Li, H.; Zhang, F.; van der Werf, W. Syndromes of production in intercropping impact yield gains. Nat. Plants. 2020, 6, 653–660. [Google Scholar] [CrossRef]
  25. Tamburini, G.; Bommarco, R.; Wanger, T.C.; Kremen, C.; van der Heijden, M.G.A.; Liebman, M.; Hallin, S. Agricultural diversification promotes multiple ecosystem services without compromising yield. Sci. Adv. 2020, 6, 45. [Google Scholar] [CrossRef]
  26. Kebede, E. Contribution, Utilization, and Improvement of Legumes-Driven Biological Nitrogen Fixation in Agricultural Systems. Front. Sustain. Food Syst. 2021, 5, 767998. [Google Scholar] [CrossRef]
  27. Ranaldo, M.; Carlesi, S.; Costanzo, A.; Bàrberi, P. Functional diversity of cover crop mixtures enhances biomass yield and weed suppression in a Mediterranean agroecosystem. Weed Res. 2020, 60, 96–108. [Google Scholar] [CrossRef]
  28. Chehade, L.; Antichi, D.; Frasconi, C.; Sbrana, M.; Tramacere, L.G.; Mazzoncini, M.; Peruzzi, A. Legume Cover Crop Alleviates the Negative Impact of No-Till on Tomato Productivity in a Mediterranean Organic Cropping System. Agronomy 2023, 13, 2027. [Google Scholar] [CrossRef]
  29. Morugán-Coronado, A.; Linares, C.; Gómez-López, M.D.; Faz, Á.; Zornoza, R. The impact of intercropping, tillage and fertilizer type on soil and crop yield in fruit orchards under Mediterranean conditions: A meta-analysis of field studies. Agric. Syst. 2020, 178, 102736. [Google Scholar] [CrossRef]
  30. Zhang, Y.; Han, M.; Song, M.; Tian, J.; Song, B.; Hu, Y.; Zhang, J.; Yao, Y. Intercropping With Aromatic Plants Increased the Soil Organic Matter Content and Changed the Microbial Community in a Pear Orchard. Front. Microbiol. 2021, 12, 616932. [Google Scholar] [CrossRef]
  31. Sánchez-Navarro, V.; Shahrokh, V.; Martínez-Martínez, S.; Acosta, J.A.; Almagro, M.; Martínez-Mena, M.; Boix-Fayos, C.; Díaz-Pereira, E.; Zornoza, R. Perennial alley cropping contributes to decrease soil CO2 and N2O emissions and increase soil carbon sequestration in a Mediterranean almond orchard. Sci. Total Environ. 2022, 845, 157225. [Google Scholar] [CrossRef]
  32. Rao, S.G.R.; Radhika, R.M. Prospects for sustainable cultivation of medicinal and aromatic plants in India. In Sustainable Uses and Prospects of Medicinal Plants; CRC Press: Boca Raton, FL, USA, 2023; pp. 227–243. [Google Scholar]
  33. Rao, M.R.; Palada, M.C.; Becker, B.N. Medicinal and aromatic plants in agroforestry systems. In New Vistas in Agroforestry. Advances in Agroforestry: A Compendium for 1st World Congress of Agroforestry; Springer: Dordrecht, The Netherlands, 2004; Volume 1, pp. 107–122. [Google Scholar]
  34. Steenwerth, K.; Guerra, B. Influence of floor management technique on grapevine growth, disease pressure, and juice and wine composition: A review. Am. J. Enol. Vitic. 2012, 63, 149–164. [Google Scholar] [CrossRef]
  35. Montemurro, F.; Persiani, A.; Diacono, M. Cover crop as living mulch: Effects on energy flows in mediterranean organic cropping systems. Agronomy 2020, 10, 667. [Google Scholar] [CrossRef]
  36. Markou, M.; Moraiti, C.A.; Stylianou, A. Addressing Climate Change Impacts on Agriculture: Adaptation Measures For Six Crops in Cyprus. Atmosphere 2020, 11, 483. [Google Scholar] [CrossRef]
  37. Angon, P.B.; Anjum, N.; Akter, M.M.; Kc, S.; Suma, R.P.; Jannat, S. An Overview of the Impact of Tillage and Cropping Systems on Soil Health in Agricultural Practices. Adv. Agric. 2023, 2023, 861216. [Google Scholar] [CrossRef]
  38. Rusu, T. Energy efficiency and soil conservation in conventional, minimum tillage and no-tillage. Int. Soil Water Conserv. Res. 2014, 2, 42–49. [Google Scholar] [CrossRef]
  39. Reicosky, D.C. Conservation tillage is not conservation agriculture. J. Soil Water Conserv. 2015, 70, 103–108. [Google Scholar] [CrossRef]
  40. Chauhan, B.S.; Singh, R.G.; Mahajan, G. Ecology and management of weeds under conservation agriculture: A review. Crop Prot. 2012, 38, 57–65. [Google Scholar] [CrossRef]
  41. Battle, I.; Tous, J. Carob tree Ceratonia siliqua L. In Promoting the Conservation and Use of Underutilized and Neglected Crops; Leibniz Institute of Plant Genetics and Crop Plant Research: Gatersleben, Germany, 1997. [Google Scholar]
  42. Palaiogianni, A.; Stylianou, M.; Sarris, D.; Agapiou, A. Carob-agro-industrial waste and potential uses in the circular economy. In Mediterranean Fruits Bio-Wastes: Chemistry, Functionality and Technological Applications; Springer International Publishing: Berlin/Heidelberg, Germany, 2022; pp. 765–797. [Google Scholar]
  43. Goulas, V.; Stylos, E.; Chatziathanasiadou, M.V.; Mavromoustakos, T.; Tzakos, A.G. Functional components of carob fruit: Linking the chemical and biological space. Int. J. Mol. Sci. 2016, 17, 1875. [Google Scholar] [CrossRef]
  44. Stavrou, I.J.; Christou, A.; Kapnissi-Christodoulou, C.P. Polyphenols in carobs: A review on their composition, antioxidant capacity and cytotoxic effects, and health impact. Food Chem. 2018, 269, 355–374. [Google Scholar] [CrossRef]
  45. Flintan, F. Participatory rangeland management-an enabling process for improving silvopastoral management and governance. In Grazing with Trees; Haddad, F.F., Herrera, P.M., Besbes, B., Eds.; FAO: Rome, Italy, 2022. [Google Scholar]
  46. Valdecantos, A.; Vallejo, V.R.; Baeza, J.; Bautista, S.; Boeschoten, M.; Christoforou, M.; Daliakopoulos, I.N.; González-Pelayo, O.; Guixot, L.; Keizer, J.J.; et al. Report on the Restoration Potential for Preventing and Reversing Regime Shifts. 2016. Available online: https://research.wur.nl/en/publications/report-on-the-restoration-potential-for-preventing-and-reversing- (accessed on 5 February 2025).
  47. Diamond, N.K. An Agroforestry System for Semi-Arid Mediterranean Areas and Its Potential for Technology Transfer. Ph.D. Thesis, California Polytechnic State University, San Luis Obispo, CA, USA, 1988. [Google Scholar]
  48. Martins-Loução, M.A.; Correia, P.J.; Romano, A. Carob: A Mediterranean Resource for the Future. Plants 2024, 13, 1188. [Google Scholar] [CrossRef]
  49. Qin, J.; Duan, W.; Zou, S.; Chen, Y.; Huang, W.; Rosa, L. Global energy use and carbon emissions from irrigated agriculture. Nat. Commun. 2024, 15, 3084. [Google Scholar] [CrossRef]
  50. Karimi, F.; Ghahderijani, M.; Bakhoda, H. Optimizing cropping patterns and resource allocation for sustainable agricultural development: A case study of Ilam province. Iran. Environ. Sustain. Indic. 2024, 23, 100464. [Google Scholar] [CrossRef]
  51. Litskas, V.D.; Chrysargyris, A.; Tzortzakis, N.; Stavrinides, M.C.; Petropoulos, S.A. Can the commercial cultivation of wild edible species contribute to sustainable food production? A case study of golden thistle (Scolymus hispanicus L.). Int. J. Life Cycle Assess. 2025, 30, 446–461. [Google Scholar] [CrossRef]
  52. Moradi, P.; Ford-Lloyd, B.; Pritchard, J. Plant-water responses of different medicinal plant thyme (Thymus spp.) species to drought stress condition. Aust. J. Crop Sci. 2014, 8, 666–673. [Google Scholar]
  53. Cordovilla, M.P.; Bueno, M.; Aparicio, C.; Urrestarazu, M. Effects of Salinity and the Interaction Between Thymus Vulgaris and Lavandula Angustifolia on Growth, Ethylene Production and Essential Oil Contents. J. Plant Nutr. 2014, 37, 875–888. [Google Scholar] [CrossRef]
  54. Martínez-Mena, M.; Boix-Fayos, C.; Carrillo-López, E.; Díaz-Pereira, E.; Zornoza, R.; Sánchez-Navarro, V.; Acosta, J.A.; Martínez-Martínez, S.; Almagro, M. Short-term impact of crop diversification on soil carbon fluxes and balance in rainfed and irrigated woody cropping systems under semiarid Mediterranean conditions. Plant Soil 2021, 467, 499–514. [Google Scholar] [CrossRef]
  55. Almagro, M.; Díaz-Pereira, E.; Boix-Fayos, C.; Zornoza, R.; Sánchez-Navarro, V.; Re, P.; Fernández, C.; Martínez-Mena, M. The combination of crop diversification and no tillage enhances key soil quality parameters related to soil functioning without compromising crop yields in a low-input rainfed almond orchard under semiarid Mediterranean conditions. Agric. Ecosyst. Environ. 2023, 345, 108320. [Google Scholar] [CrossRef]
  56. Durán Zuazo, V.H.; Pleguezuelo, C.R.R.; Francia Martínez, J.R.; Martínez Raya, A.; Arroyo Panadero, L.; Càrceles Rodríguez, B.; Navarro Moll, M.C. Benefits of plant strips for sustainable mountain agriculture. Agron. Sustain. Dev. 2008, 28, 497–505. [Google Scholar] [CrossRef]
  57. IACO. Consultation Services for the Production of a National Action Plan to Combat Desertification in Cyprus—Contract No. 3/2007—Environment Service Executive Summary; I.A.CO Ltd.: Strovolos, Nicosia, Cyprus, 2007. [Google Scholar]
  58. Matsi, S.; Sarris, D.; Konstantinou, M. Effects of Climate and Weeds on the Establishment of Thyme-Based Living Mulch Systems in Drylands of Cyprus. Int. J. Environ. Clim. Change 2024, 14, 791–803. [Google Scholar] [CrossRef]
  59. Wilson, J.B. Cover plus: Ways of measuring plant canopies and the terms used for them. J. Veg. Sci. 2011, 22, 197–206. [Google Scholar] [CrossRef]
  60. Davies, F.S.; Lakso, A.N. Diurnal and Seasonal Changes in Leaf Water Potential Components and Elastic Properties in Response to Water Stress in Apple Trees. Physiol. Plant. 1979, 46, 109–114. [Google Scholar] [CrossRef]
  61. Oyebade, B.A.; Anaba, J.C. Individual tree basal area equation for a young Tectona Grandis (Teak) plantation in Choba, Port Harcourt, Rivers State, Nigeria. World News Nat. Sci. 2018, 16, 130–140. [Google Scholar]
  62. Tous, J.; Romero, A.; Hermoso, J.F.; Ninot, A.; Plana, J.; Batlle, I. Agronomic and commercial performance of four Spanish carob cultivars. Horttechnology 2009, 19, 465–470. [Google Scholar] [CrossRef]
  63. Pawar, M.A.D.; Patil, M.S. Orchard Tree Canopy Detection. Int. Res. J. Eng. Technol. 2019, 6, 7642–7644. [Google Scholar]
  64. Liang, X.; Rehman, S.U.; Zhiqi, W.; Raza, M.A.; Haider, I.; Khalid, M.H.B.; Saeed, A.; Iqbal, Z.; Fatima, S.; Siddiqa, A.; et al. Impacts of Conservation Tillage on Agricultural Land Development: A Review. J. Soil Sci. Plant Nutr. 2024, 25, 428–449. [Google Scholar] [CrossRef]
  65. Ochoa-Hueso, R.; Eldridge, D.J.; Berdugo, M.; Trivedi, P.; Sokoya, B.; Cano-Díaz, C.; Abades, S.; Alfaro, F.; Bamigboye, A.R.; Bastida, F.; et al. Unearthing the soil-borne microbiome of land plants. Glob. Change Biol. 2024, 30, e17295. [Google Scholar] [CrossRef] [PubMed]
  66. Yu, R.P.; Li, X.X.; Xiao, Z.H.; Lambers, H.; Li, L. Phosphorus facilitation and covariation of root traits in steppe species. New Phytol. 2020, 226, 1285–1298. [Google Scholar] [CrossRef] [PubMed]
  67. Lithourgidis, A.S.; Dordas, C.A.; Damalas, C.A.; Vlachostergios, D.N. Annual intercrops: An alternative pathway for sustainable agriculture. Aust. J. Crop Sci. 2011, 5, 396–410. [Google Scholar]
  68. Constantinou, E.; Sarris, D.; Vogiatzakis, I.N. The possible role of Ziziphus lotus as an ecosystem engineer in semiarid landscapes. J. Arid Environ. 2021, 195, 104614. [Google Scholar] [CrossRef]
  69. Constantinou, E.; Sarris, D.; Psichoudaki, M.; Cabello, J.; Vogiatzakis, I.N. How can ecosystem engineer plants boost productivity in east Mediterranean drylands. Ecol. Process. 2023, 12, 30. [Google Scholar] [CrossRef]
  70. Constantinou, E.; Montesinos-Navarro, A.; Sarris, D.; Vogiatzakis, I.N. Facilitation network in phryganic plant communities: Evidence from a Mediterranean island. Plant Biosyst. 2025, 159, 596–605. [Google Scholar] [CrossRef]
  71. Ahmed, Z.; Gui, D.; Abd-Elmabod, S.K.; Murtaza, G.; Ali, S. An overview of global desertification control efforts: Key challenges and overarching solutions. Soil Use Manag. 2024, 40, e13154. [Google Scholar] [CrossRef]
  72. Gerowitt, B.; Bàrberi, P.; Darmency, H.; Petit, S.; Storkey, J.; Westerman, P. Weeds and biodiversity. In Weed Research: Expanding Horizons; John Wiley & Sons Ltd.: West Sussex, UK, 2017. [Google Scholar]
  73. Valdes, Y.B. The role of weeds as a component of biodiversity in agroecosystems. Cultiv. Trop. 2016, 37, 34–56. [Google Scholar] [CrossRef]
  74. Correia, P.J.; Cota, T.; Pestana, M. Evaluation of Carob Tree Productivity during a 30-Year Period, in Relation to Precipitation and Air Temperature. Environ. Process. 2020, 7, 1221–1233. [Google Scholar] [CrossRef]
  75. Correia, P.J.; Anastácio, I.; Da Fé Candeias, M.; Martins-Loução, M.A. Nutritional diagnosis in carob-tree: Relationships between yield and leaf mineral concentration. Crop Sci. 2002, 42, 1577–1583. [Google Scholar] [CrossRef]
  76. Bonanomi, G.; Stinca, A.; Chirico, G.B.; Ciaschetti, G.; Saracino, A.; Incerti, G. Cushion plant morphology controls biogenic capability and facilitation effects of Silene acaulis along an elevation gradient. Funct. Ecol. 2016, 30, 1216–1226. [Google Scholar] [CrossRef]
  77. Bonanomi, G.; Idbella, M.; Stinca, A.; Maisto, G.; De Marco, A.; Del Galdo, G.P.G.; Guarino, R.; Zotti, M. Nitrogen-fixing cushion Astragalus siculus modulates soil fertility, microclimate, plant facilitation, bacterial and fungal microbiota along an elevation gradient. J. Veg. Sci. 2023, 34, e13193. [Google Scholar] [CrossRef]
  78. Momberg, M.; Roux, P.C. Testing for consistency in ecosystem engineering: Do cushion plants always turn up the heat? Acta Oecologica 2020, 104, 103532. [Google Scholar] [CrossRef]
  79. Pugnaire, F.I.; Losapio, G.; Schöb, C. Species interactions involving cushion plants in high-elevation environments under a changing climate. Ecosistemas 2021, 30, 2186. [Google Scholar] [CrossRef]
  80. Tátrai, Z.A.; Sanoubar, R.; Pluhár, Z.; Mancarella, S.; Orsini, F.; Gianquinto, G. Morphological and Physiological Plant Responses to Drought Stress in Thymus citriodorus. Int. J. Agron. 2016, 2016, 4165750. [Google Scholar] [CrossRef]
  81. Nyawade, S.O.; Karanja, N.N.; Gachene, C.K.K.; Gitari, H.I.; Schulte-Geldermann, E.; Parker, M.L. Intercropping Optimizes Soil Temperature and Increases Crop Water Productivity and Radiation Use Efficiency of Rainfed Potato. Am. J. Potato Res. 2019, 96, 457–471. [Google Scholar] [CrossRef]
  82. Safari, N.; Kazemi, F.; Tehrani, A. Examining temperature and soil moisture contents of mulches in the urban landscaping of an arid region. Desert 2021, 26, 139–156. [Google Scholar] [CrossRef]
  83. Correia, P.J.; Martins-Loução, M.A. The use of macronutrients and water in marginal Mediterranean areas: The case of carob-tree. Field Crops Res. 2005, 91, 1–6. [Google Scholar] [CrossRef]
  84. Kolyva, F.; Stratakis, E.; Rhizopoulou, S.; Chimona, C.; Fotakis, C. Leaf surface characteristics and wetting in Ceratonia siliqua L. Flora Morphol. Distrib. Funct. Ecol. Plants 2012, 207, 551–556. [Google Scholar] [CrossRef]
  85. Sarris, D.; Mazza, G. Mediterranean Pine Root Systems Under Drought. In Pines and Their Mixed Forest Ecosystems in the Mediterranean Basin; Ne’eman, G., Osem, Y., Eds.; Managing Forest Ecosystems; Springer: Cha, Switzerland, 2021; Volume 38, pp. 129–140. [Google Scholar] [CrossRef]
  86. Sarris, D.; Christodoulakis, D. Topographic and climatic effects on Pinus halepensis s.l. growth at its drought tolerance margins under climatic change. J. For. Res. 2024, 35, 102. [Google Scholar] [CrossRef]
  87. Markou, L. Effects of Intercropping Systems on Carob Productivity Under Rainfed Conditions, Master in Ecology and Biodiversity. Master’s Thesis, Department of Biological Sciences, University of Cyprus, Nicosia, Cyprus, 2021. [Google Scholar]
  88. Dorman, M.; Perevolotsky, A.; Sarris, D.; Svoray, T. Amount vs. temporal pattern: On the importance of intra-annual climatic conditions on tree growth in a dry environment. J. Arid. Environ. 2015, 118, 65–68. [Google Scholar] [CrossRef]
  89. Mazza, G.; Sarris, D. Identifying the full spectrum of climatic signals controlling a tree species’ growth and adaptation to climate change. Ecol. Indic. 2021, 130, 108109. [Google Scholar] [CrossRef]
  90. Mazza, G.; Markou, L.; Sarris, D. Species-specific growth dynamics and vulnerability to drought at the single tree level in a Mediterranean reforestation. Trees Struct. Funct. 2021, 35, 1697–1710. [Google Scholar] [CrossRef]
  91. Mazza, G.; Manetti, M.C.; Kraushaar, G.; Pezzi, G.; Krebs, P.; Coşgun, S.; Tinner, W.; Conedera, M. Climate sensitivity of Abies alba Mill. in marginal Mediterranean low-elevation stands reveals new insights into the ecological potential of the species. For. Ecol. Manag. 2025, 585, 122670. [Google Scholar] [CrossRef]
  92. von Hasalberg, C.D. Vegetative Growth and Flower and Fruit Development in Carob Tree (Ceratonia siliqua L.) with Special Emphasis on Environmental Conditions at Marginal Production Sites in South Portugal. Ph.D. Thesis, Humboldt-Universitat Zu Berlin, Berlin, Germany, 2000. [Google Scholar]
  93. Tous, J.; Romero, A.; Batlle, I. The Carob Tree: Botany, Horticulture and Genetic Resources. In Horticultural Reviews; John Wiley & Sons Inc.: Hobokeny, NJ, USA, 2013; Volume 41, pp. 385–456. [Google Scholar]
  94. Von Haselberg, C. Factors influencing flower and fruit development in carob (Ceratonia siliqua L.). In Proceedings of the Third International Carob Symposium, Tavira, Portugal, 9–11 September 1996. [Google Scholar]
  95. Moore, E.A.; Norton, U. Improving semi-arid agroecosystem services with cover crop mixes. PLoS ONE 2024, 19, e0306567. [Google Scholar] [CrossRef]
  96. Opoku, A.; Ogunleye, A.M.; Solomon, J.K.Q.; Payne, W.A. Cover crop systems impact on biomass production, carbon-to-nitrogen ratio, forage quality, and soil health in a semi-arid environment. Heliyon 2024, 10, e39600. [Google Scholar] [CrossRef]
  97. Everwand, G.; Cass, S.; Dauber, J.; Williams, M.; Stout, J. Legume crops and biodiversity. In Legumes in Cropping Systems; CABI: Wallingford, UK, 2017; pp. 55–59. [Google Scholar]
  98. Simoes, M.P.; Belo, A.F.; Pinto-Cruz, C.; Pinheiro, A.C. Natural vegetation management to conserve biodiversity and soil water in olive orchards. Span. J. Agric. Res. 2014, 12, 633–643. [Google Scholar] [CrossRef]
  99. Zhu, S.G.; Zhu, H.; Zhou, R.; Zhang, W.; Wang, W.; Zhou, Y.N.; Wang, B.Z.; Yang, Y.M.; Wang, J.; Tao, H.Y.; et al. Intercrop overyielding weakened by high inputs: Global meta-analysis with experimental validation. Agric. Ecosyst. Environ. 2023, 342, 108239. [Google Scholar] [CrossRef]
  100. Brooker, R.; Kikvidze, Z.; Pugnaire, F.I.; Callaway, R.M.; Choler, P.; Lortie, C.J.; Michalet, R. The importance of importance. Oikos 2005, 109, 63–70. [Google Scholar] [CrossRef]
  101. Echarte, L.; Della Maggiora, A.; Cerrudo, D.; Gonzalez, V.H.; Abbate, P.; Cerrudo, A.; Sadras, V.O.; Calvino, P. Yield response to plant density of maize and sunflower intercropped with soybean. Field Crops Res. 2011, 121, 423–429. [Google Scholar] [CrossRef]
  102. Willey, R.W. Resource use in intercropping systems. Agric. Water Manag. 1990, 1–3, 215–231. [Google Scholar] [CrossRef]
  103. Rossi, L.; Regni, L.; Rinaldi, S.; Sdringola, P.; Calisti, R.; Brunori, A.; Dini, F.; Proietti, P. Long-term water footprint assessment in a rainfed olive tree grove in the Umbria region, Italy. Agriculture 2020, 10, 8. [Google Scholar] [CrossRef]
  104. Litskas, V.; Mandoulaki, A.; Vogiatzakis, I.N.; Tzortzakis, N.; Stavrinides, M. Sustainable viticulture: First determination of the environmental footprint of grapes. Sustainability 2020, 12, 8812. [Google Scholar] [CrossRef]
Figure 1. (a) Location of the two experimental sites in Cyprus, Skarinou (SKR; (b)) and Vrysoulles (VRY; (c)) within carob agroforestry systems in regions prone to desertification (the highest desertification risk is for arid, the lowest for humid areas; SKR, semi-arid; VRY, arid; [57] with calcareous soil in SKR and red clay soil in VRY. Altitude (alt.)).
Agronomy 15 01560 g001
Figure 2. (a) The south (sun)-exposed side (SES) of carob trees (yellow rectangle; ca. 4 m2) where 60 T. capitata plants were installed in Y1 (thyme-based intercropping system with carob trees—T-System), or where (c) clover was additionally sown annually, eradicating thyme from Y1 (clover-based intercropping system with carob trees—C-System). (b) The establishment of thyme (ca. 3–5 cm tall seedlings) was supported by ecologically engineered soil, (c) clover (C) growing in between thyme plants (T, within black circle); (d) the T-System in Y3 (March 2022).
Agronomy 15 01560 g002
Figure 3. Established living mulch intercropping systems at two sites, SKR and VRY, prior to the Y3 dry season (Spring 2022). The thyme-based intercropping system (T-System) and a close-up of established thyme plants at the SKR (a,b) and VRY sites (d,e). C-System with clover-based living mulch in 3 out of 3 years of monitoring (CCC) (c) and the C-System with clover-based living mulch in 2 out of 3 years of monitoring (CCW) (f) at the SKR and VRY sites.
Agronomy 15 01560 g003
Figure 4. Carob leaf water potential (Ψ) at midday for monitored intercropping and control system plots prior to treatment initiation (Y0—October 2019) for the SKR (a) and VRY sites (b) and at the end of the Y3 dry season (Y3—October 2022) for the SKR (c) and VRY sites (d). a-b statistically different: *** at p < 0.001. TLGdry = Conservation tillage carob trees without irrigation. N = number of monitored trees. Error bars = ±1 standard error.
Agronomy 15 01560 g004
Figure 5. (ac) Carob leaf water potential difference ΔΨ between the beginning (i) and the end of the dry season (ii) (ΔΨ = Ψii − Ψi) for each monitored year. (d) Carob yield efficiency and (e) wood production averages for 3 years for T-System and TLGdry plots at the SKR site. Coloring reflects conditions of the hydrological year concurrent to the above parameter monitoring. y.e = yield efficiency; a-b statistically different: * at p < 0.05, ** at p < 0.01, *** at p < 0.001. TLGdry = Conservation tillage without irrigation. N = number of monitored plots. Error bars = ±1 standard error.
Agronomy 15 01560 g005
Figure 6. (ac) Carob leaf water potential difference ΔΨ between the beginning (i) and the end of the dry season (ii) (ΔΨ = Ψii − Ψi) for each monitored year. (d) Carob yield efficiency and (e) wood production averages for 3 years for C-System (CCC) and TLGdry plots at the SKR site. Coloring reflects conditions of the hydrological year concurrent to the above parameter monitoring. a-b statistically different: * at p < 0.05. TLGdry = Conservation tillage without irrigation. N = number of monitored plots. Error bars = ±1 standard error.
Agronomy 15 01560 g006
Figure 7. (ac) Carob leaf water potential difference ΔΨ between the beginning (i) and the end of the dry season (ii) (ΔΨ = Ψii − Ψi) for each monitored year. (d) wood production averages for 3 years for T-System and TLGdry plots at the VRY site. Coloring reflects conditions of the hydrological year concurrent to the above parameter monitoring. TLGdry = Conservation tillage without irrigation. a-a not statistically different. N = number of monitored plots. Error bars = ±1 standard error.
Agronomy 15 01560 g007
Figure 8. (ac) Carob leaf water potential difference ΔΨ between the beginning (i) and the end of the dry season (ii) (ΔΨ = Ψii − Ψi) for each monitored year. (d) wood production averages for 3 years for C-System (CCW) and TLGdry plots at the VRY site. Coloring reflects conditions of the hydrological year concurrent to the above parameter monitoring. TLGdry = Conservation tillage without irrigation. a-a not statistically different. N = number of monitored plots. Error bars = ±1 standard error.
Agronomy 15 01560 g008
Figure 9. (ac) Annual carob yield efficiency for each monitored year at the SKR site. Coloring reflects the hydrological conditions of the previous year (see Figure S2 and Table 1). C = C-System. T = T-System. a-b statistically different at p < 0.05. CCC = C-system with clover-based living mulch in 3 out of 3 years of monitoring. CCW = C-system with clover-based living mulch in 2 out of 3 years of monitoring. TLGdry = Conservation tillage without irrigation. N = number of monitored plots. Error bars = ±1 standard error.
Agronomy 15 01560 g009
Figure 10. Monitored surface temperature at the SES of carob trees (a,b) at the peak of the Y3 dry season (July 2022) and soil moisture (c,d) monitored at the end of the Y3 dry season (October 2022) for the T-System (T: (a,c)) and C-System (CCC: (b,d)) compared to TLGdry for the SKR site. a-b statistically different: ** at p < 0.01, *** at p < 0.001. TLGdry = Conservation tillage without irrigation. N = number of monitored plots and in parenthesis is the total number of soil moisture measurements per group. Coloring reflects conditions of the hydrological year concurrent to the above parameter monitoring. Error bars = ±1 standard error.
Agronomy 15 01560 g010
Figure 11. Monitored surface temperature at the SES of carob trees (a,b) at the peak of the Y3 dry season (July 2022) and soil moisture (c,d) monitored at the end of the Y3 dry season (October 2022) for the T-System (T: (a,c)) and C-System (CCW: (b,d)) compared to TLGdry for the VRY site. a-b statistically different: *** at p < 0.001. TLGdry = Conservation tillage without irrigation. N = number of monitored plots and in parenthesis is the total number of measurements per group. Coloring reflects conditions of the hydrological year concurrent to the above parameter monitoring. Error bars = ±1 standard error.
Agronomy 15 01560 g011
Figure 12. Environmental performance indicators of the carob yield (kg of carob pods), focusing on (a) water footprint (WF), (b) energy intensity (EI), and (c) carbon footprint (CF). Coloring reflects the hydrological conditions of the previous year (see Figure S2 and Table 1). The WF, EI and CF for TLGdry could not be determined for Y3, as there was no production (n.p.). Note that in Y3, the T-System (T) outperformed all other systems for all indicators evaluated. TLGirr/dry = Conservation tillage with/without irrigation.
Agronomy 15 01560 g012
Table 1. Annual climate data for SKR and VRY sites by year (Oct-Sep). Exp. = Experiment; DMAI = De Martonne’s Aridity Index; r = rainfall in bold/italics for below/above the 1981–2010 mean; Ta = mean temperature.
Exp.: Hydrological Yearr (mm)% Change from Previous Year% of Normal rTa (°C)DMAI
SKRVRYSKRVRYSKRVRYSKRVRYSKRVRY
Y0: 2018–2019678469 16014220.420.522.2815.35
Y1: 2019–2020655513−<1%+<1%15415520.820.421.2916.88
Y2: 2020–2021311289−53%−44%738721.220.89.969.40
Y3: 2021–202249628359%−2%117852020.315.779.33
Table 2. Living mulch performance in the south (sun)-exposed soil side (SES) of carob trees for the thyme-based living mulch (T-System) and clover-based living mulch in 2 or 3 out of the 3 years of monitoring (CCW or CCC; C-System) at the SKR and VRY sites during Y1 (2019–20) Y2 (2020–21) and Y3 (2021–22). Thyme and clover biomass (TB, CB). Clover-and-weed biomass (CWB). Soil cover (thyme without and with weeds, clover without and with weeds; TSC, TWSC, CSC, CWSC). Thyme survival rate (TSR). Clover-to-clover plus weeds ratio (CR). Exp. = Experiment. Weed comp. = Weed competition. * Representing values for the SES layer of clover-based hay applied during Y2.
SKR Site
T-System C-System: CCC
Exp. YearClimate YearWeed Comp.TB (g/m2)
Mean
TSC (%)
Mean
TWSC (%)
Mean
TSR (%)
Median
CB (g/m2)
Mean
TB (g/m2)
Mean
TSC (%)
Mean
CWB (g/m2)
Mean
CR (%)
Mean
CWSC (%)
Mean
TSR (%)
Median
Y1Very wetLow4315>40971571<0.321570>902
Y2Very dryLow335355597 329 * 97 *
Y3NormalLow420838594>180 >32055100
VRY Site
T-SystemC-System: CCW
Y1Very wetHigh2811>55721710030550970
Y2Very dryHigh399>8040 >400 * >95 *
Y3Very dryHigh4525>974022 3167100
Disclaimer/Publisher’s Note: The statements, opinions and data contained in all publications are solely those of the individual author(s) and contributor(s) and not of MDPI and/or the editor(s). MDPI and/or the editor(s) disclaim responsibility for any injury to people or property resulting from any ideas, methods, instructions or products referred to in the content.

