Article

Integrating Multi-Trait Selection Indices for Climate-Resilient Lentils: A Three-Year Evaluation of Earliness and Yield Stability Under Semi-Arid Conditions

by
Mustafa Ceritoglu
1,*,
Fatih Çığ
1,
Murat Erman
2 and
Figen Ceritoglu
3
1
Department of Field Crops, Faculty of Agriculture, Siirt University, Siirt 56100, Türkiye
2
Department of Field Crops, Faculty of Agriculture, Bursa Uludağ University, Bursa 16059, Türkiye
3
Department of Animal Science, Faculty of Agriculture, Siirt University, Siirt 56100, Türkiye
*
Author to whom correspondence should be addressed.
Agronomy 2025, 15(7), 1554; https://doi.org/10.3390/agronomy15071554
Submission received: 23 May 2025 / Revised: 15 June 2025 / Accepted: 23 June 2025 / Published: 26 June 2025
(This article belongs to the Section Crop Breeding and Genetics)

Abstract

This research assessed 42 lentil genotypes developed by ICARDA along with a local variety over three growing seasons (2019–2022) in Southeastern Türkiye. Phenological, morphological, and yield attributes were determined to observe earliness, yield stability, and adaptation properties. Genotype G3771 showed outstanding performance in grain yield (2579 kg ha−1), 1000-seed weight (54.9 g), and harvest index (37.3%), although it had lower stability under more severe drought conditions. Early-maturing genotypes like G3744, G3715, and G3716 consistently flowered and matured sooner, making them better suited for escaping terminal drought stress areas. The highest yields were recorded during the 2019–2020 season, which experienced favorable rainfall and soil nutrient levels, while the lowest yields occurred due to changing climatic conditions in the 2020–2021 season, highlighting the crop’s sensitivity to climate. Principal component analysis, hierarchical clustering, the Modified Multi-Trait Stability Index (MTSI), and the Multi-Trait Genotype-Ideotype Distance Index (MGIDI) aided in effective genotype classification. Although G3771 was the most productive, genotypes G3687, G3715, and G3689 proved to be the most stable and early maturing based on MGIDI scores. Strong relationships between grain yield, biological yield, and seed size identified these as key selection criteria. This study underscores the value of multi-trait selection tools like MGIDI and MTSI in consistently pinpointing lentil genotypes that balance earliness, productivity, and adaptability, laying a strong foundation for developing climate-resilient varieties suited to semi-arid climates.

1. Introduction

Lentil (Lens culinaris Medik.) is one of the earliest domesticated legumes, with origins tracing back roughly 8000 years to the Fertile Crescent. It spread across Asia, North Africa, and Europe from the Middle East. Its adaptability and rich genetic diversity allow it to be grown in a wide variety of agro-climatic conditions. The Near East and South Asia, where wild relatives of lentils still grow, serve as key centers of origin and genetic diversity [1,2]. In recent years, lentils have become increasingly significant due to their role in food security, sustainable agriculture, and nutrition. Globally, lentils are annually produced in quantities of more than 7 million tons on 6.5 million hectares, with Canada, India, Australia, and Türkiye leading in production [3,4]. Despite this, lentil farming continues to face hurdles like low yields, susceptibility to abiotic stresses, and a limited genetic base, especially in light of climate change [5].
As a cool-season crop, lentil is particularly vulnerable to high temperatures during flowering and pod-filling stages, as well as to terminal drought. These climate-driven pressures highlight the urgent need for resilient varieties that can perform consistently across diverse and shifting environments. Genetic diversity is essential not only for understanding how different lentil types adapt but also for identifying traits that confer tolerance to climate-related stresses [1,6]. Preserving and utilizing the genetic resources found in wild lentil species and traditional landraces could help broaden the genetic base for breeding climate-resilient cultivars [7,8]. Traits like early flowering, drought resistance, and the ability to recover from stress are especially valuable in this effort [9].
Climate change poses a growing threat to agriculture worldwide. Rising temperatures, irregular rainfall, and more frequent extreme weather events have led to greater year-to-year variability in crop performance [10]. These changes cause problems, particularly in arid and semi-arid regions, where inconsistent weather can disrupt plant growth and reduce yields. Seasonal rainfall has been decreasing, while short-term weather anomalies have become more common in Türkiye’s Southeastern Anatolia region. This instability affects planting cycles, hampers plant development, and ultimately compromises both yield and crop quality [9,11].
Lentil is a highly nutritious legume crop with significant economic value, and it is widely cultivated both globally and in Turkey. According to global data for the 2023–24 growing season, lentils were cultivated on 5.7 million hectares, yielding approximately 7.1 million tons of production. In terms of global lentil production, the top three countries are Australia with 1.8 million tons (25%), Canada with 1.7 million tons (24%), and India with 1.6 million tons (23.9%). Turkey ranks fourth among the world’s major lentil producers, with a production of 474,000 tons from 323,000 hectares. In the global lentil export market, Canada leads with exports valued at USD 1.7 billion, followed by Australia with USD 1.3 billion, and Turkey with USD 558 million [12]. In Turkey’s domestic market, lentil production data from 2021 indicates a total output of 263,000 tons. Of this, 86.7% (228,000 tons) was red lentils, while 13.3% (35,000 tons) was green lentils. Red lentil production is primarily concentrated in the Southeastern Anatolia Region, with the leading provinces being Şanlıurfa (46%), Diyarbakır (20%), Siirt (7%), and Batman (7%). On the other hand, green lentil cultivation is predominantly located in the Central Anatolia Region, where Yozgat (48%), Kırşehir (19%), and Konya (13%) are the main production areas [13].
This study set out to assess the phenological, morphological, and agronomic traits of 42 lentil accessions and one local cultivar over three successive growing seasons marked by varying climate conditions. By focusing on genotypes selected from the International Center for Agricultural Research in the Dry Areas (ICARDA)’s core collection for their earliness and drought tolerance, this research aims to reveal how yearly shifts in climate influence growth and yield performance. This study uniquely combines genotype response data with climatic variability, highlighting how environmental interactions influence lentil adaptation. Moreover, it points out the importance of advanced multivariate selection methods in the stability determination process. These findings inform breeding strategies focused on enhancing crop resilience to climate variability.

2. Materials and Methods

2.1. Experimental Materials

Forty-two lentil (Lens culinaris) accessions and one local check variety (Fırat-87) were cultivated in this study. Pedigree information of the ICARDA-based accession is given in Table A1. Accessions were obtained from the core collection of ICARDA (Lebanon) at 2016. Accessions were selected from two differently characterized groups. One of them has a short lifespan and is described as “Lentil International Elite Nursery-Extra Early”, while the other collection has high adaptability to drought conditions and is described as “Lentil International Drought Tolerance Nursery”. All accessions from two group were together cultivated and compared with a high-yield local check to asses adaptation abilities. Fırat-87, which has red cotyledons, was registered by the Gap International Agricultural Research and Training Center (GAPUTAEM, Diyarbakır, Türkiye) in 2012. Fırat-87 has a long lifespan, winter habitat, 35–40 g 1000-seed weight, and 1750–2250 kg ha−1 mean grain yield for the area [14].

2.2. Experimental Conditions

This study was conducted at Siirt University, Siirt, Southeast of Türkiye. The coordinates of the experimental area were 37°58′04″ N and 41°51′17″ E, with an altitude of 588 m above sea level. The field was used for wheat cultivation before the start of the experiment (Figure 1).
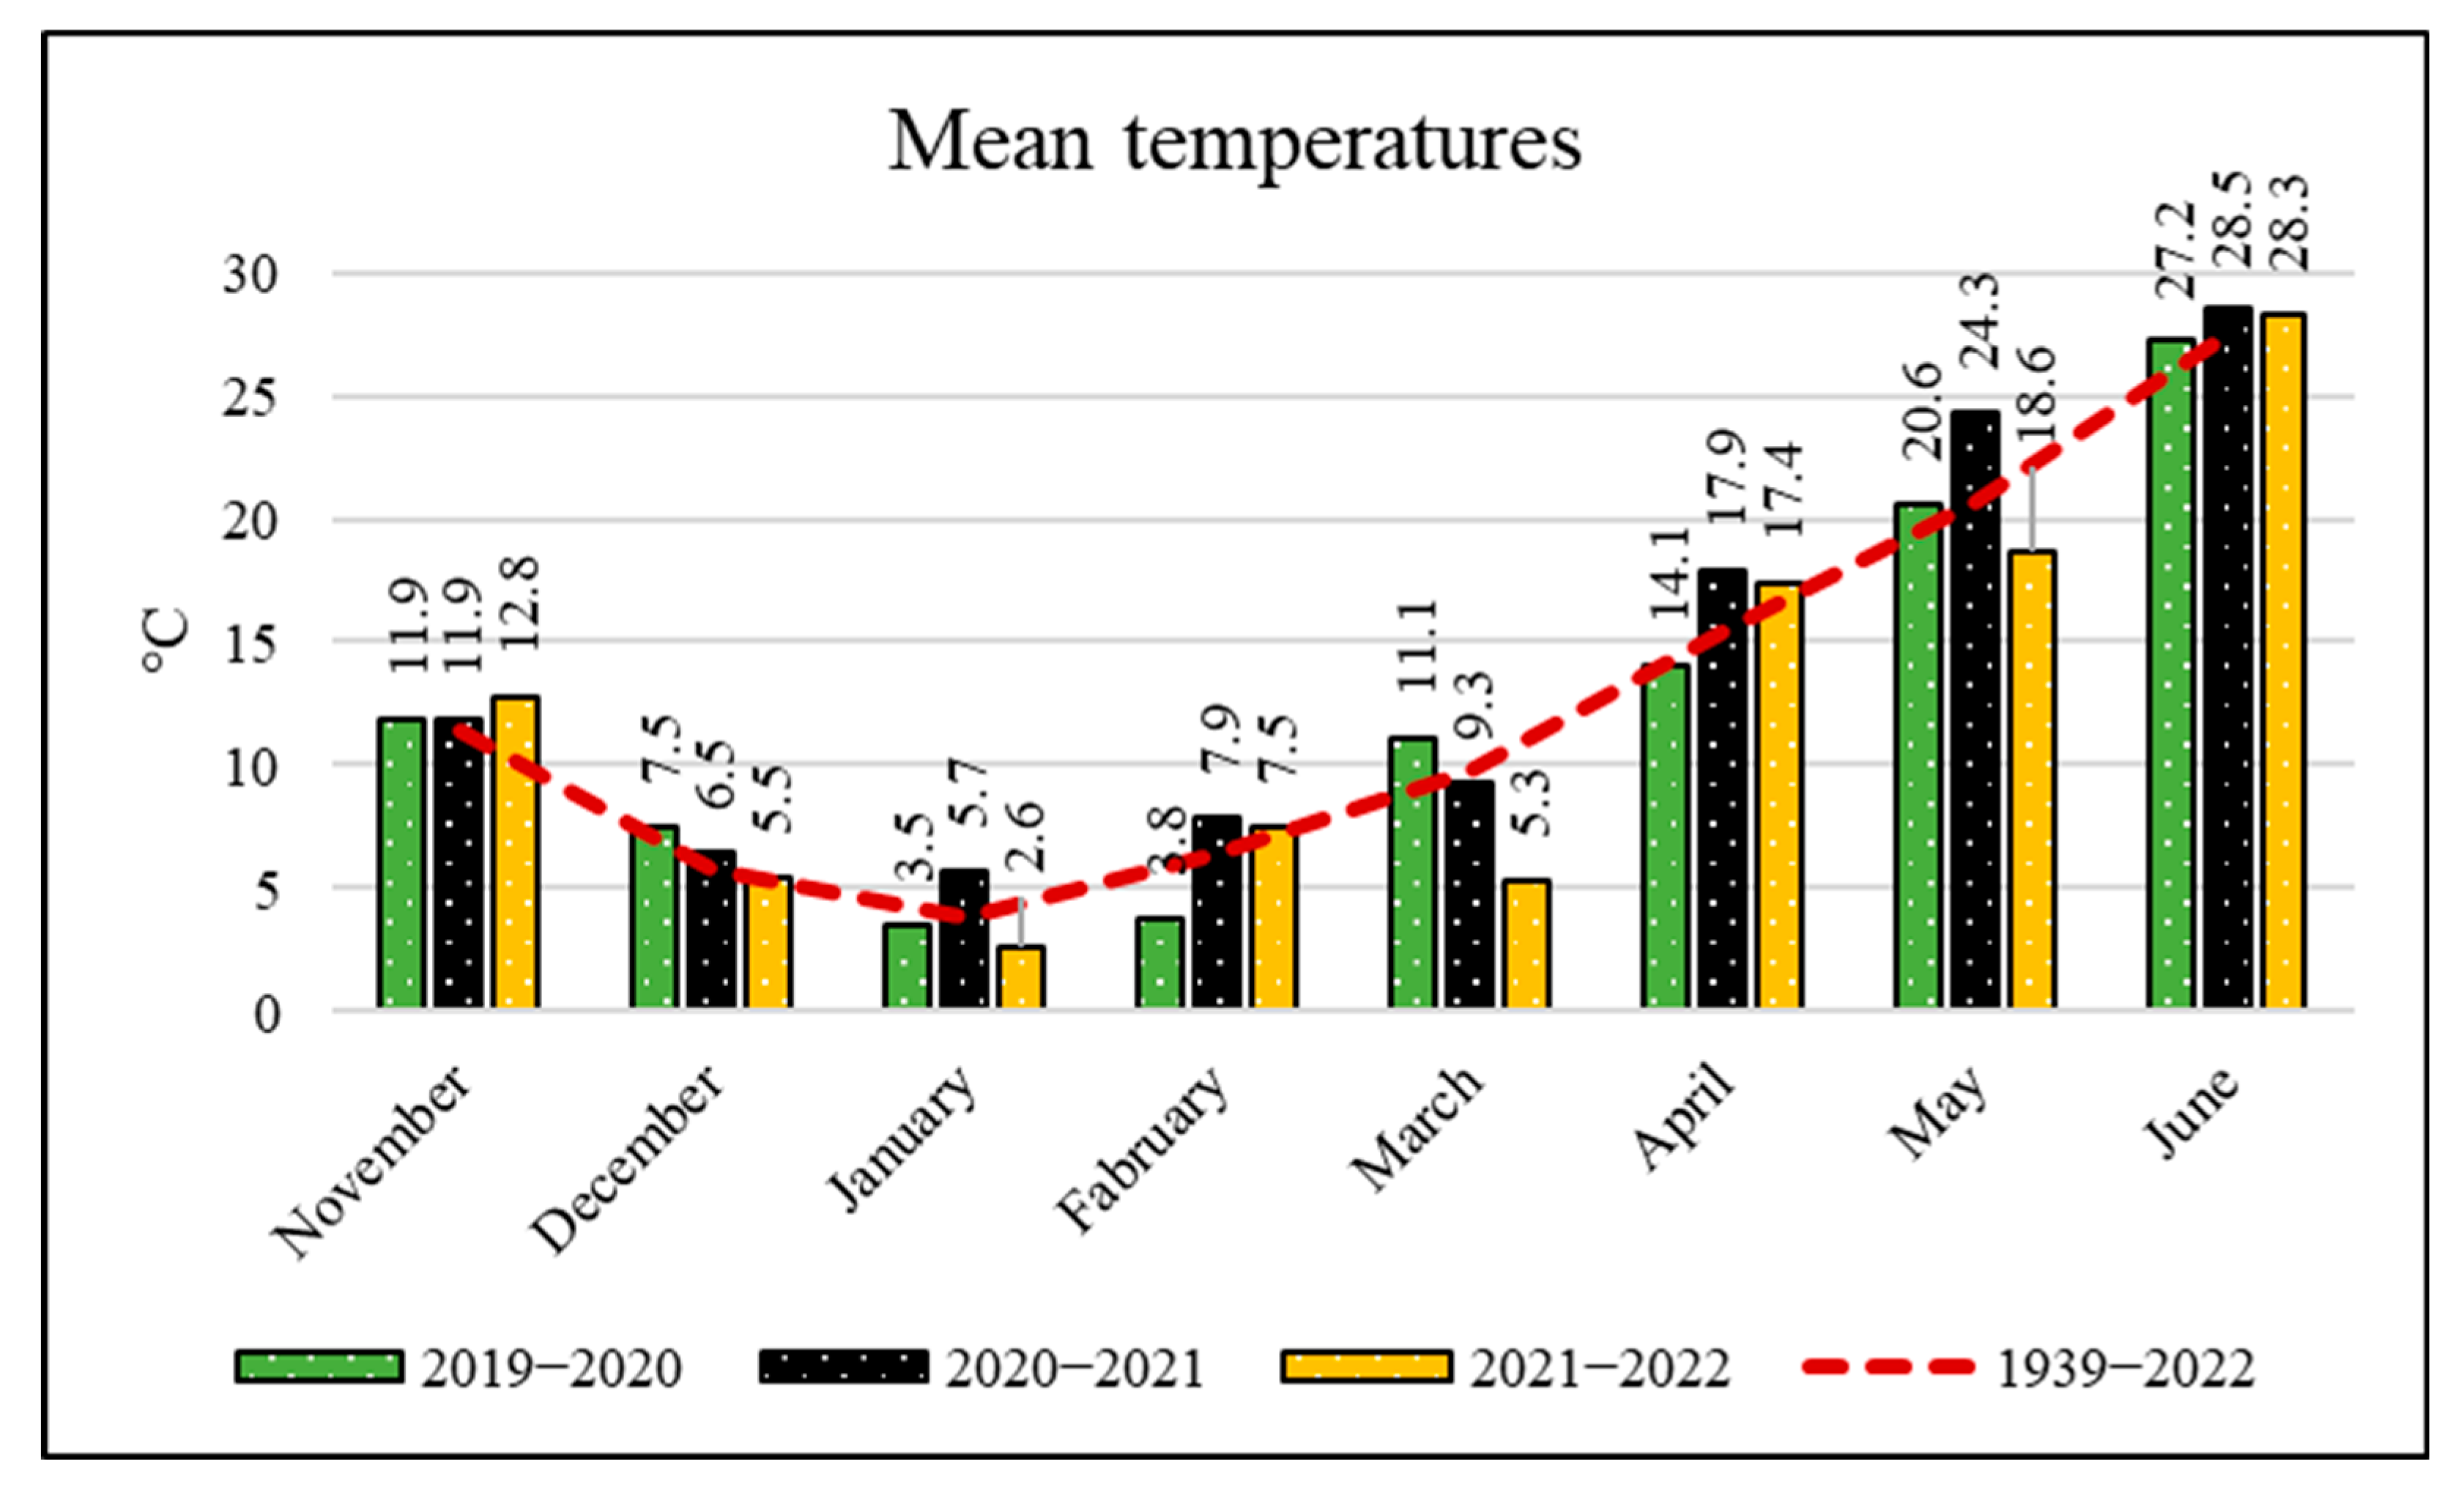
The analysis of climate data reveals significant seasonal and annual variations in temperature, relative humidity, and total precipitation. Temperature trends indicate that the winter months (January and February) are the coldest periods, with temperatures ranging between 2 and 7 °C, while temperatures reach 27–28 °C in the summer (June), thereby indicating hot and dry conditions. Although recent temperature fluctuations have remained within the long-term averages from 1939 to 2022, some seasonal changes are notable, such as the 2020–2021 season, which was slightly warmer than others. Extreme temperature values show that minimum temperatures can drop significantly, especially in winter, where they changed between −9 °C and 16–19 °C in January and February. This indicates that while severe cold can occur in winter, some days also experience milder temperatures. Maximum temperatures can reach up to 39 °C in the summer season (Figure 2).
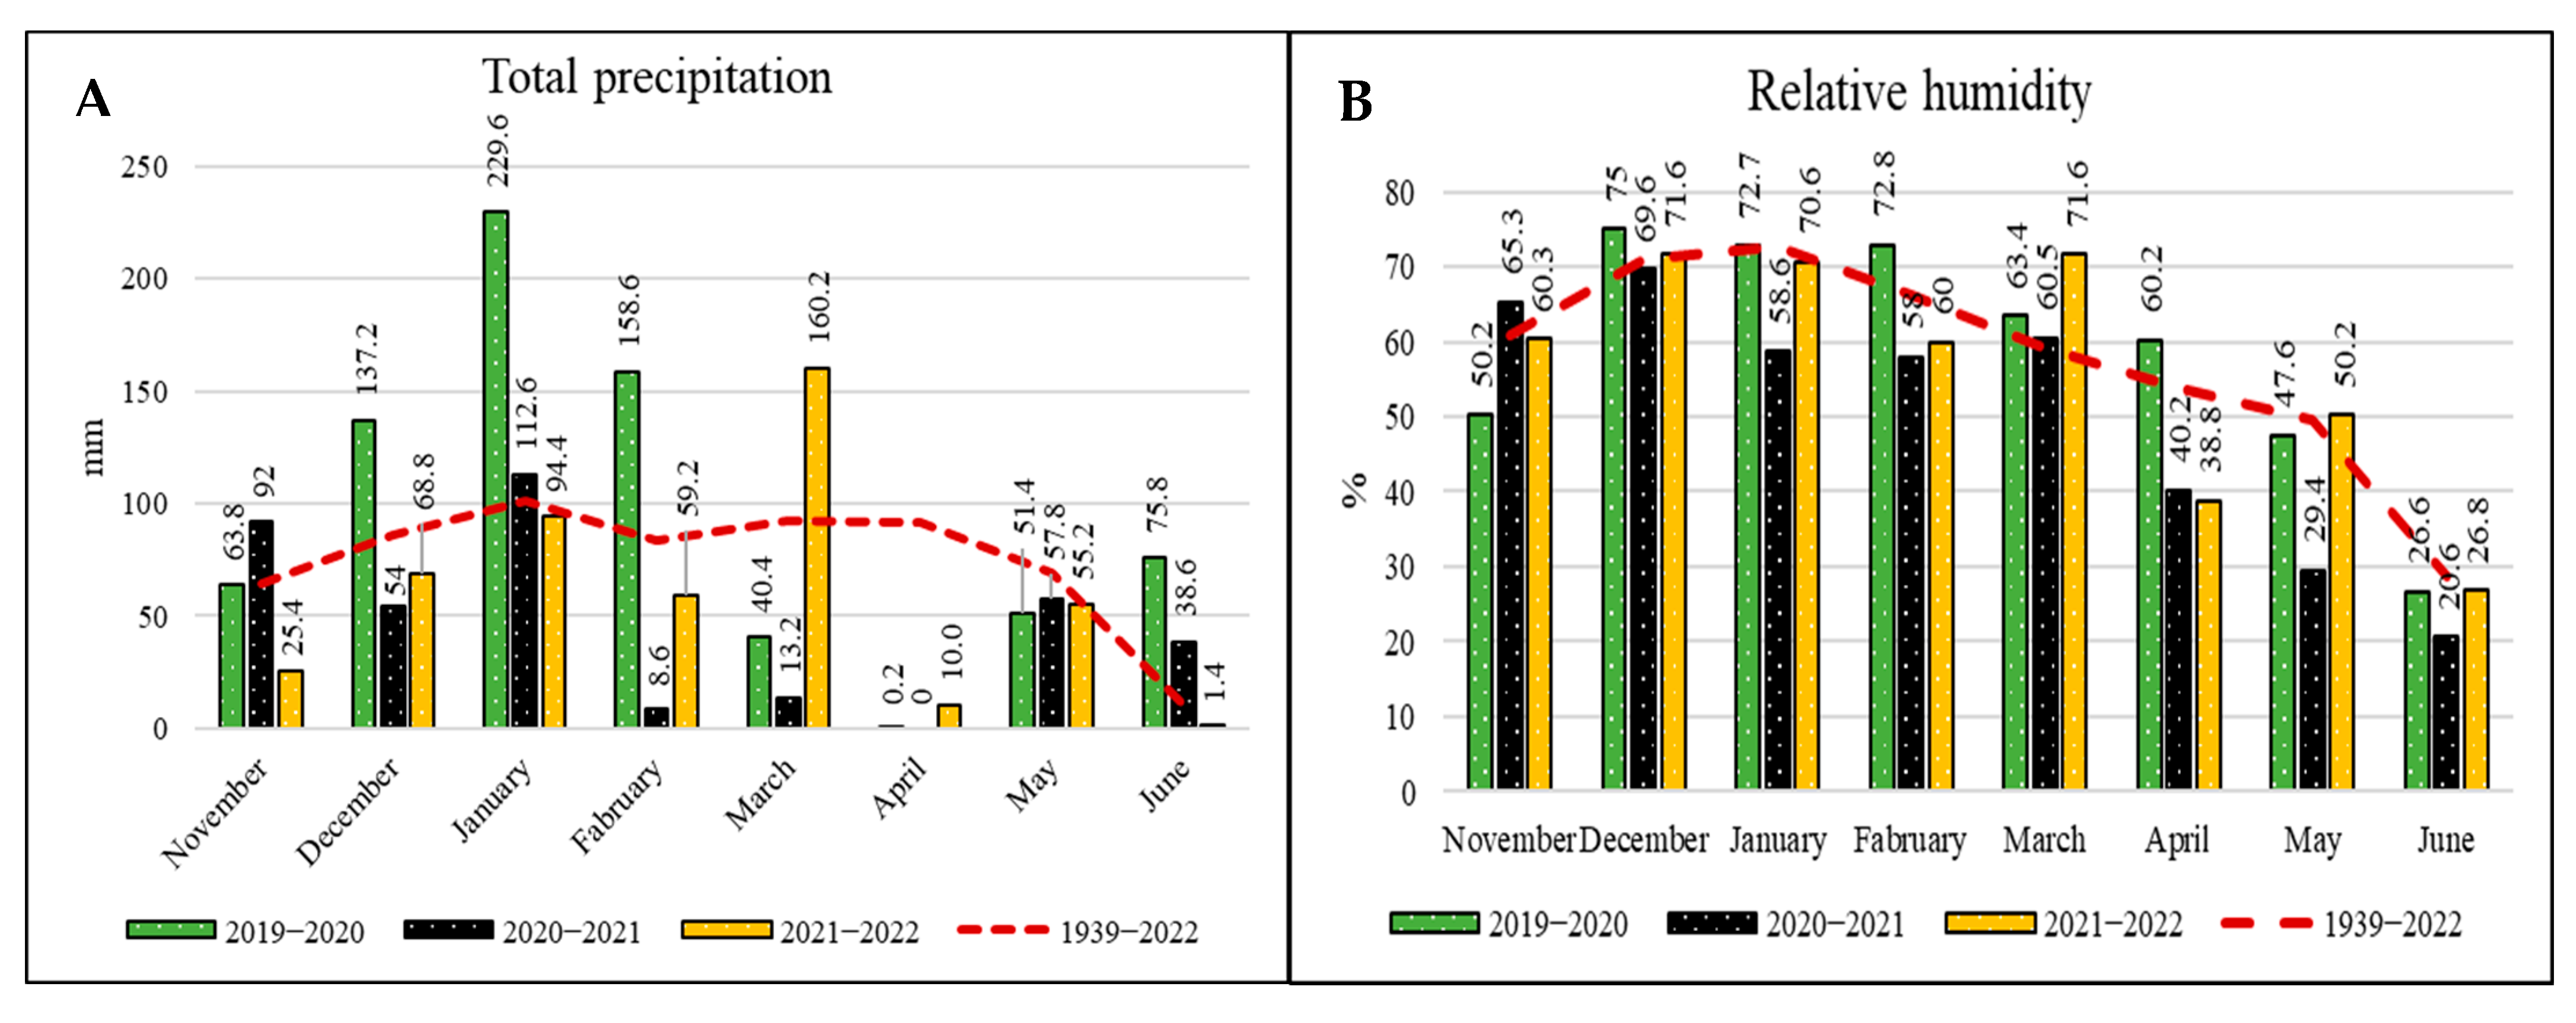
The 2019–2020 season received the highest total rainfall, reaching 757 mm, while the 2020–2021 season was significantly drier, with only 377 mm of total precipitation. There was a slight increase to 475 mm in 2021–2022, but it remained below the 2019–2020 levels. Compared to the long-term average (1939–2022) of around 600 mm, a noticeable decline in rainfall has been observed in certain years. The 2020–2021 season was particularly dry, with almost no precipitation in March and April, indicating drought conditions. However, precipitation rose to 160 mm in March 2021–2022, suggesting a temporary wetter period. Overall, precipitation levels have shown a declining trend in recent years, with 2020–2021 being the driest season (Figure 3A). Relative humidity levels generally range between 60 and 75% during autumn and winter but decline significantly in spring and summer, dropping as low as 26% in May and June. Although humidity levels have remained relatively stable, a slight decrease in recent years may indicate drier conditions (Figure 3B).

2.3. Soil Characterization of Experimental Area

Experimental soil was analyzed for texture; soil reaction (pH); electrical conductivity (EC); lime; organic matter; and P, K, Ca, Mg, Mn, Fe, Zn and Cu. Texture was determined by the Bouyoucos hydrometer method [15]. The pH and EC were calculated as outlined in “Soil Survey Laboratory Staff” using the 1:2.5 soil–water mixture method [16]. Lime was detected using the calcimeter method [17]. Soil organic matter was determined using the Walkley Black wet combustion method [18]. Macro- and micronutrient analyses in soil were determined by the ICP-OES spectrophotometric method according to Kacar [19].
The experimental soil was characterized by sandy clay loam, silty loam, and loam during 2019–2020, 2020–2021, and 2021–2022, respectively. Experimental soils were slightly alkaline in 2019–2020 and 2021–2022, while it was alkaline in the 2020–2021 season. Soils have no salt and low organic matter content in all years. Lime contents changed according to the experimental soil, i.e., high-lime, lime, and mid-lime during the first, second, and third experimental years, respectively. The available phosphorus was high in the experimental soil during the first year but low during the second and third years. Potassium contents were sufficient in the first year, whereas they were low during the second and third experimental years. Experimental soils were characterized as mid-calcium and magnesium in all years. Manganese, copper, and iron were sufficient. Finally, zinc contents were low in all experimental soils (Table 1).

2.4. Experimental Design and Laying Out

The field experiments were laid out during three consecutive seasons from 2019 to 2022 in the same area. The experiments were started on the 3rd week of November in all seasons, i.e., 21 November 2019, 15 November 2020, and 14 November 2021. The experiments were arranged according to a randomized block design with four replications. Forty-two accessions from ICARDA and one local check were cultivated in 3 m2 (1 m plot width and 3 m plot length) plots. Five rows were placed in each plot, and row spaces were arranged at 25 cm [20]. The distance between blocks and plots was set as 1.5 m.
The 1000-grain weight was determined for each genotype before sowing to decide the seed quantity for each one. In total, 250 seeds per square meter were manually sown [21]. Then, 25 kg N and 65 kg P ha−1 were applied under the seedbed as diammonium phosphate during seed sowing time [22]. The weed population was manually controlled, and herbicides were not used. Any disease or pathogenic insect population was observed in all experimental seasons.

2.5. Data Collection

Days to flowering, podding, and maturity were noted to assess phenological growth indices. Ten plants were randomly collected from each plot before harvesting to determine plant height, number of branches, first pod height, and number of pods per plant. External rows and the areas 0.5 m from each head part were neglected to avoid edge effects; therefore, an area of 1.5 m2 was manually harvested and air-dried. Also, edge rows were harvested. However, they were not used for calculations. Harvesting was carried out between the last week of May and the first week of June in all experimental seasons. The total dry biomass was weighted to determine the biological yield. Straw and seed materials were separated via threshing, and the grain yield was determined and calculated per hectare. The harvest index and 1000-seed weight were calculated.

2.6. Statistical Analysis

All statistical calculations were laid out by R software (v. 4.5.0). Data was subjected to analysis of variance (ANOVA) to assess the significance of experimental treatments. Significant means were grouped using Tukey’s Honestly Significant Difference test [23]. Pearson correlation was performed on the dataset to examine the relationships between traits using the “PerformanceAnalytics” package [24]. Multi-trait relationships were investigated via principal component analysis (PCA) and visualized by a biplot chart using the “ggcorrplot” and “FactoMineR” packages. Hierarchical clustering was employed to identify subpopulations and uncover patterns within the dataset by structurally grouping samples with similar characteristics, in which the “dendextend”, “circlize”, “cluster”, “openxlsx”, and “dplyr” packages were used.
Two multivariate selection indices were used to identify genotypes combining earliness and yield stability: the Modified Multi-Trait Stability Index (MTSI) and the Multi-Trait Genotype-Ideotype Distance Index (MGIDI). Initially, genotypes were filtered for earliness, and high-yield potential genotypes were selected using the MTSI, which evaluates stability across years based on grain and biological yields. The MGIDI, which integrates multiple traits into a single score, accounted for trait correlations and variance, selecting genotypes based on both phenological and yield-related characteristics [25].
The ideal genotype’s traits were weighted using expert opinions and the Analytical Hierarchy Process (AHP) and normalized via Z-scores. Genotypic distances were calculated using Euclidean distances, and hierarchical clustering was performed using Ward’s method, which minimizes within-cluster variances. PCA was used for dimensionality reduction, and clustering helped identify patterns and subpopulations within the dataset.
All analyses were conducted in the R environment using the “metan” package, which offers robust tools for multivariate genotype selection and stability analysis. The “mtsi” function calculated genotype distances to the ideal genotype, while the “mgidi” function applied factor analysis to partition trait variance and compute ideotype distances [26]. In addition to conventional Pearson’s correlation analysis, the MGIDI and MTSI were employed to enable a multi-trait selection approach. These indices allow for ranking genotypes not only based on individual trait performance but also their overall proximity to an ideotype, integrating both yield and stability across environments.

3. Results

Forty-three lentil genotypes were cultivated throughout three years, from 2019 to 2022, in Siirt ecological conditions and under field conditions. According to ANOVA, experimental years, genotypes, and YxG interactions caused statistically significant differences (p < 0.01) in all characteristics (Table A2).
Phenological characteristics exhibited significant differences among years in which the shortest flowering time (127 days), podding time (140 days), and maturity time (169 days) were observed in the first experimental seasons, whereas the longest flowering time (140 days) and podding time (150 days) were determined in the second season, in addition to the longest maturity time (175 days) screened in the third season. Plant height and first pod height decreased from the 2019–2020 to 2021–2022 seasons and varied between 26.8–45.8 cm and 5.3–15.9 cm, respectively. In contrast, the number of branches increased from the 2019–2020 to the 2021–2022 seasons and varied between 7.4 and 14.5. The number of pods (139.5), harvest index (28.3%), 1000-seed weight (35 g), biological yield (7504 kg ha−1), and grain yield (2136 kg ha−1) exhibited the highest performance during the first season. These characteristics decreased to the lowest levels during the third season, except for 1000-seed weight, which was low during the second year (Figure 4).
G3715 was the first genotype to reach flowering (126.2 days) and podding (140.5 days), while G3744 exhibited the longest life span (165.7 days). On the other hand, G37, G21151, G3840, and G3673 were observed as late maturity genotypes. The highest plant height (43.4 cm) was determined in G37, whereas the shortest one was observed in G3761 (30.5 cm). G21151 had the highest number of branches (11.8) and first pod height (18.9 cm), while G3715 exhibited the lowest values for them. G3837 had the highest biological yield (7109 kg ha−1), followed by G3771 (6540 kg ha−1) and G3840 (6470 kg ha−1), whereas G3718 (3580 kg ha−1) exhibited the lowest performance. The highest grain yield (2579 kg ha−1), harvest index (37.3%), and 1000-seed weight (54.9 g) were determined in G3771. In contrast, the lowest grain yield (743 kg ha−1), harvest index (18.3%), and 1000-seed weight (21 g) were observed in G3839, G3703, and G3710, respectively (Table 2).
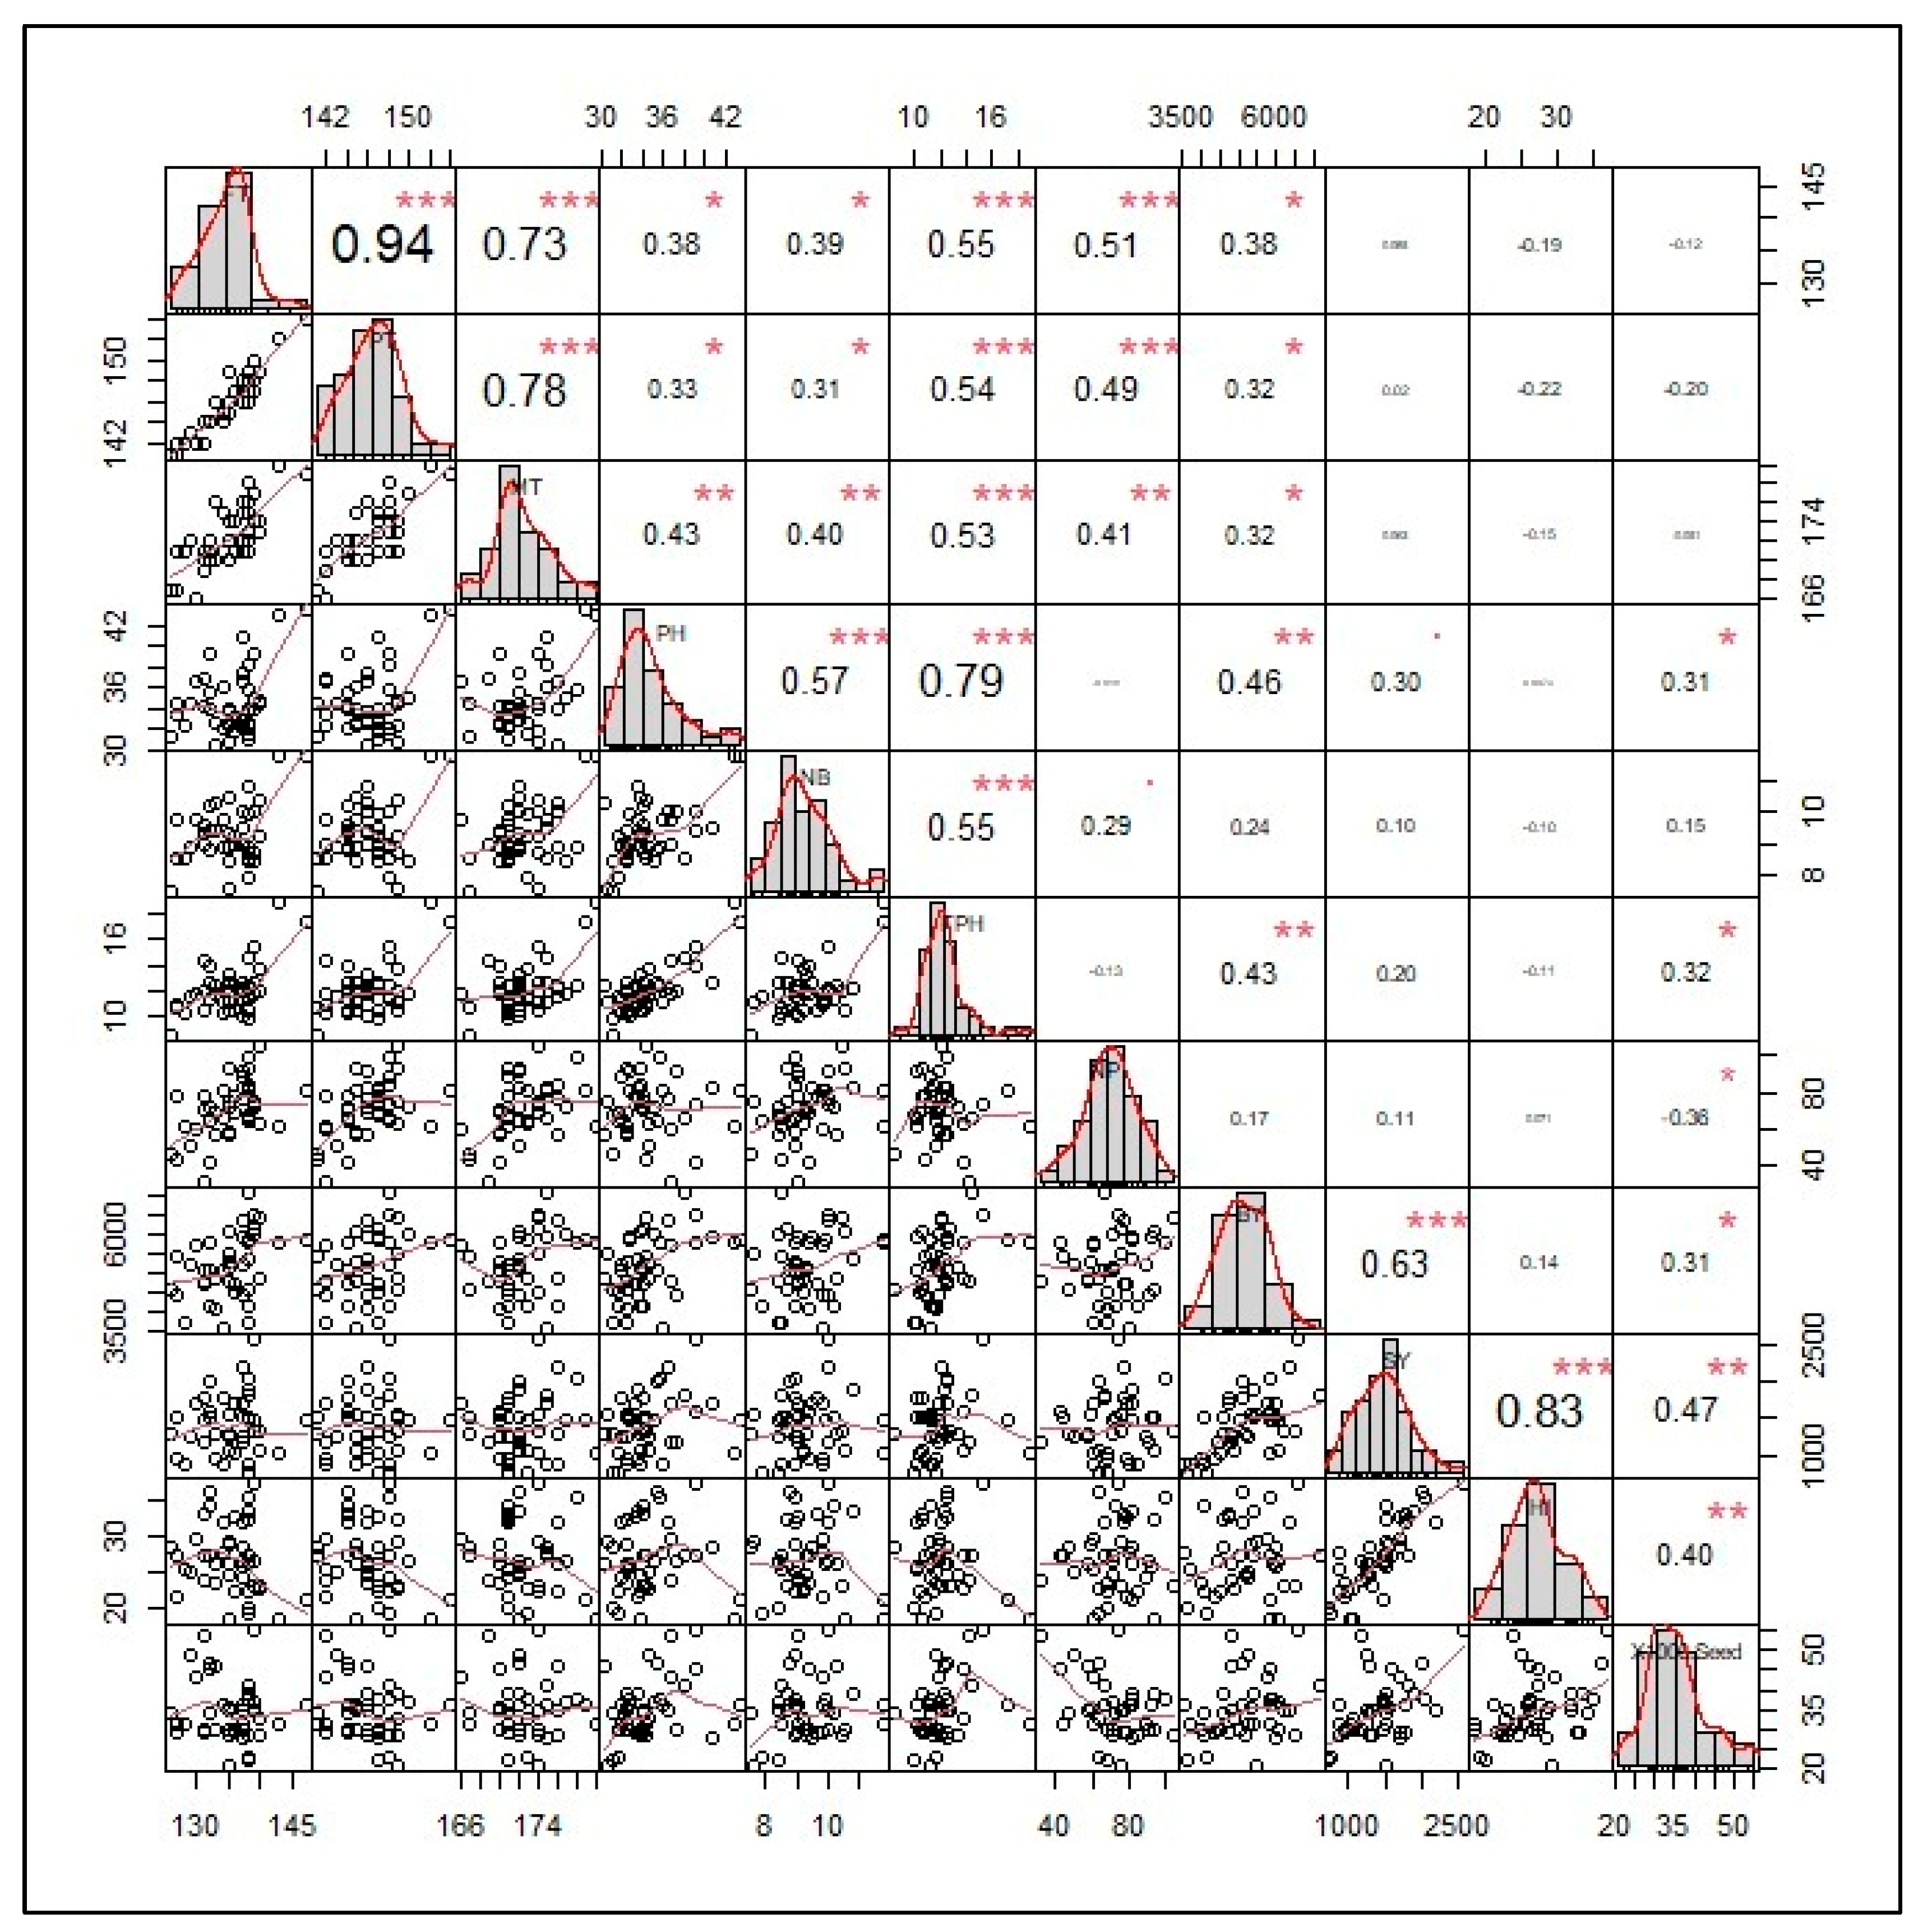
Understanding how key agronomic traits relate to one another is crucial for designing effective selection strategies in plant breeding programs focused on improving yield and adaptability. To explore these interconnections in depth, Pearson’s correlation analysis was conducted to assess pairwise relationships between traits. In the resulting matrix, the upper triangle displays Pearson correlation coefficients for each trait pair, with asterisks marking statistically significant levels (p < 0.05, p < 0.01, and p < 0.001). Strong positive correlations emerged between flowering time and podding time (0.94), flowering time and maturity time (0.78), and grain yield and biological yield (0.63). These statistically significant relationships (p < 0.001) underscore the synchronized nature of plant development and its direct ties to productivity. The number of branches exhibited strong positive correlations with plant height (0.57) and first pod height (0.55). First pod height showed significant and strong positive correlations with phenological characterizations, i.e., flowering (0.55), podding (0.54), and maturity time (0.53), due to a shorter vegetation growth period. Thus, these genotypes are far from being suitable for machine harvesting. Similarly, biological yields exhibited significant positive correlations with flowering (0.38), podding (0.32), and maturity time (0.32), in which a long vegetation period caused higher dry matter accumulation, i.e., total biomass. The matrix’s diagonal includes histograms that reveal the distribution patterns of each trait, while the lower triangle features scatterplots that illustrate both linear and nonlinear relationships. A moderately positive correlation was found between grain yield and harvest index (0.83), as well as between grain yield and 1000-seed weight (0.47), indicating that yield is influenced by both how efficiently biomass is converted and by seed size. Overall, this visual analysis offers a comprehensive view of how phenological, morphological, and yield-related traits are interconnected, providing valuable guidance for trait selection in breeding initiatives (Figure 5).
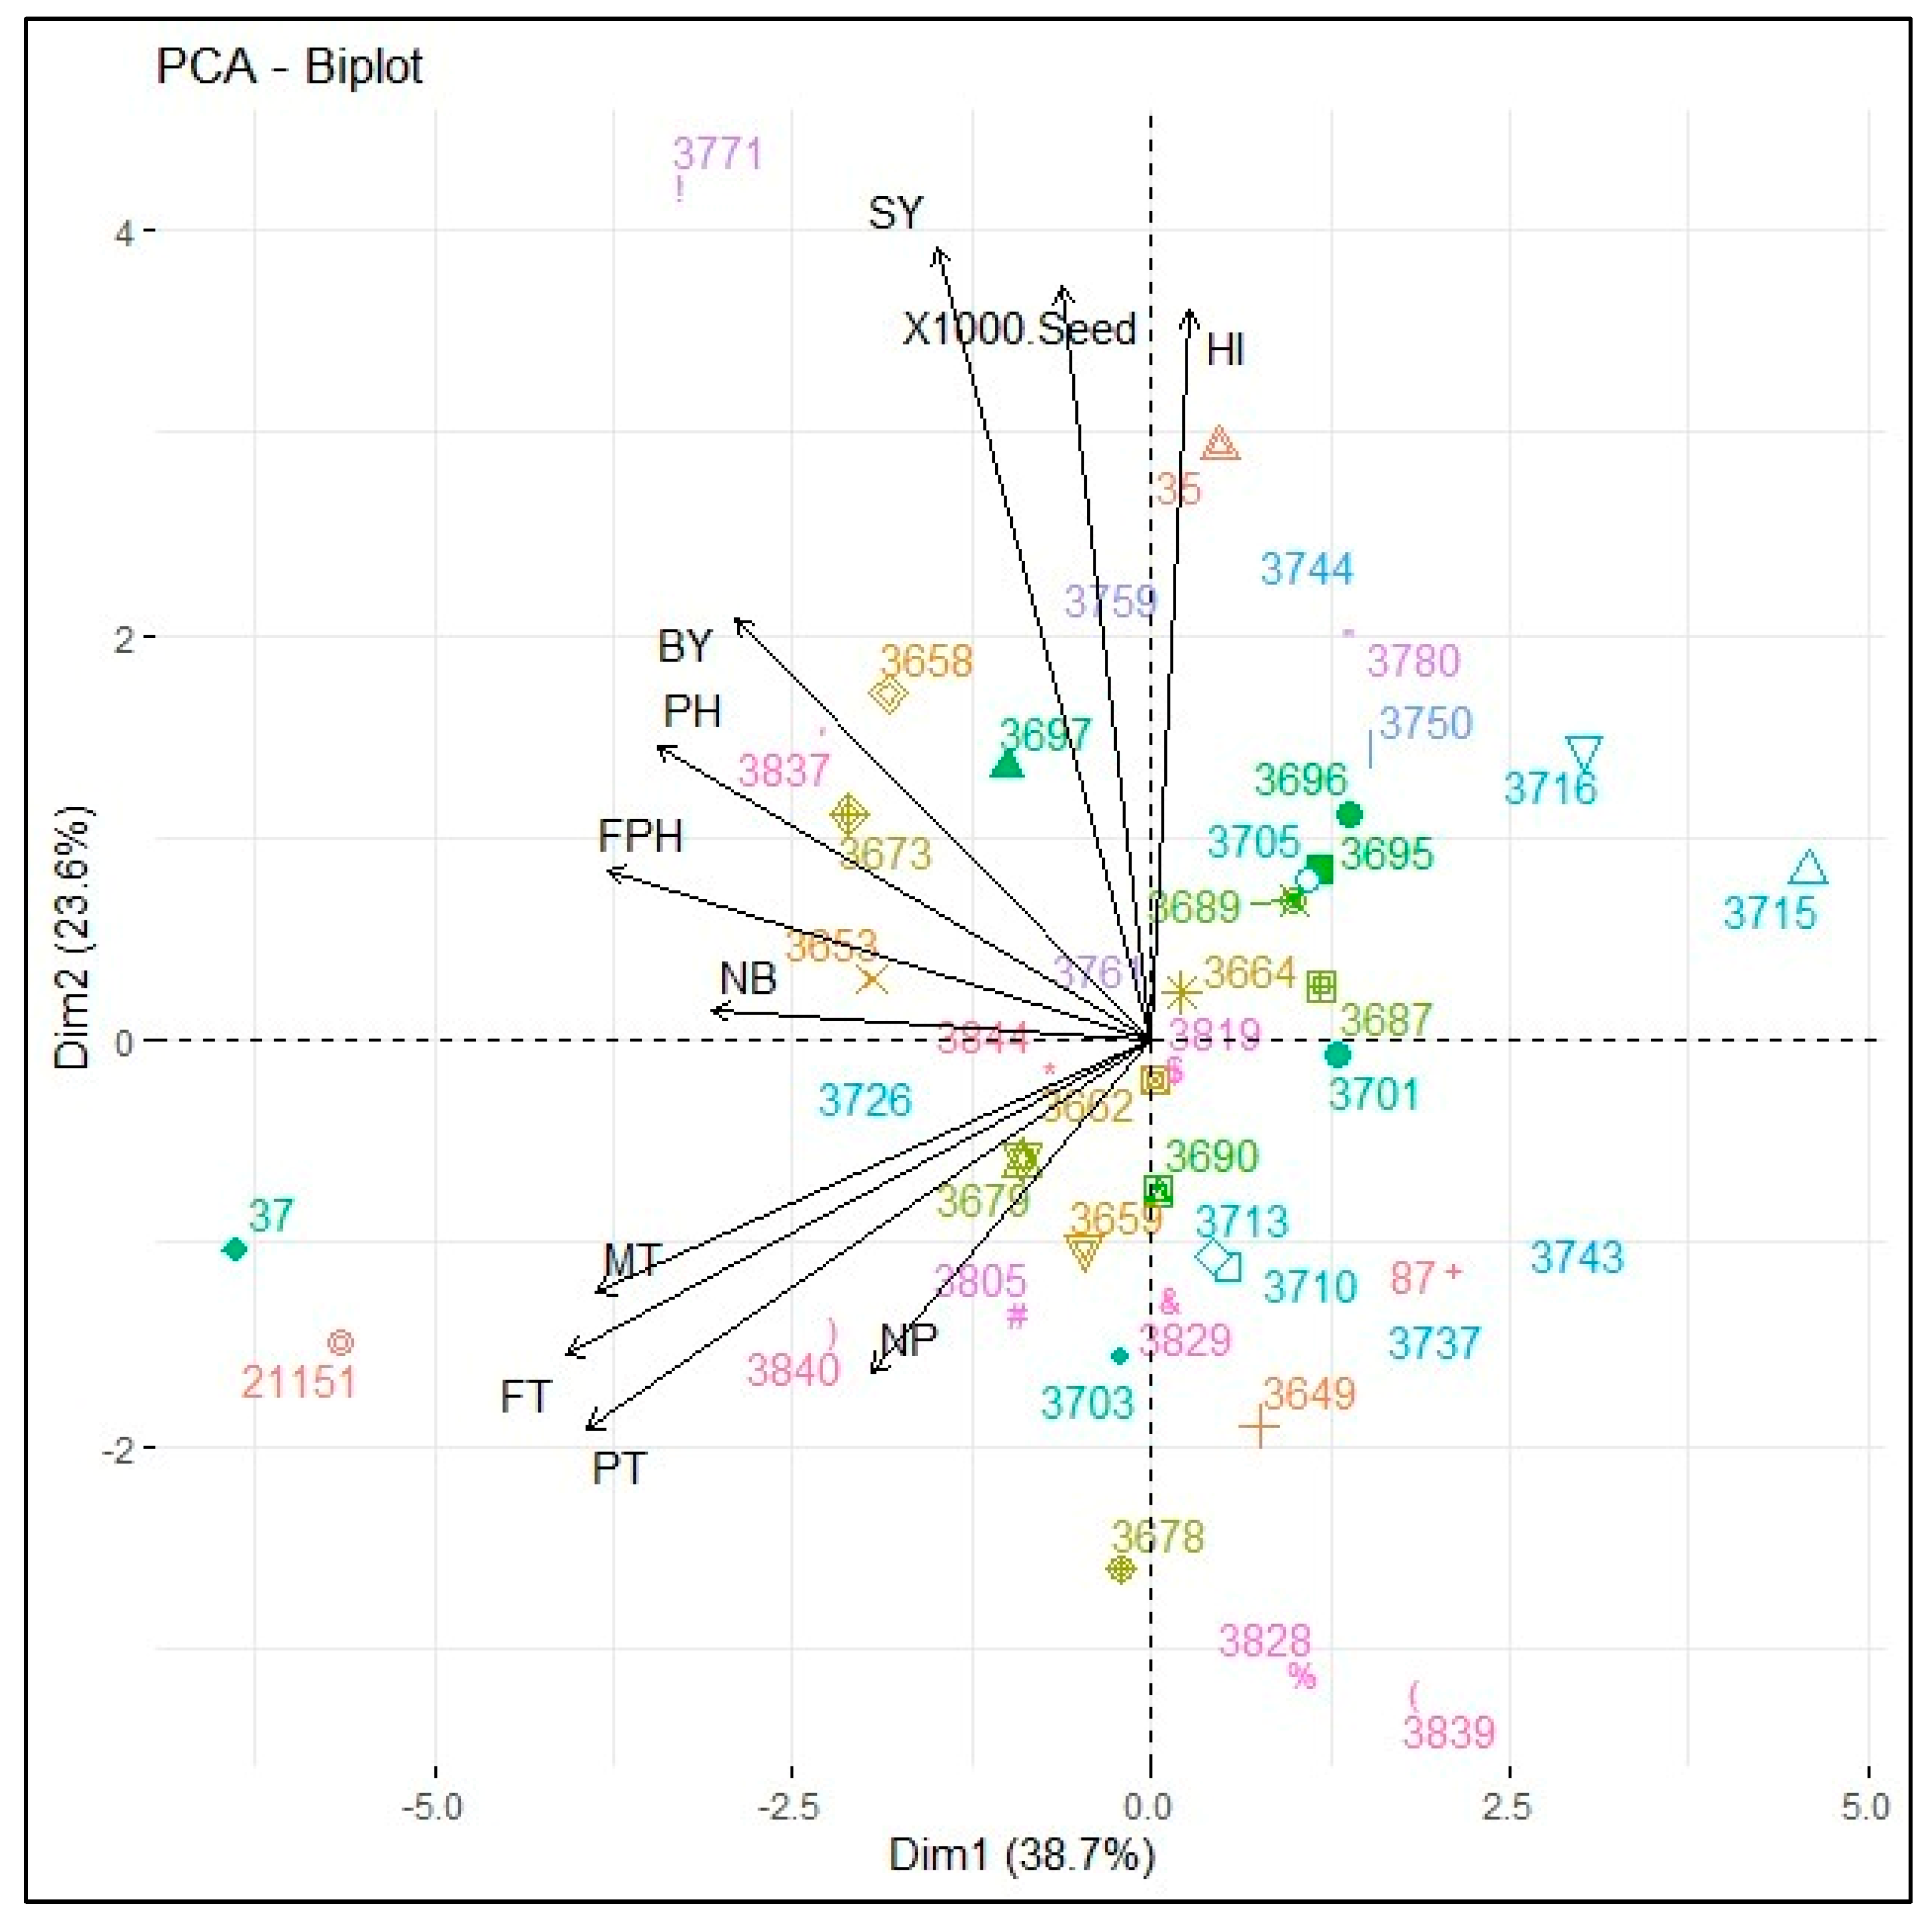
A set of eleven agronomic traits was analyzed using PCA, with the results visualized in a biplot based on data from 43 genotypes. The biplot maps genetic variations along two main principal components: PC1, which explains 38.7% of the variance, and PC2, which accounts for 23.6%, together capturing 62.3% of the total variation. In terms of plant development timing, traits like flowering time, podding time, and maturity time are oriented negatively along PC1. This means that the genotypes on the left side of the graph are typically late-maturing, while those on the right tend to mature earlier. G37 and G21151 cluster toward the late-maturing end, while G3744, G3715, and G3716 fall on the opposite side, indicating their early-maturing nature. When it comes to yield-related traits such as grain yield, 1000-seed weight, and harvest index, these are all positively aligned with PC1. G21151 and G3697 mostly presented the first pod height; therefore, they are strong candidates for elite lines in terms of machine harvesting. Genotypes falling in this quadrant are likely to offer strong yield performance. Among them, genotype 3771 is positioned closest to the grain yield vector, suggesting that it holds the highest yield potential in the group. Meanwhile, genotypes like 3689 and 3705 occupy an intermediate space on the biplot, making them particularly interesting due to their balance between early maturity and solid productivity. Their placement suggests that they could be ideal candidates for breeding programs targeting both traits (Figure 6).
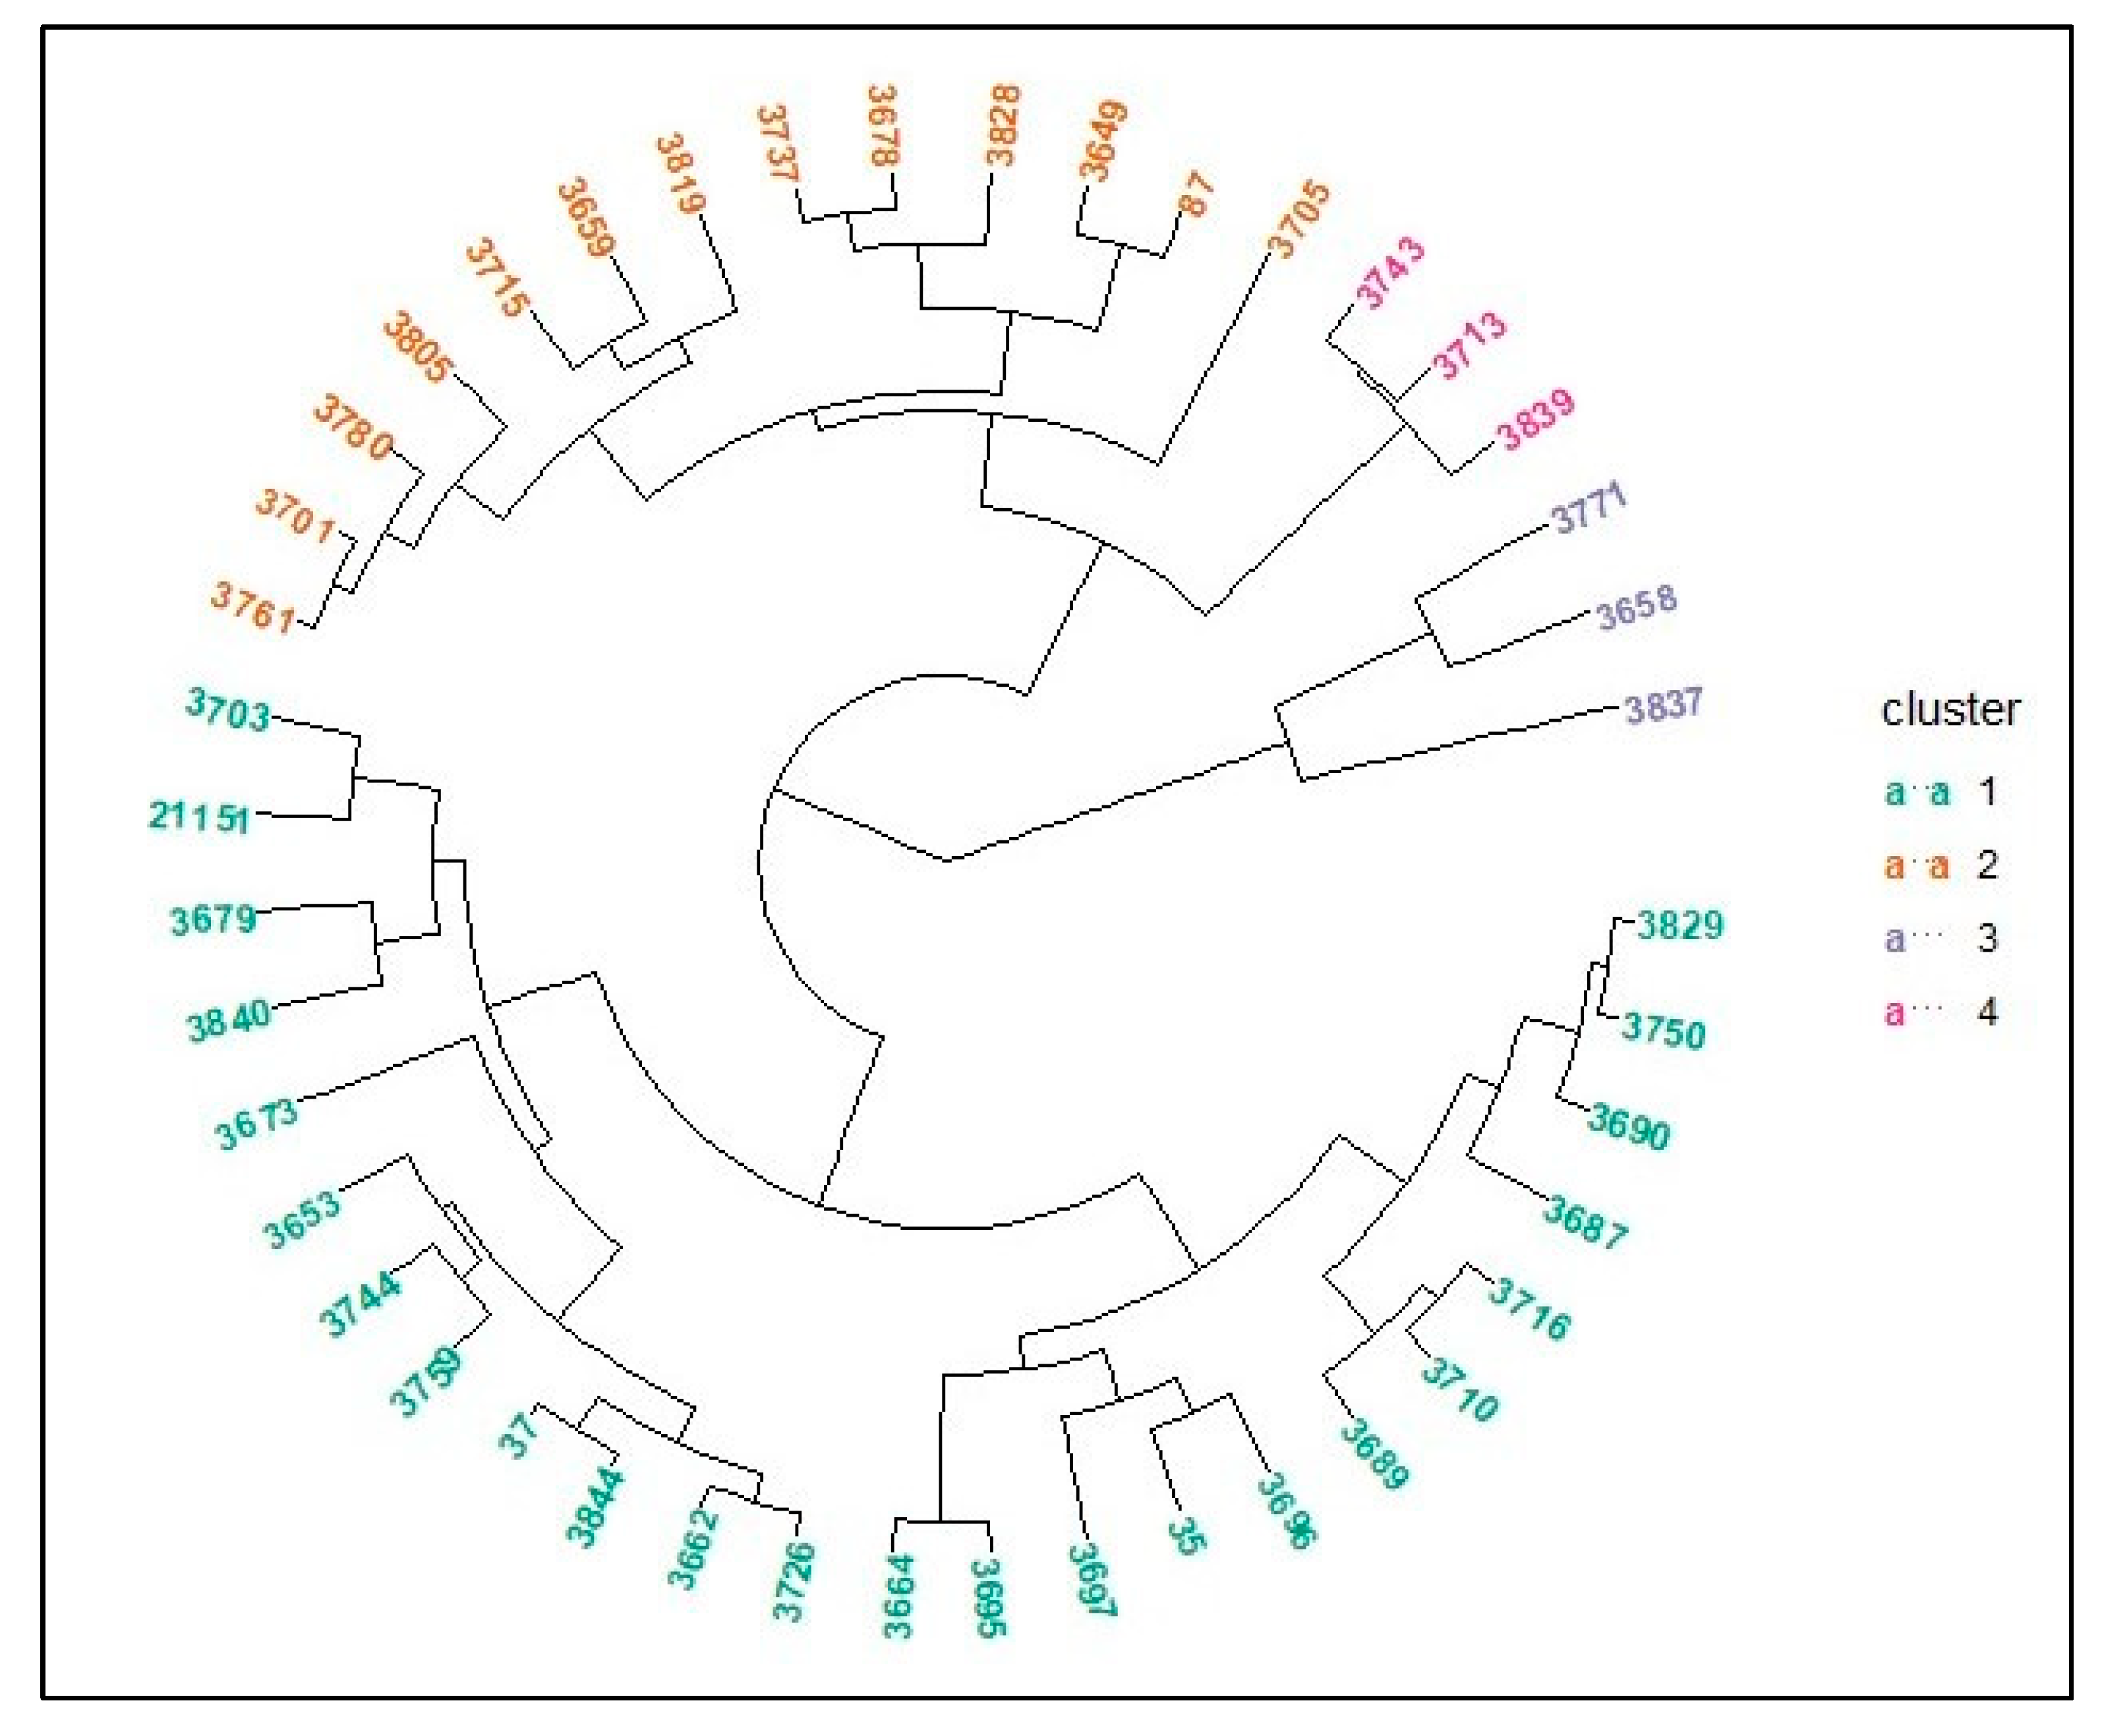
A hierarchical clustering analysis was performed on 43 genotypes based on their phenotypic and agronomic traits, resulting in four distinct clusters. Each cluster grouped genotypes with similar characteristics, and further subgroup patterns emerged, particularly along phenological and yield-related lines. These groupings reveal how traits like adaptability, earliness, and yield potential vary across the population. Among the clusters, Cluster 3 (blue group) stood out, containing genotypes G3771, G3658, and G3837. These accessions showed statistically superior performance in the grain yield, biomass production, 1000-seed weight, and harvest index. Data indicated that their yields were around 2500–2600 kg ha−1, making them strong contenders for inclusion in breeding programs. Their consistent performance over multiple years also points to solid resilience under varying climatic conditions. While yield is a key breeding goal, early development is also crucial, especially in environments prone to drought or other stressors. Cluster 1 (green group) included early-maturing genotypes like G3715 (126.2 days to flowering and 140.5 days to pod setting) and G3744 (165.7 days to maturity), which offer strategic advantages under time-sensitive growing conditions. Many genotypes in this cluster also achieved above-average yields, suggesting a beneficial balance of early phenology and productivity. In contrast, Cluster 4 (purple group) comprised late-maturing, low-yielding genotypes. Although they did not perform as well statistically, they are still valuable to breeding efforts. These genotypes may possess rare traits or unique mechanisms for coping with harsh environments, making them important for preserving and expanding genetic diversity in future lentil improvement initiatives (Figure 7).
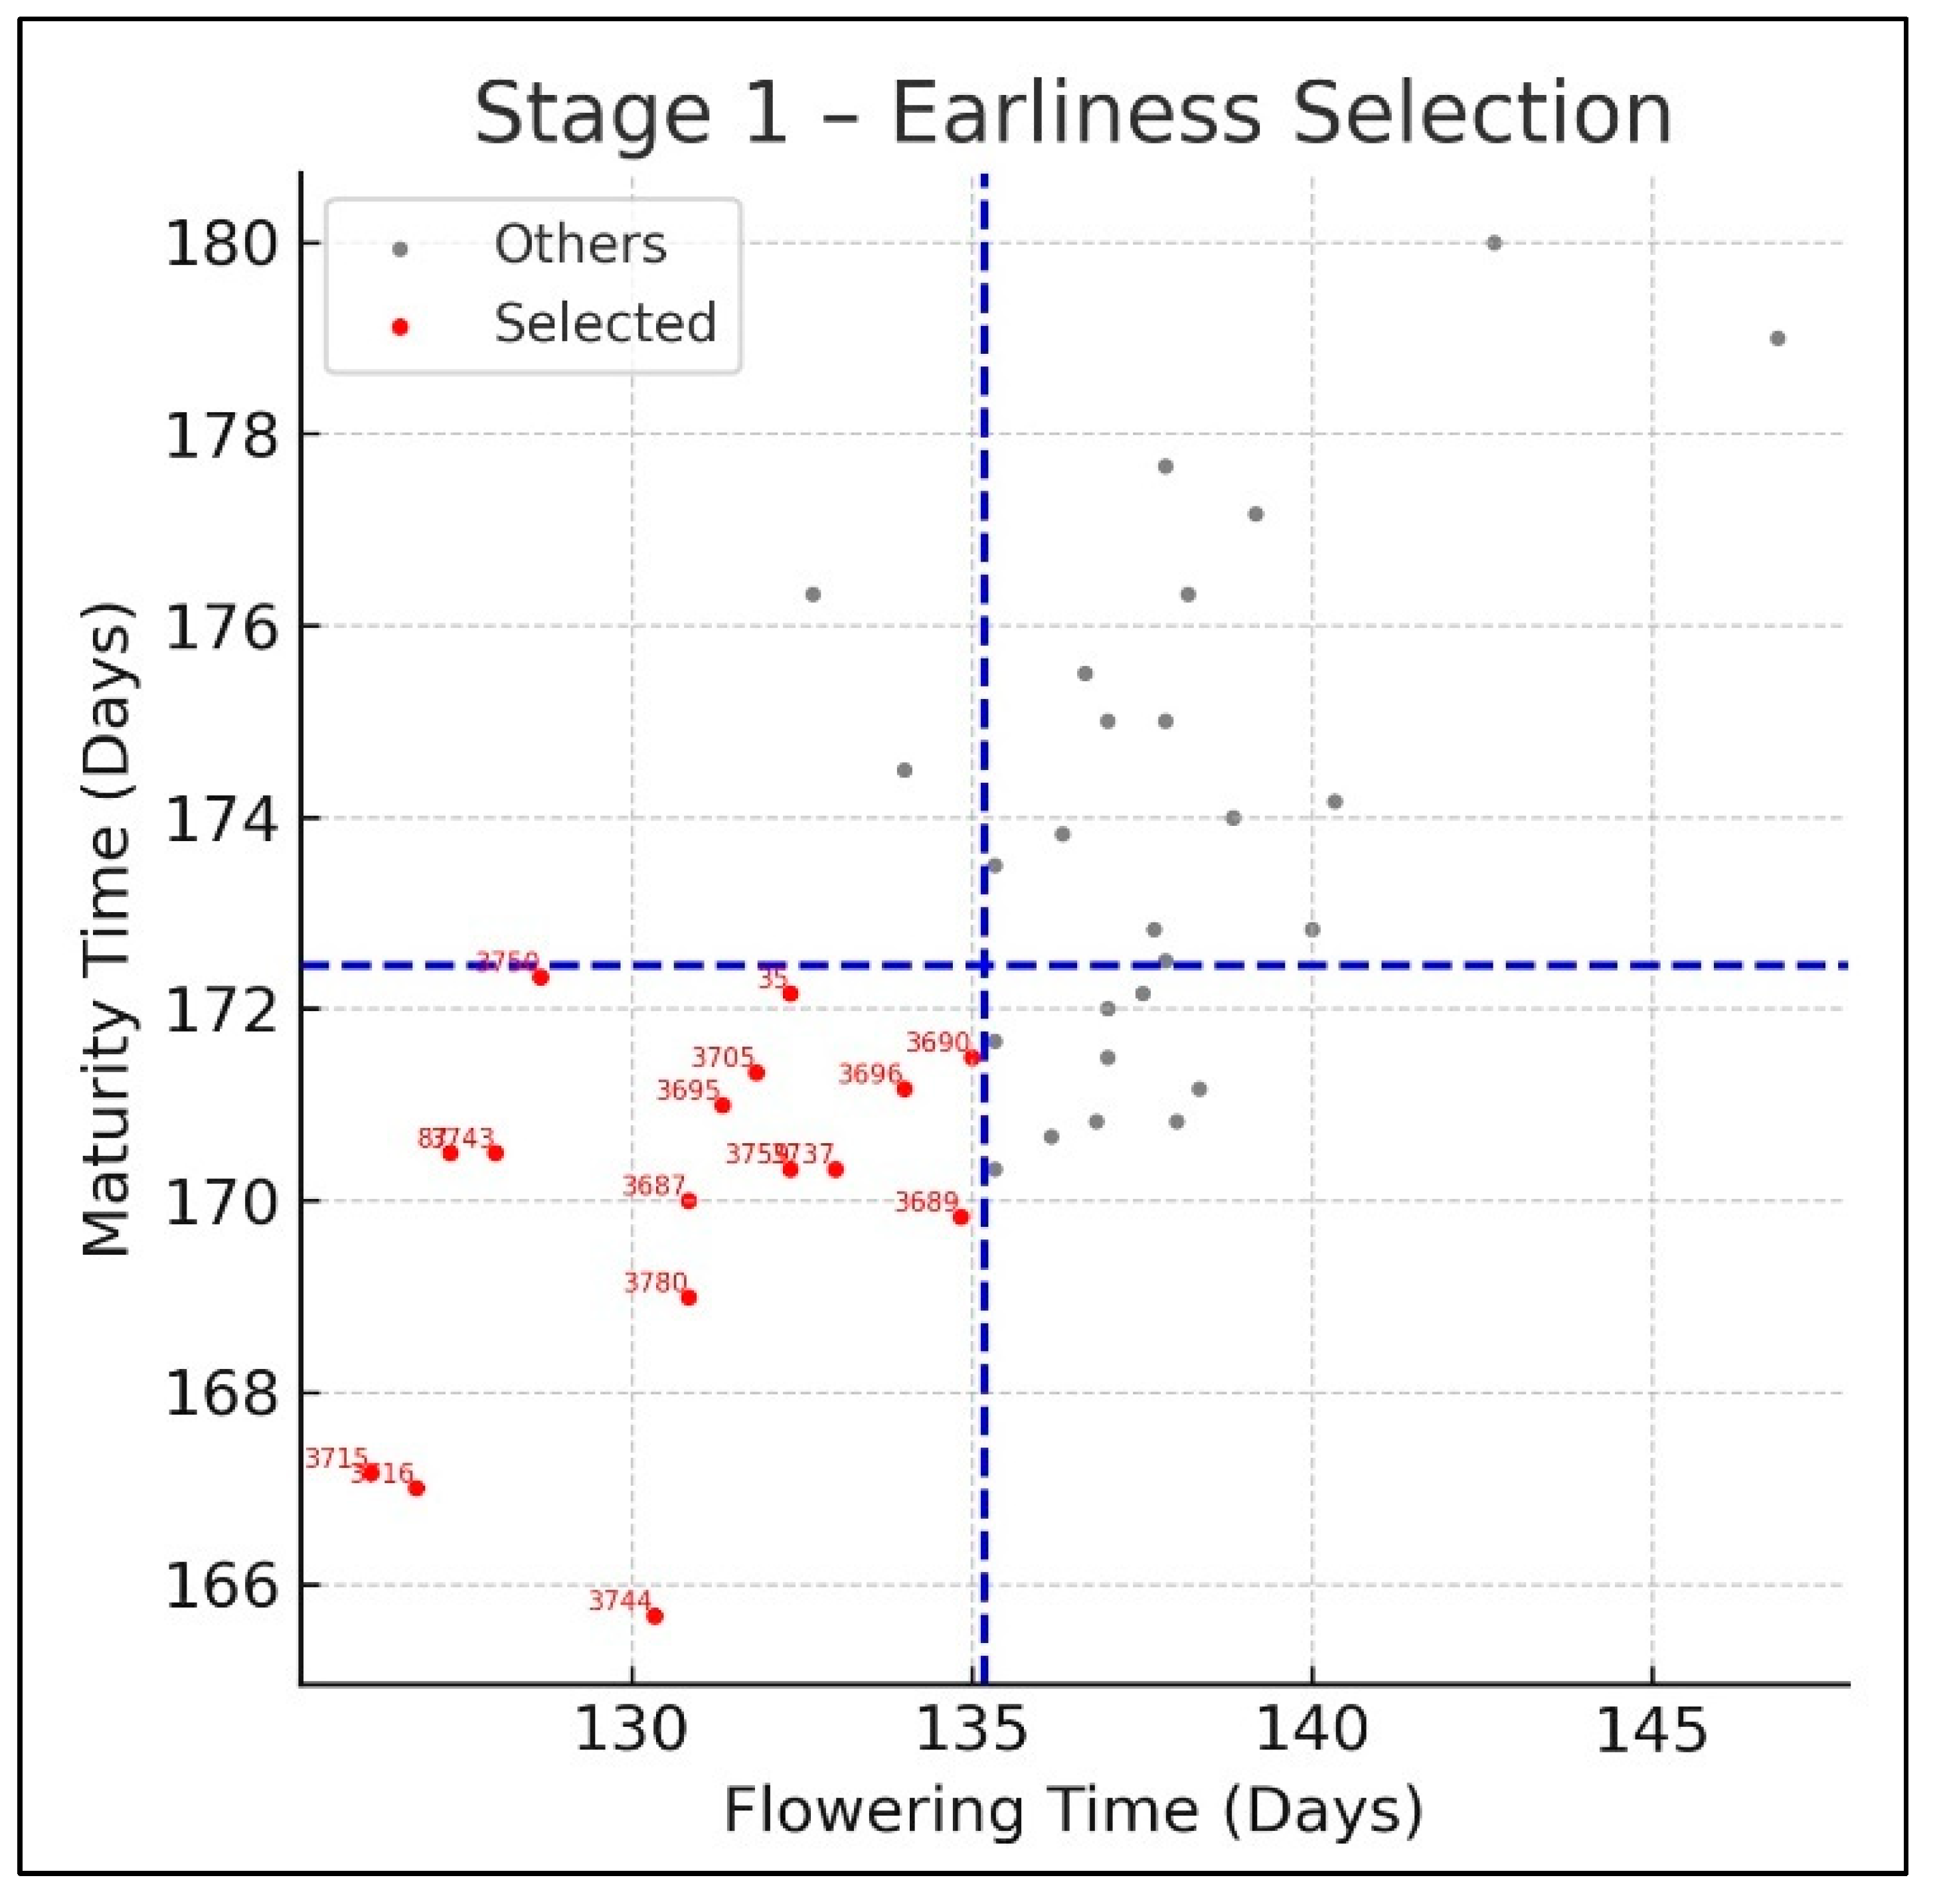
In the first stage of genotype selection, a two-dimensional scatter plot was used to evaluate flowering and maturity times, with the aim of identifying early-maturing lines. Genotypes positioned below the population mean for both traits—represented by dashed blue lines—were considered desirable and selected for further analysis. This threshold-based filtering resulted in the identification of 18 genotypes exhibiting early flowering (<135 days) and early maturity (<172 days). Among them, lines such as G3744, G3715, and G3716 stood out as the earliest candidates. These selections are agronomically advantageous, as early-maturing genotypes are more likely to escape terminal drought stress, align with short-season cropping systems, and enable earlier harvesting. This initial filtering helped narrow the focus of subsequent stability and multi-trait evaluations to genotypes with phenological characteristics favorable for adaptation under variable or marginal growing conditions (Figure 8).
In the second stage, the Modified Multi-Trait Stability Index (MTSI) was applied to assess the stability of early-maturing genotypes based on two yield-related traits: biological yield and grain yield. The bar chart ranks genotypes by their MTSI scores, where lower scores indicate greater proximity to the ideotype, reflecting both high performance and stability across years. Genotypes G3744 (1.27), G3759 (1.48), and G35 (1.63) were identified as the most stable and high-yielding lines. In contrast, genotypes such as G3743 (4.91) and G3745 (5.50) had higher MTSI scores, suggesting either lower performance or greater instability across seasons. This selection step is crucial in refining candidates that not only flower and mature early but also maintain consistent yield performance. By incorporating multi-year yield data into a single stability metric, the MTSI enables the prioritization of genotypes that are more likely to perform reliably under variable environmental conditions, a key requirement for climate-resilient lentil breeding (Figure 9).
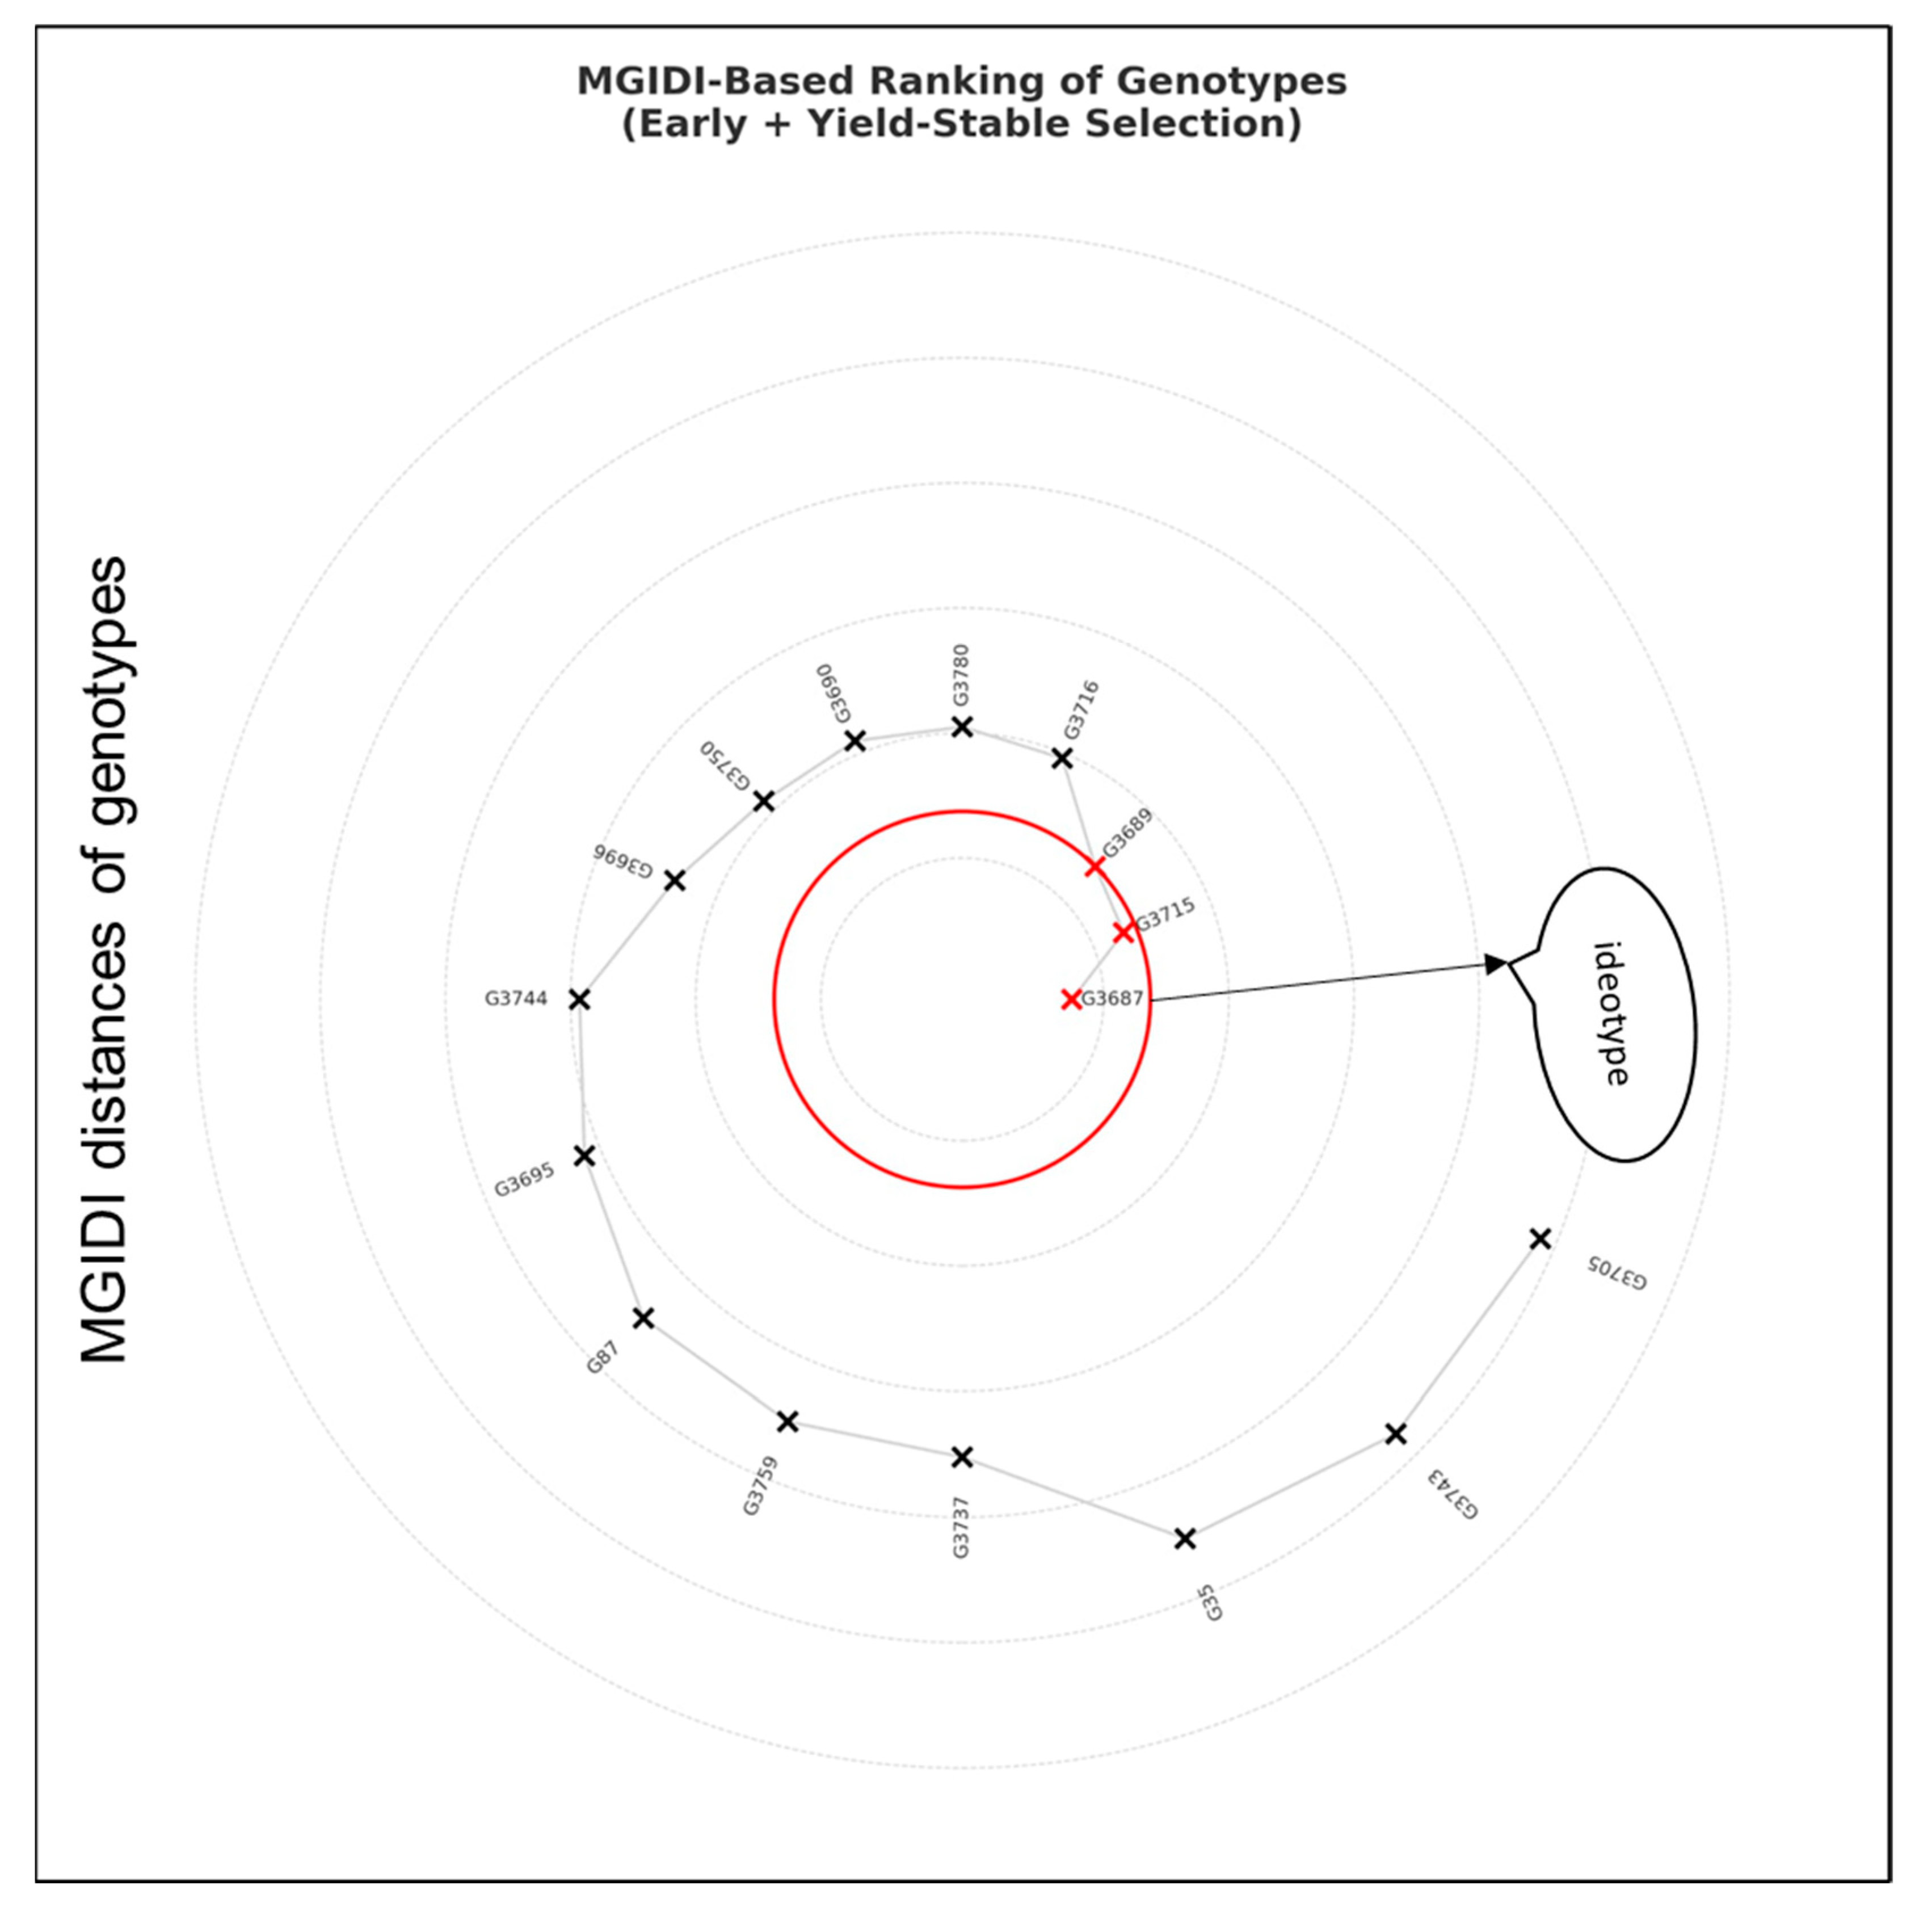
In the final stage of the selection process, the Multi-Trait Genotype-Ideotype Distance Index (MGIDI) was used to identify genotypes combining earliness and yield stability across multiple traits (Table A3). This index integrates information from phenological (flowering and maturity time) and yield-related (biological yield, grain yield, and harvest index) traits, using factor analysis to reduce dimensionality and account for correlations. The spiral plot represents genotypes positioned according to their MGIDI scores, with proximity to the center indicating greater similarity to the ideotype (i.e., optimal multi-trait performance). Genotypes within the innermost red circle represent the top 20% of selections. Among the early and stable candidates, G3687 ranked closest to the ideotype, followed by G3715 and G3689. These genotypes demonstrated a balanced performance across all considered traits, making them promising lines for advancing breeding programs. In contrast, genotypes located farther from the center exhibited deviations in one or more trait dimensions, reducing their composite desirability. The MGIDI thus provides a robust framework for multi-trait selection, ensuring genetic gain while maintaining trait harmony and stability (Figure 10).

4. Discussion

This study assessed the phenological, morphological, and agronomic characteristics of 43 lentil genotypes across three consecutive growing seasons. The results clearly show that yearly climate fluctuations significantly affect lentil growth and productivity. The 2019–2020 season, which had the most favorable rainfall and temperature patterns, as well as better soil conditions, saw the highest values for grain yield, biomass, harvest index, and pod number. In addition to climatological differences, higher P and K concentrations in the experimental soils during the 2019–2020 season may positively affect the results. In contrast, the 2020–2021 season experienced severe drought and elevated temperatures during crucial growth stages, leading to poorer performance across most traits. These findings underscore the importance of selecting climate-resilient genotypes that can maintain stable output despite abiotic stress, supporting earlier research that stresses the role of genetic adaptation in unpredictable environments [11].
The noticeable differences in traits like flowering and maturity times between years further highlight the sensitivity of lentils to environmental variation. Genotypes such as G3744, G3715, and G3716 displayed early phenology, while G21151 and G37 (local check) had longer vegetative phases. Early flowering and maturity can be especially advantageous in drought-prone areas, allowing plants to avoid heat and water stress during reproductive development. These observations are consistent with Neupane et al. [5], who pointed out the importance of early development stages in enhancing lentil adaptation to dry climates. Another reason for focusing on the selection of early-maturing genotypes in this study is their suitability for double cropping. The Southeastern Anatolia Region of Turkey is highly favorable for second crop cultivation due to its high cumulative temperature values and prolonged summer season. In this region, crops such as maize and cotton are commonly grown as second crops [27]. However, in such systems, high temperatures coinciding with the flowering period pose a significant risk to both yield and quality [28]. This is because elevated temperatures can negatively affect pollination and fertilization processes. Therefore, among the genotypes exhibiting high yield stability, those with early-maturing characteristics were prioritized in this study.
Correlation analyses also revealed that grain yields were strongly linked with biological yields (r = 0.63), the harvest index (r = 0.83), and the 1000-seed weight (r = 0.47), echoing the findings of Fratini and Pérez de la Vega [2], who emphasized seed weight and biomass as major contributors to yield. Moreover, flowering times correlated closely with both podding (r = 0.94) and maturity (r = 0.78), suggesting that lentils exhibit synchronized growth responses to environmental cues—an important trait under changing climate conditions.
Interestingly, some genotypes with lower yield potential, like G3839, G3828, and G3713, displayed late phenology and other suboptimal traits. Despite this, they may still hold valuable genetic traits or stress-response mechanisms that are crucial for long-term breeding strategies. This reinforces the perspective of Kumar et al. [8] and Guerra-Garcia et al. [9], who advocate conserving low-yield but genetically diverse accessions. Variations in morphological traits, such as plant height and branch number, also offer useful breeding insights. G21151 had the highest number of branches and first pod height—traits that could be beneficial in low-input environments and suitable for machine-based harvesting. Previous studies have identified such morphological plasticity as a key asset for improving drought tolerance and yield reliability [6].
Another critical subject is the suitability of the machine harvesting of genotypes. First pod height is the key indicator of mechanical harvestability [29]. G21151 (18.9 cm), G37 (17.3 cm), and G3771 (15.3 cm) came to the fore with the highest first pod height, whereas the lowest ones were observed in G3715 (8.49 cm), G3839 (9.9 cm), and G3662 (10.1 cm). In particular, G3771 exhibited the highest mean yield performance throughout three years and high mechanical harvestability; however, low yield stability and adaptation to unfavorable conditions reduced its selection score. On the other hand, advanced selection algorithms indicated that G3715 exhibited high yield stability and adaptation to stringent conditions, as well as high earliness characterization; however, its mechanical harvestability was low. Given the importance of mechanical harvesting suitability in large-scale lentil cultivation, it is recommended to cross this genotype—characterized by high yield stability—with compatible genotypes in breeding programs to develop more efficient lines [30].
Among all the genotypes, G3771 proved to be a standout performer, delivering top values in grain yield (2579 kg ha−1), 1000-seed weight (54.9 g), and harvest index (37.3%). However, its reliable performance across years was low, in which higher precipitation and nutrient status promoted total biomass and grain yield, whereas difficult conditions, i.e., low rainfall and nutrient status, inhibited the genotype’s performance. On the other hand, another factor affecting the year-to-year stability of genotypes is soil properties. The phosphorus (113 kg ha−1) and potassium (1561 kg ha−1) contents detected in the 2019–2020 season were significantly lower in the 2020–2021 and 2021–2022 seasons. Phosphorus plays a critical role in key developmental stages such as root development, flowering, and metabolic energy production by contributing to the structure of ATP [31]. Potassium, on the other hand, is involved in water uptake, the maintenance of ionic balance, stomatal regulation, and shaping plant responses to drought stress [32]. The deficiency of these nutrients not only impairs root development but also reduces photosynthetic efficiency [33]. Therefore, in addition to unfavorable meteorological conditions, soil-based factors are also thought to have contributed to the reduced yield stability of the L3771 genotype [34]. Previous studies conducted in the experimental region have shown that phosphorus deficiency in soils is widespread [35,36]. Thus, the low tolerance of certain genotypes to phosphorus deficiency may limit their potential to be high-yielding under such conditions. Future studies comparing genotypic responses to drought stress under different nutrient regimes will help better understand the mechanisms of genetic adaptation. Biological yield, grain yield, and harvest index fluctuated up to 97%, 216%, and 76% depending on the experimental years, respectively. These strong alterations between seasons caused a reduction in the yield stability of L3771 (Figure A1). These results are also supported by previous field trials in the same region, which included both local and high-yielding cultivars [35,36]. PCA and hierarchical clustering confirmed the strong performance of G3771, grouping it with other productive genotypes like G3837 and G3658. This aligns with earlier studies where multivariate approaches were successfully used to identify promising genotypes in varied stress environments [7]. However, no stability in genotypes across experimental years complicates the genotype selection for climate resilience. Overall, advanced selection methods such as Modified MTSI and MGIDI have critical roles in reliable genotype selection and yield stability under changing conditions. These methods have been validated and are widely used in genotype selection studies for crops like guar [22], okra [23], Norway spruce [37], and forage sorghum [38]. The MGIDI, in particular, has been proposed as a reliable alternative to traditional linear indices, minimizing multicollinearity and enabling greater genetic gains [39]. According to MGIDI results, G3687, G3715, and G3689 exhibited the most stable and reliable genotypes under changing climate conditions such that they had low grain yields depending on the mean of experimental years compared with G3771. However, G3771’s lower ranking was due to its unstable performance and less favorable earliness traits. Unlike correlation analysis, which only reveals linear relationships between trait pairs, MGIDI and MTSI provide a more comprehensive selection framework. These indices enabled the identification of genotypes, such as G2115 and G3401, that exhibit both high performance and trait stability, offering more actionable insights for breeding decisions.

5. Conclusions

This multi-seasonal field study emphasized the substantial impact of climate variability on the phenological and agronomic performance of lentil genotypes in Southeastern Türkiye. The evaluation of 43 genotypes, including 42 from ICARDA and 1 local check (Fırat-87), revealed considerable variations across years and genotypes that were shaped by differences in precipitation, temperature, and soil fertility. Grain yields varied between 743 and 2579 kg ha−1 in the experiment. Among genotypes, G3771 emerged as the top performer in terms of grain yield, seed size, and harvest index, although its yield stability across years was lower. On the other hand, G37 local check (1504 kg ha−1), G3761 (1453 kg ha−1), and G3673 (1497 kg ha−1) exhibited the highest yield performance under severe drought conditions; however, their yield stability and earliness characteristics were low. Advanced multivariate selection tools—Modified Multi-Trait Stability Index (MTSI) and Multi-Trait Genotype-Ideotype Distance Index (MGIDI)—proved to be instrumental in identifying genotypes with both high yield and stability. Genotypes like G3687, G3715, and G3689, despite moderate yields, showed superior stability and early maturity traits, positioning them as valuable resources for climate-resilient breeding programs. Early-maturing genotypes such as G3715, G3716, and G3744 demonstrated strong potential for drought escape strategies, offering timely flowering and maturity aligned with erratic rainfall patterns. The use of PCA and hierarchical clustering validated these findings, clearly separating genotypes with desirable trait combinations. Overall, this study reinforces the strategic role of genetic diversity, phenological adaptation, and robust trait-based selection indices in breeding lentils that can withstand the growing challenges posed by climate change. ICARDA’s germplasm remains a vital resource for developing high-performing and stable cultivars suitable for variable environments in semi-arid regions.

Author Contributions

Conceptualization, M.C. and F.Ç.; methodology, M.C., F.Ç. and M.E.; software, M.C. and F.C.; validation, M.E. and F.Ç.; formal analysis, F.C.; investigation, M.C.; resources, M.C. and F.Ç.; data curation, M.C. and F.Ç.; writing—original draft preparation, M.C.; writing—review and editing, F.Ç., M.E. and F.C.; visualization, M.C. and F.C.; supervision, M.E. All authors have read and agreed to the published version of the manuscript.

Funding

This research received no external funding.

Data Availability Statement

All related data were given in the main text.

Conflicts of Interest

The authors declare no conflicts of interest.

Abbreviations

The following abbreviations are used in this manuscript:
ICARDAInternational Center for Agricultural Research in the Dry Areas;
ICP-OESInductively Coupled Plasma Optical Emission spectroscopy;
ANOVAAnalysis of variance;
PCAPrincipal component analysis;
MTSIModified Multi-Trait Stability Index;
MGIDIMulti-Trait Genotype-Ideotype Distance Index;
YxGYear x genotype interaction.

Appendix A

Table A1. Pedigree information of ICARDA and local lentil genotypes.
Germplasm IDDesignationThe Pedigree String of the Germplasm
37Cv.Fırat-87Local check
87ILL8006ILL8006
3705x2011s_11_12ILL4605XBARIMASUR-6
3703x2011s_110_23ILL8007XILL759
3689x2011s_129_13FLIP96-49LXFLIP97-33L
3701x2011s_130_1ILL4402XILL7979
3805x2011s_139_4ILL4402XILL7950
3687x2011s_171_13Barimusor-6xL-7713
3695x2011s_171_2Barimusor-6xL-7713
3696x2011s_203_2ILL10749XILL3597
3664x2011s_221_5ILL10750XILL1959
3690x2011s_226_6ILL10800XILL4419
3649x2011s_59_20L-4147XILL4649
3839x2011s_60_28L-4147XILL4649
3697x2011s_72_54ILL7978XILL7537
3771x2011s133_119_15FLIP97-29LXFLIP97-33L
3750x2011s17_20_3BARIMASUR-6XLIRL-22-46-1-1-1-0
3780x2011s242_230_3ILL10801XILL2711
3761x2011s91_77_6ILL4605XILL5597
3744x2013_126_54FLIP97-34LXFLIP97-33L
3743x2013_171_17Barimusor- 6xL-7713
3737x2013_19_16BARIMASUR-6XLIRL-21-50-1-1-1-0
3715x2013_20_7BARIMASUR-6XLIRL-22-46-1-1-1-0
3716x2013_21_2BARIMASUR-6XLIRL-22-46-1-1-1-0
21151ILL2245ILL2245
35ILL4605ILL4605
3819x2011s_118_12FLIP97-29LXFLIP97-33L
3713x2011s_119_25FLIP97-29LXFLIP97-33L
3673x2011s_172_34ILL7723XADA’A
3662x2011s_161_1ILL8008XILL8010
3653x2011s_172_34ILL7723XADA’A
3840x2011s_183_16ILL7115XILL2585
3658x2011s_204_23ILL10750X33108
3679x2011s_204_30ILL10750X33108
3844x2011s_35_36ILL10731XILL4637
3710x2011s_55_22ILL4605XL-4147
3678x2011s_55_9ILL4605XL-4147
3659x2011s_60_48L-4147XILL4649
3829x2011s_63_9ILL3796XILL4605
3828x2011s_75_17ILL7978XILL5888
3837x2011s_97_17ILL5883XILL10750
3759x2011s91_76_4ILL4605XILL5597
3726x2013_126_8FLIP97-34LXFLIP97-33L
Table A2. Analysis of variance for the phenological and agronomic traits of lentil genotypes across three growing seasons.
Sum of Square/F Prob.
TraitsYearGenotypeY × G
Flowering time8877.5 **224.3 **29.5 **
Podding time5604.0 **92.9 **10.2 **
Maturity time1774.5 **109.8 **28.4 **
Plant height16,885 **110.6 **29.1 **
Number of branches per plant3573.4 **10.6 **11.8 **
First pod height6052.6 **43.1 **20.9 **
Number of pods per plant606,085 **2926 **2427 **
Biological yield796,196,793 **8,544,848 **6,849,222 **
Seed yield73,658,759 **1,936,561 **1,060,640 **
Harvest index275.5 **287.5 **169.8 **
1000-seed weight3.68 **685.6 **53.7 **
(**: p < 0.01)
Table A3. Trait-based filtering and MGIDI optimization for elite genotype selection.
GenotypeFloweringMaturityBiological YieldSeed YieldHarvest IndexMGIDI
3687130.83170.005058.831462.8627.330.39
3715126.17167.174591.171298.9328.310.62
3689134.83169.835315.671545.7328.690.67
3716126.83167.005414.331519.6427.450.92
3780130.83169.004790.001175.9923.720.96
3690135.00171.505147.221280.6124.580.99
3750128.67172.335217.671243.4824.960.99
3696134.00171.175067.001772.0131.881.10
3744130.33165.675729.331689.9229.451.35
3695131.33171.004757.171774.2533.301.45
87127.33170.504396.17943.3221.291.59
3759132.33170.335825.001598.3927.121.61
3737133.00170.334044.89941.6723.511.62
35132.33172.175112.502004.3436.222.06
3743128.00170.503700.72870.8725.202.17
3705131.83171.334116.721522.1234.242.21
Figure A1. Visualization of the yield stability (A) with seed weight and harvest index (B) of L3771 throughout three experimental years. Lowercase letters indicate significant differences at 0.05 level.
Agronomy 15 01554 g0a1

References

  1. Singh, M.; Bisht, I.S.; Kumar, S.; Dutta, M.; Bansal, K.C.; Singh, A.K.; Sarker, A. Global wild annual Lens collection: A potential resource for lentil genetic base broadening and yield enhancement. PLoS ONE 2014, 9, e107781. [Google Scholar] [CrossRef] [PubMed]
  2. Fratini, R.M.; Pérez de la Vega, M. Lentil. In Broadening the Genetic Base of Grain Legumes; Singh, M., Upadhyaya, H.D., Bisht, I.S., Eds.; Springer: Berlin/Heidelberg, Germany, 2014; pp. 123–149. [Google Scholar] [CrossRef]
  3. Dissanayake, R.; Braich, S.; Cogan, N.O.I.; Smith, K.; Spangenberg, G.C.; Kaur, S. Characterization of genetic and allelic diversity amongst cultivated and wild lentil accessions for germplasm enhancement. Front. Genet 2020, 11, 546. [Google Scholar] [CrossRef] [PubMed]
  4. Tullu, A.; Diederichsen, A.; Suvorova, G.; Vandenberg, A. Genetic and genomic resources of lentil: Status, use and prospects. Plant Genet. Res. 2011, 9, 19–29. [Google Scholar] [CrossRef]
  5. Neupane, S.; Dhakal, R.; Wright, D.M.; Shrestha, D.K.; Shrestha, J. Strategic identification of new genetic diversity to expand lentil (Lens culinaris Medik.) production (using Nepal as an example). Agronomy 2021, 11, 1933. [Google Scholar] [CrossRef]
  6. Dikshit, H.K.; Singh, A.; Singh, D.; Aski, M.S.; Prakash, P. Genetic diversity in Lens species revealed by EST and genomic simple sequence repeat analysis. PLoS ONE 2015, 10, e0138101. [Google Scholar] [CrossRef] [PubMed]
  7. Lombardi, M.; Materne, M.; Cogan, N.O.I.; Rodda, M.S.; Daetwyler, H.D.; Slater, A.T. Assessment of genetic variation within a global collection of lentil (Lens culinaris Medik.) cultivars and landraces using SNP markers. BMC Genet. 2014, 15, 150. [Google Scholar] [CrossRef]
  8. Kumar, J.; Gupta, S.; Dubey, S.; Gupta, P.; Gupta, D.S. Genetic diversity changes in Indian lentils over the times. J. Plant Biochem. Biotechnol. 2018, 27, 456–464. [Google Scholar] [CrossRef]
  9. Guerra-Garcia, A.; Haile, T.; Ogutcen, E.; von Wettberg, E.; Wright, D. An evolutionary look into the history of lentil reveals unexpected diversity. Evol. Appl. 2022, 15, 822–835. [Google Scholar] [CrossRef]
  10. Wright, D.M.; Neupane, S.; Heidecker, T.; von Wettberg, E.J.B. Understanding photothermal interactions will help expand production range and increase genetic diversity of lentil (Lens culinaris Medik.). Plants People Planet 2021, 3, 75–89. [Google Scholar] [CrossRef]
  11. Khazaei, H.; Caron, C.T.; Fedoruk, M.; Diapari, M.; Vandenberg, A.; Bett, K.E. Genetic diversity of cultivated lentil (Lens culinaris Medik.) and its relation to the world’s agro-ecological zones. Front. Plant Sci. 2016, 7, 1093. [Google Scholar] [CrossRef]
  12. FAO 2025. Lentil Production on the World. Available online: https://www.fao.org/faostat/en/#data/QCL (accessed on 13 June 2025).
  13. Anonymous. Crop Report-Lentil; Ministry of Agriculture and Forestry of Repablic of Türkiye: Ankara, Türkiye, 2022.
  14. GAPUTAEM. Registration Information of Fırat-87 Lentil Cultivar. Available online: https://arastirma.tarimorman.gov.tr/gaputaem/Belgeler/%C3%A7e%C5%9Fit%20belgeleri/t%C3%BCrk%C3%A7e/mercimek/f%C4%B1rat%2087%20tr.pdf (accessed on 25 May 2024).
  15. Bouyoucos, G.J. Hydrometer method improved for making particle size analyses of soils. J. Agron. 1962, 54, 464–465. [Google Scholar] [CrossRef]
  16. Burt, R. Soil Survey Laboratory Methods Manual; USDA: Washington, DC, USA, 1992.
  17. Leal, O.; Trujillo, G.; Moreno, D.A. Assessment of calcium carbonate content in calcareous soils using the Bernard calcimeter method. Geoderma Reg. 2021, 25, e00432. [Google Scholar] [CrossRef]
  18. De Vos, B.; Lettens, S.; Muys, B.; Deckers, J.A. Walkley-Black analysis of forest soil organic carbon: Recovery, limitations and uncertainty. Soil Use Manag. 2007, 23, 221–229. [Google Scholar] [CrossRef]
  19. Kacar, B. Soil Analyses; Nobel Publishing: Ankara/Türkiye, 2009. [Google Scholar]
  20. Kraska, P.; Andruszczak, S.; Kwiecińska-Poppe, E.; Staniak, M.; Różyło, K.; Rusecki, H. Supporting crop and different row spacing as factors influencing weed infestation in lentil crop and seed yield under organic farming conditions. Agronomy 2020, 10, 9. [Google Scholar] [CrossRef]
  21. Togay, N.; Anlarsal, A.E. The effects of different planting densities and sowing methods on yield and yield components of lentil (Lens culinaris Medic.) in Van conditions. Tarım Bilim. Derg. 2008, 18, 35–47. [Google Scholar]
  22. Dona, W.H.G.; Schoenau, J.J.; King, T. Effect of starter fertilizer in seed-row on emergence, biomass and nutrient uptake by six pulse crops grown under controlled environment conditions. J. Plant Nutr. 2020, 43, 879–895. [Google Scholar] [CrossRef]
  23. Mendiburu, F. Agricolae: Statistical Procedures for Agricultural Research; R Package Version 1.1-8. 2010. Available online: https://cran.r-project.org/web/packages/agricolae/agricolae.pdf (accessed on 25 May 2025).
  24. Peterson, B.G.; Carl, P.; Boudt, K.; Bennett, R.; Ulrich, J.; Zivot, E.; Lestel, M.; Balkissoon, K.; Wuertz, D. Performance Analytics: Econometric Tools for Performance and Risk Analysis; R Package Version 2.0.4. 2014. Available online: https://cran.r-project.org/web/packages/PerformanceAnalytics/PerformanceAnalytics.pdf (accessed on 11 March 2025).
  25. Benakanahalli, N.K.; Sridhara, S.; Ramesh, N.; Olivoto, T.; Sreekantappa, G.; Tamam, N.; Abdelbacki, A.M.M.; Elansary, H.O.; Abdelmohsen, S.A.M. A framework for identification of stable genotypes based on MTSI and MGDII indexes: An example in guar (Cymopsis tetragonoloba L.). Agronomy 2021, 11, 1221. [Google Scholar] [CrossRef]
  26. Olivoto, T.; Lúcio, A.D. metan: An R package for multi-environment trial analysis. Methods Ecol. Evol. 2020, 11, 783–789. [Google Scholar] [CrossRef]
  27. Karademir, E.; Karademir, Ç.; Ekinci, R.; Karahan, H. Determining the appropriate cotton varieties for second crop cultivation in the Southeastern Anatolia Region. Çukurova J. Agric. Food Sci. 2017, 21, 119–126. (In Turkish) [Google Scholar]
  28. Wang, Y.; Tao, H.; Tian, B.; Sheng, D.; Xu, C.; Zhou, H.; Huang, S.; Wang, P. Flowering dynamics, pollen, and pistil contribution to grain yield in response to high temperature during maize flowering. Environ. Exp. Bot. 2019, 158, 80–88. [Google Scholar] [CrossRef]
  29. Kuzbakova, M.; Khassanova, G.; Oshergina, I.; Ten, E.; Jatayev, S.; Yerzhebayeva, R.; Bulatova, K.; Khalbayeva, S.; Schramm, C.; Anderson, P.; et al. Height to first pod: A review of genetic and breeding approaches to improve combine harvesting in legume crops. Front. Plant Sci. 2022, 13, 948099. [Google Scholar] [CrossRef] [PubMed]
  30. Silva-Perez, V.; Shunmugam, A.S.K.; Rao, S.; Cossani, C.M.; Tefera, A.T.; Fitzgerald, G.J.; Armstrong, R.; Rosewarne, G.M. Breeding has selected for architectural and photosynthetic traits in lentils. Front. Plant Sci. 2022, 13, 925987. [Google Scholar] [CrossRef] [PubMed]
  31. Pang, J.; Ryan, M.H.; Lambers, H.; Siddique, K.H.M. Phosphorus acquisition and utilisation in crop legumes under global change. Curr. Opin. Plant Biol. 2018, 45, 648379. [Google Scholar] [CrossRef]
  32. Zhang, Y.; Yang, J.; Showalter, A.M.; Zhou, D. Potassium nutrition and drought stress in plants: Current status and perspectives. Front. Plant Sci. 2020, 11, 543. [Google Scholar] [CrossRef]
  33. Tariq, A.; Liu, Y.; Han, C.; Xie, Z.; Chen, M.; Abbas, F.; Xie, Y. Combined application of phosphorus and potassium improves drought tolerance in chickpea (Cicer arietinum L.) by enhancing photosynthesis and antioxidant enzyme activities. Plants 2021, 10, 796. [Google Scholar] [CrossRef]
  34. Berzsenyi, Z.; Dang, Q.L. Effect of various crop production factors on the yield and yield stability of maize in a long-term experiment. Cereal Res. Commun. 2008, 36, 167–176. [Google Scholar] [CrossRef]
  35. Ceritoglu, M.; Erman, M. Effect of vermicompost application at different sowing dates on some phenological, agronomic and yield traits in lentil. J. Int. Environ. Appl. Sci. 2020, 15, 158–166. [Google Scholar]
  36. Ceritoglu, M.; Erman, M.; Çığ, F. Seed priming boosts plant growth, yield attributes, seed chemical and antioxidant composition in lentil under low-phosphorus field conditions. Int. J. Plant Prod. 2024, 18, 513–530. [Google Scholar] [CrossRef]
  37. Alexandru, A.M.; Mihai, G.; Stoica, E.; Curtu, A.L. Multi-trait selection and stability in norway spruce (Picea abies) provenance trials in Romania. Forests 2023, 14, 456. [Google Scholar] [CrossRef]
  38. Behera, P.; Singode, A.; Bhat, B.V.; Ronda, V.; Borah, N.; Verma, H.; Gogoi, L.R.; Borah, J.; Majhi, P.K.; Saharia, N.; et al. Genetic gains in forage sorghum for adaptive traits for non-conventional areas through multi-trait-based stability selection methods. Front. Plant Sci. 2024, 15, 1248663. [Google Scholar] [CrossRef]
  39. Olivoto, T.; Nardino, M. MGIDI: Toward an effective multivariate selection in biological experiments. Bioinformatics 2021, 37, 1383–1389. [Google Scholar] [CrossRef] [PubMed]
Figure 1. Location of the experimental area in Siirt University, Siirt, Türkiye. (Total of yellow and orange area represents Southeastern Anatolia Region of Türkiye. The orange area shows the borders of the city of Siirt, which includes Siirt University).
Agronomy 15 01554 g001
Figure 2. Temperature variations through experimental seasons and long-term average.
Agronomy 15 01554 g002
Figure 3. Total precipitation (A) and relative humidity (B) changes throughout experimental seasons and long-term averages.
Agronomy 15 01554 g003
Figure 4. Alterations in phenological, growth and yield attributes (A) and straw and seed yield (B) throughout three years. Units of experimental observations are as follows: flowering, podding, and maturity time (day); plant height and first pod height (cm); harvest index (%); 1000-seed weight (g); biological yield and grain yield (kg ha−1). Lowercase letters indicate significant differences at 0.05 level; Capital letters indicate significant differences at 0.01 level.
Agronomy 15 01554 g004
Figure 5. Phenotypic correlation matrix with scatterplot and distribution visualizations of experimental characteristics. The experimental characters are listed from the top to the bottom as follows: flowering time (FT), podding time (PT), maturity time (MT), plant height (PH), number of branches (NB), first pod height (FPH), number of pods (NP), biological yield (BY), grain yield (GY), harvest index (HI), and 1000-seed weight (1000-seed). (*: p < 0.05, **: p < 0.01, ***: p < 0.001. The red lines represent density curves that smoothly approximate the probability distribution of each variable).
Agronomy 15 01554 g005
Figure 6. Multivariate biplot visualization of phenological, morphological, and yield-related traits in 43 genotypes using principal component analysis. FT: Flowering time; PT: podding time; MT: maturity time; PH: plant height; NB: number of branches; FPH: first pod height; NP: number of pods; BY: biological yield; GY: grain yield; HI: harvest index; 1000-Seed: 1000-seed weight.
Agronomy 15 01554 g006
Figure 7. Circular hierarchical clustering dendrogram of 43 lentil genotypes based on phenological and agronomic traits.
Agronomy 15 01554 g007
Figure 8. Phenological screening of genotypes for earliness (The blue dashed lines represent the selection thresholds for early flowering and early maturity. The vertical line indicates the cutoff for flowering time, and the horizontal line indicates the cutoff for maturity time. Genotypes located in the bottom-left quadrant (below both thresholds) were selected as early maturing and early flowering candidates and are shown in red).
Agronomy 15 01554 g008
Figure 9. Selection of yield-stable genotypes via the MTSI.
Agronomy 15 01554 g009
Figure 10. Multi-trait ranking of earliness and yield stable genotypes using MGIDI (In the figure, black crosses (×) represent individual genotypes, each positioned according to its MGIDI (Multi-Trait Genotype–Ideotype Distance Index) distance, which reflects how far it is from the ideotype—the ideal genotype. The red cross (×) and red concentric circles highlight the most desirable genotype(s), which are closest to the ideotype and thus considered optimal selections based on combined criteria of earliness, yield, and stability.
Agronomy 15 01554 g010
Table 1. Physiochemical characterization of experimental soils for three cultivation seasons.
YearSandSiltClayTpHECLimeOMPKCaMgZnMnFeCu
%dS m-%%kg ha-kg ha-mg kg-mg kg-mg kg-mg kg-mg kg-mg kg-
2019–2020462232SCL7.80.1922.71.4711.3156.1212656.90.5720.712.950.72
2020–2021542323SIL7.30.221.881.143.4981.1234757.40.6121.302.560.69
2021–2022363331L8.00.168.441.553.3755.1229957.00.6020.932.680.74
T: Texture; L: loam; SCL: sandy clay loam; SIL: silty loam.
Table 2. Phenological, agronomical, and yield characterizations of lentil genotypes.
TraitBest GenotypesWorst Genotypes
Flowering time
(day)
G3715 (126.2) followed by G3716 (126.8) and G87 (127.3)G37 (146.8) followed by G21151 (142.7) and 3840 (140.3)
Podding time
(day)
G3715 (140.5) followed by G3716 (140.7) and G3744 (142.0) G37 (154.2) followed by G21151 (151.5) and 3840 (149.7)
Maturity time
(day)
G3744 (165.7) followed by G3716 (167.0) and G3715 (167.2)G21151 (180.0) followed by G37 (179.0) and G3673 (177.7)
Plant height
(cm)
G37 (43.4) followed by G21151 (42.9) and G3653 (40.8)G3761 (30.5) followed by G3710 (30.7) and G3839 (31.1)
Number of branchesG21151 (11.8) followed by G37 (11.8) and G3697 (10.8)G3715 (7.55) followed by G3710 (7.58) and G3828 (7.92)
First pod height
(cm)
G21151 (18.9) followed by G37 (17.3) and G3771 (15.3)G3715 (8.49) followed by G3839 (9.9) and G3662 (10.1)
Number of podsG3840 (104.6) followed by G3673 (99.3) and G3819 (93.8)G3780 (31.6) followed by G3759 (42.6) and G3716 (43.5)
Biological yield
(kg ha−1)
G3837 (7109) followed by G3771 (6540) and G3840 (6470)G3713 (3580) followed by G3839 (3681) and G3743 (3701)
Grain yield
(kg ha−1)
G3771 (2579) followed by G3658 (2203) and G3673 (2054)G3839 (743) followed by G3828 (744) and G3713 (862)
Harvest index
(%)
G3771 (37.3) followed by G35 (36.2) and G3673 (35.3)G3703 (18.2) followed by G21151 (18.3) and G3828 (19.1)
1000-seed weight
(g)
G3771 (54.9) followed by G3780 (53.6) and G3750 (48.4)G3710 (21.0) followed by G3839 (22.6) and G3828 (22.9)
Disclaimer/Publisher’s Note: The statements, opinions and data contained in all publications are solely those of the individual author(s) and contributor(s) and not of MDPI and/or the editor(s). MDPI and/or the editor(s) disclaim responsibility for any injury to people or property resulting from any ideas, methods, instructions or products referred to in the content.