
Multi-Criteria Analysis of a Potential Expansion of Protected Agriculture in Imbabura, Ecuador


 ,
,  ,
,  ,
, 

Abstract
1. Introduction
2. Materials and Methods
2.1. Study Area Description
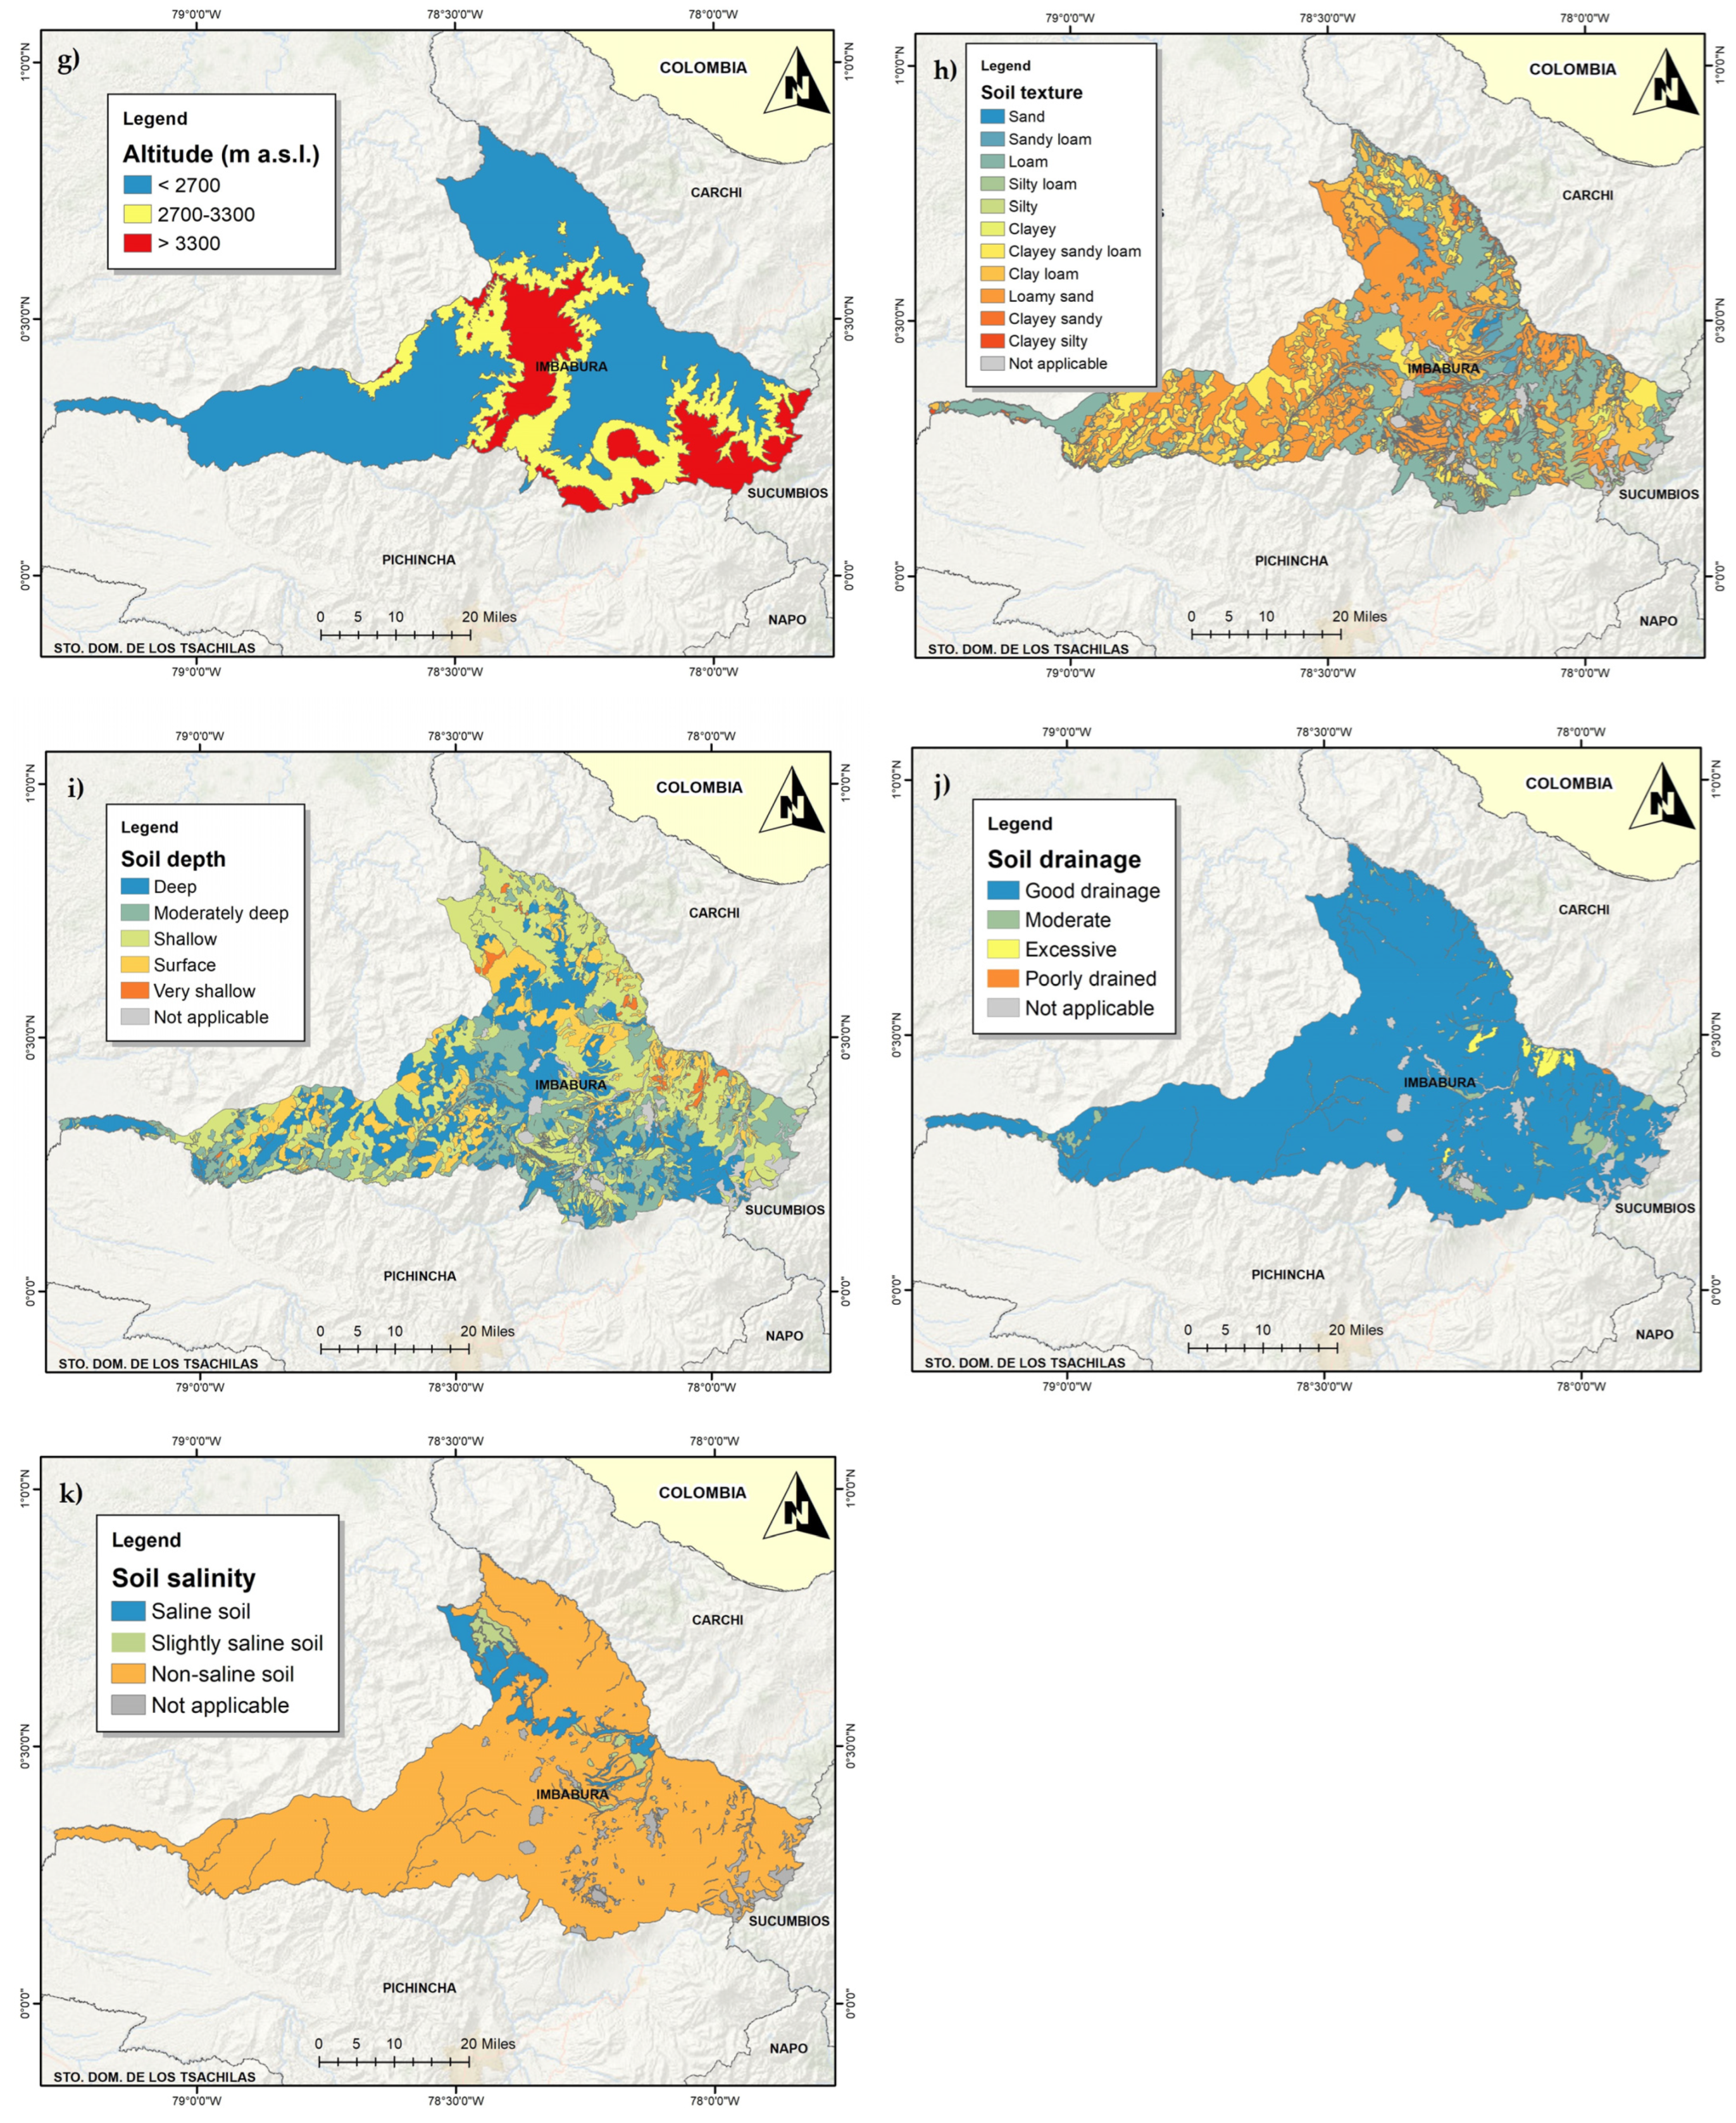
2.2. Selected Variables and Their Characteristics
2.3. Modeling Approaches for Greenhouse Expansion
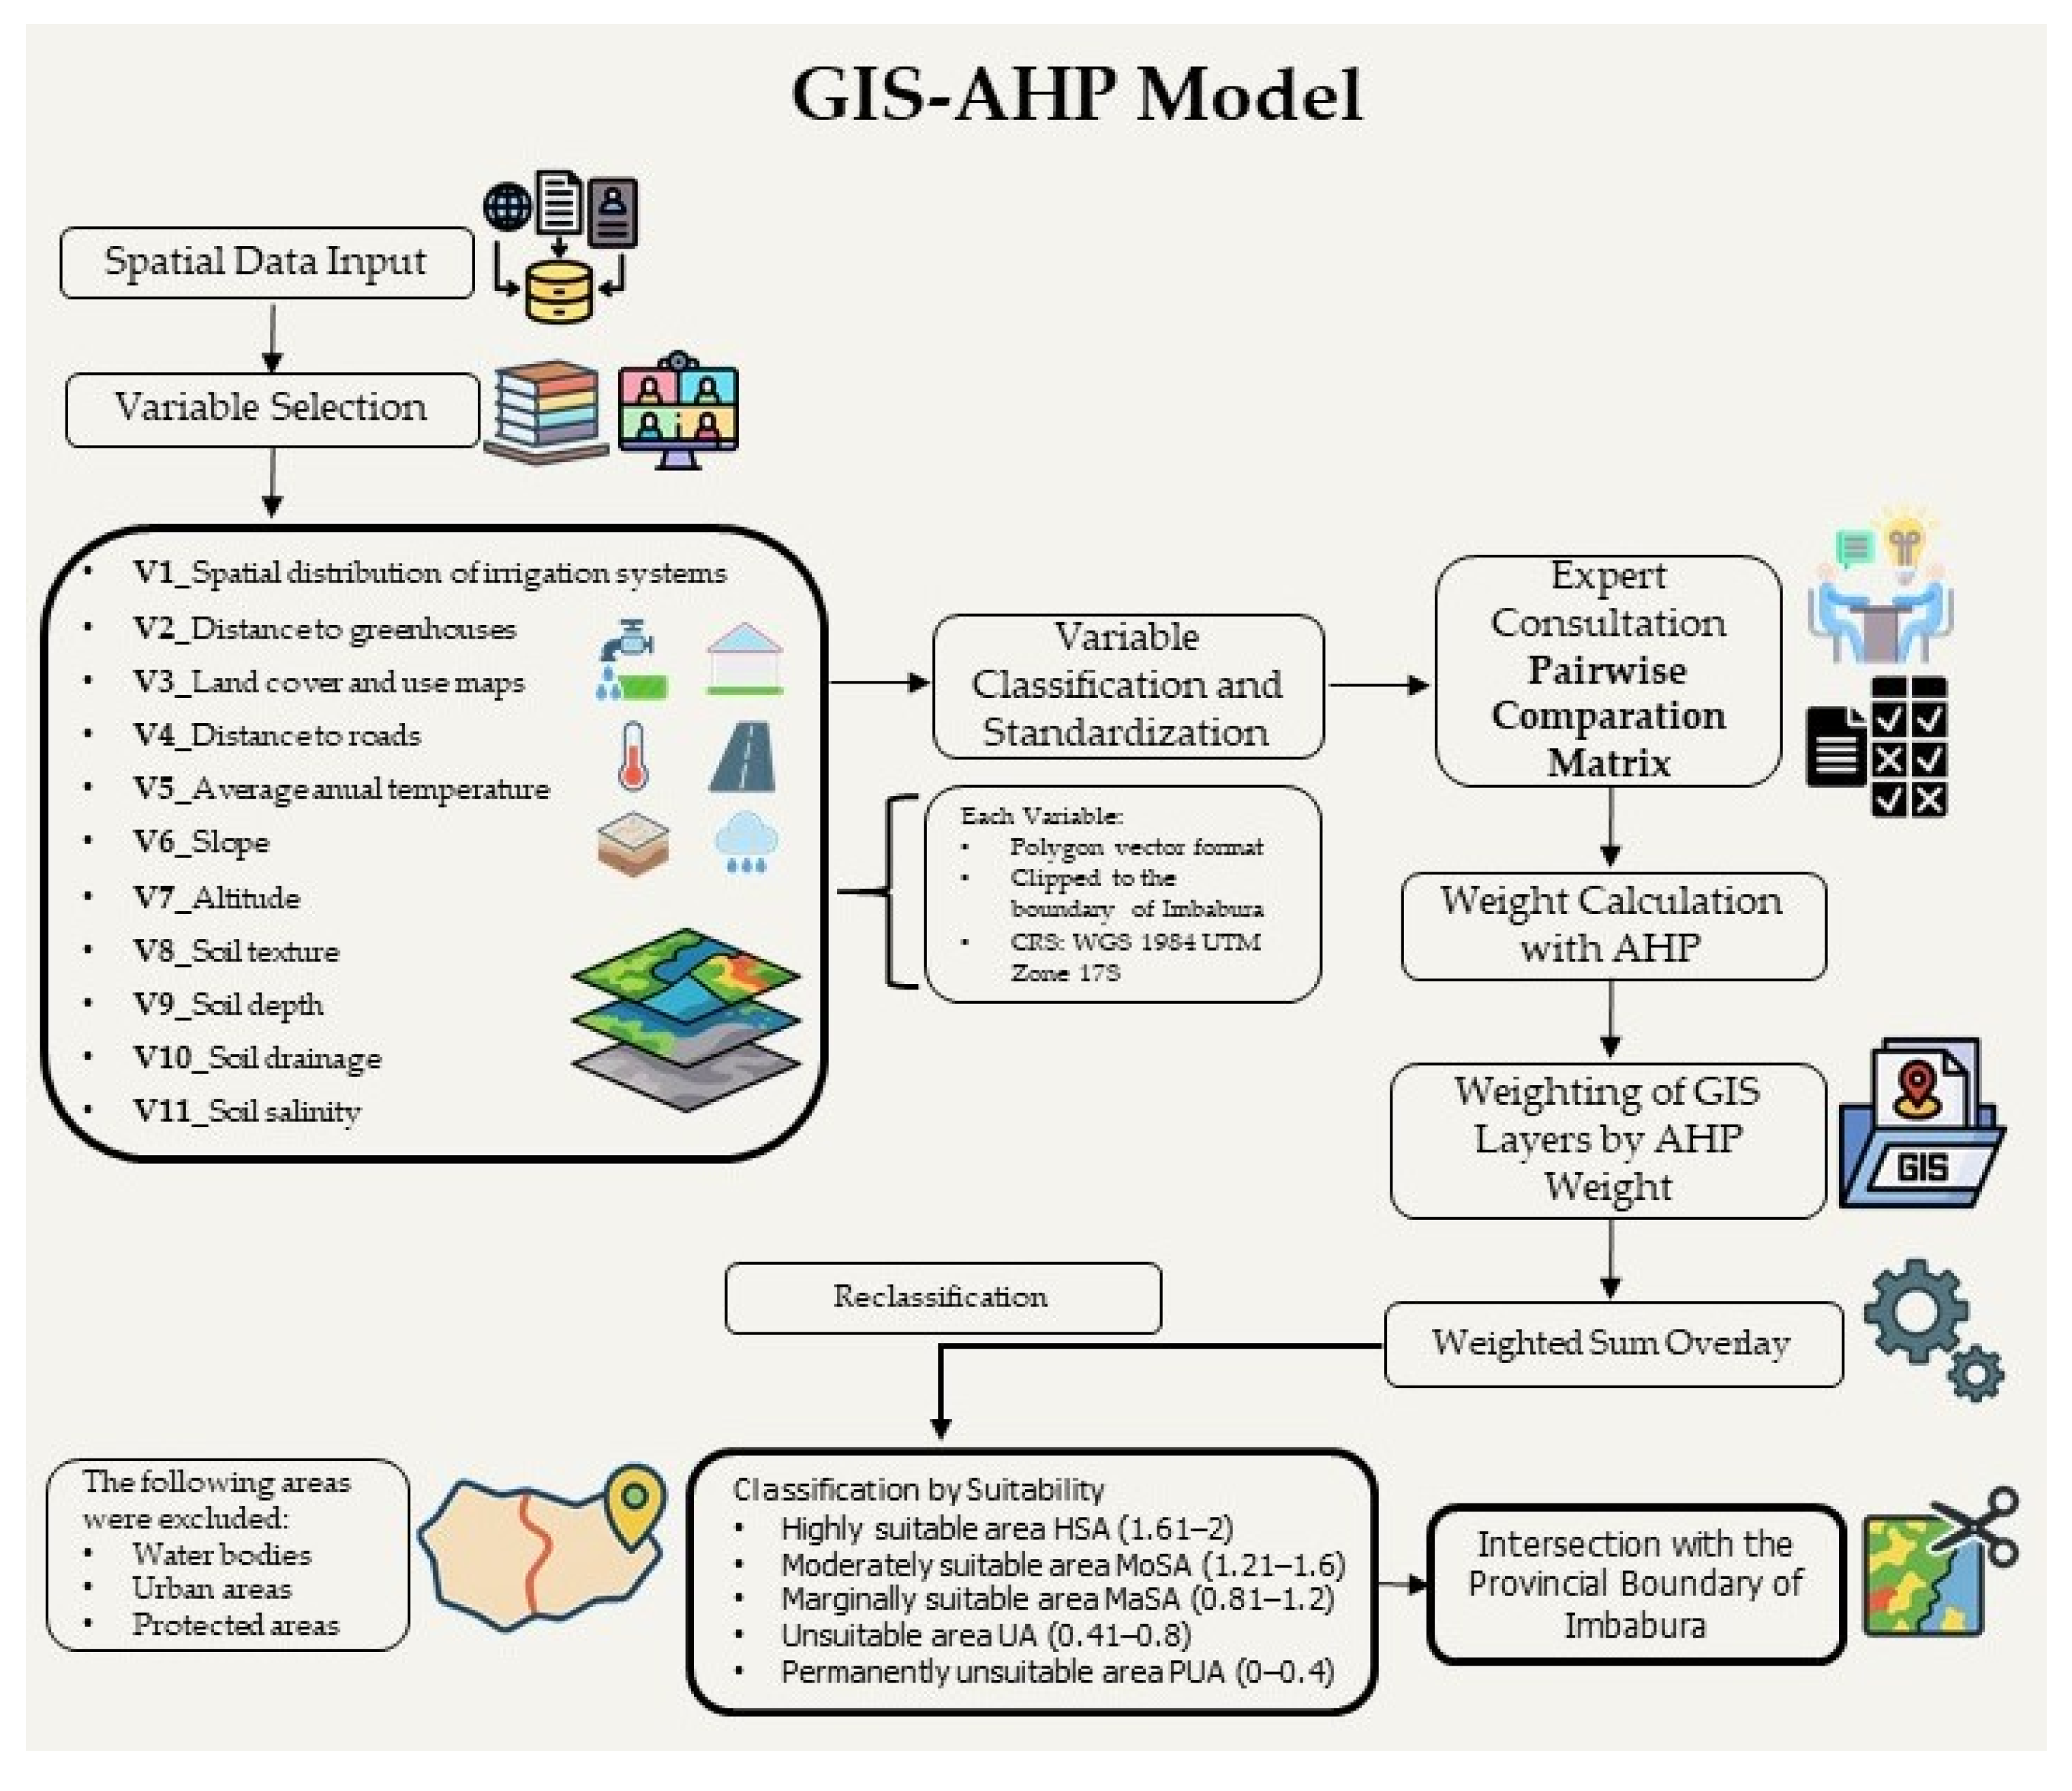
2.3.1. GIS-AHP Integration
Variable Weighting Method
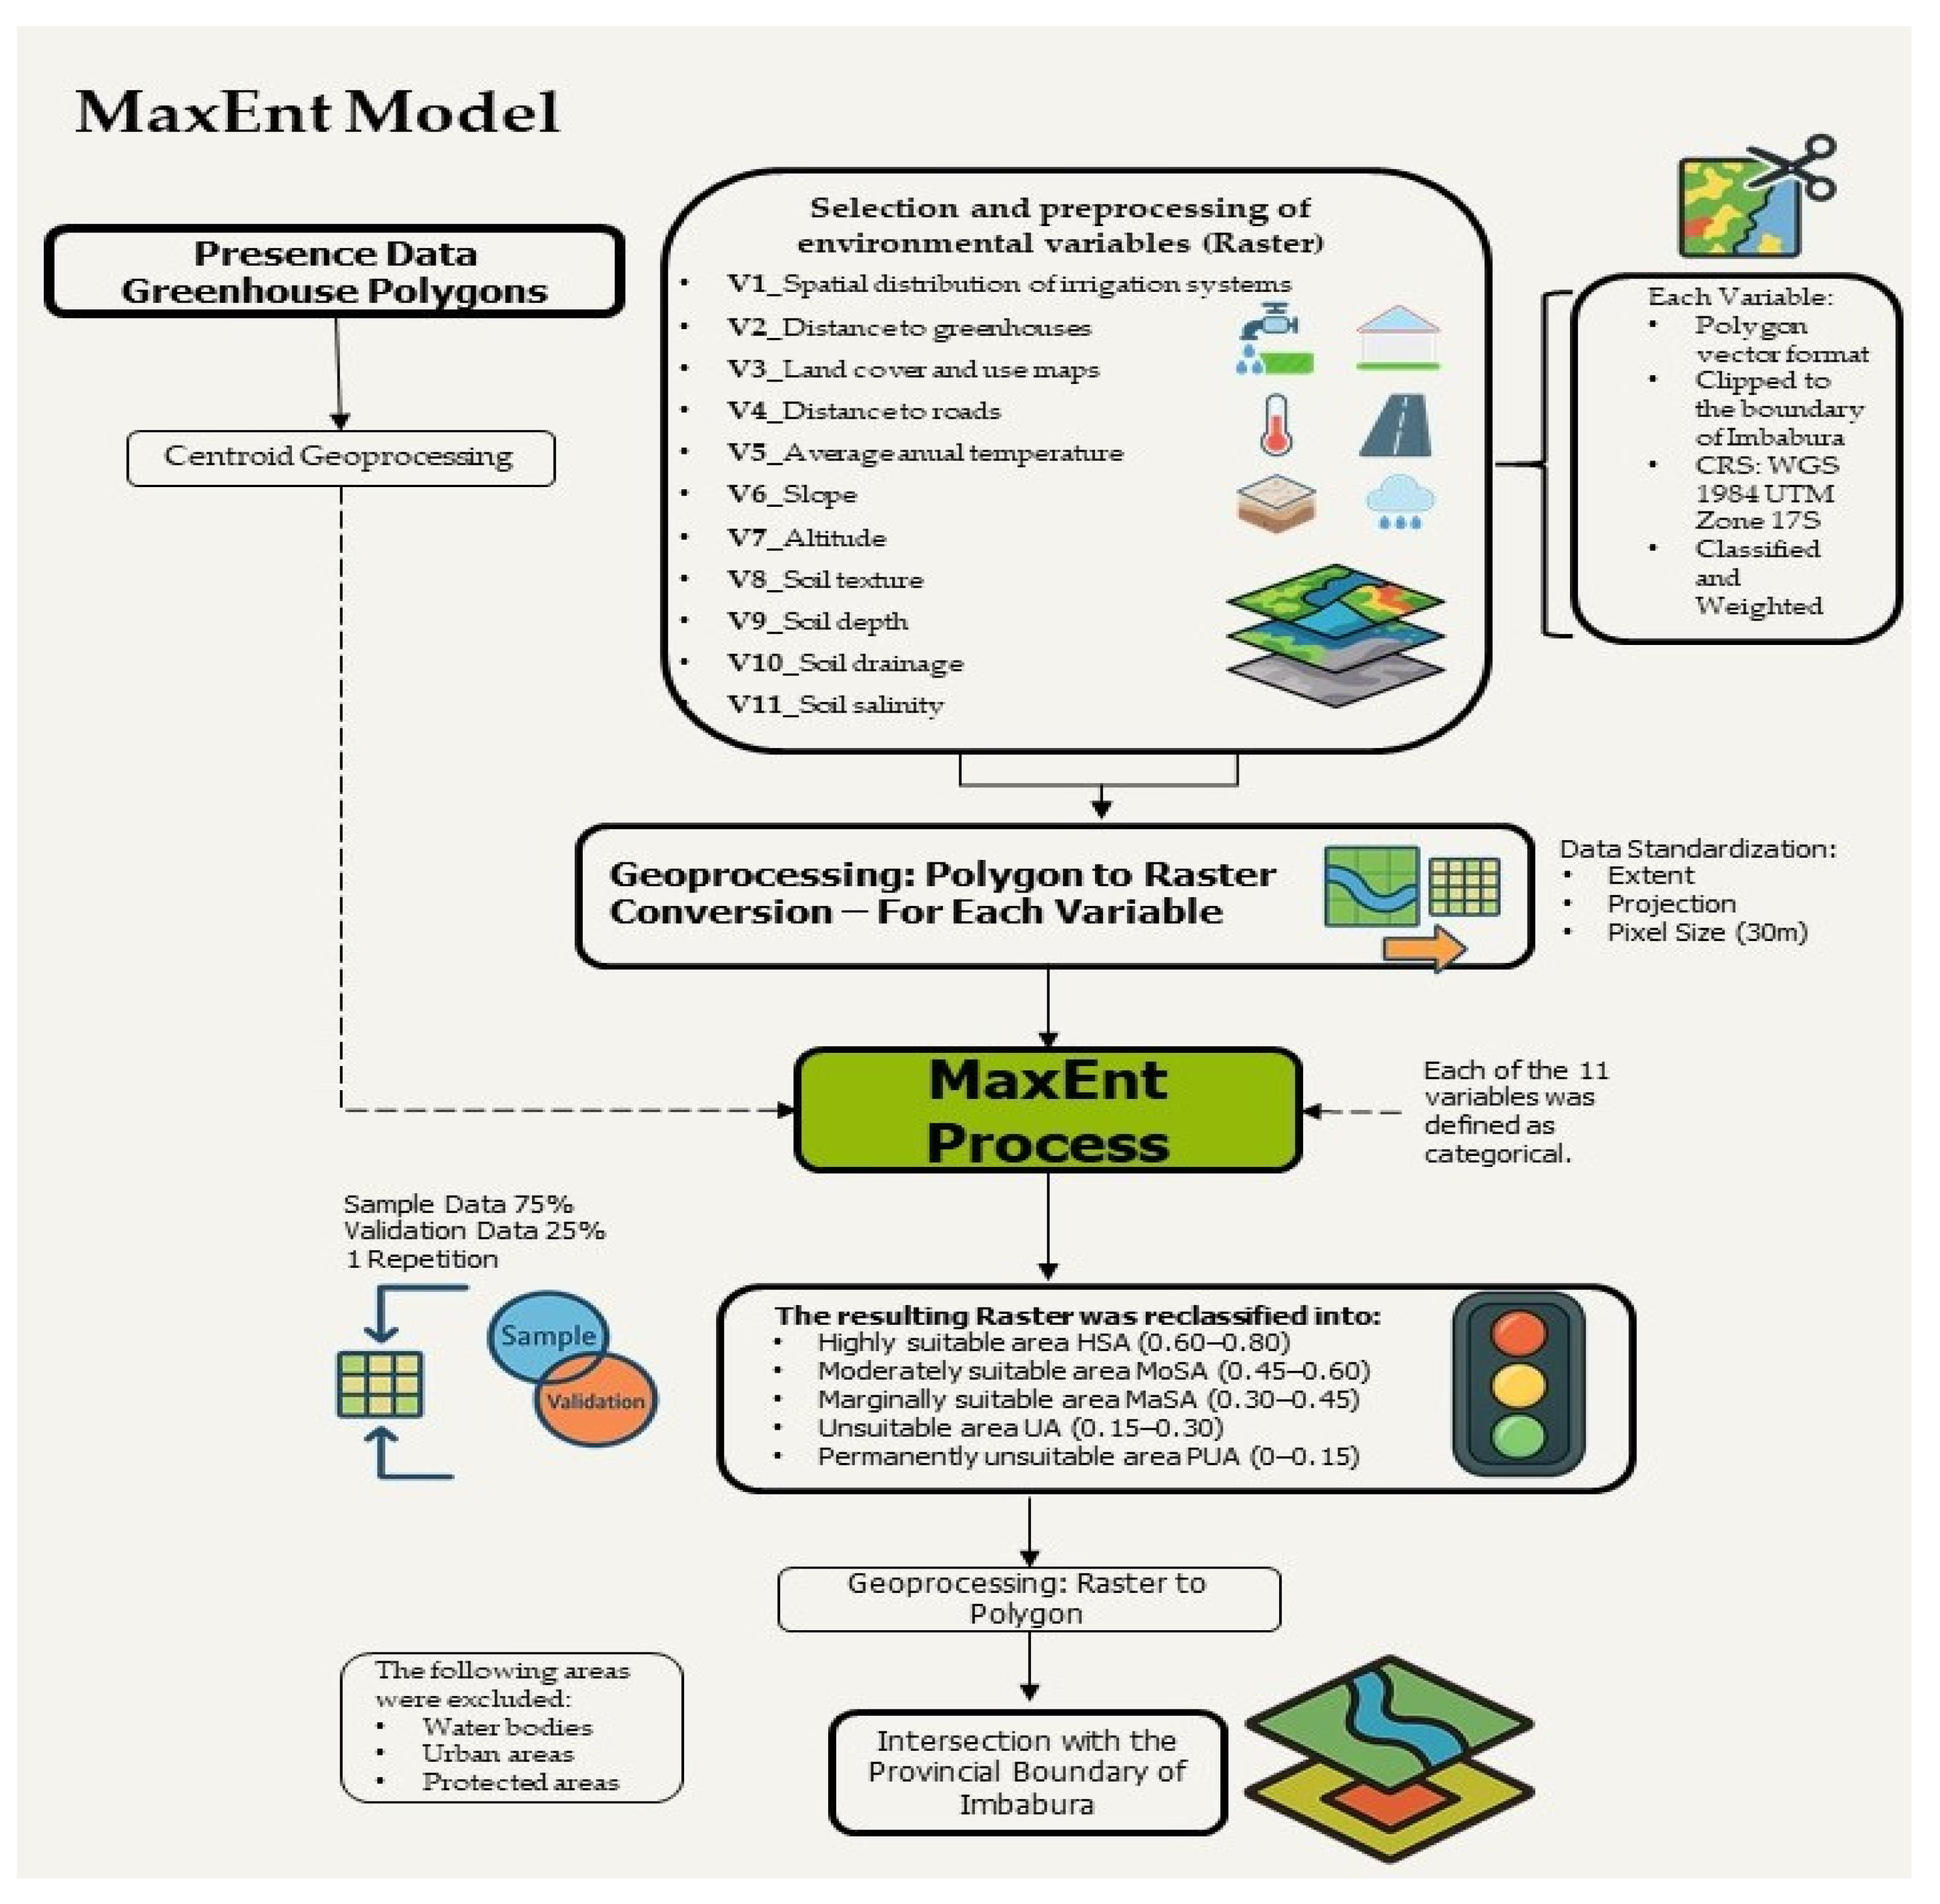
2.3.2. Maximum Entropy Model (MaxEnt)
MaxEnt Model Application and Validation
3. Results
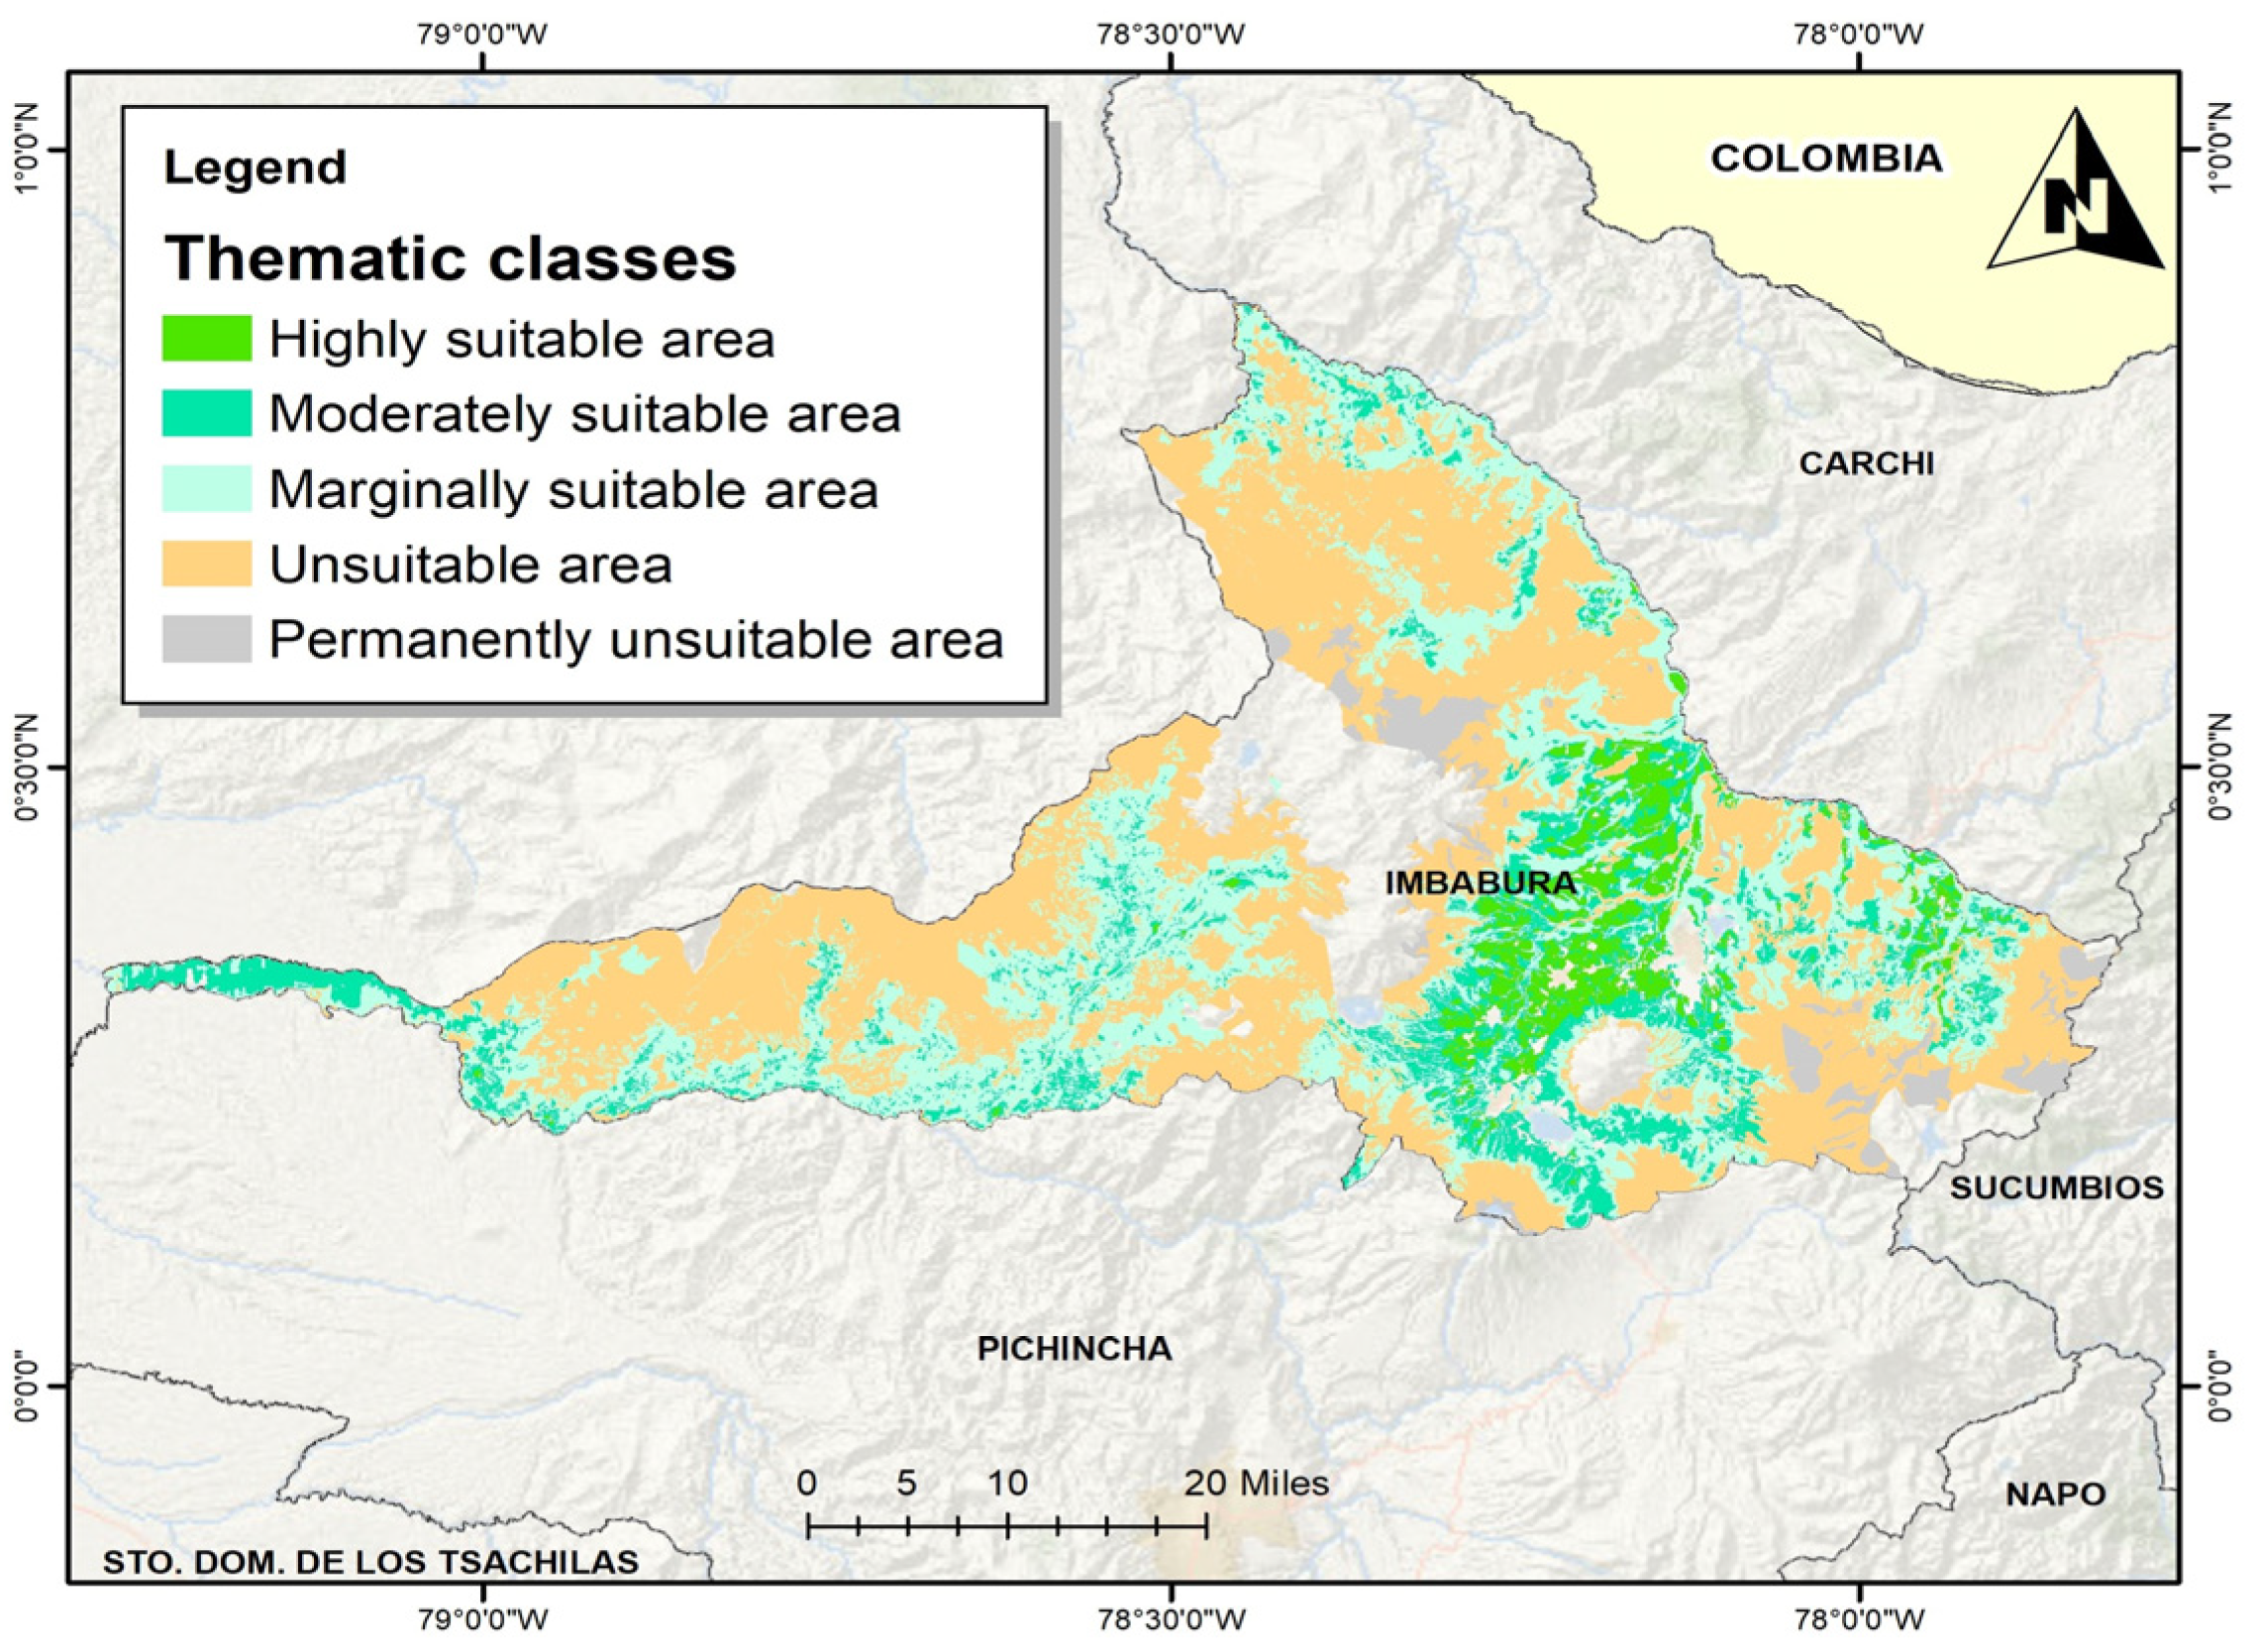
3.1. GIS-AHP Modeling for the Potential Expansion of Agricultural Greenhouses in Imbabura
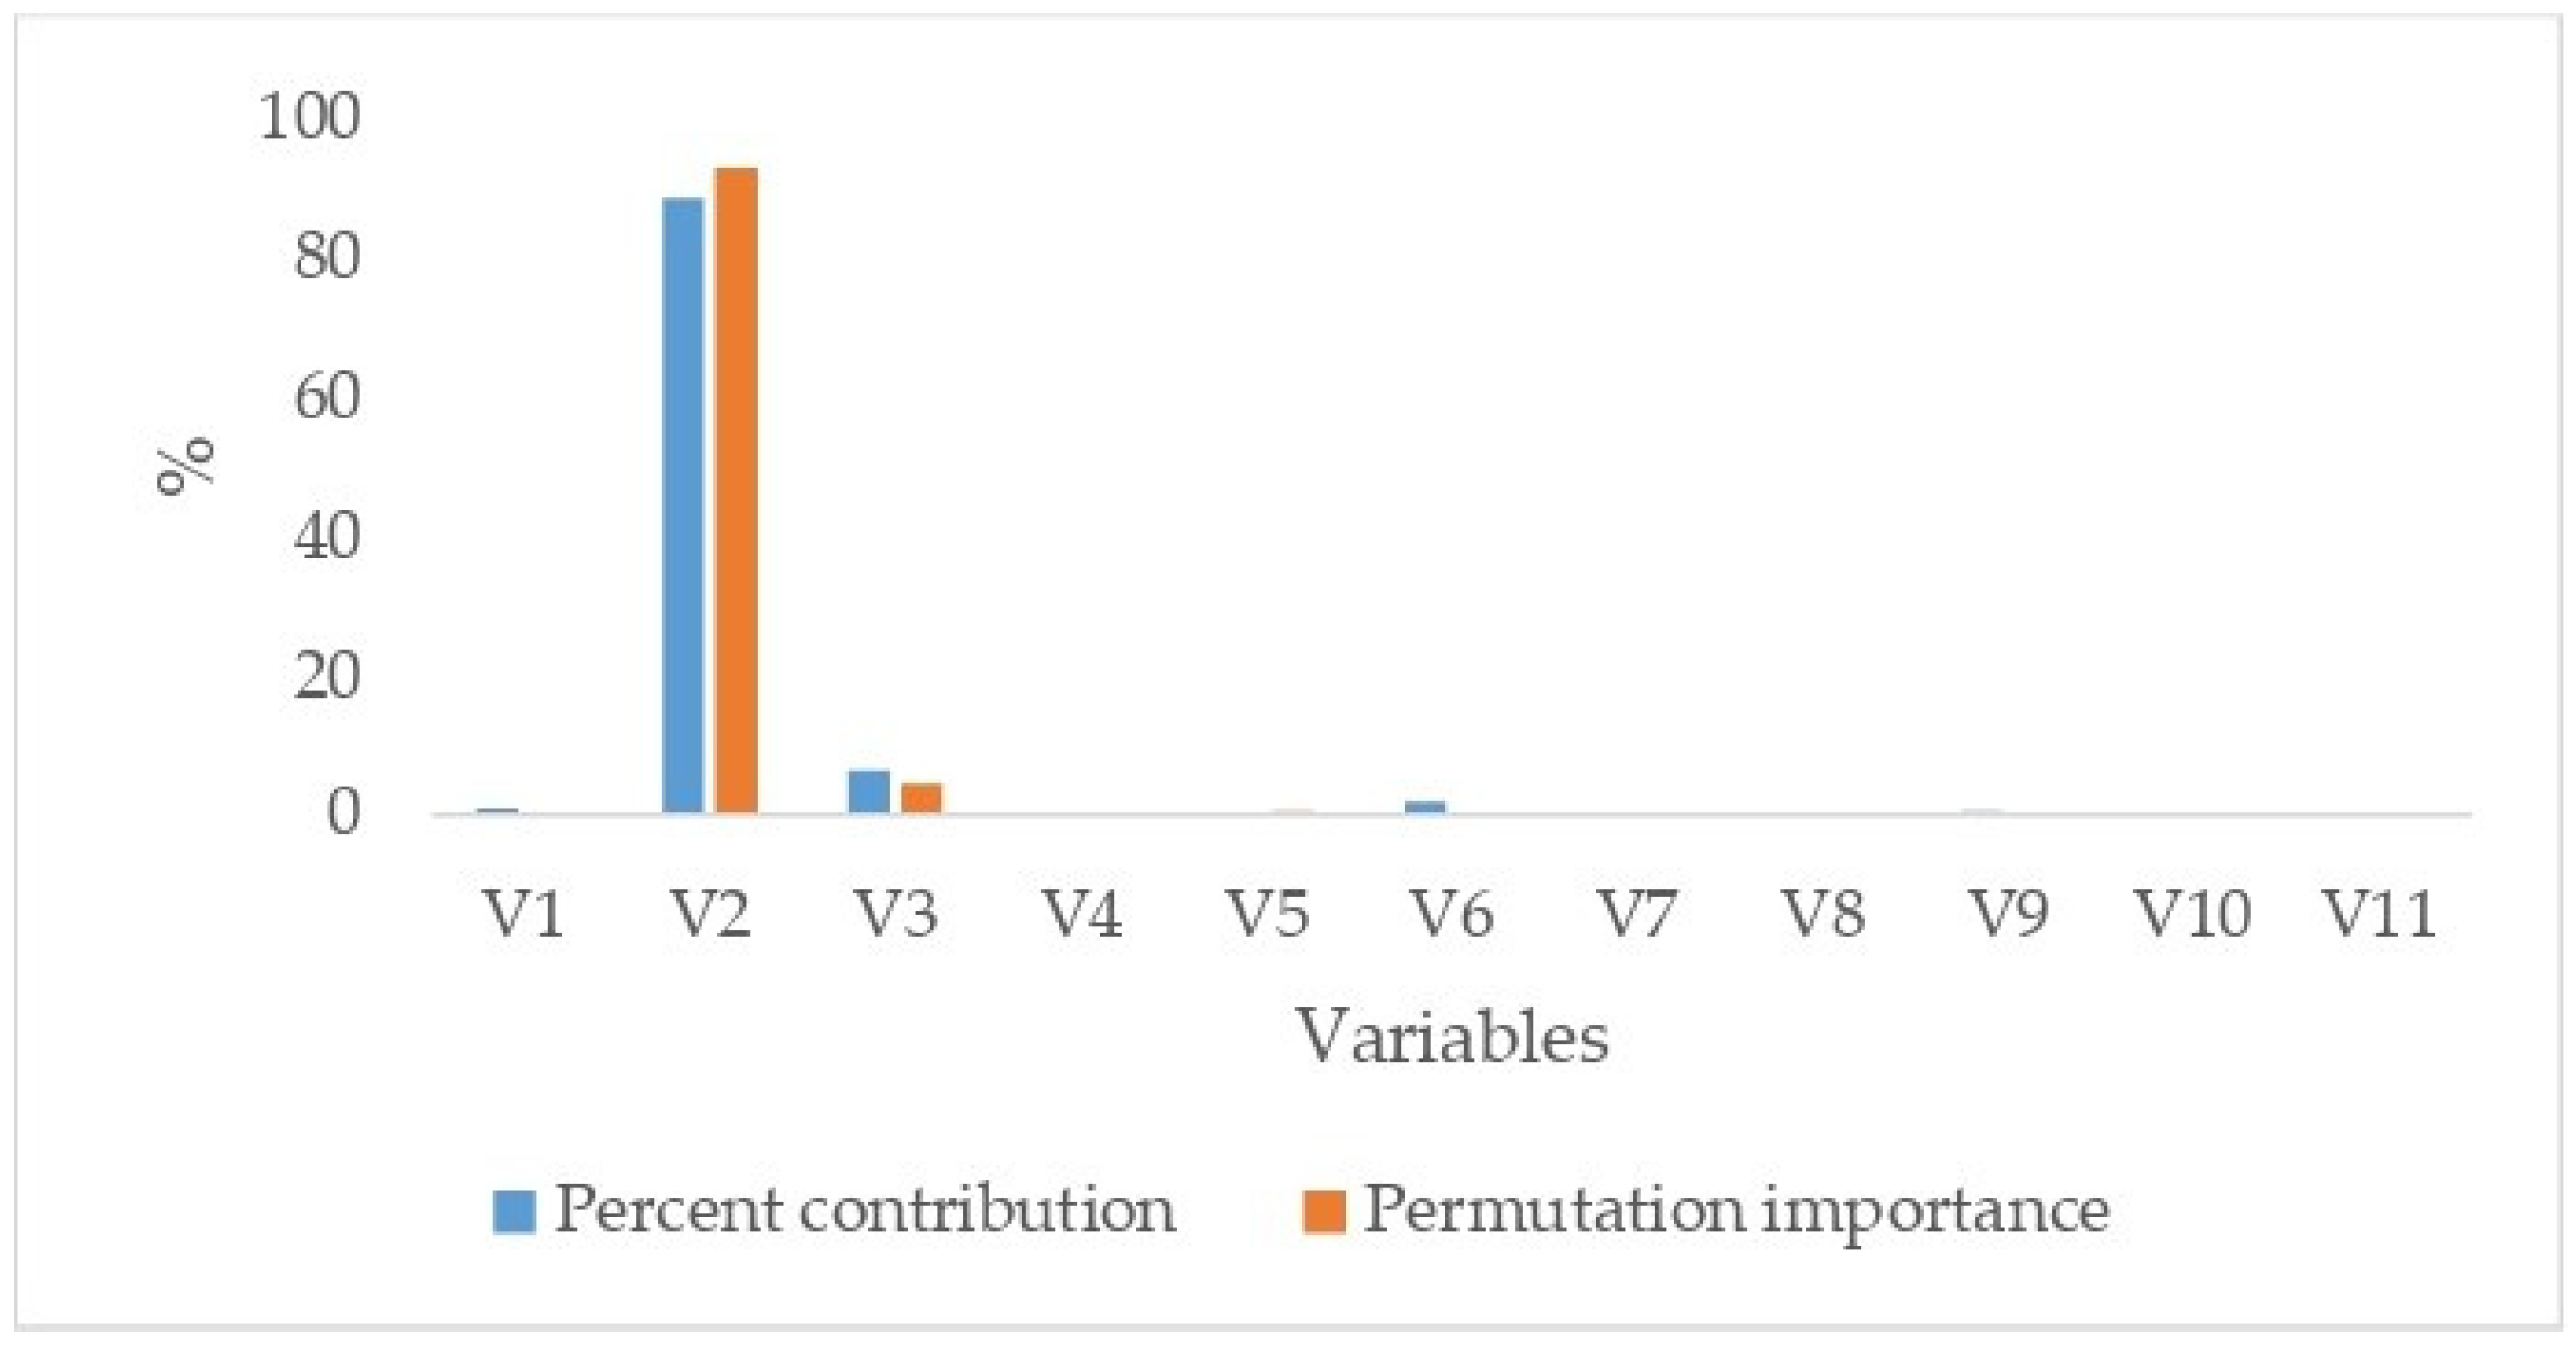
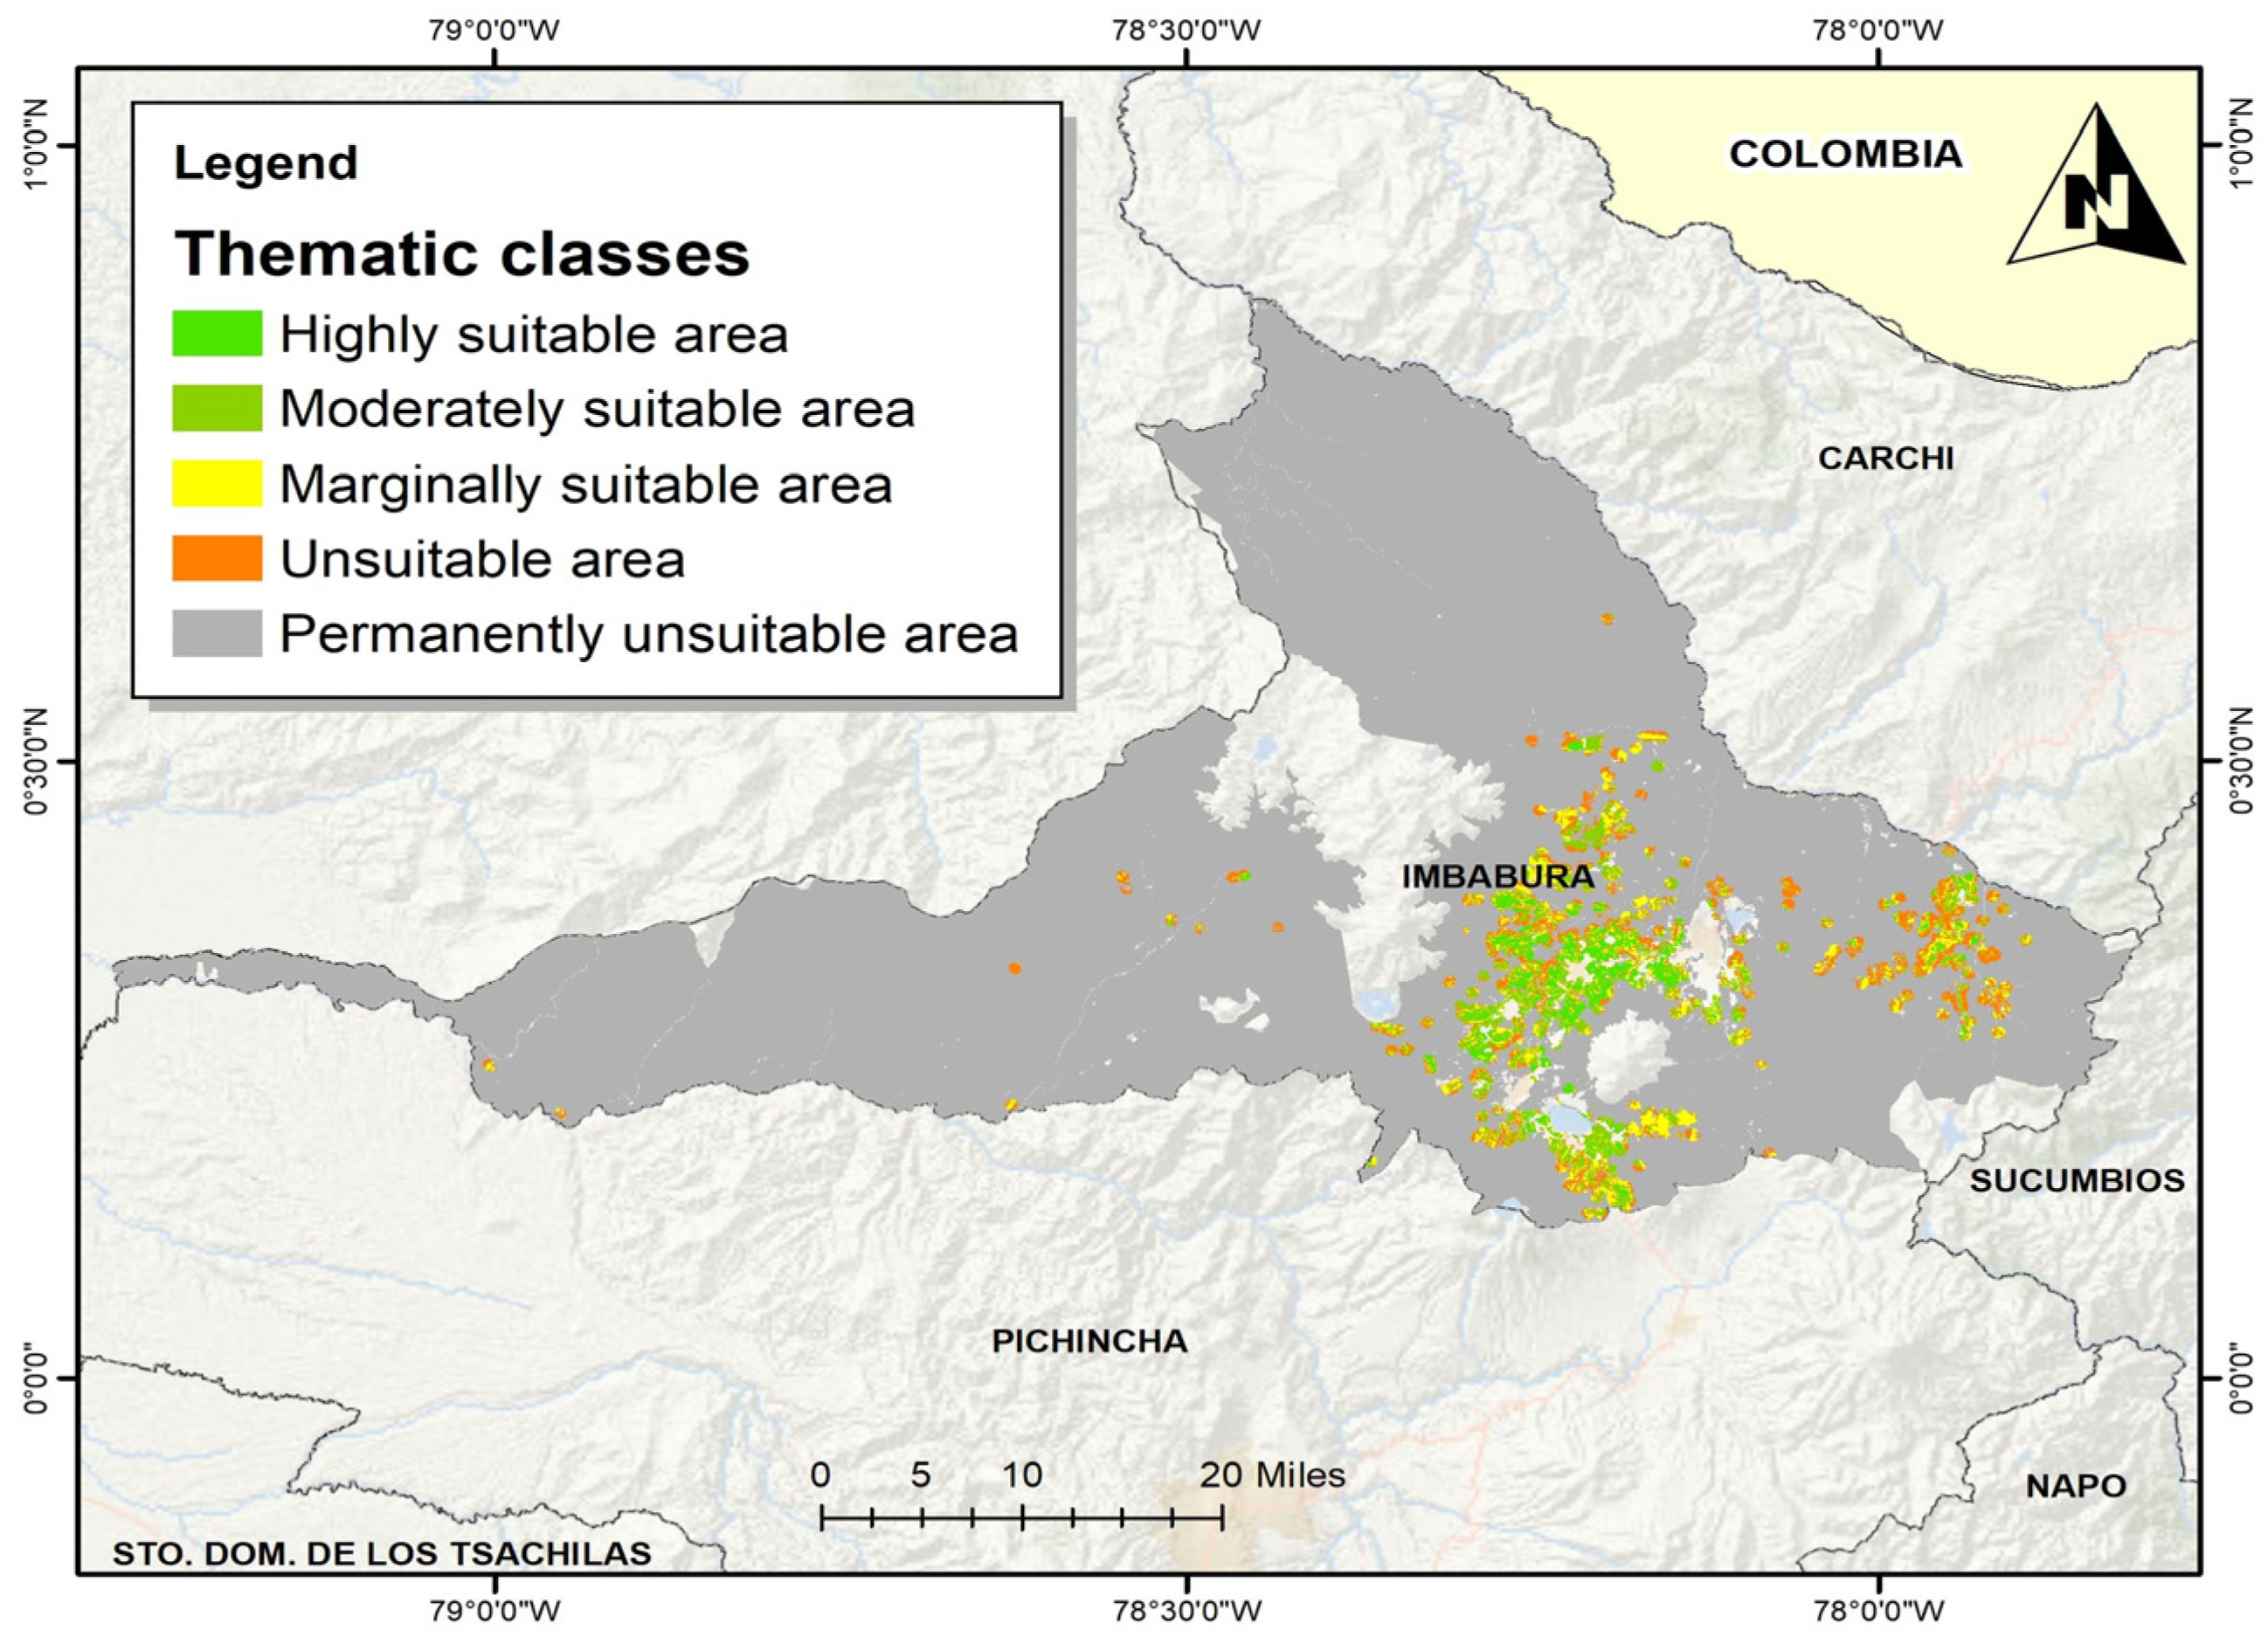
3.2. Maxent Modeling for a Possible Expansion of Agricultural Greenhouses in Imbabura
3.3. Suitability of Existing Greenhouse Locations
4. Discussion
5. Conclusions
Author Contributions
Funding
Data Availability Statement
Conflicts of Interest
References
- Barati, A.A.; Azadi, H.; Movahhed Moghaddam, S.; Scheffran, J.; Dehghani Pour, M. Agricultural expansion and its impacts on climate change: Evidence from Iran. Environ. Dev. Sustain. 2024, 26, 5089–5115. [Google Scholar] [CrossRef]
- Qayyum, M.; Zhang, Y.; Wang, M.; Yu, Y.; Li, S.; Ahmad, W.; Maodaa, S.N.; Sayed, S.R.M.; Gan, J. Advancements in technology and innovation for sustainable agriculture: Understanding and mitigating greenhouse gas emissions from agricultural soils. J. Environ. Manag. 2023, 347, 119147. [Google Scholar] [CrossRef]
- Intergubernmental Panel on Climate Change. Special Report on Climate Change and Land (Chapter 5.1.1). En Climate Change 2022: Impacts, Adaptation, and Vulnerability; Cambridge University Press: Cambridge, UK, 2022. [Google Scholar]
- Kollar, A.J. Bridging the gap between agriculture and climate: Mitigation of nitrous oxide emissions from fertilizers. Environ. Prog. Sustain. Energy 2023, 42, e14069. [Google Scholar] [CrossRef]
- Gardner, A.S.; Trew, B.T.; Maclean, I.M.D.; Sharma, M.D.; Gaston, K.J. Wilderness areas under threat from global redistribution of agriculture. Curr. Biol. 2023, 33, 4721–4726.e2. [Google Scholar] [CrossRef] [PubMed]
- Sinore, T.; Wang, F. Impact of climate change on agriculture and adaptation strategies in Ethiopia: A meta-analysis. Heliyon 2024, 10, e26103. [Google Scholar] [CrossRef]
- The World Bank. Population, Total—Ecuador. World Development Indicators. 2023. Available online: https://data.worldbank.org/indicator/SP.POP.TOTL?locations=EC (accessed on 17 April 2025).
- Cabrera, M.; Capparelli, M.V.; Ñacato-Ch, C.; Moulatlet, G.M.; López-Heras, I.; Díaz González, M.; Alvear-S, D.; Rico, A. Effects of intensive agriculture and urbanization on water quality and pesticide risks in freshwater ecosystems of the Ecuadorian Amazon. Chemosphere 2023, 337, 139286. [Google Scholar] [CrossRef] [PubMed]
- Viteri-Salazar, O.; Toledo, L. The expansion of the agricultural frontier in the northern Amazon region of Ecuador, 2000–2011: Process, causes, and impact. Land Use Policy 2020, 99, 104986. [Google Scholar] [CrossRef]
- The World Bank Ecuador—Country Climate Development Report (English); World Bank Group: Washington, DC, USA, 2024; Available online: http://documents.worldbank.org/curated/en/099090524100027132/P1793421ddff2d0281a40519e897f9b555e (accessed on 25 March 2025).
- Naciones Unidas. Objetivos y Metas de Desarrollo Sostenible—Desarrollo Sostenible. Disponible en Línea. 2015. Available online: https://www.un.org/sustainabledevelopment/es/objetivos-de-desarrollo-sostenible/ (accessed on 21 March 2025).
- Farooq, M.S.; Riaz, S.; Helou, M.A.; Khan, F.S.; Abid, A.; Alvi, A. Internet of Things in Greenhouse Agriculture: A Survey on Enabling Technologies, Applications, and Protocols. IEEE Access 2022, 10, 53374–53397. [Google Scholar] [CrossRef]
- Zhao, J.; Liu, D. Smart greenhouse agriculture: A review towards near zero energy. Discov. Cities 2025, 2, 55. [Google Scholar] [CrossRef]
- la Cecilia, D.; Tom, M.; Stamm, C.; Odermatt, D. Pixel-based mapping of open field and protected agriculture using constrained Sentinel-2 data. ISPRS Open J. Photogramm. Remote Sens. 2023, 8, 100033. [Google Scholar] [CrossRef]
- Ou, C.; Yang, J.; Du, Z.; Zhang, T.; Niu, B.; Feng, Q.; Liu, Y.; Zhu, D. Landsat-derived annual maps of agricultural greenhouse in Shandong province, China from 1989 to 2018. Remote Sens. 2021, 13, 4830. [Google Scholar] [CrossRef]
- Sun, H.; Wang, L.; Lin, R.; Zhang, B. Mapping Plastic Greenhouses with Two-Temporal Sentinel-2 Images and 1D-CNN Deep Learning. Remote Sens. 2021, 13, 2820. [Google Scholar] [CrossRef]
- Smith, A.B.; Jones, C.D. Energy-efficient operation and modeling for greenhouses: A literature review. Renew. Sustain. Energy Rev. 2020, 117, 109480. [Google Scholar] [CrossRef]
- Li, B.; Shi, B.; Yao, Z.; Kumar Shukla, M.; Du, T. Energy partitioning and microclimate of solar greenhouse under drip and furrow irrigation systems. Agric. Water Manag. 2020, 234, 106096. [Google Scholar] [CrossRef]
- Shukla, R.M.; Nazir, N.B.; Pandey, Y.; Dadhich, S.M. Influence of Protected Cultivation Structures on Vegetable Crops. J. Agric. Ecol. Res. Int. 2024, 25, 116–122. [Google Scholar] [CrossRef]
- Ghanem, A.A.; Mostafa, A.E.A.M.; Sadek, E.S. The role of management in sustainable African protected agriculture: Case study Egypt. Int. J. Sustain. Agric. Manag. Inform. 2023, 9, 320–349. [Google Scholar] [CrossRef]
- Thakur, N.; Sharma, R.; Giridhar, B.J.; Kumar, S.; Sharma, S.; Klate, A. Socioeconomic impact assessment of protected cultivation. J. Agric. Dev. Policy 2024, 33, 138–145. [Google Scholar] [CrossRef]
- Yumna, A.; Suryantini, A.; Nugroho, R.A. Does the greenhouse adoption improve farmers’ welfare? Evidence from Indonesia. Agrar. J. Agribus. Rural Dev. Res. 2024, 10, 41–52. [Google Scholar] [CrossRef]
- Serrano-Carreón, L.; Aranda-Ocampo, S.; Balderas-Ruíz, K.A.; Juárez, A.M.; Leyva, E.; Trujillo-Roldán, M.A.; Valdez-Cruz, N.A.; Galindo, E. A case study of a profitable mid-tech greenhouse for the sustainable production of tomato, using a biofertilizer and a biofungicide. Electron. J. Biotechnol. 2022, 59, 13–24. [Google Scholar] [CrossRef]
- Vanitha, S.M.; Ravi, S.C. Economic Feasibility, Status, and Future Prospects of Protected Cultivation. In Protected Cultivation: Structural Design, Crop Management Modeling, and Automation; Apple Academic Press: Palm Bay, FL, USA, 2024. [Google Scholar] [CrossRef]
- Hirvonen, K.; Bai, Y.; Headey, D.; Masters, W.A. Affordability of the EAT–Lancet reference diet: A global analysis. Lancet Glob. Health 2020, 8, e59–e66. [Google Scholar] [CrossRef]
- Stemmler, H.; Meemken, E.M. Greenhouse farming and employment: Evidence from Ecuador. Food Policy 2023, 117, 102443. [Google Scholar] [CrossRef]
- Knapp, G. Mountain Agriculture for Global Markets: The Case of Greenhouse Floriculture in Ecuador. Ann. Am. Assoc. Geogr. 2017, 107, 511–519. [Google Scholar] [CrossRef]
- Liu, X.; Xin, L. Spatial and temporal evolution and greenhouse gas emissions of China’s agricultural plastic greenhouses. Sci. Total Environ. 2023, 863, 160810. [Google Scholar] [CrossRef] [PubMed]
- Li, J.; Wang, H.; Wang, J.; Zhang, J.; Lan, Y.; Deng, Y. Combining Multi-Source Data and Feature Optimization for Plastic-Covered Greenhouse Extraction and Mapping Using the Google Earth Engine: A Case in Central Yunnan Province, China. Remote Sens. 2023, 15, 3287. [Google Scholar] [CrossRef]
- Ou, C.; Wang, Y. Tracking Spatio-Temporal Dynamics of Greenhouse-Led Cultivated Land and its Drivers in Shandong Province, China. Front. Environ. Sci. 2022, 10, 944422. [Google Scholar] [CrossRef]
- González-Orozco, C.E.; Diaz-Giraldo, R.A.; Rodriguez-Castañeda, C. An early warning for better planning of agricultural expansion and biodiversity conservation in the Orinoco high plains of Colombia. Front. Sustain. Food Syst. 2023, 7, 1192054. [Google Scholar] [CrossRef]
- Gao, C.; Wu, Q.; Dyck, M.; Lv, J.; He, H. Greenhouse area detection in Guanzhong Plain, Shaanxi, China: Spatio-temporal change and suitability classification. Int. J. Digit. Earth 2022, 15, 226–248. [Google Scholar] [CrossRef]
- Kil, S.-H.; Park, H.-M.; Park, M.; Kim, Y.I.; Lee, E. Location Selection of Urban Rooftop Greenhouses in Seoul Based on AHP and GIS. Land 2023, 12, 2187. [Google Scholar] [CrossRef]
- Mercan, Y.; Sezgin, F. The Use Of Multi-Criteria Decision Analysis (MCDA) And Geographic Information System (GIS) In Selection of Greenhouse Site Location: The Case of Aydin Region In Türkiye. Adnan Menderes Üniversitesi Ziraat Fakültesi Derg. 2023, 20, 149–158. [Google Scholar] [CrossRef]
- LaRota-Aguilera, M.J.; Zapata-Caldas, E.; Buitrago-Bermúdez, O. New criteria for sustainable land use planning of metropolitan green infrastructures in the tropical Andes. Landsc. Ecol. 2024, 39, 112. [Google Scholar] [CrossRef]
- Kleemann, J.; Koo, H.; Hensen, I.; Mendieta-Leiva, G.; Kahnt, B.; Kurze, C.; Inclan, D.J.; Cuenca, P.; Noh, J.K.; Hoffmann, M.H.; et al. Priorities of action and research for the protection of biodiversity and ecosystem services in continental Ecuador. Biol. Conserv. 2022, 265, 109404. [Google Scholar] [CrossRef]
- Koo, H.; Kleemann, J.; Cuenca, P.; Noh, J.K.; Fürst, C. Implications of landscape changes for ecosystem services and biodiversity: A national assessment in Ecuador. Ecosyst. Serv. 2024, 69, 101652. [Google Scholar] [CrossRef]
- Correa-Pinilla, D.E.; Gutiérrez-Vanegas, A.J.; Gil-Restrepo, J.P.; Martínez-Atencia, J.; Córdoba-Gaona, O.d.J. Agroecological and South American leaf blight escape zones for rubber cultivation in Colombia. Agron. J. 2022, 114, 2830–2844. [Google Scholar] [CrossRef]
- Esri. Presence-Only Prediction (Spatial Statistics). ArcGIS Pro Tool Reference. Available online: https://pro.arcgis.com/es/pro-app/latest/tool-reference/spatial-statistics/presence-only-prediction.htm (accessed on 24 February 2025).
- França, L.C.d.J.; Jarochinski e Silva, C.S.; Mucida, D.P.; Severino da Costa, J.; Gomide, L.R. Towards renewable energy projects under sustainable watersheds principles for forest biomass supply. Biomass Bioenergy 2023, 176, 106916. [Google Scholar] [CrossRef]
- Ivale, A.H.; de Alencar Nääs, I. Precision Agriculture Impact on Food Production in Brazil. IFIP Adv. Inf. Commun. Technol. 2022, 664, 43–49. [Google Scholar] [CrossRef]
- Sethuraman, S.; Alshahrani, H.M.; Tamizhselvi, A.; Sujaatha, A. Assessment of coastal vulnerability using AHP and machine learning techniques. J. S. Am. Earth Sci. 2024, 147, 105107. [Google Scholar] [CrossRef]
- Zuluaga, A.; Etter, A.; Nepstad, D.; Chará, J.; Stickler, C.; Warren, M. Colombia’s pathway to a more sustainable cattle sector: A spatial multi-criteria analysis. Land Use Policy 2021, 109, 105596. [Google Scholar] [CrossRef]
- Vizuete-Montero, M.O.; Figueroa-Saavedra, H.F.; Barbaru-Grajales, A.D.; Zapata-Mayorga, H.A.; Herrera-Ocaña, H.R.; Moya, W. Physio-edaphoclimatic factors show optimal soil suitability for three tropical crops in the Ecuadorian Amazon. Sci. Agric. 2024, 81, e20220214. [Google Scholar] [CrossRef]
- Food Agriculture Organization of the United Nations. Integrating Spatial Planning into Sustainable Rural Development: Aframework Aligned with SDG2; FAO: Rome, Italy, 2022. [Google Scholar]
- Prefectura Imbabura. Plan de Desarrollo y Ordenamiento Territorial de la Provincia de Imbabura (2015–2035); Prefectura Imbabura: Ibarra, Ecuador, 2018. [Google Scholar]
- Gobierno Provincial de Imbabura. Información Básica del Geoparque Imbabura. Geoparque Imbabura. Available online: https://geoparque.imbabura.gob.ec/index.php/es/geoparque/informacion-basica (accessed on 27 February 2025).
- Albuja-Illescas, L.M.; Carrión-Burgos, A.M.; Jiménez-Lao, R.; Lao, M.T. Diagnosis of Protected Agriculture in Imbabura—Ecuador, Period 2016–2023. Agronomy 2025, 15, 166. [Google Scholar] [CrossRef]
- World Bank Climate Change Knowledge Portal. Ecuador. Disponible en Líne. 2021. Available online: https://climateknowledgeportal.worldbank.org/country/ecuador/climate-data-historical (accessed on 13 March 2025).
- Food Agriculture Organization of the United Nations. A Framework for Land Evaluation; Soils Bulletin 32; FAO: Rome, Italy, 1976. [Google Scholar]
- Sun, M.; He, Y.; Li, C. Spatial heterogeneity of agroecological factors and their implications for sustainable land use planning in mountainous zones. Geoderma 2024, 437, 116582. [Google Scholar] [CrossRef]
- Khatib, A.; Sizov, A.P. Mapping the spatial distribution and potential expansion of agricultural plastic greenhouses in Tartus, Syria using GIS and remote sensing techniques. Geocarto Int. 2022, 38, 1–24. [Google Scholar] [CrossRef]
- Arias-Muñoz, P.; Cabrera-García, S.; Jácome-Aguirre, G. A Multicriteria Geographic Information System Analysis of Wildfire Susceptibility in the Andean A Multicriteria Geographic Information System Analysis of Wildfire Susceptibility in the Andean Region: A Case Study in Ibarra, Ecuador. Fire 2024, 7, 81. [Google Scholar] [CrossRef]
- Sathiyamurthi, S.; Saravanan, S.; Sankriti, R.; Aluru, M.; Sivaranjani, S.; Srivel, R. Integrated GIS and AHP techniques for land suitability assessment of cotton crop in Perambalur District, South India. Int. J. Syst. Assur. Eng. Manag. 2024, 15, 267–278. [Google Scholar] [CrossRef]
- Sekhar, S.; Dutta, S.; Sahana, M.; Areendran, G.; Raj, K. Assessing Impact of Climate Variability on Potential Agricultural Land Suitability in Nalanda District, Bihar. In Sustainable Development Goals Series: Vol. Part F2706; Springer: Cham, Switzerland, 2022. [Google Scholar] [CrossRef]
- Choudhary, K.; Boori, M.S.; Shi, W.; Valiev, A.; Kupriyanov, A. Agricultural land suitability assessment for sustainable development using remote sensing techniques with analytic hierarchy process. Remote Sens. Appl. Soc. Environ. 2023, 32, 101051. [Google Scholar] [CrossRef]
- Morán-Alonso, N.; Viedma-Guiard, A.; Simón-Rojo, M.; Córdoba-Hernández, R. Agricultural Land Suitability Analysis for Land Use Planning: The Case of the Madrid Region. Land 2025, 14, 134. [Google Scholar] [CrossRef]
- Demir, S. Determination of suitable agricultural areas and current land use in Isparta Province, Türkiye, through a linear combination technique and geographic information systems. Environ. Dev. Sustain. 2024, 26, 13455–13493. [Google Scholar] [CrossRef]
- Sabljić, L.; Lukić, T.; Bajić, D.; Marković, R.; Spalević, V.; Delić, D.; Radivojević, A.R. Optimizing agricultural land use: A GIS-based assessment of suitability in the Sana River Basin, Bosnia and Herzegovina. Open Geosci. 2024, 16, 20220683. [Google Scholar] [CrossRef]
- Karna, B.K.; Shrestha, S.; Koirala, H.L. GIS based Approach for Suitability Analysis of Residential Land Use. Geogr. J. Nepal 2023, 16, 35–50. [Google Scholar] [CrossRef]
- Aldababseh, A.; Temimi, M.; Maghelal, P.; Branch, O.; Wulfmeyer, V. Multi-criteria evaluation of irrigated agriculture suitability to achieve food security in an arid environment. Sustainability 2018, 10, 803. [Google Scholar] [CrossRef]
- Ambarwulan, W.; Nahib, I.; Widiatmaka, W.; Dewi, R.S.; Munajati, S.L.; Suwarno, Y.; Sutrisno, D.; Suprajaka, S. Delineating suitable site for settlement in potential earthquake vulnerable areas using spatial multi-criteria decision analysis in the Sukabumi regency, Indonesia. J. Water Land Dev. 2022, 53, 10–21. [Google Scholar] [CrossRef]
- Bagheri, M.; Sulaiman, W.N.A.; Vaghefi, N. Application of geographic information system technique and analytical hierarchy process model for land-use suitability analysis on coastal area. J. Coast. Conserv. 2013, 17, 1–10. [Google Scholar] [CrossRef]
- Malczewski, J.; Jankowski, P. Emerging trends and research frontiers in spatial multicriteria analysis. Int. J. Geogr. Inf. Sci. 2020, 34, 1257–1282. [Google Scholar] [CrossRef]
- Saaty, R.W. The analytic hierarchy process-what it is and how it is used. Math. Model. 1987, 9, 161–176. [Google Scholar] [CrossRef]
- Saaty, T.L. How to make a decision: The analytic hierarchy process. Eur. J. Oper. Res. 1990, 48, 9–26. [Google Scholar] [CrossRef]
- Benito, B.P.d.; Peñas, J.G.d. Greenhouses, land use change, and predictive models: MaxEnt and Geomod working together. In Environmental Science and Engineering; Springer: Berlin/Heidelberg, Germany, 2008. [Google Scholar] [CrossRef]
- Fitzgibbon, A.; Pisut, D.; Fleisher, D. Evaluation of Maximum Entropy (Maxent) Machine Learning Model to Assess Relationships between Climate and Corn Suitability. Land 2022, 11, 1382. [Google Scholar] [CrossRef]
- Ahmadi, M.; Hemami, M.R.; Kaboli, M.; Shabani, F. MaxEnt brings comparable results when the input data are being completed; Model parameterization of four species distribution models. Ecol. Evol. 2023, 13, e9827. [Google Scholar] [CrossRef] [PubMed]
- Su, P.; Zhang, A.; Wang, R.; Wang, J.; Gao, Y.; Liu, F. Prediction of future natural suitable areas for rice under representative concentration pathways (Rcps). Sustainability 2021, 13, 1580. [Google Scholar] [CrossRef]
- Phillips, S.J.; Anderson, R.P.; Schapire, R.E. Maximum entropy modeling of species geographic distributions. Ecol. Model. 2006, 190, 231–259. [Google Scholar] [CrossRef]
- Yang, X.Q.; Kushwaha, S.P.S.; Saran, S.; Xu, J.; Roy, P.S. Maxent modeling for predicting the potential distribution of medicinal plant, Justicia adhatoda L. in Lesser Himalayan foothills. Ecol. Eng. 2013, 51, 83–87. [Google Scholar] [CrossRef]
- Gyamfi, E.K.; ElSayed, Z.; Kropczynski, J.; Yakubu, M.A.; Elsayed, N. Agricultural 4.0 Leveraging on Technological Solutions: Study for Smart Farming Sector. arXiv 2024, arXiv:2401.00814. [Google Scholar] [CrossRef]
- Phani, V.; Khan, M.R.; Dutta, T.K. K. Plant-parasitic nematodes as a potential threat to protected agriculture: Current status and management options. Crop Prot. 2021, 144, 105573. [Google Scholar] [CrossRef]
- Jellason, N.P.; Robinson, E.J.Z.; Chapman, A.S.A.; Neina, D.; Devenish, A.J.M.; Po, J.Y.T.; Adolph, B. A systematic review of drivers and constraints on agricultural expansion in sub-saharan africa. Land 2021, 10, 332. [Google Scholar] [CrossRef]
- Al-Maimani, A.M.; Al-Ismaili, A.M.; Al-Maktoumi, A.K.; Charabi, Y. Spatio-Temporal Distribution of Greenhouses and Affecting Driving Factors in Al-Batinah South, Oman, Using GIS Mapping. Am.-Eurasian J. Sustain. Agric. 2019, 13, 13–33. [Google Scholar] [CrossRef]
- Lin, J.; Jin, X.; Ren, J.; Liu, J.; Liang, X.; Zhou, Y. Rapid mapping of large-scale greenhouse based on integrated learning algorithm and google earth engine. Remote Sens. 2021, 13, 1245. [Google Scholar] [CrossRef]
- Zhang, Y.; Wu, L.; Yu, L.; Long, H.; Li, W. Greenhouse-mulched farmland transition: Theory and progress. Dili Yanjiu 2024, 43, 519–534. [Google Scholar] [CrossRef]
- Dhandare, K.M.; Waghole, S.B.; Kshirsagar, A. Opportunities and Challenges in Protected Cultivation in India. Int. J. Sci. Res. Eng. Manag. 2024, 8, 1–6. [Google Scholar] [CrossRef]
- Benke, K.; Tomkins, B. Future food-production systems: Vertical farming and controlled-environment agriculture. Sustain. Sci. Pract. Policy 2017, 19, 2250073. [Google Scholar] [CrossRef]
- Montero, J.I.; Stanghellini, C.; Castilla, N. Greenhouse technology for sustainable agriculture: A review of socio-economic and environmental impacts. J. Agric. Eng. Biotechnol. 2024, 12, 45–59. [Google Scholar]
- Djibrilla, A.; Saidou, A.; Mahaman, M. Environmental challenges in greenhouse agriculture: Plastic waste management and sustainable solutions. Sustainability 2022, 14, 1359. [Google Scholar] [CrossRef]
- Liu, S.; Deichmann, M.; Moro, M.A.; Andersen, L.S.; Li, F.; Dalgaard, T.; McKnight, U.S. Targeting sustainable greenhouse agriculture policies in China and Denmark: A comparative study. Land Use Policy 2022, 119, 106148. [Google Scholar] [CrossRef]
- Yu, B.; Song, W.; Lang, Y. Spatial patterns and driving forces of greenhouse land change in Shouguang City, China. Sustainability 2017, 9. [Google Scholar] [CrossRef]
- Fernández, J.R.; Torres, M.; Martínez, L. Balancing agricultural expansion and biodiversity conservation: A multi-criteria spatial planning approach. Agric. Ecosyst. Environ. 2022, 326, 107784. [Google Scholar] [CrossRef]
- Kumar, P.; Singh, R. GIS-based multi-criteria analysis for identifying suitable sites for agricultural development. Sustainability 2021, 13, 7703. [Google Scholar] [CrossRef]
- Bondarev, B.; Nosov, S.; Antipov, O.; Papikian, L. Urban land use planning within the system of sustainable urban development management. E3S Web Conf. 2019, 110, 8. [Google Scholar] [CrossRef]
- Galli, N.; Chiarelli, D.D.; Ricciardi, L.; Rulli, M.C. A Blue Water Scarcity-Based Method for Hydrologically Sustainable Agricultural Expansion Design. Water Resour. Res. 2023, 59, e2023WR034473. [Google Scholar] [CrossRef]
- Forkuor, G.; Amponsah, W.; Oteng-Darko, P.; Osei, G. Safeguarding food security through large-scale adoption of agricultural production technologies: The case of greenhouse farming in Ghana. Clean. Eng. Technol. 2022, 6, 100384. [Google Scholar] [CrossRef]
- Zhong, T.; Si, Z.; Shi, L.; Ma, L.; Liu, S. Impact of state-led food localization on suburban districts’ farmland use transformation: Greenhouse farming expansion in Nanjing city region, China. Landsc. Urban Plan. 2020, 202, 103872. [Google Scholar] [CrossRef]
- Liu, M.; Qi, D.; Zhong, T. Agricultural development policy diffusion associated with leading cadre’s experience and expansion of protected agriculture in China. Front. Environ. Sci. 2023, 11, 1078565. [Google Scholar] [CrossRef]
- Ateka, J.M.; Mbeche, R.M.; Muendo, K.M. Determinants of protected tomato production technologies among smallholder peri-urban producers in kiambu county, kenya. J. Agric. Rural Dev. Trop. Subtrop. 2021, 122, 43–52. [Google Scholar] [CrossRef]
- Ravani, M.; Ghasemi, S.; Mirzapour, M. Strategies to enhance smallholder farmer access to greenhouse technologies: Policy and innovation perspectives. Agriculture 2023, 13, 1012. [Google Scholar] [CrossRef]
- Joensuu, M.; Aakkula, J.; Huuskonen, S. Inclusive financing and innovation systems for smallholder greenhouse farmers in developing countries. World Dev. Perspect. 2021, 23, 100311. [Google Scholar] [CrossRef]
- Ajayi, O.O.; Toromade, A.S.; Olagoke, A. Climate-Smart Agricultural Finance (CSAF): A model for sustainable investments in agriculture. WJARR 2024, 24, 1–11. [Google Scholar] [CrossRef]
- Maraveas, C.; Karavas, C.S.; Loukatos, D.; Bartzanas, T.; Arvanitis, K.G.; Symeonaki, E. Agricultural Green-houses: Resource Management Technologies and Perspectives for Zero Greenhouse Gas Emissions. Agriculture 2023, 13, 1464. [Google Scholar] [CrossRef]
- Forster, E.J.; Styles, D.; Healey, J.R. Temperate forests can deliver future wood demand and climate-change mitigation dependent on afforestation and circularity. Nat. Commun. 2025, 16, 3872. [Google Scholar] [CrossRef] [PubMed]
- Niu, J.; Jin, G.; Zhang, L. Territorial spatial zoning based on suitability evaluation and its impact on ecosystem services in Ezhou city. J. Geogr. Sci. 2023, 33, 2278–2294. [Google Scholar] [CrossRef]
- Wieckowski, J.; Sałabun, W.; Kizielewicz, B.; Baczkiewicz, A.; Shekhovtsov, A.; Paradowski, B.; Watróbski, J. Recent advances in multi-criteria decision analysis: A comprehensive review of applications and trends. Int. J. Knowl.-Based Intell. Eng. Syst. 2023, 27. [Google Scholar] [CrossRef]


| Data Category | Variable Name | Range/Units | Assigned Value | Variable Code |
|---|---|---|---|---|
| Water resources | Spatial distribution of irrigation systems | Yes | 2 | V1 |
| No | 0 | |||
| Agricultural clustering | Distance to greenhouses | 0–500 m | 2 | V2 |
| 500–1000 m | 1 | |||
| >1000 m | 0 | |||
| Ecological Criterion | Land cover and use maps | Agricultural | 2 | V3 |
| Livestock | 1 | |||
| Other uses | 0 | |||
| Infraestructure Criterion | Distance to roads | 0–500 m | 2 | V4 |
| 500–1000 m | 1 | |||
| >1000 m | 0 | |||
| Climatic criteron | Average anual temperature | 12–24 °C | 2 | V5 |
| 8–12 °C | 1 | |||
| <8 and >24 | 0 | |||
| Topographic criterion | Slope | 0–25% | 2 | V6 |
| 25–45% | 1 | |||
| >45% | 0 | |||
| Altitude | 0–2700 a.m.s.l. | 2 | V7 | |
| 2700–3000 a.m.s.l. | 1 | |||
| >3000 a.m.s.l | 0 | |||
| Soil resources | Soil texture | Sandy Loam, Loam, Clay-Loam Sandy, Clay Loam, Sandy Loam, Silty Loam | 2 | V8 |
| Clay-Sandy, Clay-Silty, Silty | 1 | |||
| 100% Sandy, Clayey | 0 | |||
| Soil depth | Moderately | 2 | V9 | |
| Shallow | 1 | |||
| Superficial | 0 | |||
| Soil drainage | Good | 2 | V10 | |
| Moderate | 1 | |||
| Excessive | 0 | |||
| Soil salinity | Non-saline | 2 | V11 | |
| Slightly saline | 1 | |||
| Saline | 0 |
| Scale | Definition | Scale | Definition |
|---|---|---|---|
| 1 | i and j have equal importance | ||
| 3 | i is slightly more preferable than j | 1/3 | i is slightly less preferable than j |
| 5 | i is more preferable than j | 1/5 | i is less preferable than j |
| 7 | i is strongly more preferable than j | 1/7 | i is strongly less preferable than j |
| 9 | i is extremely more preferable than j | 1/9 | i is extremely less preferable than j |
| V1 | V2 | V3 | V4 | V5 | V6 | V7 | V8 | V9 | V10 | V11 | Ci | λi | |
|---|---|---|---|---|---|---|---|---|---|---|---|---|---|
| V1 | 1 | 2 | 1/5 | 3 | 2 | 4 | 3 | 4 | 4 | 4 | 5 | 0.17 | 1.503 |
| V2 | 1/2 | 1 | 1/3 | 2 | 2 | 2 | 2 | 3 | 3 | 3 | 3 | 0.12 | 1.098 |
| V3 | 5 | 3 | 1 | 3 | 2 | 2 | 2 | 3 | 3 | 3 | 3 | 0.20 | 0.958 |
| V4 | 1/3 | 1/2 | 1/3 | 1 | 2 | 2 | 2 | 3 | 3 | 3 | 3 | 0.10 | 1.223 |
| V5 | 1/2 | 1/2 | 1/2 | 1/2 | 1 | 2 | 2 | 2 | 3 | 3 | 3 | 0.09 | 1.057 |
| V6 | 1/4 | 1/2 | 1/2 | 1/2 | 1/2 | 1 | 1/3 | 1/3 | 3 | 1/3 | 3 | 0.05 | 1.204 |
| V7 | 1/3 | 1/2 | 1/2 | 1/2 | 1/2 | 3 | 1 | 2 | 2 | 2 | 3 | 0.08 | 1.083 |
| V8 | 1/4 | 1/3 | 1/3 | 1/3 | 1/2 | 3 | 1/2 | 1 | 2 | 2 | 3 | 0.06 | 1.212 |
| V9 | 1/4 | 1/3 | 1/3 | 1/3 | 1/3 | 1/3 | 1/2 | 1/2 | 1 | 3 | 3 | 0.05 | 1.167 |
| V10 | 1/4 | 1/3 | 1/3 | 1/3 | 1/3 | 3 | 1/2 | 1/2 | 1/3 | 1 | 3 | 0.05 | 1.189 |
| V11 | 1/5 | 1/3 | 1/3 | 1/3 | 1/3 | 1/3 | 1/3 | 1/3 | 1/3 | 1/3 | 1 | 0.03 | 0.897 |
| ∑ | 8.87 | 9.33 | 4.70 | 11.83 | 11.50 | 22.67 | 14.17 | 19.67 | 24.67 | 25 | 33 | 1.00 | 12.59 |
| Area of Thematic Classes | Range | |
|---|---|---|
| Minimum | Maximum | |
| Highly suitable area (HSA) | 1.61 | 2.0 |
| Moderately suitable area (MoSA) | 1.21 | 1.6 |
| Marginally suitable area (MaSA) | 0.81 | 1.2 |
| Unsuitable area (UA) | 0.41 | 0.8 |
| Permanently unsuitable area (PUA) | 0 | 0.4 |
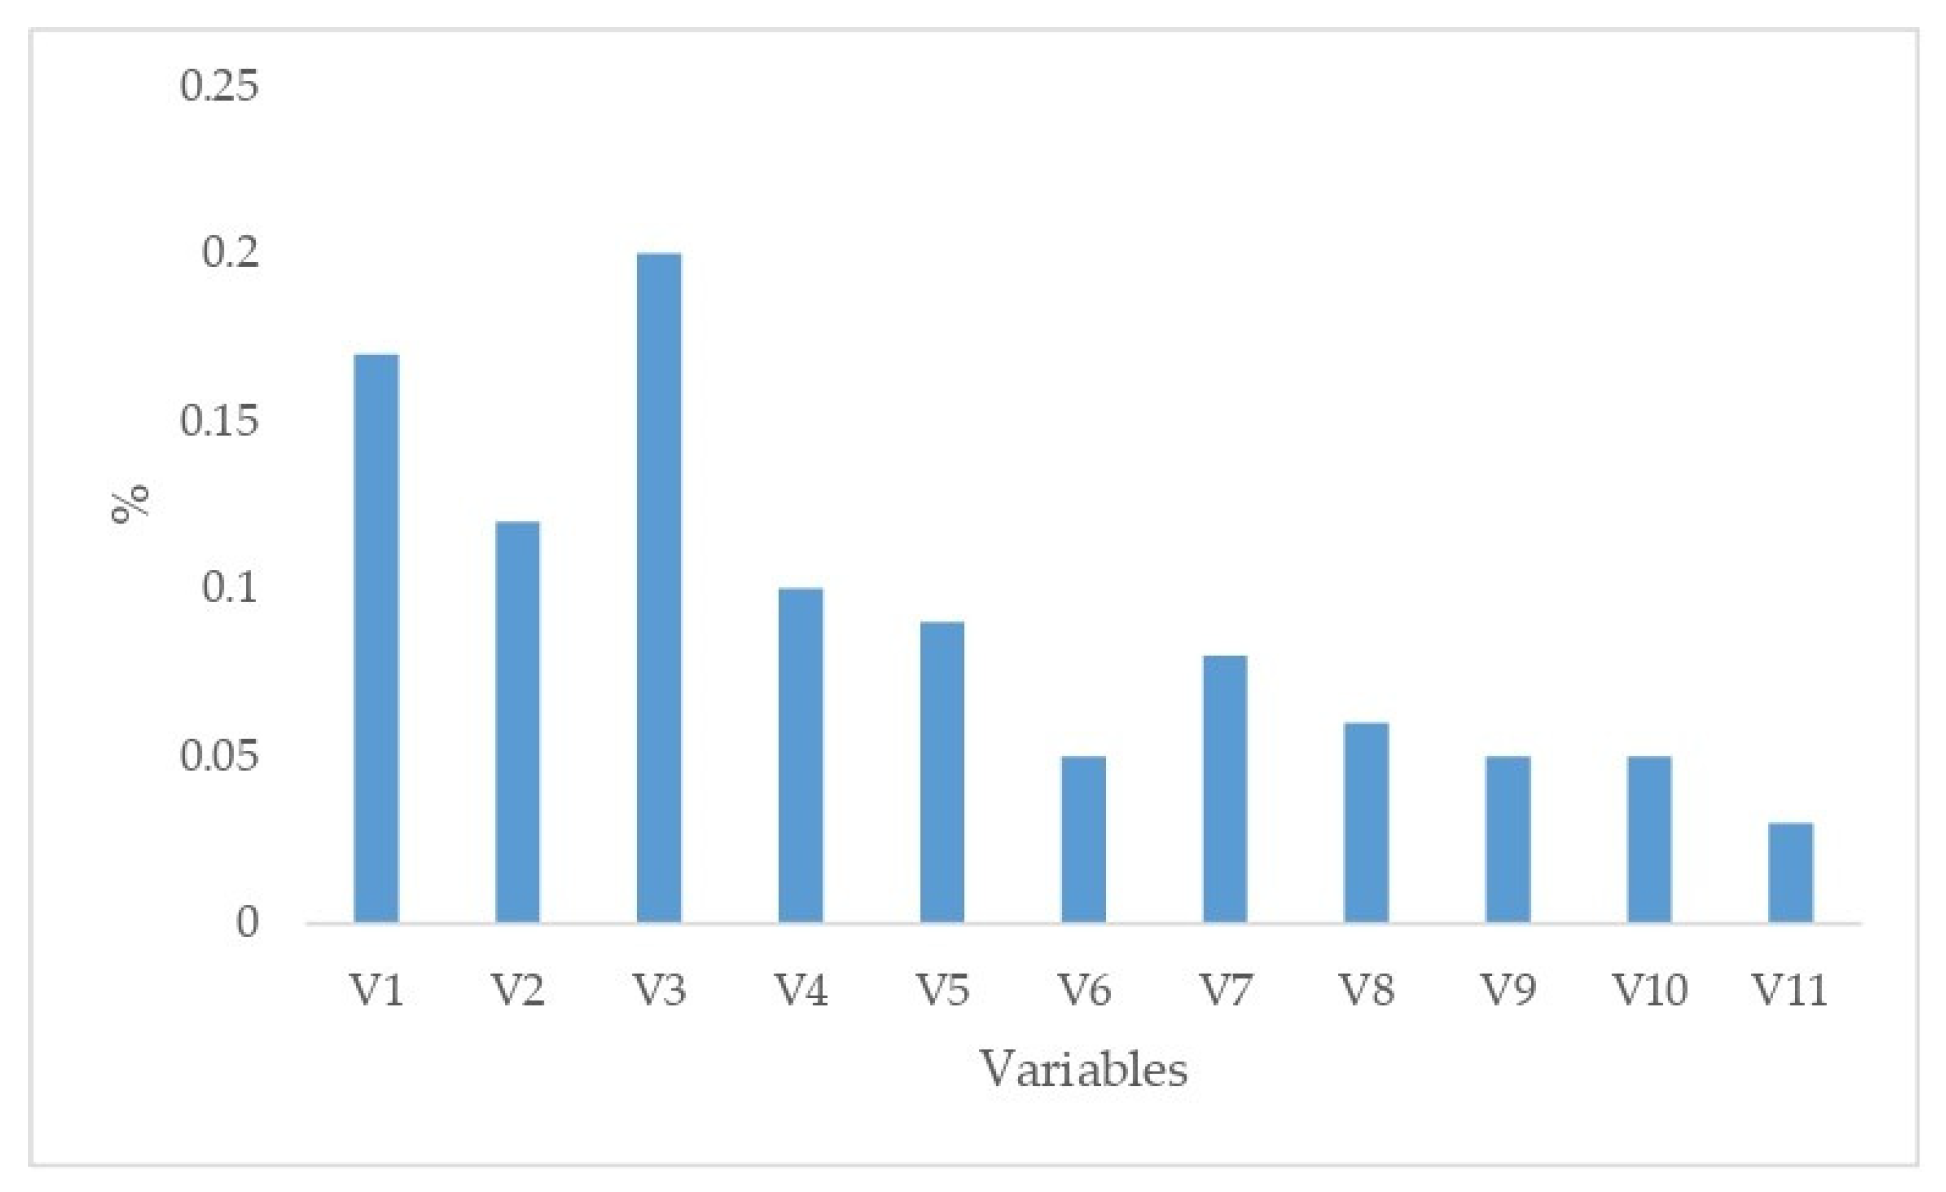
| Variable | Percent Contribution |
|---|---|
| V1 | 0.17 |
| V2 | 0.12 |
| V3 | 0.20 |
| V4 | 0.10 |
| V5 | 0.09 |
| V6 | 0.05 |
| V7 | 0.08 |
| V8 | 0.06 |
| V9 | 0.05 |
| V10 | 0.05 |
| V11 | 0.03 |
| Thematic Classes | Surface Area per Canton (ha) | |||||||
|---|---|---|---|---|---|---|---|---|
| Antonio Ante | Cotacachi | Ibarra | Otavalo | Pimampiro | Urcuquí | Total | % | |
| HSA | 3707.51 | 3485.74 | 5497.51 | 1188.66 | 1699.61 | 5182.61 | 20,761.64 | 4.4 |
| MoSA | 1691.94 | 16,444.48 | 12,337.95 | 9642.02 | 3308.96 | 5422.76 | 48,848.11 | 10.3 |
| MaSA | 1392.15 | 54,087.71 | 37,564.97 | 16,254.55 | 9259.25 | 15,833.06 | 134,391.69 | 28.5 |
| US | 144.33 | 75,708.34 | 48,266.54 | 17,255.49 | 16,480.37 | 38,206.01 | 196,061.08 | 41.6 |
| PUA | 1270.11 | 31,730.3 | 6864.49 | 5432.96 | 13,573.87 | 12,076.66 | 70,948.39 | 15.0 |
| TOTAL | 8206.04 | 181,456.57 | 110,531.46 | 49,773.68 | 44,322.06 | 76,721.1 | 471,010.91 | 100.0 |
| Variable | Percent Contribution | Permutation Importance |
|---|---|---|
| V1 | 1 | 0.5 |
| V2 | 88.7 | 93 |
| V3 | 6.4 | 4.6 |
| V4 | 0.2 | 0.1 |
| V5 | 0.5 | 0.6 |
| V6 | 1.9 | 0.2 |
| V7 | 0 | 0 |
| V8 | 0.2 | 0 |
| V9 | 0.6 | 0.3 |
| V10 | 0.5 | 0.2 |
| V11 | 0.1 | 0.4 |
| Thematic Classes | Surface Area per Canton (ha) | |||||||
|---|---|---|---|---|---|---|---|---|
| Antonio Ante | Cotacachi | Ibarra | Otavalo | Pimampiro | Urcuquí | Total | % | |
| HSA | 1898.46 | 1394.89 | 844.13 | 997.38 | 290.53 | 192.76 | 5618.15 | 1.2 |
| MoSA | 950.06 | 1782.79 | 1150.80 | 2296.57 | 974.91 | 1500.28 | 8655.41 | 1.8 |
| MaSA | 864.35 | 1329.74 | 1193.25 | 2287.75 | 1328.93 | 1572.34 | 8576.35 | 1.8 |
| US | 814.10 | 2132.76 | 1971.52 | 1916.00 | 2823.67 | 1592.79 | 11,250.84 | 2.4 |
| PUA | 11,855.77 | 152,958.75 | 109,552.49 | 46,691.51 | 40,531.87 | 75,319.77 | 436,910.16 | 92.8 |
| TOTAL | 16,382.74 | 159,598.93 | 114,712.19 | 54,189.20 | 45,949.90 | 80,177.95 | 471,010.91 | 100.00 |
| Thematic Classes | Number of Greenhouses GIS-AHP | % | Number of Greenhouses MaxEnt | % |
|---|---|---|---|---|
| HSA | 1281 | 65.4 | 750 | 38.3 |
| MoSA | 552 | 28.2 | 626 | 32.0 |
| MaSA | 81 | 4.1 | 400 | 20.4 |
| UA | 8 | 0.4 | 163 | 8.3 |
| PUA | 0 | 0 | 19 | 1.0 |
| Missing data | 36 | 1.8 | ||
| TOTAL | 1958 | 100 | 1958 | 100 |
Disclaimer/Publisher’s Note: The statements, opinions and data contained in all publications are solely those of the individual author(s) and contributor(s) and not of MDPI and/or the editor(s). MDPI and/or the editor(s) disclaim responsibility for any injury to people or property resulting from any ideas, methods, instructions or products referred to in the content. |
© 2025 by the authors. Licensee MDPI, Basel, Switzerland. This article is an open access article distributed under the terms and conditions of the Creative Commons Attribution (CC BY) license (https://creativecommons.org/licenses/by/4.0/).
Share and Cite
Albuja-Illescas, L.M.; Eraso Terán, O.H.; Arias-Muñoz, P.; Basantes-Vizcaíno, T.-F.; Jiménez-Lao, R.; Lao, M.T. Multi-Criteria Analysis of a Potential Expansion of Protected Agriculture in Imbabura, Ecuador. Agronomy 2025, 15, 1518. https://doi.org/10.3390/agronomy15071518
Albuja-Illescas LM, Eraso Terán OH, Arias-Muñoz P, Basantes-Vizcaíno T-F, Jiménez-Lao R, Lao MT. Multi-Criteria Analysis of a Potential Expansion of Protected Agriculture in Imbabura, Ecuador. Agronomy. 2025; 15(7):1518. https://doi.org/10.3390/agronomy15071518
Chicago/Turabian StyleAlbuja-Illescas, Luis Marcelo, Oscar Hernando Eraso Terán, Paúl Arias-Muñoz, Telmo-Fernando Basantes-Vizcaíno, Rafael Jiménez-Lao, and María Teresa Lao. 2025. "Multi-Criteria Analysis of a Potential Expansion of Protected Agriculture in Imbabura, Ecuador" Agronomy 15, no. 7: 1518. https://doi.org/10.3390/agronomy15071518
APA StyleAlbuja-Illescas, L. M., Eraso Terán, O. H., Arias-Muñoz, P., Basantes-Vizcaíno, T.-F., Jiménez-Lao, R., & Lao, M. T. (2025). Multi-Criteria Analysis of a Potential Expansion of Protected Agriculture in Imbabura, Ecuador. Agronomy, 15(7), 1518. https://doi.org/10.3390/agronomy15071518