Article

Assessing the Sustainability of Miscanthus and Willow as Global Bioenergy Crops: Current and Future Climate Conditions (Part 2)

Institute of Biological & Environmental Science, University of Aberdeen, St Machar Drive, Cruickshank Building, Aberdeen AB24 3UU, UK
*
Author to whom correspondence should be addressed.
Agronomy 2025, 15(6), 1491; https://doi.org/10.3390/agronomy15061491
Submission received: 28 April 2025 / Revised: 16 June 2025 / Accepted: 17 June 2025 / Published: 19 June 2025
(This article belongs to the Special Issue Advances in Grassland Productivity and Sustainability — 2nd Edition)

Abstract

:
Land-based bioenergy systems are increasingly promoted for their potential to support climate change mitigation and energy security. Building on previous productivity and efficiency analyses, this study applies the MiscanFor and SalixFor models to evaluate land use energy intensity (LUEI) for Miscanthus (Miscanthus × giganteus) and willow (Salix spp.) under baseline (1961–1990) and future climate scenarios, and Business-as-Usual (B1) and Fossil Intensive (A1FI) scenarios, projected to 2060. The study also assesses the impact of biomass transport on energy use efficiency (EUE) and quantifies soil organic carbon (SOC) sequestration by Miscanthus. Under current conditions, Miscanthus exhibits a higher global mean LUEI (321 ± 179 GJ ha−1) than willow (164 ± 115.6 GJ ha−1) across all regions (p < 0.0001), with energy yield hotspots in tropical and subtropical regions such as South America, Sub-Saharan Africa, and Southeast Asia. Colder regions, such as Europe and Canada, show limited energy potential. By 2060, LUEI is projected to decline by 9–15% for Miscanthus and 8–13% for willow, with B1 improving energy returns in temperate zones and A1FI reducing them in the tropics. Global EUE for Miscanthus declines significantly (p < 0.0001) by 21%, from 15.73 ± 7.1 to 12.37 ± 5.2 as biomass transport distance increases from 50 km to 500 km. Mean SOC sequestration is estimated at 1.20 ± 1.46 t C ha−1, with tropical hotspots reaching up to 4.57 t C ha−1 and some cooler regions exhibiting net losses (–7.93 t C ha−1). Climate change significantly reduces SOC gains compared to baseline (p < 0.0001), although differences between B1 and A1FI are not statistically significant. These findings highlight the importance of region-specific, climate-resilient biomass systems to optimize energy returns and carbon benefits under future climate conditions.

1. Introduction

Miscanthus (Miscanthus × giganteus) and willow (Salix spp.) are among the leading candidates for sustainable bioenergy production due to their high biomass yields and adaptability to diverse environmental conditions [1]. This manuscript represents Part 2 of a two-part study. In Part 1 [2], we assessed biomass yield potential, energy outputs, and input requirements across spatial and temporal scales under current and future climate scenarios using process-based modelling. Building on that foundation, Part 2 expands the analysis to include additional dimensions that are critical to assessing the broader sustainability of bioenergy systems: land use energy intensity (LUEI), the impacts of biomass transport on energy use efficiency (EUE), and soil carbon sequestration. These additional aspects were not fully explored in Part 1 due to scope limitations and data complexity; they require dedicated analysis, particularly for SOC, which depends on detailed biomass partitioning and turnover dynamics, and on EUE, which involves logistics and transport energy not addressed previously. By incorporating these new components, Part 2 provides a more holistic view of the environmental and energy implications of bioenergy crop deployment. For the purposes of this study, we consider the values relating to the biomass feedstock used as fuel at the farm gate or after transportation at the fuel use location gate; we do not consider thermal conversion efficiencies of the end use. While both crops are assessed for LUEI, analyses of biomass transport and carbon sequestration are conducted exclusively for Miscanthus, as comparable data for willow were unavailable.
Miscanthus is widely recognized for its high biomass yield and substantial carbon sequestration potential, making it a promising option for sustainable bioenergy production and long-term carbon storage in agricultural systems [3]. Its perennial growth cycle and extensive root system are valuable in promoting the accumulation of soil organic carbon (SOC), contributing to improved soil health and climate mitigation [4,5]. However, evaluating the true sustainability of Miscanthus-based bioenergy systems requires more than just agronomic assessments. Energy use and emissions associated with biomass transport can significantly influence the overall EUE and carbon balance, potentially offsetting some of bioenergy benefits [6]. To address this, the current study incorporates biomass transport considerations into the sustainability assessment of Miscanthus, offering a more comprehensive evaluation that accounts for logistical constraints alongside agronomic potential. Through analysis of transportation-related energy consumption and greenhouse gas (GHG) emissions, the study aims to identify strategies that reduce fossil fuel dependence, improve EUE, and minimize climate impacts [2]. This integrated approach provides critical insights for optimizing biomass supply chains, informing decisions about processing site locations, and guiding policy development to support low-carbon bioenergy systems. Although willow is not included in the carbon sequestration and transport analysis presented in this study, it remains an important species in bioenergy research. Its deep-rooted system contributes to soil stability and nutrient cycling, offering valuable ecosystem services beyond the scope of this study [7]. However, other woody biomass species may be more suitable for use in tropical and subtropical climate zones, but are not considered here.
To conduct this analysis, we applied the MiscanFor and SalixFor models, which simulate biomass yields and energy requirements by integrating climatic conditions, soil properties, and management data [6]. These process-based models are instrumental in evaluating the energy performance of bioenergy crops, particularly under projected climate change scenarios which may significantly influence both productivity and resource demands. Estimation of SOC turnover involves quantifying the incorporation of organic carbon from above- and below-ground biomass into the soil matrix. This is a key process in determining the crop’s long-term contribution to SOC accumulation, an essential factor for improving soil health, fertility, and carbon sequestration potential. Reliable assessment of these carbon inputs is vital for understanding the broader role of Miscanthus systems in GHG mitigation and sustainable land use strategies [8].
By integrating energy yield analysis, transport impacts, and SOC dynamics, this study provides a comprehensive evaluation of Miscanthus and willow as sustainable bioenergy crops. It contributes to the ongoing discussion on their viability within the context of climate change mitigation and the global energy transition. Ultimately, the findings from this study underline the necessity of holistic approaches to bioenergy system design, approaches that account for productivity, environmental performance, and logistical considerations to maximize climate benefits [4,5,6]. Therefore, the aim of this study is to provide an integrated sustainability assessment of Miscanthus and willow as bioenergy crops by evaluating LUEI, the impacts of biomass transport on EUE, and soil carbon sequestration under current and projected future climate conditions.

2. Materials and Methods

2.1. Soil Data

The soil characteristics used in this study were derived from the dataset documented by [2,6]. These data, sourced from the International Geosphere-Biosphere Program—Data and Information System (IGBP-DIS), encompass critical parameters such as wilting point, field capacity, bulk density, soil organic carbon (to a depth of 1 m), thermal capacity, and total nitrogen. The dataset, available at a 5′ × 5′ global grid resolution, was accessed through the Oak Ridge National Laboratory Distributed Active Archive Centre (ORNL DAAC). These inputs formed the basis for driving the MiscanFor and SalixFor models to simulate biomass productivity.

2.2. Crop Data

Land cover data for this analysis were sourced from the CORINE Land Cover 2000 (CLC 2000) dataset [9] as previously detailed in [2,6]. The dataset uses 44 distinct land use classes, though only four were considered appropriate for cultivating Miscanthus. This exclusion reflects the incompatibility of Miscanthus due to its height (3–5 m) with intercropping systems in orchards or planting in woodlands, peatlands or other protected areas. The methodology for selecting suitable categories for Miscanthus cultivation is discussed further in [2,6].

2.3. Climate Data

The climate data used in this study included monthly values for temperature, precipitation, vapour pressure, cloud cover, and temperature range. These data were obtained from global gridded datasets with a spatial resolution of 0.5° × 0.5°, produced by the Climate Research Unit (CRU) at the University of East Anglia, as described by [2,6,10]. Future climate projections (2010–2100) were generated using the HadCM3 global climate model, driven by the IPCC’s Special Report on Emissions Scenarios (SRES). Scenarios B1 and A1FI were selected to evaluate the potential impacts of a fossil-fuel-intensive future versus a sustainability-focused pathway. The baseline period (1961–1990) served as a reference for comparing these projections. Percentage changes in EUE and LUEI due to climate change were calculated using global mean values under baseline and future climate conditions.

2.4. MiscanFor and SalixFor Models

The MiscanFor and SalixFor models are dynamic, process-based simulation tools designed to estimate the growth and biomass yield of Miscanthus and short-rotation coppice willow (referred to as willow in this study). These models, as outlined by [2,6,7], incorporate environmental, agronomic, and management data to predict crop performance under different scenarios. MiscanFor has been successfully applied from local to global scales and has been promoted for its versatility in predicting crop responses to changes in soil conditions, climate variability, and management practices [2]. SalixFor, developed based on MiscanFor principles, is tailored for modelling willow crops and explores similar biophysical and management interactions. Both models enable evaluations of long-term crop productivity, carbon dynamics, and water-use efficiency, thus supporting the development of strategies for sustainable bioenergy production [4]. They run at the fine spatial resolution (5′ × 5′). For each fine-resolution soil grid cell, the programme identifies the corresponding 0.5° × 0.5° climate grid cell in which it is located and assigns the relevant meteorological data from that cell. This approach allows the model to use detailed soil and land use parameters while incorporating the appropriate coarse-resolution climate data. Model outputs are generated at the fine grid resolution, thereby preserving the spatial detail of the input soil dataset.

2.5. Annual Land Use Energy Intensity

Annual land use energy intensity (LUEI) represents the net energy yield of the biomass fuel produced by a bioenergy crop system per unit land area, expressed in GJ ha−1. It is calculated as the difference between the gross energy content of the harvested biomass and the total energy inputs required for cultivation, harvest, processing, and transport. Positive LUEI values indicate a net energy gain, reflecting favourable conditions for energy crop production, while negative values imply that the system consumes more energy than it generates, signalling unsuitability for bioenergy deployment in those locations. This metric enables spatially explicit assessments of land suitability and energy performance under current and future scenarios [8,11].

2.6. Impacts of Biomass Transport on Energy Use Efficiency

The transportation of biomass plays a critical role in determining the overall energy and use efficiency of bioenergy systems. It was possible for transportation impacts of Miscanthus biomass to be assessed, as reliable data and estimation values are available from previous research by the authors of [5]; however, although equivalent comprehensive data for willow are currently unavailable, a similar methodology could be applied knowing the bulk density of chipped and baled willow. Biomass transportation from the Miscanthus cultivation sites to processing facilities or end-use markets introduces environmental, economic, and logistical challenges. To quantify the impacts of transportation on energy use efficiency, two primary transport scenarios were considered:
  • Local utilization: Biomass is transported within a 50 km radius of the cultivation site, representing a decentralized bioenergy model with minimal transportation emissions.
  • Long distance utilization: Biomass is transported over 500 km, simulating scenarios where centralized bioenergy facilities or export markets require long-haul transportation.
The transport energy estimates used in this study are based on literature values for the average fuel consumption of heavy-duty trucks transporting biomass bales, using 40-foot container vehicles at 14% moisture content and Heston bale compaction. These values include energy associated with loading and unloading. Preprocessing operations such as drying and baling are excluded from transport estimates and are accounted for separately in the MiscanFor model’s on-farm energy use calculations. In both scenarios, it was assumed that biomass transport is carried out by heavy-duty trucks, which reflects standard logistical practice for farm-to-plant movement of Miscanthus, particularly in regions where rail or shipping infrastructure is limited or unavailable. This assumption is consistent with the literature on biomass logistics. Miscanthus was assumed to be propagated through rhizomes and converted to biomass bales following harvesting, a common practice to enhance storage efficiency and combustion performance. As illustrated in Table 1, the on-farm energy and carbon costs of production used in the MiscanFor model to represent transport distances, include carbon sequestration per hectare, carbon emissions per tonne of biomass transported, crop moisture content, and annual energy yield. These values were derived from literature estimates specific to truck-based freight transport reported by [5].

2.7. Estimated SOC Turnover for Miscanthus

In this study, global estimation of SOC accumulation under Miscanthus cultivation is supported by well-established data on belowground biomass contributions and carbon inputs. Specifically, the average annual belowground live biomass carbon (C) for Miscanthus is approximately 2.7 times the harvest yield [12,13], providing a robust basis for calculating long-term SOC changes. Additionally, soil carbon inputs from litter (including leaf fall and stubble), dead rhizomes, and root turnover contribute an estimated 0.73 times the harvest yield (Shepherd et al., unpublished). These well-constrained relationships allow for a more precise estimation of SOC dynamics under Miscanthus cultivation.
The initial SOC stock dataset (prior to Miscanthus establishment) was spatially aligned with Miscanthus dry matter (DM) outputs from the MiscanFor model under each climate scenario. This was achieved using the latitude and longitude of each grid cell. Grids were matched to their exact coordinates or, if unavailable, to the nearest neighbouring cell within a 1 m threshold. In cases where initial SOC values were missing, a default value of zero was assigned, as summarized in Table 2.
The annual change and rate of SOC accumulation were calculated using the cumulative SOC values at 30 years (baseline) and 70 years (future scenarios), based on Formulas (1)–(4) below, derived from the Cohort Model [14,15,16] and parameterized for Miscanthus in [17] and implemented in MiscanFor [18].
SOC30 = (SOC_initial × (1 − 0.310745))/10 + DM yield/y × 3.588562
SOC70 = (SOC_initial × (1 − 0.470492))/10 + DM yield/y × 5.568245
SOC annual change (t ha−1) = (SOC30 (or 70) − SOC_initial)/30 (or 70)
SOC annual rate (t ha−1) = SOC30 (or 70)/30 (or 70)
where
SOC30 and SOC70 are the cumulative soil organic carbon stocks (t ha−1) after 30 and 70 years, respectively.
SOC_initial is the initial SOC stock (t ha−1) before Miscanthus cultivation.
The constants (1 − 0.310745) and (1 − 0.470492) represent fractional SOC losses over 30 and 70 years due to decomposition and other natural processes.
DM_yield_per_year refers to the annual average dry matter yield (t ha−1 y−1) of Miscanthus.
The values 3.588562 and 5.568245 are empirical conversion factors accounting for the cumulative contribution of biomass inputs to SOC over 30 and 70 years, respectively [14,15,16].

2.8. Statistical Analysis

All statistical analyses were performed using R (version 4.1.1) with significance determined at p < 0.05. Due to non-normality in the data distributions, differences between groups were tested using the non-parametric Kruskal–Wallis test. Where significant differences were detected, post hoc multiple pairwise comparisons were conducted using the Wilcoxon Rank-Sum test. These analyses were applied to:
  • Compare LUEI between Miscanthus and Willow across each region.
  • Evaluate differences in EUE between 50 km and 500 km biomass transport distances under baseline climate scenario.
  • Assess differences in SOC among the Baseline, B1, and A1FI climate scenarios.

3. Results

3.1. Land Use Energy Intensity for Miscanthus and Willow

3.1.1. Land Use Energy Intensity for Miscanthus and Willow Under Current Climate Conditions

Figure 1 and Table 3 present baseline annual LUEI for Miscanthus and willow, showing similar spatial patterns with notable differences in magnitude and adaptability. Miscanthus achieves higher energy returns, with LUEI values ranging from −8.68 to 753 GJ ha−1 and a global mean of 321 ± 179 GJ ha−1. The highest values occur in tropical and subtropical regions, particularly in Brazil, Sub-Saharan Africa, and Southeast Asia, reflecting favourable growing conditions. Moderate productivity is observed in the southern United States and Eastern Europe, while colder regions (e.g., Scandinavia, Russia, and Canada) show low to negative values due to short growing seasons.
Willow follows a similar regional trend but with generally lower LUEI values (range: −7.98 to 488 GJ ha−1; mean: 164 ± 116 GJ ha−1). It performs well in the tropics and subtropics and displays a broader spread of moderate LUEI in temperate regions such as the central/eastern United States and Central Europe, suggesting greater ecological versatility.
Figure 2 and Table 4 directly compare the regional performance of the two crops. Statistical analysis confirms that the differences in LUEI between Miscanthus and willow are significant in all regions (p < 0.0001). Willow’s broader distribution of moderate LUEI values may suggest higher resilience, although this interpretation should be cautious due to model limitations in simulating drought sensitivity. These results indicate that Miscanthus offers higher energy yield per hectare, while willow may complement it in regions with suboptimal or variable conditions. Both crops show low viability in high-latitude areas due to climate constraints.

3.1.2. Land Use Efficiency Intensity for Miscanthus and Willow Under B1 and A1FI Climate Scenarios

Figure 3 and Figure 4 and Table 3 present the projected LUEI for Miscanthus and willow under the B1 and A1FI scenarios, up to 2060. Results reveal broadly similar spatial patterns for both crops, with key regional differences in magnitude and sensitivity to warming.
Under the B1 scenario, both crops maintain high to very high LUEI values across tropical and subtropical regions particularly in Brazil, Sub-Saharan Africa, Southeast Asia, and coastal Australia despite minor climate-related declines. Temperate regions such as the southern United States, central and eastern Europe, and parts of Central Asia show moderate increases in LUEI, reflecting improved suitability under moderate warming. However, global LUEI declines slightly by 9% for Miscanthus and 8% for willow under B1.
Under the A1FI scenario, warming is more pronounced, leading to greater LUEI expansion into temperate zones. For both crops, significant gains are observed in the midwest and southern United States, and central/eastern Europe, driven by longer growing seasons. However, declines in LUEI occur in some tropical and subtropical areas, where increased heat stress outweighs productivity gains. This leads to a 15% global reduction in LUEI for Miscanthus and 13% for willow. Overall, while both crops show increased bioenergy potential in cooler regions under warming scenarios, excessive heat stress in parts of the global South may constrain future energy efficiency.

3.2. Impacts of Biomass Transport on Energy Use Efficiency

Figure 5, Figure 6, Figure 7 and Figure 8 and Table 5 present the global EUE of Miscanthus cultivation under two biomass transport distances (50 km and 500 km) for baseline and under B1, and A1FI climate scenarios, up to 2060. Across all scenarios, EUE is consistently higher for the 50 km transport scenario, emphasizing the energy penalty associated with long-distance transport. Under the baseline climate (Figure 5a,b), EUE values for 50 km range from 0.05 to 24.75 (mean = 15.73 ± 7.10), while for 500 km, they decline to a range of 0.05–18.20 (mean = 12.37 ± 5.20), marking a 21% average reduction. High-EUE zones are concentrated in tropical and subtropical regions such as Central/South America, Central/Sub-Saharan Africa, Southeast Asia, and northern Australia.
Under the B1 scenario (Figure 7a,b), EUE values remain similar in distribution but decline slightly: 50 km (mean = 15.15 ± 7.13), 500 km (mean = 11.97 ± 5.17), again showing a 21% reduction. The pattern of high EUE in tropical areas persists, while slight increases appear in cooler northern regions due to moderate climate shifts.
Under the A1FI scenario (Figure 8a,b), EUE further declines due to climate stress in warmer regions. Values drop to 14.56 ± 7.10 for 50 km and 11.58 ± 5.14 for 500 km, a 20% reduction. High EUE zones still cluster in tropical latitudes, but reductions are more prominent in temperate and boreal regions such as Canada, Scandinavia, and northern Russia, where climate constraints limit Miscanthus productivity.
Figure 6 and Table 6 highlight regional differences under baseline conditions, showing that the EUE decline due to extended transport is especially pronounced in Africa, Asia, and South America, likely due to a combination of environmental and infrastructure factors. Statistical testing confirms that the reduction in EUE between 50 km and 500 km transport distances is significant across all regions (p < 0.0001). Overall, longer transport distances consistently reduce EUE by around 20–21% across all scenarios, with the most efficient biomass use observed in tropical and subtropical areas. These results underline a key trade-off in bioenergy systems: high productivity regions benefit most from short transport distances to retain net energy efficiency.

3.3. Estimated Soil Organic Carbon Sequestered by Miscanthus

Figure 9 and Table 7 present the global patterns of annual changes in SOC (ΔSOC) and SOC addition rates from Miscanthus cultivation under the baseline (1961–1990) and two future climate scenarios (B1 and A1FI) up to 2060. Under the baseline scenario, most regions, especially tropical Africa, Southeast Asia, and Latin America, show predominantly positive ΔSOC values (Figure 9a). The global mean annual ΔSOC is 1.20 ± 1.46 t ha−1, with some locations reaching up to 4.57 t ha−1, indicating strong carbon accumulation potential. The average SOC addition rate is also highest during this period, at 5.02 ± 2.00 t ha−1, with maxima of up to 21.44 t ha−1, suggesting highly favourable conditions for SOC build-up.
Under the B1 scenario, SOC sequestration potential declines both in spatial extent and intensity (Figure 9b). Many high ΔSOC areas shift to moderate or low gains, particularly in temperate and northern zones. The mean annual ΔSOC drops to 0.62 ± 1.11 t ha−1, and the SOC addition rate decreases to 2.39 ± 1.05 t ha−1, reflecting reduced carbon inputs under changing climate conditions.
The A1FI scenario further diminishes SOC accumulation (Figure 9c), with more widespread areas showing neutral or negative ΔSOC. The mean annual ΔSOC is only 0.49 ± 1.13 t ha−1, and the SOC addition rate declines slightly to 2.34 ± 1.05 t ha−1. Nonetheless, certain regions, especially in Sub-Saharan Africa and Southeast Asia retain relatively high SOC sequestration potential. However, the overall extent of areas with high SOC gains is considerably reduced.
Figure 10 and Table 8 illustrate regional averages of SOC addition rates across the scenarios. Statistical analysis shows that the difference between the baseline and future climate scenarios (B1 and A1FI) is significant (p < 0.0001), while no significant difference is observed between the two future scenarios themselves. The baseline scenario consistently yields higher SOC rates in all regions, underscoring the negative effect of projected climate change on Miscanthus-driven soil carbon accumulation. The greatest gains are seen in South America, Asia, and Africa, which offer optimal growing conditions with relatively stable climate impacts. In contrast, colder northern regions such as Scandinavia and the Baltics show negative SOC addition rates across all scenarios. This suggests that low temperatures, and possibly soil or land use limitations, may constrain SOC benefits from Miscanthus in these zones. Overall, these results highlight that climate change is likely to reduce both the extent and intensity of SOC gains under Miscanthus cultivation. The findings emphasize the importance of site-specific conditions and adaptive land management strategies in maintaining carbon sequestration benefits under future climates.

4. Discussion

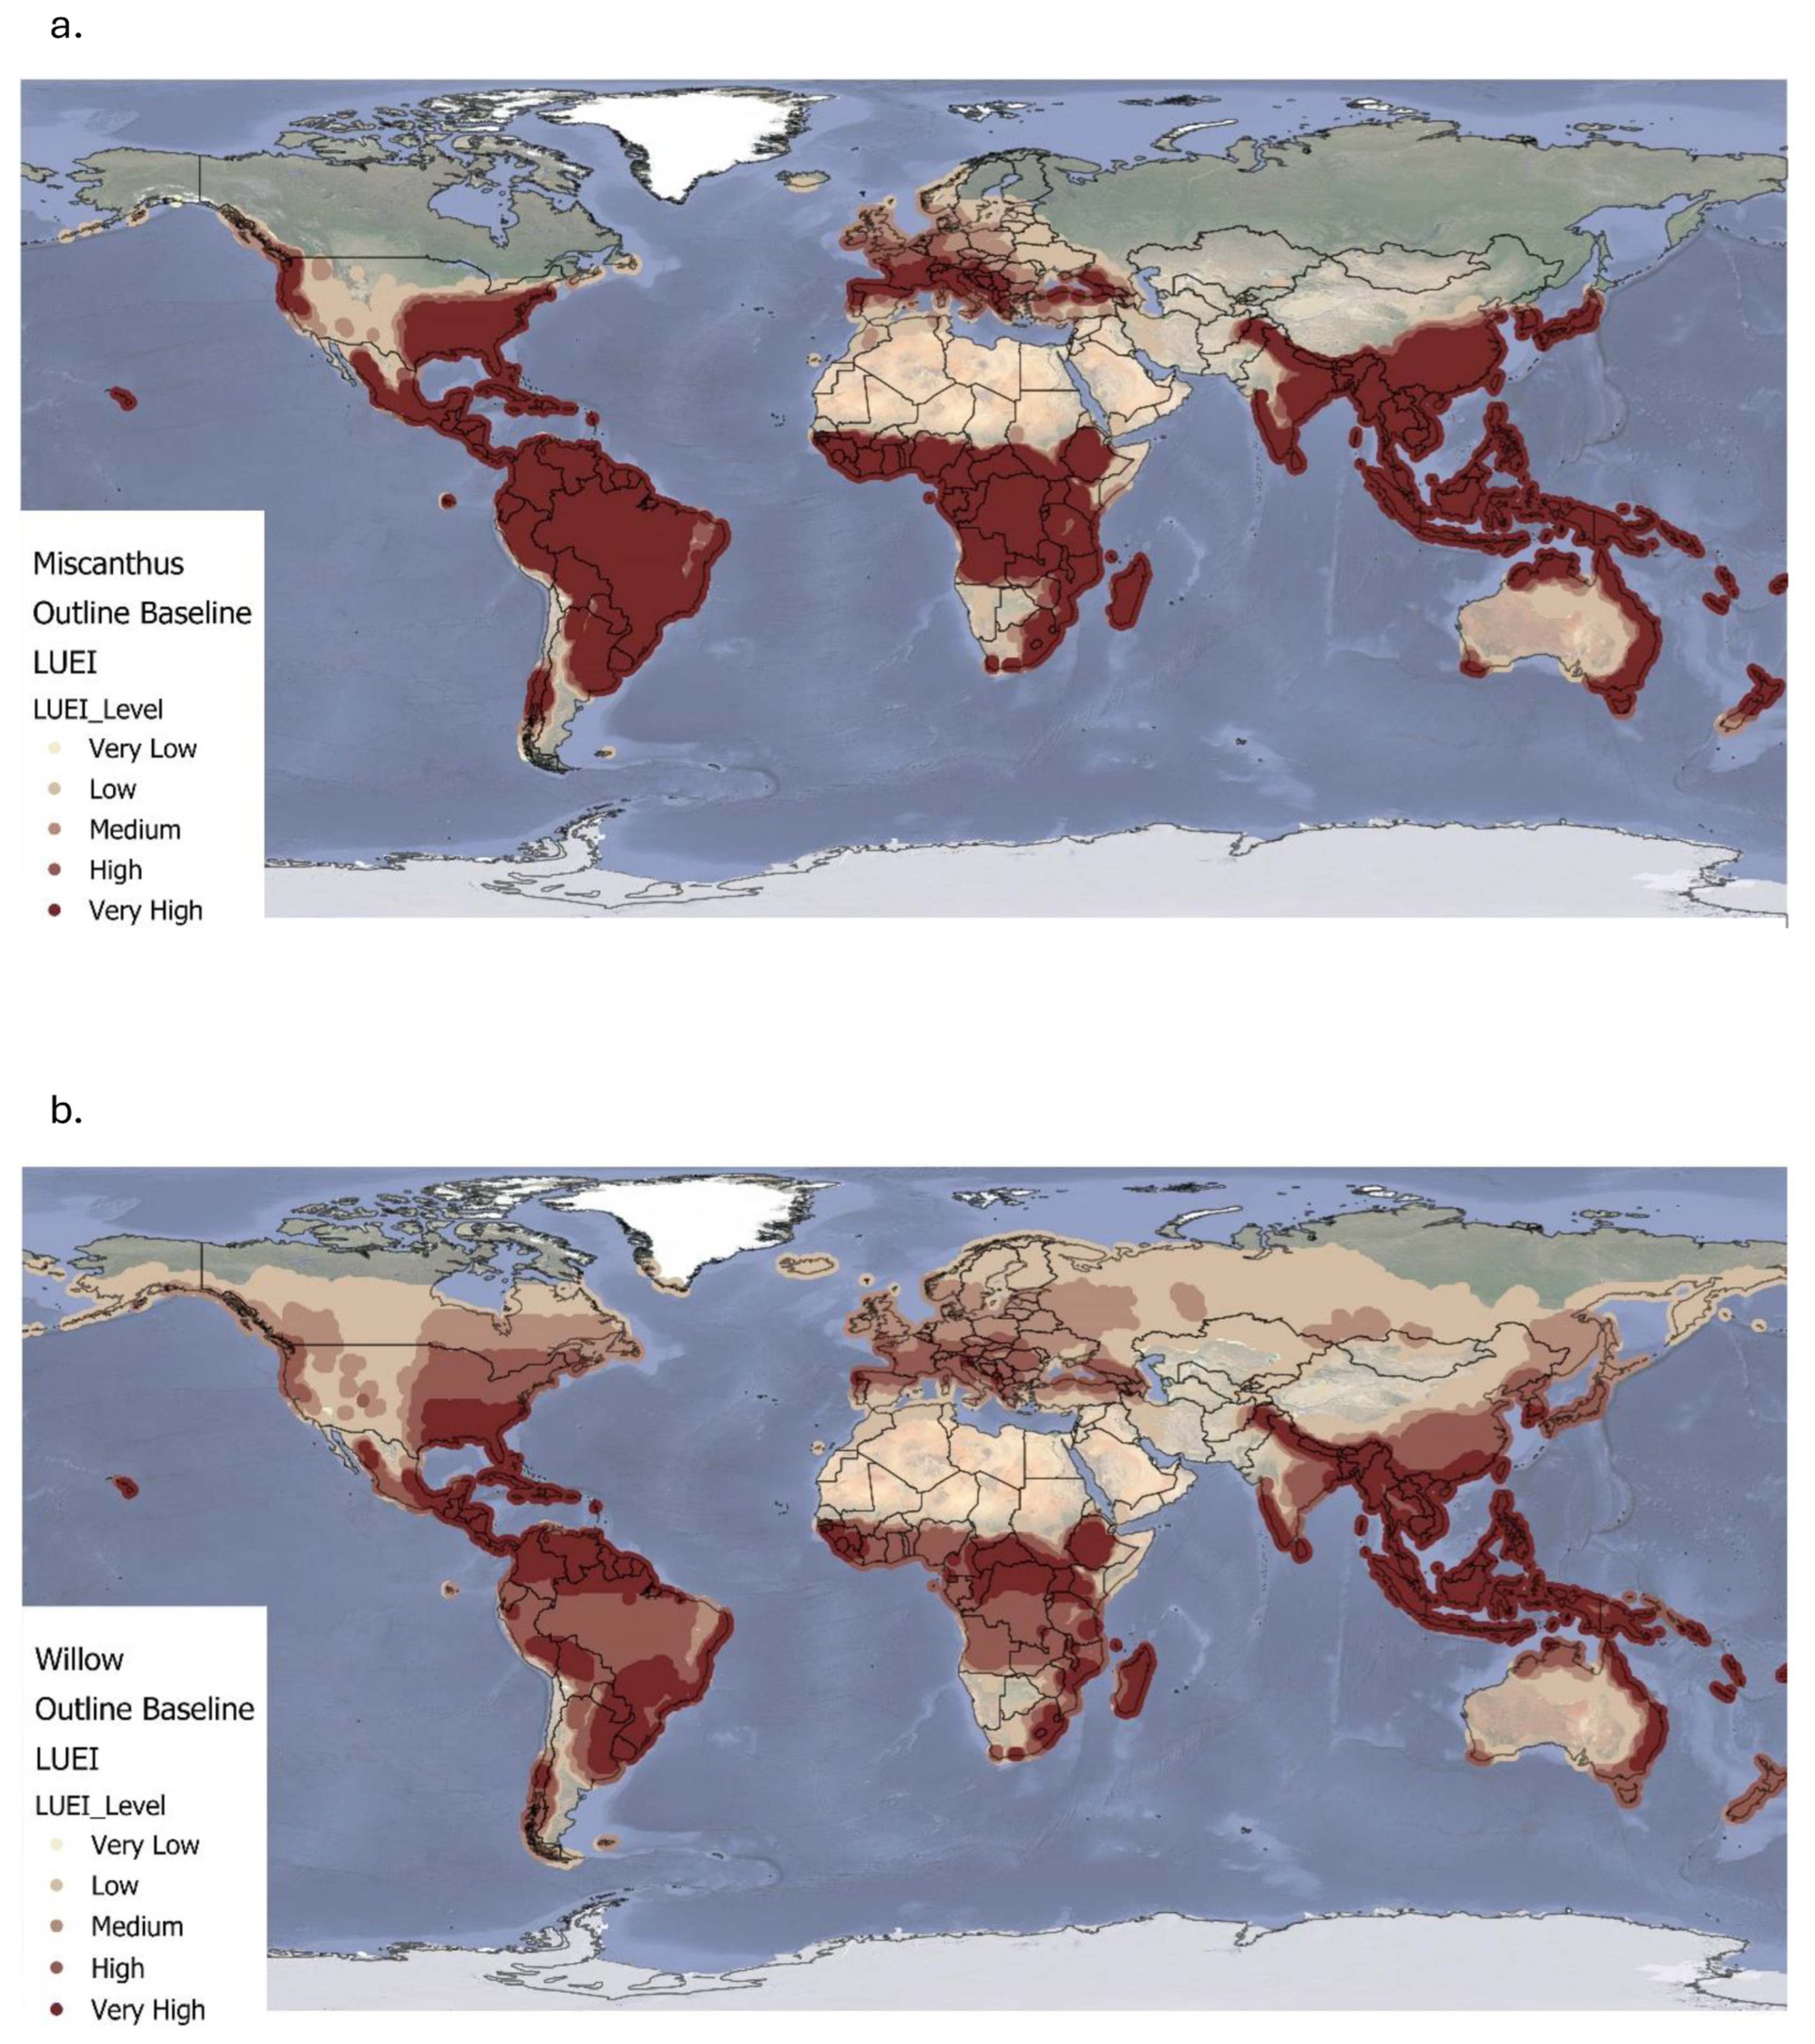
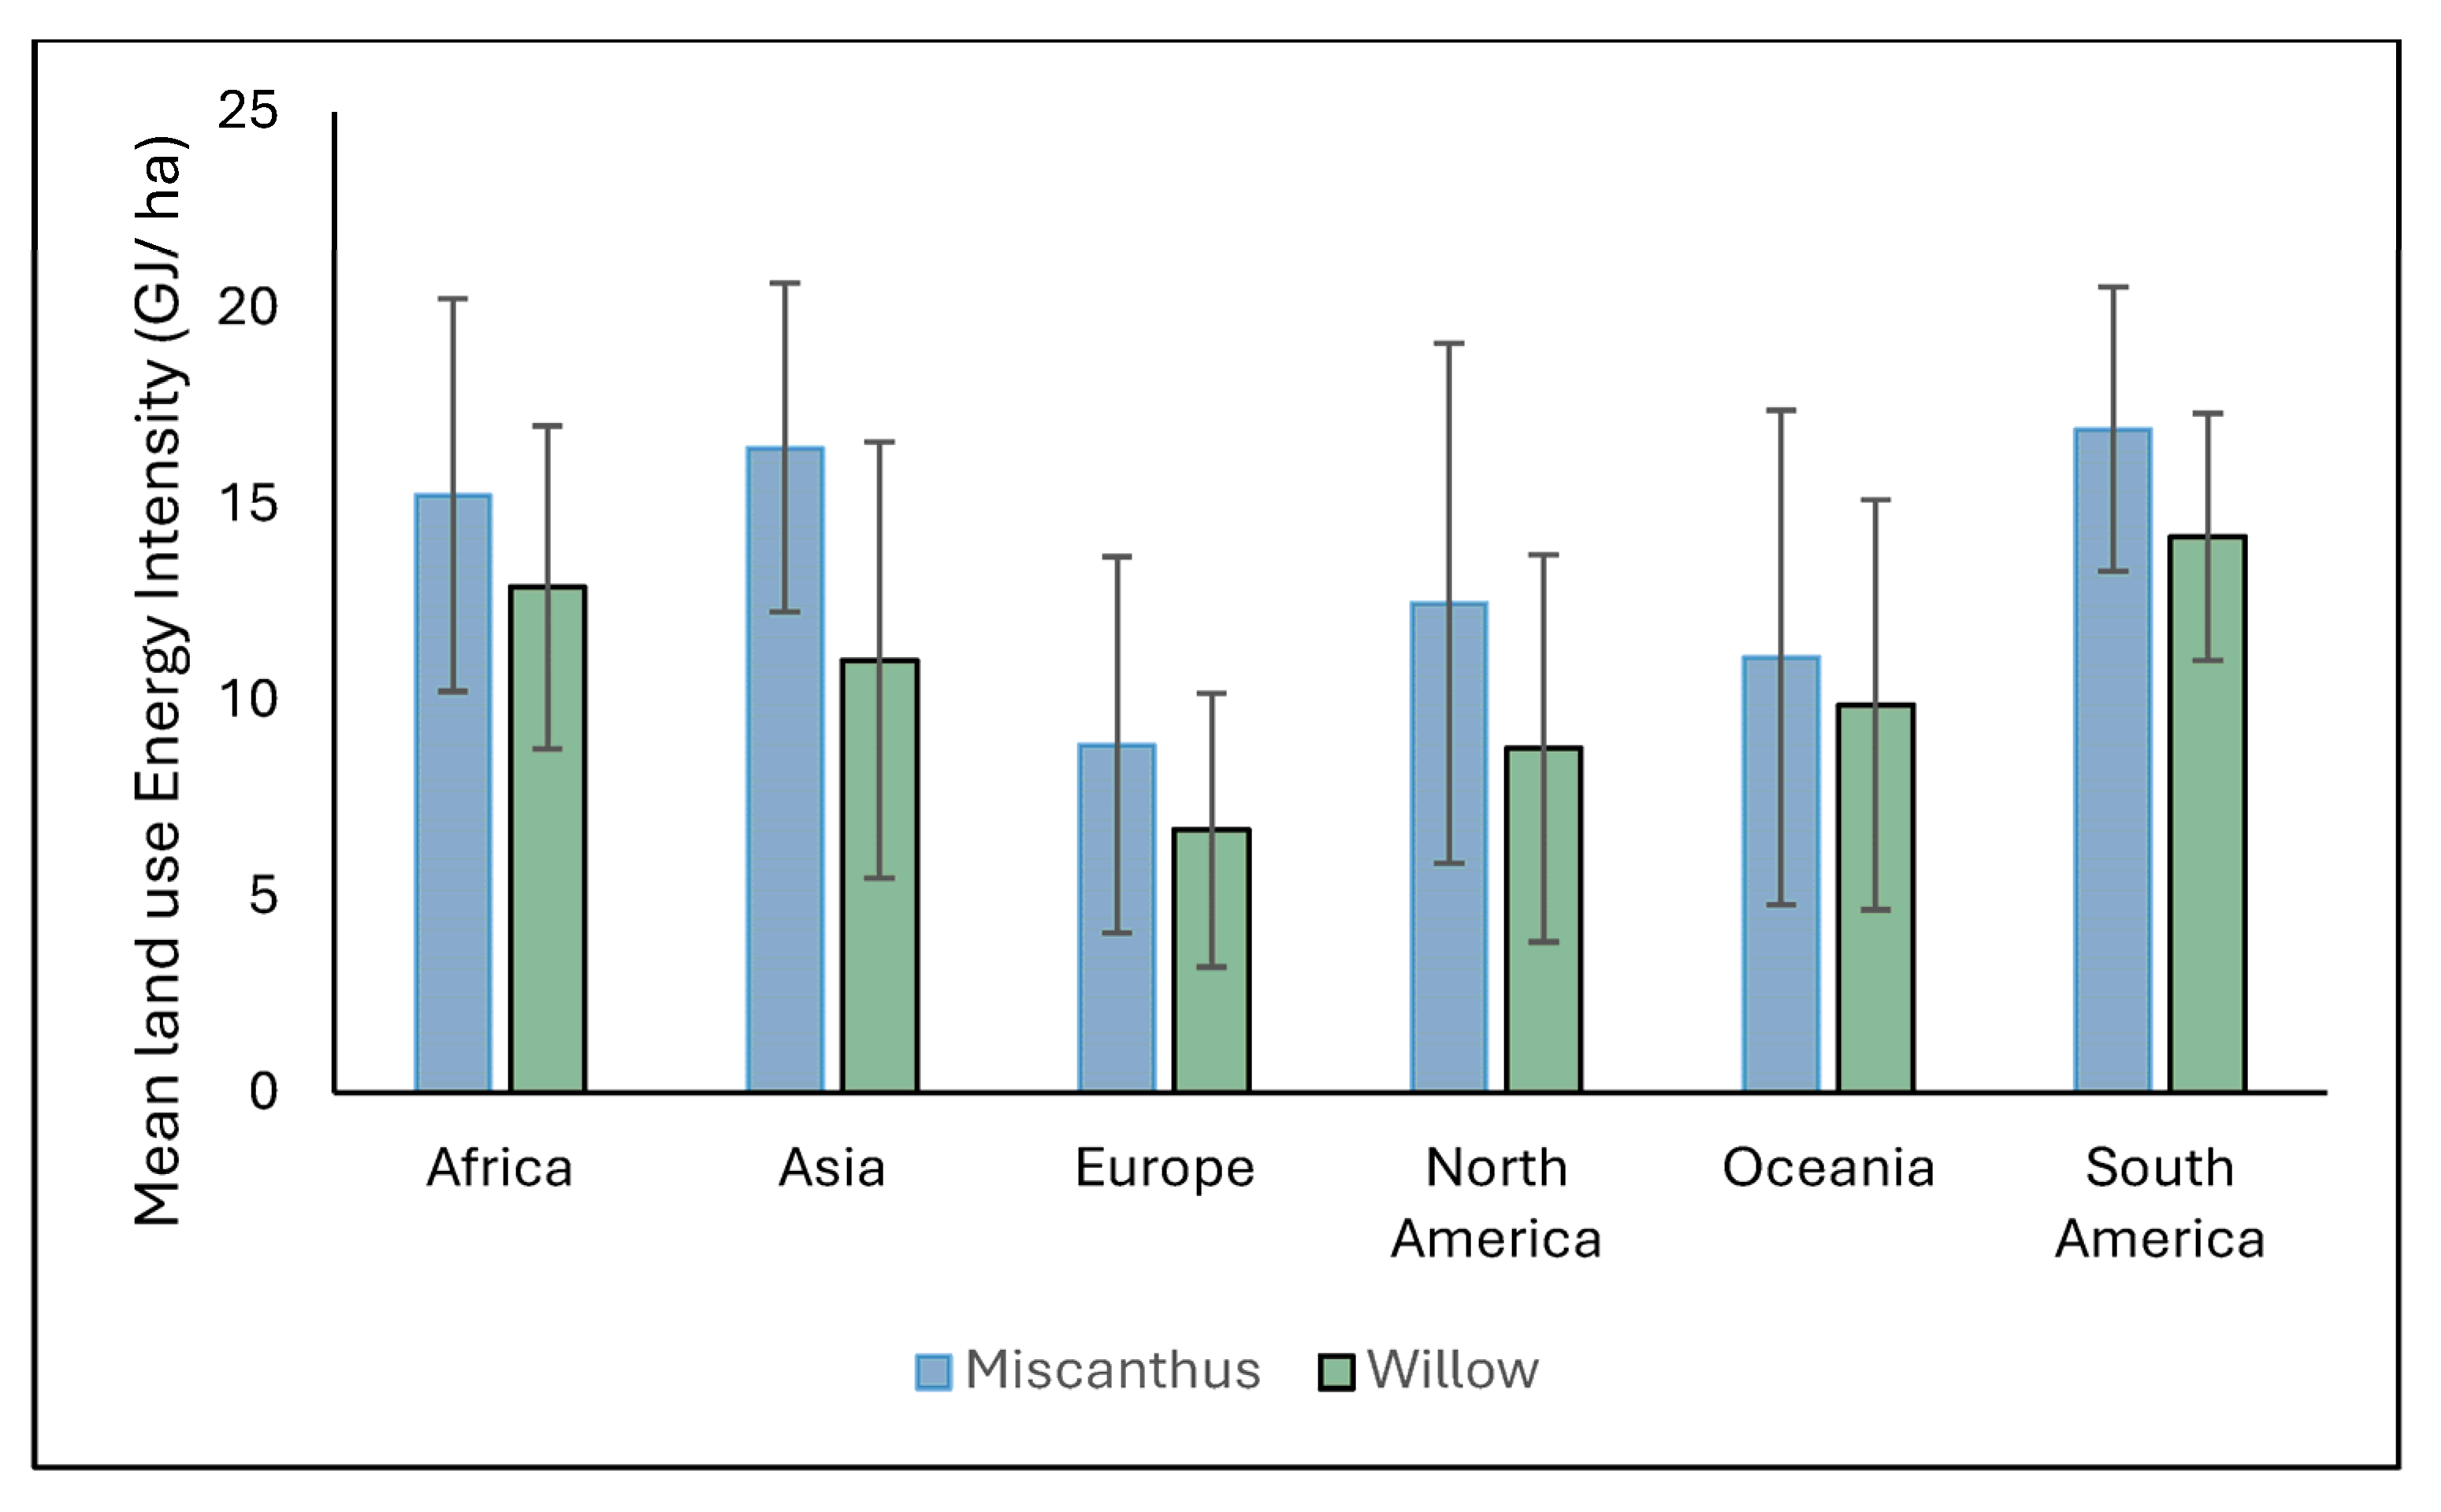
4.1. Land Use Energy Intensity for Miscanthus and Willow Under Current Climate Conditions

The spatial variation in LUEI for Miscanthus highlights its strong dependence on climatic and biophysical conditions. On average, Miscanthus delivers a high LUEI (321 ± 179.1 GJ ha−1 y−1), particularly in tropical and subtropical regions. These areas benefit from high solar radiation, long growing seasons, and sufficient rainfall, all of which promote high biomass yields and strong annual net energy returns [1]. Our findings show LUEI values exceeding 700 GJ ha−1 in tropical hotspots comparable to the success of sugarcane (a close relative of Miscanthus) used in Brazil for ethanol and bagasse-based bioenergy production. In contrast, cooler temperate and boreal zones, such as Scandinavia, the Baltics, northern Russia, Canada, and parts of eastern Russia, exhibit much lower LUEI values, with some regions even experiencing negative energy balances. These results reflect biophysical limitations including shorter growing seasons, reduced heat accumulation, and lower winter survival, all of which constrain biomass production and reduce energy efficiency [2].
Willow, used here as a representative of coppiced woody biomass, typically achieves a lower mean annual LUEI (164 ± 115.6 GJ ha−1 y−1) compared to Miscanthus. This is primarily due to its C3 photosynthetic pathway and generally lower yield potential. However, willow exhibits relatively stable energy returns across a broader geographic range, particularly in temperate regions like the central and eastern United States and Central Europe [19,20]. Although it does not achieve the high yields of Miscanthus, willow’s resilience makes it suitable for a wider range of latitudes and climatic conditions.
Regionally, both crops display high variability, but Miscanthus consistently delivers higher energy returns per hectare than willow. Even so, willow’s broader climatic suitability points to its complementary role in areas where Miscanthus performance is marginal. It is worth noting that MiscanFor’s LUEI calculations do not include energy costs associated with end-of-life crop removal, unless specifically modelled, which may affect full lifecycle assessments.
The concentration of high LUEI values in tropical and subtropical zones reinforces the strategic bioenergy potential of these areas. However, expansion in these regions must be carefully managed to avoid negative impacts on land availability, food security, and ecosystem conservation [21,22]. Thus, integrating environmental, economic, and social factors into land use planning is critical to aligning bioenergy deployment with broader sustainable development goals [23]. While Miscanthus delivers higher net energy returns under optimal conditions, willow’s broader climatic adaptability positions it as a valuable alternative. These findings support a dual-crop strategy that aligns crop selection with regional suitability and long-term sustainability goals.

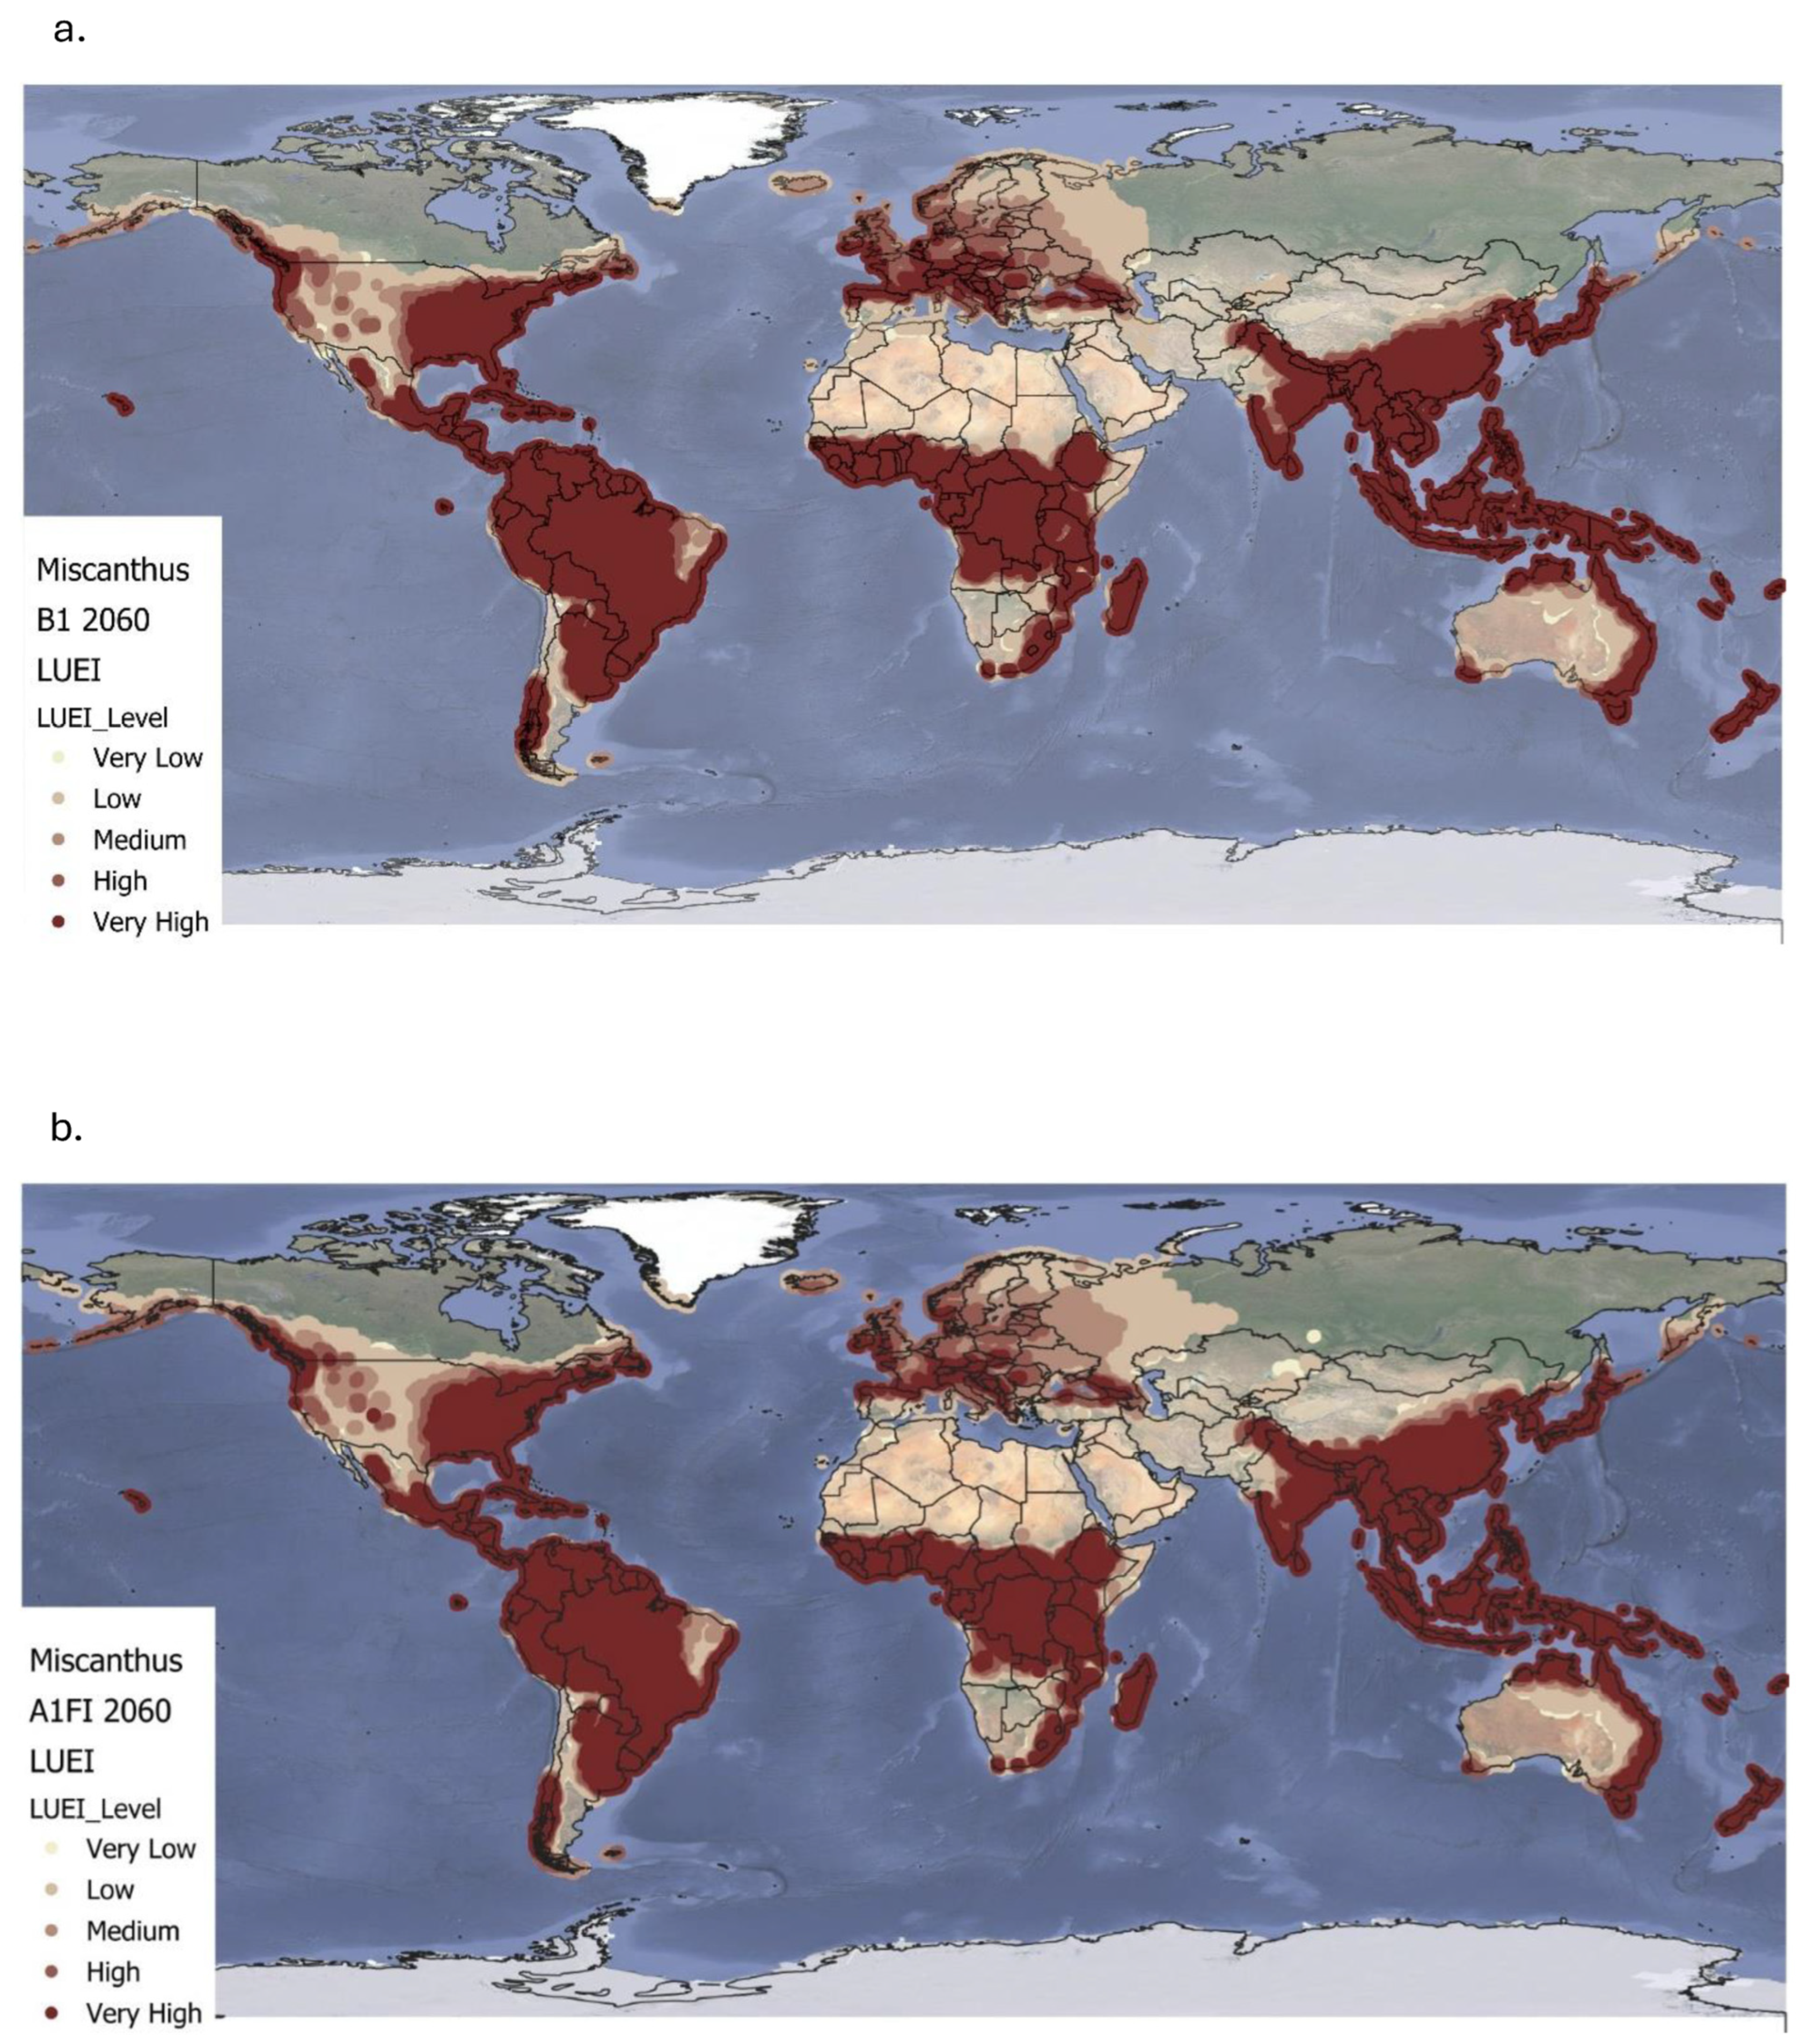
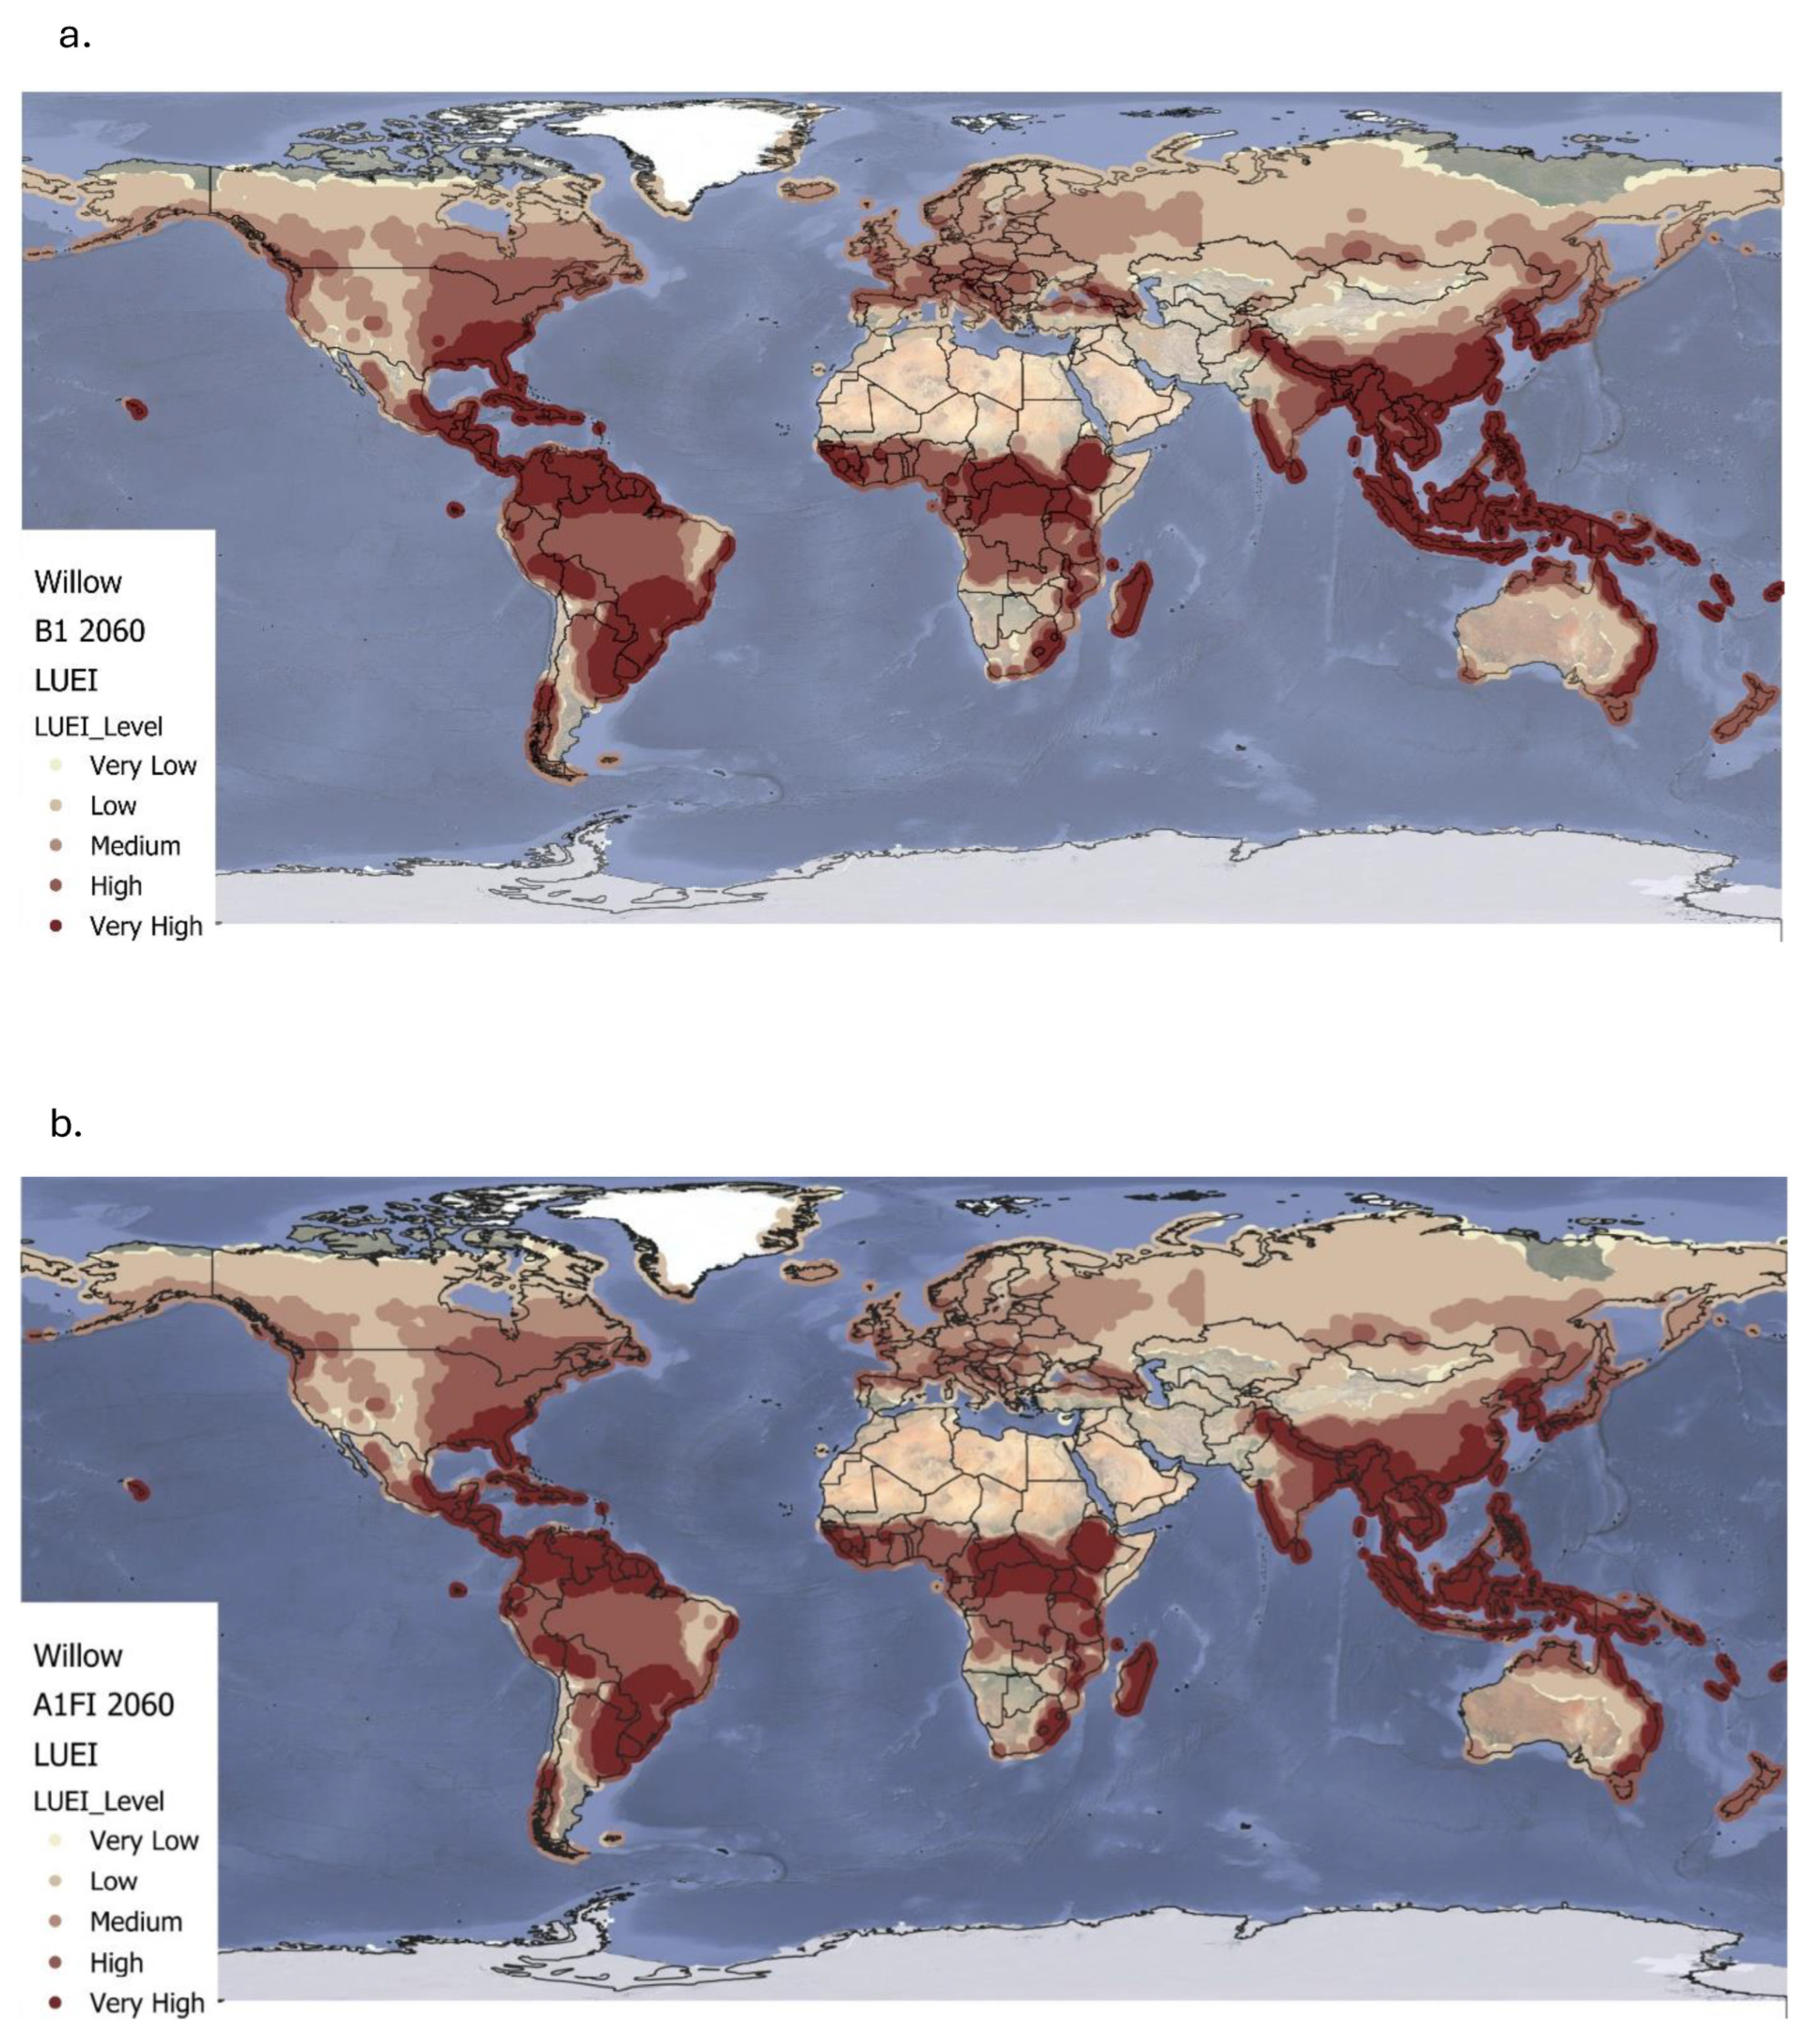
4.2. Land Use Energy Intensity for Miscanthus and Willow Under Future Climate Conditions

Under the B1 climate scenario up to 2060, both Miscanthus and willow maintain high to very high LUEI across tropical and subtropical regions due to favourable conditions such as consistent solar radiation, adequate rainfall, and optimal temperatures [24,25,26]. These results reinforce previous findings on the ecological adaptability of both crops to warm climates [26,27].
Beyond these stable regions, B1 also facilitates an expansion of medium-to-high LUEI into temperate areas for both species. Southern parts of the United States, southern and eastern Europe, and parts of Central Asia show increased suitability driven by extended growing seasons and milder winters [6,8,28,29]. These patterns suggest that moderate warming may improve biomass yields in areas previously seen as marginal. Despite this geographic expansion, global average LUEI declines modestly under B1 by 9% for Miscanthus and 8% for willow likely due to increased climate variability, shifts in precipitation patterns, or emerging pest and disease pressures [23,29]. These findings highlight the trade-off between spatial expansion and localized productivity declines in core growing zones.
Under the more extreme A1FI scenario, the LUEI trends for Miscanthus and willow diverge more dramatically. For both crops, temperate regions including the United States, Midwest and large parts of Europe experience significant LUEI gains due to warmer temperatures and longer frost-free periods [30,31]. These shifts suggest potential benefits in utilizing both crops for bioenergy production as part of climate adaptation strategies in temperate zones. However, in tropical and subtropical regions, A1FI triggers yield declines for both species. Rising heat stress, drought, and disrupted nutrient cycles in these areas appear to surpass the physiological thresholds of both crops, reducing their net energy returns [32]. For Miscanthus, this results in a 15% drop in global LUEI, while willow shows a 13% reduction compared to baseline levels. These findings mirror broader concerns about the limits of ecological resilience under high-emissions scenarios [23,33].
In both cases, future viability will depend on region-specific climate conditions, particularly temperature extremes and water availability. While moderate climate change may expand bioenergy opportunities, high-emissions futures pose risks to productivity stability.
To maximize the potential of Miscanthus and willow as sustainable bioenergy crops, adaptive land use planning and targeted breeding programmes are essential. These should focus on enhancing stress tolerance, especially in marginal environments, and managing the transition into new suitable areas [34]. Furthermore, although willow is used here as a proxy for short rotation coppice biomass due to widespread trials, other woody crops such as poplar and eucalyptus may prove better suited to some regions, particularly outside temperate climates.
Ultimately, integrated policy frameworks must address where these crops can be grown, how to manage them sustainably, and how to align their use with broader goals for climate resilience, food security, and biodiversity protection [35].

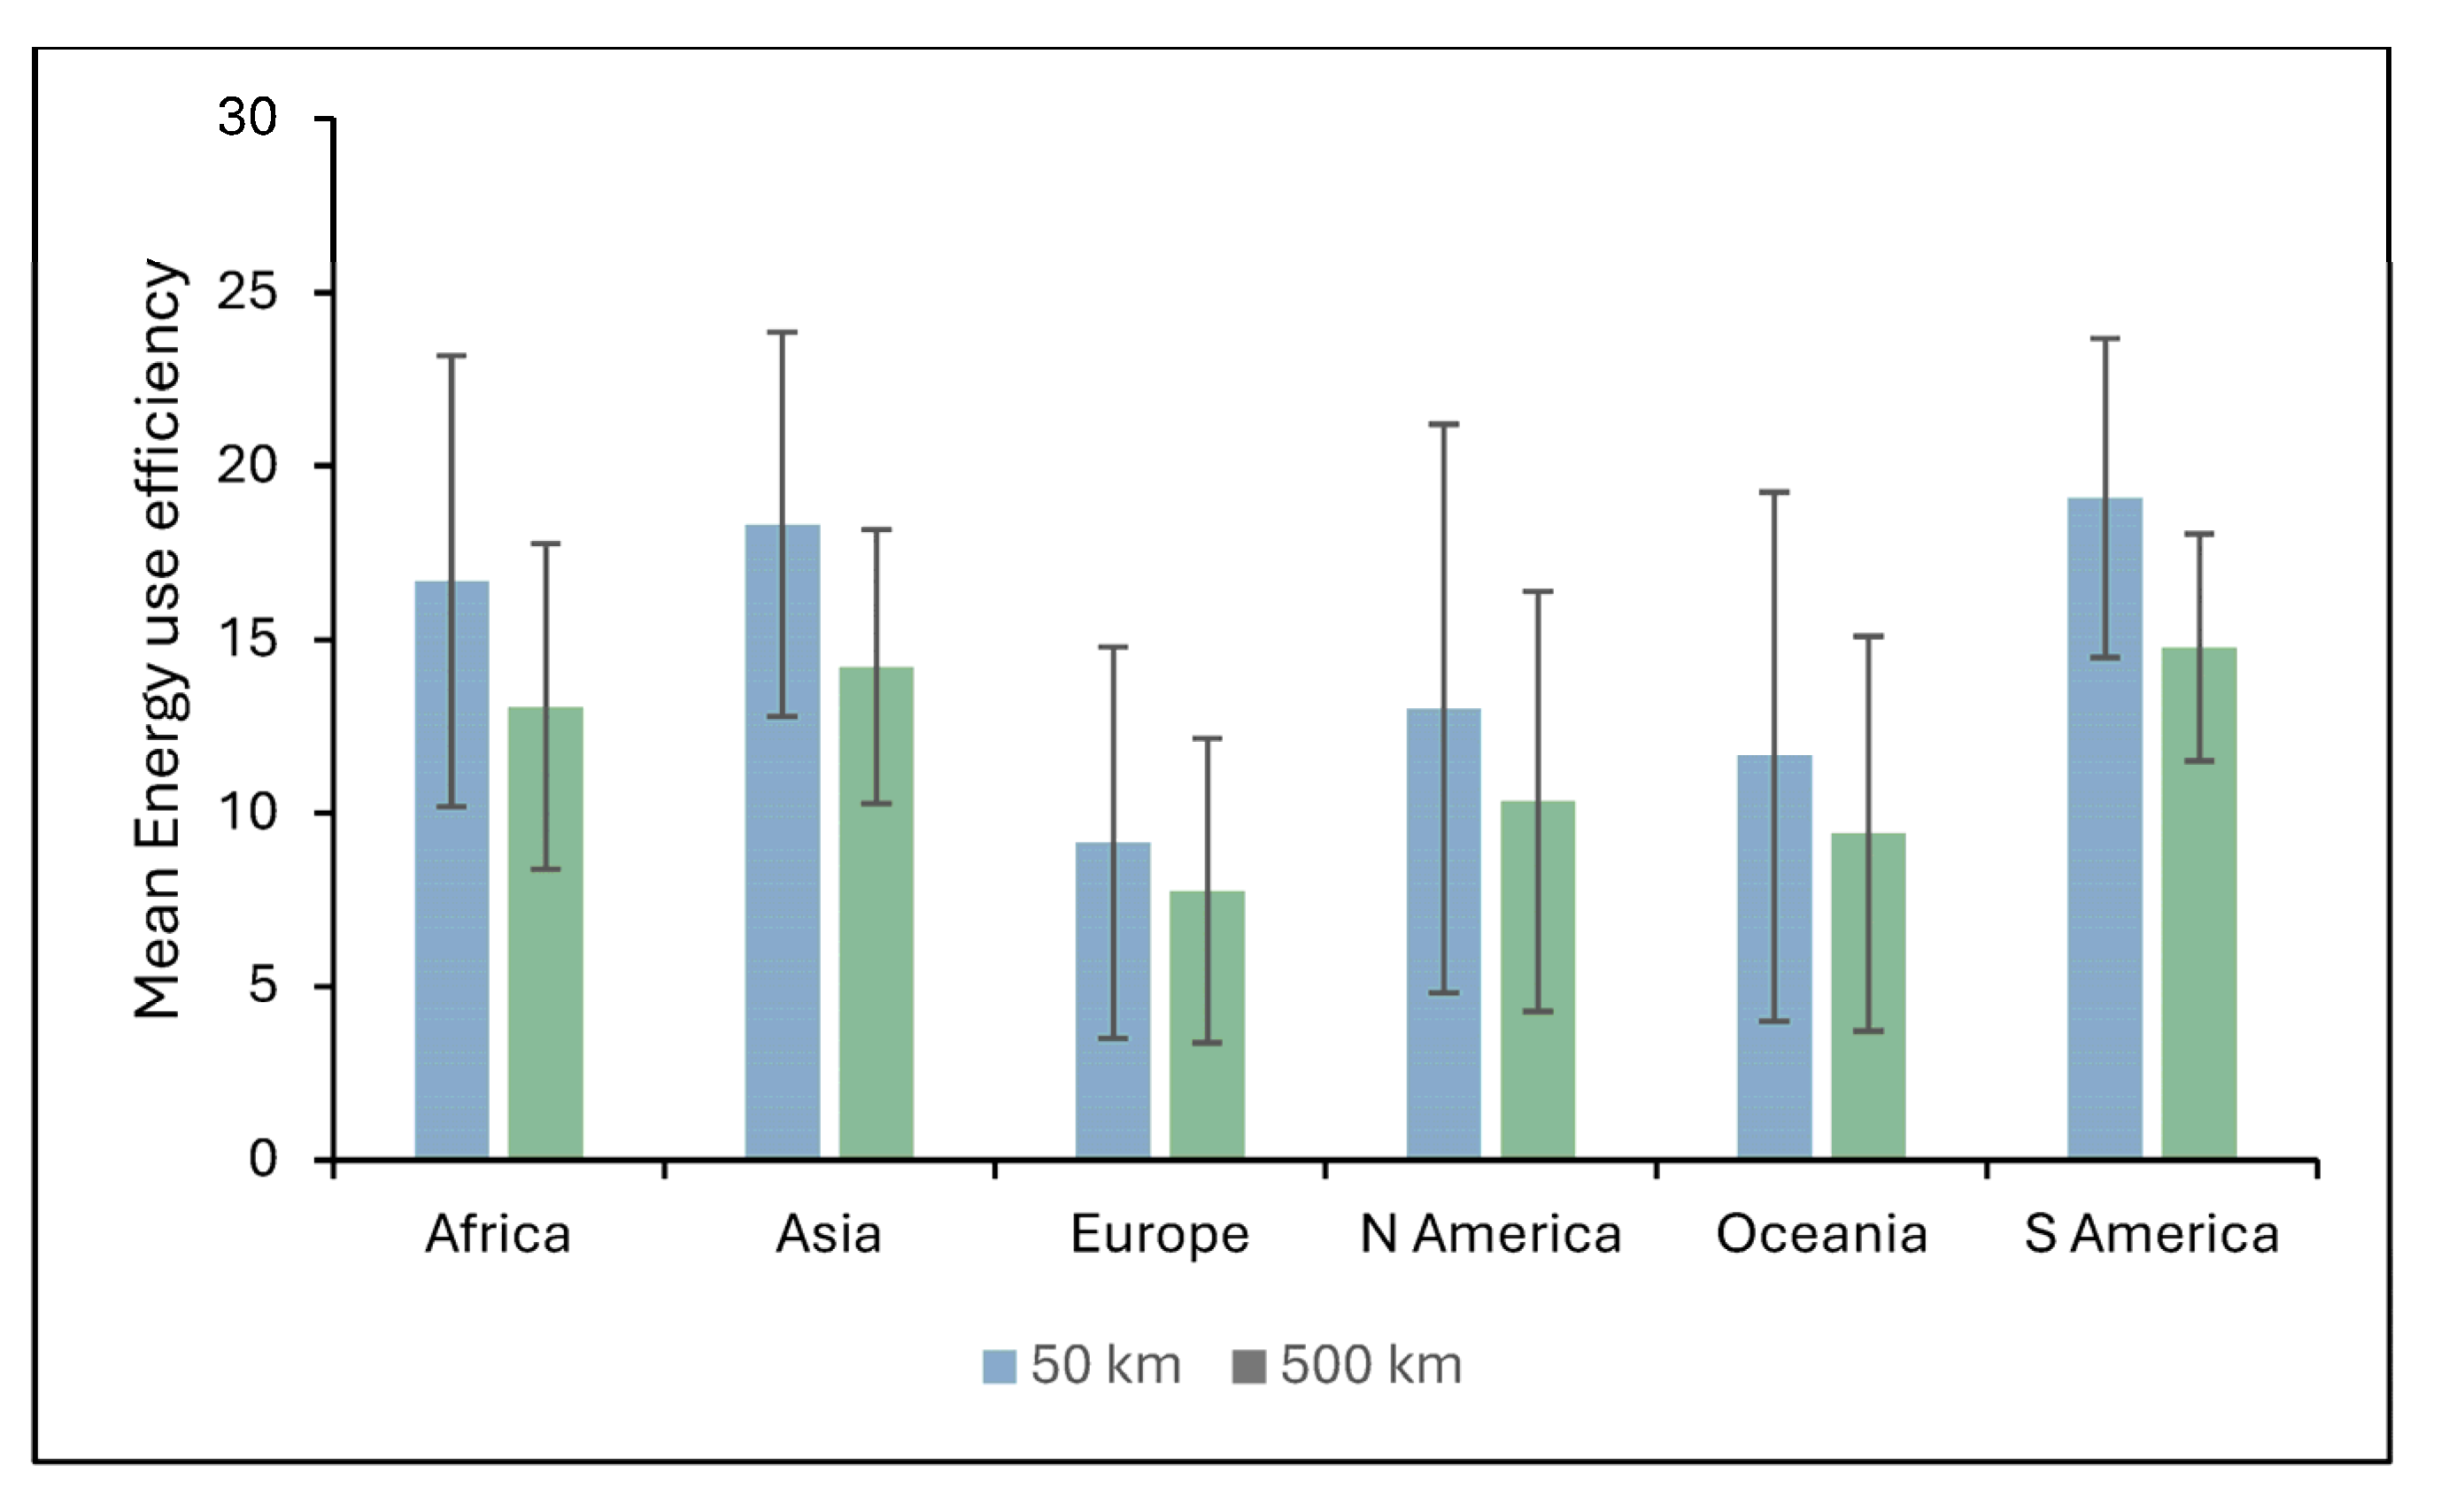
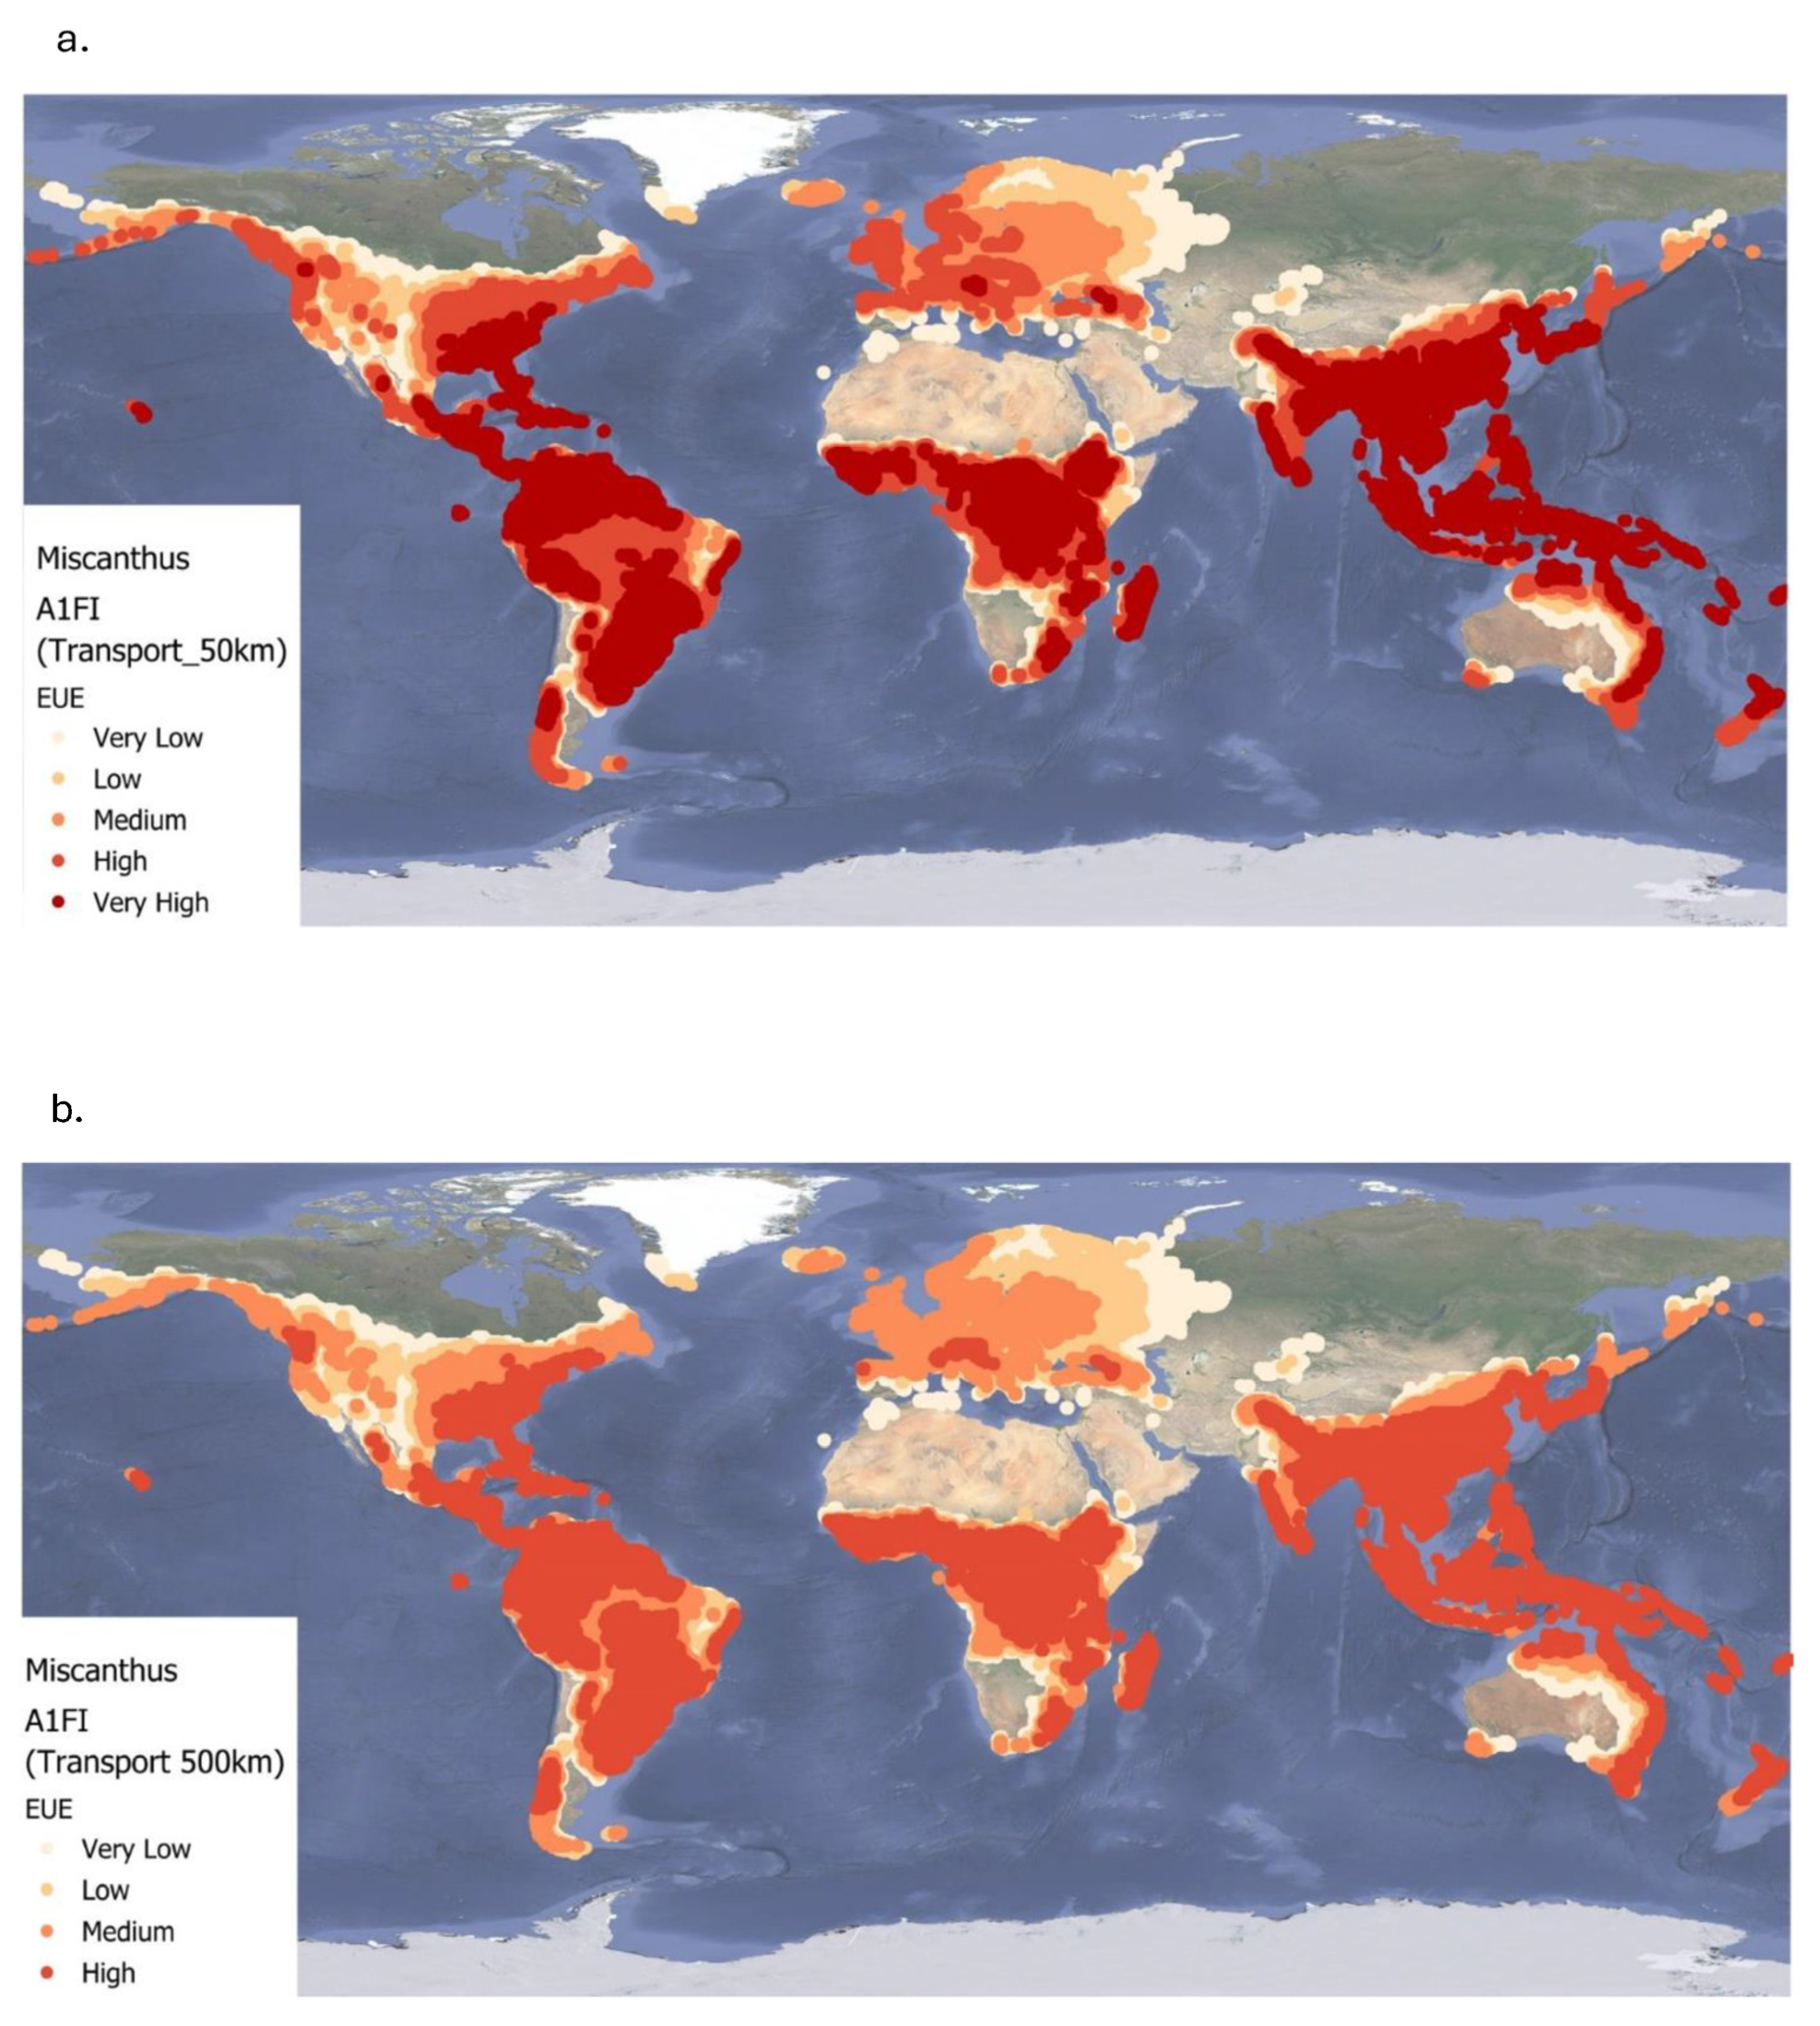
4.3. Impacts of Biomass Transport on the Energy Use Efficiency of Miscanthus

This study provides a detailed assessment of how transport distance affects the EUE of Miscanthus-based bioenergy systems under current and future climate scenarios. While Miscanthus is used as the focus crop due to robust existing data [5], there is a pressing need for similar analyses on other perennials like willow to enable multi-crop comparisons in supply chain planning. Across all climate scenarios, the highest EUE values are observed in tropical and subtropical regions. These areas offer optimal conditions for Miscanthus growth due to favourable temperatures, sufficient rainfall, and long growing seasons [2]. However, increasing the biomass transport distance from 50 km to 500 km results in a consistent decline in EUE across all scenarios. This decline is most pronounced in high-yielding regions, reflecting the significant energy cost of moving bulky biomass over long distances [36,37].
Under the B1 and A1FI scenario, some high-latitude temperate regions show modest EUE gains due to warmer growing conditions. However, these improvements are often offset by reduced yields in already hot regions due to increased heat stress. Consequently, the global average EUE still declines under A1FI. This underscores the complex interaction between regional climate shifts and crop performance, highlighting the need for site-specific strategies [2,28]. Transport represents a major bottleneck to fully realizing the sustainability potential of Miscanthus. Regional EUE losses are especially evident where poor infrastructure and environmental constraints magnify transport inefficiencies, particularly in parts of Africa, Asia, and South America. A key strategy to mitigate these losses is to develop localized biomass supply chains, where production, processing, and utilization occur in proximity. Brazil offers a model example: co-locating sugarcane farms with ethanol and bagasse power plants reduces transport-related energy use and emissions [38]. Another option is to preprocess biomass into energy-dense forms such as pellets, briquettes, or bio-oils before long-distance transport. While this can improve transport efficiency, the pre-processing itself consumes energy and may reduce overall system efficiency [5,37]. Additionally, decentralization of biomass systems brings trade-offs. It may reduce transport distances but require more machinery, labour, and logistics, which could offset some energy gains. Balancing these factors is crucial to designing sustainable systems. Our results suggest that Miscanthus is most sustainable when cultivated and used locally, especially in tropical and subtropical zones. Long transport distances significantly reduce energy returns, a challenge that persists across all future climate scenarios. Therefore, we suggest that bioenergy policies must prioritize:
  • Geographically optimized supply chains.
  • Investment in low-emissions transport infrastructure (e.g., rail and waterways).
  • Climate-resilient planning that considers yield variability and regional logistics.
  • Safeguards to avoid unintended land use impacts, particularly the disturbance of high-carbon soils like peatlands, which could release large quantities of CO2 and compromise climate goals.
Thus, realizing the full potential of Miscanthus-based bioenergy systems will require an integrated approach linking agronomic performance, transport efficiency, and sustainable land management under changing climatic and socio-environmental conditions.

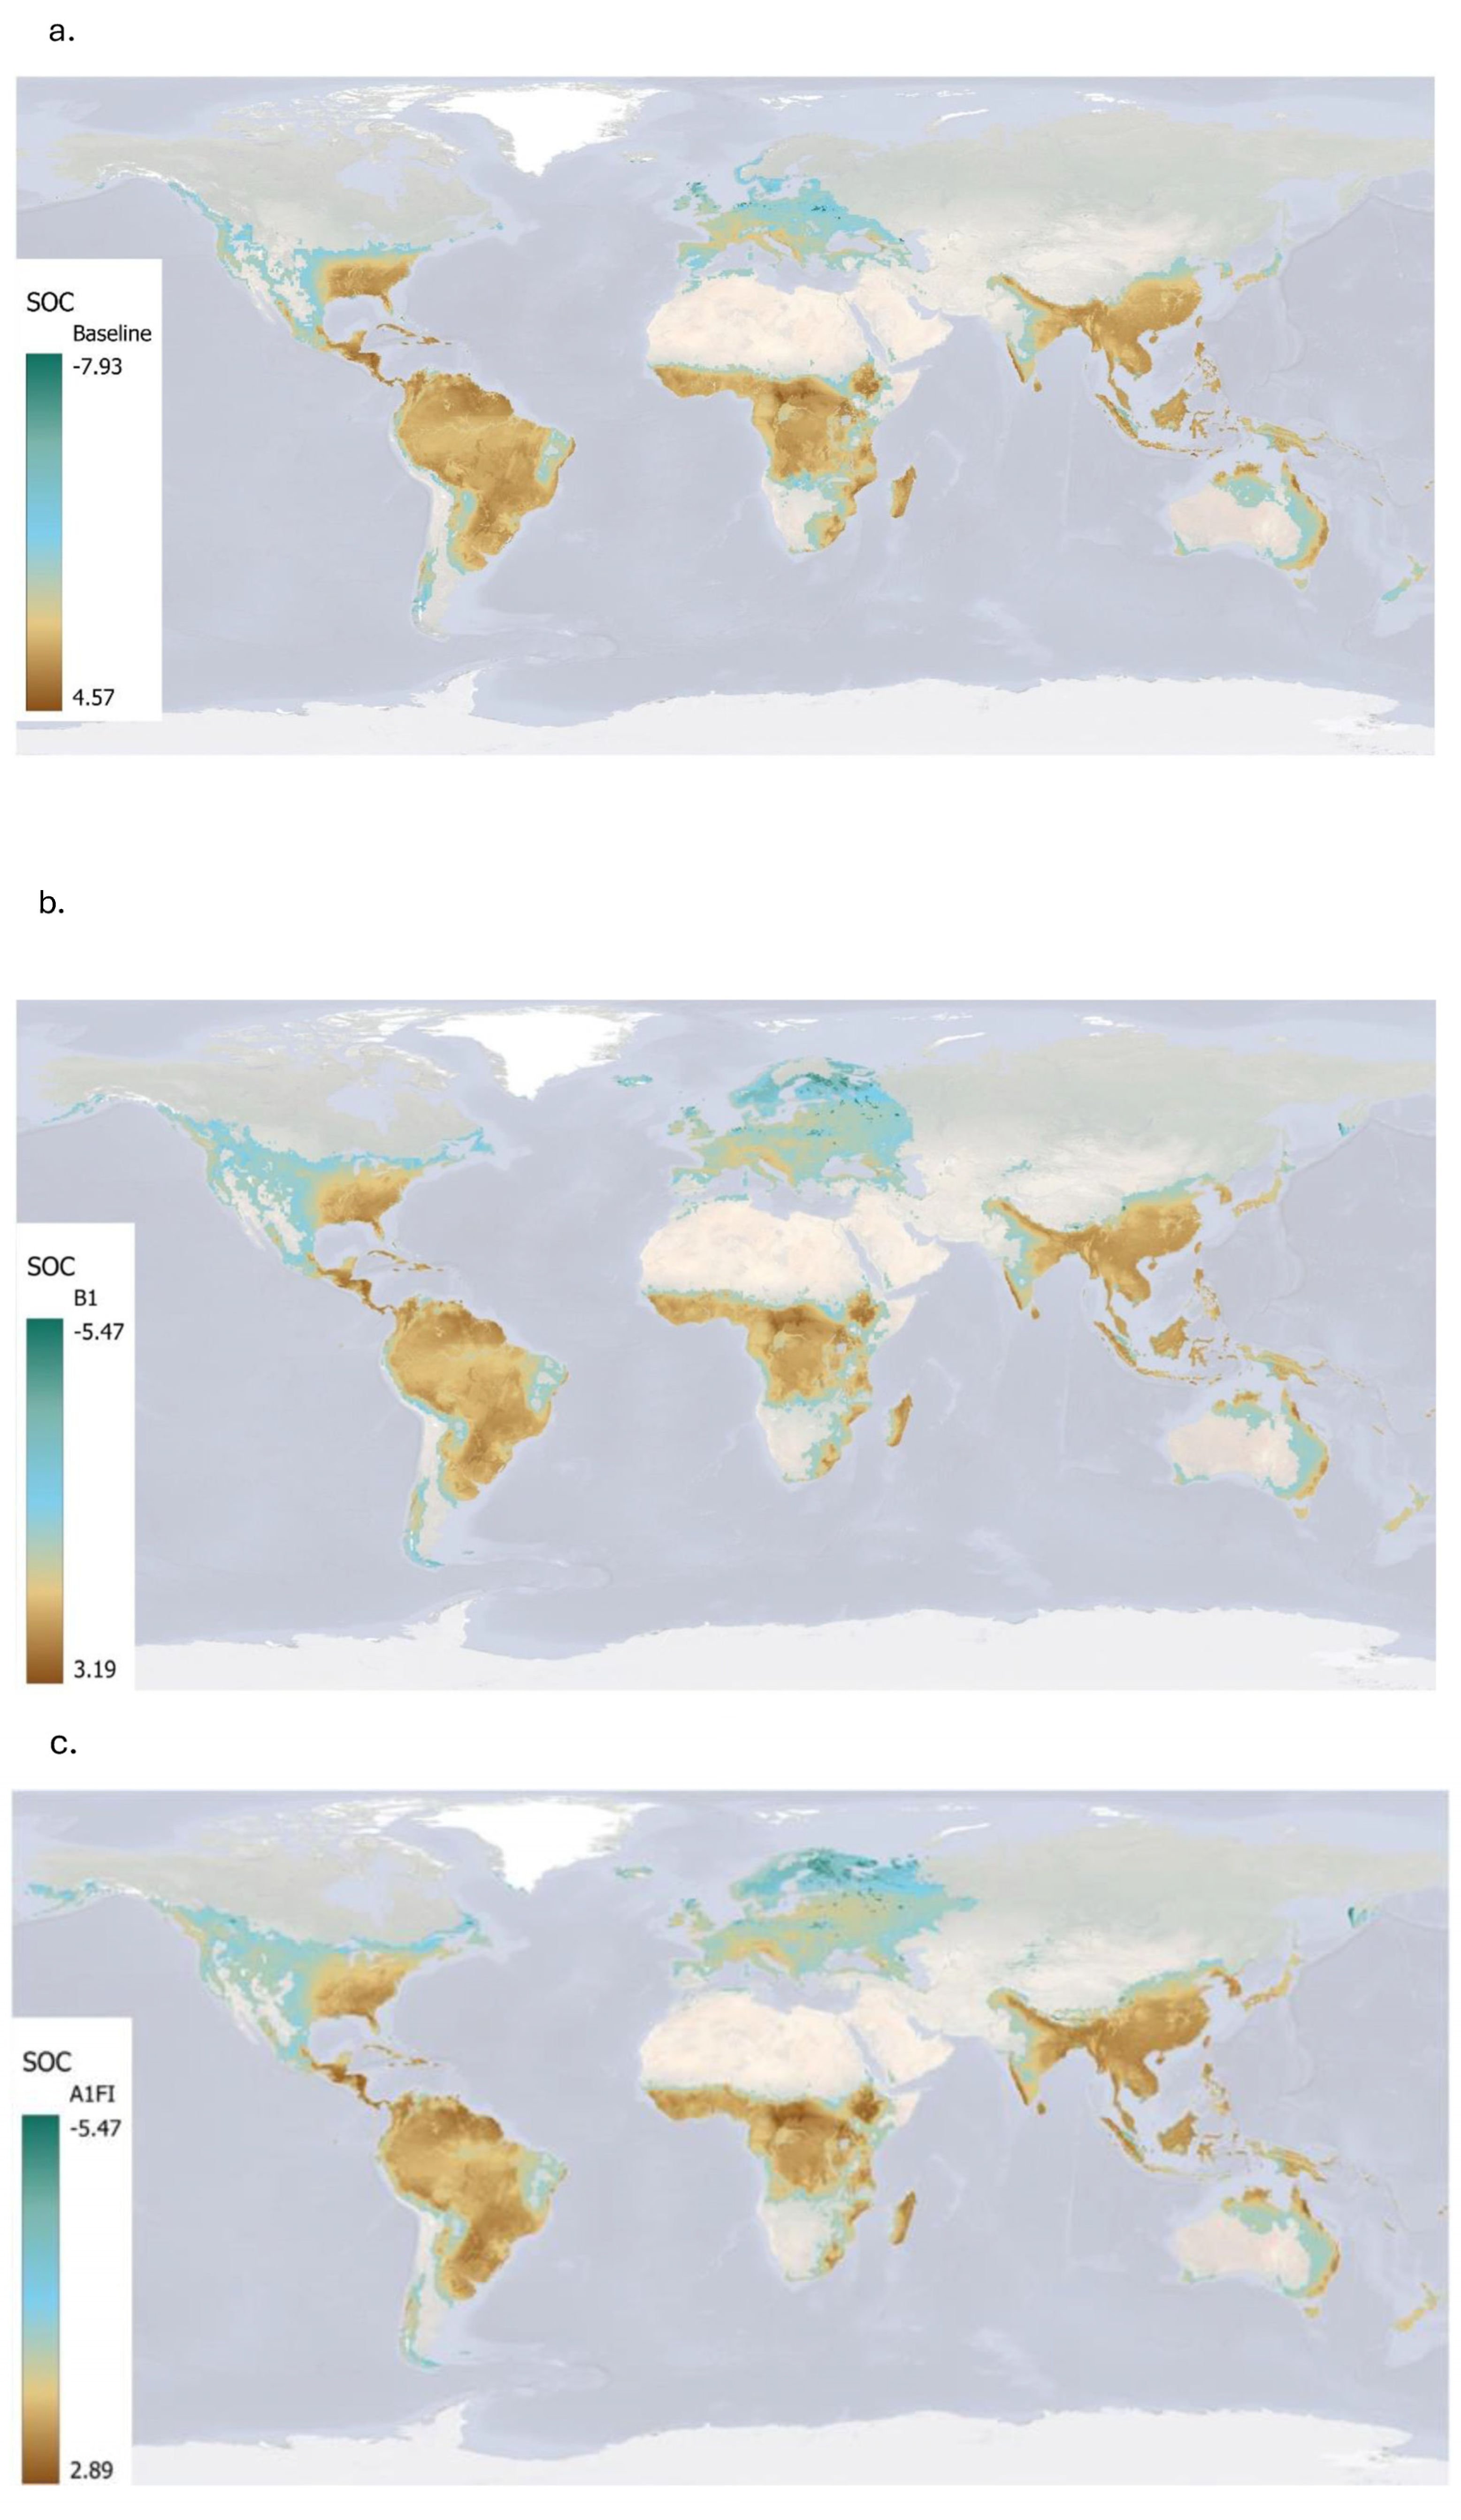
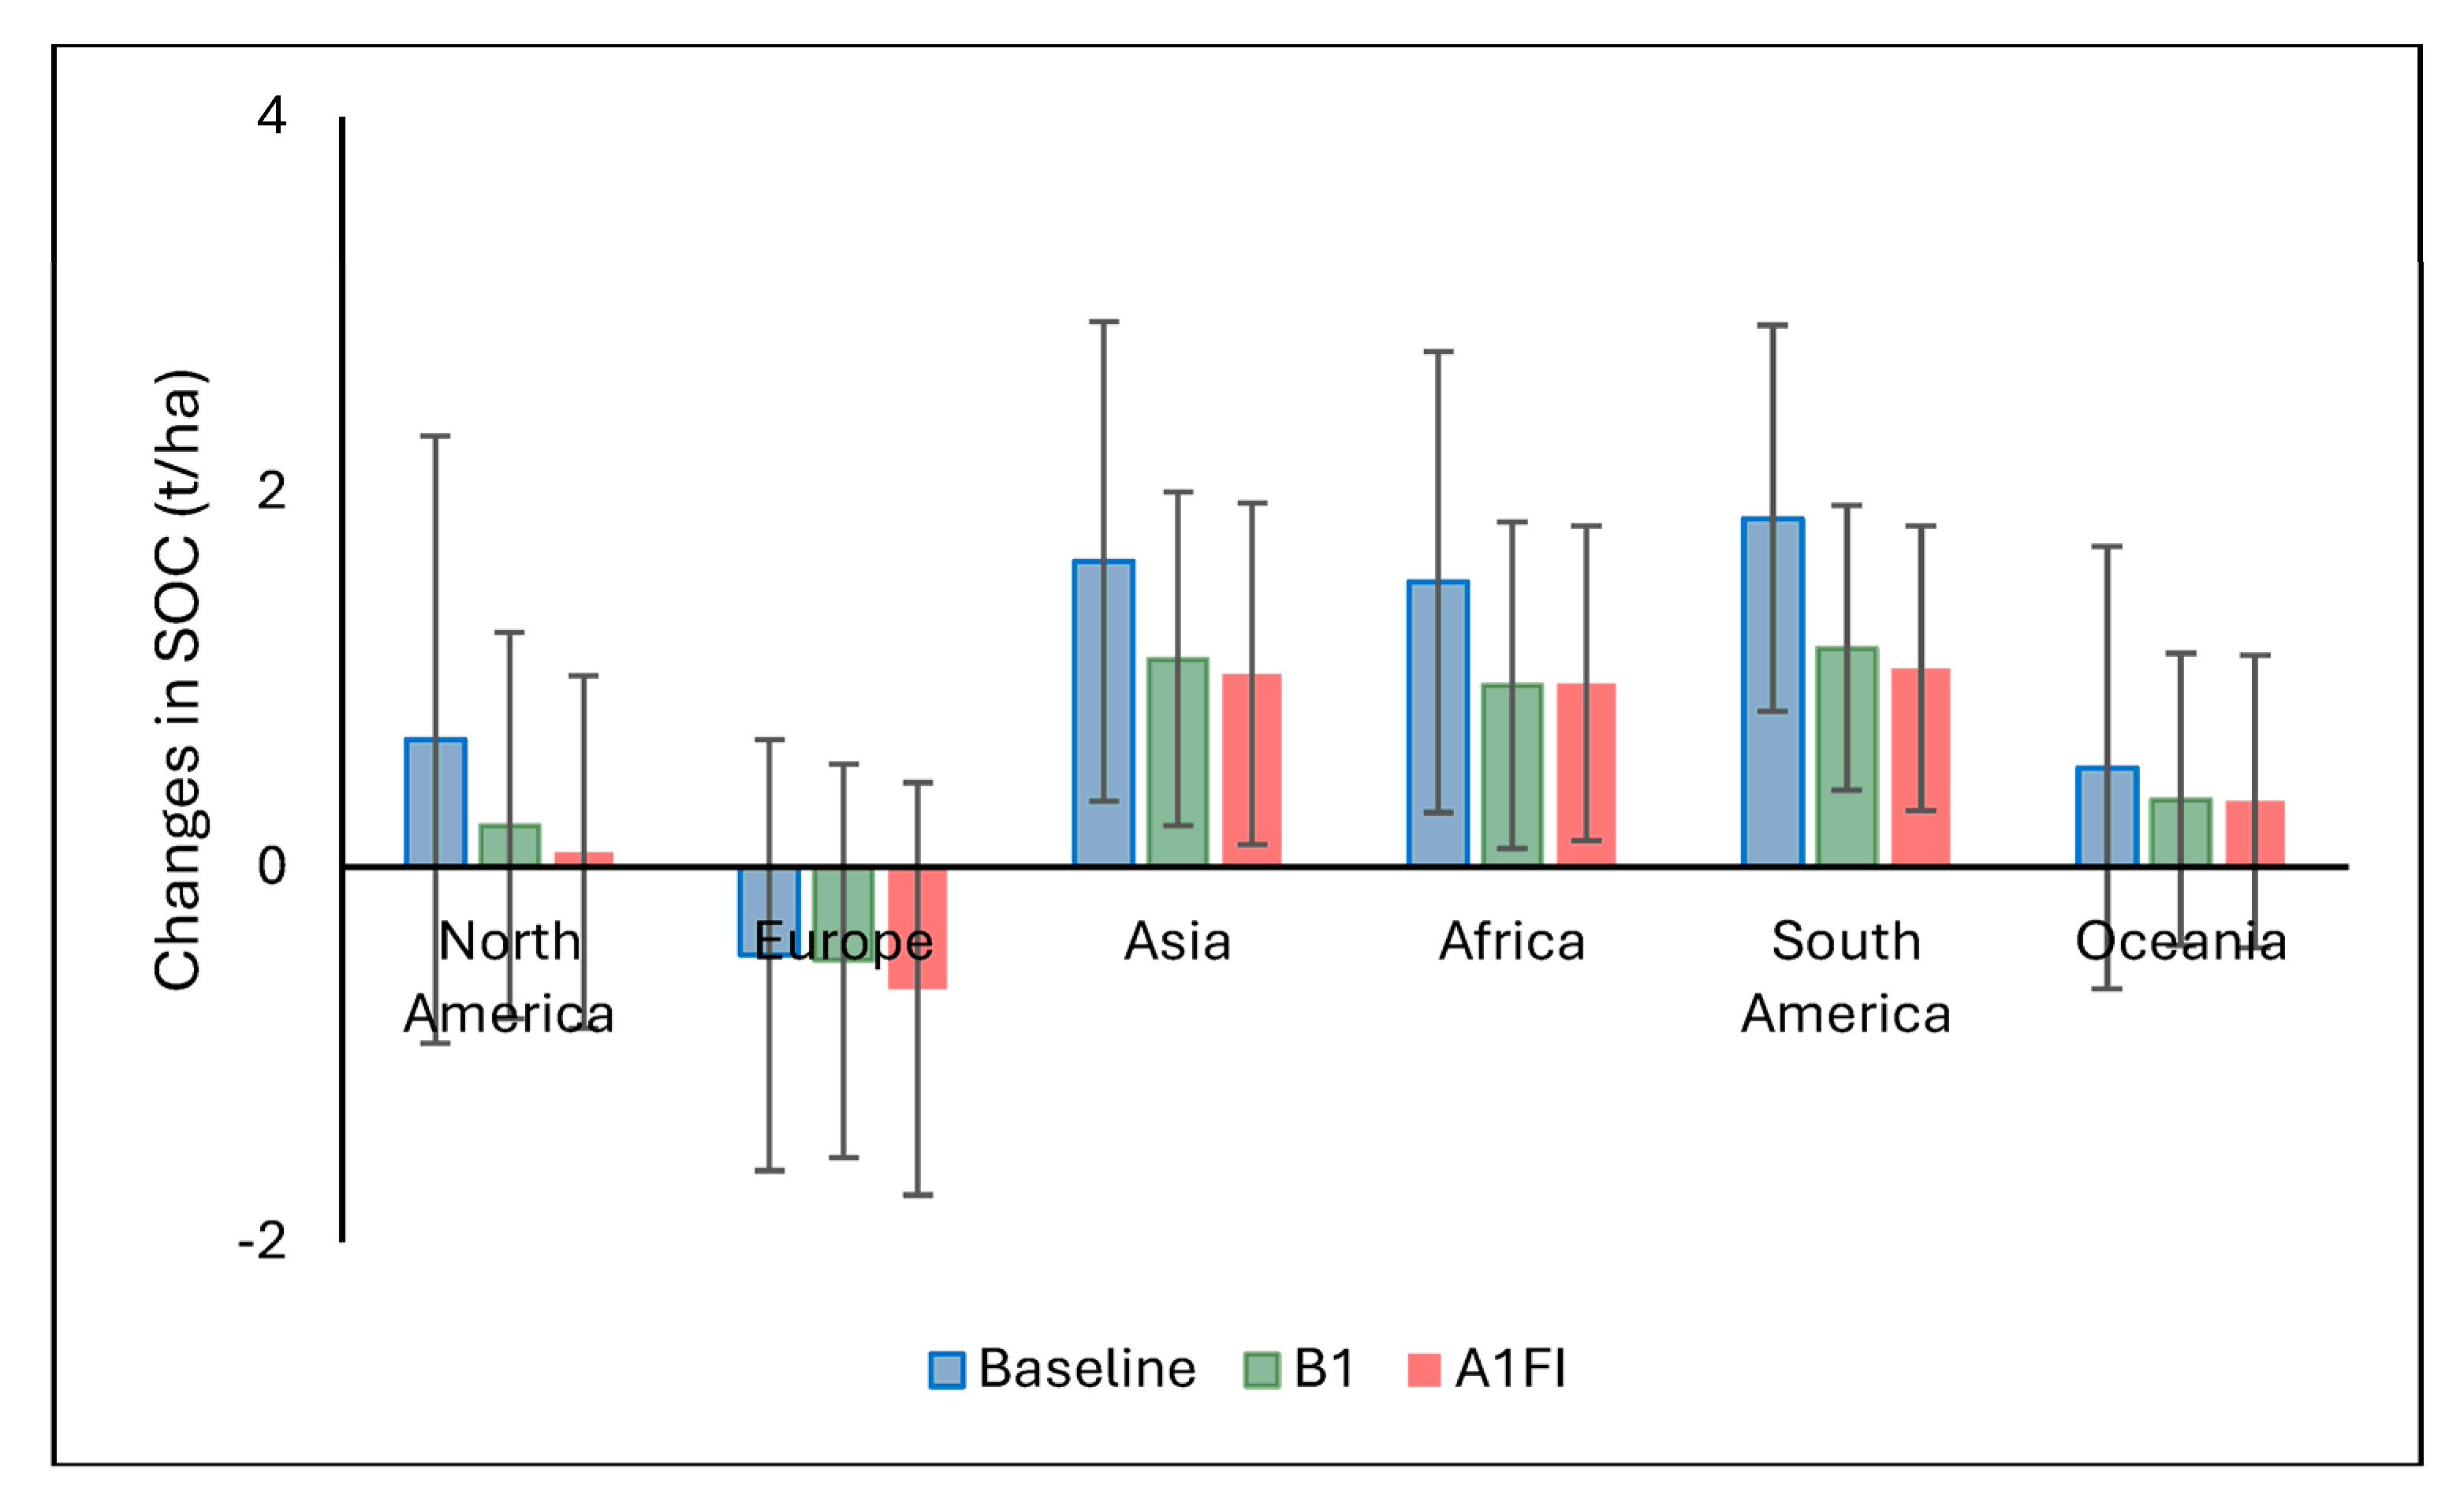
4.4. Estimated Soil Organic Carbon Sequestered by Miscanthus

This study demonstrates that Miscanthus cultivation has significant potential to enhance SOC sequestration globally, particularly under current climatic conditions. The highest SOC accumulation was observed under the baseline climate (1961–1990), with a global mean annual ∆SOC of 1.20 ± 1.46 t ha−1, and hotspots reaching up to 4.57 t ha−1. These results align with previous findings that perennial bioenergy crops can contribute meaningfully to long-term soil carbon storage [16,39]. Tropical and subtropical regions in Africa, Southeast Asia, and Latin America emerged as the most promising areas. These regions benefit from warm temperatures and adequate moisture, enhancing plant productivity and litter input, both of which promote SOC accumulation [40]. However, the analysis also reveals trade-offs. In regions with high initial SOC, especially carbon-rich soils such as histosols or peatlands and/or those with low crop productivity, Miscanthus cultivation can lead to net SOC losses. This is largely due to disturbance during crop establishment (e.g., ploughing or drainage), which accelerates the decomposition of existing soil carbon. Importantly, high plant productivity does not always guarantee a net SOC gain if losses from disturbed soils are greater than the new inputs from crop biomass.
Under future climate scenarios, both the spatial extent and magnitude of SOC gains decline. The mean ∆SOC drops to 0.62 ± 1.11 t ha−1 under the B1 scenario and 0.49 ± 1.13 t ha−1 under A1FI. Warmer temperatures and increased drought risk likely reduce plant productivity and slow carbon accumulation, especially in already vulnerable regions. These results echo earlier studies that warn of diminished mitigation benefits from bioenergy crops under warming scenarios [41]. Regional patterns further underscore the importance of biophysical conditions. Tropical and subtropical regions maintain some SOC gains due to higher net primary productivity [42], whereas Europe exhibits consistent SOC losses, possibly due to cooler climates, lower yields, higher initial SOC levels, and large histosol coverage [43]. These findings affirm that site-specific assessments are critical when evaluating Miscanthus as a climate mitigation option [24]. While the crop offers strong potential to sequester carbon, especially under current conditions, its effectiveness diminishes under climate change, highlighting the importance of adaptive land management, such as:
  • Using drought-tolerant or regionally adapted Miscanthus cultivars.
  • Applying soil amendments (e.g., compost, biochar) to improve soil structure and moisture retention.
  • Avoiding cultivation on high-carbon-stock soils like undisturbed peatlands.
Based on our findings, land use strategies should encourage region-specific zoning for energy crops, prioritize the use of marginal or underutilized land, and incorporate sustainability safeguards (e.g., protecting high-carbon or high-biodiversity areas). Policy frameworks should support localized biomass supply chains, promote adaptive land management, and ensure bioenergy development aligns with broader goals for climate mitigation, biodiversity conservation, and food security.

5. Conclusions

This study provides a spatially explicit global assessment of the sustainability of Miscanthus and willow as bioenergy crops under current and future climate scenarios. Miscanthus generally outperforms willow in terms of energy productivity, particularly in tropical and subtropical regions, and shows resilience under moderate climate change. However, extreme climate scenarios significantly reduce its productivity in some regions, underscoring the importance of climate-resilient deployment strategies.
Biomass transport distance strongly influences energy use efficiency, with longer distances reducing returns. This highlights the importance of localized processing and strategic supply chain planning.
Miscanthus also contributes to climate mitigation through SOC sequestration, especially in tropical regions, although future climate change may reduce this benefit in some areas. These findings emphasize the need for region-specific management and adaptation strategies.
Overall, the study demonstrates the potential of Miscanthus as a key component in sustainable bioenergy systems, provided deployment is supported by informed policy, site-specific assessments, and adaptation to future climate risks.

Author Contributions

Conceptualization, M.A., A.H. and P.S.; methodology, M.A., A.H., G.C., J.M. and A.S.; software, M.A. and A.H.; formal analysis, M.A., J.M. and G.C.; investigation, M.A., A.H., G.C., J.M. and P.S.; writing—original draft preparation, M.A.; writing—review and editing, M.A., A.H., G.C., J.M., A.S. and P.S.; visualization, M.A., J.M. and G.C. All authors have read and agreed to the published version of the manuscript.

Funding

This work was supported by the EU Horizon-UPTAKE Project (project nr: 101081521) and UKRI projects: PCB4GGR (BB/V011553/1) and NZ+ (BB/V011588/1).

Data Availability Statement

Data will be made available on request.

Conflicts of Interest

The authors declare no conflict of interest.

Abbreviations

LUEILand Use Energy Intensity
EUEEnergy Use Efficiency
SOCSoil Organic Carbon
∆SOCChange in Soil Organic Carbon
GHGGreenhouse Gas
IGBP-DISInternational Geosphere-Biosphere Programme—Data and Information System
ORNL DAACOak Ridge National Laboratory Distributed Active Archive Centre
CRUClimate Research Unit
SRESSpecial Report on Emissions Scenarios (by the IPCC)
DMDry Matter

References

  1. Heaton, E.A.; Dohleman, F.G.; Long, S.P. Meeting US biofuel goals with less land: The potential of Miscanthus. Glob. Chang. Biol. 2008, 14, 2000–2014. [Google Scholar] [CrossRef]
  2. Abdalla, M.; Hastings, A.; Campbell, G.; Chen, H.; Smith, P. Assessing the sustainability of Miscanthus and willow as global bioenergy crops: Current and future climate conditions (Part 1). Agronomy 2024, 14, 3020. [Google Scholar] [CrossRef]
  3. Hodgson, E.; McCalmont, J.; Rowe, R.; Whitaker, J.; Holder, A.; Clifton-Brown, J.; Thornton, J.; Hastings, A.; Robson, P.; Webster, R. Upscaling Miscanthus production in the United Kingdom: The benefits, challenges, and trade-offs. GCB Bioenergy 2024, 16, e13177. [Google Scholar] [CrossRef]
  4. Clifton-Brown, J.; Breuer, J.; Jones, M.B. Carbon mitigation by the energy crop, Miscanthus. Glob. Chang. Biol. 2007, 13, 2296–2307. [Google Scholar] [CrossRef]
  5. Hastings, A.; Mos, M.; Yesufu, J.A.; McCalmont, J.; Schwarz, K.U.; Shafei, R.; Ashman, C. Economic viability of Miscanthus production with less productive land in England. GCB Bioenergy 2017, 9, 947–957. [Google Scholar]
  6. Hastings, A.; Clifton-Brown, J.; Wattenbach, M.; Mitchell, C.P.; Stampfl, P.; Smith, P. Future energy potential of Miscanthus in Europe. GCB Bioenergy 2009, 1, 180–196. [Google Scholar] [CrossRef]
  7. Aylott, M.J.; Casella, E.; Tubby, I.; Street, N.R.; Smith, P.; Taylor, G. Yield and spatial supply of bioenergy poplar and willow short-rotation coppice in the UK. New Phytol. 2008, 178, 358–370. [Google Scholar] [CrossRef]
  8. Hastings, A.; Clifton-Brown, J.; Wattenbach, M.; Mitchell, C.P.; Smith, P. The development of MISCANFOR, a new Miscanthus crop growth model: Towards more robust yield predictions under different climatic and soil conditions. GCB Bioenergy 2009, 1, 154–170. [Google Scholar] [CrossRef]
  9. European Environment Agency (EEA). CORINE Land Cover 2000 (CLC2000): Technical Guidelines; EEA: Copenhagen, Denmark, 2002; Available online: https://www.eea.europa.eu (accessed on 1 May 2024).
  10. Mitchell, T.D.; Carter, T.R.; Jones, P.D.; Hulme, M. A Comprehensive Set of High-Resolution Grids of Monthly Climate for Europe and the Globe: The Observed Record (1901–2002) and 16 Scenarios (2001–2100); Tyndall Centre Working Paper 55; Tyndall Centre for Climate Change Research: Norwich, UK, 2004. [Google Scholar]
  11. Daioglou, V.; Doelman, J.C.; Wicke, B.; Faaij, A.P.C.; van Vuuren, D.P. Integrated assessment of biomass supply and demand in climate change mitigation scenarios. Glob. Environ. Change 2019, 54, 88–101. [Google Scholar] [CrossRef]
  12. Dohleman, F.G.; Heaton, E.A.; Arundale, R.A.; Long, S.P. Seasonal dynamics of above- and below-ground biomass and nitrogen partitioning in Miscanthus × giganteus and Panicum virgatum across three growing seasons. GCB Bioenergy 2012, 4, 534–544. [Google Scholar] [CrossRef]
  13. Martani, E.; Ferrarini, A.; Serra, P.; Pilla, M.; Marcone, A.; Amaducci, S. Belowground biomass C outweighs soil organic C of perennial energy crops: Insights from a long-term multispecies trial. GCB Bioenergy 2021, 13, 88–103. [Google Scholar] [CrossRef]
  14. Bosatta, E.; Ågren, G.I. Theoretical analysis of decomposition of heterogeneous substrates. Soil Biol. Biochem. 1985, 17, 601–610. [Google Scholar] [CrossRef]
  15. Bosatta, E.; Ågren, G.I. Dynamics and carbon and nitrogen in the organic matter of the soil: A generic theory. Am. Nat. 1991, 138, 227–245. [Google Scholar] [CrossRef]
  16. Bosatta, E.; Ågren, G.I. Theoretical Ecosystem Ecology: Understanding Element Cycles; Cambridge University Press: Cambridge, UK, 1996. [Google Scholar]
  17. Dondini, M.; Van Groenigen, K.J.; Del Galdo, I.; Jones, M.B. Carbon sequestration under Miscanthus: A study of potential, mechanisms and environmental interactions. GCB Bioenergy 2009, 1, 123–133. [Google Scholar] [CrossRef]
  18. Shepherd, A.; Littleton, E.; Clifton-Brown, J.; Martin, M.; Hastings, A. Projections of global and UK bioenergy potential from Miscanthus × giganteus—Feedstock yield, carbon cycling and electricity generation in the 21st century. GCB Bioenergy 2020, 12, 287–305. [Google Scholar] [CrossRef]
  19. Karp, A.; Shield, I. Bioenergy from plants and the sustainable yield challenge. New Phytol. 2008, 179, 15–32. [Google Scholar] [CrossRef]
  20. Donnison, I.S.; Shield, I.F.; Parrish, D.J.; Clifton-Brown, J.; Karp, A. Prospects for Miscanthus, willow and other perennial biomass crops in the UK. In Perennial Energy Crops; Wiley-Blackwell: Oxford, UK, 2009; pp. 245–268. [Google Scholar]
  21. Tilman, D.; Socolow, R.; Foley, J.A.; Hill, J.; Larson, E.; Lynd, L.; Williams, R. Beneficial biofuels—The food, energy, and environment trilemma. Science 2009, 325, 270–271. [Google Scholar] [CrossRef]
  22. Santangeli, A.; Di Minin, E.; Toivonen, T.; Pogson, M.; Hastings, A.; Smith, P. Mapping energy crops and biodiversity trade-offs in the UK. GCB Bioenergy 2016, 8, 1191–1200. [Google Scholar] [CrossRef]
  23. Creutzig, F.; Ravindranath, N.H.; Berndes, G.; Bolwig, S.; Bright, R.; Cherubini, F.; Masera, O. Bioenergy and climate change mitigation: An assessment. GCB Bioenergy 2015, 7, 916–944. [Google Scholar] [CrossRef]
  24. Clifton-Brown, J.; Robson, P.; Sanderson, R.; Hastings, A.; Valentine, J.; Donnison, I. Thermal requirements for seed germination in Miscanthus compared with switchgrass (Panicum virgatum), reed canary grass (Phalaris arundinacea), maize (Zea mays), and perennial ryegrass (Lolium perenne). GCB Bioenergy 2011, 3, 375–386. [Google Scholar] [CrossRef]
  25. Zhuang, Q.; Qin, Z.; Chen, M. Biofuel, land and water: Maize, switchgrass or Miscanthus? Environ. Res. Lett. 2013, 8, 015020. [Google Scholar] [CrossRef]
  26. Volk, T.A.; Verwijst, T.; Tharakan, P.J.; Abrahamson, L.P.; White, E.H. Growing fuel: A sustainability assessment of willow biomass crops. Front. Ecol. Environ. 2004, 2, 411–418. [Google Scholar] [CrossRef]
  27. Lewandowski, I.; Scurlock, J.M.O.; Lindvall, E.; Christou, M. The development and current status of perennial rhizomatous grasses as energy crops in the US and Europe. Biomass Bioenergy 2003, 25, 335–361. [Google Scholar] [CrossRef]
  28. Heaton, E.A.; Voigt, T.B.; Long, S.P. A quantitative review comparing the yields of two candidate C4 perennial biomass crops in relation to nitrogen, temperature, and water. Biomass Bioenergy 2004, 27, 21–30. [Google Scholar] [CrossRef]
  29. Volk, T.A.; Abrahamson, L.P.; Nowak, C.A.; Smart, L.B.; Tharakan, P.J.; White, E.H. The development of short-rotation willow in the northeastern United States for bioenergy and bioproducts, agroforestry, and phytoremediation. Biomass Bioenergy 2006, 30, 715–727. [Google Scholar] [CrossRef]
  30. Somerville, C.; Youngs, H.; Taylor, C.; Davis, S.C.; Long, S.P. Feedstocks for lignocellulosic biofuels. Science 2010, 329, 790–792. [Google Scholar] [CrossRef]
  31. Volk, T.A.; Heavey, J.P.; Eisenbies, M.H. Advances in shrub-willow crops for bioenergy, renewable products, and environmental benefits. Food Energy Sec. 2016, 5, 97–106. [Google Scholar] [CrossRef]
  32. Yuan, W.; Zheng, Y.; Piao, S.; Ciais, P.; Lombardozzi, D.; Wang, Y.; Ryu, Y.; Chen, G.; Dong, W.; Hu, Z. Increased atmospheric vapor pressure deficit reduces global vegetation growth. Sci. Adv. 2019, 5, eaax1396. [Google Scholar] [CrossRef]
  33. Bonsch, M.; Humpenöder, F.; Popp, A.; Bodirsky, B.L.; Dietrich, J.P.; Rolinski, S.; Biewald, A.; Lotze-Campen, H.; Weindl, I.; Gerten, D.; et al. Trade-offs between land and water requirements for large-scale bioenergy production. GCB Bioenergy 2016, 8, 11–24. [Google Scholar] [CrossRef]
  34. Clifton-Brown, J.; Harfouche, A.; Casler, M.D.; Jones, H.D.; Macalpine, W.J.; Murphy-Bokern, D.; Smart, L.B.; Adler, A.; Ashman, C.; Awty-Carroll, D.; et al. Breeding progress and preparedness for mass-scale deployment of perennial lignocellulosic biomass crops switchgrass, Miscanthus, willow, and poplar. GCB Bioenergy 2019, 11, 118–151. [Google Scholar] [CrossRef]
  35. Clifton-Brown, J.; Hastings, A.; von Cossel, M.; Murphy-Bokern, D.; McCalmont, J.; Whitaker, J.; Alexopoulou, E.; Amaducci, S.; Andronic, L.; Ashman, C.; et al. Perennial biomass cropping and use: Shaping the policy ecosystem in European countries. GCB Bioenergy 2023, 15, 538–558. [Google Scholar] [CrossRef] [PubMed]
  36. Ko, S.; Lautala, P.; Handler, R.M. Securing the feedstock procurement for bioenergy products: A literature review on the biomass transportation and logistics. J. Clean. Prod. 2018, 200, 205–218. [Google Scholar] [CrossRef]
  37. Searle, S.; Malins, C. Waste and residue availability for advanced biofuel production in the European Union. Biomass Bioenergy 2016, 89, 2–10. [Google Scholar] [CrossRef]
  38. Galdos, M.V.; Cantarella, H.; Hastings, A.; Hillier, J.; Smith, P. Environmental sustainability aspects of second-generation ethanol production from sugarcane. In Advances of Basic Science for Second Generation Bioethanol from Sugarcane; Buckeridge, M.S., De Souza, A.P., Eds.; Springer International Publishing: Cham, Switzerland, 2017; pp. 173–192. [Google Scholar] [CrossRef]
  39. Anderson-Teixeira, K.J.; Davis, S.C.; Masters, M.D.; DeLucia, E.H. Changes in soil organic carbon under biofuel crops. GCB Bioenergy 2009, 1, 75–96. [Google Scholar] [CrossRef]
  40. Rowe, R.L.; Street, N.R.; Taylor, G. Identifying potential environmental impacts of large-scale deployment of dedicated bioenergy crops in the UK. Renew. Sustain. Energy Rev. 2009, 13, 271–290. [Google Scholar] [CrossRef]
  41. Whitaker, J.; Field, J.L.; Bernacchi, C.J.; Cerri, C.E.P.; Ceulemans, R.; Davies, C.A.; De Lucia, E.H.; Donnison, I.S.; McCalmont, J.P.; Paustian, K.; et al. Consensus, uncertainties and challenges for perennial bioenergy crops and land use. GCB Bioenergy 2018, 10, 150–164. [Google Scholar] [CrossRef]
  42. Don, A.; Osborne, B.; Hastings, A.; Skiba, U.; Carter, M.S.; Drewer, J.; Freibauer, A. Land-use change to bioenergy production in Europe: Implications for the greenhouse gas balance and soil carbon. GCB Bioenergy 2012, 4, 372–391. [Google Scholar] [CrossRef]
  43. Richter, D.D.; Hofmockel, M.; Callaham Jr, M.A.; Powlson, D.S.; Smith, P. Long-term soil experiments: Keys to managing Earth’s rapidly changing ecosystems. Soil Sci. Soc. Am. J. 2015, 79, 1459–1466. [Google Scholar] [CrossRef]
Figure 1. Simulated global land use energy intensity (GJ/ha) for Miscanthus (a) and Willow (b) under current climate conditions (1961–1990). For both crops: very low ≤ 0.00; low = 0.00–100; medium = 100–200; high = 200–300; very high ≥ 300.
Agronomy 15 01491 g001
Figure 2. Regional land use energy intensity of Miscanthus (blue) and Willow (green) under baseline conditions (1961–1990). Error bars represent standard deviation (SD).
Agronomy 15 01491 g002
Figure 3. Simulated global land use energy intensity (GJ/ha) for Miscanthus at the B1 (a) and A1FI (b) climate projections (up to 2060). Very low ≤ 0.00; low = 0.00–100; medium = 100–200; high = 200–300; very high ≥ 300.
Agronomy 15 01491 g003
Figure 4. Simulated global land use energy intensity (GJ/ha) for Willow at the B1 (a) and A1FI (b) climate projections (up to 2060). Very low ≤ 0.00; low = 0.00–100; medium = 100–200; high = 200–300; very high ≥ 300.
Agronomy 15 01491 g004
Figure 5. Energy use efficiency (EUE) of Miscanthus for two biomass transportation distances at the baseline climate (1961–1990). (a) EUE at 50 km transportation distance and (b) EUE at 500 km transportation distance. EUE categories: Very low ≤ 5; low = 5.01–9.99; medium = 10.00–14.99; high = 15.00–20.00.
Agronomy 15 01491 g005
Figure 6. Regional energy use efficiency at transport distances of 50 km (blue) and 500 km (green) under baseline conditions (1961–1990). Error bars represent standard deviation (SD).
Agronomy 15 01491 g006
Figure 7. Energy use efficiency (EUE) of Miscanthus for two biomass transportation distances at B1 climate scenario, up to 2060. (a) EUE at 50 km transportation distance and (b) EUE at 500 km transportation distance. EUE categories: Very low ≤ 5; low = 5.01–9.99; medium = 10.00–14.99; high = 15.00–20.00.
Agronomy 15 01491 g007
Figure 8. Energy use efficiency (EUE) of Miscanthus for two biomass transportation distances at A1FI climate scenario, up to 2060. (a) EUE at 50 km transportation distance and (b) EUE at 500 km transportation distance. EUE categories: Very low ≤ 5; low = 5.01–9.99; medium = 10.00–14.99; high = 15.00–20.00.
Agronomy 15 01491 g008
Figure 9. Changes in soil organic carbon due to cultivation of Miscanthus under baseline (a); 1961–1990, and future climate projections: B1 (b) and A1FI (c). The SOC range varies from 2.89 to −5.47 t/ha.
Agronomy 15 01491 g009
Figure 10. Regional soil organic carbon (SOC) sequestration due to Miscanthus cultivation under the baseline climate (1961–1990) and two future climate scenarios (B1 and A1FI) projected to 2060. Error bars indicate standard deviation (SD).
Agronomy 15 01491 g010
Table 1. Summary of on farm energy and carbon costs of production used in MiscanFor model.
Climate/Transport
Scenario
Annual Energy/Yield (GJ/t)Greenhouse Gas Emissions* Crop Harvest Moisture (%)
(kg C ha−1y−1)(kg C/Mg)
Baseline (50 km)0.514752325.2714
Baseline (500 km)0.771002329.3414
B1 (50 km)0.514752325.2714
B1 (500 km)0.771002329.3414
A1FI (50 km)0.514752325.2714
A1FI (500 km)0.771002329.3414
* Harvest of Miscanthus typically takes place in late winter to early spring (February–March), which allows for natural drying of the biomass in the field. Moisture values (14%) reflect the moisture content after natural field drying.
Table 2. Summary of the number of global grids used in the analysis for each scenario.
ScenarioNumber of Grid CellsNumber of * NA (Zeros)
Baseline725,185181
B1836,890427
A1FI903,373778
* NA means not available.
Table 3. Global means LUEI (GJ ha−1) of Miscanthus and willow at baseline (1961–1990) and two climate projections (A1FI and B1) up to 2060. Percentage changes due to climate change are calculated based on global mean values. SD is standard deviation.
ScenarioMinimumMaximumMeanMedianSDChanges Due to Climate Change (%)
MiscanthusBaseline−8.68753.10321.02392.01179.07-
B1−8.29784.75293.20345.21190.05−9
A1FI−8.44702.98273.22302.05184.66−15
WillowBaseline−7.98487.79163.98157.73115.56-
B1−8.82505.26150.98136.67115.32−8
A1FI−5.56455.28142.52125.11111.76−13
Table 4. Comparisons of regional land use energy intensity of Miscanthus and Willow under baseline climate conditions (1961–1990). SD is standard deviation.
ContinentMiscanthusWillow* Statistics
MeanNSDMeanNSDp-Value
Africa342.46166,669164.91225.58161,010101.75<0.0001
Asia388.76134,056148.46189.80200,105125.94<0.0001
Europe129.7691,033105.3277.41323,75860.13<0.0001
North America270.3692,988206.41129.40244,129108.56<0.0001
Oceania214.9651,088178.13156.3246,010114.11<0.0001
South America400.97186,091127.53258.61188,46981.48<0.0001
* Difference between Miscanthus and Willow is statistically significant on all continents (p < 0.0001) based on Wilcoxon Rank-Sum test (used due to non-normality of data distributions). N is the number of observations.
Table 5. Global mean energy use efficiency (EUE) of Miscanthus for two transportation levels (50 km and 500 km) at baseline climate (1961–1990) and two climate projections (A1FI and B1) up to 2060. Percentage change due to climate change are calculated based on global mean values. SD is standard deviation.
Scenario/Transport DistanceMinimumMaximumMeanMedianSDChanges (%)
Baseline (50 km)0.0524.7515.7319.657.08−21
Baseline (500 km)0.0518.2012.3715.295.15
B1 (50 km)0.0824.9915.1518.707.13−21
B1 (500 km)0.0818.3311.9714.705.17
A1FI (50 km)0.0624.2514.5617.587.06−20
A1FI (500 km)0.0617.9211.5814.005.14
Table 6. Comparisons of regional energy use efficiency at 50 km and 500 km distance scenarios under baseline climate conditions (1961–1990). SD is standard deviation. N is the number of observations.
Region50 km500 km* Statistics
ContinentMeanNSDMeanNSDp-Value
Africa16.67172,8746.4913.06172,8744.7<0.0001
Asia18.31137,0145.5314.21137,0143.95<0.0001
Europe9.1597,3485.657.7697,3484.39<0.0001
North America13.01101,0068.210.33101,0066.05<0.0001
Oceania11.6254,9477.629.454,9475.69<0.0001
South America19.08187,7014.5914.77187,7013.27<0.0001
* Difference between the two distances is statistically significant (p < 0.0001) based on Wilcoxon Rank-Sum test (due to non-normality of data distributions).
Table 7. Global cumulative soil organic carbon (SOC30 or SOC70), annual change (∆SOC) and annual added rate for Miscanthus at baseline (1961–1990) and two climate projections (A1FI and B1) up to 2060. SD is standard deviation.
ScenarioParametersMinimum1st QuartileMedianMean3rd QuartileMaximumSD
BaselineSOC30 (t ha−1)14.90114.40152.50150.50177.20643.259.90
∆SOC (t ha−1)−7.93−0.051.671.202.374.571.46
Annual rate (t ha−1)0.503.815.085.025.9121.442.00
B1SOC70 (t ha−1)9.25104.79180.54167.31216.35605.0473.71
∆SOC (t ha−1)−5.47−0.240.820.621.533.191.11
Annual rate (t ha−1)0.131.502.582.393.098.641.05
A1FISOC70 (t ha−1)13.37101.39172.58163.45212.09598.0073.27
∆SOC (t ha−1)−5.47−0.310.600.491.432.891.13
Annual rate (t ha−1)0.191.452.472.343.038.541.05
Table 8. Comparisons of regional soil organic carbon sequestration at baseline climate condition (1961–1990) and B1 and A1FI climate projections. SD is standard deviation. N is the number of observations.
ContinentBaselineA1FI *B1 *
Mean NSDMean NSDMean NSD
North America0.6892,9881.620.08160,5120.940.22138,0981.03
Europe−0.4790,8601.15−0.65179,3491.10−0.50149,2021.05
Asia1.63134,0481.281.03160,1090.911.11151,5550.89
Africa1.52166,6691.230.98153,9670.840.97157,5930.87
South America1.86186,0911.031.06188,0070.761.17188,4270.76
Oceania0.5351,0881.180.3550,3310.780.3647,5150.78
* SOC values significantly different from Baseline on all continents (p < 0.0001) based on Kruskal–Wallis testing with post hoc multiple pair-wise testing by Wilcoxon Rank-Sum test (due to non-normality of data distributions).
Disclaimer/Publisher’s Note: The statements, opinions and data contained in all publications are solely those of the individual author(s) and contributor(s) and not of MDPI and/or the editor(s). MDPI and/or the editor(s) disclaim responsibility for any injury to people or property resulting from any ideas, methods, instructions or products referred to in the content.

