Article

Transcription Factor Protein (TFP)-Trait Relationships During Sugarcane Internode Development

by
Frederik C. Botha
1,* and
Annelie Marquardt
2
1
Queensland Alliance for Agriculture and Food Innovation (QAAFI), University of Queensland, St Lucia, QLD 10587, Australia
2
Agriculture and Food, CSIRO, St Lucia, QLD 10587, Australia
*
Author to whom correspondence should be addressed.
Agronomy 2025, 15(6), 1475; https://doi.org/10.3390/agronomy15061475
Submission received: 17 May 2025 / Revised: 10 June 2025 / Accepted: 13 June 2025 / Published: 17 June 2025
(This article belongs to the Section Plant-Crop Biology and Biochemistry)

Abstract

Understanding how transcription factors regulate biomass accumulation and sucrose storage is essential for improving sugarcane productivity. In this study, we quantified transcription factor protein (TFP) abundance in sugarcane internodes across developmental stages and growth rates. These profiles were correlated with key biochemical traits, including lignin, glucan, hemicellulose, and sucrose content. From 7333 identified proteins, 205 were annotated as transcription factors spanning 22 families. By applying Pearson correlation followed by Partial Correlation with Information Theory (PCIT), we identified 46 high-confidence TFP-trait associations. Key regulators, such as ScMYB113, ScMADS15, and ScbZIP85, exhibited trait-specific roles, influencing sucrose storage and cell wall biosynthesis. Network topology revealed distinct transcriptional modules linked to biomass production, polysaccharide deposition, and intermediary metabolism. Notably, sucrose and lignin accumulation intensified after internode elongation ceased, highlighting shifts in transcriptional control during maturation. This study delivers the first protein-level regulatory map linking transcription factors to metabolic traits in sugarcane and provides a framework for targeting candidate regulators to enhance biomass quality and yield in bioenergy crops such as sugarcane.

1. Introduction

The need for increased biomass utilisation in a circular, sustainable bioeconomy is underscored by global population growth and climate change. Bioenergy is already a major renewable energy source, and this trend is expected to continue growing in the coming decades [1]. Utilizing biomass as a feedstock for energy and value-added systems is often challenging due to material heterogeneity, high moisture, poor biological stability, and low energy density [1,2,3].
A sustainable biomass future economy hinges on not expanding land use. Land-use change, biodiversity loss, climate change, water pollution, and land degradation are all consequences of the past century’s unprecedented biomass harvesting [4,5]. With population growth and wealthier, more meat-heavy diets increasing biomass demand, these problems are predicted to intensify [6].
The process by which grasses produce, transport and store carbohydrates underpin all aspects of yield traits. There is a link between net photosynthesis biomass yield [7]. However, sink strength (defined as biomass accumulation), is directly linked on maintaining a low sucrose concentration in the cytosol [8]. Impairment or changes in sink strength feedback and regulate photosynethetic activity [9].
Improving biomass yield and sugar content in sugarcane is critical for advancing sustainable bioenergy production. Internode elongation and sucrose accumulation are two central traits determining productivity [10,11,12,13] yet the transcriptional mechanisms controlling these processes remain poorly defined. While previous research has examined changes in transcript levels during culm development [14,15,16,17,18], these studies do not adequately capture the functional regulatory landscape, particularly in the case of transcription factors (TFs), whose activity is regulated post-transcriptionally through protein stability, localization, and modification.
The disconnect between mRNA and protein levels is especially pronounced for TFs, which are often rapidly activated or suppressed at the protein level in response to environmental or developmental cues without corresponding changes in transcript abundance [19]. Thus, identifying TFs based solely on transcriptomic data can lead to misleading conclusions. Direct measurement of TF protein abundance offers a more accurate route to identifying functionally relevant regulators.
The intricate, multigene-controlled traits of cell wall composition and biomass accumulation rate are complex. Consequently, modifying the cell wall genetically would be quite challenging. It’s clear that several identified transcription factors act as master regulators in plants, with key roles in metabolic pathways [20,21]. Transcription factors (TFs), which act as metabolic regulators, modulate the expression of enzyme genes within specific metabolic pathways through activation or repression. Plant metabolic pathway control is seemingly better achieved by manipulating transcription factors than by targeting single enzyme genes [22,23]. In this study, we combine trait-specific biochemical and morphological data with quantitative proteomics of sugarcane internode tissues to identify transcription factors associated with major traits such as sucrose content, cell wall composition, and biomass accumulation. We focus on rapidly growing and developmentally staged internodes to capture dynamic regulatory changes.
A key innovation of our analysis is the use of the Partial Correlation with Information Theory (PCIT) algorithm to build high-confidence trait-TF correlation networks [24,25]. Unlike conventional Pearson correlation, which captures both direct and indirect associations, PCIT removes indirect effects, resulting in a more stringent and biologically meaningful inference of regulatory relationships.
This work represents the first comprehensive effort to map transcription factor–trait associations in sugarcane using protein-level data combined with the stringency of PCIT. Our findings reveal distinct TF modules linked to carbon partitioning, cell wall biosynthesis, and sucrose storage, providing a valuable resource for future metabolic engineering and crop improvement strategies.

2. Materials and Methods

2.1. Material

Research trials were conducted in field with sugarcane variety KQ228. The trial locations were at Sugar Research Australia’s Burdekin Station in QLD (19° 34 0.80 S, The trials were planted in a completely randomised design, including four replicate plots per treatment. Each replicate consisted of four 10 m rows with a 1.5 m spacing between rows Planting material, planting, fertilisation and irrigation of the trials were done as previously described [26]. Previously we have shown that the growth rate and metabolic composition of late season growth and that of MODDUS treated cane at peak growth rate does not differ significantly [26]. In the work reported here and rate of crop growth rate was controlled by the application of 50 g Trinexapac-ethyl ha 1 [13]. The last application was 26 days before harvest. In the manuscript we refer to the MODDUS treated cane phenotype as “slow-growth”.

2.2. Destructive Sampling

Six culm samples were collected from the field plots 1130   G D D 18 after planting. Previously we have shown that peak internode growth rates occur around this time for KQ228 [26]. These samples were analyzed using a modified method by Berding [27]. The culm samples were disintegrated using either a garden mulcher or Dedini laboratory disintegrator at room temperature. The mulched material was then weighed to determine the fresh weight (FW) and transferred to a paper bag to be dried at 70 °C until a constant dry weight (DW) was reached (usually 6 to 7 days). Important to note that in this document internode numbering is based on leaf number where leaf 1 represents the leaf with the top visible dewlap. Botanically internode number 1 is probably internode 3 or 4.

2.3. Biomass Composition

All the analyses biomass compositional analysis were conducted at Celignis Analytical (https://www.celignis.com/biomass-analysis.php) using the analytical package P19 (Deluxe lignocellulose: Sugars, Lignin, Extractives, and Ash, protein-corrected lignin, water-soluble sugars, uronic acids, acetyl content and starch).

2.3.1. Extraction of Biomass Component

All extractions were carried out with a Dionex Accelerated Solvent Extractor (ASE) 200 [28]. The extractions were carried out according to the National Renewable Energy Laboratory (NREL) standard operating procedure for determining extractives in biomass [29]. Ash content was determined using a Nabertherm L-240H1SN furnace, according to the NREL operating procedure for the determination of ash in biomass [29].

2.3.2. Cell Wall Constituents

Hydrolysis of the dry extractives-free samples was performed according to a modification of the NREL standard operating procedure for the determination of structural carbohydrates and lignin in biomass [30]. The procedure was divided into two main steps: a two-stage acid hydrolysis of the samples and the gravimetric filtration of the hydrolysate to separate it from the acid-insoluble residue (AIR) [29].
Klason lignin was calculated by determining the weight difference between the AIR and its ash content. Acid-soluble lignin was measured by determining the absorbance of an aliquot of the hydrolysate at 240 nm using an Agilent 8452 UV–vis spectrophotometer (Agilent, Santa Clara, CA, USA). The results are then converted to ASL based on Beer’s law [31]. Ion-chromatography techniques adapted from Hayes [30] were used to determine the lignocellulosic sugars resulting from hydrolysis. The method consisted of diluting the hydrolysate samples 20× with a deionised water solution containing known amounts of melibiose as an internal standard [28]. The diluted hydrolysates were filtered and then analysed with HPLC and fitted with an electrochemical detector (PAD).

2.3.3. Water Solubles

The sugars in the water-soluble fraction presented in the Section 2.3.1 (Extraction of Biomass Component) were analysed using ion–chromatography [28].

2.4. Calculation of Growth and Metabolic Rates

Growth and metabolic rates were calculated from:
Rate of Change = t T 1 t T 2 Δ G D D
This equation calculates the difference in trait (t) (mass, concentration or internode length) between times T 1 and T 2 (i.e., t T 1 t T 2 ) and normalises it by the delta growing degree days (GDD) [32].

2.5. Trait-Trait Correlation

Trait-trait correlations were investigated using Spearman’s rank correlation coefficient, which assesses monotonic relationships between variables. This method was chosen because it is robust to non-linear relationships and is less sensitive to outliers compared to Pearson correlation. Before computing correlations, categorical variables in the dataset were converted to numeric values. This was achieved using the factorize function in Panda (2.2.3), which assigns integer values to unique categories.
Spearman’s rank correlation coefficient ( ρ ) measures the strength and direction of the monotonic relationship between two variables. Unlike Pearson correlation, it does not assume a linear relationship and is based on ranked values. The Spearman correlation coefficient is defined as:
ρ = 1 6 d i 2 n ( n 2 1 )
where:
  • ρ is Spearman’s rank correlation coefficient,
  • d i is the difference between the ranks of corresponding values,
  • n is the number of observations.

2.6. Exaction of Proteins

Internodes 2, 4 and 6 (Figure 1A) were removed from the stalk, and a 30 mm long section was cut from the bottom of the internode. Approximately 8 mm diameter cylindrical cores were bored off-centre (avoiding the pith) and vertically down using a 12 mm cordless drill and Diamond drill Bit. The cylindrical samples were placed in a labelled 2 mL screw cap tube and snap frozen in liquid nitrogen and stored at −80 °C. The drill bit borer was sprayed with 70% (v/v) ethanol and wiped between samples.
A portion of the liquid nitrogen frozen samples were lyophilised and used for protein extraction to generate proteome data [33]. Samples were washed with 10% TCA containing 0.07% DTT in acetone and homogenised in 50 mM HEPES in 2% SDS buffer (w/v). The supernatant was removed and buffer exchanged with 100 mM TEAB using 5 KDa molecular weight cut-off filter (VIVASPIN 6, 5 kDa spin filter, Product VS0612, Sartorius Stedim, Göttingen, Germany). The protein concentration was determined by Direct Detect® (Sigma-Aldrich, St. Louis, MO, USA). Each sample (100 μg) was taken for digestion and analysis with a 1D and 2D IDA nanoLC (Ultra nanoLC system, Eksigent, Dublin, CA, USA) system. Protein aliquots (100 μg) were suspended in 200 μL 8 M urea in 50 mM Tris (pH 8.8). Samples were digested with Lys-C at a 1:100 enzyme-to-protein ratio overnight at room temperature. Samples were then diluted with 50 mM Tris (pH 8.8) to a final concentration of less than 2 M urea and further digested with trypsin at a 1:100 enzyme-to-protein ratio for at least 4 h at 37 °C. The IDA LC–MS/MS data were searched using ProteinPilot v5 (Sciex, Toronto, ON, Canada) in thorough mode. The top 6 most intense fragments of each peptide were extracted from the SWATH data sets (75 ppm mass tolerance, 10 min retention time window). Shared and modified peptides were excluded. After data processing, peptides with confidence ≥ 99% and FDR ≤ 1% (based on chromatographic feature after fragment extraction) were used for quantitation. Protein differential abundance was determined using unnormalised protein quantification values as input for package DESeq2 v1.18.1 [34].

2.7. Transcription Factor Identification and Annotation

A list of all protein models for sugarcane was downloaded from the relevant genome database in FASTA format from Grassius [35]. A local REfSeq protein blast sugarcane TF database was created from the downloaded sugarcane TFs as described Bioinformatics and Other Bits—Creating a local RefSeq protein BLAST (2.13.0) database (http://bioinformaticsandotherbits.blogspot.com/2021/03/creating-local-refseq-protein-blast.html, accessed on 11 June 2025). A list of protein names and sequences is contained in the FASTA file was also downloaded from MaizeGDB https://www.maizegdb.org/. TFs were then identified through a Blastp search of the 7333 proteins sequences from this project against the constructed Sugarcane TF database. Identified TFs were placed into families using a set of classification rules based on available or self-built Pfam Hidden Markov Model (HMM) profiles.

2.8. Trait-Based Differential Expression Analysis

To normalize the data and avoid errors due to zero expression values, a log2 transformation was applied to all protein expression values with a pseudo-count of 1, following best practices in transcriptomics and proteomics studies [34]. For each trait of interest (e.g., sucrose, lignin, hemicellulose), samples were stratified into high and low trait groups based on whether their measured values were above or below the median for that trait. This median-based dichotomization is a widely used method to convert continuous variables into categorical groupings for downstream differential expression analysis [36].
To identify TFs differentially expressed between high and low trait groups, a two-sample independent t-test (Welch’s t-test) was applied to log2-transformed protein expression values. The resulting p-values were adjusted for multiple testing using the Benjamini-Hochberg false discovery rate (FDR) correction to control for false positives [37].
To infer high-confidence trait–transcription factor relationships, we employed the Partial Correlation with Information Theory (PCIT) algorithm, originally developed by Reverter and colleagues [24,25], to address limitations of conventional co-expression approaches. Unlike Pearson correlation, which captures both direct and indirect associations, PCIT distinguishes true regulatory interactions by systematically eliminating spurious correlations that arise from transitive or indirect effects.
The PCIT approach involves evaluating every triplet of variables (e.g., proteins or traits) and calculating the first-order partial correlation coefficients among them. Specifically, for any three variables X, Y, and Z, the partial correlation between X and Y controlling for Z is computed as:
r X Y · Z = r X Y r X Z r Y Z ( 1 r X Z 2 ) ( 1 r Y Z 2 )
where r X Y , r X Z , and r Y Z are the Pearson correlation coefficients between the respective variable pairs. The PCIT algorithm then applies a dynamic, data-driven threshold to determine whether an observed direct correlation r X Y is stronger than both partial correlations involving a third variable Z. If this condition is met for all potential Z, the edge (or connection) between X and Y is retained.
The threshold is derived using an information-theoretic strategy, where the mean ( μ ) and standard deviation ( σ ) of the absolute values of the partial correlations in each triplet are calculated. A correlation is considered significant only if:
| r X Y |   >   μ + k σ
where k is typically set to 1. This criterion excludes edges whose correlation strength is not markedly stronger than expected by chance, thereby removing noise from the network.
The final result is a sparse, high-confidence network in which retained edges represent likely direct and biologically meaningful associations. This filtering is particularly useful in high-dimensional proteomic datasets, where multicollinearity and co-regulation are prevalent.
Only significant correlations that survive the PCIT filtering are included in the final network. This results in a sparse, high-confidence network, where edges represent strong direct associations.
A significance threshold of 0.6 was applied to filter strong associations.

2.9. Protein-Protein Network Construction

For proteins displaying significant correlations with traits, a network-based analysis was performed using the networkx package. A protein-protein correlation matrix was computed, and protein pairs exceeding a correlation threshold of 0.4 were connected in the network. This approach enabled the visualization of molecular interactions underpinning trait associations. Network topology was analysed by computing clustering coefficients for each node, measuring the degree of local connectivity [38]. Distributions of clustering coefficients were visualized through histograms and cumulative distribution plots. The connectivity distribution of the TFS in any one of the four trait networks (Figure S6) indicated that most TFs have a moderate level of connectivity (peak around 0.4) meaning that a majority of them have around 40% connectivity relative to the total possible connections in the network.The cumulative distribution of connectivity shows a characteristic sigmoidal shape, indicating that a small fraction of TFS exhibit very high connectivity, while most TFS fall within the lower to mid-range of connectivity.

2.10. Computational Analysis

The computational analyses used Python, 3.11.11 in the Spyder Integrated Development Environment (IDE; version 6.0.3) [39]. Data preprocessing, statistical modelling, and network visualizations were implemented using the NumPy (Numerical Python) (2.2.2), pandas (2.2.3), SciPy (1.15.2), matplotlib (3.10.0), scienceplots (2.1.1) and seaborn (0.13.2) libraries in Python. To visualize strong trait correlations, we constructed an undirected network graph were constructed using NetworkX (3.4.2).

3. Results and Discussion

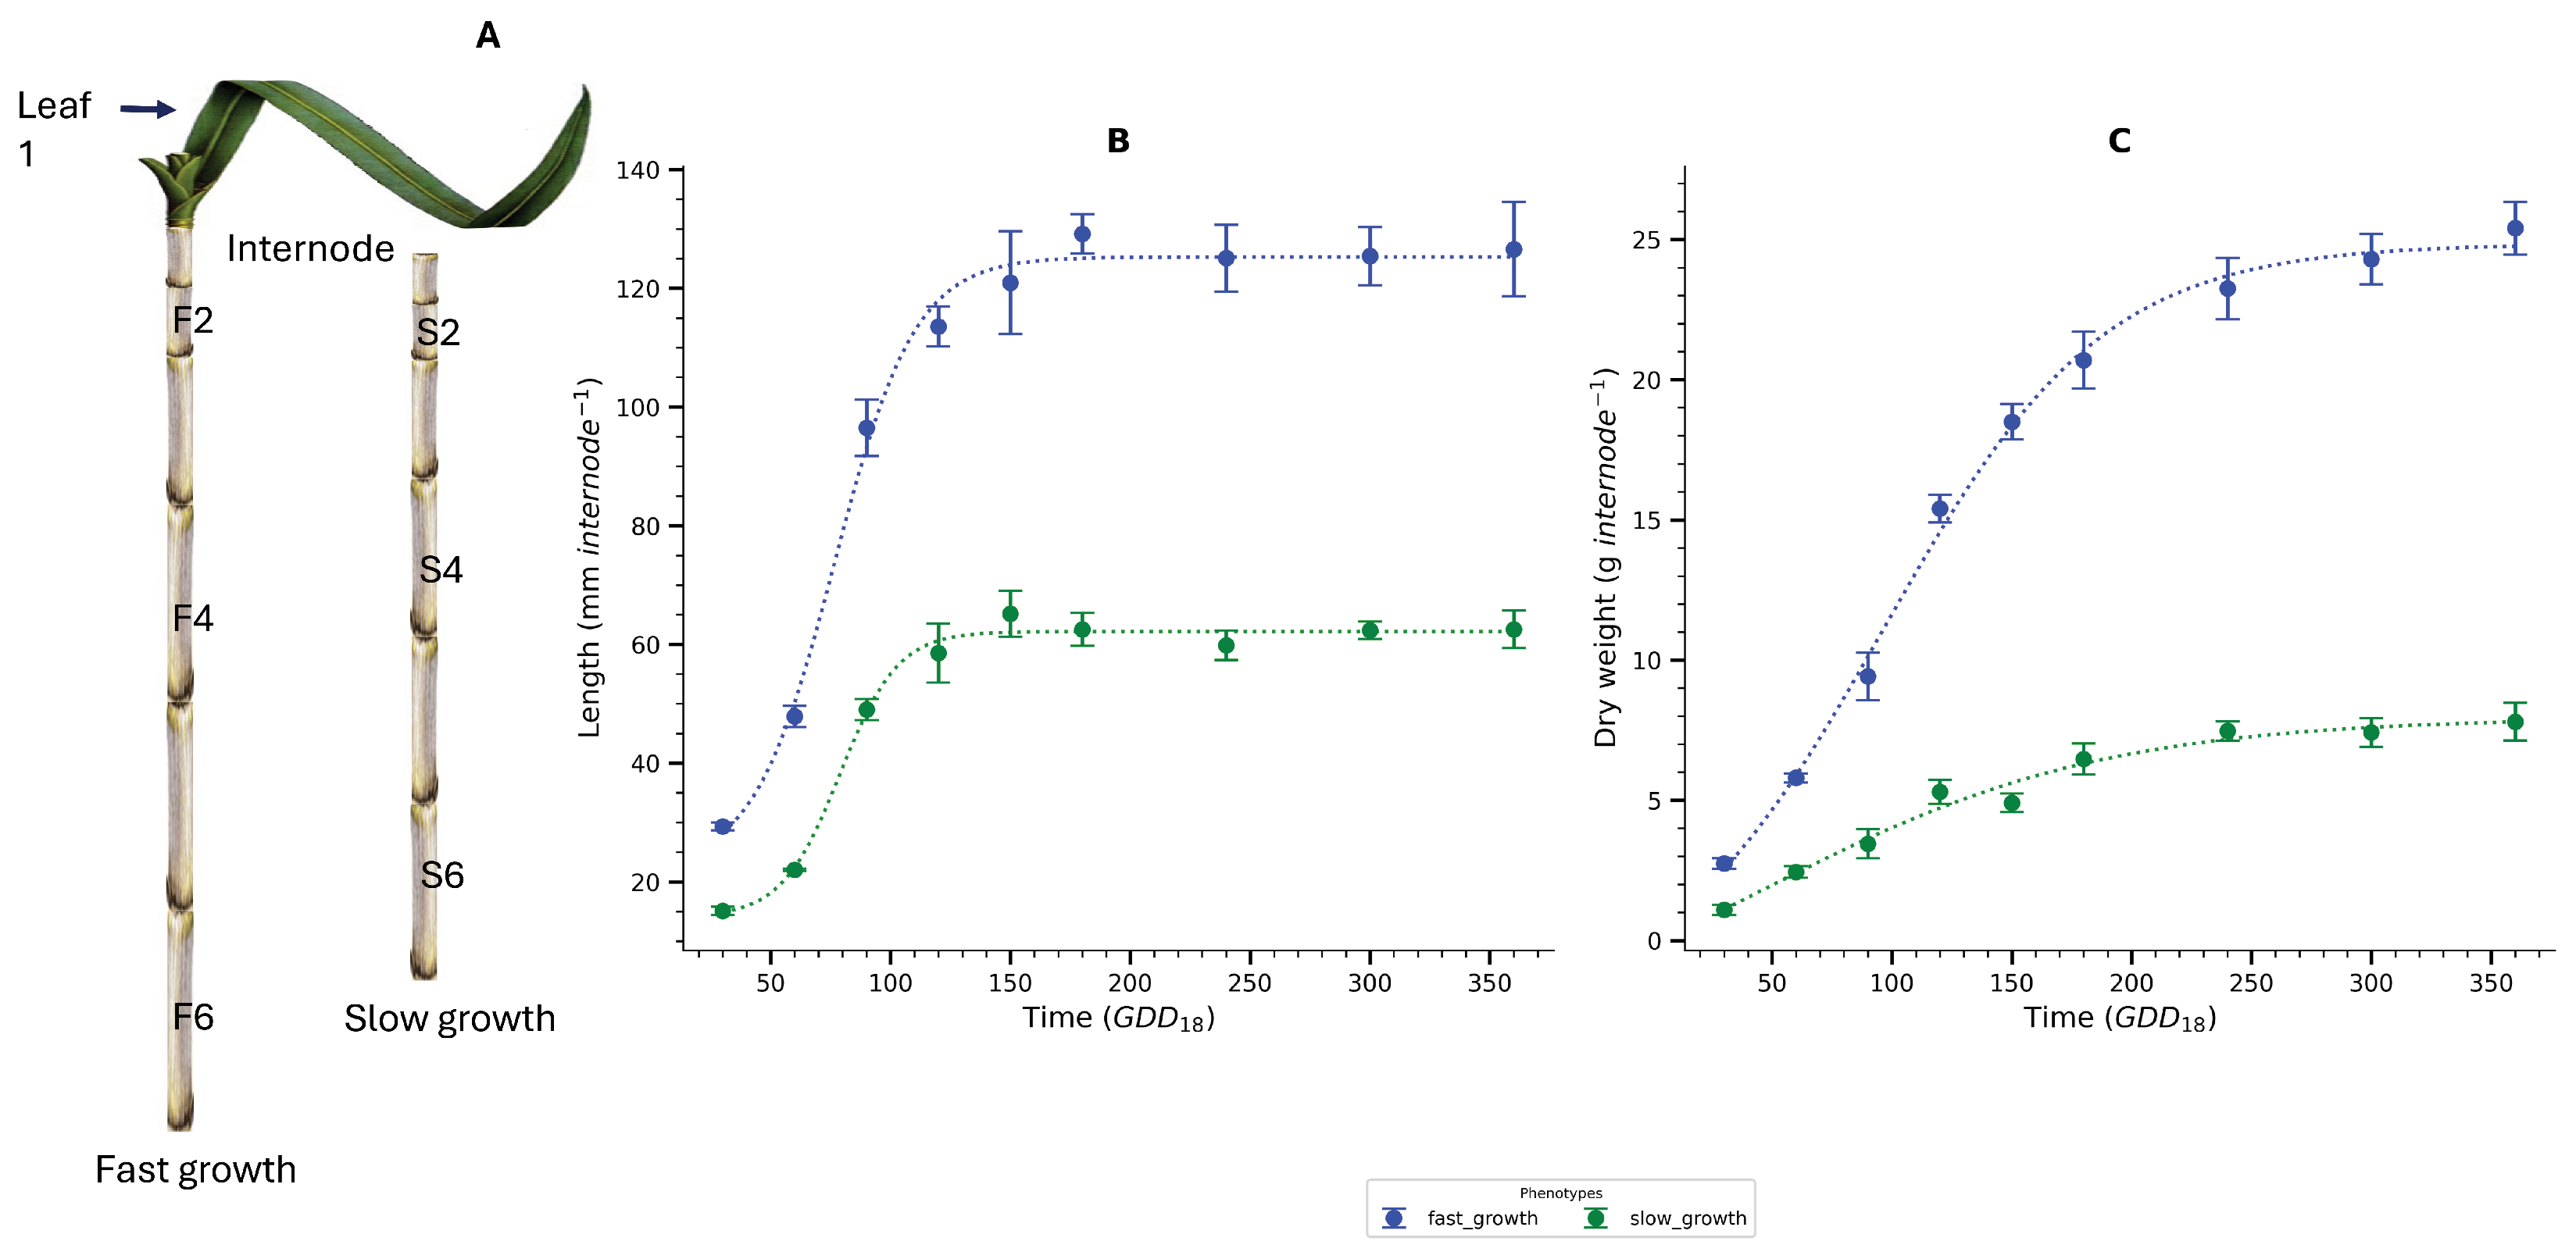
3.1. Growth and Sink Strength

While a strong correlation exists between culm length, internode length, and above-ground biomass in C4 grasses [10,12,26,40], it is important to distinguish between internode elongation and biomass accumulation. These two traits have been often measured and described in sugarcane related research.
The pattern of internode elongation and biomass accumulation is sigmoidal (Figure 1). Approximately 150   G D D 18 was required for complete internode elongation in sugarcane KQ228 (Figure 1B). At this time-point four new internodes have formed (i.e., internode 5 is the last elongating internode [26]. In comparison, the peak of biomass accumulation (sink strength) was observed around 120– 150   G D D 18 , with its termination at 300– 360   G D D 18 (Figure 1C and Figure S1). Fast-growing and slow-growing sugarcane showed identical patterns of internode elongation and biomass accumulation. A Tukey HSD post-hoc analysis showed that the differences in both internode length and biomass were significantly different between the two phenotypes and the young internodes (Table 1).
In this study we measured 13 biochemical traits, and calculated six (total soluble sugar, total cell wall sugar, hexosans, pentosans, hemicellulose (Equation (3)) and ROPAL (Equation (4)) that underpins internode elongation and biomass accumulation.
hemicellulose = x y l a n + a r a b i n a n + g l u c o r o n i c a c i d .
ROPAL = B i o m a s s ( s o l u b l e s u g a r s + h e x o s a n s + p e n t o s a n s + g l u c o r o n i c a c i d )
No significant differences in biomass profiles were found between fast and slow-growing sugarcane phenotypes in 16 traits, according to ANOVA and Tukey HSD post hoc analysis (Table 1). Except for glucuronic acid, all other 15 traits exhibited significant differences between internodes 2–6. Eleven of the 16 traits did not show significant variation in internodes 8–12.
However, the yield of every component depends on the concentration of the tissue and the total mass. The biomass yield differed significantly between phenotypes and internodes; trait yields also showed significant differences. Internodes 2 and 12 showed significantly different yields of total sugar, sucrose, glucose, fructose, xylan, rhamnan, glucuronic acid, hemicellulose, and lignin (Table 1).
Biomass accumulation and internode length are significantly correlated between 0– 150   G D D 18 , but not between 150– 360   G D D 18 (Figure S2). This is true for both rapidly and slowly growing sugarcane (Figure S2A,B). Approximately 25% of the total biomass accumulated after the internode elongation was complete, causing the lack of correlation (Table 2). Fast- and slow-growing sugarcane showed no significant differences in glucan, hemicellulose, and lignin accumulation after elongation ceased; however, biomass (p < 0.05) and sucrose (p < 0.001) accumulation differed significantly. The bulk (>80%) of the glucan and hemicellulose are accumulated during internode elongation while more than 50% of lignin, and 70% of sucrose are accumulated after completion of internode elongation.
These two aspects warrant consideration. Faster growth leads to larger internodes, resulting in greater biomass accumulation after elongation. Secondly, fast-growing sugarcane shows a higher percentage of sucrose accumulation after internode elongation because internode elongation is a more significant sink than sucrose accumulation. Early sucrose accumulation occurs with slower growth, preceding complete internode elongation.
Metabolism and carbon allocation in upper internodes before growth ceases are critical determinants of final aboveground biomass yield and composition. Boosting sugarcane and similar bioenergy crops needs a deep understanding of metabolic regulation in their rapidly growing top internodes.
This study concentrated on the metabolic processes and transcription factors within internodes 2, 4, and 6. This paper labelled the internodes 2F, 4F, 6F, 2S, 4S, and 6S. ‘F’ denotes fast-growing, while ‘S’ represents slow-growing (Figure 1A).

3.2. Carbon Partitioning and Trait-Trait Correlations

Carbon was largely allocated to glucan and hemicellulose within the early internodes (2F, 2S) (Figure 2). Carbon allocation to Lignin and sucrose increased as the internode completed elongation. Carbon allocation to the carbohydrate fractions of the cell wall decreased significantly following cessation of internode elongation. The greatest carbon allocation to ROPAL happens in early to mid-stages of development, then decreases significantly in mature internodes (Figure 2).
The data is indicative of active primary cell wall biosynthesis during elongation. During development, these pools decrease, and lignin allocation increases, consistent with a role in secondary wall deposition and tissue maturation.
ROPAL metabolism’s peak in early to mid-stage internodes, followed by a sharp decline in mature ones, points to its role in development and precursor metabolism. The substantial rise in carbon channelled into sucrose mirrors its function as a weakly responsive demand component within developing internodes.
Internode size is a key driver for sink strength [13,26]. his workflow enabled the identification of key trait-trait relationships in the dataset. The combination of statistical correlation computation and network visualization allowed for both quantitative and visual interpretation of phenotypic interactions. The threshold and edge colouring approaches ensured that the most relevant relationships were emphasized.
Glucan was positively correlated with xylan and hemicellulose (Figure 3). Hemicellulose and Xylan were nearly perfectly positively correlated (r = 0.99, p < 0.001). ROPAL acted as a connector and showed moderate correlations with other traits, positively with glucan, xylan and hemicellulose, and negatively with lignin and sucrose. Sucrose was negatively correlated with most other traits, except lignin (r = 0.64) and GOPAL, and showed the strongest negative correlation with glucan and xylan.
The strong negative relationship between sucrose and the structural components confirmed the weak demand of sucrose for incoming carbon and the strong demand of cell wall polysaccharide synthesis [13]. The tight coupling of hemicellulose and xylan confirmed the dominance of glucuronoarabinoxylan (GAX) in the hemicellulose fraction of sugarcane [41].
ROPAL’s dual connectivity implies that it may have a modulatory role in supporting sink strength and the switch from cell enlargement to sucrose accumulation. Lignin shows weak or negative associations with most traits, indicating distinct regulatory mechanisms or trade-offs between lignification and polysaccharide biosynthesis, possibly during secondary wall thickening.

3.3. Transcription Factors

A total of 7333 different proteins sequences were found in sugarcane internode tissue. Of these proteins 205 showed significant homology to the TFs that are captured in the Grassius sugarcane database (https://grassius.org/species/Sugarcane) (Figure S3A). These TFs belong to 22 different TF families (Figure S3B). More than 35% of the TF proteins in the internode belongs to the C3H family. Among the various families of plant TFs, the C3H (or CCCH zinc finger) family is characterized by one or more zinc finger, domains containing three cysteines and one histidine.
Originally recognized for their involvement in stress responses and post-transcriptional regulation, recent research has increasingly implicated C3H factors in key developmental processes such as stem elongation, internode differentiation, and cell wall biogenesis [42]. Studies in fast-growing species such as bamboo show that C3H factors act together with MYB and ARF proteins to establish transcriptional networks that not only promote rapid internode elongation but also signal the transition toward secondary cell wall deposition [42].

3.4. Transcription Factor Expression

A Principal Component Analysis (PCA) of the TFS expression was done by grouping the samples into three groups, fast- and slow growing, internode age, and internodes grouped and on the basis of development stage and growing rate. There was a clear clustering between the two phenotypes (fast- and slow growth (Figure S4A). The PCA reveals three distinguishable clustersof TFS expression with young samples positioned on the left, intermediate samples in the centre, and mature samples more spread out on the right side of the plot (Figure S4B).
This temporal separation reflects progressive TFS changes associated with developmental progression. The relative positions suggest a continuum of TFS expression changes from young to mature stages. When phenotype and internode stage were combined six cluster were evident, though with some clear overlap (Figure S4C).
The distinct clustering of internodes reflects localized transcriptional programs. The separation between the fast- and slow growing internodes of the same positional identity underscores the interaction of TFS expression with spatial and developmental growth. This progression of clusters along PC1 and PC2 may also correspond to a gradient of growth and maturation or physiological across the internodes.

3.5. Protein-Trait Correlation

A Pearson correlation analysis indicated that 107 TFS were significantly (p < 0.05) linked to the traits under investigation (Figure S5). This complicated network contained 107 nodes and 314 edges (links) between the TFS and traits. Trait-centric correlation networks were constructed to explore transcriptional regulators significantly associated with key cell wall and carbohydrate traits, namely glucan, xylan, sucrose, and lignin content (Figure 4). Each network includes only those transcription factors (TFs) whose expression levels were significantly correlated with the respective trait.
Distinct transcriptional signatures were observed for each trait. For instance, glucan (Figure 4A) was positively correlated with several TFs including ScMYB100 and ScCH94, while showing a strong negative association with ScbZIP85. Xylan (Figure 4B) exhibited a similar pattern, sharing several TFs with glucan, yet maintaining trait-specific associations such as ScMYB100 as a central regulator. Sucrose (Figure 4C) demonstrated a mixture of strong positive (e.g., ScMYB113) and negative (e.g., ScMADS15, ScHD53) correlations, suggesting a more complex regulatory architecture. In contrast, lignin (Figure 4D) was predominantly negatively correlated with a cluster of TFs, including ScARF6 and ScHD53, indicating potential repression by these regulators.
Overall, while some TFs such as ScMADS15 and ScHD53 appear to participate in the regulation of multiple traits, others show specificity, highlighting both shared and divergent regulatory controls across lignocellulosic and metabolic pathways.
However, the Pearson correlation by adjusting for indirect relationships can lead to spurious associations [24]. When we applied the PCIT algorithm only 46 TFS were significantly linked to the traits through 58 edges (links) (Table 3, Figure 4). This supports the use of PCIT as a more conservative and biologically meaningful method for network inference. The PCIT algorithm was central to this analysis, as it improves upon conventional Pearson correlation by adjusting for indirect relationships that could lead to spurious associations [24].

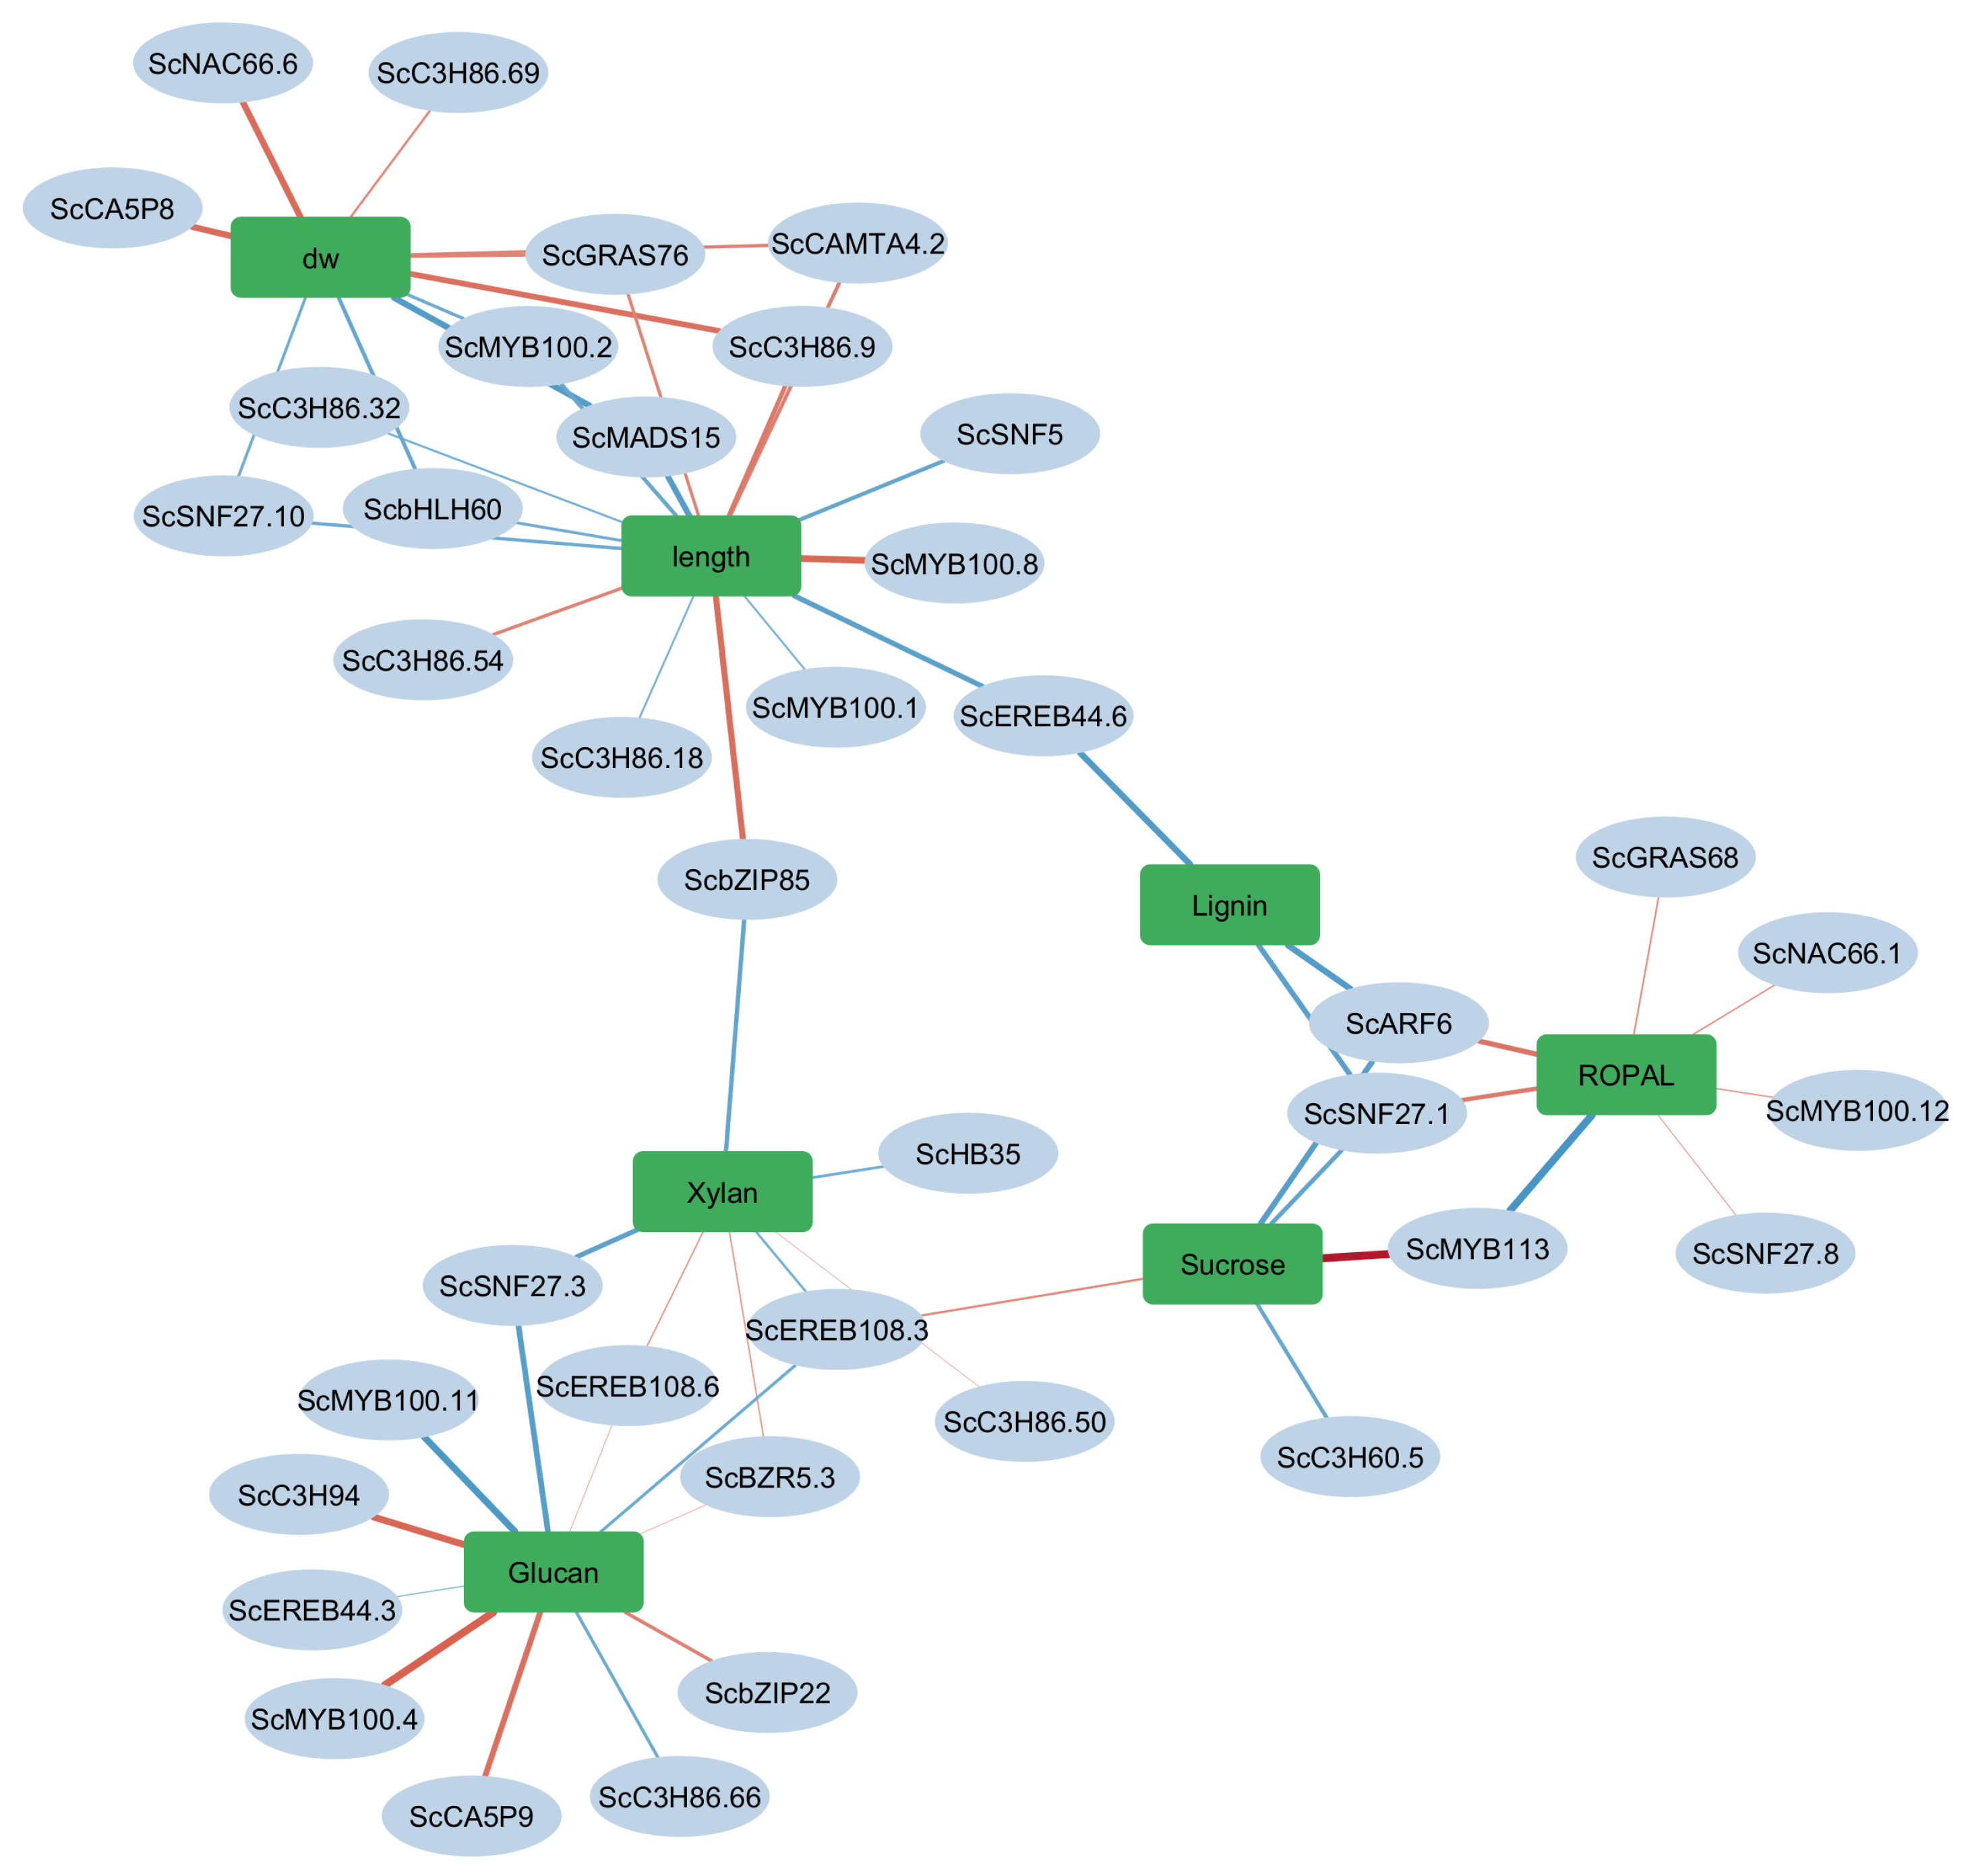
3.6. Gene-Trait Association Network Reveals Modular and Coordinated Regulation of Biomass-Related Traits

A key feature of the TFS-trait association network was the three distinct trait clusters, each reflecting a potentially co-regulated biological module Figure 5.

3.6.1. A Biomass Cluster: Dry Weight and Elongation

This cluster includes TFS such as ScMYB100, ScGRAS76, and ScMADS15, pointing toward a transcriptional module regulating internode elongation and biomass accumulation. The MYB family has well-established roles in secondary cell wall biosynthesis and growth regulation. The expression pattern of these TFs are in Figure 6. For instance, in Arabidopsis thaliana, AtMYB46 and AtMYB83 function as master switches activating secondary wall biosynthetic programs, influencing plant biomass. Similarly, GRAS family members are known to participate in various aspects of plant development, including stem elongation and meristem maintenance [43]. Internode strength and development in maize are modulated by TFs linked to secondary wall deposition, including MYB- and GRAS-domain proteins [44]. MADS-box TFs like ScMADS15 are implicated in floral development and may also influence vegetative growth patterns [45].
Likewise, MADS-box TFs have been implicated in both floral and vegetative growth, including stem morphology [45]. The clustering of dry weight and internode elongation also aligns with findings in maize, where hormonal regulation (auxin, gibberellins) affects internode elongation by modulating TFs involved in cell wall biosynthesis [46].

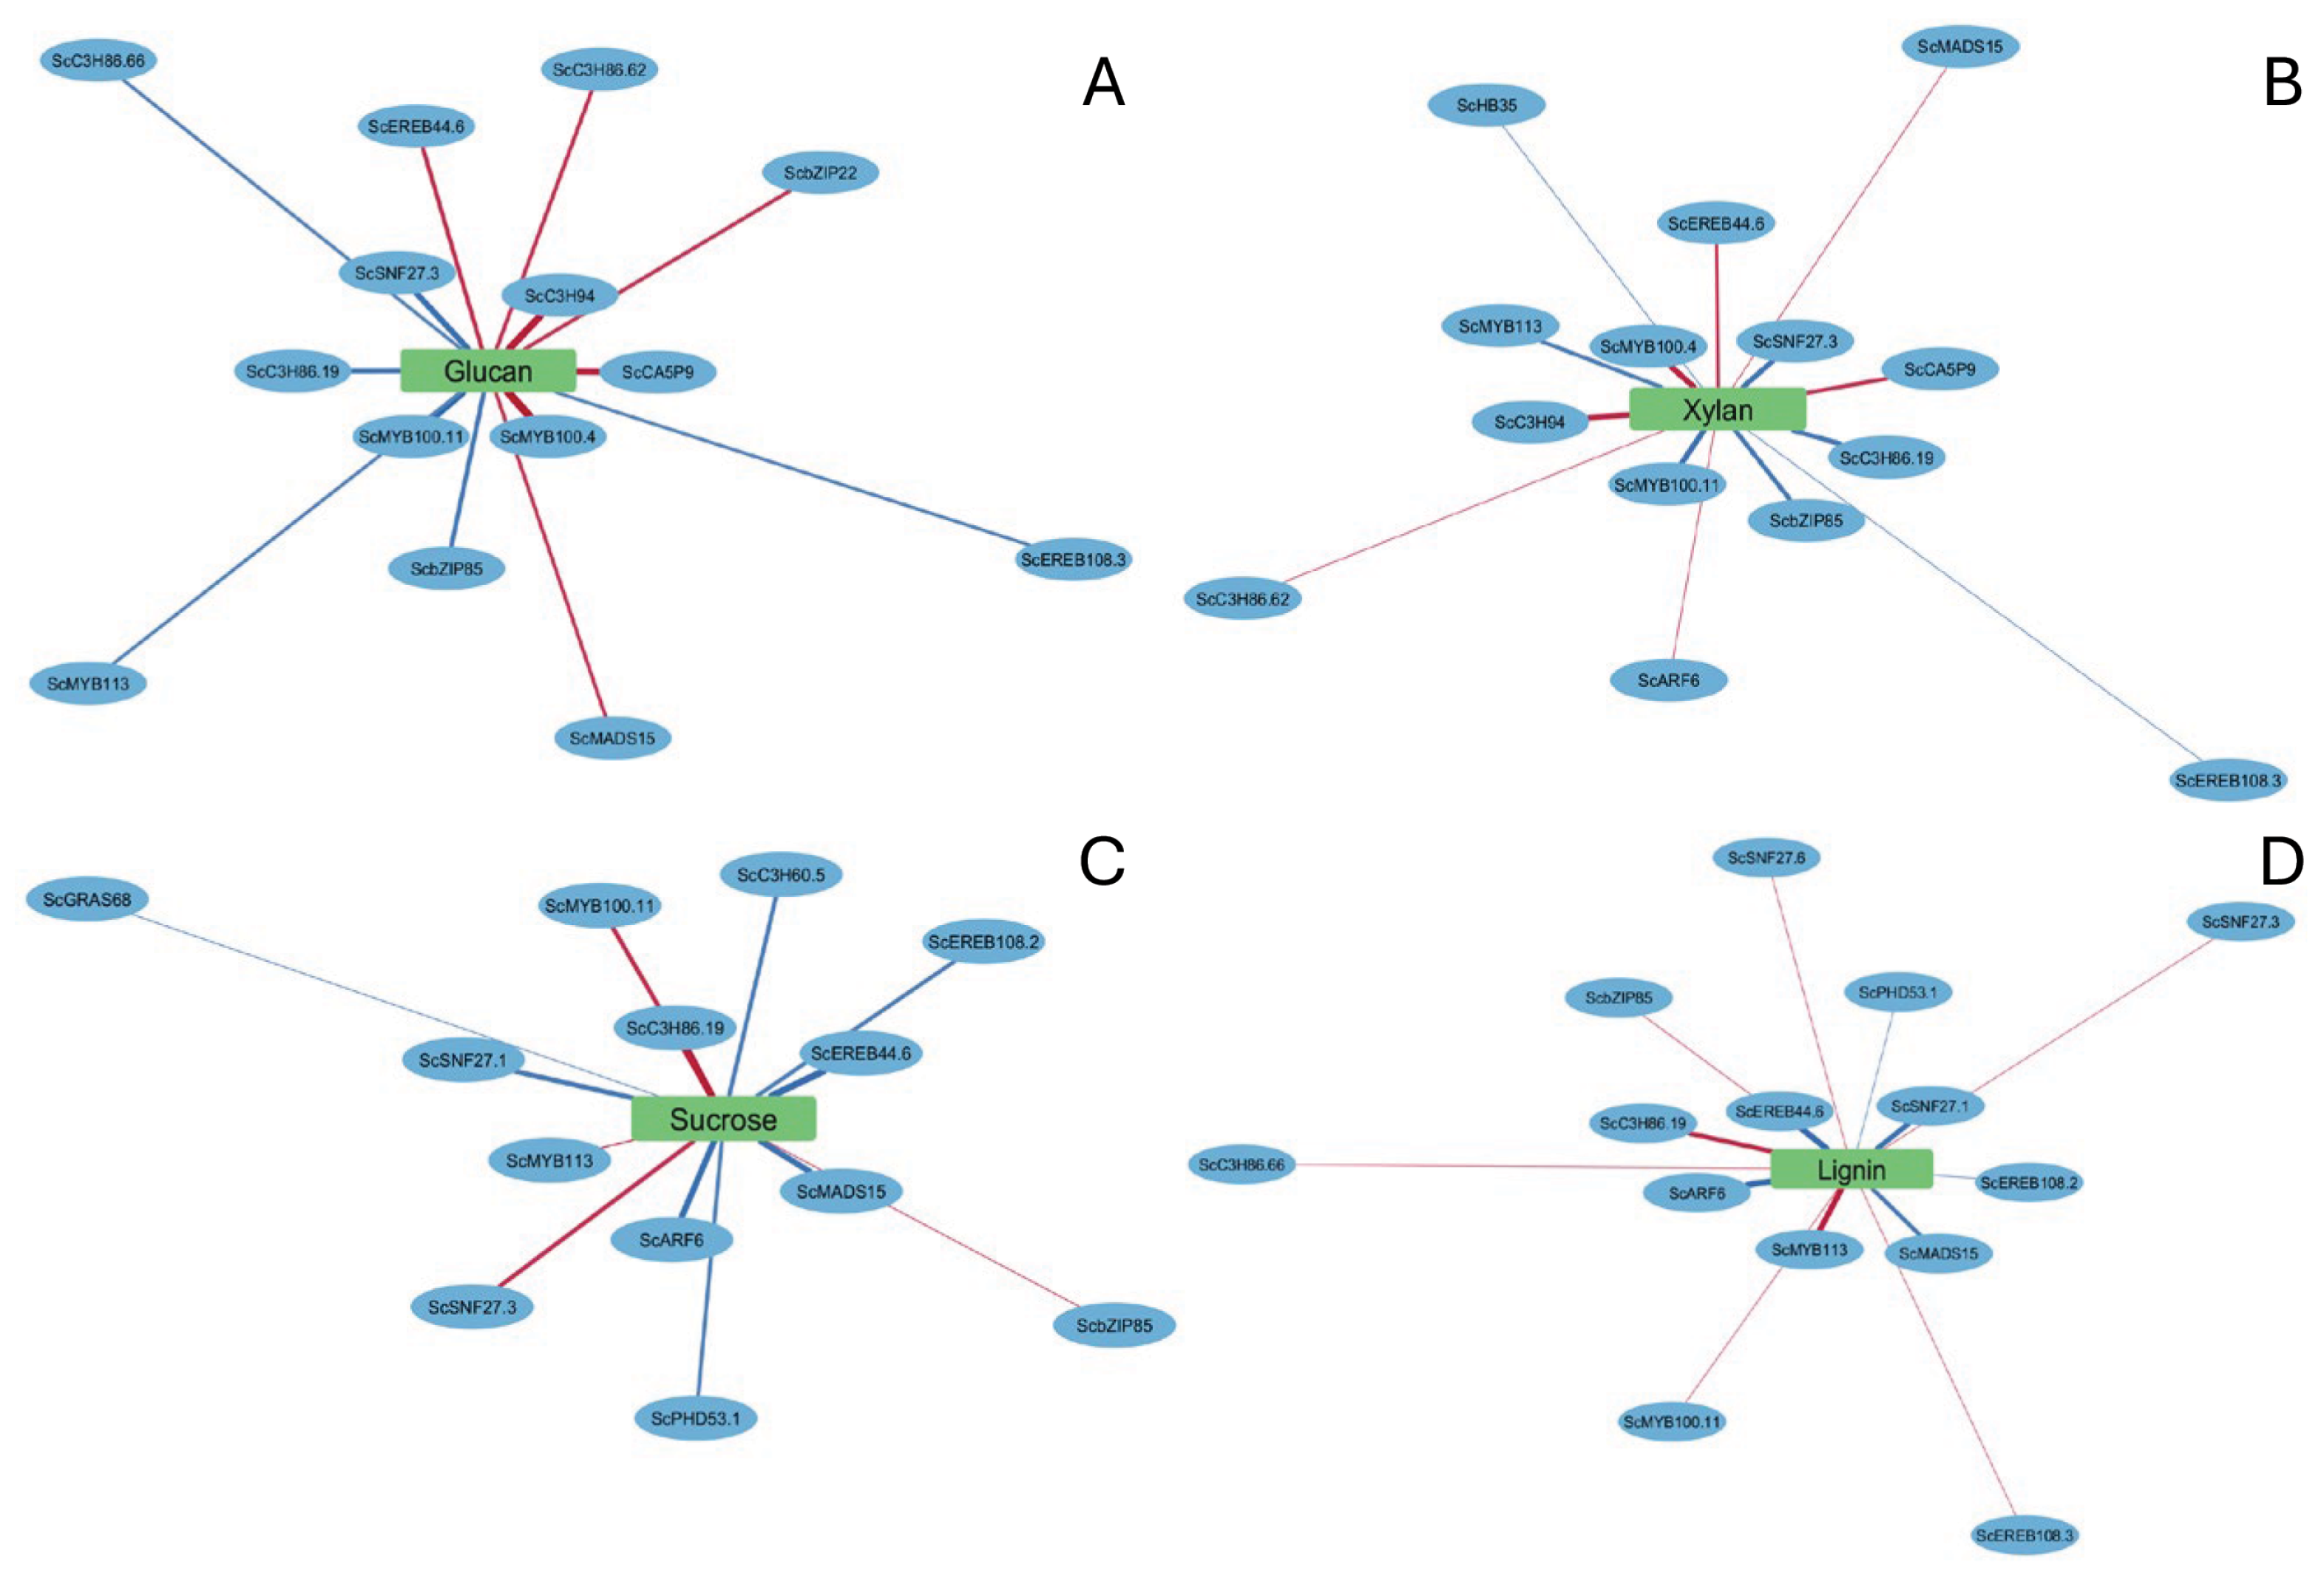
3.6.2. Cell Wall Polysaccharide Cluster: Glucan and Xylan

This cluster involves TFs such as ScEREB108, ScMYB100, and ScSNF27, all of which are candidate regulators of cell wall polysaccharide biosynthesis. Ethylene-responsive factors like ScEREB108 modulate wall modification genes in response to both developmental and environmental signals [47]. Interestingly, ethylene has also been linked to internode elongation and wall remodeling in cereals, acting in tandem with auxin and gibberellin pathways [46]. The overlap of TFs between glucan and xylan supports the idea of a co-regulated transcriptional module dedicated to cellulose and hemicellulose deposition.

3.6.3. Intermediary Metabolism (ROPAL), Sucrose, and Lignin

This cluster associates with TFs such as ScMYB113, ScSNF27.1, and ScARF6, suggesting a module integrating carbon allocation, lignification, intermediary and respiratory metabolism. Lignin biosynthesis is a tightly regulated process that balances structural reinforcement with metabolic cost. MYB and ARF TFs have been shown to coordinate lignin accumulation and growth-defense trade-offs [44]. The placement of sucrose, lignin and ROPAL within this module implies a shared regulatory mechanism where sucrose and lignin accumulation is initiated only when cell wall metabolism and respiratory metabolism is down regalted by decreases in SNF, MYB and ARF6.
The trait-specific TF networks revealed both overlapping and divergent transcriptional controls across biomass accumulation, cell wall polysaccharide deposition, and sucrose storage. Notably, TFs such as ScMYB113 and ScMADS15 showed distinct patterns of association with sucrose and lignin metabolism, aligning with their proposed roles in maturation-phase regulation. The cell wall module, involving ScMYB100, ScEREB108, and ScSNF27, appeared most active during elongation, reinforcing the developmental regulation of secondary wall biosynthesis. Meanwhile, the biomass cluster including ScGRAS76 and ScbZIP85 linked growth traits (internode length and dry weight) to TF expression early in development.
We propose that these TFs are spatially localized within the developing internode tissues—particularly in vascular parenchyma or cortex—where they initiate regulatory cascades that shape growth and carbon allocation at the organ level. This spatial specificity supports a ’butterfly effect’ model, where TF activity in a defined cell population during early development can propagate systemic metabolic changes, such as enhanced sucrose storage or altered wall composition in later stages or adjacent internodes. Such effects are consistent with the observation that internode elongation and biomass accumulation are not temporally aligned, yet are transcriptionally coordinated. These insights provide a mechanistic framework for understanding how local transcriptional events can drive whole-organ metabolic phenotypes.

4. Conclusions

This study provides the first protein-level evidence linking specific transcription factors (TFs) to key biochemical and morphological traits during sugarcane internode development. By profiling TF protein abundance across developmental stages and phenotypes, we reveal dynamic, stage-specific regulatory programs that underpin biomass accumulation and carbon partitioning. Using the Partial Correlation with Information Theory (PCIT) algorithm, we refined trait-centric correlation networks to identify a compact and high-confidence set of TF-trait associations, reducing spurious links observed with Pearson correlation.
The identification of key regulators such as ScMYB113, which showed a strong positive correlation with sucrose accumulation, highlights potential targets for functional validation and translational research. While preliminary, manipulating the expression of ScMYB113—for instance, through overexpression or genome editing—could shift carbon allocation toward sucrose storage. Similarly, ScbZIP85 and ScMADS15, which were positively and negatively correlated with internode length, respectively, may play opposing roles in regulating growth rate and biomass accumulation. Targeted modulation of these transcription factors using gene editing or transgenic approaches could potentially influence culm elongation and, by extension, total biomass production. However, such applications require further validation in controlled systems. Transcription factors have been effectively used to reprogram metabolic and developmental pathways in other plant systems [20,21], supporting their promise as tools for trait enhancement in sugarcane.
This integrative framework combining proteomics, trait analysis, and PCIT-based network modelling offer a robust framework for identifying master regulators of biomass quality and yield. This work offers a robust platform for guiding future efforts in transcriptional reprogramming of bioenergy crops.

Supplementary Materials

The supplementary supporting information can be downloaded at: https://www.mdpi.com/article/10.3390/agronomy15061475/s1. Table S1: Changes in metabolite yield between internodes at different stages of development during fast growth and slow growth). Figure S1: Biomass accumulation rate of fast-and slow-growing sugarcane internodes. Figure S2: Linear regression of dry weight against internode length for two growth phases. “Panels (A) and (B) represent different growth conditions (Fast Growth and Slow Growth)”. “Dotted lines indicate regression fits for early growth (0–150 GDD) and mature phase (150–360 GDD), with corresponding R2 values displayed above each fit. Significance levels: *** (p < 0.001), ** (p < 0.01), * (p < 0.05), n.s. (not significant). Figure S3: Frequency distributions of transcription factor (TF) Proteins and their families. (A) Depicts the frequency of individual protein names, where the count for each TF is determined by its occurrence in the dataset. (B) The distribution of TF families, with frequencies indicating the number of occurrences for each family group. Figure S4: Principal Component Analysis (PCA) plots of transcription factor protein expression profiles under different experimental conditions. (A) PCA colored by Condition, representing experimental treatment groups. (B) PCA colored by Age, highlighting expression changes across developmental stages. (C) PCA colored by Stage, showing distinct clustering of growth phases. Confidence ellipses indicate 95% confidence intervals, illustrating the variance within each group. Figure S5: Heatmap of pairwise Pearson correlations between metabolic traits and protein expression. “Only direct associations based on filtering for significance are shown. Colour indicates strength and direction of correlation”. Figure S6: Connectivity distribution of proteins in the Trait-networks for glucan (A), xylan (B), sucrose (C) and lignin (D). Each panel shows a histogram of the proportion of connections per transcription factor (TF), representing the number of TFS with a given level of connectivity, and a line graph which depicts the cumulative distribution of connectivity. “Only direct associations based on filtering for significance are shown. Colour indicates strength and direction of correlation”.

Author Contributions

F.C.B. and A.M. were involved in the conceptualization and carried out the formal analysis and investigation. F.C.B. wrote and prepared the original draft. A.M. took part in reviewing and editing. All authors have read and agreed to the published version of the manuscript.

Funding

This research was funded by Sugar Research Australia (SRA), the Queensland Government, the Australian Research Council (ARC), and The University of Queensland (UQ).

Data Availability Statement

The proteome and other datasets used and analyzed during the current study are available from the corresponding author on request.

Acknowledgments

We thank Jane Brownlee for overseeing and managing some of the field trials and collecting of phenotype data.

Conflicts of Interest

The authors declare no conflicts of interest.

Abbreviations

The following abbreviations are used in this manuscript:
MODDUSTrinexapac-ethyl
ROPALBiomass-(soluble sugars+hexosans+pentosans+glucoronic-acid)
PCITPartial Correlation with Information Theory
GDD G D D 18 = growing degree days above 37 °C base temperature

References

  1. Duca, D.; Toscano, G. Biomass energy resources: Feedstock quality and bioenergy sustainability. Resources 2022, 11, 57. [Google Scholar] [CrossRef]
  2. Peláez-Samaniego, M.R.; Garcia-Perez, M.; Cortez, L.; Rosillo-Calle, F.; Mesa, J. Improvements of Brazilian carbonization industry as part of the creation of a global biomass economy. Renew. Sustain. Energy Rev. 2008, 12, 1063–1086. [Google Scholar] [CrossRef]
  3. Oh, Y.K.; Hwang, K.R.; Kim, C.; Kim, J.R.; Lee, J.S. Recent developments and key barriers to advanced biofuels: A short review. Bioresour. Technol. 2018, 257, 320–333. [Google Scholar] [CrossRef] [PubMed]
  4. Fridolin, K.; Simone, G.; Nina, E.; Karl-Heinz, E.; Helmut, H.; Marina, F.-K. Growth in global materials use, GDP and population during the 20th century. Ecol. Econ. 2009, 68, 2696–2705. [Google Scholar]
  5. European Commission. The European Green Deal; COM (2019) 640 Final; European Commission: Brussels, Switzerland, 2019; Volume 11, p. 2019.
  6. Muscat, A.; de Olde, E.M.; Ripoll-Bosch, R.; Van Zanten, H.H.E.; Metze, T.A.P.; Termeer, C.J.A.M.; van Ittersum, M.K.; de Boer, I.J.M. Principles, drivers and opportunities of a circular bioeconomy. Nat. Food 2021, 2, 561–566. [Google Scholar] [CrossRef] [PubMed]
  7. Inman-Bamber, G. Sugarcane Yields and Yield-Limiting Processes. In Sugarcane: Physiology, Biochemistry, and Functional Biology; John Wiley & Sons, Ltd.: Hoboken, NJ, USA, 2013. [Google Scholar]
  8. Wang, J.; Nayak, S.; Koch, K.; Ming, R. Carbon partitioning in sugarcane (Saccharum Species). Front. Plant Sci. 2013, 4, 201. [Google Scholar] [CrossRef]
  9. McCormick, A.J.; Cramer, M.D.; Watt, D.A. Sink strength regulates photosynthesis in sugarcane. New Phytol. 2006, 171, 759–770. [Google Scholar] [CrossRef]
  10. Kebrom, T.H.; McKinley, B.; Mullet, J.E. Dynamics of gene expression during development and expansion of vegetative stem internodes of bioenergy sorghum. Biotechnol. Biofuels Bioprod. 2017, 10, 159. [Google Scholar] [CrossRef]
  11. Lingle, S.E. Seasonal Internode Development and Sugar Metabolism in Sugarcane. Crop Sci. 1997, 37, 1222–1227. [Google Scholar] [CrossRef]
  12. Martin, A.; Palmer, W.; Brown, C.; Abel, C.; Lunn, J.; Furbank, R.; Grof, C.P.L. A developing Setaria viridis internode: An experimental system for the study of biomass generation in a C4 model species. Biotechnol. Biofuels 2016, 9, 45. [Google Scholar] [CrossRef]
  13. Botha, F.C.; Scalia, G.; Marquardt, A.; Wathen-Dunn, K. Sink Strength During Sugarcane Culm Growth: Size Matters. Sugar Tech 2023, 25, 1047–1060. [Google Scholar] [CrossRef]
  14. Yanagui, K.; Camargo, E.L.; de Abreu, L.G.F.; Nagamatsu, S.T.; Fiamenghi, M.B.; Silva, N.V.; Carazzolle, M.F.; Nascimento, L.C.; Franco, S.F.; Bressiani, J.A. Internode elongation in energy cane shows remarkable clues on lignocellulosic biomass biosynthesis in Saccharum hybrids. Gene 2022, 828, 146476. [Google Scholar] [CrossRef] [PubMed]
  15. Chen, R.; Fan, Y.; Yan, H.; Zhou, H.; Zhou, Z.; Weng, M.; Huang, X.; Lakshmanan, P.; Li, Y.; Qiu, L.; et al. Enhanced Activity of Genes Associated With Photosynthesis, Phytohormone Metabolism and Cell Wall Synthesis Is Involved in Gibberellin-Mediated Sugarcane Internode Growth. Front. Genet. 2020, 11, 570094. [Google Scholar] [CrossRef] [PubMed]
  16. Mason, P.J.; Hoang, N.V.; Botha, F.C.; Furtado, A.; Marquardt, A.; Henry, R.J. Comparison of the root, leaf and internode transcriptomes in sugarcane (Saccharum spp. Hybrids). Curr. Res. Biotechnol. 2022, 4, 167–178. [Google Scholar] [CrossRef]
  17. Wang, M.; Li, A.M.; Liao, F.; Qin, C.X.; Chen, Z.L.; Zhou, L.; Li, Y.R.; Li, X.F.; Lakshmanan, P.; Huang, D.L. Control of sucrose accumulation in sugarcane (Saccharum spp. Hybrids) involves miRNA-mediated regulation of genes and transcription factors associated with sugar metabolism. GCB Bioenergy 2022, 14, 173–191. [Google Scholar] [CrossRef]
  18. Ferreira, S.S.; Hotta, C.T.; de Carli Poelking, V.G.; Leite, D.C.C.; Buckeridge, M.S.; Loureiro, M.E.; Barbosa, M.H.P.; Carneiro, M.S.; Souza, G.M. Co-expression network analysis reveals transcription factors associated to cell wall biosynthesis in sugarcane. Plant Mol. Biol. 2016, 91, 15–35. [Google Scholar] [CrossRef]
  19. Vélez-Bermúdez, I.C.; Schmidt, W. The conundrum of discordant protein and mRNA expression. Are plants special? Front. Plant Sci. 2014, 5, 619. [Google Scholar]
  20. Broun, P. Transcription factors as tools for metabolic engineering in plants. Curr. Opin. Plant Biol. 2004, 7, 202–209. [Google Scholar] [CrossRef]
  21. Grotewold, E. Transcription factors for predictive plant metabolic engineering: Are we there yet? Curr. Opin. Biotechnol. 2008, 19, 138–144. [Google Scholar] [CrossRef]
  22. Braun, E.L.; Dias, A.P.; Matulnik, T.J.; Grotewold, E. Chapter Five Transcription factors and metabolic engineering: Novel applications for ancient tools. In Recent Advances in Phytochemistry; Romeo, J.T., Saunders, J.A., Mattews, B.F., Eds.; Elsevier: Amsterdam, The Netherlands, 2001; Volume 35, pp. 79–109. [Google Scholar] [CrossRef]
  23. Capell, T.; Christou, P. Progress in plant metabolic engineering. Curr. Opin. Biotechnol. 2004, 15, 148–154. [Google Scholar] [CrossRef]
  24. Reverter, A.; Hudson, N.J.; Nagaraj, S.H.; Pérez-Enciso, M.; Dalrymple, B.P. Regulatory impact factors: Unraveling the transcriptional regulation of complex traits from expression data. Bioinformatics 2010, 26, 896–904. [Google Scholar] [CrossRef]
  25. Hudson, N.J.; Reverter, A.; Dalrymple, B.P. Beyond differential expression: The quest for causal mutations and effector molecules. BMC Genom. 2009, 10, 83. [Google Scholar] [CrossRef]
  26. Botha, F.C.; Marquardt, A. Metabolic Control of Sugarcane Internode Elongation and Sucrose Accumulation. Agronomy 2024, 14, 1487. [Google Scholar] [CrossRef]
  27. Berding, N.; Marston, D.H. Operational validation of the efficacy of spectracane, a high-speed analytical system for sugarcane quality components. In Proceedings of the 2010 Conference of the Australian Society of Sugar Cane Technologists, Bundaberg, QLD, Australia, 11–14 May 2010; Australian Society of Sugar Cane Technologists: Marian, QLD, Australia, 2010; pp. 445–459. [Google Scholar]
  28. Pisanó, I.; Gottumukkala, L.; Hayes, D.J.; Leahy, J.J. Characterisation of Italian and Dutch forestry and agricultural residues for the applicability in the bio-based sector. Ind. Crop. Prod. 2021, 171, 113857. [Google Scholar] [CrossRef]
  29. Sluiter, A.; Hames, B.; Ruiz, R.; Scarlata, C.; Sluiter, J.; Templeton, D.; Crocker, D. Determination of structural carbohydrates and lignin in biomass. Lab. Anal. Proced. 2008, 1617, 1–16. [Google Scholar]
  30. Hayes, D.J. Development of near infrared spectroscopy models for the quantitative prediction of the lignocellulosic components of wet Miscanthus samples. Bioresour. Technol. 2012, 119, 393–405. [Google Scholar] [CrossRef]
  31. Bhagia, S.; Nunez, A.; Wyman, C.E.; Kumar, R. Robustness of two-step acid hydrolysis procedure for composition analysis of poplar. Bioresour. Technol. 2016, 216, 1077–1082. [Google Scholar] [CrossRef]
  32. Yang, S.; Logan, J.; Coffey, D. Mathematical formulae for calculating the base temperature for growing degree days. Agric. For. Meteorol. 1995, 74, 61–74. [Google Scholar] [CrossRef]
  33. Marquardt, A.; Henry, R.J.; Botha, F.C. Effect of sugar feedback regulation on major genes and proteins of photosynthesis in sugarcane leaves. Plant Physiol. Biochem. 2021, 158, 321–333. [Google Scholar] [CrossRef] [PubMed]
  34. Love, M.I.; Huber, W.; Anders, S. Moderated estimation of fold change and dispersion for RNA-seq data with DESeq2. Genome Biol. 2014, 15, 550. [Google Scholar] [CrossRef] [PubMed]
  35. Gray, J.; Chu, Y.H.; Abnave, A.; Cano, F.G.; Lee, Y.S.; Percival, S.; Jiang, N.; Grotewold, E. GRASSIUS 2.0: A gene regulatory information knowledgebase for maize and other grasses. Curr. Plant Biol. 2024, 40, 100396. [Google Scholar] [CrossRef]
  36. Subramanian, A.; Tamayo, P.; Mootha, V.K.; Mukherjee, S.; Ebert, B.L.; Gillette, M.A.; Paulovich, A.; Pomeroy, S.L.; Golub, T.R.; Lander, E.S. Gene set enrichment analysis: A knowledge-based approach for interpreting genome-wide expression profiles. Proc. Natl. Acad. Sci. USA 2005, 102, 15545–15550. [Google Scholar] [CrossRef]
  37. Benjamini, Y.; Hochberg, Y. On the adaptive control of the false discovery rate in multiple testing with independent statistics. J. Educ. Behav. Stat. 2000, 25, 60–83. [Google Scholar] [CrossRef]
  38. Watts, D.J.; Strogatz, S.H. Collective dynamics of ‘small-World’ Networks. Nature 1998, 393, 440–442. [Google Scholar] [CrossRef]
  39. Python Software Foundation. Python Language Reference, version 3.8.12. Technical Report. Python Software Foundation: Wilmington, DE, USA, 2024.
  40. Lingle, S.E.; Thomson, J.L. Sugarcane Internode Composition During Crop Development. BioEnergy Res. 2012, 5, 168–178. [Google Scholar] [CrossRef]
  41. De Souza, A.P.; Leite, D.C.; Pattathil, S.; Hahn, M.G.; Buckeridge, M.S. Composition and structure of sugarcane cell wall polysaccharides: Implications for second-generation bioethanol production. BioEnergy Res. 2013, 6, 564–579. [Google Scholar] [CrossRef]
  42. Chen, L.; Dou, P.; Li, L.; Chen, Y.; Yang, H. Transcriptome-wide analysis reveals core transcriptional regulators associated with culm development and variation in Dendrocalamus sinicus, the strongest woody bamboo in the world. Heliyon 2022, 8, e12600. [Google Scholar] [CrossRef]
  43. Langfelder, P.; Horvath, S. WGCNA: An R package for weighted correlation network analysis. BMC Bioinform. 2008, 9, 559. [Google Scholar] [CrossRef]
  44. Xie, L.; Wen, D.; Wu, C.; Zhang, C. Transcriptome analysis reveals the mechanism of internode development affecting maize stalk strength. BMC Plant Biol. 2022, 22, 49. [Google Scholar] [CrossRef] [PubMed]
  45. Becker, A.; Theißen, G. The major clades of MADS-box genes and their role in the development and evolution of flowering plants. Plant Mol. Evol. 2003, 29, 464–489. [Google Scholar] [CrossRef]
  46. Zhang, Y.; Wang, Y.; Ye, D.; Xing, J.; Duan, L.; Li, Z.; Zhang, M. Ethephon-regulated maize internode elongation associated with modulating auxin and gibberellin signal to alter cell wall biosynthesis and modification. Plant Sci. 2020, 290, 110196. [Google Scholar] [CrossRef] [PubMed]
  47. Ohme-Takagi, M.; Shinshi, H. Ethylene-inducible DNA binding proteins that interact with an ethylene-responsive element. Plant Cell 1995, 7, 173–182. [Google Scholar] [CrossRef] [PubMed]
Figure 1. Internode sampling and developmental dynamics under fast and slow growth conditions. (A) Diagram of sugarcane culms illustrating the positions of sampled internodes (F2, F4, F6 and S2, S4, S6) from fast-growing and slow-growing phenotypes. Growth rate modulation was achieved via application of MODDUS (Trinexapac-ethyl). Leaf +1 is shown to indicate the developmental reference point. (B) Internode length over time ( G D D 18 ) for fast- and slow-growing sugarcane phenotypes, showing sigmoidal elongation kinetics. (C) Dry weight accumulation over time in the same internodes, highlighting differential biomass accumulation dynamics between phenotypes. Data represent mean ± standard deviation ( n = 4 biological replicates). Lines represent sigmoidal fitted curves. G D D 18 = growing degree days above 18 °C base temperature.
Agronomy 15 01475 g001
Figure 2. Bar chart showing carbon flux into different metabolic pools as a fraction of total biomass gain in internodes at three stages of development (2,4 and 6) during fast growth (F) and slow growth (S). Peak growth rate 1130   D D 18 after planting and slow growth by application of MODDUS. ROPAL is defined as the two reducing sugars (glucose and fructose), organic acids, protein, amino acids, and all other not defined as traits in this study. Error bars indicate the standard deviation.
Agronomy 15 01475 g002
Figure 3. Visualization of trait correlations. (A) Heatmap of pairwise Spearman correlation coefficients among biochemical traits. Each cell displays the correlation value and is coloured according to statistical significance: purple for p < 0.001, green for p < 0.01. (B) Network graph where nodes represent traits and edges denote significant correlations (absolute r > 0.4). Edge color indicates the direction of correlation (blue = positive, red = negative), and edge thickness scales with the magnitude of the correlation coefficient.
Agronomy 15 01475 g003
Figure 4. Trait-centric correlation networks of transcription factors associated with major cell wall and metabolic traits. Network plots depict significant correlations (r ≥ 0.6, p < 0.05) between transcription factors and four key traits: (A) Glucan, (B) Xylan, (C) Sucrose, and (D) Lignin. Trait nodes are represented as green rectangles and transcription factors as blue nodes. Edge colors denote correlation direction: blue for positive and red for negative correlations. Edge thickness and labels reflect the strength of the correlation coefficient.
Agronomy 15 01475 g004
Figure 5. Correlation network showing significant transcription factors (TFs) associated with biochemical and morphological traits in sugarcane. Blue ellipses represent TFs, while green rectangles denote traits including cell wall components (Glucan, Xylan, Lignin), intermediary metabolism (ROPAL), the storage compound (Sucrose), and morphological traits (dry weight, length). Edges represent significant Pearson correlations (r ≥ 0.6, p < 0.05). Blue edges indicate positive correlations and red edges indicate negative correlations. The numerical values on edges reflect the correlation coefficients.
Agronomy 15 01475 g005
Figure 6. Boxplots showing the expression profiles of the 15 transcription factors that are significanly linked to the seven major internode traits, across six phenotypic conditions (C2, C4, C6, S2, S4, and S6). Expression values were Z-score normalised and grouped by phenotype. Each subplot represents one transcription factor, highlighting differential expression patterns across the phenotypes. Values represent the mean of four biological replicates.
Agronomy 15 01475 g006
Table 1. Changes in metabolite profiles between internodes at different stages of development during fast growth and slow growth.
TraitPhenotype 1Young 2Mature 3
Δ Mean p-adj Tukey Δ Mean p-adj Tukey Δ Mean p-adj Tukey 4
Growth Traits
  Length (mm internode 1 )−50.81<0.001** 458.1<0.001**−1.281ns
  Dry weight (g internode 1 )−11.2<0.001**7.58<0.001**4.020.03**
Water-Soluble Sugars (mg g 1 )
  Total sugar31.590.1789ns182.46<0.001**−40.680.192ns
  Sucrose40.490.2794ns241.43<0.001**31.010.6912ns
  Cellobiose−0.020.9413ns2.86<0.001**−1.72<0.001**
  Glucose−4.680.5813ns−32.07<0.001**−38.3<0.001**
  Fructose−4.030.5764ns−28.49<0.001**−31.89<0.001**
  Galactose−0.140.3249ns−1.15<0.001**0.230.7982ns
  Arabinose−0.020.2764ns−0.13<0.001**−0.010.9997ns
Cell Wall Sugars (mg g 1 )
  Total sugar−23.280.0737ns−83.81<0.001**−56.64<0.001**
  Hexosans−17.020.0764ns−61.57<0.001**−45.28<0.001**
  Glucan−16.760.0759ns−60.17<0.001**−45.42<0.001**
  Mannan−0.100.1828ns−0.430.0012**0.060.9992ns
  Galactan−0.170.3208ns−0.970.0046**0.071ns
  Pentosans−6.360.0739ns−21.09<0.001**−9.640.0556ns
  Xylan−5.280.0952ns−18.54<0.001**−9.850.0712ns
  Arabinan−0.960.0792ns−3.51<0.001**−1.600.1171ns
  Rhamnan−0.020.5405ns−0.190.0011**0.090.5463ns
  Glucuronic acid0.310.4683ns1.290.5724ns1.050.7981ns
  Hemicellulose 5−6.250.0856ns−22.24<0.001**−11.360.0311**
Lignin (mg g 1 )
  Klason lignin2.850.6771ns21.86<0.001**43.48<0.001**
  AS lignin−0.360.4546ns−3.39<0.001**2.700.001**
Other (mg g 1 )
  ROPAL 6−22.70.4576ns−170.9<0.001**−6.291ns
1 Comparison between fast- and slow-growing sugarcane. 2 Comparison between internodes 2 and 6. 3 Comparison between internodes 8 and 12. 4 ** indicates statistically significant differences at p < 0.05 based on Tukey HSD; ns = not significant. 5 Calculated as the total of cell wall sugars and lignin. 6 Calculated as total biomass minus the sum of water solubles, cell wall sugars, and lignin.
Table 2. Percentage increase in total biomass components in the internode after completion of elongation. Fast growth occurs around 1130   D D 18 after planting and slow growth was achieved by application of MODDUS.
TraitFast_GrowthSlow_Growthp-Value 1Significance
Dry weight27.1521.460.03*
glucan14.5212.860.47ns
hemicellulose12.248.080.06ns
lignin53.7451.920.42ns
sucrose71.7652.33.20 × 10 5 ***
1 * = p < 0.05, *** = p < 0.001; ns = not significant.
Table 3. Transcription factors associated with the main traits in the sugarcane culm.
TraitPositive CorrelationNegative Correlation
TF 1 Correlation p-Value TF 1p-Value
LengthScMYB1000.7749.07 × 10 6 ScC3H86−0.5812.92 × 10 3
ScbZIP850.7472.76 × 10 5 ScbHLH60−0.6181.29 × 10 3
ScC3H860.6832.34 × 10 4 ScSNF27−0.6368.30 × 10 4
ScCAMTA40.6535.45 × 10 4 ScSNF5−0.6634.12 × 10 4
ScGRAS760.6299.84 × 10 4 ScMADS15−0.7383.79 × 10 5
ScEREB44−0.7101.01 × 10 4
Dry weightScC3H860.5962.11 × 10 3 ScMADS15−0.7502.41 × 10 5
ScGRAS760.6241.11 × 10 3 ScbHLH60−0.6614.43 × 10 4
ScCAMTA40.6378.12 × 10 4 ScMYB100−0.6329.15 × 10 4
ScC3H860.7324.72 × 10 5 ScSNF27−0.6201.24 × 10 3
ScCA5P80.7551.99 × 10 5
ScNAC660.7591.70 × 10 5
GlucanScMYB1000.8111.52 × 10 6 ScEREB44−0.5485.57 × 10 3
ScC3H940.7787.71 × 10 6 ScEREB108−0.6251.10 × 10 3
ScCA5P90.7364.09 × 10 5 ScC3H86−0.6319.39 × 10 4
ScbZIP220.6446.88 × 10 4 ScSNF27−0.7314.93 × 10 5
ScEREB1080.5307.78 × 10 3
ScBZR50.5278.11 × 10 3
XylanScEREB1080.5564.76 × 10 3 ScSNF27−0.7001.40 × 10 4
ScBZR50.5554.87 × 10 3 ScbZIP85−0.6792.66 × 10 4
ScC3H860.5268.33 × 10 3 ScHB35−0.6131.44 × 10 3
SucroseScMYB1130.8247.58× 10 7 ScC3H60−0.6614.35 × 10 4
ScEREB1080.5932.25 × 10 3 ScSNF27−0.6812.49 × 10 4
ScARF6−0.7334.61 × 10 5
LigninScEREB44−0.7551.99 × 10 5
ScARF6−0.7532.17 × 10 5
ScSNF27−0.7187.83 × 10 5
ROPALScARF60.7129.57 × 10 5 ScMYB113−0.8052.10 × 10 6
ScSNF270.6792.68 × 10 4
ScGRAS680.5703.64 × 10 3
ScNAC660.5624.29 × 10 3
ScSNF270.5396.62 × 10 3
1 Transcription factor. Name based on homology with sugarcane sequences in GRASSIUS.
Disclaimer/Publisher’s Note: The statements, opinions and data contained in all publications are solely those of the individual author(s) and contributor(s) and not of MDPI and/or the editor(s). MDPI and/or the editor(s) disclaim responsibility for any injury to people or property resulting from any ideas, methods, instructions or products referred to in the content.

