Article

Monocropping Degrades Soil Quality Index and Soil Multifunctionality Compared to Natural Grasslands and Restored Shrubland in China’s Qilian Mountains (Based on Single-Year Sampling)

1
Pratacultural College, Gansu Agricultural University, Lanzhou 730070, China
2
Key Laboratory of Forage Gerplasm Innovation and New Variety Breeding of Ministry of Agriculture and Rural Affairs (Co-Sponsored by Ministry and Province), Lanzhou 730070, China
*
Author to whom correspondence should be addressed.
Agronomy 2025, 15(6), 1461; https://doi.org/10.3390/agronomy15061461
Submission received: 6 May 2025 / Revised: 10 June 2025 / Accepted: 11 June 2025 / Published: 16 June 2025
(This article belongs to the Special Issue The Impact of Land Use Change on Soil Quality Evolution)

Abstract

As the ecological security barrier in northwestern China, understanding how natural grassland (NG) utilization pattern transformation in the northern Qilian foothills affects soil quality and ecosystem multifunctionality supports regional ecosystem management. The study compared soil chemical and biological properties, soil quality index (SQI), and soil ecosystem multifunctionality (SMF) among four grassland utilization patterns in the northern foothills of the Qilian Mountains, Gansu Province, China. Soil samples were collected in early October 2024 following crop harvest from the following systems: traditionally grazed NG, monocropping Hordeum vulgare (barley; MHV), monocropping Avena sativa (oat; MAS), and Hippophae rhamnoides shrubland (sea buckthorn; HRS). The results showed that compared with NG, SQI was decreased by 52.69% (p = 0.000059) under MHV treatment and by 18.78% (p = 0.03) under MAS treatment, while HRS did not have a significant reduction in SQI. Under the three patterns of transformative utilization of NG, SMF followed the order of HRS (0.11) > MAS (−0.06) > MHV (−0.51). Overall, the establishment of restoration vegetation (sea buckthorn shrubland) retained SQI under different grassland utilization patterns in the study area, whereas long-term monocropping resulted in significant reductions in SQI and SMF due to compromised chemical and biological properties.

1. Introduction

Soils are vital for human life, as they support ecosystem biodiversity and functions [1]. Its quality serves as a critical factor in sustaining the stability of the global biosphere [2], and its health and fertility directly regulate ecosystem productivity and species survival [3]. Global soils face multiple anthropogenic threats, including cropland reclamation, artificial afforestation, settlement expansion, etc. [4]. These activities have compromised global soil quality stability, and the health status of soil urgently requires attention.
Soil quality refers to the sustained ability of soil to maintain biological productivity; improve air and water quality; and maintain the health of animals, plants, and humans as an important life system within the boundaries of ecosystems and land use [5]. The soil quality index (SQI) is currently the most widely used comprehensive indicator in soil quality evaluation systems [6]. This index systematically incorporates interactions among measured values, weighting factors, and evaluation parameters [7,8]. Additionally, the SQI calculation process identifies critical parameters from the total data set (TDS) to establish the minimum data set (MDS), effectively minimizing data redundancy through this selection methodology [9]. However, selecting the MDS that contains key soil information remains a challenge in soil quality assessment. Principal component analysis (PCA), a multivariate analysis method for reducing data set dimensionality, is commonly used for MDS screening. Many scholars combine it with correlation analysis to identify MDS components and assess soil quality across different land-use types, thus simplifying the soil quality assessment process [10,11,12].
Ecosystem multifunctionality (EMF) refers to the capacity of a specific ecological system to simultaneously sustain multiple ecosystem functions and service provisions across spatiotemporal dimensions through synergistic interactions between biotic and abiotic components [13,14,15]. As a critical element in maintaining the dynamic stability of ecosystem functions, soil multifunctionality (SMF) is increasingly used to describe the multifunctionality of entire ecosystems [16]. However, definitions and interpretations of SMF vary across disciplines, influenced by research objectives and study systems. The broad concept of SMF encompasses a wide range of ecological processes (e.g., primary productivity, nutrient cycling, water regulation/purification, carbon sequestration/climate regulation, biodiversity habitat provision, pest/disease management) [15,17], whereas the narrow concept focuses specifically on material cycles such as carbon, nitrogen, and phosphorus [18].
Existing review studies (1980–2022) clearly indicate that transformations in grassland use, particularly the conversion of natural grassland to cropland or forestland, often lead to a decline in grassland ecosystem multifunctionality and weaken the provision of multiple key ecosystem services [19]. Although the current understanding and quantification indexes of SMF are still not unified, the vast majority of scholars have adopted indicators related to material cycles (carbon, nitrogen and phosphorus cycles) for quantification [20]. Among them, indicators related to soil extracellular enzyme activity and soil nutrients are more frequently used, and indicators related to soil microbial nutrient content and other aspects are also involved, which to some extent provide a basis for comparison among different studies [20]. Given the high sensitivity of soil chemical and biological indicators in characterizing these functional changes, along with the prevalence of natural grassland use transformations, this study proposes the core hypothesis based on this theoretical foundation. Specifically, the transformation of natural grassland use will induce significant alterations in key chemical indicators and biological indicators related to soil carbon, nitrogen, and phosphorus cycling, thereby exerting a profound impact on the maintenance of soil ecosystem multifunctionality.
The Qilian Mountains are located on the eastern margin of the Qinghai-Tibet Plateau in China, adjacent to the Mongolian Plateau and the Loess Plateau [21]. Their unique geographical position establishes them as a critical ecological protective barrier in northwestern China. The northern foothills of the mountains host vast grassland ecosystems that sustain extensive agricultural and pastoral activities within the region [22]. This agropastoral ecotone intensifies the interactions between human activities and natural processes. Since the last century, due to the growth of supplementary feeding for livestock and grain demand, the utilization patterns of natural grasslands in this region have undergone significant changes. Traditional grazing-based practices have progressively shifted toward agropastoral transition zones and intensive agricultural systems in certain areas [23]. These land-use changes may exert profound impacts on soil health within plateau ecosystems. However, research on the impacts of natural grassland use pattern transformations on soil quality and ecosystem multifunctionality remains lacking. Particularly, there are currently no studies that systematically and simultaneously analyze the comprehensive impacts of use pattern transformations on both aspects in the Qilian Mountain region. Therefore, this study, using traditionally grazed natural grassland (NG) as a control, focuses on investigating the impacts of three converted land-use types in the northern foothills of the Qilian Mountains—monocropping Hordeum vulgare (barley; MHV), monocropping Avena sativa (oat; MAS), and Hippophae rhamnoides shrubland (sea buckthorn; HRS)—on soil chemical/biological properties, SQI, and SMF.
The objectives are to (a) quantify the synergistic variation patterns of soil chemical properties and biological characteristics under different land-use; (b) construct a comprehensive evaluation system for soil quality based on key indicators; (c) elucidate the impacts of land-use conversion on SMF; and (d) identify the critical driving factors of SQI and SMF.

2. Materials and Methods

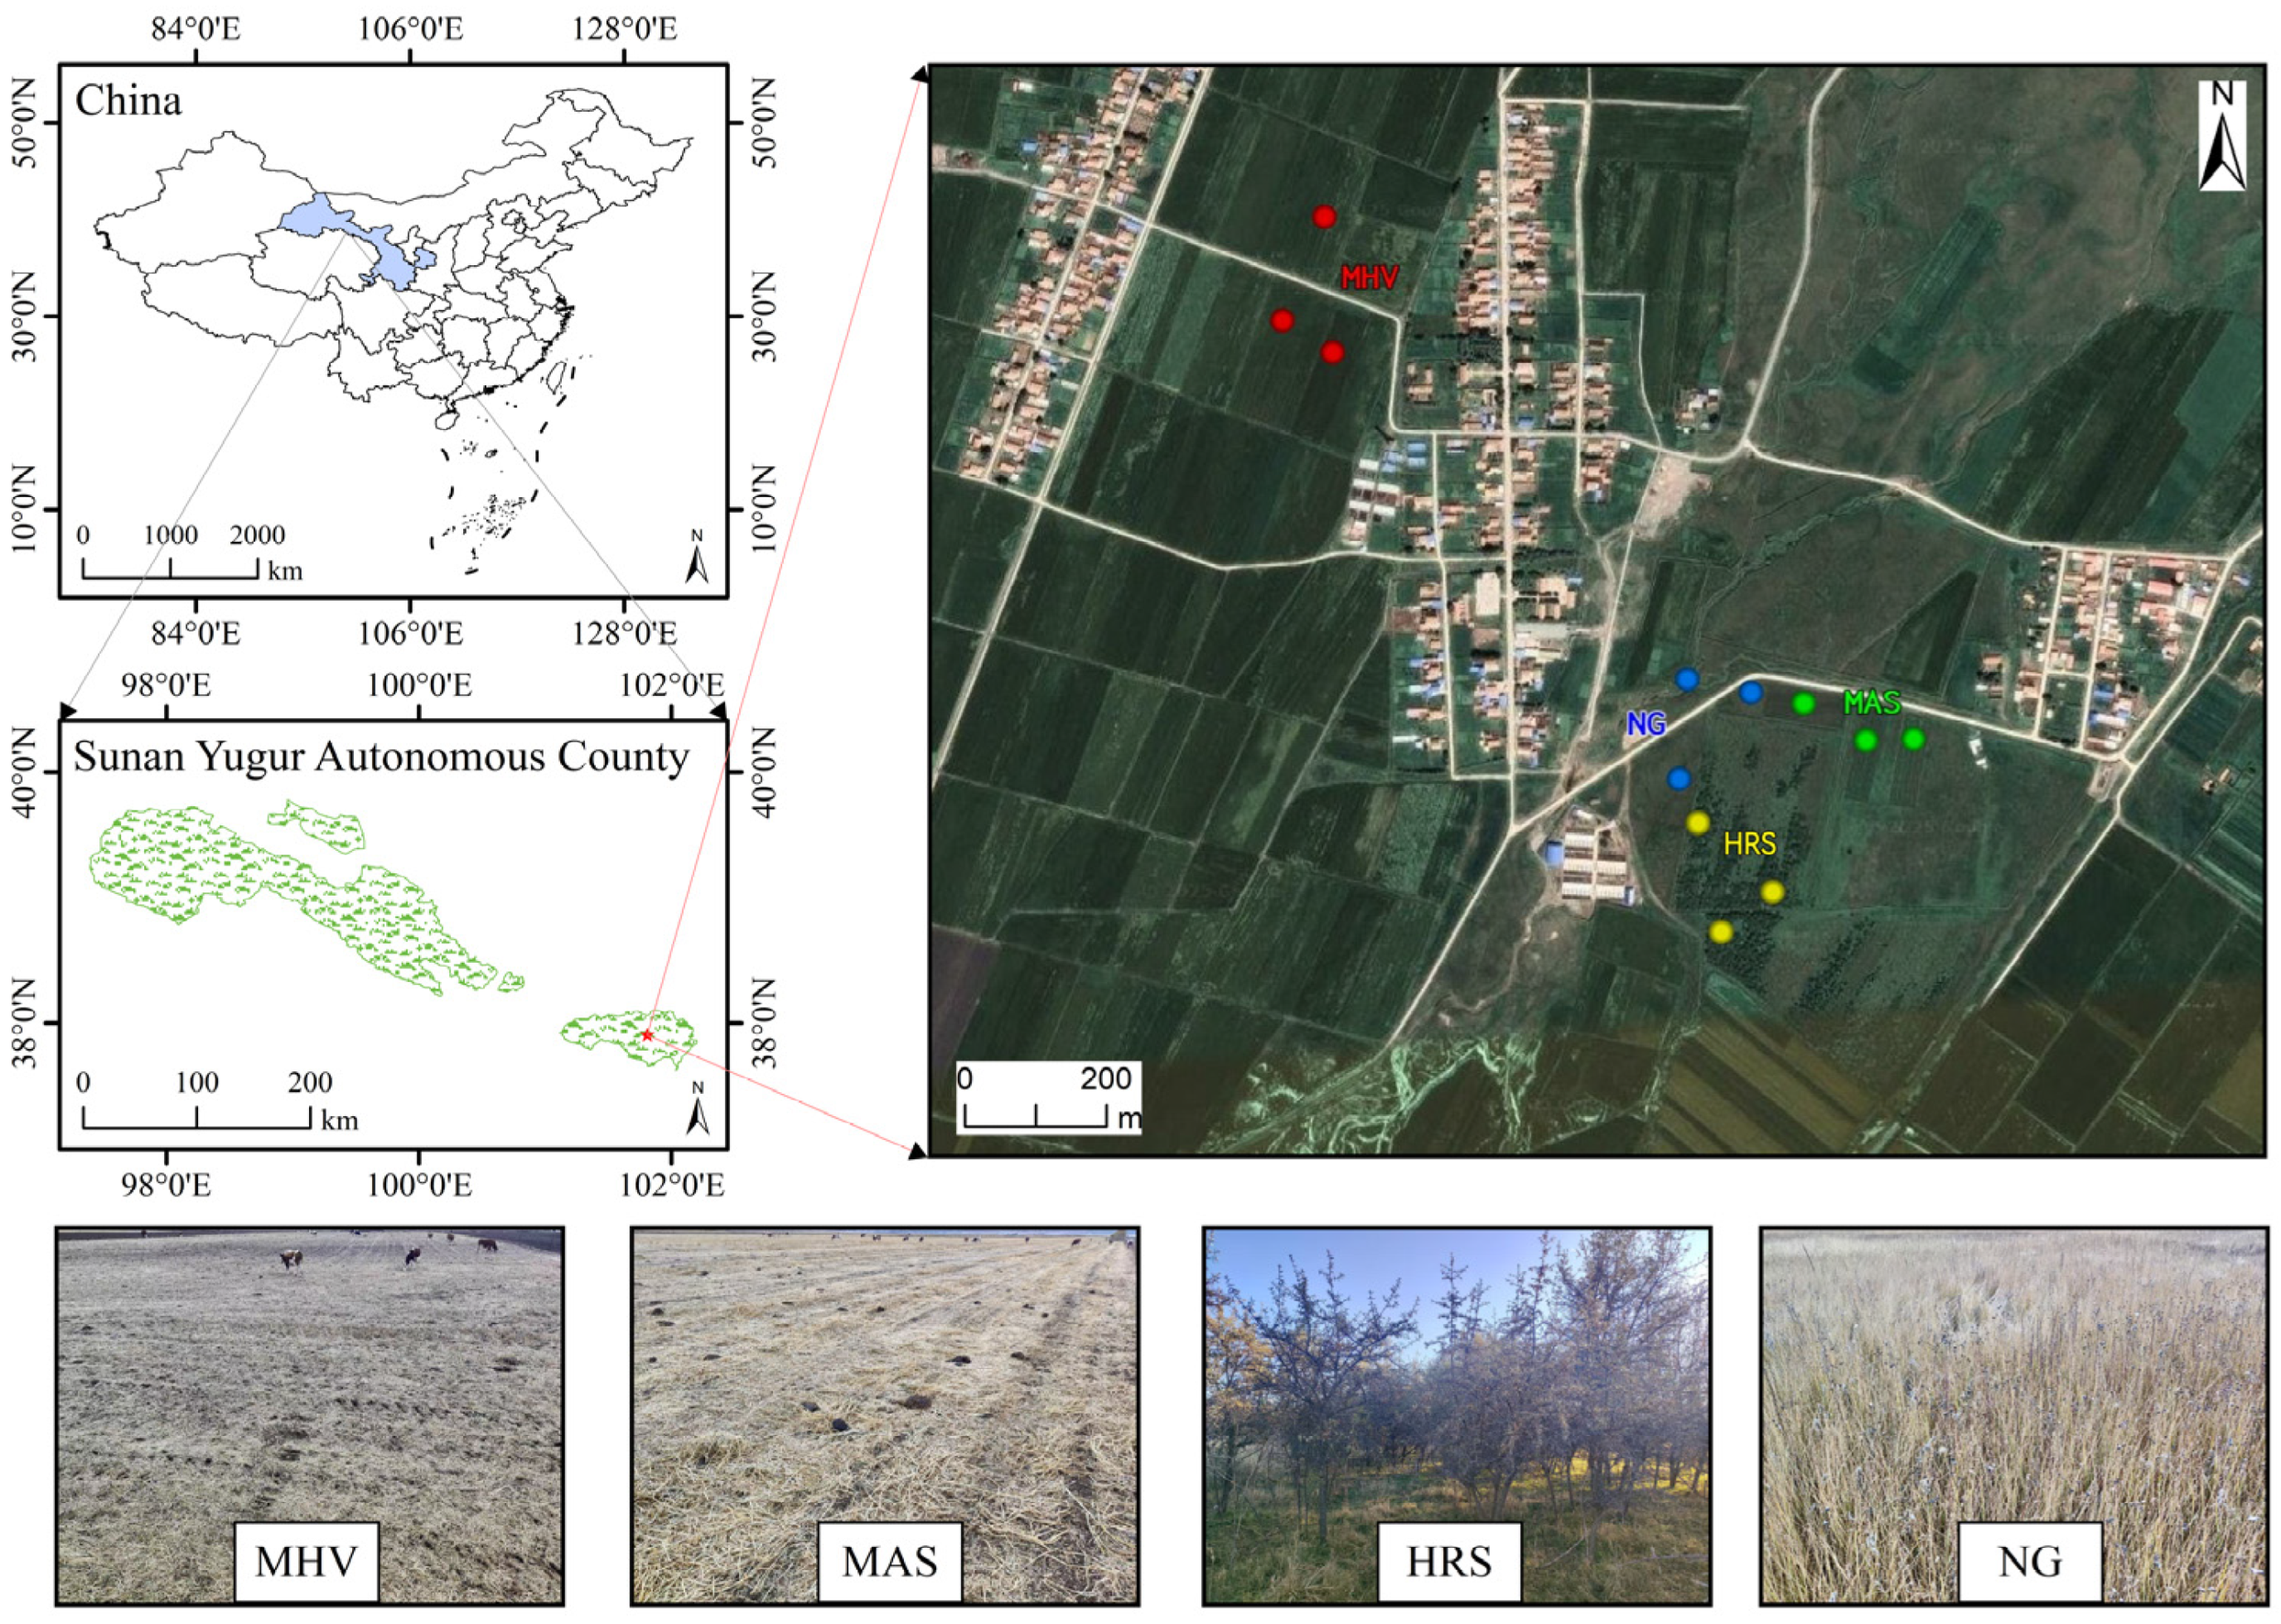
2.1. Overview of the Study Area

The study area is located in Huangcheng Town, Sunan Yugur Autonomous County, Zhangye City, Gansu Province, China (101°48′34″ E, 37°54′35″ N) (Figure 1). The experimental site is situated at an elevation of 2590 m above sea level, characterized by a typical alpine semi-arid climate. The region has a mean annual temperature of 0–1 °C, with a January average temperature of −12 °C and a July average temperature of 13 °C (National Tibetan Plateau Data Center, China). The annual average growing season spans 120 days, with an average frost-free period of 95 days. Annual precipitation averages 260 mm, primarily concentrated from June to September [24]. The study area is located on a flat plain (slope < 2°), with no significant microtopographic variation observed at sampling sites. According to the World Reference Base for Soil Resources, the soils in the study area are classified as Calcic Chernozem (Loess) [25,26], and the primary land-use types include grassland, cropland, and woodland.

2.2. Experimental Design

The experimental setup used four-season open grazing NG as the control group, and three treatment groups, including MHV, MAS, and HRS. The croplands in the study area have been continuously used for agricultural production since their initial reclamation in the mid-1950s. With the intensification of agriculture, these lands transitioned to mechanized cultivation, and later shifted to monocropping systems dominated by forage production due to expanding livestock husbandry and winter supplemental feeding demands. Replacing the former diversified rotation system that included barley, oat, and cash vegetable crops. Both crops were applied with diammonium phosphate as base fertilizer (225 kg ha−1) before sowing and irrigated appropriately based on drought conditions of the year. After harvest, the residues are provided for cattle and sheep to graze. Sea buckthorn shrubland was established after 2000 in response to the national Grain for Green Program for purposes of windbreak and sand fixation as well as soil and water conservation. With shrub coverage of approximately 50% and height around 3 m, it continues to support free-range grazing functions due to the developed understory herbaceous layer. A table comparing the details of the treatment groups is shown below (Table 1).

2.3. Soil Sample Collection and Determination

2.3.1. Sample Collection

In October 2024, soil samples were collected from four types of plots at 0–10 cm, 10–20 cm, and 20–30 cm soil layers. These depths were chosen to capture the surface horizon, which is highly influenced by vegetation cover and management practices, as well as to assess subsurface conditions and the vertical distribution of soil properties. Each treatment selected three replicated sub-plots. Within each sub-plot, an ‘S’-shaped sampling method was used to collect nine undisturbed soil cores per layer with a soil auger of 3.5 cm inner diameter to eliminate microtopographic variation. The undisturbed soils were mixed on-site by layer and sieved through a 2-mm-diameter sieve. The samples were divided into two parts: one part was immediately placed in insulated boxes with ice packs for preservation, and the other part was air-dried in the laboratory. A total of 36 soil samples were obtained (4 plot types × 3 sub-plots × 3 depths), and related indicators were measured as soon as possible.

2.3.2. Soil Property Determination

Soil pH with a soil-to-water ratio of (2.5:1) and electrical conductivity (EC) (with a soil-to-water ratio of 5:1) were determined using a digital multi-parameter analyzer (DZS-760F-A, INESA, Shanghai, China) [27].
Soil organic matter (SOM) content was measured using the potassium dichromate oxidation method [28]. Total carbon (TC) and soil organic carbon (SOC) were analyzed using a Multi N/C 2100S and HT1300 Total Carbon/Organic Carbon Analyzer (Analytik Jena AG, Jena, Germany). The Kjeldahl method [28] was applied to determine total nitrogen (TN). Ammonium nitrogen (AN) and nitrate nitrogen (NN) concentrations were measured with a San++ Compact continuous flow analyzer (Skalar Analytical B.V., Breda, Netherlands). For soil total phosphorus (TP), the alkali fusion–Mo-Sb antispectrophotometric method was applied [28]. Available phosphorus (AP) was extracted following the 0.5 mol L⁻1 sodium bicarbonate (NaHCO3) protocol [28]. The chloroform fumigation-extraction technique [29] was used to evaluate soil microbial biomass carbon (MBC), nitrogen (MBN), and phosphorus (MBP).
Soil enzyme activities were determined as follows: cellulase (SCL) activity using the 3,5-dinitrosalicylic acid colorimetric method [30], urease (URE) activity using the sodium phenolate-sodium hypochlorite colorimetric method [30], and alkaline phosphatase (ALP) using the disodium phenyl phosphate colorimetric method [30].

2.4. Calculation of the SQI

2.4.1. Constructing the MDS

This study integrated soil chemical and biological properties to construct a comprehensive evaluation system comprising 16 rigorously selected representative indicators. After eliminating unit-induced discrepancies through z-score standardization of raw data, a screening strategy combining PCA and correlation analysis was implemented. To prevent information loss, a norm value evaluation framework was introduced to identify core indicators characterizing soil quality (SQ) from the TDS, thereby constructing the MDS [31]. The norm value was calculated as follows:
N i k = i = 1 k U i k 2 × λ k
In Equation (1), Nik represents the comprehensive load of i (the k principal components with eigenvalues ≥ 1), Uik represents the load of i (the k-th principal component), and λk represents the eigenvalue of the k-th principal component.

2.4.2. Indicator Normalization and Affiliation Calculation

Due to the lack of unified measurement units among different evaluation indicators, the calculation of SQ cannot directly use the original indicator values. Therefore, it is necessary to normalize each indicator to ensure comparability between the evaluation indicators. The membership function is currently the mainstream method used for normalization in SQ calculations. Different indicators require corresponding membership functions to be determined based on their functional roles in soil. This study, based on the influences of different indicators on soil quality, normalizes the indicators using membership functions and assigns scores to each indicator. It follows the methods of “the more the better” (S-shaped function), “the less the better” (inverse S-shaped function), and “the optimal range” (parabolic function) proposed in previous land-use change studies [32,33,34,35,36]. Specifically, for the selection of the corresponding membership functions of the indicators, we referred to relevant studies [35,36] on the evaluation of grassland soil quality in China and consulted experts (Table 2). The calculation method for variable weights is as follows:
W i = C i i = 1 n C i
In Equation (2), Wi denotes the weight of i, Ci represents the common factor variance of i, and n indicates the number of variables.

2.4.3. Comprehensive Calculation

SQI is a comprehensive representation of soil quality indicators. It is calculated using the following formula:
S Q I = i = 1 n W i × S i
In Equation (3), Si denotes the score of i, and Wi and n remain consistent with Equation (2).

2.5. Quantification of SMF

The application of SMF in agricultural ecosystems has become increasingly widespread, providing a quantitative approach to assess the multifunctionality of entire ecosystems. However, to date, there is no universally accepted definition of multifunctionality, nor any recognized measurement methodology. In current biodiversity–ecosystem functioning research, the primary methods for quantifying multifunctionality at the ecosystem level are the ‘Averaging’ (or summation) method and the ‘Threshold’ method [14]. For the selection of quantitative indexes and methods, we referred to the systematic review studies of Chinese scholars on the relevant literature at home and abroad during the period from 2009 to 2021 [20]. The indicators were selected according to the basic principle of “characterizing nutrient reserves by more stable total nutrients in the soil, nutrient conversion rate by extracellular enzyme activity, and nutrient status by quick-acting nutrients” [20]. At the same time, the selection of indicators should cover the main material cycling processes such as carbon, nitrogen, and phosphorus. In the specific analysis method, we adopted the average value method, which is the most widely used method at present. Therefore, building upon existing studies and the SQI calculated in Section 2.4, we continued to use z-score dimensionless standardized data and adopted the most widely used ‘Averaging’ method to quantify SMF.

2.6. Statistical Analysis

During the data integration phase, Microsoft Excel 2019 (Microsoft Corporation, USA) was used to organize and preprocess the raw data. In statistical analysis, data processing was performed using SPSS 27.0 (IBM Corporation, USA) statistical software. If the data met the assumptions of normal distribution and homogeneity of variances between groups, one-way ANOVA was conducted with the LSD post hoc test for pairwise comparisons. When the data violated normality assumptions or exhibited unequal variances, the Kruskal–Wallis test with multiple comparisons was employed. A significance level of α = 0.05 was set to examine the differential effects of different utilization methods on soil indicators.
In the domain of geospatial information visualization, GPS coordinates were acquired using the mobile app Ovital Interactive Map 10.1.8 (Beijing Ovital Software Co., Ltd., China). Vector data sets for mapping were sourced from the China National Geomatics Center. Spatial distribution maps of sampling plots were generated using the ArcGIS 10.8 (Esri Inc., USA) platform to visually represent the layout characteristics of the plots.
Data visualization was conducted using Origin 2024 (OriginLab Corporation, USA) to generate statistical graphics. To perform a deeper analysis of SQI and SMF, machine learning approaches were implemented in RStudio 2024.12.1 (Posit PBC, USA). The rfPermute package executed random forest algorithms to systematically evaluate the contributions of biotic and abiotic factors to SQI and SMF within the 0–30 cm soil layer, identifying key driving factors. Concurrently, the linkET package conducted Mantel tests to construct correlation networks between soil chemical and biological indicators and SQI/SMF, revealing intrinsic interconnections among these indicators.

3. Results

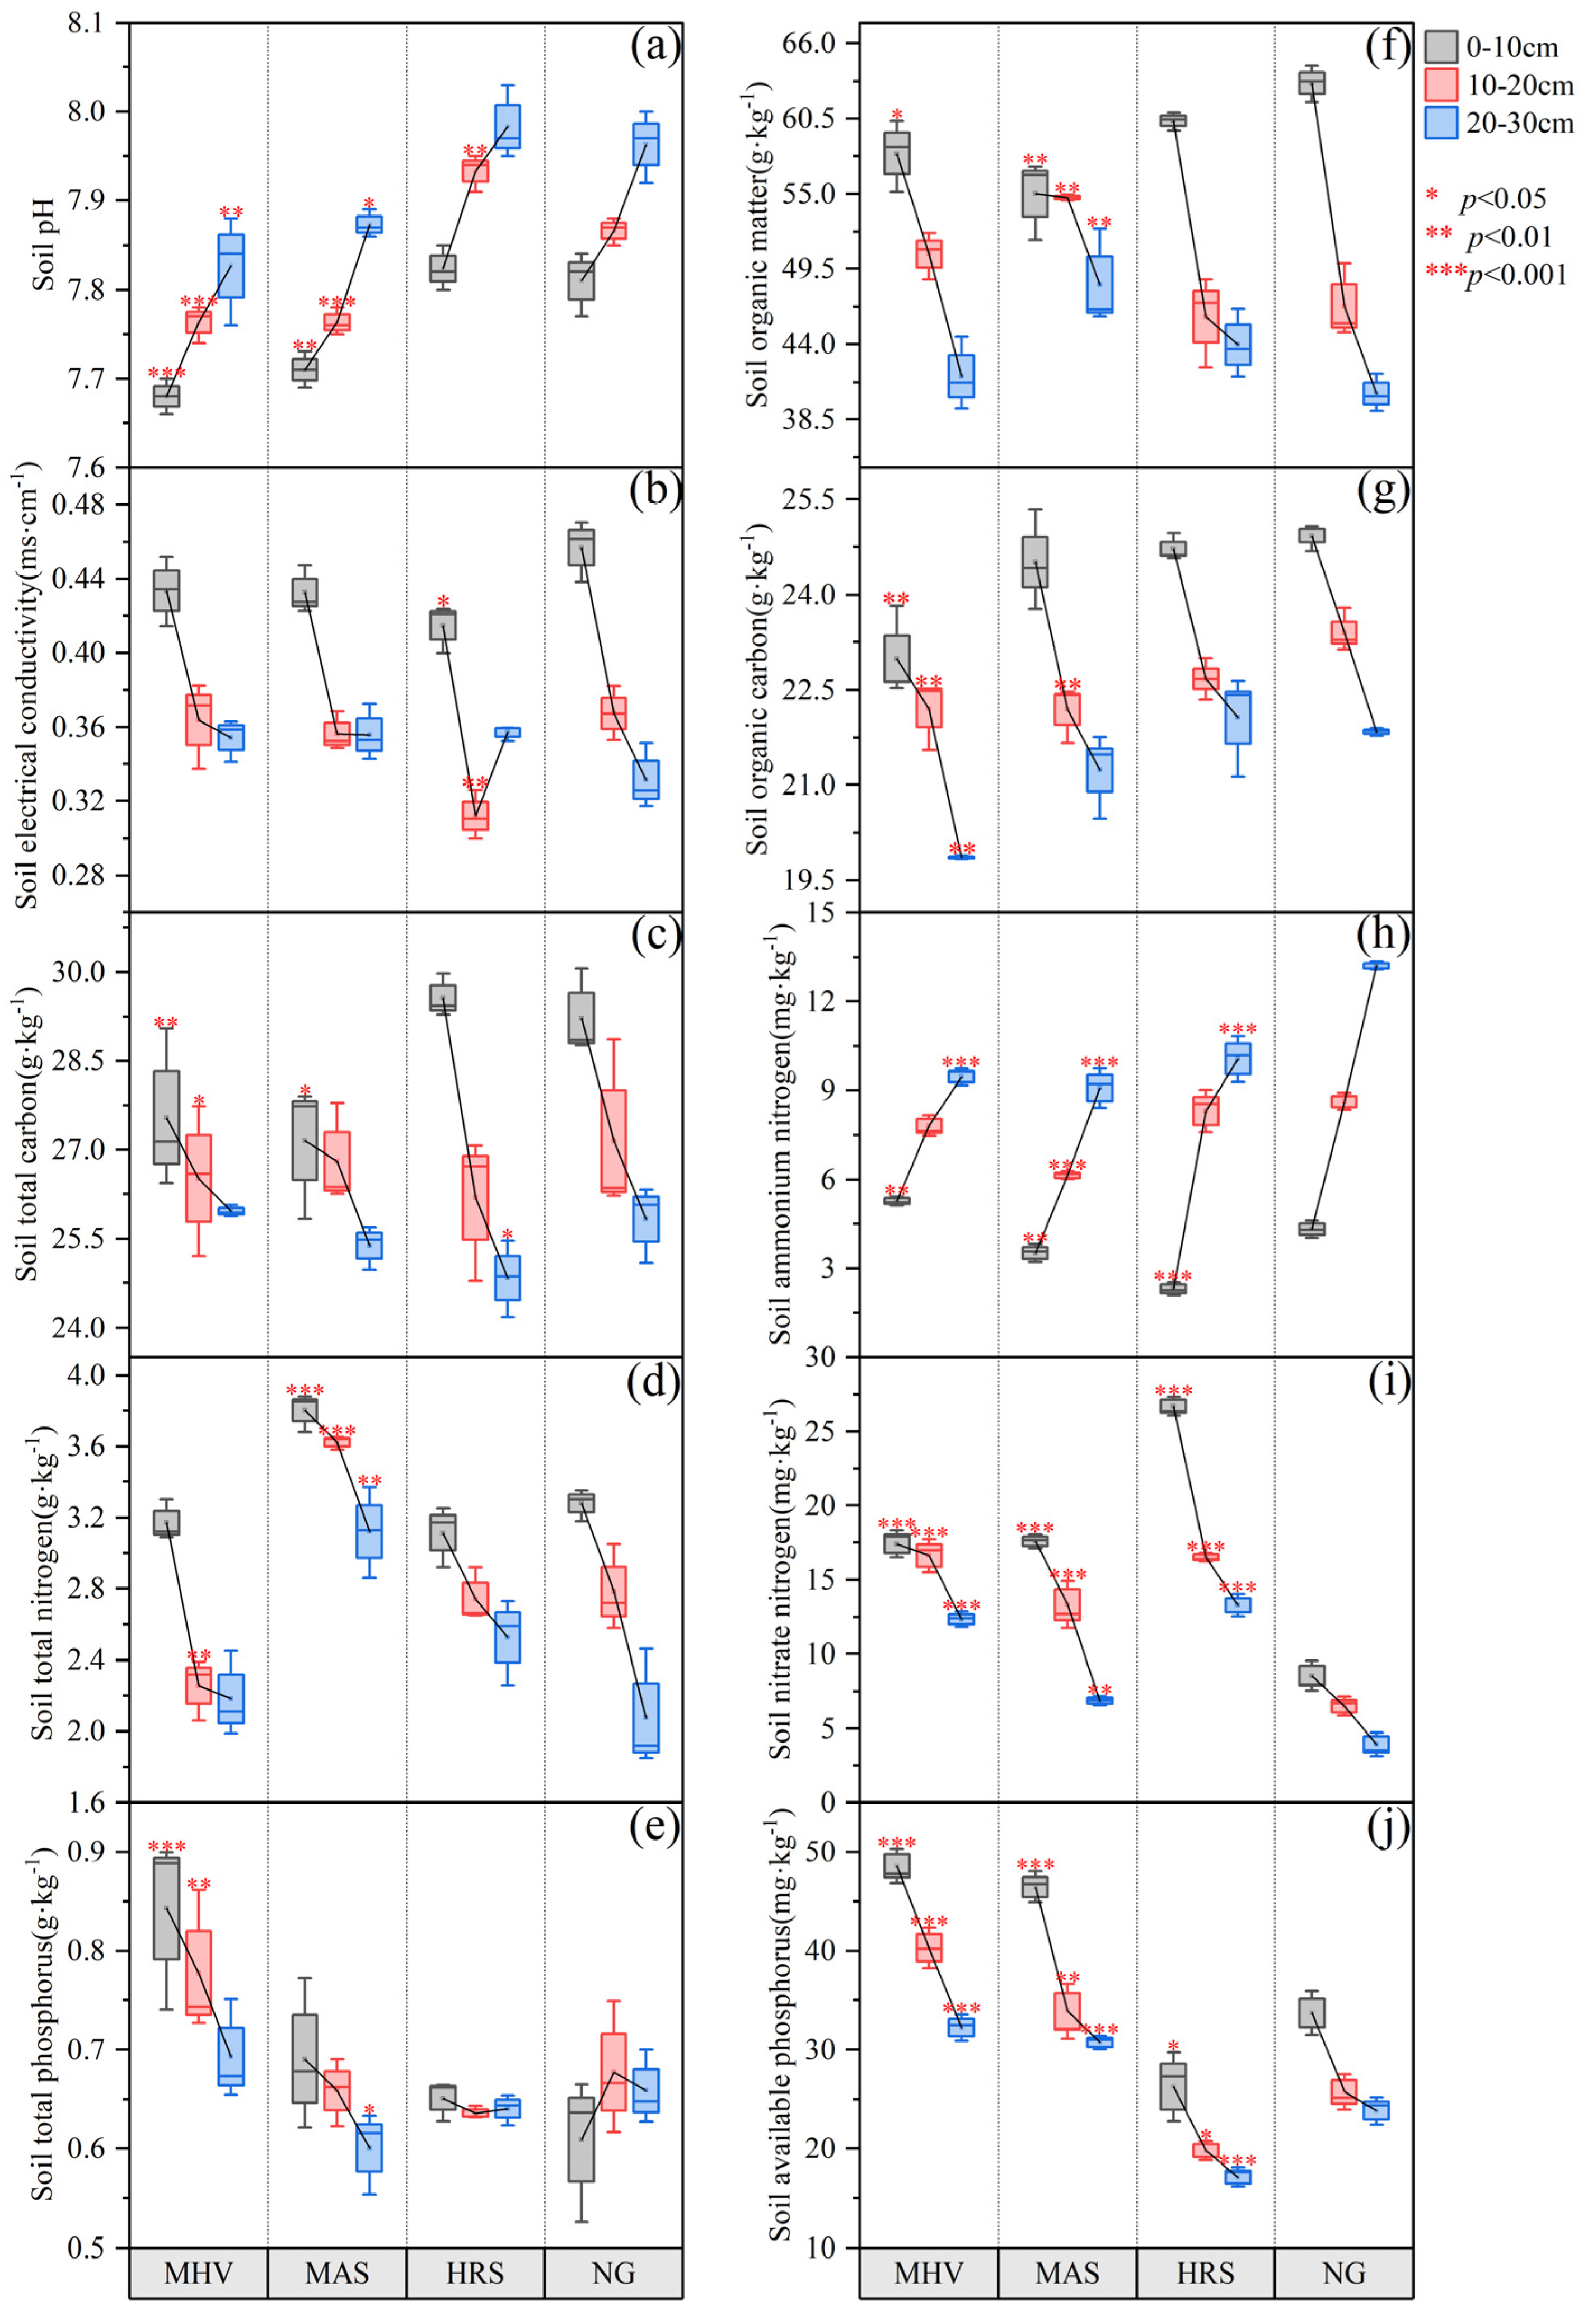
3.1. Soil Chemical Properties Under Different NG Utilization Patterns

Compared to traditionally grazed NG, MHV, MAS, and HRS exhibited significant and contrasting effects on soil properties across depths. Tillage activities in MHV and MAS systems led to significant pH reductions across soil layers, with MHV showing substantially greater decreases in the stratified profile, particularly in the 20–30 cm layer where the mean pH was 7.83 ± 0.04 (Δ = −1.76%; p = 0.004), while HRS exhibited a significant pH increase to 7.93 ± 0.01 (Δ = +0.85%; p = 0.002) in the 10–20 cm layer (Figure 2a). EC significantly decreased in HRS within the 0–10 cm (p = 0.01) and 10–20 cm (p = 0.003) soil layers, with the largest reduction observed in the 10–20 cm layer, where EC reached 0.31 ± 0.01 ms cm−1 (Δ = −14.56%), while cultivated plots (MHV and MAS) showed minimal changes (Figure 2b).
MHV significantly reduced (p = 0.03) TC content in the 0–10 cm soil layer. HRS had the highest TC content (29.56 ± 0.21 g kg−1) at 0–10 cm among all treatments, but showed a significant reduction (Δ = −3.85%; p = 0.04) in the 20–30 cm layer (Figure 2c). MAS significantly increased TN content across all soil layers, while MHV significantly reduced TN content (2.26 ± 0.10 g kg−1) in the 10–20 cm soil layer (Δ = −5.87%; p = 0.005) (Figure 2d). MHV significantly increased TP content in the 0–10 cm (0.84 ± 0.05 g kg−1; Δ = +38.25%; p = 0.0003) and 10–20 cm (0.78 ± 0.04 g kg−1; Δ = +14.22%; p = 0.002) soil layers (Figure 2e), while HRS significantly decreased AP content in the 10–20 cm (19.80 ± 0.65 mg kg−1; Δ = −23.09%; p = 0.01) and 20–30 cm (17.14 ± 0.66 mg kg−1; Δ = −28.08%; p = 0.0002) soil layers (Figure 2j).
Both MHV (p = 0.02) and MAS (p = 0.002) significantly reduced SOM content in the 0–10 cm soil layer, with MHV additionally showing significant reductions in SOC content across all soil layers (Figure 2g). In contrast, HRS exhibited no significant differences in SOM content compared to NG throughout all soil depths (Figure 2h). Soil nitrogen speciation diverged markedly, with cultivated plots (MHV/MAS) exhibiting dramatic increases in NN content (155.77% rise at 10–20 cm in MHV), while HRS displayed the lowest AN content at 0–10 cm (2.31 mg kg−1; Δ = −46.61%) (Figure 2h,i).

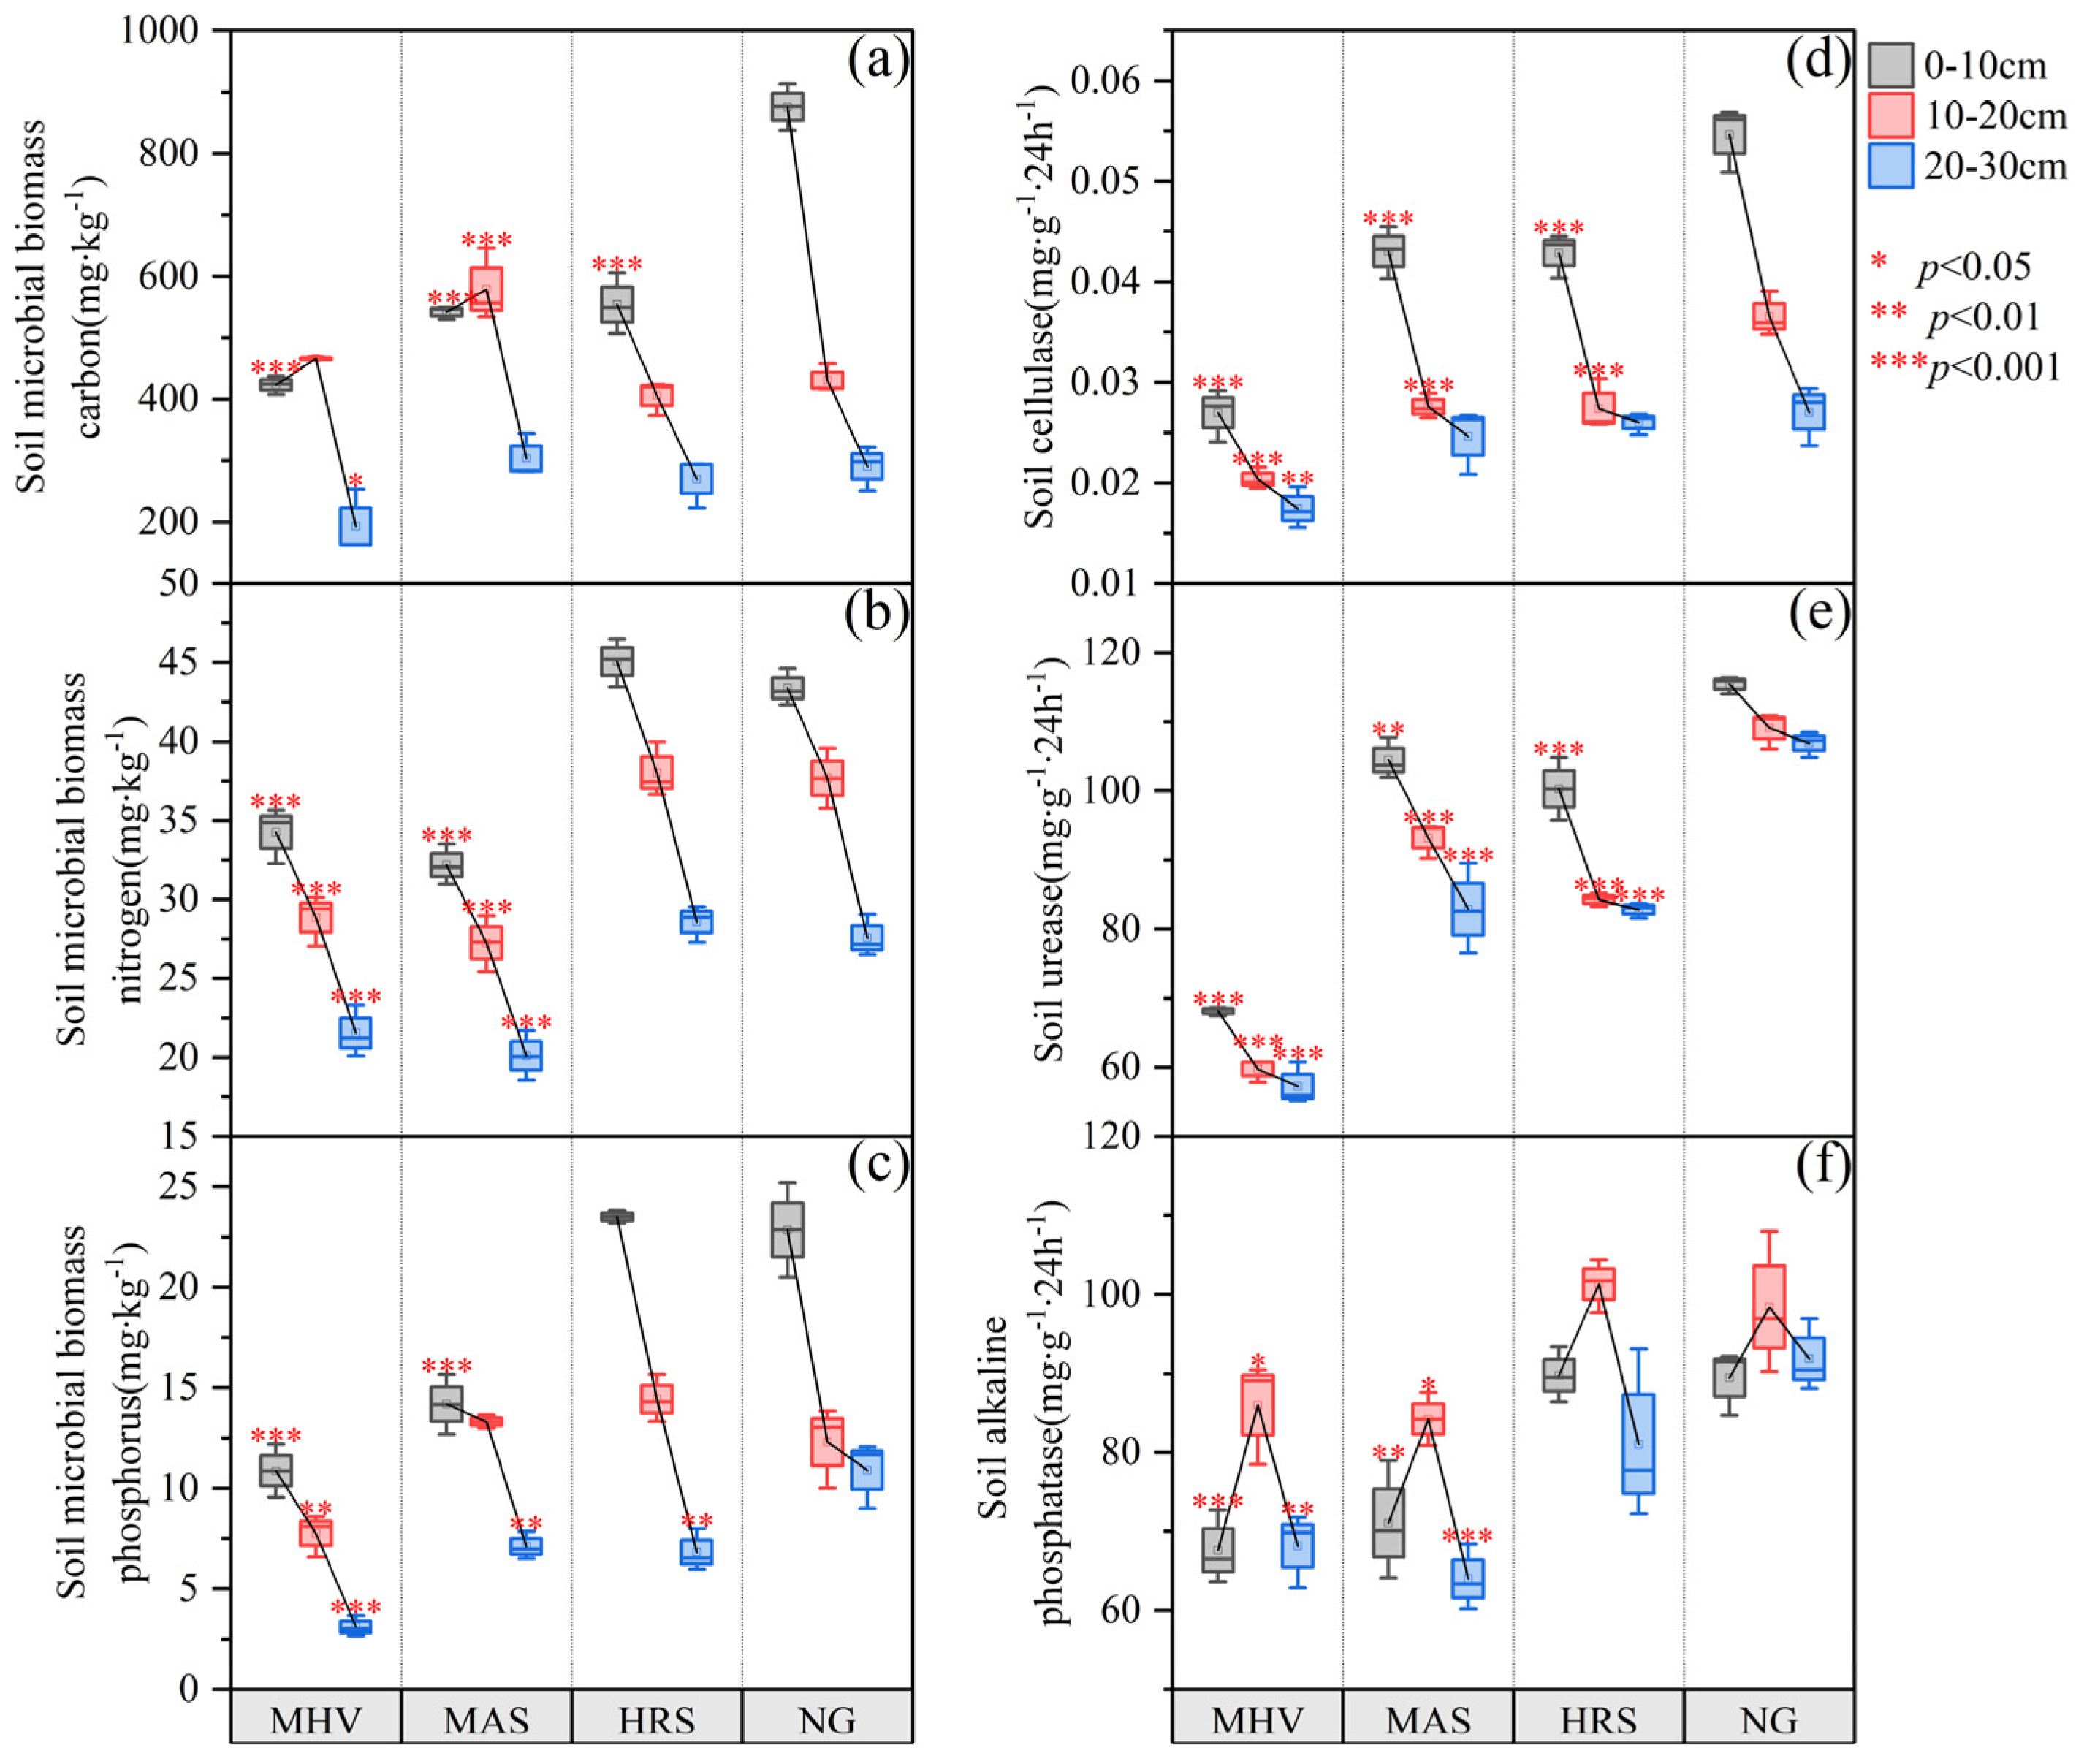
3.2. Soil Biological Characteristics Under Different NG Utilization Patterns

Compared to traditionally grazed NG, MHV and MAS significantly reduced the content of soil microbial biomass carbon, nitrogen, and phosphorus, and the MBC content was significantly reduced by 51.65% (p = 0.0000001) and 38.12% (p = 0.000001) in the 0–10 cm soil layer (the largest decrease was observed in MHV), respectively, while MBN content (25.84–27.70% decrease in MAS) and MBP (36.93–71.40% decrease in MHV) also generally decreased. In contrast, HRS exhibited only marginal decreases in MBN and MBP contents (Figure 3a–c).
Regarding enzyme activities, MHV exhibited the most pronounced reductions in URE activity (41.96–46.41% decrease across soil layers), with ALP activity declining in all tillage plots. Under MHV treatment, SCL activity decreased by 35.52–50.63%. In contrast, HRS demonstrated smaller reductions in ALP activity (Figure 3d–f).

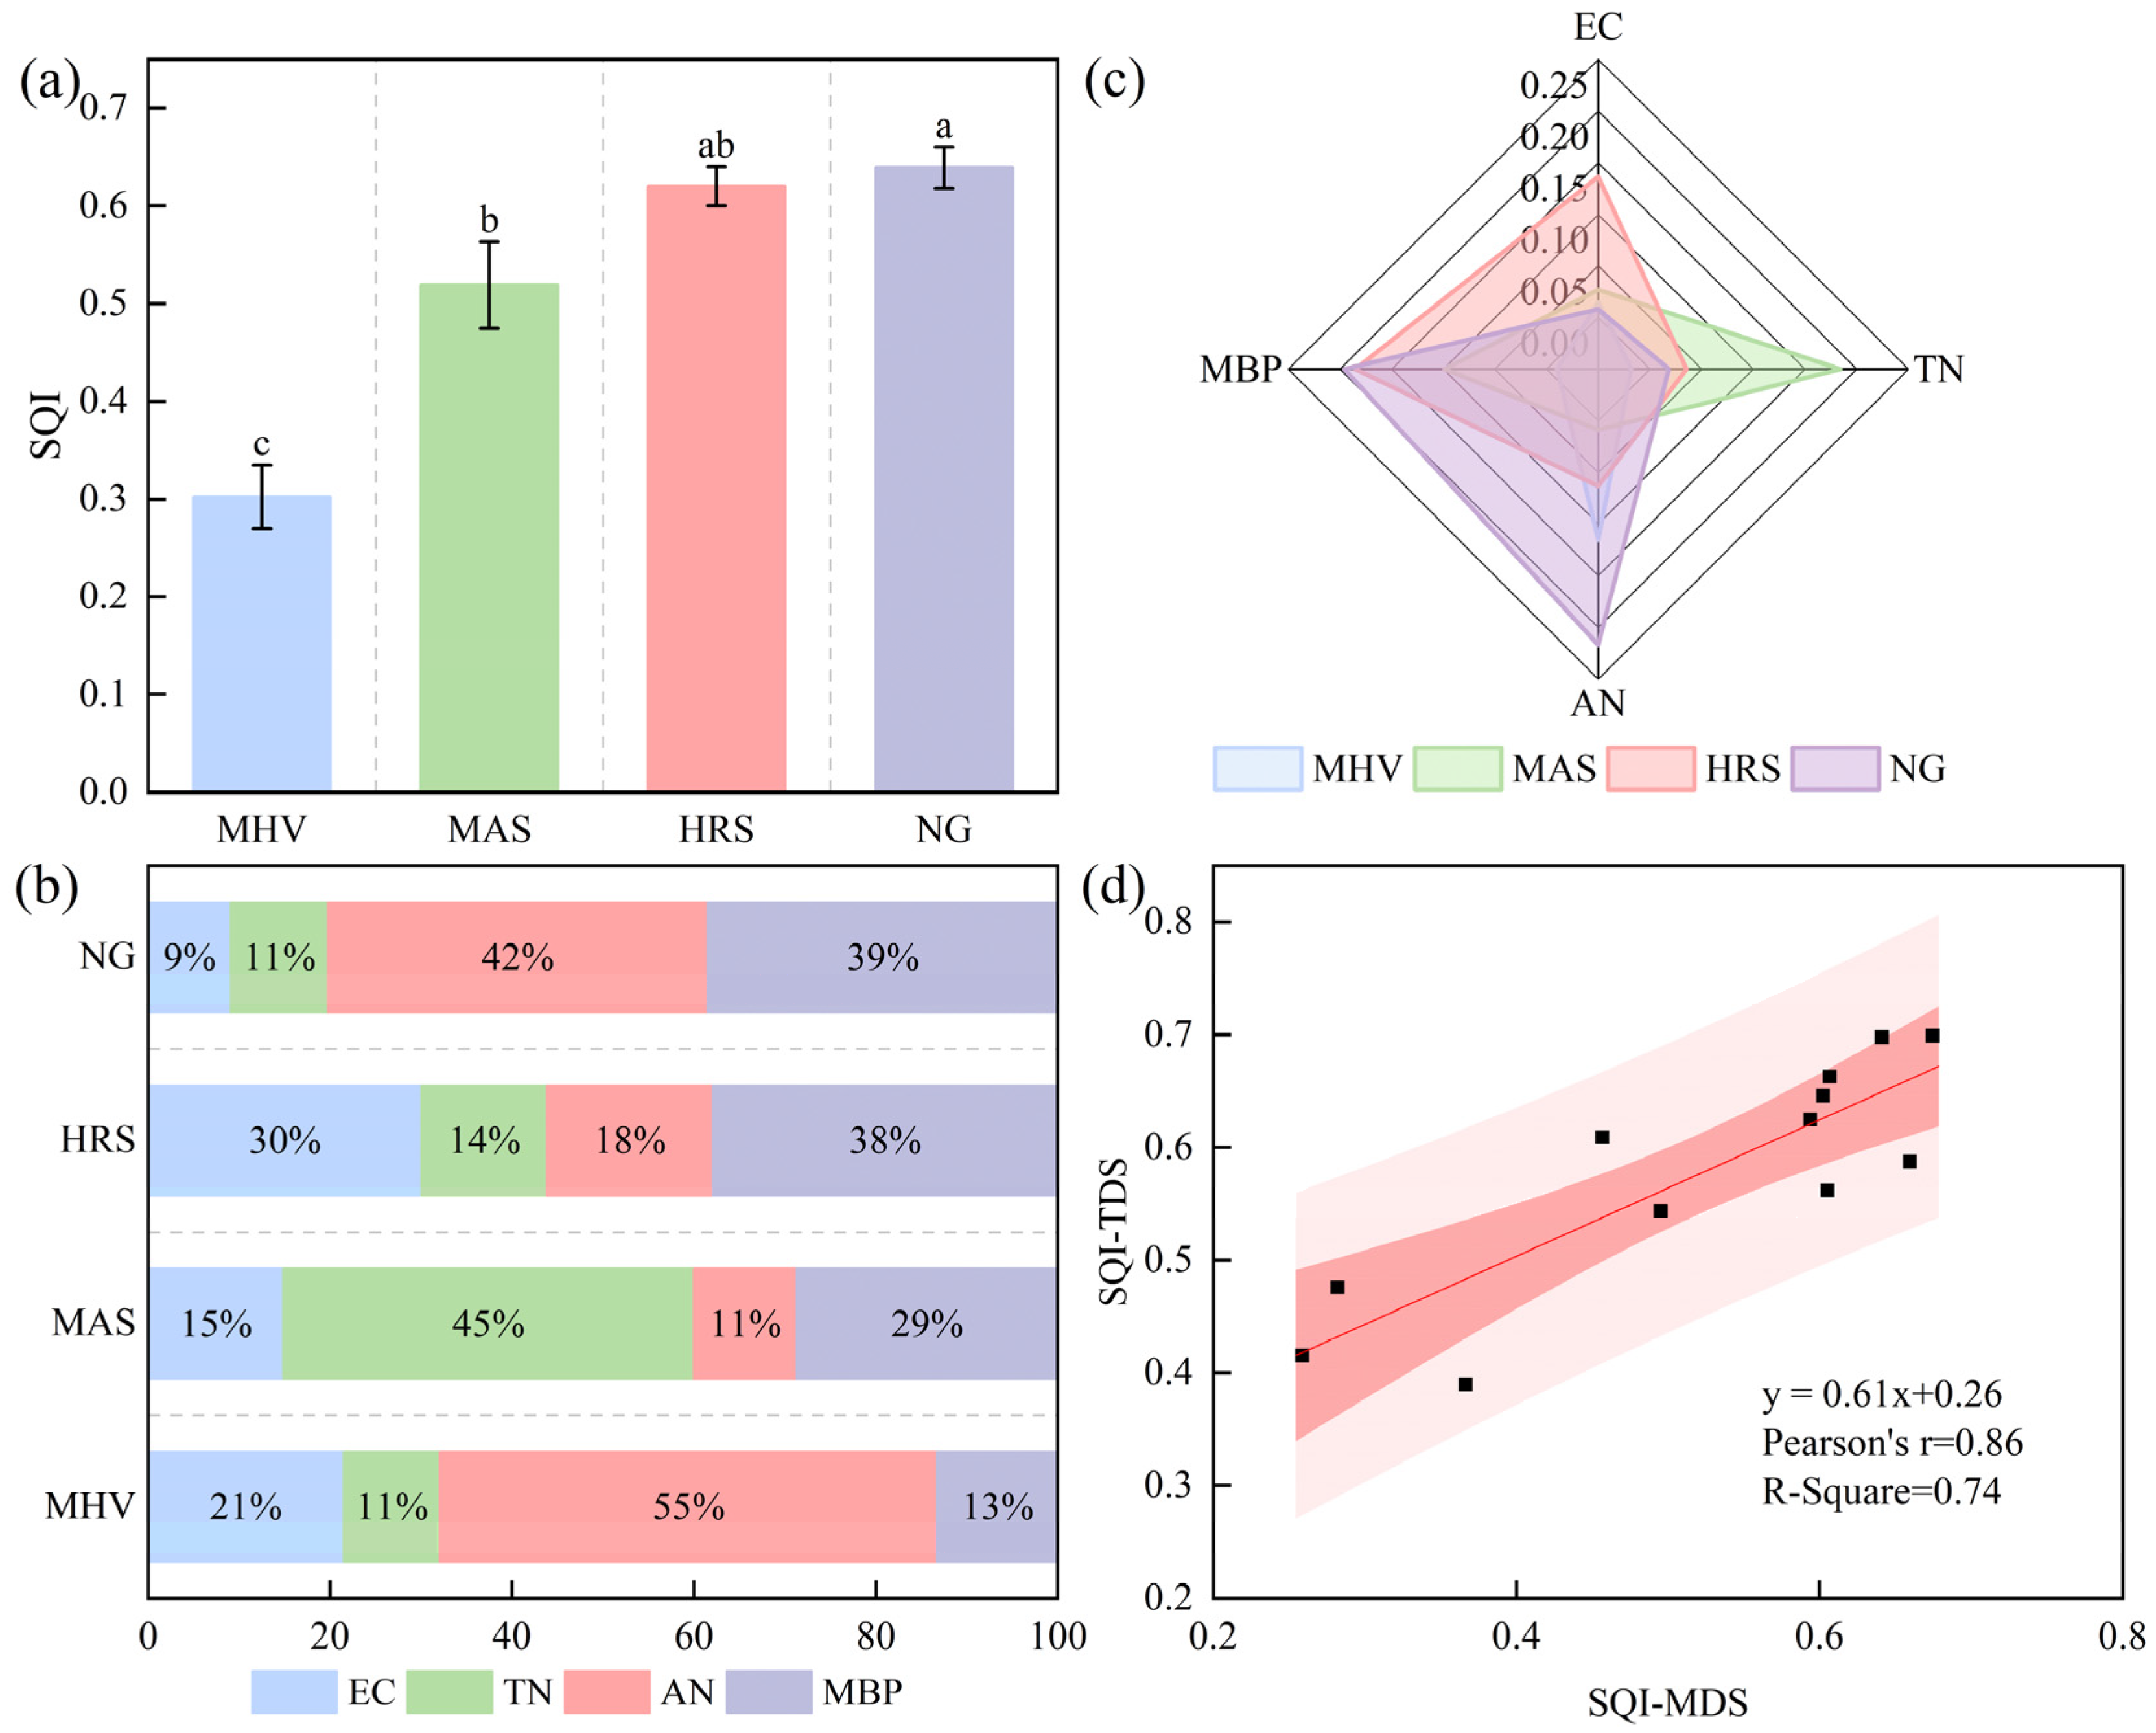
3.3. Impact of NG Utilization Patterns Transformation on the SQI

3.3.1. Construction of the MDS

Using the aforementioned 16 indicators as TDS, principal component analysis (PCA) and Pearson correlation analysis were conducted to classify the indicators into three principal components (PC1, PC2, and PC3) based on the criterion of eigenvalue ≥ 1. The eigenvalues for these components were 8.574, 3.246, and 2.539, respectively, resulting in a cumulative contribution rate of 89.742%. This indicates that these three principal components possess strong explanatory capacity (Table 3).
All indicators were screened by grouping those with absolute loading values ≥0.5 in each principal component into a category. If the same indicator appeared in two principal component groups simultaneously, it was assigned to the group with lower correlation based on the correlation principle (Table A1). Group 1 included pH, TC, TP, SOC, AP, MBN, MBP, SCL, URE, and ALP. Group 2 included EC, SOM, TN, and MBC. Group 3 included AN and NN.
Based on the principles of norm value and correlation-based selection, indicators within the top 10% range of the maximum norm value within each group were screened. If two indicators in the same group were significantly correlated with an absolute correlation coefficient >0.5, the indicator with the higher norm value was selected. If the absolute correlation coefficient was <0.5, both indicators were retained.
In Group 1, the norm values were ranked as follows: MBP > SOC > pH > ALP > AP > MBN > URE > TC > SCL > TP. Except for TP, all other indicators fell within the top 10% range of the maximum norm value. In Group 2, the norm values were ranked as MBC > EC > TN > SOM, with EC and TN being the soil indicators within the top 10% range of the maximum norm value. In Group 3, the norm values were ranked as AN > NN, and both indicators fell within the top 10% range of the maximum norm value. After correlation comparisons, EC, TN, AN, and MBP were finally selected for the MDS (Table 3), with weight rankings of AN > MBP > TN > EC (Table 4). The selection of these four indicators is not only statistically justified but also grounded in their fundamental theoretical and practical significance within key soil processes: TN serves as the primary indicator of the soil nitrogen pool, forming the foundation of soil fertility and directly influencing plant growth and ecosystem productivity. AN represents the main direct product of the primary mineralization of nitrogen. Its concentration dynamics provide an immediate reflection of soil nitrogen turnover rates and availability. MBP signifies the fraction of the soil’s active phosphorus pool tightly bound within microbial cells. It acts as a central hub in the soil phosphorus cycle, reflecting the microbial capacity for phosphorus immobilization and release. EC measures the total concentration of soluble salts in the soil solution, directly indicating osmotic pressure (salinization stress). Salinity profoundly affects soil chemical properties (nutrient availability, pH buffering) and biological processes (microbial activity and enzyme activity) through its impact on osmotic potential and specific ion toxicity. In this study, the TDS contained 16 indicators, while the MDS comprised four, achieving a 75.00% indicator reduction rate and significantly simplifying the evaluation system.

3.3.2. SQ Evaluation Based on the MDS

The SQI is a composite measure of various soil properties and processes, and the larger the value is, the better the soil quality. Under four grassland utilization patterns, SQI was ranked as follows: NG > HRS > MAS > MHV. NG exhibited the optimal SQ (SQI: 0.64 ± 0.02), with AN contributing the highest proportion (42%) and SQI-AN reaching 1.00. In contrast, MHV displayed the poorest SQ (SQI: 0.30 ± 0.03), where AN also constituted the dominant fraction (55%; SQI-AN: 0.62). Compared to NG, both MHV and MAS demonstrated significant reductions (p < 0.05) in 0–10 cm, 10–20 cm, and 20–30 cm soil layer SQI (Figure 4a–c).

3.3.3. MDS Suitability Validation

To validate the applicability of the MDS, SQI was calculated under both TDS (SQI-TDS) and MDS (SQI-MDS) frameworks. The SQI-TDS values ranged from 0.39 to 0.70 (mean: 0.58; coefficient of variation (CV): 17.93%), whereas SQI-MDS values ranged from 0.26 to 0.67 (mean: 0.52; CV: 28.18%). Linear regression analysis indicated a robust linear correlation between SQI-TDS and SQI-MDS (R2 = 0.74), confirming the validity of the MDS-based SQ assessment system as a substitute for the TDS method in evaluating SQ across four NG utilization patterns (Figure 4d).

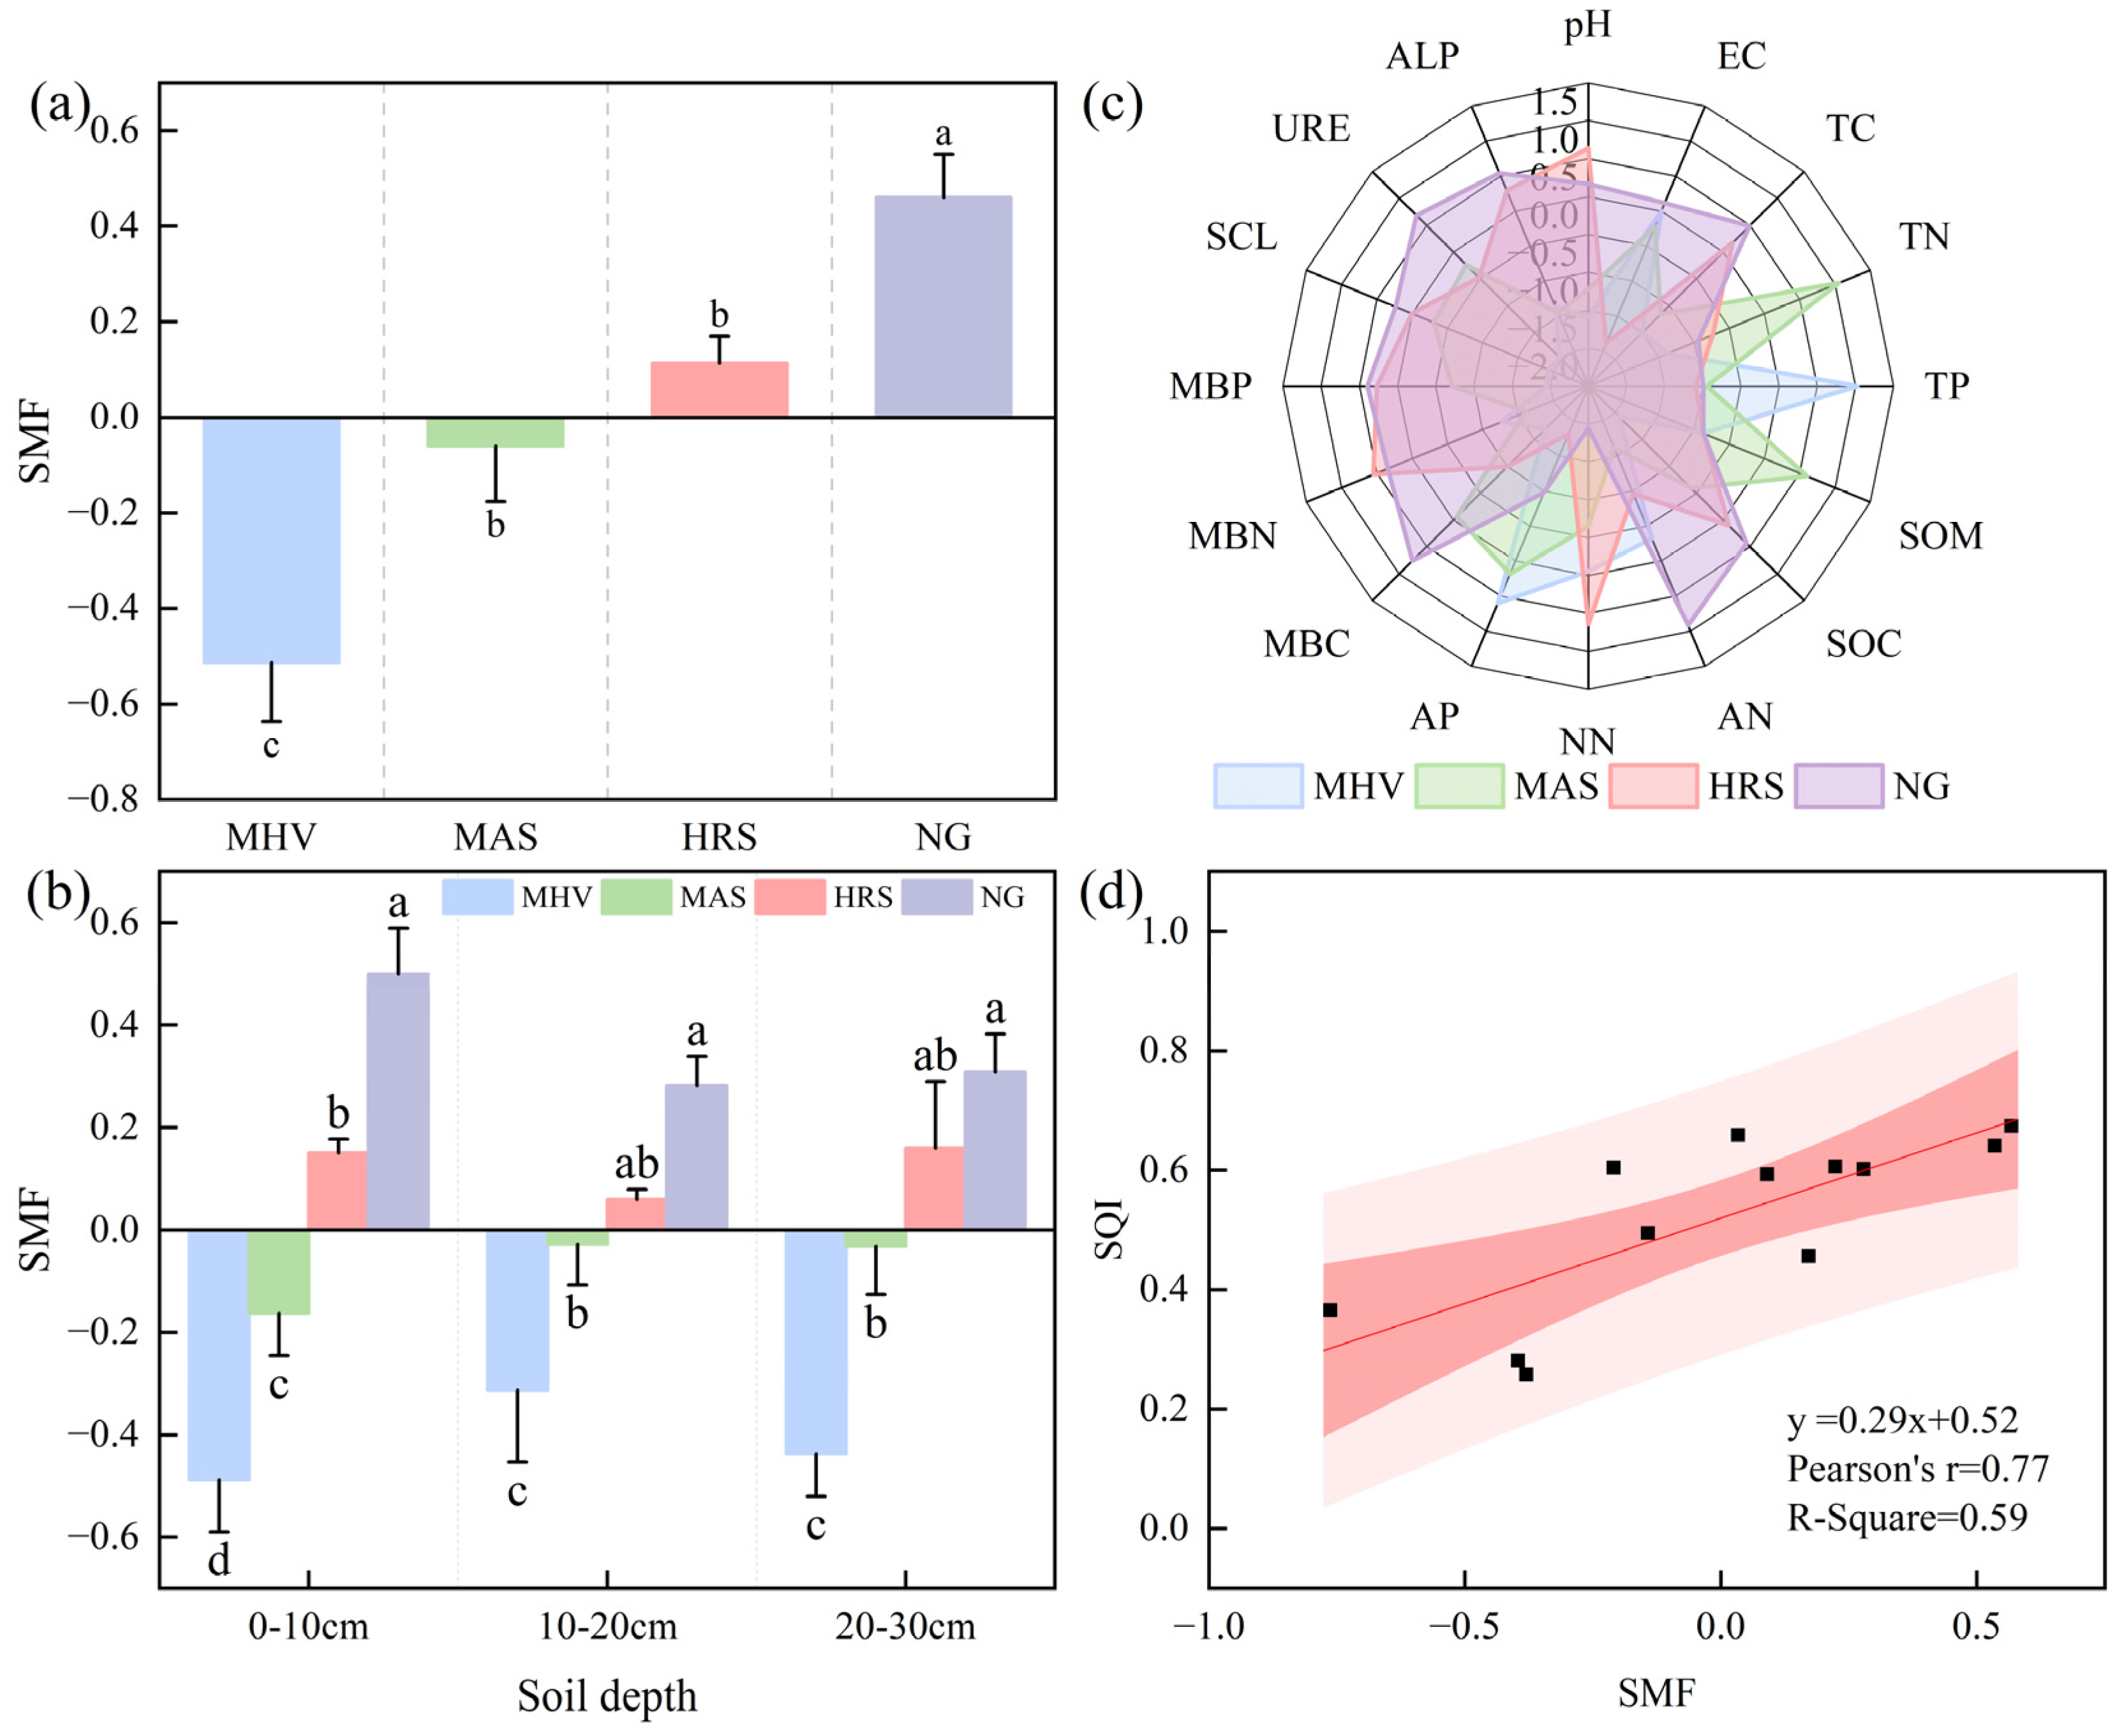
3.4. Characteristics of SMF Under Different NG Utilization Patterns

Compared to NG, MHV, MAS, and HRS all significantly reduced average SMF in the 0–30 cm soil layer (p < 0.05) (Figure 5a). NG had the highest SMF of 0.4 ± 0.07. MHV had a 200% decrease in SMF compared to (p = 0.00007). Within the same grassland utilization pattern, SMF under MHV and MAS exhibited an initial increase followed by a decrease with soil depth, whereas HRS and NG showed a decrease followed by an increase. Additionally, MHV and MAS significantly reduced SMF across all soil layers (p < 0.05) (Figure 5b).
Radar chart analysis of the 16 indicators (z-score standardized data) involved in SMF quantification revealed that MHV exhibited relatively higher levels of EC, TP, and AP; MAS showed elevated TN and SOM; HRS demonstrated increased pH, NN, and MBN; while NG maintained higher AN, MBC, URE, and ALP (Figure 5c).
The linear regression analysis results between SQI and SMF indicate that the model fits well (R2 = 0.59), and there is a positive linear correlation between the two (Figure 5d). Crucially, this strong link between SMF and SQI emphasizes the fundamental role of SQ as underpinning EMF.

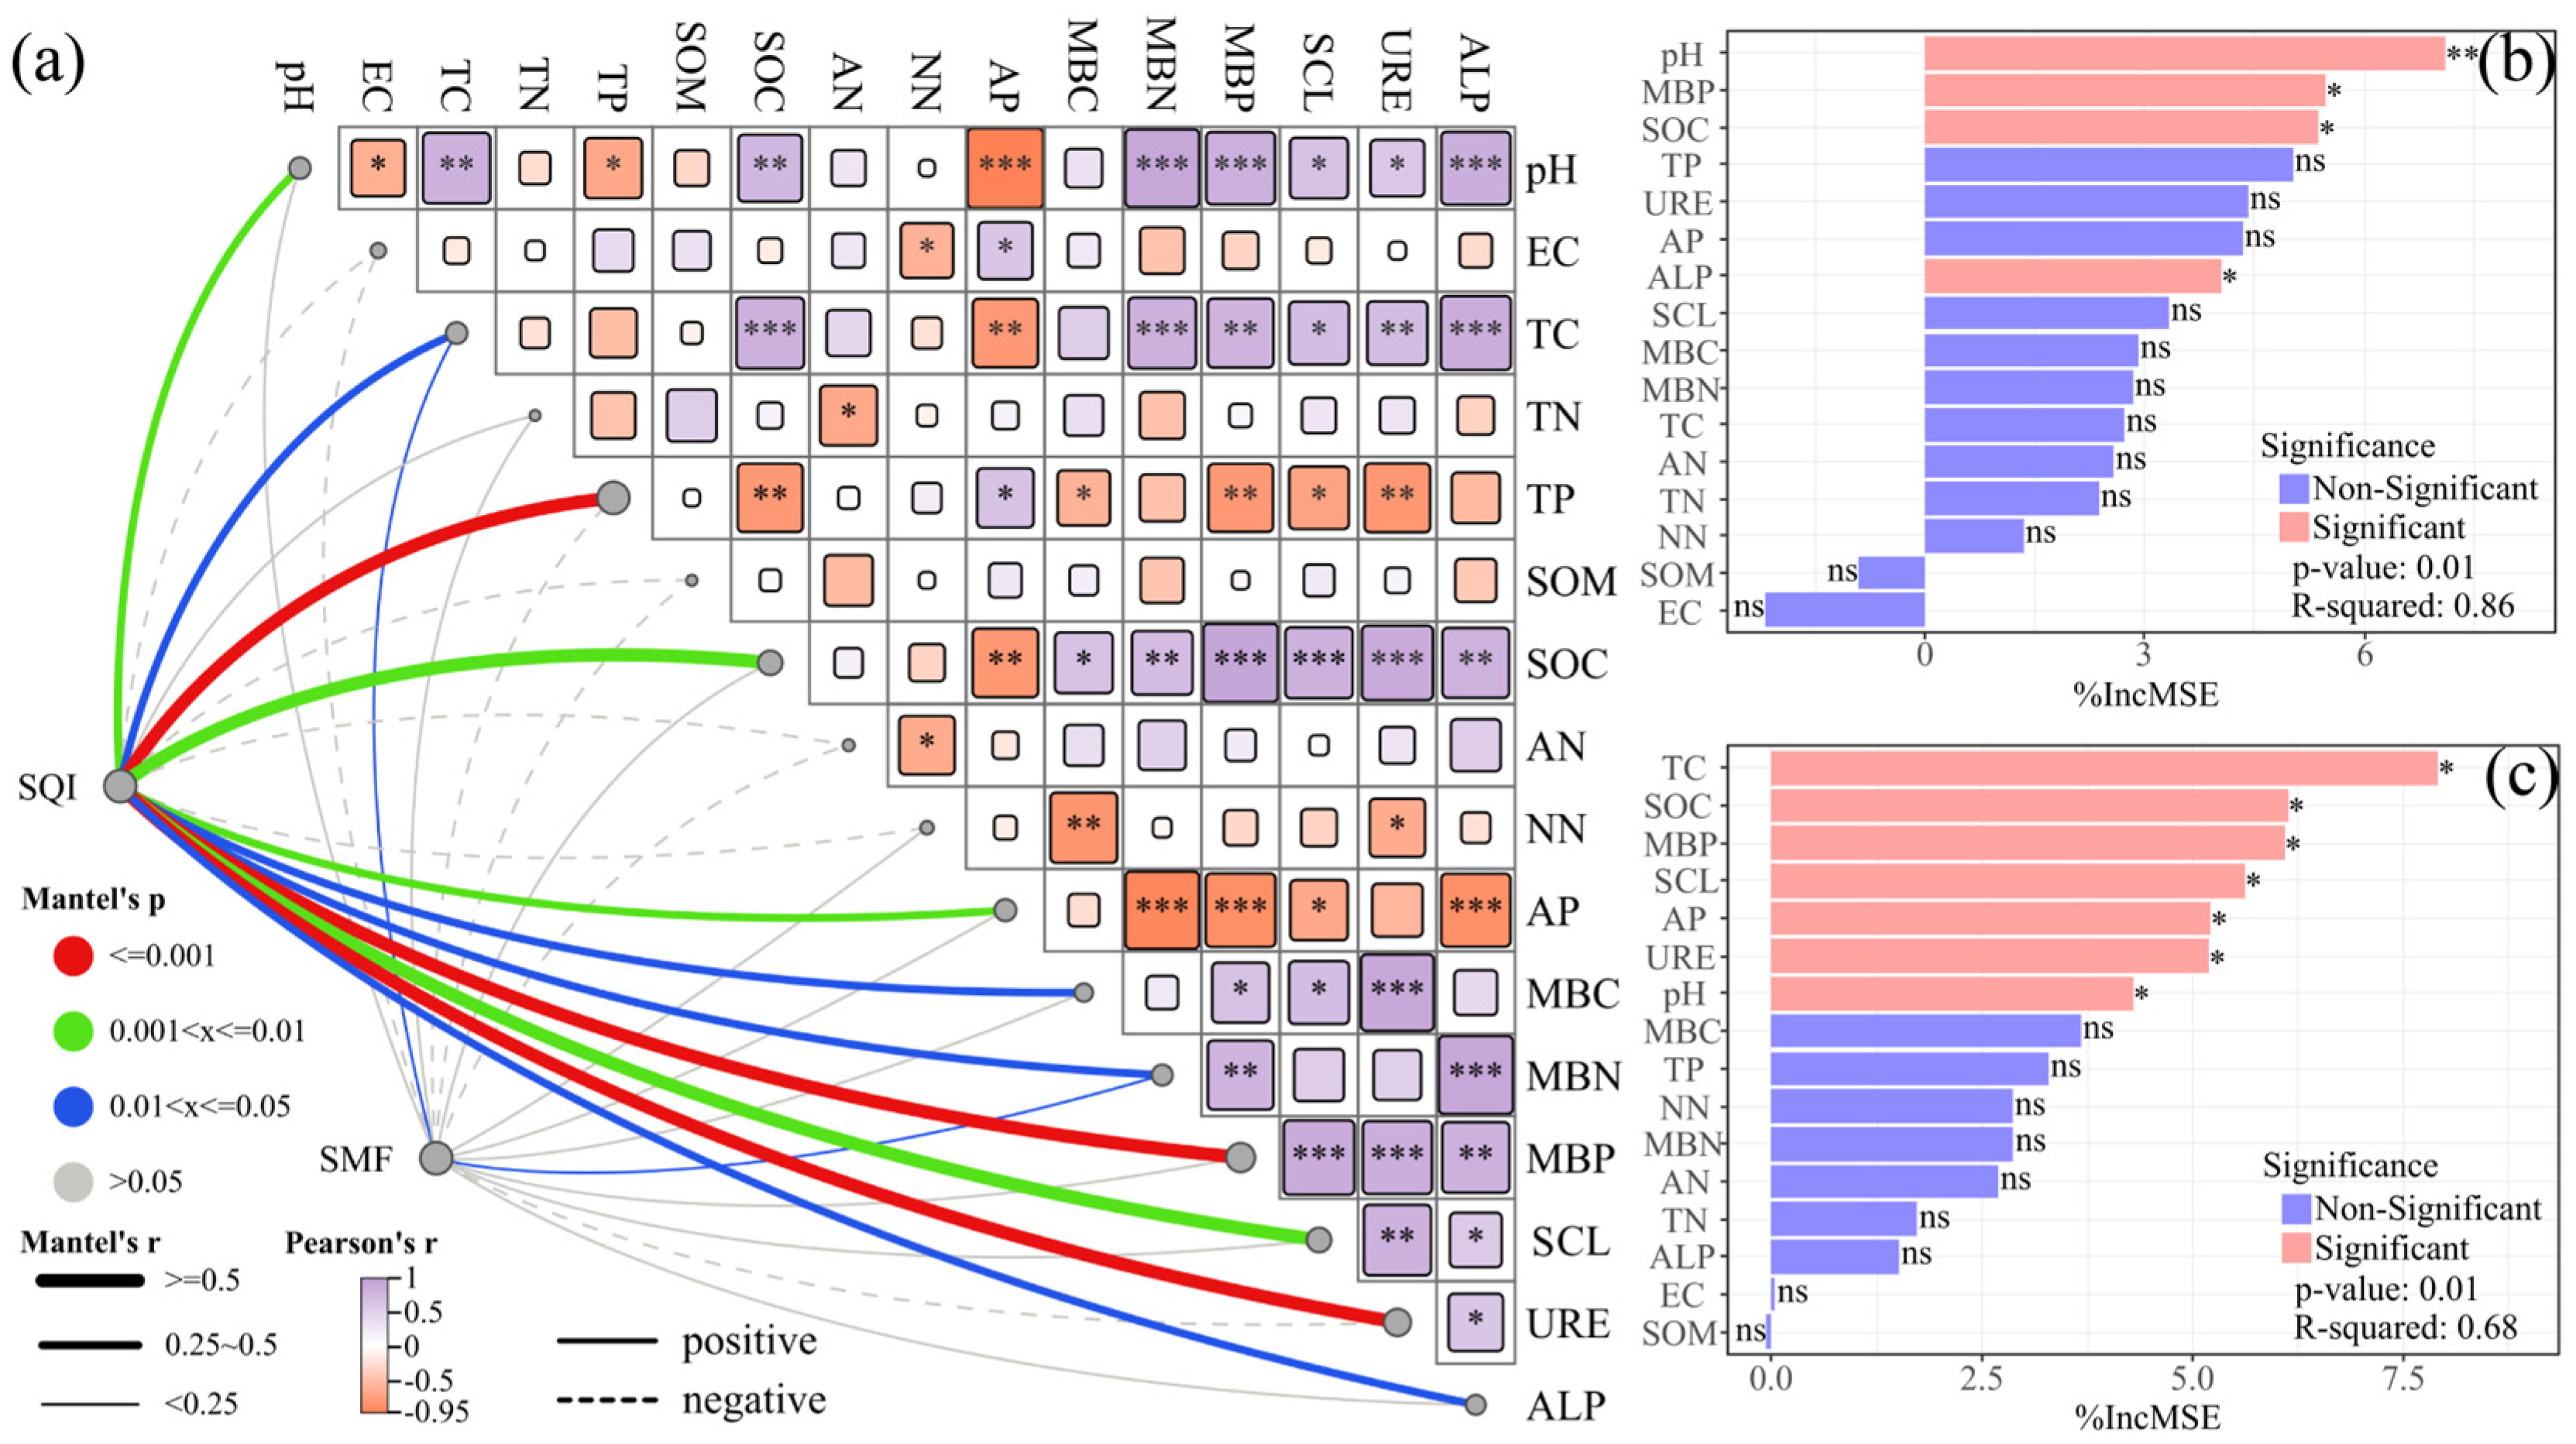
3.5. Mantel Tests and Random Forest Model Predictions

Based on Mantel test results (Figure 6a), SQI showed significant spatial coupling with multiple soil parameters. Strong positive correlations were observed between SQI and soil TP content, MBP content, and URE activity (Mantel’s p ≤ 0.001, r ≥ 0.5). SMF exhibited significant positive correlations with soil TC and MBN contents (0.001 ≤ Mantel’s p ≤ 0.01, 0.25 ≤ r ≤ 0.5).
For the random forest prediction of SQI (Figure 6b), the model explained 86.00% of the variance. Permutation importance tests identified soil pH, SOC, MBP, and ALP as significant predictors (p < 0.05), with pH showing extremely significant predictive contribution (p = 0.001). Variable importance metrics based on percentage increase in mean squared error (%IncMSE) further confirmed pH as the most influential determinant of SQI variation.
In the SMF prediction model (Figure 6c), the variance explanation rate was 68.00%. Importance analysis revealed soil pH, TC, SOC, AP, MBP, SCL, and URE as key predictors (p < 0.05), where TC’s %IncMSE was significantly higher than other indicators, highlighting its central role in SMF prediction.

4. Discussion

4.1. Impacts of NG Utilization Patterns Transformation on Soil Chemical Characteristics

The transformation of NG utilization patterns significantly impacted soil chemical properties. Soil pH is critical for nutrient availability [37,38]. Compared to traditionally grazed NG, cultivated plots reclaimed as MHV and MAS generally exhibited reduced soil pH. Previous studies on agricultural intensification-induced soil acidification have confirmed this phenomenon, yet multiple perspectives exist regarding specific driving mechanisms. Khalili et al. [39], Kavvadias et al. [40], and Souza et al. [41] found this associated with fertilizer application during cultivation, where nitrogen inputs release hydrogen ions through soil nitrification. Meanwhile, Naveed et al. [42] and Lu et al. [43] attribute this to acidification effects from crop root exudates and organic acids. Additionally, Raza et al. [44] discovered that accelerated decomposition of soil organic matter promotes mineralization processes, leading to acidic substance accumulation in soils and subsequent acidification. Taken together with the aforementioned aspects and this study, the cause of decreased soil pH in croplands may be primarily associated with chemical fertilizer application. The EC in the HRS 0–20 cm soil layer showed significant reduction, which correlates with its higher vegetation coverage. Chu et al. [45] demonstrated that understory herbaceous development enhances vegetation coverage, helping maintain low-salinity soil environments. In cultivated plots, EC decreased in the 0–20 cm layer but increased in the 20–30 cm layer, closely linked to salt redistribution caused by irrigation and tillage [46,47].
It is noteworthy, however, that there were small decreases in pH and EC between treatments, which may be due to overlap between planting phases, as well as spatial and seasonal variations. In addition, this low variability may partly represent differences between mulches.
Compared to traditionally grazed NG, MHV and MAS significantly reduced surface SOM and TC content. Additionally, SOC exhibited varying degrees of reduction across all soil layers. Since SOC quantitatively represents the carbon content of SOM, this reduction is linked to accelerated SOM decomposition of SOM by frequent tillage activities and depletion of crop residues from grazing (which reduced plant derived SOM inputs). Anning et al. [48], based on studies of straw returning-induced priming effects on SOM components, provided inverse confirmation of this phenomenon. In contrast, HRS exhibited higher TC and TN in surface soils, attributed to carbon-nitrogen sequestration driven by litter inputs and extensive root systems [49,50].
MHV significantly increased TP in the 0–20 cm layer, while AP increased under both monocropping systems. These increases were linked to compound fertilizer application, enhanced soil mineralization from tillage, and soil disturbance that elevates phosphorus availability and mobility [51]. However, in HRS, AP content decreased, likely due to plant uptake regulating phosphorus availability [52,53]. Additionally, NN content significantly increased in HRS, which is associated with its nitrogen-fixing plant characteristics, specifically root symbiosis with Frankia actinobacteria, and microbially driven enhancement of nitrogen transformation efficiency [54].
Collectively, the transformation of NG utilization patterns profoundly reshaped soil nutrient cycling patterns, exerting differential impacts on soil fertility. Monocropping agriculture accelerates SOC depletion, while the ecological restoration vegetation HRS establishes a more stable C-N reservoir through biological stabilization and microbial interactions. SOC stabilization improves basic soil quality attributes and enhances the potential for ecosystem multifunctionality, including sustained soil nutrient supply, carbon sequestration, biologically robust characteristics, and more.

4.2. Impacts of the Transformation of NG Utilization Patterns on Soil Biological Characteristics

Soil biological characteristics exhibited high sensitivity to transformations in NG utilization patterns. Compared to traditionally grazed NG, MHV and MAS systems significantly reduced MBC, MBN, and MBP contents, alongside marked declines in URE, SCL, and ALP activities. Given the strong positive correlations observed in this study between SOC and soil microbial biomass/enzyme activities, it is highly likely that the reduction in SOC directly contributed to this suppression of soil biological functions. In addition, fertilizer application also inhibited the presence of soil microbes and enzyme functions [55,56]. The long-term impacts of fertilization on soil biological properties have been repeatedly validated [57,58]. Under monocropping patterns, deteriorating soil chemical conditions further impaired microbial metabolic functionality, resulting in reduced biological activity and community imbalance [59].
From a microbial nutrient cycling perspective, HRS exhibited gradual decreases in MBN and MBP with soil depth, yet these reductions were significantly smaller than in monocropping croplands. This difference highlights the protective effect of artificial forest systems on soil nutrient retention capacity, especially the symbiotic relationship between sea buckthorn roots and mycorrhizal fungi, which can alleviate the bioavailability limitation of deep soil phosphorus through phosphorus activation mechanisms [60]. At the enzymatic level, HRS exhibited “functional compensation” traits. Despite suppressed URE and SCL activities, ALP activity remained levels comparable to NG. This multidimensional regulatory mechanism reflects the ecosystem’s adaptive strategy to preserve critical phosphorus cycling functions through metabolic pathway rebalancing [61].
Additionally, correlation analyses in this study revealed significant correlations between soil chemical and biological characteristics. Plant growth indirectly modulated soil biological characteristics via its regulation of soil chemical properties, exerting profound impacts on SQI and SMF. This conclusion is consistent with multiple previous research findings [62,63].

4.3. Impacts of NG Utilization Pattern Transformation on SQI

The SQI, which integrates soil chemical and biological properties, serves as a comprehensive tool for SQ assessment. This study referenced the arithmetic mean method previously employed for processing three-layer soil indicator data in prior research [64]. By establishing a MDS, we streamlined the complex soil quality assessment framework, enabling a more efficient evaluation of the impacts of the transformation of NG utilization patterns on soil quality SQ.
The study demonstrated that traditionally grazed NG exhibited a higher SQI compared to other utilization patterns. This finding is consistent with the results reported by Xiang et al. [65]. In the present study, this superiority of NG was primarily attributed to their elevated contribution rates in two pivotal metrics: AN and MBP. In contrast, cultivated plots with MHV and MAS showed significantly reduced SQI values. This decline was primarily caused by long-term monocropping practices and fertilizer application, which suppressed soil microbial activity and consequently reduced MBP content. Additionally, continuous harvesting of crop biomass and removal of field residues through grazing further exacerbated soil nutrient depletion [66]. In eastern India, research by Parijat et al. [67] on the effects of different land-use practices on SQ also highlighted that excessive tillage, high cropping intensity, and the absence of legumes in crop rotations contribute to agricultural soil degradation.
Furthermore, the appropriateness of MDS selection directly influences the accuracy of SQ assessment, making validation of the MDS essential. Zhang et al. [68] validated the MDS using linear regression between SQI-TDS and SQI-MDS (R2 = 0.51), demonstrating that the MDS can effectively replace the TDS for soil quality assessment in their specific study context. Wang et al. [69] in Qinghai-Tibet Plateau research (R2 = 0.86) further confirmed the regional applicability of this method within their sampling scope.
In our study, the R2 value of 0.74 indicates that the MDS is applicable to natural grasslands in the Qilian Mountains region of China and can effectively replace the TDS for comprehensive SQ assessment in this area. However, this conclusion is drawn within the constraints of our sampling design. The relatively limited number of samples, coupled with the fact that sampling was conducted in a single year, may restrict the broader generalization of our findings.

4.4. Impacts of NG Utilization Pattern Transformation on SMF

SMF, a critical indicator of soil ecosystem service capacity, reflects integrated soil functions in nutrient cycling, biodiversity maintenance, and ecological regulation. This study, through analyzing SMF under different NG utilization patterns, revealed the impacts of NG utilization patterns transformation on SMF.
The transformation of NG utilization patterns significantly altered SMF, a finding supported by previous studies [70]. Compared with traditionally grazed NG, MHV and MAS exhibited significantly lower SMF values. This decline was primarily attributed to soil acidification, reduced microbial activity, and impaired nutrient cycling functions. Prior research has indicated that decreased soil pH can weaken EMF by affecting soil microorganisms [71]. In addition, frequent mechanical disturbances and monocropping patterns further reduce the functional redundancy and stability of soil ecosystems, as pointed out by Garba et al. [72]. In contrast, HRS exhibited higher SMF than monocropped farmlands. HRS maintained soil ecosystem equilibrium through enhanced vegetation cover and litter deposition, consistent with Yan et al. [73] who reported similar effects of restorative afforestation on EMF.
Further analysis showed that there was a strong linear positive correlation between SQI and SMF, which is consistent with the research results of Wang et al. [74]. This demonstrates that enhancing SQ can synergistically improve EMF. Specifically, increasing SOC input and enhancing soil biological activity contribute to both improved soil productivity and strengthened soil functions in nutrient cycling and biodiversity conservation. Existing evaluations based on SQI and SMF on long-term fertilized farmland have conclusions consistent with the results of this study [75].

4.5. Limitations of the Study

Based on the above discussion, this study inevitably has some limitations. Due to the current imperfect research on MDS construction, where some chemical properties are omitted and no physical properties are included, generating bias in MDS selection and the general interpretation of observed soil changes, it is difficult to systematically analyze the multidimensional attribute characteristics of SQ and their interactions. Furthermore, the applicability of the SQI is limited due to a small sample size, resulting in low data capture, which fails to capture evidence of natural, spatial, and temporal variability concerning soil management variations in each cover. In addition, the applicability of the SQI is limited by the small sample size and the fact that it is based on a single year of data, which results in a low data capture rate and fails to capture evidence of natural, spatial, and temporal variability in soil use changes across the study area. Future research could validate the generalizability of a single MDS by combining previous studies [33,76], further constructing dimension-specific sub-MDS for physical, chemical, and biological characteristics of soil based on multi-year, long-term data and calculating SQI by integrating core metrics for these three types of attributes.
Furthermore, although the random forest model high showed prediction accuracy, its omission of soil microbial community parameters may restrict the depth of relevant mechanism analysis. Future studies could integrate metagenomic techniques to further explore the regulatory pathways of microbial functional communities on SQI and SMF [61].

5. Conclusions

On the northern foothills of the Qilian Mountains in China, distinct grassland utilization patterns differentially affected SQI and SMF based on a one-year sampling after cropping land harvest. Quantification of soil chemical and biological properties revealed that SQI significantly decreased in MHV and MAS due to mechanical disturbances, organic matter loss, and inhibition of microbial functions. In contrast, the HRS treatment preserved SQI relative to NG, which was primarily attributed to its higher vegetation coverage and species dominance. This preservation effect was further supported by enhanced microbial activity and optimized nutrient cycling processes. SMF and SQI demonstrated a synergistic relationship, while monocropping croplands led to SMF degradation due to biodiversity reduction and nutrient imbalance.
The random forest model revealed that soil pH had the highest predictive contribution to SQI, reaching extremely significant levels, while soil carbon sequestration stability indicators (TC and SOC) showed the most significant predictive capacity for SMF. Notably, soil pH, SOC, and MBP emerged as shared key predictors of both SQI and SMF. The findings warn of ecological risks from intensive monocropping patterns, emphasize the importance of synergistic optimization between vegetation restoration and soil biogeochemical processes in enhancing SQ and EMF, and provide critical references for sustainable regional ecosystem development and rational utilization of grassland resources.

Author Contributions

Conceptualization, X.Y.; Methodology, L.Z. and S.W.; Software, L.Z. and S.W.; Formal analysis, L.Z. and H.X.; Investigation, L.Z., S.W. and H.X.; Data curation, L.Z. and S.W.; Writing—original draft, L.Z.; Writing—review and editing, H.X. and X.Y.; Visualization, L.Z.; Project administration, X.Y.; Funding acquisition, X.Y. All authors have read and agreed to the published version of the manuscript.

Funding

This study was supported by Gansu Provincial Forestry and Grassland Bureau Gansu Grassland Monitoring and Evaluation Project (2022HT BAO 1473).

Data Availability Statement

The original contributions presented in the study are included in the article, and further inquiries can be directed to the corresponding author.

Acknowledgments

The authors thank the editors and the reviewers for their comments and constructive suggestions for improving this manuscript.

Conflicts of Interest

The authors declare no conflicts of interest.

Abbreviations

MHVMonocropping Hordeum vulgare
MASMonocropping Avena sativa
HRSHippophae rhamnoides shrubland
NGNatural grassland
SQSoil quality
SQISoil quality index
EMFEcosystem multifunctionality
SMFSoil ecosystem multifunctionality
TDSTotal data set
MDSMinimum data set
ECElectrical conductivity
SOMSoil organic matter
TCTotal carbon
TCTotal nitrogen
TPTotal phosphorus
SOCSoil organic carbon
ANAmmonium nitrogen
NNNitrate nitrogen
APAvailable phosphorus
MBCMicrobial biomass carbon
MBNMicrobial biomass nitrogen
MBPMicrobial biomass phosphorus
SCLCellulase
UREUrease
ALPAlkaline phosphatase

Appendix A

Table A1. Correlation coefficient matrix of SQ evaluation indicators.
Soil IndicatorspHECTCTNTPSOMSOCANNNAPMBCMBNMBPSCLUREALP
pH 11
EC 1−0.604 *1
TC 10.819 **−0.1471
TN 1−0.2430.042−0.2161
TP 1−0.670 *0.395−0.496−0.4541
SOM 1−0.2980.330−0.0890.5410.0161
SOC 10.767 **−0.1290.829 **0.152−0.789 **0.0851
AN 10.2950.2860.454−0.659 *0.087−0.5220.2011
NN 1−0.009−0.584 *−0.227−0.080.213−0.012−0.320−0.637 *1
AP 1−0.958 **0.610 *−0.789 **0.1730.652* 0.274−0.793 **−0.167−0.1151
MBC 10.3420.2570.5410.370−0.588 *0.2060.673 *0.375−0.815 **−0.2481
MBN 10.929 **−0.4460.827 **−0.466−0.468−0.4380.719 **0.502−0.053−0.926 **0.2601
MBP 10.848 **−0.3150.800 **0.113−0.786 **−0.0310.939 **0.235−0.288−0.864 **0.661 *0.798 **1
SCL 10.674 *−0.1300.729 **0.299−0.701 *0.2540.840 **0.058−0.317−0.670 *0.710 **0.5460.875 **1
URE 10.612 *0.0260.714 **0.305−0.797 **0.1420.882 **0.308−0.635 *−0.5560.911 **0.5110.855 **0.827 **1
ALP 10.854 **−0.2560.870 **−0.335−0.522−0.4090.813 **0.543−0.220−0.856 **0.4370.933 **0.822 **0.590 *0.621 *1
1 Soil indicators: pH (acidity-alkalinity), EC (electrical conductivity), BD (bulk density), SWC (soil water content), TC (total carbon), TN (total nitrogen), TP (total phosphorus), SOM (soil organic matter), SOC (soil organic carbon), AN (ammonium nitrogen), NN (nitrate nitrogen), AP (available phosphorus), MBC (microbial biomass carbon), MBN (microbial biomass nitrogen), MBP (microbial biomass phosphorus), SCL (cellulase), URE (urease), and ALP (alkaline phosphatase). * indicates p < 0.05, ** indicates p < 0.01.

References

  1. Enjavinezhad, S.M.; Naghibi, S.J.; Shirazi, M.P.; Baghernejad, M.; Fernandez-Raga, M.; Rodrigo-Comino, J. From fields to cities: Innovating assessment of soil quality in Southern Iran’s Urban areas. PLoS ONE 2025, 20, e0321312. [Google Scholar] [CrossRef]
  2. Drobnik, T.; Greiner, L.; Keller, A.; Gret-Regamey, A. Soil quality indicators—From soil functions to ecosystem services. Ecol. Indic. 2018, 94, 151–169. [Google Scholar] [CrossRef]
  3. Amundson, R.; Berhe, A.A.; Hopmans, J.W.; Olson, C.; Sztein, A.E.; Sparks, D.L. Soil and human security in the 21st century. Science 2015, 348, 1261071. [Google Scholar] [CrossRef]
  4. Montanarella, L.; Pennock, D.J.; McKenzie, N.; Badraoui, M.; Chude, V.; Baptista, I.; Mamo, T.; Yemefack, M.; Aulakh, M.S.; Yagi, K.; et al. World’s soils are under threat. Soil 2016, 2, 79–82. [Google Scholar] [CrossRef]
  5. Laudicina, V.A.; Ruisi, P.; Badalucco, L. Soil Quality and Crop Nutrition. Agriculture 2023, 13, 1412. [Google Scholar] [CrossRef]
  6. Baghche-Maryam, M.Z.; Sheklabadi, M.; Ayoubi, S. Covariate selection approaches in spatial prediction of soil quality indices using machine learning models at the watershed scale, west of Iran. Soil Tillage Res. 2025, 252, 106571. [Google Scholar] [CrossRef]
  7. Zou, X.; Zhu, X.; Zhu, P.; Singh, A.K.; Zakari, S.; Yang, B.; Chen, C.; Liu, W. Soil quality assessment of different Hevea brasiliensis plantations in tropical China. J. Environ. Manag. 2021, 285, 112147. [Google Scholar] [CrossRef]
  8. Biswas, S.; Hazra, G.C.; Purakayastha, T.J.; Saha, N.; Mitran, T.; Roy, S.S.; Basak, N.; Mandal, B. Establishment of critical limits of indicators and indices of soil quality in rice-rice cropping systems under different soil orders. Geoderma 2017, 292, 34–48. [Google Scholar] [CrossRef]
  9. Timilsina, B.; Kharel, M.; Shrestha, R.; Saqr, A.M.; Pant, R.R. Assessment of soil quality along the elevation gradient of the Seti River watershed in Pokhara Metropolitan City, Nepal. Environ. Monit. Assess. 2025, 197, 296. [Google Scholar] [CrossRef]
  10. Karkaj, E.S.; Sepehry, A.; Barani, H.; Motamedi, J.; Shahbazi, F. Establishing a Suitable Soil Quality Index for Semi-arid Rangeland Ecosystems in Northwest of Iran. J. Soil Sci. Plant Nutr. 2019, 19, 648–658. [Google Scholar] [CrossRef]
  11. Kahsay, A.; Haile, M.; Gebresamuel, G.; Mohammed, M. Developing soil quality indices to investigate degradation impacts of different land use types in Northern Ethiopia. Heliyon 2025, 11, e41185. [Google Scholar] [CrossRef] [PubMed]
  12. Zhu, M.; Ai, X.; Sheng, M.; Ai, S.; Miao, N.; Ai, Y. Using a soil quality index to evaluate the artificial soil quality response to rehabilitation time. Ecol. Eng. 2024, 202, 107234. [Google Scholar] [CrossRef]
  13. Byrnes, J.E.K.; Gamfeldt, L.; Isbell, F.; Lefcheck, J.S.; Griffin, J.N.; Hector, A.; Cardinale, B.J.; Hooper, D.U.; Dee, L.E.; Duffy, J.E. Investigating the relationship between biodiversity and ecosystem multifunctionality: Challenges and solutions. Methods Ecol. Evol. 2014, 5, 111–124. [Google Scholar] [CrossRef]
  14. Manning, P.; van der Plas, F.; Soliveres, S.; Allan, E.; Maestre, F.T.; Mace, G.; Whittingham, M.J.; Fischer, M. Redefining ecosystem multifunctionality. Nat. Ecol. Evol. 2018, 2, 427–436. [Google Scholar] [CrossRef] [PubMed]
  15. Creamer, R.E.; Barel, J.M.; Bongiorno, G.; Zwetsloot, M.J. The life of soils: Integrating the who and how of multifunctionality. Soil Biol. Biochem. 2022, 166, 108561. [Google Scholar] [CrossRef]
  16. Ding, J.Y.; Eldridge, D.J. Climate and plants regulate the spatial variation in soil multifunctionality across a climatic gradient. Catena 2021, 201, 105233. [Google Scholar] [CrossRef]
  17. Schulte, R.P.O.; Creamer, R.E.; Donnellan, T.; Farrelly, N.; Fealy, R.; O’Donoghue, C.; O’HUallachain, D. Functional land management: A framework for managing soil-based ecosystem services for the sustainable intensification of agriculture. Environ. Sci. Policy 2014, 38, 45–58. [Google Scholar] [CrossRef]
  18. Hu, W.; Ran, J.; Dong, L.; Du, Q.; Ji, M.; Yao, S.; Sun, Y.; Gong, C.; Hou, Q.; Gong, H.; et al. Aridity-driven shift in biodiversity-soil multifunctionality relationships. Nat. Commun. 2021, 12, 5350. [Google Scholar] [CrossRef]
  19. Schils, R.L.M.; Bufe, C.; Rhymer, C.M.; Francksen, R.M.; Klaus, V.H.; Abdalla, M.; Milazzo, F.; Lellei-Kovacs, E.; ten Berge, H.; Bertora, C.; et al. Permanent grasslands in Europe: Land use change and intensification decrease their multifunctionality. Agric. Ecosyst. Environ. 2022, 330, 107891. [Google Scholar] [CrossRef]
  20. Song, Z.; Yue, P.; Li, X.; Hu, Y.; Qiao, J.; Zuo, X. Progress in research on soil multifunctionality and influence mechanisms in grassland ecosystems. Chin. Desert 2023, 43, 151–165. [Google Scholar]
  21. Yang, L.; Jia, W.; Shi, Y.; Zhang, Z.; Xiong, H.; Zhu, G. Spatiotemporal Differentiation of Soil Organic Carbon of Grassland and Its Relationship with Soil Physicochemical Properties on the Northern Slope of Qilian Mountains, China. Sustainability 2020, 12, 9396. [Google Scholar] [CrossRef]
  22. Dignam, B.E.A.; O’Callaghan, M.; Condron, L.M.; Raaijmakers, J.M.; Kowalchuk, G.A.; Wakelin, S.A. Challenges and opportunities in harnessing soil disease suppressiveness for sustainable pasture production. Soil Biol. Biochem. 2016, 95, 100–111. [Google Scholar] [CrossRef]
  23. Hassen, E.E.; Assen, M. Land use/cover dynamics and its drivers in Gelda catchment, Lake Tana watershed, Ethiopia. Environ. Syst. Res. 2017, 6, 4. [Google Scholar] [CrossRef]
  24. Tian, B.; XIao, Q. Compendium of Administrative Divisions of the People’s Republic of China: Gansu Province Volume; China Social Press: Beijing, China, 2016. [Google Scholar]
  25. China Soil Science Database. Available online: http://vdb3.soil.csdb.cn/ (accessed on 20 March 2025).
  26. World Reference Base for Soil Resources 2022. Available online: https://www.fao.org/soils-portal (accessed on 29 March 2025).
  27. NY/T 1377-2007; Determination of Soil pH. 2007. Institute of Agricultural Quality Standards and Testing Technology: Beijing, China, 2007.
  28. Bao, S. Soil and Agricultural Chemistry Analysis; China Agricultural Press: Beijing, China, 2000. [Google Scholar]
  29. GB/T 39228-2020; Determination of Soil Microbial Biomass—Fumigation Extraction Method. Standardization Administration of China: Beijing, China, 2020.
  30. Guan, S. Soil Enzymes and Their Research Methods; China Agricultural Press: Beijing, China, 1986. [Google Scholar]
  31. Damiba, W.A.F.; Gathenya, J.M.; Raude, J.M.; Home, P.G. Soil quality index (SQI) for evaluating the sustainability status of Kakia-Esamburmbur catchment under three different land use types in Narok County, Kenya. Heliyon 2024, 10, e25611. [Google Scholar] [CrossRef] [PubMed]
  32. Carbajal, C.; Moya-Ambrosio, F.; Barja, A.; Ottos-Diaz, E.; Aguilar-Tito, C.; Advíncula-Zeballos, O.; Cruz-Luis, J.; Solórzano-Acosta, R. Soil quality variation associated with land cover in the Peruvian jungle of the Junín region. Soil Secur. 2025, 19, 100188. [Google Scholar] [CrossRef]
  33. Vasu, D.; Tiwary, P.; Chandran, P. A novel and comprehensive soil quality index integrating soil morphological, physical, chemical, and biological properties. Soil Tillage Res. 2024, 244, 106246. [Google Scholar] [CrossRef]
  34. Zhu, Z.; Chen, J.; Hu, H.; Zhou, M.; Zhu, Y.; Wu, C.; Zhu, L.; Jiang, X.; Wang, J. Soil quality evaluation of different land use modes in small watersheds in the hilly region of southern Jiangsu. Ecol. Indic. 2024, 160, 111895. [Google Scholar] [CrossRef]
  35. Li, X.; Bai, J. Evaluation of soil quality of four land-use modes on the southern Tibetan Plateau. Grass Sci. 2024, 41, 1614–1623. [Google Scholar]
  36. Yazhuan, S.; Yang, Y.; Cai, L.D.; Yufeng, A.; Fujiang, H. Effects of grazing on soil quality of alpine typical grassland in Qilian Mountains. Ecol. Lett. 2023, 43, 6364–6377. [Google Scholar]
  37. Ebadati, E.; Switalska, E.; Lombi, E.; Warren-Smith, S.C.; Evans, D. Challenges of polymer-based pH sensing in soil. J. Polym. Sci. 2024, 62, 32–41. [Google Scholar] [CrossRef]
  38. Hartemink, A.E.; Barrow, N.J. Soil pH-nutrient relationships: The diagram. Plant Soil 2023, 486, 209–215. [Google Scholar] [CrossRef]
  39. Khalili, A.; Ramesh, A.; Sharma, M.P. Soil Rhizosphere pH, Enzymatic and Microbial Activities Under Different Nitrogen and Sulfur Fertilization of Soybean (Glycine max L.). J. Soil Sci. Plant Nutr. 2024, 24, 3986–3999. [Google Scholar] [CrossRef]
  40. Kavvadias, V.; Ioannou, Z.; Vavoulidou, E.; Paschalidis, C. Short Term Effects of Chemical Fertilizer, Compost and Zeolite on Yield of Lettuce, Nutrient Composition and Soil Properties. Agriculture 2023, 13, 1022. [Google Scholar] [CrossRef]
  41. Souza, J.L.B.; Antonangelo, J.A.; Zhang, H.; Reed, V.; Finch, B.; Arnall, B. Impact of long-term fertilization in no-till on the stratification of soil acidity and related parameters. Soil Tillage Res. 2023, 228, 105624. [Google Scholar] [CrossRef]
  42. Naveed, M.; Brown, L.K.; Raffan, A.C.; George, T.S.; Bengough, A.G.; Roose, T.; Sinclair, I.; Koebernick, N.; Cooper, L.; Hackett, C.A.; et al. Plant exudates may stabilize or weaken soil depending on species, origin and time. Eur. J. Soil Sci. 2017, 68, 806–816. [Google Scholar] [CrossRef]
  43. Lu, P.; Yang, T.; Li, L.; Zhao, B.; Liu, J. Response of oat morphologies, root exudates, and rhizosphere fungal communities to amendments in a saline-alkaline environment. PLoS ONE 2020, 15, e0243301. [Google Scholar] [CrossRef]
  44. Raza, S.; Miao, N.; Wang, P.; Ju, X.; Chen, Z.; Zhou, J.; Kuzyakov, Y. Dramatic loss of inorganic carbon by nitrogen-induced soil acidification in Chinese croplands. Glob. Change Biol. 2020, 26, 3738–3751. [Google Scholar] [CrossRef] [PubMed]
  45. Chu, L.; Yuan, S.; Chen, D.; Kang, Y.; Shaghaleh, H.; Okla, M.K.; AbdElgawad, H.; Alhaj Hamoud, Y. Changes in salinity and vegetation growth under different land use types during the reclamation in coastal saline soil. Chemosphere 2024, 366, 143427. [Google Scholar] [CrossRef]
  46. Baridón, J.E.; Casas, R.R. Salinity Dynamics in Subsoiled Soils of the Northwest of the Argentine Pampean Plain. Int. J. Plant Soil Sci. 2021, 33, 51–59. [Google Scholar] [CrossRef]
  47. Zhang, L.; Mao, L.; Yan, X.; Liu, C.; Song, X.; Sun, X. Long-term cotton stubble return and subsoiling increases cotton yield through improving root growth and properties of coastal saline soil. Ind. Crops Prod. 2022, 177, 114472. [Google Scholar] [CrossRef]
  48. Anning, D.K.; Ghanney, P.; Qiu, H.; Abalori, T.A.; Zhang, C.; Luo, C. Stimulation of soil organic matter fractions by maize straw return and nitrogen fertilization in the Loess Plateau of Northwest China. Appl. Soil Ecol. 2023, 191, 105061. [Google Scholar] [CrossRef]
  49. Yu, X.; Liu, X.; Zhao, Z.; Liu, J.; Zhang, S. Effect of Monospecific and Mixed SeaBuckthorn (Hippophae rhamnoides) Plantations on the Structure and Activity of Soil Microbial Communities. PLoS ONE 2015, 10, e0117505. [Google Scholar] [CrossRef]
  50. Angers, D.; Arrouays, D.; Cardinael, R.; Chenu, C.; Corbeels, M.; Demenois, J.; Farrell, M.; Martin, M.; Minasny, B.; Recous, S.; et al. A well-established fact: Rapid mineralization of organic inputs is an important factor for soil carbon sequestration. Eur. J. Soil Sci. 2022, 73, e13242. [Google Scholar] [CrossRef]
  51. Spiegel, H.; Sanden, T.; Sanden, H.; Goetzinger, S.; Miloczki, J.; Kandeler, E. Changes in Biological and Chemical Soil Properties in an Austrian Long-Term Tillage Experiment. Eur. J. Soil Sci. 2025, 76, e70037. [Google Scholar] [CrossRef]
  52. Ma, H.; Zhang, H.; Gao, Q.; Li, S.; Yu, Y.; Ma, J.; Zheng, C.; Cui, M.; Wu, Z.; Zhang, H. The Relative Contribution of Root Morphology and Arbuscular Mycorrhizal Fungal Colonization on Phosphorus Uptake in Rice/Soybean Intercropping Under Dry Cultivation. Plants 2025, 14, 106. [Google Scholar] [CrossRef]
  53. Jiang, M.; Crous, K.Y.; Carrillo, Y.; Macdonald, C.A.; Anderson, I.C.; Boer, M.M.; Farrell, M.; Gherlenda, A.N.; Castaneda-Gomez, L.; Hasegawa, S.; et al. Microbial competition for phosphorus limits the CO2 response of a mature forest. Nature 2024, 630, 660–665. [Google Scholar] [CrossRef]
  54. Du, Z.; Bai, H.; Liu, M.; Liu, Y.; Zhu, G.; Chai, G.; He, Y.; Shi, J.; Duan, Y. Response of ecological stoichiometry and homeostasis characteristic to nitrogen addition in Hippophae rhamnoides L. Sci. Total Environ. 2024, 951, 175591. [Google Scholar] [CrossRef] [PubMed]
  55. Jordan, D.; Ponder, F., Jr.; Hubbard, V.C. Effects of soil compaction, forest leaf litter and nitrogen fertilizer on two oak species and microbial activity. Appl. Soil Ecol. 2003, 23, 33–41. [Google Scholar] [CrossRef]
  56. Tan, X.; Chang, S.X.; Kabzems, R. Soil compaction and forest floor removal reduced microbial biomass and enzyme activities in a boreal aspen forest soil. Biol. Fertil. Soils 2007, 44, 471–479. [Google Scholar] [CrossRef]
  57. Ibrahim, M.M.; Tong, C.; Hu, K.; Zhou, B.; Xing, S.; Mao, Y. Biochar-fertilizer interaction modifies N-sorption, enzyme activities and microbial functional abundance regulating nitrogen retention in rhizosphere soil. Sci. Total Environ. 2020, 739, 140065. [Google Scholar] [CrossRef]
  58. Pinsonneault, A.J.; Moore, T.R.; Roulet, N.T. Effects of long-term fertilization on peat stoichiometry and associated microbial enzyme activity in an ombrotrophic bog. Biogeochemistry 2016, 129, 149–164. [Google Scholar] [CrossRef]
  59. dos Santos Cordeiro, C.F.; Echer, F.R.; Araujo, F.F. Cover Crops Impact Crops Yields by Improving Microbiological Activity and Fertility in Sandy Soil. J. Soil Sci. Plant Nutr. 2021, 21, 1968–1977. [Google Scholar] [CrossRef]
  60. Tawaraya, K. Response of mycorrhizal symbiosis to phosphorus and its application for sustainable crop production and remediation of environment. Soil Sci. Plant Nutr. 2022, 68, 241–245. [Google Scholar] [CrossRef]
  61. Xiao, Y.; Wang, J.; Wang, B.; Fan, B.; Zhou, G. Soil microbial network complexity predicts soil multifunctionality better than soil microbial diversity during grassland-farmland-shrubland conversion on the Qinghai-Tibetan Plateau. Agric. Ecosyst. Environ. 2025, 379, 109356. [Google Scholar] [CrossRef]
  62. Han, Z.; Sui, X.; Li, M. Effects of Forest Age on Soil Fungal Community in a Northern Temperate Ecosystem. Indian J. Microbiol. 2016, 56, 328–334. [Google Scholar] [CrossRef]
  63. Yannikos, N.; Leinweber, P.; Helgason, B.L.; Baum, C.; Walley, F.L.; Van Rees, K.C.J. Impact of Populus trees on the composition of organic matter and the soil microbial community in Orthic Gray Luvisols in Saskatchewan (Canada). Soil Biol. Biochem. 2014, 70, 5–11. [Google Scholar] [CrossRef]
  64. Shirima, D.D.; Totland, O.; Moe, S.R. The relative importance of vertical soil nutrient heterogeneity, and mean and depth-specific soil nutrient availabilities for tree species richness in tropical forests and woodlands. Oecologia 2016, 182, 877–888. [Google Scholar] [CrossRef] [PubMed]
  65. Xiang, H.; Xu, J.; Yang, H.; Song, J.; Yu, X. Reduced Soil Quality but Increased Microbial Diversity in Cultivated Land Compared to Other Land-Use Types in the Longzhong Loess Plateau. Agriculture 2024, 14, 2106. [Google Scholar] [CrossRef]
  66. Kuzyakov, Y.; Zamanian, K. Reviews and syntheses: Agropedogenesis—Humankind as the sixth soil-forming factor and attractors of agricultural soil degradation. Biogeosciences 2019, 16, 4783–4803. [Google Scholar] [CrossRef]
  67. De, P.; Deb, S.; Deb, D.; Chakraborty, S.; Santra, P.; Dutta, P.; Hoque, A.; Choudhury, A. Soil quality under different land uses in eastern India: Evaluation by using soil indicators and quality index. PLoS ONE 2022, 17, e0275062. [Google Scholar] [CrossRef]
  68. Zhang, Z.; Han, J.; Yin, H.; Xue, J.; Jia, L.; Zhen, X.; Chang, J.; Wang, S.; Yu, B. Assessing the effects of different long-term ecological engineering enclosures on soil quality in an alpine desert grassland area. Ecol. Indic. 2022, 143, 109426. [Google Scholar] [CrossRef]
  69. Wang, Z.; Jia, L.; Yang, L.; Guo, Z.; Sang, W.; Lu, L.; Xiao, C. Assessment of the Effects of Fencing Enclosure on Soil Quality Based on Minimum Data Set in Biru County of the Qinghai-Tibet Plateau, China. Agronomy 2023, 13, 1558. [Google Scholar] [CrossRef]
  70. Lopezosa, P.; Soliveres, S.; Serra, L.; Constan-Nava, S.; Berdugo, M. Land use determines Mediterranean ecosystems’ multifunctionality more than plant richness or habitat composition. J. Appl. Ecol. 2024, 61, 476–488. [Google Scholar] [CrossRef]
  71. Gu, S.; Wu, S.; Zeng, W.; Deng, Y.; Luo, G.; Li, P.; Yang, Y.; Wang, Z.; Hu, Q.; Tan, L. High-elevation-induced decrease in soil pH weakens ecosystem multifunctionality by influencing soil microbiomes. Environ. Res. 2024, 257, 119330. [Google Scholar] [CrossRef]
  72. Garba, I.I.; Bell, L.W.; Chauhan, B.S.; Williams, A. Optimizing ecosystem function multifunctionality with cover crops for improved agronomic and environmental outcomes in dryland cropping systems. Agric. Syst. 2024, 214, 103821. [Google Scholar] [CrossRef]
  73. Yan, Y.; Wang, J.; Ding, J.; Zhang, S.; Zhao, W. Afforestation promotes ecosystem multifunctionality in a hilly area of the Loess Plateau. Catena 2023, 223, 106905. [Google Scholar] [CrossRef]
  74. Wang, C.; Ma, Y.; He, W.; Kuzyakov, Y.; Bol, R.; Chen, H.; Fan, M. Soil quality and ecosystem multifunctionality after 13-year of organic and nitrogen fertilization. Sci. Total Environ. 2024, 931, 172789. [Google Scholar] [CrossRef]
  75. Jia, R.; Zhou, J.; Chu, J.; Shahbaz, M.; Yang, Y.; Jones, D.L.; Zang, H.; Razavi, B.S.; Zeng, Z. Insights into the associations between soil quality and ecosystem multifunctionality driven by fertilization management: A case study from the North China Plain. J. Clean. Prod. 2022, 362, 132265. [Google Scholar] [CrossRef]
  76. Andres-Abellan, M.; Wic-Baena, C.; Lopez-Serrano, F.R.; Garcia-Morote, F.A.; Martinez-Garcia, E.; Picazo, M.I.; Rubio, E.; Moreno-Ortego, J.L.; Bastida-Lopez, F.; Garcia-Izquierdo, C. A soil-quality index for soil from Mediterranean forests. Eur. J. Soil Sci. 2019, 70, 1001–1011. [Google Scholar] [CrossRef]
Figure 1. Location map of the study area and sampling sites: monocropping Hordeum vulgare (MHV), monocropping Avena sativa (MAS), Hippophae rhamnoides shrubland (HRS), and natural grassland (NG).
Agronomy 15 01461 g001
Figure 2. Soil chemical properties under different NG utilization patterns: soil pH (a), electrical conductivity (b), total carbon (c), total nitrogen (d), total phosphorus (e), organic matter (f), organic carbon (g), ammonium nitrogen (h), nitrate nitrogen (i), and available phosphorus (j). The number of * indicates significant level of differences among MHV, MAS, HRS, and control NG; the folded line connects the average values of different soil layers for the same indicator; MHV: monocropping Hordeum vulgare, MAS: monocropping Avena sativa, HRS: Hippophae rhamnoides shrubland, NG: natural grassland.
Agronomy 15 01461 g002
Figure 3. Soil biological characteristics under different NG utilization patterns: Soil microbial carbon (a), microbial nitrogen (b), and microbial phosphorus content (c), cellulase (d), urease (e), and alkaline phosphatase (f) activity. The number of * indicates significant level of differences among MHV, MAS, HRS, and control NG; the folded line connects the average values of different soil layers for the same indicator; MHV: monocropping Hordeum vulgare, MAS: monocropping Avena sativa, HRS: Hippophae rhamnoides shrubland, NG: natural grassland.
Agronomy 15 01461 g003
Figure 4. SQI under different NG utilization patterns (a), where lower case letters (a, b and c) represent the comparison of significance under the four treatments. Proportion of SQI explained by MDS components (b), where EC is electrical conductivity, TN is total nitrogen content, AN is nitrate nitrogen content, and MBP is microbial phosphorus content. Radar plot analysis (c). Linear regression analysis between SQI-TDS and SQI-MDS (d). SQI-TDS is the SQI calculated for the total data set, and SQI-MDS is the SQI calculated for the minimum data set. MHV: Monocropping Hordeum vulgare, MAS: monocropping Avena sativa, HRS: Hippophae rhamnoides shrubland, NG: natural grassland.
Agronomy 15 01461 g004
Figure 5. SMF under different NG utilization patterns (a), where lower case letters (a, b, and c) represent the comparison of significance under the four treatments. SMF across soil layers (b), where lower case letters (a, b, c, and d) represent the comparison of significance of each soil layer under the four treatments. Radar plot analysis of indicators involved in SMF (c). Linear regression analysis between SQI and SMF (d). Soil indicators: pH (acidity-alkalinity), EC (electrical conductivity), TC (total carbon), TN (total nitrogen), TP (total phosphorus), SOM (soil organic matter), SOC (soil organic carbon), AN (ammonium nitrogen), NN (nitrate nitrogen), AP (available phosphorus), MBC (microbial biomass carbon), MBN (microbial biomass nitrogen), MBP (microbial biomass phosphorus), SCL (cellulase), URE (urease), and ALP (alkaline phosphatase). MHV: monocropping Hordeum vulgare, MAS: monocropping Avena sativa, HRS: Hippophae rhamnoides shrubland, NG: natural grassland.
Agronomy 15 01461 g005
Figure 6. Mantel test of soil indicators on SQI and SMF (a) and random forest model predictions (b,c). In the figure, ns represents p > 0.05, * represents p < 0.05, ** represents p < 0.01, *** represents p < 0.001. Soil indicators: pH (acidity-alkalinity), EC (electrical conductivity), TC (total carbon), TN (total nitrogen), TP (total phosphorus), SOM (soil organic matter), SOC (soil organic carbon), AN (am-monium nitrogen), NN (nitrate nitrogen), AP (available phosphorus), MBC (microbial biomass carbon), MBN (microbial biomass nitrogen), MBP (microbial biomass phosphorus), SCL (cellulase), URE (urease), and ALP (alkaline phosphatase).
Agronomy 15 01461 g006
Table 1. Comparison table of treatment group information.
Related InformationMHV 1MAS 2HRS 3
Conversion time201220122000
SpeciesOatBarleySea buckthorn
Crop cyclesApril-OctoberJune-SeptemberPerennial
Machinery usedTractor-drawn share plows, disc harrows, and harvestersTractor-drawn share plows, disc harrows, harvesters, and balersNone
IrrigationModeFlood irrigationFlood irrigationNone
Times22None
AgrochemicalBrand nameBenzenesulfuron, tebuconazoleBenzenesulfuron, tebuconazoleNone
Frequency22None
1 Monocropping Hordeum vulgare (MHV), 2 Monocropping Avena sativa (MAS), 3 Hippophae rhamnoides shrubland (HRS).
Table 2. Types of evaluation indicators and membership functions.
Function TypeEvaluation IndicatorsMembership FunctionsMembership Parameters
a1b1b2a2Unit
S-type TC 1 f ( x ) = 0.1 x a 1 0.1 + 0.9 x a 1 x a 1 a 1 < x < a 2 1 x a 2 25.86 27.60 g kg−1
TN 12.50 3.56 g kg−1
TP 10.60 0.79 g kg−1
SOM 147.72 54.51g kg−1
SOC 121.31 23.46 g kg−1
AN 15.87 8.74 mg kg−1
NN 15.73 19.24 mg kg−1
AP 120.10 41.13 mg kg−1
MBC 1346.93 556.60 mg kg−1
MBN 126.40 37.40 mg kg−1
MBP 16.71 16.02 mg kg−1
SCL 10.02 0.03 mg g−1 24 h−1
URE 160.56 111.92 mg g−1 24 h−1
ALP 170.56 95.84 mg g−1 24 h−1
Inverse s-typeEC 1 f ( x ) = 1 x a 1 1 0.9 x a 1 a 2 a 1 a 1 < x < a 2 0.1 x a 2 0.35 0.39ms cm−1
Parabolic shapepH 1 f ( x ) = 0.1 x a 1 0.1 + 0.9 x a 1 b 1 a 1 a 1 < x < b 1 1 b 1 x b 2 1 0.9 x b 2 a 2 b 2 b 2 < x < a 2 0.1 x a 2 7.737.787.907.93-
1 Soil indicators: pH (acidity-alkalinity), EC (electrical conductivity), TC (total carbon), TN (total nitrogen), TP (total phosphorus), SOM (soil organic matter), SOC (soil organic carbon), AN (ammonium nitrogen), NN (nitrate nitrogen), AP (available phosphorus), MBC (microbial biomass carbon), MBN (microbial biomass nitrogen), MBP (microbial biomass phosphorus), SCL (cellulase), URE (urease), ALP (alkaline phosphatase). x: Raw soil measurement data. f(x): Normalized indicator score. a1, a2: Lower/upper limits (min/max of original data). b1, b2: Optimal interval bounds (quantile method).
Table 3. Principal component loading matrix and determination of MDS components.
Soil IndicatorsPrincipal ComponentsNormGroupMDS
PC1 2PC2 2PC3 2
pH 10.904−0.347−0.1642.732 1No
EC 1−0.2930.5490.6591.678 2Yes
TC 10.891−0.0970.1242.622 1No
TN 1−0.0300.781−0.531.643 2Yes
TP 1−0.765−0.2650.3772.368 1No
SOM 1−0.150.705−0.3131.434 2No
SOC 10.9370.200−0.0872.771 1No
AN 10.380−0.2410.8821.844 3Yes
NN 1−0.332−0.555−0.7091.795 3No
AP 1−0.8800.3630.2772.695 1No
MBC 10.6620.6450.2882.306 2No
MBN 10.861−0.4850.0712.671 1No
MBP 10.9680.093−0.1272.847 1Yes
SCL 10.8340.353−0.1832.540 1No
URE 10.8610.4710.0902.664 1No
ALP 10.898−0.3040.1762.701 1No
Eigenvalue8.5743.2462.539
Contribution/%53.58720.28515.870
Cumulative contribution/%53.58773.87289.742
1 Soil indicators: pH (acidity-alkalinity), EC (electrical conductivity), TC (total carbon), TN (total nitrogen), TP (total phosphorus), SOM (soil organic matter), SOC (soil organic carbon), AN (ammonium nitrogen), NN (nitrate nitrogen), AP (available phosphorus), MBC (microbial biomass carbon), MBN (microbial biomass nitrogen), MBP (microbial biomass phosphorus), SCL (cellulase), URE (urease), ALP (alkaline phosphatase). 2 PC (principal component).
Table 4. TDS and MDS common factor variance and weights.
Soil IndicatorsTDS 2MDS 3
Common Factor VarianceWeightCommon Factor VarianceWeight
pH 10.9650.067
EC 10.8220.057 0.8220.225
TC 10.8190.057
TN 10.8920.062 0.8920.244
TP 10.7980.056
SOM 10.6180.043
SOC 10.9260.064
AN 10.9790.068 0.9790.268
NN 10.920.064
AP 10.9830.068
MBC 10.9380.065
MBN 10.9810.068
MBP 10.9610.067 0.9610.263
SCL 10.8540.059
URE 10.9720.068
ALP 10.930.065
1 Soil indicators: pH (acidity-alkalinity), EC (electrical conductivity), TC (total carbon), TN (total nitrogen), TP (total phosphorus), SOM (soil organic matter), SOC (soil organic carbon), AN (ammonium nitrogen), NN (nitrate nitrogen), AP (available phosphorus), MBC (microbial biomass carbon), MBN (microbial biomass nitrogen), MBP (microbial biomass phosphorus), SCL (cellulase), URE (urease), ALP (alkaline phosphatase). 2 TDS (total data Set). 3 MDS (minimum data set).
Disclaimer/Publisher’s Note: The statements, opinions and data contained in all publications are solely those of the individual author(s) and contributor(s) and not of MDPI and/or the editor(s). MDPI and/or the editor(s) disclaim responsibility for any injury to people or property resulting from any ideas, methods, instructions or products referred to in the content.

