Article

Quantitative Resolution of Phosphorus Sources in an Agricultural Watershed of Southern China: Application of Phosphate Oxygen Isotopes and Multiple Models

1
State Key Laboratory of Environmental Criteria and Risk Assessment, Chinese Research Academy of Environmental Sciences, Beijing 100012, China
2
Department of Science, Technology and Finance, Ministry of Ecology and Environment of the People’s Republic of China, Beijing 100006, China
3
Foreign Environmental Cooperation Center, Ministry of Ecology and Environment of the People’s Republic of China, Beijing 100035, China
4
Department of Civil and Environmental Engineering, Florida A&M University (FAMU)-Florida State University (FSU) Joint College of Engineering, Tallahassee, FL 32310, USA
*
Authors to whom correspondence should be addressed.
Agronomy 2025, 15(3), 663; https://doi.org/10.3390/agronomy15030663
Submission received: 14 February 2025 / Revised: 2 March 2025 / Accepted: 5 March 2025 / Published: 6 March 2025
(This article belongs to the Special Issue The Impact of Land Use Change on Soil Quality Evolution)

Abstract

:
Phosphorus is the primary contributor to eutrophication in water bodies, and identifying phosphorus sources in rivers is crucial for controlling phosphorus pollution and subsequent eutrophication. Although phosphate oxygen isotopes (δ18OP) have the capacity to trace phosphorus sources and cycling in water and sediments, they have not been used in small- to medium-sized watersheds, such as the Xiaodongjiang River (XDJ), which is located in an agricultural watershed, source–complex region of southern China. This study employed phosphate oxygen isotope techniques in combination with a land-use-based mixed end-member model and the MixSIAR Bayesian mixing model to quantitatively determine potential phosphorus sources in surface water and sediments. The δ18OP values of the surface water ranged from 5.72‰ to 15.02‰, while those of sediment ranged from 10.41‰ to 16.80‰. In the downstream section, the δ18OP values of the surface water and sediment were similar, suggesting that phosphate in the downstream water was primarily influenced by endogenous sediment control. The results of the land-use–source mixing model and Bayesian model framework demonstrated that controlling phosphorus inputs from fertilizers is essential for reducing phosphorus emissions in the XDJ watershed. Furthermore, ongoing rural sewage treatment, manure management, and the resource utilization of aquaculture substrates contributed to reduced phosphorus pollution. This study showed that isotope techniques, combined with multi-model approaches, effectively assessed phosphorus sources in complex watersheds, offering a theoretical basis for phosphorus pollution management to prevent eutrophication.

1. Introduction

Phosphorus is a critical nutrient element for energy transfer and growth of aquatic organisms, which plays a pivotal role in maintaining the health of aquatic ecosystems [1,2]. Anthropogenic phosphorus inputs (e.g., fertilizer application and domestic sewage discharge) increase the risk of eutrophication in water bodies [3,4,5,6]; small- and medium-sized watersheds are more vulnerable to these anthropogenic impacts compared to large watersheds [7]. Dissolved phosphate in water is easily accessible to organisms and can enter sediments through adsorption or sedimentation processes [8]. In addition, under hypoxic conditions, phosphorus in sediments is readily transformed into dissolved phosphate and released into the surface water column [9]. In recent decades, increased anthropogenic inputs, extreme climatic events, wildfires, and waste incineration have accelerated phosphorus loss from land to water bodies [10,11,12], posing a major threat to water quality. Therefore, identifying and quantifying phosphorus sources in water bodies and sediments is essential for formulating management strategies to protect river ecosystems.
Phosphate oxygen isotope ratios (δ18OP) are commonly used to characterize phosphorus dynamics in terrestrial and aquatic systems [7,13,14]. Phosphorus has only one stable isotope (31P) when present as phosphate, and only biological processes can disrupt the P-O bond in surface water under ambient temperature, pressure, and neutral pH conditions [15,16]. When microorganisms fully utilize phosphate, δ18OP approaches the equilibrium oxygen isotope value (Eδ18OP). In this case, δ18OP cannot be used to trace phosphorus sources but can indicate phosphate biotransformation [13,17]. Previous studies have shown significant differences between observed δ18OP and Eδ18OP in river water. When δ18OP is not in isotopic equilibrium with its environment, it can be used to trace phosphate sources [17,18]. For example, Wang et al. [14] used δ18OP to track down phosphorus sources in the Yangtze River Basin and found that chemical fertilizers were the dominant phosphorus source. Ishida et al. [7] used δ18OP to characterize the impacts of non-point phosphorus sources in Japan’s Yasu River Basin. Furthermore, river and sediment δ18OP characteristics help specify the impact of endogenous releases on phosphorus dynamics in water bodies [19,20]. Therefore, isotope techniques are effective in identifying phosphorus sources, and tracing the ultimate sources of phosphate in freshwater and sediments is critical for phosphorus management to mitigate eutrophication in watersheds.
While δ18OP can differentiate among different phosphorus sources, it cannot quantitatively characterize the contribution of each source. Various mixing models have, thus, been developed for isotope quantification, including the IsoError model, IsoSource software (developed by the U.S. Environmental Protection Agency (Washington, WA, USA)), Stable Isotope Analysis in R (SIAR), and Bayesian Stable Isotope Mixing (MixSIAR), which are commonly used in isotope studies [21,22]. However, these models have limitations. For example, the IsoError model is restricted by the number of isotopes [23] and unlike the SIAR and MixSIAR models, IsoSource does not account for source uncertainty. The MixSIAR model accounts for source uncertainty and is well-suited for complex systems and high-precision source resolution studies. In prior studies, isotope mixing models are widely used for characterizing nitrate source [24,25,26]. However, their application to characterizing phosphorus in terms of δ18OP is limited.
Xiaodongjiang (XDJ) is a tributary of the Jianjiang River, the largest river in western Guangdong and a crucial water source for Maoming and Zhanjiang cities in Guangdong Province. Through various anthropogenic activities, domestic sewage, livestock and poultry wastewater, fertilizers, and pesticides enter the river, leading to phosphorus accumulation and water quality deterioration in XDJ. This poses a growing challenge to maintaining the watershed’s water quality [27,28]. Owing to its smaller water volumes and diverse land use types, XDJ has been significantly impacted by phosphorus and the subsequent eutrophication. Therefore, identifying phosphorus sources in the XDJ watershed is crucial for regulating anthropogenic inputs and implementing management strategies. This study used δ18OP values to trace phosphorus sources in XDJ and its sub-basins and aimed to (1) explore whether δ18OP can serve as a key indicator for source resolution in regions strongly affected by precipitation and storm events and (2) characterize watershed phosphorus contributions using a land-use-type mixed end-member model and MixSIAR model. This study expands the application of δ18OP as a tracer and provides theoretical insights for phosphorus management and phosphorus pollution restoration in the XDJ watershed.

2. Materials and Methods

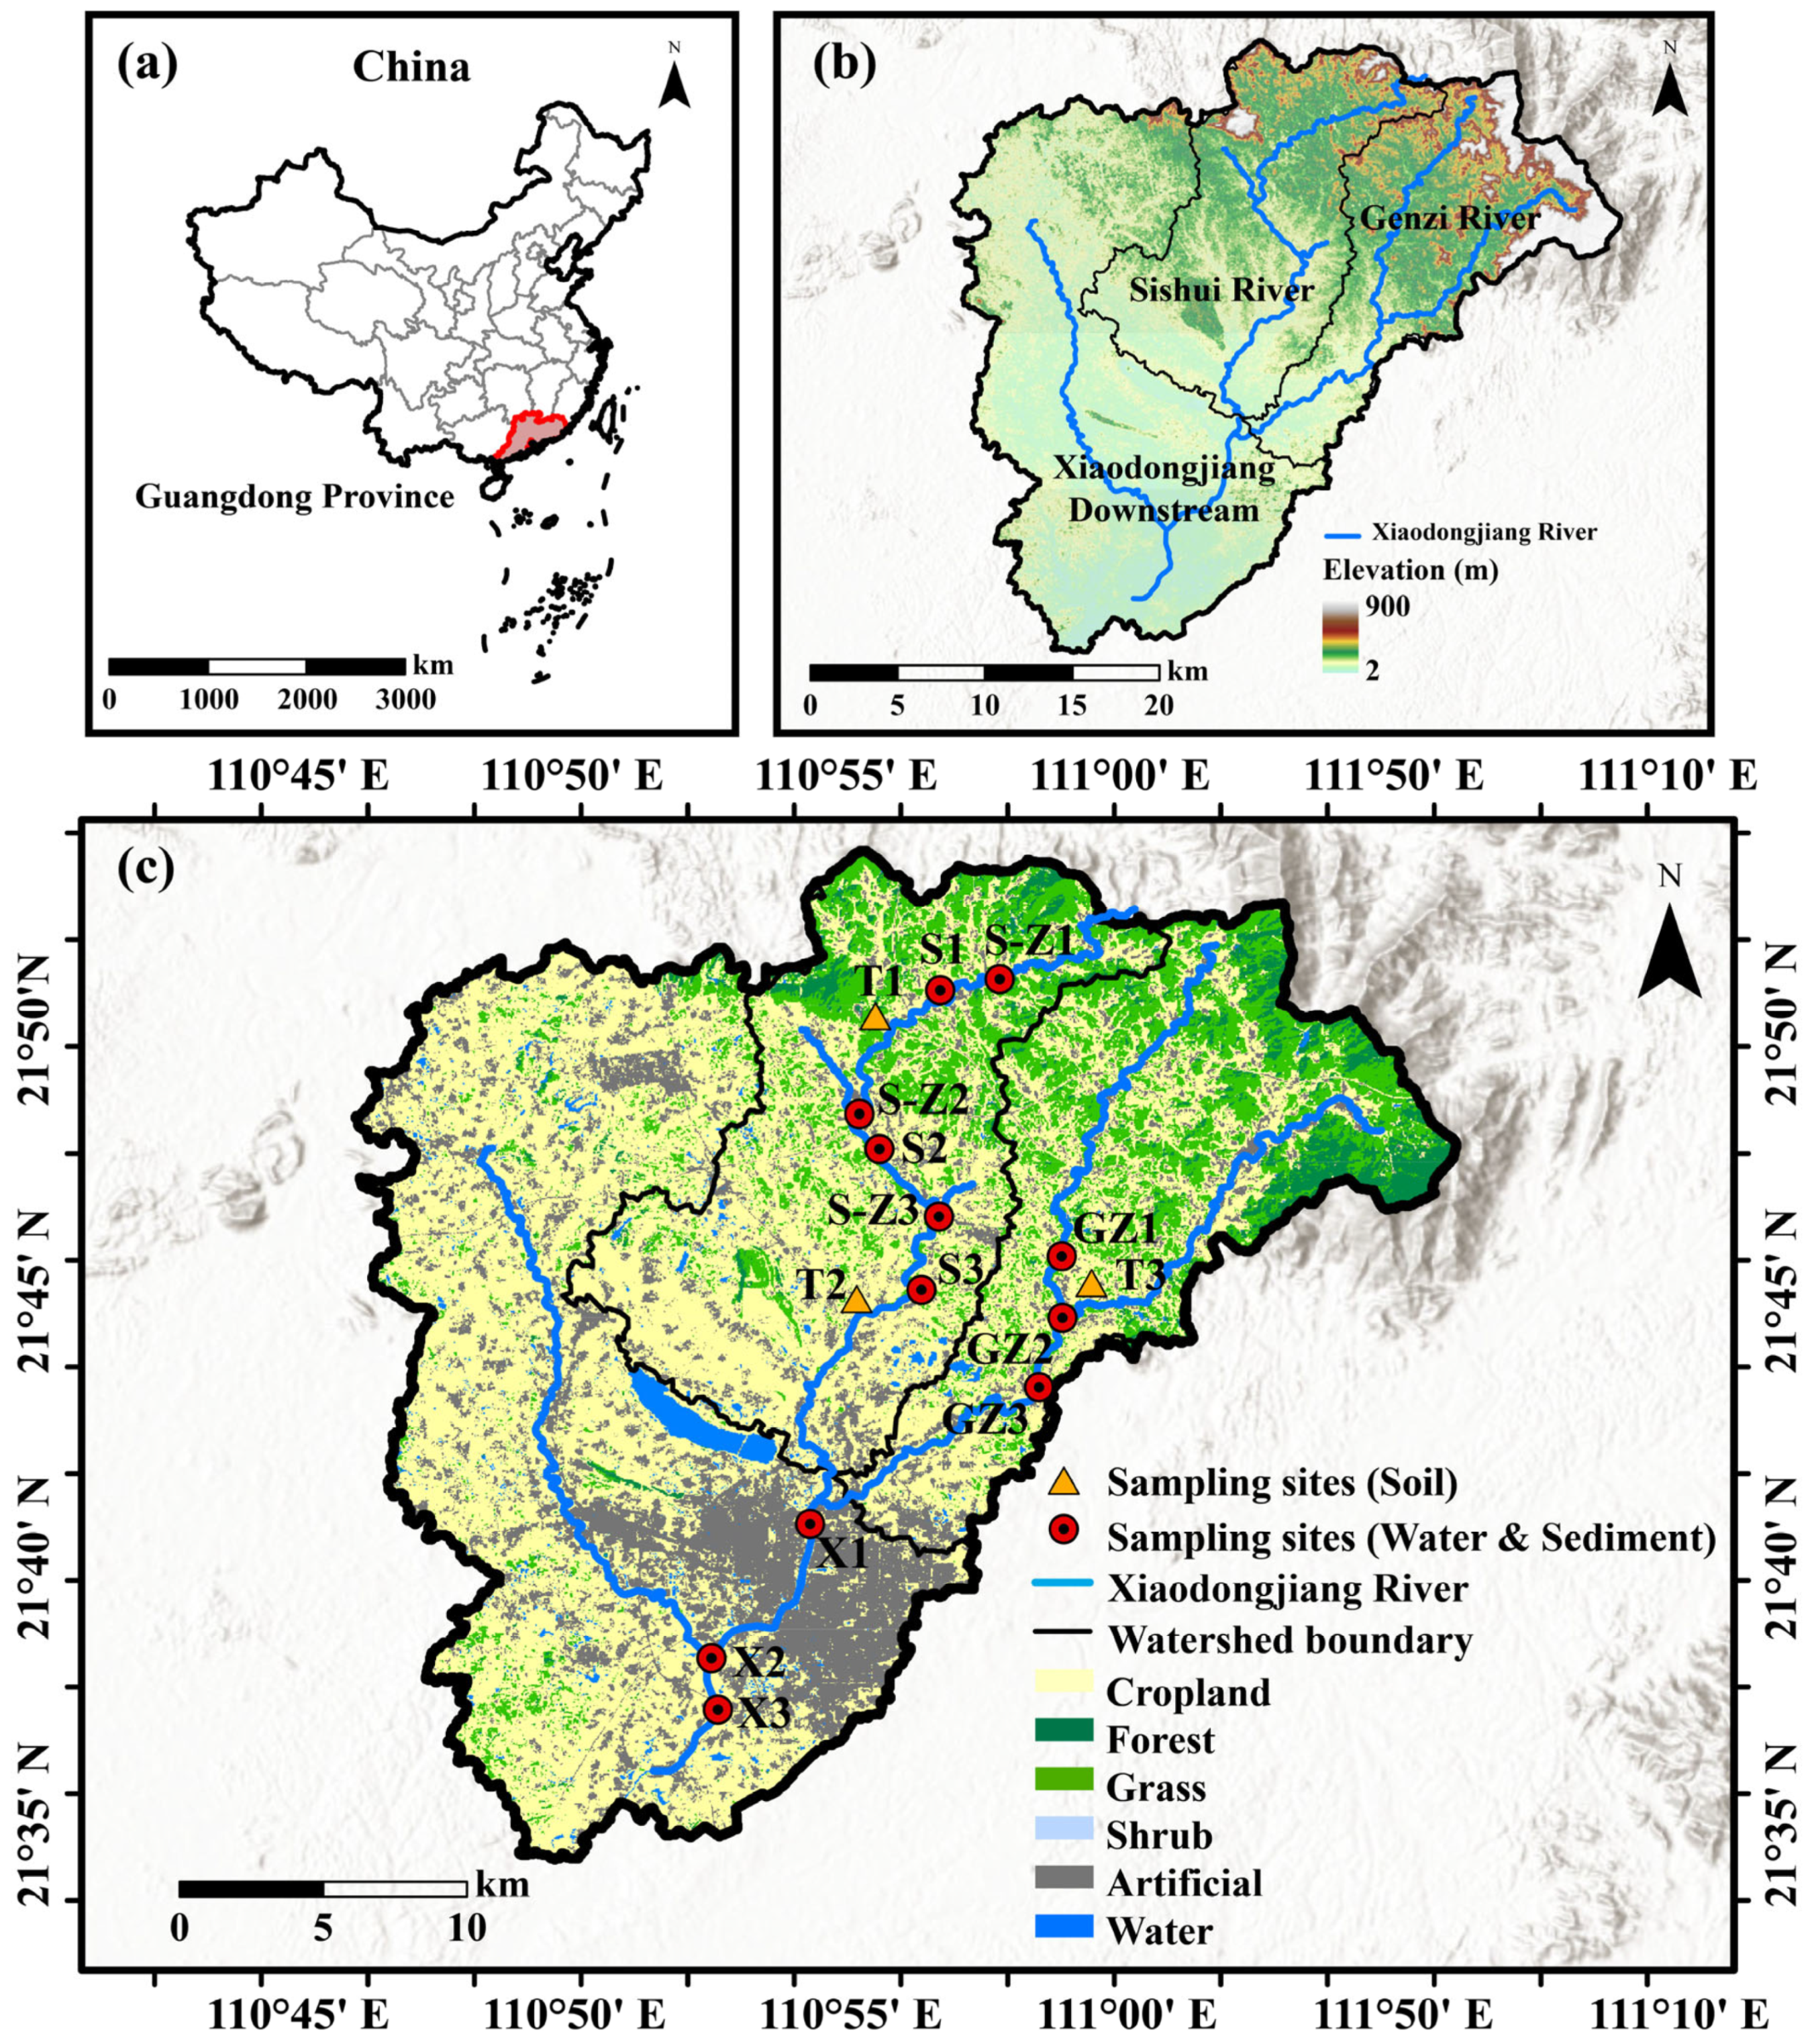
2.1. Study Area and Sampling Points

Xiaodongjiang (XDJ) (110°40′ E–111°05′ E, 21°21′ N–21°54′ N) is located in western Guangdong Province, China. It is a tributary of Jianjiang River, the largest river in the western Pearl River system, spanning 67 km and covering a watershed area of 1142 km2. The region experiences a subtropical monsoon climate with abundant precipitation and heat. Land use in the watershed includes cropland in the middle and lower reaches (58.63%), artificial land in the lower reaches (18.29%), and shrubland in the middle and upper reaches (21.02%). The watershed is divided into the following three sub-watersheds based on land use and topographical characteristics: (1) Sishui River (SSR) watershed: Dominated by cropland and Shrubland, with towns and cities occupying artificial land. This sub-watershed features significant topographical relief and favorable hydrological conditions. (2) Genzi River (GZR) watershed: Primarily composed of cropland and shrub. This sub-watershed has large topographic drops and short hydrological residence times. (3) Downstream Xiaodongjiang River (XDJ-D): Dominated by cropland and artificial land use. This area has flatter terrain and less favorable hydrological conditions. The terrain in the SSR and GZR basins generally slopes from the northeast to the southwest, with rolling hills in the northeast that favor the growth of plantation and cash crops (Figure 1). Upstream phosphorus sources mainly originate from agricultural runoff and sporadic farming activities, while downstream phosphorus sources come primarily from wastewater treatment plants (WWTPs) and urban domestic sewage. Livestock and poultry farming in the watershed are mainly composed of pigs, chickens, and ducks, while aquaculture is dominated by tilapia farming. Soils in the region consist primarily of red earths, rice soils, and yellow earths [29,30].

2.2. Sample Collection

Sampling sites and conditions are presented in Table S1. Twelve sites were selected in July 2023 along a land-use gradient from upstream to downstream, representing the transition from forest to agriculture or artificial areas (Figure 1). Sediment and water samples were collected separately. For water sampling, 30 L of water was taken from each site to ensure sufficient volume for δ18OP analysis. For sediment sampling, three representatives of river sediment were sampled, including cropland surface soil and forest surface soil (T1, T2, and T3 of Figure 1). Sediment samples were collected using a manual grab sampler. Debris and plant material were removed, and the samples were mixed and stored in plastic self-sealing bags away from light. The samples were transported to the laboratory in temperature-controlled containers. Soil and sediment samples were sieved through a 100-mesh sieve (0.15 mm) before further analysis. δ18OP data for the phosphorus sources used in this study were obtained from related studies in China, covering livestock farming, industrial wastewater, chemical fertilizers, and bedrock (Table S2). In situ measurements of pH and water temperature (T) were performed using a portable multiparameter water quality meter (AZ Instrument, AZ86031, Taichung, Taiwan, China) during sampling. Sampling sites were selected in the main river channel and key tributaries to characterize both the main stem and individual tributaries.

2.3. Sample Preparation

Water samples were filtered through a 0.45 μm microporous membrane within 24 h of collection. The filtered water was then used for the analysis of oxygen isotopes (δ18Ow), hydrogen isotopes (δD), phosphorus, and δ18OP. Mg(NO3)2∙6H2O and NaOH were added to raise the pH above 10, forming Mg(OH)2-PO4 coprecipitation (MAGIC) [31]. Soil/sediment samples were dried at 40 °C and sieved through a <2 mm mesh to homogenize the samples, and stored at room temperature until further analysis. Approximately 20–30 g of soil (based on phosphate concentration) was weighed and introduced into a polypropylene bottle. A total of 120 mL of freshly prepared 1 M HCl was then added and the bottle was shaken overnight at room temperature. The sample was centrifuged and the brown filtrate was collected (Figure S1). The DTP content was analyzed using the ammonium molybdate spectrophotometric method after filtration (0.45 μm acetate fiber filter membrane, filtered on the day of sampling). The TP content was analyzed using the ammonium molybdate spectrophotometric method without filtration.

2.4. Isotopic Composition Analysis

Inorganic phosphate in water samples was converted to Ag3PO4 following the method of Wang et al. [14], with reagents added in a step-wise manner to remove the organic matter (Figure S1). δ18OP analysis was conducted using a TC/EA-IRMS system (Thermo Fisher, Massachusetts, MA, USA) at the Third Institute of Oceanography, Ministry of Natural Resources, China. The 12 samples were analyzed alongside two standard samples, with elemental calibration performed using B2207, as follows: Ag3PO4 (δ18O = 21.7‰). During the measurement, a suitable amount of the sample was compacted in a silver cup and introduced to the high-temperature pyrolysis (25 °C) furnace of the elemental analyzer via an autosampler. The silver phosphate underwent pyrolysis at high temperatures. Silver phosphate was decomposed at the high temperature, releasing oxygen from PO43−, which reacted with the glassy carbon to form CO. The generated CO was separated and purified via the carrier gas in a chromatographic column and was then transported to the isotope mass spectrometer for δ18O detection through a continuous flow interface. The ratio of oxygen stable isotopes (18O/16O) in phosphate is referred to as δ18OP, as expressed in Equation (1), as follows:
δ 18 O P ( ) = R sample R standard R standard × 1000
where δ(‰) denotes the δ18OP value, Rsample is the isotope ratio of the sample, and Rstandard is the isotope ratio of Vienna Standard Mean Ocean Water (VSMOW).
The measured δ18OP values are frequently compared with the theoretical isotopic equilibrium value of δ18OP (Eδ18OP) to determine whether phosphate in water is being significantly utilized by organisms or whether δ18OP can effectively trace the source of phosphate [32,33,34]. Eδ18OP was calculated using the empirically derived fractionation equation proposed by Longinelli and Nuti [35], as shown in Equation (2), as follows:
T = 111.4 4.3 × E δ 18 O p δ 18 O W
where T is the water temperature (°C), Eδ18OP is the isotopic value of the theoretical phosphate, and δ18Ow is the ambient water oxygen isotope. δ18OP and δ18OW were analyzed with an accuracy of ±0.5‰.

2.5. Stable Isotope Mixing Model

A land-use-based mixed end-member model (Supporting Information, Part 1) and a Bayesian isotope mixing model (implemented in the open-source R language MixSIAR package) [36] were used in this study to estimate the contribution of four potential sources of phosphorus (domestic and industrial effluents (D&I), livestock and poultry effluents (livestock), fertilizers, and bedrock) to the XDJ watershed. The phosphate oxygen isotope compositions of the phosphorus sources utilized in this study were sourced from other research (Table S2).

2.6. Sensitivity Analysis

One-way analysis of variance (ANOVA) was used to determine significant differences in phosphate isotope levels among different phosphorus sources. The MixSIAR model uses the mean and standard deviation of pollutant sources as the input data. In this study, a perturbation approach was applied to assess sensitivity, i.e., how changes in input variables affect MixSIAR outputs [18]. To quantify the sensitivity of each input source, simulation scenarios were created with variations of ±50%, ±30%, ±10%, and 0% from the mean value of the end source of δ18OP (Supporting Information, Part 3, Figure S3). Data and graphs were analyzed and plotted using Origin 2021, ArcGIS 10.8, and R 4.3.1. Specifically, ArcGIS 10.8 was used for mapping the study area location and sampling sites, Origin 2021 was used for constructing data plots, and R 4.3.1 was employed for MixSIAR model analysis and graphical plotting.

3. Results

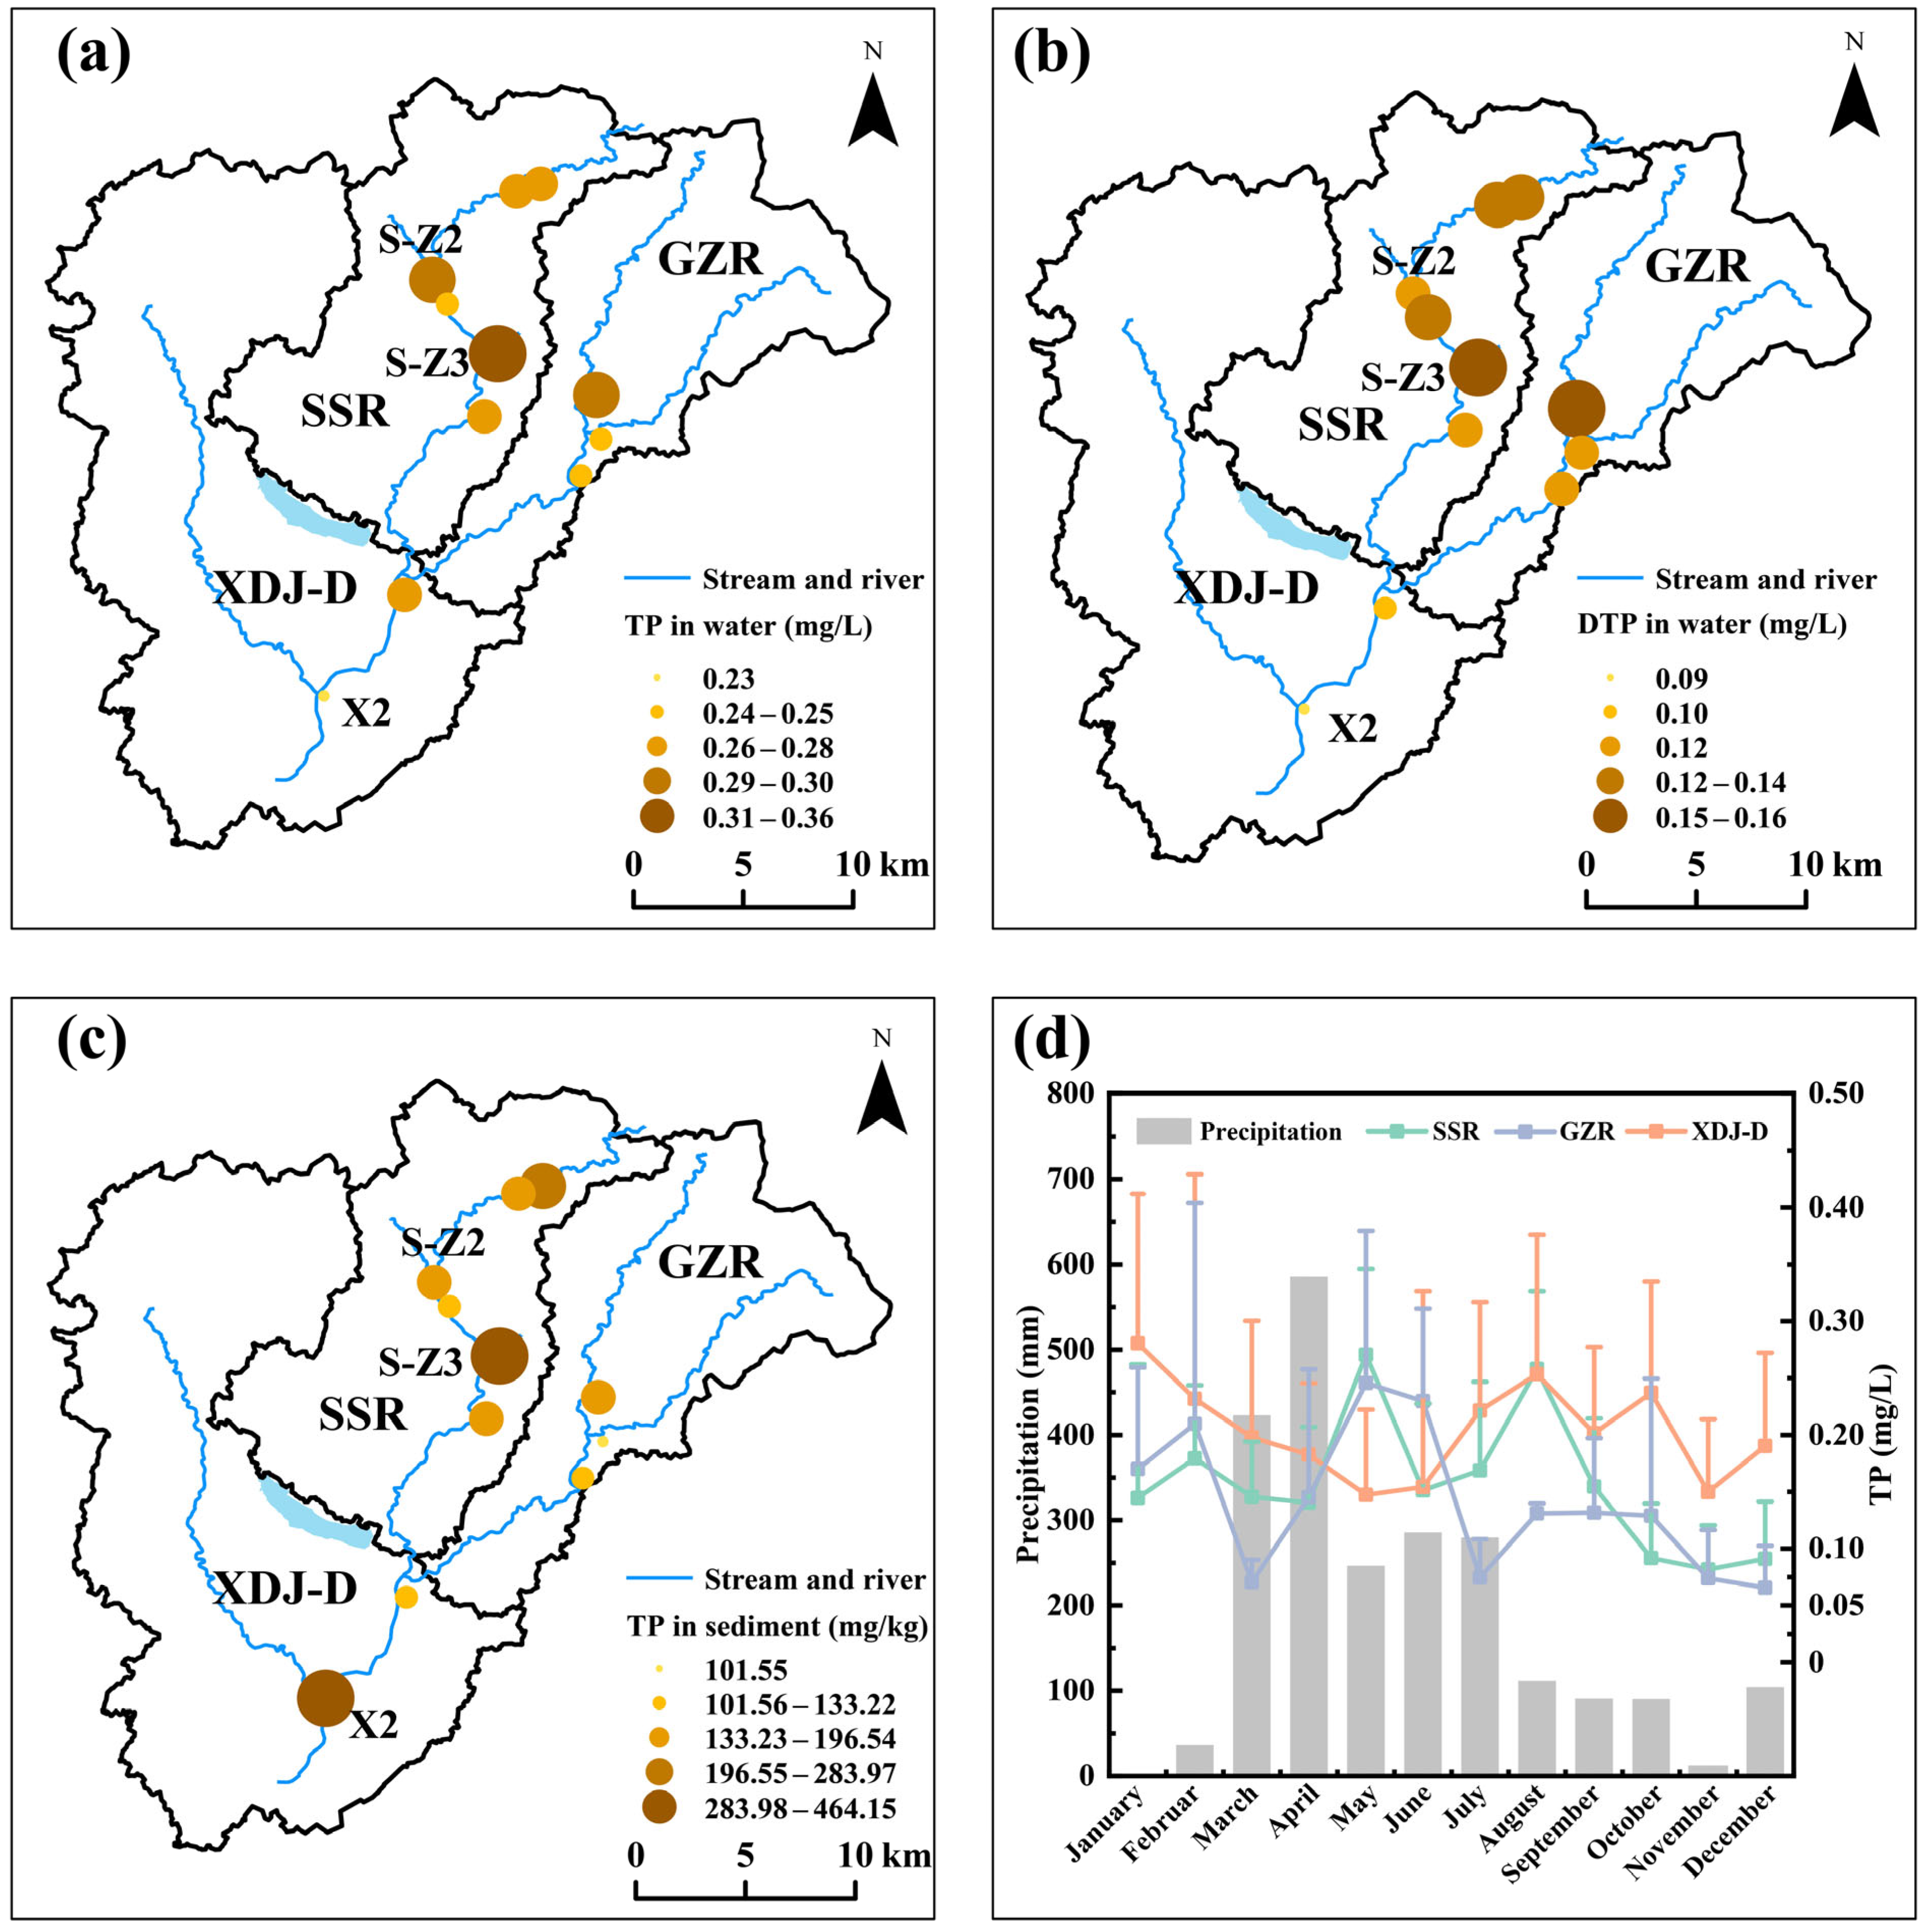
3.1. Spatio-Temporal Characteristics of Phosphorus in the XDJ Watershed

This study investigates the spatial distributions of total phosphorus (TP) and dissolved total phosphorus (DTP) in stream water and sediments, along with the variations in TP concentration in response to precipitation in the XDJ sub-watershed (Figure 2). TP concentrations were high (0.23~0.36 mg/L) (Figure 2a). TP at all sampling sites exceeded the Chinese national standard for surface water Class Ⅲ (TP < 0.20 mg/L). The SSR exhibits lower variability in TP and DTP (TP: 0.24~0.26 mg/L and DTP: 0.11~0.13 mg/L). TP concentrations were higher in SSR tributaries than GZR and XDJ-D (p > 0.05), but the difference was not significant (p > 0.05), with the highest levels at S-Z3 (0.35 mg/L). TP and DTP concentrations were also high in the GZR watershed. Overall, TP and DTP concentrations in the XDJ watershed decreased by up to 36% from upstream to downstream. Sediment TP content in the XDJ watershed ranged from 101.55 to 464.15 mg/kg, and upstream sediments generally had lower TP compared to downstream, except for S-Z3 (464.15 mg/kg). Downstream site X2 had the higher TP (437.69 mg/kg), with higher TP in tributaries, emphasizing the influence of hydrodynamic conditions on phosphorus transport and transformation. TP was generally higher in the wet season (March–August) compared to the dry season (September–February) (Figure 2d). During the wet season in May and June, upstream SSR and GZR also had higher TP than downstream XDJ-D (p < 0.05).

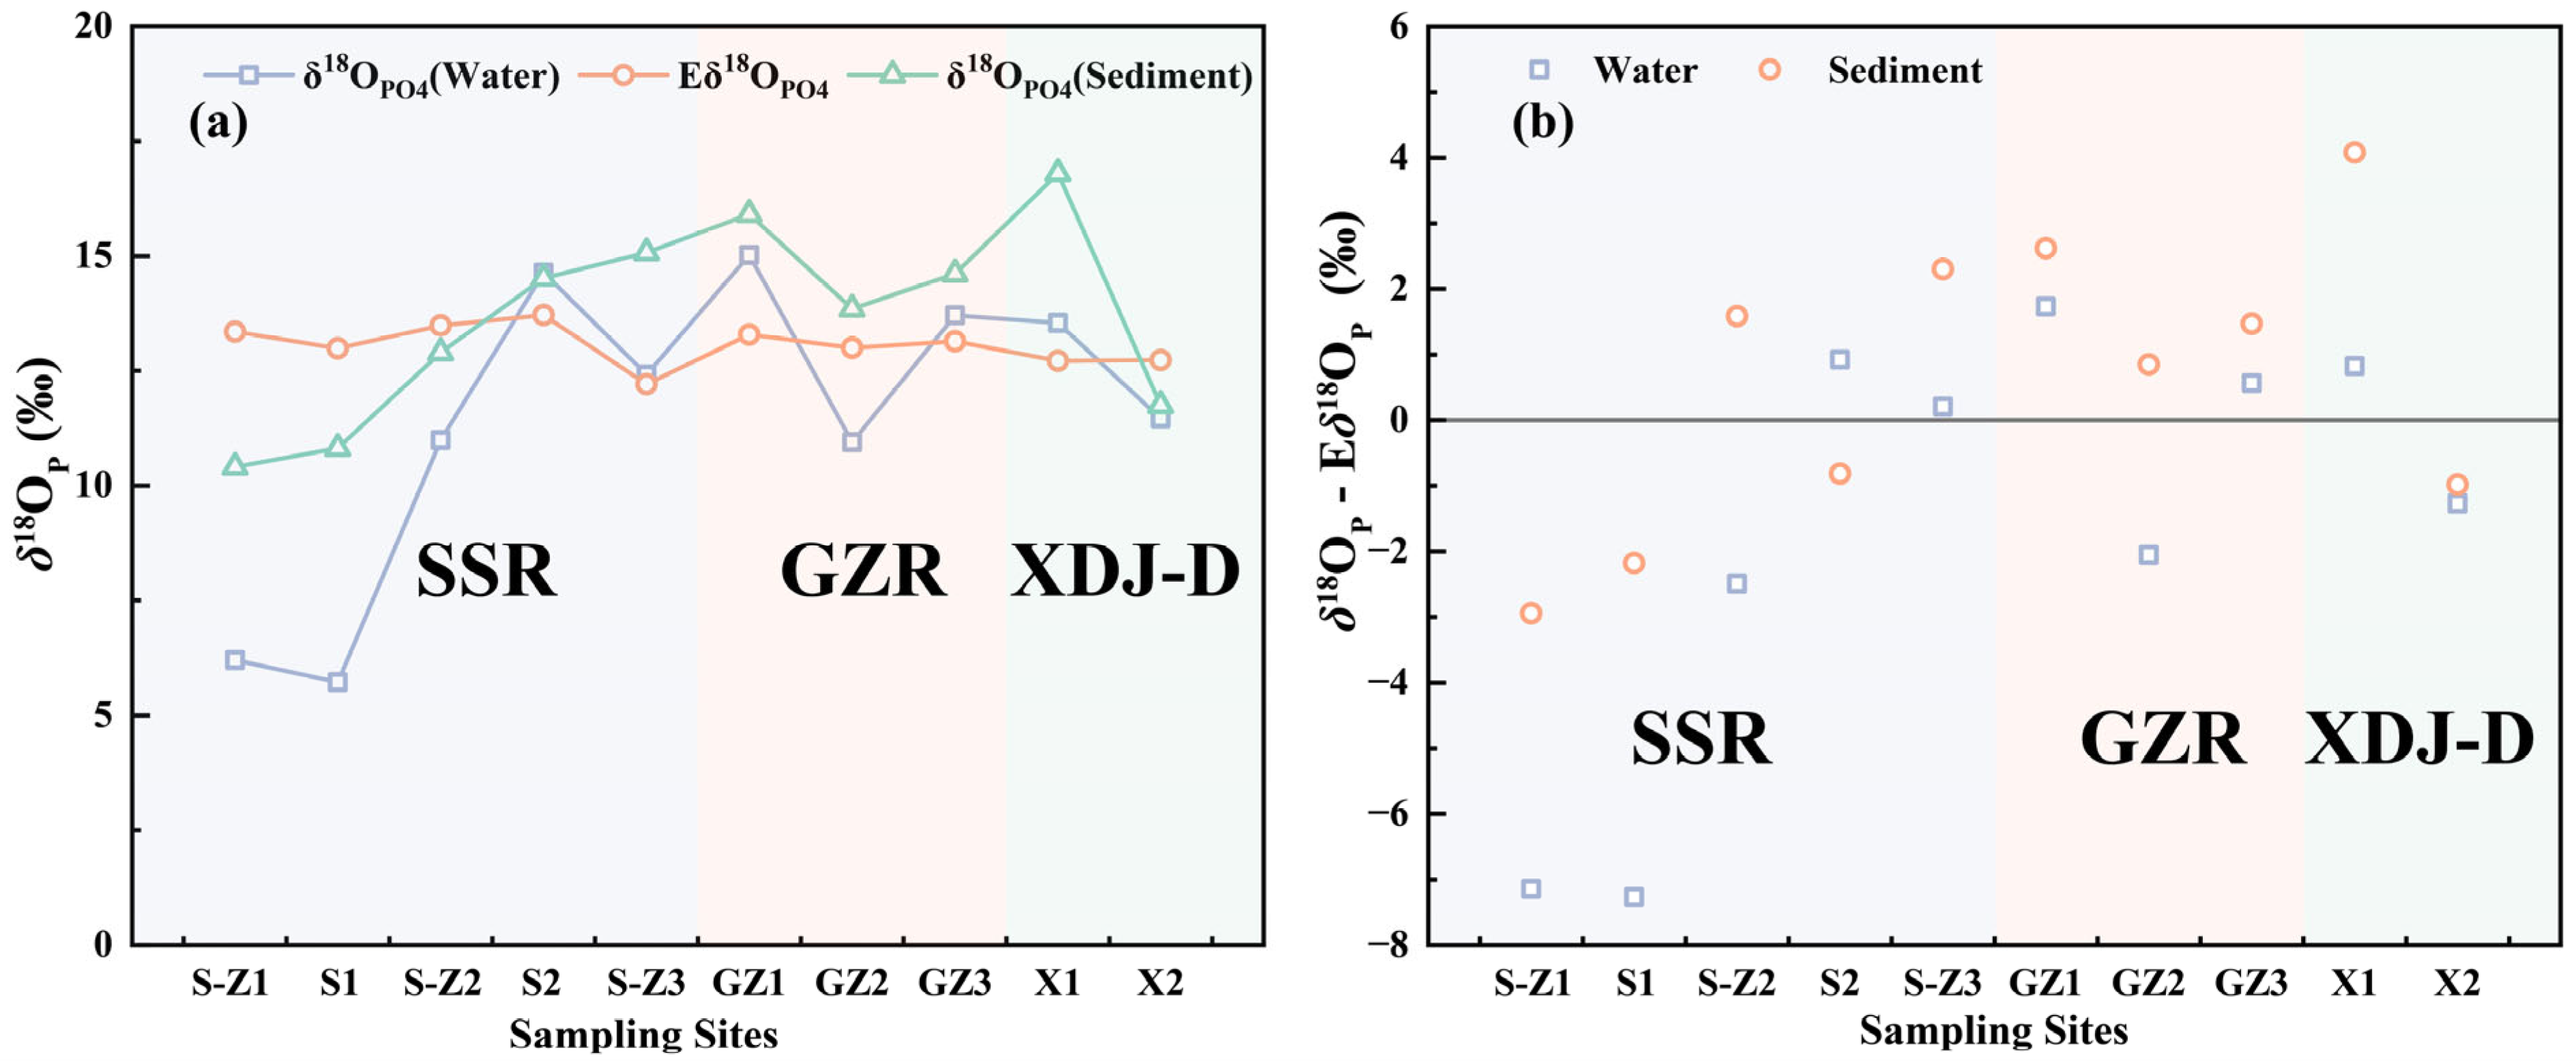
3.2. Characterization of δ18OP Distribution in Water Samples and Sediments from the XDJ Watershed and Feasibility Analysis of Tracer Sources

Figure S2 illustrates the δ18OP characteristics of soils within the XDJ watershed as well as other sources of phosphorus investigated in other studies. The results indicate similar mean δ18OP values of industrial sewage (IS, 15.31 ± 2.48‰) and domestic sewage (DS, 15.27 ± 0.29‰). Since there were no phosphorus-related industries in the watershed, IS and DS were combined as D&I sources in this study. Soil (17.84 ± 1.99‰) and livestock wastewater (18.03 ± 2.21‰) exhibited similar δ18OP characteristics and were thus grouped as S&L in the quantitative analysis of sediment phosphorus sources. In this study, fertilizer had the lowest δ18OP value (9.80 ± 2.66‰), followed by bedrock (12.81 ± 0.57‰). The distinct δ18OP characteristics indicate different phosphorus sources, making them useful for phosphorus source resolution in the region despite partial δ18OP overlap in some areas.

3.3. Deviation of δ18OP Values from Equilibrium Values in the XDJ Watershed

Although surface water was collected from 12 sites in the XDJ watershed, only 10 samples provided sufficient Ag3PO4 for δ18OP analysis owing to low phosphate concentrations in the samples that resulted in insufficient Ag3PO4 production. It is, therefore, highly recommended that either a larger volume of water should be collected, or an improved extraction technique for δ18OP analysis should be employed to minimize the largest water volume requirements [7,37]. The δ18OP values of the water samples from the XDJ watershed ranged from 5.72‰ to 15.02‰, with irregular variation from upstream to downstream, showing an increasing trend followed by a decrease (Figure 3a). The δ18OP values of the sediments ranged from 10.41‰ to 16.80‰, with irregular variation from upstream to downstream, which was generally consistent with the trends observed in the surface water. The upper tributaries of the XDJ watershed displayed lower δ18OP values, with 6.20‰ and 10.41‰ for water and sediment at S-Z1. The similarity in δ18OP values between river and sediment samples from the downstream, combined with high TP concentrations in the sediments. The Eδ18OP values in the watershed ranged from 12.21‰ to 13.48‰ with no clear spatial trend. The lowest Eδ18OP value was recorded at S-Z3, which was attributed to the relatively high δ18Ow and temperature (Figure 3a and Table S3). Overall surface water and sediment δ18Ow in the watersheds show the following trends: GZR > XDJ-D > SSR.
The δ18OP and Eδ18OP values of water samples and sediments differed between upstream and downstream in the XDJ watershed. The deviations of δ18OP from Eδ18OP ranged from −7.27‰ to 1.73‰ for water samples and from −2.94‰ to 4.08‰ for sediments (Figure 3b). In the XDJ watershed, the largest deviations for δ18OP and Eδ18OP in sediments were recorded at X1 (4.08‰), while smaller deviations were observed at GZ2, S2, and X2. Overall, the following trend was observed: SSR > GZR > XDJ-D.

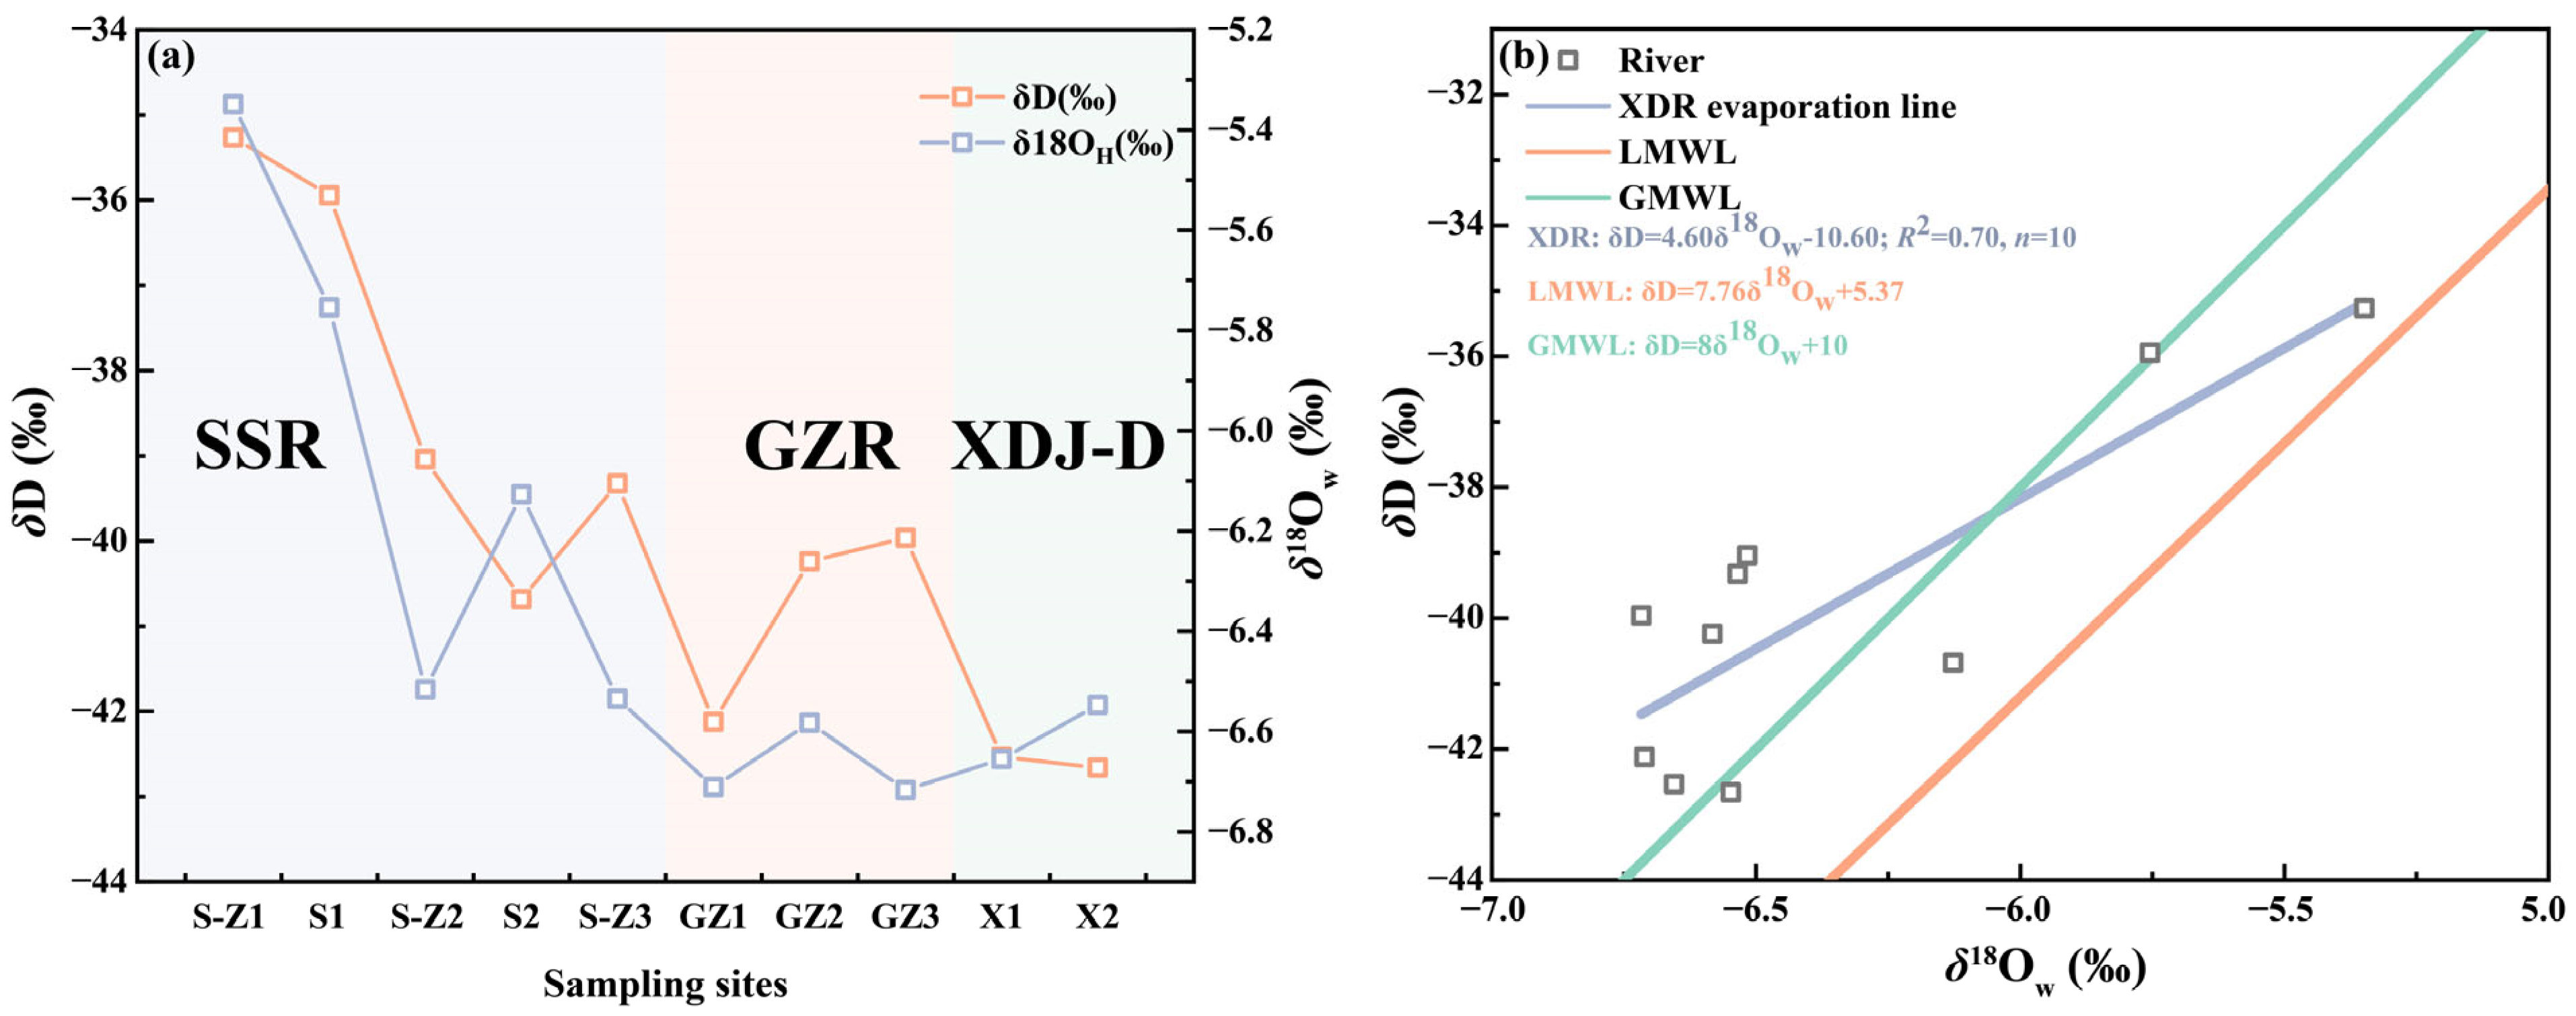
3.4. Spatial Distribution Characteristics of δD and δ18OW in the XDJ Watershed

The δD values for the XDJ watershed ranged from −42.66‰ to −35.26‰ (mean: −39.78 ± 2.54‰), while the δ18Ow values ranged from −6.71‰ to −5.35‰ (mean: −6.35 ± 0.46‰) (Figure 4a). The δD and δ18Ow values in the XDJ exhibited a gradual decrease from upstream to downstream, which was influenced by varying the downstream water recharge and intense precipitation events. Furthermore, the enriched δD and δ18Ow observed at tributaries S-Z1 and S-Z2 indicate that the upstream tributaries were significantly affected by strong evapotranspiration and multiple source inputs. Additionally, the δD and δ18Ow values for the sub-watersheds followed the trend of SSR > GZR > XDJ-D. Figure 4b illustrates the δD-δ18Ow relationship for the XDJ watershed. The Global Meteoric Water Line (GMWL), adopted from Craig [38], was represented by the equation δD = 8 × δ18Ow + 10, and the Local Meteoric Water Line (LMWL) was established using water isotope data from Guangzhou, China, based on δD = 7.76 × δ18Ow + 5.37 (IAEA). δD and δ18Ow were distributed along the atmospheric precipitation line within the watershed, confirming that atmospheric precipitation was the primary source of surface water. Furthermore, the slope and intercept of the river’s evaporation line equation deviated significantly from both the GMWL and LMWL, indicating that the watershed was influenced by strong evaporation.

3.5. Analysis of Major Phosphorus Sources in the XDJ Watershed on Land-Use End-Source Mixing Modeling

Figure 5 presents the phosphorus source resolution obtained from the land use mixing model for the XDJ watershed and its sub-watersheds. In the SSR watershed, fertilizer was identified as the dominant source of phosphorus in river water, contributing 59.08%. In sediment, the fertilizer contribution decreased to 23.41%, while the contribution from livestock farming increased to 14.37%. However, unidentified sources accounted for a larger proportion of both river water (40.36%) and sediment (62.22%). In the GZR watershed, the primary source of phosphorus is similar to the SSR. However, the relatively low flow in GZR made it more susceptible to complex phosphorus sources, with chemical fertilizers being the predominant source. In the XDJ-D watershed, the contributions of fertilizers and domestic sewage to river water were 43.76% and 8.69%, while contributions to sediments were 12.45% and 21.83%. In the total watershed, river water was predominantly influenced by chemical fertilizers (40.99%), consistent with the fact that cultivated land comprised 58.63% of the total area. Artificial land accounted for 18.29% of the watershed, contributing 5.50% of domestic sewage to river water and 12.74% to sediments. SSR and GZR were situated in the upper reaches of XDJ, where steeper terrain facilitated the leaching of applied chemical fertilizers, domestic sewage, and livestock manure into rivers through runoffs during precipitation events. Additionally, downstream hydrological facilities (e.g., dams and hydroelectric power plants) influenced sediment deposition in the rivers [39,40,41]. Furthermore, phosphorus from chemical fertilizers was more likely to be released in sediments [42]. This led to a decrease in the phosphorus proportion of sediments contributed by chemical fertilizers and an increase in contributions from phosphorus sources such as livestock farming, soil, and domestic sewage. The δ18OP values in river water and sediment throughout the watershed remained consistent. The small difference between the δ18OP values of river water and sediment in the downstream areas (Figure 3a) indicates a significant influence of endogenous dissolved release from sediments on river nutrient dynamics, particularly phosphorus. This effect was especially pronounced in downstream regions with long hydraulic retention times and slow flow velocities [43].

3.6. Quantitative Analysis of Major Phosphorus Sources in the XDJ Watershed

Chemical fertilizers were found to be the primary source of exogenous phosphorus to the XDJ watershed and its sub-watersheds by the MixSIAR model, which was consistent with the end-element mixing model results based on land use (Figure 5 and Figure 6) and the large proportion of arable land in these watersheds (Figure 1). The phosphorus source analyses for river water and sediments were generally consistent. However, significant differences emerged between the two models regarding phosphorus source contribution analyses for sediments (Figure 5 and Figure 6). The discrepancy was attributed to the model’s limitations. The end-element mixing model did not adequately account for the variability in end-element data, which limited its applicability for resolving both sources [14]. In the SSR watershed, the contributions of exogenous phosphorus sources were ranked as follows: fertilizer > bedrock > domestic > livestock (Figure 5). In the GZR watershed, contributions from domestic and livestock sources increased, reflecting the higher proportions of shrubland and artificial land in this area Figure 1. In the XDJ-D watershed, the contribution of domestic wastewater increased significantly to 24.7 ± 22.10%, which is attributed to the lower reaches of the XDJ, which flows through the densely populated urban area of Maoming city, leading to increased contributions from domestic and industrial wastewater, as well as livestock and poultry farming. Overall, the contribution of fertilizers was the largest but gradually decreased along the river, with increased contributions from domestic sources and livestock.

4. Discussion

4.1. Indication of Phosphate and Its Isotopic Signature in Xiaodongjiang Watershed

Phosphorus concentrations in the XDJ watershed were elevated, aligning with previous studies [30,44]. Both TP and DTP concentrations in this watershed exceeded those of the Yangtze [14] and Yellow River basins [45]. Because of the sampling period coinciding with the wet season, phosphorus-rich substances such as agricultural fertilizers and pesticides from farming areas, mixed with runoff and rainwater, were introduced into the river, leading to the elevated TP concentrations in the XDJ watershed. The high DTP concentrations in the river’s upper reaches indicated substantial anthropogenic phosphorus inputs, particularly in the upstream tributaries [46]. DTP was readily utilized by aquatic organisms, promoting rapid algal blooms [47]. Elevated DTP levels and reduced flow rates in the middle and lower reaches of the XDJ watershed increased the susceptibility to eutrophication threats in early spring and summer [48]. Furthermore, the presence of additional dams in these areas exacerbated the risk of eutrophication. Increased phosphorus concentrations in the river water and sediments of upstream tributaries, combined with higher bottom flow velocities at tributary confluences, accelerated the release of phosphorus from suspended particulate matter and sediments into the mainstem [49]. In the XDJ-D, reduced flow velocities or damming resulted in longer hydraulic retention times, causing phosphorus to deposit and adsorb to sediments, leading to decreased phosphorus in the river and increased phosphorus in the sediment. Therefore, there is an urgent need to analyze the relationship between sediment and river phosphorus to establish a theoretical basis to understand phosphorus transport and transformation in complex river systems.
Previous studies identified lower δ18OP values in chemical fertilizers [18,49,50]. Additionally, biotransformation in rivers can cause phosphorus isotope fractionation ranging from −30‰ to −10‰, while elevated river temperatures can further decrease the Eδ18OP values [51,52]. The mean δ18OP values for river water and sediment in the XDJ watershed were 11.46 ± 3.23‰ and 13.66 ± 2.15‰, respectively. Compared to sediment δ18OP, soil δ18OP exhibited a narrower range (Figure 3 and Figure S2), which was attributed to the easier absorption of soil δ18OP by plants or loss through surface runoff. The deviation of δ18OP and Eδ18OP values in the XDJ watershed ranged from −7.27‰ to 4.08‰. δ18OP deviated from Eδ18OP equilibrium, with upstream SSR and GZR exhibiting greater deviations than downstream areas (Figure 3b). Only a few δ18OP values (S-Z3, GZ, and X1) approached the equilibrium fractionation, suggesting that δ18OP can be used to identify phosphorus sources in the watershed. This indicates that phosphate in the XDJ was not fully metabolized by aquatic organisms [53], suggesting that the rate of phosphorus input to the watershed exceeded the rate of biological phosphorus metabolism, thereby posing ecological challenges due to phosphorus loading [35]. Frequent agricultural activities in the upstream of the SSR tributary, combined with the turbulent and fast-flowing river, led to significant deviations between δ18OP and Eδ18OP, indicating that δ18OP was not fully utilized by organisms and phosphorus inputs far exceeded biological needs (Figure 2). S-Z3 was located below a small dam and experienced a slower flow rate and longer bio-hydraulic retention time. GZ3 and X1, where the river is wider and biological activity is strong, had deeper runoffs. The above reasons resulted in smaller differences in the deviations in δ18OP and Eδ18OP. In these three regions, phosphate was absorbed and utilized by microorganisms [54]. Compared to other rivers and lakes, the δ18OP values of the XDJ watershed ranged from 5.72‰ to 16.80‰. The δ18OP values were comparable to those of the Yasu River in Japan (ranging from 9.2‰ to 17.6‰) [7], while the δ18OP values of the Mianyuan River (mean value of 15.80 ± 3.00‰) was higher than that of the XDJ, possibly due to the presence of high δ18OP sources in the basin [54].

4.2. Endogenous Control of River Phosphate

Pistocchi et al. [34] identified a gradual increase in sediment phosphorus concentration from upstream to downstream, consistent with the trend observed in this study. The wide river surface and long hydraulic retention time in the middle and lower reaches contributed to phosphorus entrapment in the sediment through processes such as adsorption and precipitation [55]. The lower TP concentrations in upstream mainstem sediments were attributed to significant elevation differences, faster flow velocities, and severe river scouring. Intense and frequent precipitation during the wet season in the XDJ watershed accelerated the migration of upstream sediment downstream, leading to increased phosphorus concentrations in downstream sediments due to precipitation [52,56]. Higher TP concentrations in upstream tributary sediments exacerbated phosphorus input into the mainstem due to the top-support effect, thereby increasing phosphorus loading to the watershed [49]. The spatial trends of δ18OP in water bodies and sediments within the XDJ watershed were consistent, showing higher δ18OP values in water bodies downstream of the city (Figure 3a). Additionally, domestic wastewater exhibited high δ18OP values (Figure S2), likely due to the prolonged hydrologic residence time in the downstream river, which facilitated rapid and continuous adsorption of phosphorus from domestic wastewater to the sediment. The adsorbed phosphorus can later re-enter the surface water body through desorption, diffusion, biotransformation, and mineralization when river hydrodynamic conditions change [34,57]. This study supports the assumption made by Dorioz, et al. [58] that heavier isotopes are preferentially adsorbed, as evidenced by sediment δ18OP values being consistently higher than those of the surface water (Figure 3a). The low δ18OP values observed in upstream river water and sediment samples may stem from the predominance of arable land and fruit orchards in the watershed, combined with excessive anthropogenic inputs of chemical fertilizers. Alternatively, high river temperatures and strong enzymatic biotransformation may also contribute to these low values. The δ18OP values in downstream water and sediment were generally similar, likely due to the prolonged hydrologic residence time. In this context, phosphorus from surface water is adsorbed and precipitated into the sediment, while phosphorus from sediment may re-enter the surface water through solubilization, desorption, and diffusion. This reflects frequent exchanges at the water–sediment interface, indicating a need for further investigation into phosphorus dynamics at this interface in future research.

4.3. Exogenous Inputs of River Phosphate and Recommendations for Phosphorus Management

Both the land-use end-source mixing-based and Bayesian models indicated that chemical fertilizers were the primary source of exogenous phosphorus inputs to the watershed. Additionally, the watershed was threatened by inputs from livestock farming and municipal sewage (Figure 3 and Figure 6). In the watershed, agricultural land occupied the largest proportion, followed by artificial land and shrubland (Figure 1), which supported these findings. In the lower XDJ, exogenous phosphorus inputs were predominantly from chemical fertilizers and domestic sewage. However, this study indicated that the downstream area was also influenced by the endogenous release of phosphorus from sediments. It should be noted that because of the overlap of δ18OP values between downstream sediments and domestic sewage (Figure 3 and Figure S2), there were discrepancies in the results. In addition to urban domestic sewage, chemical fertilizers, and livestock farming, there were other external sources of phosphorus in the watershed that this study did not consider, which included pesticides from fishery farming and the fruit and forest industries. Notably, fishery farming discharged nutrient-rich substrates and other materials from fishponds into the river during water exchange periods [59], contributing to the phosphorus pool in the river. Most chemical pesticides contained phosphorus and served as exogenous phosphorus inputs. The persistence of these pesticides in environmental media exerted toxic effects on microorganisms involved in phosphorus transformations in rivers and sediments [60,61]. This could impact the biogeochemical transformations of phosphorus and alter its dynamics. Future research is urgently needed to investigate the effects of fish farming and chemical pesticides on phosphorus dynamics in the watershed.
Chemical fertilizers were a major contributor to phosphorus pollution in the XDJ watershed; therefore, controlling phosphorus inputs from chemical fertilizers is a top priority. However, chemical fertilizers are essential for the yield and quality of crops and fruit trees in the watershed. Insufficient phosphorus inputs from fertilizers may negatively impact agricultural income. Thus, improving the utilization rate of phosphorus fertilizers to enhance the absorption of residual phosphorus in the soil by crops is a key measure to address this issue [14,62]. In addition to improving fertilizer efficiency, regulations should be introduced or strengthened to control fertilizer use in the watershed, including guidelines for application timing, rates, and methods to optimize phosphorus use and reduce runoff. Farmers should be incentivized to adopt precision farming techniques, such as soil testing and variable-rate application, to match fertilizer inputs with crop needs. A watershed-wide nutrient management plan can also help coordinate fertilizer use, reduce over-fertilization, and prevent phosphorus pollution hotspots. Furthermore, field trials in the watershed can help achieve both economic and environmental benefits by reducing phosphorus inputs from fertilizers [14,63]. Frequent precipitation in the region often leads to the runoff of chemical fertilizers into rivers. Therefore, developing agricultural runoff reuse technology to recover and utilize reactive phosphorus dissolved in these rivers is another effective measure. Effective management of municipal domestic wastewater is crucial for the region. Despite significant increases in wastewater treatment capacity in recent years, a mismatch remains between the capacities of municipal treatment plants and wastewater production, heightening the risk of inputs from domestic wastewater sources. Rural domestic wastewater collection and treatment pose additional challenges in managing domestic wastewater within the watershed. Ensuring the effective operation of rural treatment facilities and reducing treatment costs can help decrease phosphorus emissions [14]. In recent years, the comprehensive rural domestic wastewater remediation plan in the XDJ watershed has been gradually implemented. Once full-scale remediation is complete, ensuring the effective operation of wastewater treatment facilities will be crucial for reducing phosphorus emissions from rural domestic sources. In fishery farming, techniques such as reusing phosphorus from fish pond substrates can enhance phosphorus nutrition while reducing phosphorus inputs from feeds [59]. Optimizing the distribution and timing of manure application, implementing precise fertilizer application strategies, controlling surface runoff to minimize phosphorus loss, and promoting the optimization of crop types and structures can significantly enhance the utilization of residual phosphorus by farmland crops. These measures can effectively reduce the negative environmental impacts of phosphorus pollution and the subsequent eutrophication caused by excess phosphorus entering surface water systems through runoff [64]. Additionally, they offer a viable solution to address the increasing constraints on global phosphorus resources.

5. Conclusions

This study employed phosphate oxygen isotopes, land-use end-source mixing models, and the MixSIAR Bayesian model to quantify phosphorus source contributions in the XDJ and its sub-watersheds, considering significant agricultural and urban interactions and seasonal precipitation. This research addresses the gap in the quantitative analysis of complex phosphorus sources in small to medium-sized monsoon-influenced watersheds, and establishes a foundation for precise phosphorus pollution control by providing theoretical support for phosphorus management in similar river watersheds. Analysis of δ18OP characteristics indicated that phosphorus loading in XDJ and its sub-watersheds was predominantly driven by human activities. Therefore, controlling fertilizer input is essential to reducing phosphorus emissions. Municipal wastewater and livestock farming also played significant roles in phosphorus loading within the watershed. In the downstream sections of the watershed, endogenous phosphorus released from sediments was likely a major contributor to the river phosphorus loading. To mitigate these major exogenous phosphorus sources, strategies such as optimizing manure application timing and distribution, adopting regular and precise fertilizer practices, managing surface runoff to prevent phosphorus loss, and reusing fish pond substrates are effective strategies for controlling phosphorus pollution in the XDJ watershed.

Supplementary Materials

The following supporting information can be downloaded at: https://www.mdpi.com/article/10.3390/agronomy15030663/s1, Figure S1: Process flow diagram for the purification of phosphate by the MAGIC and APM-MAP methods; Figure S2: The δ18OP values of cultivated land, forested land source samples, and collected end elements within the XDJ watershed; Figure S3: Sensitivity analyses based on the perturbation method; Table S1: Supplementary Information on sampling stes in the XDJ watershed; Table S2: Supplementary information for oxygen isotopes of phosphorus source phosphates; Table S3: Supplementary information on phosphate oxygen isotopes in watersheds; Table S4: Percentage of land use in the watershed. References [1,14,22,65,66,67,68,69,70,71,72] are cited in Supplementary Materials file.

Author Contributions

Conceptualization, D.W.; methodology, D.W., J.T., X.G., and Q.Z.; validation, X.G. and Q.Z.; formal analysis, D.W.; investigation, D.W., S.L., C.L., and L.Z.; data curation, D.W., Y.W., and F.W.; writing—original draft preparation, D.W. and Q.Z.; writing—review and editing, X.G., J.T., Q.Z., and G.C.; supervision, Q.Z.; project administration, Q.Z.; funding acquisition, Q.Z. All authors have read and agreed to the published version of the manuscript.

Funding

This research was funded by the Overall Technical Service for Ecological Environmental Protection and Governance of Maonan District, Maoming city (No. 2023-DFKY-0105), and the Environmental Protection Butler Residency Project in Huazhou city (No. 2022-DFKY-0932). Co-funding was provided by the Jianjiang River Basin Land-Ocean Integration Regulatory Observatory, Chinese Research Academy of Environmental Sciences.

Data Availability Statement

Data will be made available upon request.

Conflicts of Interest

The authors declare no conflicts of interest.

References

  1. Liu, Y.; Wang, J.; Chen, J.; Jin, Z.; Ding, S.; Yang, X. Method for phosphate oxygen isotopes analysis in water based on in situ enrichment, elution, and purification. J. Environ. Manag. 2021, 279, 111618. [Google Scholar] [CrossRef] [PubMed]
  2. Karl, D.M. Phosphorus, the staff of life. Nature 2000, 406, 31–33. [Google Scholar] [CrossRef] [PubMed]
  3. Fink, G.; Alcamo, J.; Flörke, M.; Reder, K. Phosphorus loadings to the world’s largest lakes: Sources and trends. Glob. Biogeochem. Cycles 2018, 32, 617–634. [Google Scholar] [CrossRef]
  4. Gächter, R.; Wehrli, B. Ten years of artificial mixing and oxygenation: No effect on the internal phosphorus loading of two eutrophic lakes. Environ. Sci. Technol. 1998, 32, 3659–3665. [Google Scholar] [CrossRef]
  5. Luo, X.; Elrys, A.S.; Zhang, L.; Ibrahim, M.M.; Liu, Y.; Fu, S.; Yan, J.; Ye, Q.; Wen, D.; Hou, E. The global fate of inorganic phosphorus fertilizers added to terrestrial ecosystems. One Earth 2024, 7, 1402–1413. [Google Scholar] [CrossRef]
  6. Wang, R.; Wang, Q.; Dong, L.; Zhang, J. Cleaner agricultural production in drinking-water source areas for the control of non-point source pollution in China. J. Environ. Manag. 2021, 285, 112096. [Google Scholar] [CrossRef]
  7. Ishida, T.; Uehara, Y.; Iwata, T.; Cid-Andres, A.P.; Asano, S.; Ikeya, T.; Osaka, K.i.; Ide, J.i.; Privaldos, O.L.A.; Jesus, I.B.B.D. Identification of phosphorus sources in a watershed using a phosphate oxygen isoscape approach. Environ. Sci. Technol. 2019, 53, 4707–4716. [Google Scholar] [CrossRef]
  8. Van Moorleghem, C.; De Schutter, N.; Smolders, E.; Merckx, R. The bioavailability of colloidal and dissolved organic phosphorus to the alga Pseudokirchneriella subcapitata in relation to analytical phosphorus measurements. Hydrobiologia 2013, 709, 41–53. [Google Scholar] [CrossRef]
  9. Linge, K.L.; Oldham, E.C. Control mechanisms for dissolved phosphorus and arsenic in a shallow lake. Appl. Geochem. 2004, 19, 1377–1389. [Google Scholar] [CrossRef]
  10. Cui, M.; Guo, Q.; Wei, R.; Tian, L. Human-driven spatiotemporal distribution of phosphorus flux in the environment of a mega river basin. Sci. Total Environ. 2021, 752, 141781. [Google Scholar] [CrossRef]
  11. Piantone, P.; Bodénan, F.; Derie, R.; Depelsenaire, G. Monitoring the stabilization of municipal solid waste incineration fly ash by phosphation: Mineralogical and balance approach. Waste Manag. 2003, 23, 225–243. [Google Scholar] [CrossRef] [PubMed]
  12. Santos, R.; Fernandes, L.S.; Pereira, M.; Cortes, R.; Pacheco, F. A framework model for investigating the export of phosphorus to surface waters in forested watersheds: Implications to management. Sci. Total Environ. 2015, 536, 295–305. [Google Scholar] [CrossRef] [PubMed]
  13. Davies, C.L.; Surridge, B.W.; Gooddy, D.C. Phosphate oxygen isotopes within aquatic ecosystems: Global data synthesis and future research priorities. Sci. Total Environ. 2014, 496, 563–575. [Google Scholar] [CrossRef]
  14. Wang, Z.; Tian, L.; Zhao, C.; Du, C.; Zhang, J.; Sun, F.; Tekleab, T.Z.; Wei, R.; Fu, P.; Gooddy, D.C. Source partitioning using phosphate oxygen isotopes and multiple models in a large catchment. Water Res. 2023, 244, 120382. [Google Scholar] [CrossRef]
  15. Blake, R.E.; Alt, J.C.; Martini, A.M. Oxygen isotope ratios of PO4: An inorganic indicator of enzymatic activity and P metabolism and a new biomarker in the search for life. Proc. Natl. Acad. Sci. USA 2001, 98, 2148–2153. [Google Scholar] [CrossRef]
  16. Lecuyer, C.; Grandjean, P.; Sheppard, S.M. Oxygen isotope exchange between dissolved phosphate and water at temperatures≤ 135 C: Inorganic versus biological fractionations. Geochim. Cosmochim. Acta 1999, 63, 855–862. [Google Scholar] [CrossRef]
  17. Elsbury, K.E.; Paytan, A.; Ostrom, N.E.; Kendall, C.; Young, M.B.; McLaughlin, K.; Rollog, M.E.; Watson, S. Using oxygen isotopes of phosphate to trace phosphorus sources and cycling in Lake Erie. Environ. Sci. Technol. 2009, 43, 3108–3114. [Google Scholar] [CrossRef]
  18. Liu, D.; Li, X.; Zhang, Y.; Qiao, Q.; Bai, L. Using a multi-isotope approach and isotope mixing models to trace and quantify phosphorus sources in the Tuojiang River, Southwest China. Environ. Sci. Technol. 2023, 57, 7328–7335. [Google Scholar] [CrossRef]
  19. Granger, S.J.; Heaton, T.H.; Pfahler, V.; Blackwell, M.S.; Yuan, H.; Collins, A.L. The oxygen isotopic composition of phosphate in river water and its potential sources in the Upper River Taw catchment, UK. Sci. Total Environ. 2017, 574, 680–690. [Google Scholar] [CrossRef]
  20. Yuan, H.; Wang, H.; Dong, A.; Zhou, Y.; Huang, R.; Yin, H.; Zhang, L.; Liu, E.; Li, Q.; Jia, B. Tracing the sources of phosphorus in lake at watershed scale using phosphate oxygen isotope (δ18OP). Chemosphere 2022, 305, 135382. [Google Scholar] [CrossRef]
  21. Kim, S.-H.; Lee, D.-H.; Kim, M.-S.; Rhee, H.-P.; Hur, J.; Shin, K.-H. Systematic tracing of nitrate sources in a complex river catchment: An integrated approach using stable isotopes and hydrological models. Water Res. 2023, 235, 119755. [Google Scholar] [CrossRef] [PubMed]
  22. Parnell, A.C.; Inger, R.; Bearhop, S.; Jackson, A.L. Source partitioning using stable isotopes: Coping with too much variation. PLoS ONE 2010, 5, e9672. [Google Scholar] [CrossRef] [PubMed]
  23. Guo, X.; Tang, Y.; Xu, Y.; Zhang, S.; Ma, J.; Xiao, S.; Ji, D.; Yang, Z.; Liu, D. Using stable nitrogen and oxygen isotopes to identify nitrate sources in the Lancang River, upper Mekong. J. Environ. Manag. 2020, 274, 111197. [Google Scholar] [CrossRef] [PubMed]
  24. Jiang, H.; Liu, W.; Li, Y.; Zhang, J.; Xu, Z. Multiple isotopes reveal a hydrology dominated control on the nitrogen cycling in the Nujiang River Basin, the last undammed large river basin on the Tibetan Plateau. Environ. Sci. Technol. 2022, 56, 4610–4619. [Google Scholar] [CrossRef]
  25. Ren, X.; Yue, F.-J.; Tang, J.; Li, C.; Li, S.-L. Nitrate transformation and source tracking of rivers draining into the Bohai Sea using a multi-tracer approach combined with an optimized Bayesian stable isotope mixing model. J. Hazard. Mater. 2024, 463, 132901. [Google Scholar] [CrossRef]
  26. Yuan, B.; Guo, M.; Zhou, X.; Li, M.; Xie, S. Defining the sources and the fate of nitrate by using dual isotopes and a Bayesian isotope mixing model: Water–nitrate management in cascade dams of Lancang river. Sci. Total Environ. 2023, 886, 163995. [Google Scholar] [CrossRef]
  27. Chen, H.; Zheng, L.; Wang, W.; Shi, R. Study on the Effect of Land-Use Change on Phosphorus Pollution In Water China, Jianjiang River, Huazhou Station Control Basin. Pol. J. Environ. Stud. 2022, 31, 2537–2547. [Google Scholar] [CrossRef]
  28. Gao, L.; Li, R.; Liang, Z.; Yan, C.; Zhu, A.; Li, S.; Yang, Z.; He, H.; Gan, H.; Chen, J. Remobilization mechanism and release characteristics of phosphorus in saline sediments from the Pearl River Estuary (PRE), South China, based on high-resolution measurements. Sci. Total Environ. 2020, 703, 134411. [Google Scholar] [CrossRef]
  29. Chen, H.; Shi, R.; He, J.; Zheng, L.; Wang, W. Simulation Analysis of Runoff and Sediment Yield under the Change of Land-Use Type: A Case Study of the Upper Jianjiang River Basin, China. Pol. J. Environ. Stud. 2022, 31, 2527–2536. [Google Scholar] [CrossRef]
  30. Mao, S.; Zhang, Q.; Li, C.; Li, Z.; Zhang, Y.; Li, F.; Shu, W.; Wang, D.; Hao, S. Phosphorus forms in sediments of Xiaodongjiang River and its environmental importance. J. Agric. Resour. Environ. 2024, 1–14. (In Chinese) [Google Scholar] [CrossRef]
  31. McLaughlin, K.; Silva, S.; Kendall, C.; Stuart-Williams, H.; Paytan, A. A precise method for the analysis of δ18O of dissolved inorganic phosphate in seawater. Limnol. Oceanogr. Methods 2004, 2, 202–212. [Google Scholar] [CrossRef]
  32. Gross, A.; Turner, B.L.; Goren, T.; Berry, A.; Angert, A. Tracing the sources of atmospheric phosphorus deposition to a tropical rain forest in Panama using stable oxygen isotopes. Environ. Sci. Technol. 2016, 50, 1147–1156. [Google Scholar] [CrossRef] [PubMed]
  33. Jaisi, D.P.; Blake, R.E. Tracing sources and cycling of phosphorus in Peru Margin sediments using oxygen isotopes in authigenic and detrital phosphates. Geochim. Cosmochim. Acta 2010, 74, 3199–3212. [Google Scholar] [CrossRef]
  34. Pistocchi, C.; Tamburini, F.; Gruau, G.; Ferhi, A.; Trevisan, D.; Dorioz, J.-M. Tracing the sources and cycling of phosphorus in river sediments using oxygen isotopes: Methodological adaptations and first results from a case study in France. Water Res. 2017, 111, 346–356. [Google Scholar] [CrossRef]
  35. Longinelli, A.; Nuti, S. Revised phosphate-water isotopic temperature scale. Earth Planet. Sci. Lett. 1973, 19, 373–376. [Google Scholar] [CrossRef]
  36. Shi, Y.; Li, C.; Jin, Z.; Zhang, Y.; Xiao, J.; Li, F. Combining dual isotopes and a Bayesian isotope mixing model to quantify the nitrate sources of precipitation in Ningbo, East China. Sci. Total Environ. 2021, 778, 146297. [Google Scholar] [CrossRef]
  37. Tcaci, M.; Barbecot, F.; Hélie, J.-F.; Surridge, B.W.; Gooddy, D.C. A new technique to determine the phosphate oxygen isotope composition of freshwater samples at low ambient phosphate concentration. Environ. Sci. Technol. 2019, 53, 10288–10294. [Google Scholar] [CrossRef]
  38. Craig, H. Isotopic variations in meteoric waters. Science 1961, 133, 1702–1703. [Google Scholar] [CrossRef]
  39. Dong, B.; Zhang, R.; Gan, Y.; Cai, L.; Freidenreich, A.; Wang, K.; Guo, T.; Wang, H. Multiple methods for the identification of heavy metal sources in cropland soils from a resource-based region. Sci. Total Environ. 2019, 651, 3127–3138. [Google Scholar] [CrossRef]
  40. Wu, Y.; Fang, H.; Huang, L.; Cui, Z. Particulate organic carbon dynamics with sediment transport in the upper Yangtze River. Water Res. 2020, 184, 116193. [Google Scholar] [CrossRef]
  41. Wu, Y.; Huang, X.; Jiang, Z.; Liu, S. Identifying sources of phosphorus in precipitation using phosphate oxygen isotope in a human and monsoon Co-affected embayment. Atmos. Environ. 2021, 244, 118008. [Google Scholar] [CrossRef]
  42. Somura, H.; Takeda, I.; Arnold, J.; Mori, Y.; Jeong, J.; Kannan, N.; Hoffman, D. Impact of suspended sediment and nutrient loading from land uses against water quality in the Hii River basin, Japan. J. Hydrol. 2012, 450, 25–35. [Google Scholar] [CrossRef]
  43. Wang, L.; Shang, S.; Liu, W.; She, D.; Hu, W.; Liu, Y. Hydrodynamic controls on nitrogen distribution and removal in aquatic ecosystems. Water Res. 2023, 242, 120257. [Google Scholar] [CrossRef] [PubMed]
  44. Fu, K.; Gao, H.; Li, F.; Wu, K.; Zhang, Q.; Li, Z.; Mao, S.; Li, C.; Wang, J. River water quality evaluation and analysis of influencing factors in typical agricultural areas. J. Agric. Resour. Environ. 2023, 40, 583–597. (In Chinese) [Google Scholar] [CrossRef]
  45. Zhao, M.M.; Wang, S.-m.; Chen, Y.-p.; Wu, J.-h.; Xue, L.-g.; Fan, T.T. Pollution status of the Yellow River tributaries in middle and lower reaches. Sci. Total Environ. 2020, 722, 137861. [Google Scholar] [CrossRef]
  46. Tong, Y.; Bu, X.; Chen, J.; Zhou, F.; Chen, L.; Liu, M.; Tan, X.; Yu, T.; Zhang, W.; Mi, Z. Estimation of nutrient discharge from the Yangtze River to the East China Sea and the identification of nutrient sources. J. Hazard. Mater. 2017, 321, 728–736. [Google Scholar] [CrossRef]
  47. Almanassra, I.W.; Kochkodan, V.; Mckay, G.; Atieh, M.A.; Al-Ansari, T. Review of phosphate removal from water by carbonaceous sorbents. J. Environ. Manag. 2021, 287, 112245. [Google Scholar] [CrossRef]
  48. Wang, S.; Jin, X.; Zhao, H.; Wu, F. Phosphorus release characteristics of different trophic lake sediments under simulative disturbing conditions. J. Hazard. Mater. 2009, 161, 1551–1559. [Google Scholar] [CrossRef]
  49. Cheng, B.; Zhang, Y.; Xia, R.; Huang, G.; Qin, T.; Yan, D.; Chen, Y. Backwater makes the tributaries of large river becoming phosphorus “sink”. Water Res. 2024, 261, 122012. [Google Scholar] [CrossRef]
  50. Wang, Z.; Guo, Q.; Tian, L. Tracing phosphorus cycle in global watershed using phosphate oxygen isotopes. Sci. Total Environ. 2022, 829, 154611. [Google Scholar] [CrossRef]
  51. Liang, Y.; Blake, R. Oxygen isotope signature of Pi regeneration from organic compounds by phosphomonoesterases and photooxidation. Geochim. Cosmochim. Acta 2006, 70, 3957–3969. [Google Scholar] [CrossRef]
  52. Yuan, H.; Li, Q.; Kukkadapu, R.K.; Liu, E.; Yu, J.; Fang, H.; Li, H.; Jaisi, D.P. Identifying sources and cycling of phosphorus in the sediment of a shallow freshwater lake in China using phosphate oxygen isotopes. Sci. Total Environ. 2019, 676, 823–833. [Google Scholar] [CrossRef] [PubMed]
  53. Ye, Y.; Wang, X.; Wang, H.; Fan, H.; Chen, Z.; Guo, Q.; Wang, Z.; Wu, C.; Canfield, D.E.; Zhang, S. Phosphate oxygen isotopes constrain Mesoproterozoic marine temperatures and the paucity of phosphorite. Chem. Geol. 2024, 644, 121831. [Google Scholar] [CrossRef]
  54. Zhong, Y. The Cause of Eutrophication and Phosphorus Source in Mianyuan River. Ph.D. Thesis, Chengdu University of Technology, Chengdu, China, 2019. [Google Scholar]
  55. He, X.; Han, W.; Chen, Q.; Zhang, Z.; Liu, C.; Zhang, Y.; Liu, Z.; Han, C.; Yao, Z.; Chen, K. Internal loading regulates the phosphorus concentration in a diversion input shallow lake in the semi-humid region of North China: Differentiated processes in littoral wetland and open water areas. Water Res. 2024, 257, 121680. [Google Scholar] [CrossRef]
  56. Li, S.; Arnscheidt, J.; Cassidy, R.; Douglas, R.; McGrogan, H.; Jordan, P. The spatial and temporal dynamics of sediment phosphorus attenuation and release in impacted stream catchments. Water Res. 2023, 245, 120663. [Google Scholar] [CrossRef]
  57. Ni, Z.; Li, Y.; Wang, S. Cognizing and characterizing the organic phosphorus in lake sediments: Advances and challenges. Water Res. 2022, 220, 118663. [Google Scholar] [CrossRef]
  58. Dorioz, J.M.; Cassell, E.; Orand, A.; Eisenman, K. Phosphorus storage, transport and export dynamics in the Foron River watershed. Hydrol. Process. 1998, 12, 285–309. [Google Scholar] [CrossRef]
  59. Luo, G. Review of waste phosphorus from aquaculture: Source, removal and recovery. Rev. Aquac. 2023, 15, 1058–1082. [Google Scholar] [CrossRef]
  60. Jayasiri, M.; Yadav, S.; Dayawansa, N.; Propper, C.R.; Kumar, V.; Singleton, G.R. Spatio-temporal analysis of water quality for pesticides and other agricultural pollutants in Deduru Oya river basin of Sri Lanka. J. Clean. Prod. 2022, 330, 129897. [Google Scholar] [CrossRef]
  61. Rasmussen, J.J.; Reiler, E.M.; Carazo, E.; Matarrita, J.; Muñoz, A.; Cedergreen, N. Influence of rice field agrochemicals on the ecological status of a tropical stream. Sci. Total Environ. 2016, 542, 12–21. [Google Scholar] [CrossRef]
  62. Zhu, J.; Li, M.; Whelan, M. Phosphorus activators contribute to legacy phosphorus availability in agricultural soils: A review. Sci. Total Environ. 2018, 612, 522–537. [Google Scholar] [CrossRef] [PubMed]
  63. Xie, S.; Yang, F.; Feng, H.; Yu, Z.; Liu, C.; Wei, C.; Liang, T. Organic fertilizer reduced carbon and nitrogen in runoff and buffered soil acidification in tea plantations: Evidence in nutrient contents and isotope fractionations. Sci. Total Environ. 2021, 762, 143059. [Google Scholar] [CrossRef] [PubMed]
  64. Bouwman, L.; Goldewijk, K.K.; Van Der Hoek, K.W.; Beusen, A.H.; Van Vuuren, D.P.; Willems, J.; Rufino, M.C.; Stehfest, E. Exploring global changes in nitrogen and phosphorus cycles in agriculture induced by livestock production over the 1900–2050 period. Proc. Natl. Acad. Sci. USA 2013, 110, 20882–20887. [Google Scholar] [CrossRef] [PubMed]
  65. Mingus, K.A.; Liang, X.; Massoudieh, A.; Jaisi, D.P. Stable isotopes and Bayesian modeling methods of tracking sources and differentiating bioavailable and recalcitrant phosphorus pools in suspended particulate matter. Environ. Sci. Technol. 2018, 53, 69–76. [Google Scholar] [CrossRef]
  66. Moore, J.W.; Semmens, B.X. Incorporating uncertainty and prior information into stable isotope mixing models. Ecol. Lett. 2008, 11, 470–480. [Google Scholar] [CrossRef]
  67. Tian, L. The Research of Analysis Method of Soil Phosphate Oxygen Isotopic and Its Application in Agricultural Soils. Ph.D. Thesis, University of Chinese Academy of Sciences, Beijing, China, 2017. [Google Scholar]
  68. Sun, Y.; Amelung, W.; Wu, B.; Haneklaus, S.; Maekawa, M.; Lücke, A.; Schnug, E.; Bol, R. ‘Co-evolution’ of uranium concentration and oxygen stable isotope in phosphate rocks. Appl. Geochem. 2020, 114, 104476. [Google Scholar] [CrossRef]
  69. Young, M.B.; McLaughlin, K.; Kendall, C.; Stringfellow, W.; Rollog, M.; Elsbury, K.; Donald, E.; Paytan, A. Characterizing the oxygen isotopic composition of phosphate sources to aquatic ecosystems. Environ. Sci. Technol. 2009, 43, 5190–5196. [Google Scholar] [CrossRef]
  70. Breaker, B.K. Phosphate-Oxygen Isotope ratios as a Tracer for Sources and Cycling of Phosphorus in the Illinois River Watershed; University of Arkansas: Fayetteville, AR, USA, 2009. [Google Scholar]
  71. Xue, K. The Impact of Phospahte Mining Activities on Surface Water Environment and Its Control Strategies—Insights from Phosphate Oxygen Isotope Tracing Technology. Master’s thesis, University of Chinese Academy of Sciences, Beijing, China, 2020. [Google Scholar]
  72. Liu, Y. Construction and Preliminary Application of Pretreatment Method System of Phosphate Oxygen Isotope Separation and Purification for Freshwater Lake Environmental Media. Ph.D. Thesis, University of Chinese Academy of Sciences, Beijing, China, 2020. [Google Scholar]
Figure 1. (a) Locations map of the study area; (b) elevation map of the study area; (c) land use and sampling point distribution map along the XDJ. S, GZ, and X (i = 1, 2, 3 …, n) represent Sishui River, Genzi River, and Xiaodongjiang downstream, respectively.
Agronomy 15 00663 g001
Figure 2. (a) Spatial distribution of riverine total phosphorus (TP), (b) dissolved total phosphorus (DTP), and (c) sediment TP concentrations; (d) total phosphorus (TP) as a function of precipitation.
Agronomy 15 00663 g002
Figure 3. (a) Distributions of δ18OP and Eδ18OP values in the XDJ watershed; (b) deviation of measured δ18OP from Eδ18OP.
Agronomy 15 00663 g003
Figure 4. (a) Spatial distributions of the surface water δD and δ18Ow values in the XDJ watershed; (b) δD versus δ18Ow plot in the XDJ watershed.
Agronomy 15 00663 g004
Figure 5. Contributions of major phosphorus sources in the XDJ and its sub- watersheds. (a) River water in the SSR watershed; (b) River water in the GZR watershed; (c) Sediments in the SSR watershed; (d) Sediments in the GZR watershed; (e) River water in the XDJ-D sub-watershed; (f) River water in the entire XDJ watershed; (g) Sediments in the XDJ-D sub-watershed; (h) Sediments in the entire XDJ watershed.
Agronomy 15 00663 g005
Figure 6. Contribution analysis of four potential sources of phosphorus in the XDJ and its sub-watersheds estimated by the MixSIAR model.
Agronomy 15 00663 g006
Disclaimer/Publisher’s Note: The statements, opinions and data contained in all publications are solely those of the individual author(s) and contributor(s) and not of MDPI and/or the editor(s). MDPI and/or the editor(s) disclaim responsibility for any injury to people or property resulting from any ideas, methods, instructions or products referred to in the content.

