Article

Transcriptome Insights into Carbohydrate Metabolism and Frying Quality Traits in Waxy and Mealy Potatoes

1
Highland Agriculture Research Institute, Rural Development Administration, Pyeongchang 25342, Republic of Korea
2
Planning and Coordination Division National Institute of Crop Science, Rural Development Administration, Jeonju 54875, Republic of Korea
3
Youngdeok Branch Station, National Institute of Crop Science, Rural Development Administration, Youngdeok 36405, Republic of Korea
4
Research Policy Bureau, Rural Development Administration, Jeonju 54875, Republic of Korea
*
Author to whom correspondence should be addressed.
These authors contributed equally to this work.
Agronomy 2025, 15(6), 1430; https://doi.org/10.3390/agronomy15061430
Submission received: 8 May 2025 / Revised: 7 June 2025 / Accepted: 9 June 2025 / Published: 11 June 2025
(This article belongs to the Section Crop Breeding and Genetics)

Abstract

The fried potato market is a high-value industry, exceeding USD 55 billion and still growing. However, the genetic mechanisms underlying key frying traits remain poorly understood. In this study, we conducted a transcriptome analysis on two types of potatoes with distinct end-use purposes to identify the gene expression profiles related to desirable frying qualities, focusing on texture and appearance after frying. Key genes encoding starch synthase 1 and 3, sucrose synthase 4, invertases, and pectin methyl-esterase inhibitors were found to be differentially regulated in waxy and mealy potatoes based on their frying characteristics. Notably, mealy potatoes exhibited a higher expression of starch synthesis-related genes and a lower expression of invertase genes. These expression patterns may enhance glucose-to-starch conversion, thereby reducing glucose levels and minimizing sugar-induced browning, which results in a lighter fried appearance. Additionally, we identified two transcription factors, StbZIP2 and StbZIP35, that are potentially co-expressed with two starch synthases. These transcription factors are responsive to abscisic acid, a key hormonal regulator involved in tuber development. This study provides transcriptomic insights for processing quality improvement and identifies key candidate genes for marker-assisted breeding. Further studies across more diverse samples with integrative multi-omics approaches will strengthen the application of these insights in breeding programs.

1. Introduction

Potato (Solanum tuberosum L.), a member of the Solanum genus, ranks among the world’s four major food crops, sustaining over a billion people worldwide. Originating from South America, potatoes are now extensively cultivated because of their agricultural efficiency and high yield potential [1,2]. Potatoes develop underground storage organs known as tubers, which facilitate asexual propagation through tiny buds called eyes, enabling efficient and straightforward cultivation. Moreover, potatoes demonstrate a high yield per unit area relative to other major crops and have a short growing cycle of approximately 100 days, making it possible to harvest multiple planting cycles within a year [3].
Similar to other plants with storage organs, potatoes accumulate photosynthetic products as starch, which is transported from leaves to tubers as sucrose [4,5]. The source–sink relationship between leaves and tubers is central to the high starch content of tubers, which have a dual function of storage and sink. Starch is a primary component of the potato dry matter and constitutes 60–80% of its dry weight [6]. It comprises two structural polysaccharides, amylose and amylopectin, which have linear and branched structures, respectively. In potato tubers, the typical amylopectin to amylose ratio is approximately 3:1, although this ratio varies with genotype and environmental conditions. Based on their starch composition, potatoes are classified mainly as mealy or waxy according to their texture. Mealy potatoes contain higher amylose levels, while waxy potatoes are richer in amylopectin. These differences affect their culinary applications, with mealy potatoes being ideal for frying (e.g., chips and French fries), while waxy potatoes are more suitable for table stock [7,8].
Mealy potato cultivars, including “Russet Burbank”, “Shepody”, and “Atlantic”, are primarily used to produce French fries and potato chips, which are highly valuable in the processed food industry [9]. Potato chips, made with thinly sliced potatoes, hold a dominant position in the global snack market, with a value exceeding USD 35 billion [10,11]. Similarly, French fries hold a substantial market presence in the fast-food industry and home cooking, with a market size surpassing USD 20 billion [11]. These products’ frying qualities are determined by several factors, including texture, fried color, appearance, and tuber shape [12]. Among these factors, texture and color after processing are particularly essential in determining quality. For chips and French fries, a crispy crust and a light, pale golden color after frying are desirable characteristics. However, conventional breeding programs for potatoes used for frying purposes are hindered by the quantitative nature of such key traits, which are polygenic and environmentally sensitive. Consequently, traditional phenotypic selection approaches are often inefficient, typically requiring from 10 to 12 years to develop a new variety [13,14,15]. To reduce the time required for developing new cultivars, various genetic and physiologic studies have been conducted to explore the associations between carbohydrate composition and frying-related traits, thereby yielding valuable insights for breeding efforts [12,16,17,18,19,20,21,22,23,24,25,26,27].
Carbohydrates in potatoes can be divided into the following three main categories: starch, nonstarch polysaccharides (NSPs), and reducing sugars. The NSP characteristics and starch concentration in tubers influence the texture of fried potatoes [16,18,19]. NSPs, which include cellulose, hemicellulose, and pectin, are key components of the cell wall [28,29,30,31]. They determine the cell wall strength and the connections between cells, affecting cell separation and flattening during starch gelatinization, which, in turn, impacts the final texture of fried potatoes. Additionally, a high starch concentration, inversely related to moisture content, improves the crust’s crispiness by promoting moisture evaporation during frying. Low reducing sugar levels are crucial for achieving the desired light golden color in fried potato products. During frying, the reducing sugars react with amino acids through the Maillard reaction at high temperatures, producing melanoidin pigments. This process causes browning, which negatively impacts the appearance and flavor of the final product [20,21,22].
Advancements in sequencing technologies have greatly facilitated genomic research on traits related to frying qualities. The potato genome’s complex characteristics, including autotetraploidy, high heterozygosity, and a large size of 3.1 Gbp, have historically posed challenges for genomic research. However, the development of long-read sequencing has enabled the creation of a chromosome-scale reference genome using doubled monoploid potatoes with a high resolution, allowing for more detailed investigations into frying-processing traits [23,32,33]. Previous studies using GWAS and QTL mapping identified putative SNPs and QTLs associated with frying processing quality on chromosomes 1, 3, 4, 5, 7, and 10 and additional tentative SNPs on other chromosomes [24,25,34]. Notably, SNPs on chromosome 10, in the 49–60 Mb region, have been highlighted for their potential influence on reducing sugar levels, which can impact the appearance of processed potatoes [26,27]. Moreover, other processing-related trait analyses, such as on tuber shape, starch content, and specific gravity, have reported QTLs on chromosome 10.
While the genetic basis of frying-related traits has been explored through recent genomic studies, transcriptome-level investigations remain relatively limited, especially in the context of different potato types. Traits such as texture and browning are known to be governed by complex interactions involving carbohydrate metabolism and signaling pathways, yet their gene expression patterns across different tuber types are still unrevealed [35]. Transcriptome analysis provides a valuable approach to identify the key molecular pathways and regulatory mechanisms associated with these traits, helping to uncover how gene expression influences the phenotypic characteristics related to frying quality. In this study, we performed a comparative transcriptomic analysis of mealy and waxy potato tubers to investigate the differences in gene expression profiles associated with starch synthesis and carbohydrate metabolism, which are critical factors in frying quality and yield. A total of four genotypes, consisting of three commercial cultivars and one advanced breeding line from the Highland Agriculture Research Institute (HARI), were selected and categorized into mealy and waxy types based on their characteristics. By examining the differential gene expressions between these two types, we aimed to understand how transcriptomic variation contributes to differences in frying traits, including appearance after frying and texture. As a tuber-specific transcriptome study, our research is expected to offer foundational insights that can support more efficient selection strategies in future potato breeding programs focused on enhancing frying quality.

2. Materials and Methods

2.1. Plant Materials and Frying-Quality-Related Phenotype Assessment

Three cultivars and one advanced breeding line, including two mealy and two waxy types, were selected from the HARI farm in Pyeongchang (Gangwon State, Republic of Korea) for RNA sequencing. Based on their breeding backgrounds and texture characteristics after cooking, “Dubaek” and “EarlyFry” were selected as mealy potatoes (dry and crumbly texture with high starch content), whereas “Chubaek” and “S18051-5” were chosen as waxy potatoes (firm and cohesive texture with low starch content). Eight seed potatoes from each sample were planted in March 2022, with three replications, and harvested after 100 days of growth. Similarly, in March 2023, ten seed potatoes from an additional six mealy and waxy potato samples were planted using the same methodology, but with only one replication. Samples from 2022 and 2023 formed Groups A and B, respectively (Table 1). From each replication in Groups A and B, one randomly selected whole tuber was immediately stored in liquid nitrogen for RNA sequencing. Among various frying-quality-related traits, glucose content—which affects the fried color—the specific gravity reflecting starch content, and lightness after frying were measured for Group A potatoes. For Group B potatoes, glucose content and specific gravity were also measured. The glucose concentration was measured with the ACCU Check Guide Me Kit (Roche), and other traits were measured after harvest from a randomized, complete block design with two replicates in two environments. Statistical analysis between the mealy and waxy potato types was conducted in R using Wilcoxon and t-tests.

2.2. RNA Sequencing

High-molecular-weight RNA was extracted from the frozen tubers of four Group A potato samples (three replicates) each and twelve Group B potato samples (no replicate) using the RNeasy Plant Mini Kit (QIAGEN, San Diego, CA, USA). DNase1 (QIAGEN) was applied following the manufacturer’s protocol to avoid potential genomic DNA contamination. The total RNA concentration was measured with Quant-IT RiboGreen (Invitrogen, Waltham, MA, USA), and QC was conducted using TapeStation RNA Screentape (Agilent Technologies, Santa Clara, CA, USA). Samples with RNA integrity number values of ≥6.0 or above were utilized for library preparation with the TruSeq Stranded mRNA Sample Prep Kit (Illumina). Sequencing was conducted with the Illumina NovaSeq platforms (Illumina, Inc., San Diego, CA, USA) with paired-end reads of 2 × 151 bp at SEEDERS (Daejeon, Korea).

2.3. Read Processing, Mapping, and Differentially Expressed Genes (DEGs) Analysis

Adapter trimming and quality control of the produced raw RNA reads were performed using Trimmomatic (v0.39) with the following parameters: window size = 4, mean quality ≥ 15, TRAILING ≥ 3.3, minimum length of reads ≥ 36, and adapter = TruSeq3-PE.fa [36]. The quality-controlled reads were then used for downstream analyses with the doubled monoploid potato genome DM 1–3 516 R44 as a reference (available at http://spuddb.uga.edu/dm_v6_1_download.shtml, accessed on 28 March 2024.) [32]. Paired-end reads were aligned to the reference genome using hisat2 (v2.2.1), and read counts were calculated with the htseq-count software (v.2.0.5) while generating mapping statistics with samtools flagstat [37,38,39]. The DESeq2 package in the R environment was used to analyze the DEGs in the four Group A potato samples [40]. The built-in median of the ratio normalization method was applied to reduce the deflection of read counts caused by gene length and sequencing depth. Multidimensional scaling analysis was performed using the glimmaMDS function from the Glimma package in R to visualize the samples’ variation [41]. DEGs between the two types were identified based on an adjusted p-value threshold of 0.05 and an absolute log2FoldChange (Log2FC) of 1.0, which is commonly regarded as biologically meaningful in transcriptomic studies to ensure differences in gene expression patterns.

2.4. Gene Ontology (GO) Analysis

GO analysis was performed for each potato type using the identified DEGs to investigate their biological significance in Group A. The analysis was conducted with the topGO package in the R environment, focusing on the following three domains: cellular component (CC), biological process (BP), and molecular function (MF) [42]. A weight01 fisher value of 0.05 was set as the cut-off to identify enriched GO terms, considering the terms’ hierarchical structure.

2.5. Carbohydrate Metabolic Gene Expression Analysis

Genes involved in the metabolic pathways of starch and NSPs, including cellulose, hemicellulose (xyloglucan, xylan, mannan, glucomannan, and beta-glucan), pectin, glycolysis, gluconeogenesis, and the TCA cycle, were investigated to analyze the carbohydrate metabolism. These genes were identified based on previous studies, the KEGG database, paralogs from related genera such as Solanum and Nicotiana, and the model plant Arabidopsis thaliana, in addition to annotated genes from the reference genome. Eighty-one genes involved in starch metabolism in potatoes were selected based on previous research findings [43]. For NSPs, 138 genes associated with the metabolic pathways of hemicelluloses, including xylan, xyloglucan, mannan, glucomannan, and beta-glucan, were chosen from closely related species, along with the KEGG database. Additionally, 196 genes related to pectin metabolism and 44 genes involved in cellulose metabolism, key NSPs of the plant cell wall, were identified using similar methods. Furthermore, 50 genes involved in general carbohydrate metabolic pathways, such as those encoding glucosidase, fructosidase, and invertase enzymes responsible for producing glucose and fructose from sucrose, were classified under the common-carbohydrate category. Lastly, 154 and 63 genes involved in glycolysis, gluconeogenesis, and the TCA cycle were identified through similar methodologies. A comprehensive list of genes related to carbohydrate metabolism within the reference genome is provided in Table S1.

2.6. Coexpression Analysis with Weighted Gene Coexpression Network Analysis (WGCNA)

WGCNA analyzed the gene coexpression patterns related to distinct potato types using normalized and variance-stabilized gene expression data processed with the DESeq2 package [40,44]. WGCNA was performed with genes in the top 95% variance range to enhance reliability and reduce noise. A soft-threshold power of eight was chosen for the network construction to achieve a scale-free topology. Modules were identified within the network, and correlations between potato type and gene expression levels were evaluated within each module. A statistical t-test with an adjusted p-value threshold of 0.05 was applied to determine the significant modules. For each significant module, hub genes were selected based on the following two criteria: module Eigengene-based connectivity (kME) and gene significance for a phenotype (GS). The top 10 genes with the highest kME and GS values were identified as hub genes, which are thought to be central to the module’s regulatory mechanisms and functions. GO analysis was performed following the same methodology and cut-off criteria as mentioned above to explore the biological functions of the significant modules.

2.7. Transcription Factor Coexpression Analysis

A Pearson correlation analysis was conducted in the R environment with 24 transcriptome datasets, including twelve Group B and four Group A potato samples (with three replicates) to identify the specific transcription factors coexpressed with those involved in starch synthesis metabolism. The transcription factor sequences of S. tuberosum were obtained from PlantTFDB (https://planttfdb.gao-lab.org/, accessed on 15 April 2024.), and the transcription factors in the reference genome were identified through BLAST (v.2.9.0+) [45]. Among the transcription factors, those with a correlation coefficient higher than 0.6 with significantly regulated genes in the starch metabolism pathway were selected as significantly coexpressed transcription factors.

3. Results

3.1. Phenotypes Related to Frying Quality

The four Group A potato samples chosen for the transcriptome analysis displayed distinct traits related to frying qualities. The two mealy potatoes exhibited lower glucose levels, with “Dubaek” and “EarlyFry” at 19 or less (below the detection limit, 10), while the two waxy potatoes exhibited higher levels of 80 and 100. The lightness of fried potatoes, which is inversely related to the reducing sugar content, followed a similar inverse trend. The mealy potatoes exhibited higher lightness values above 71.0, while the waxy potatoes had values below 50.77. Specific gravity, influenced by the tuber starch content in tubers, was also higher in the mealy potatoes, consistent with the anticipated differences between these potato types (Table 2). The Group B potatoes showed a similar phenotypic trend, with waxy types exhibiting higher glucose content and lower specific gravity. Statistical analysis of both Group A and B potatoes revealed that three frying-related traits—specific gravity, glucose content, and lightness after frying—differed significantly between mealy and waxy potatoes (Figure 1). These overall trends are consistent with the inherent characteristics of mealy and waxy potatoes and reflect the inverse relationship between glucose content and lightness after frying.

3.2. Transcriptome Sequencing and Mapping

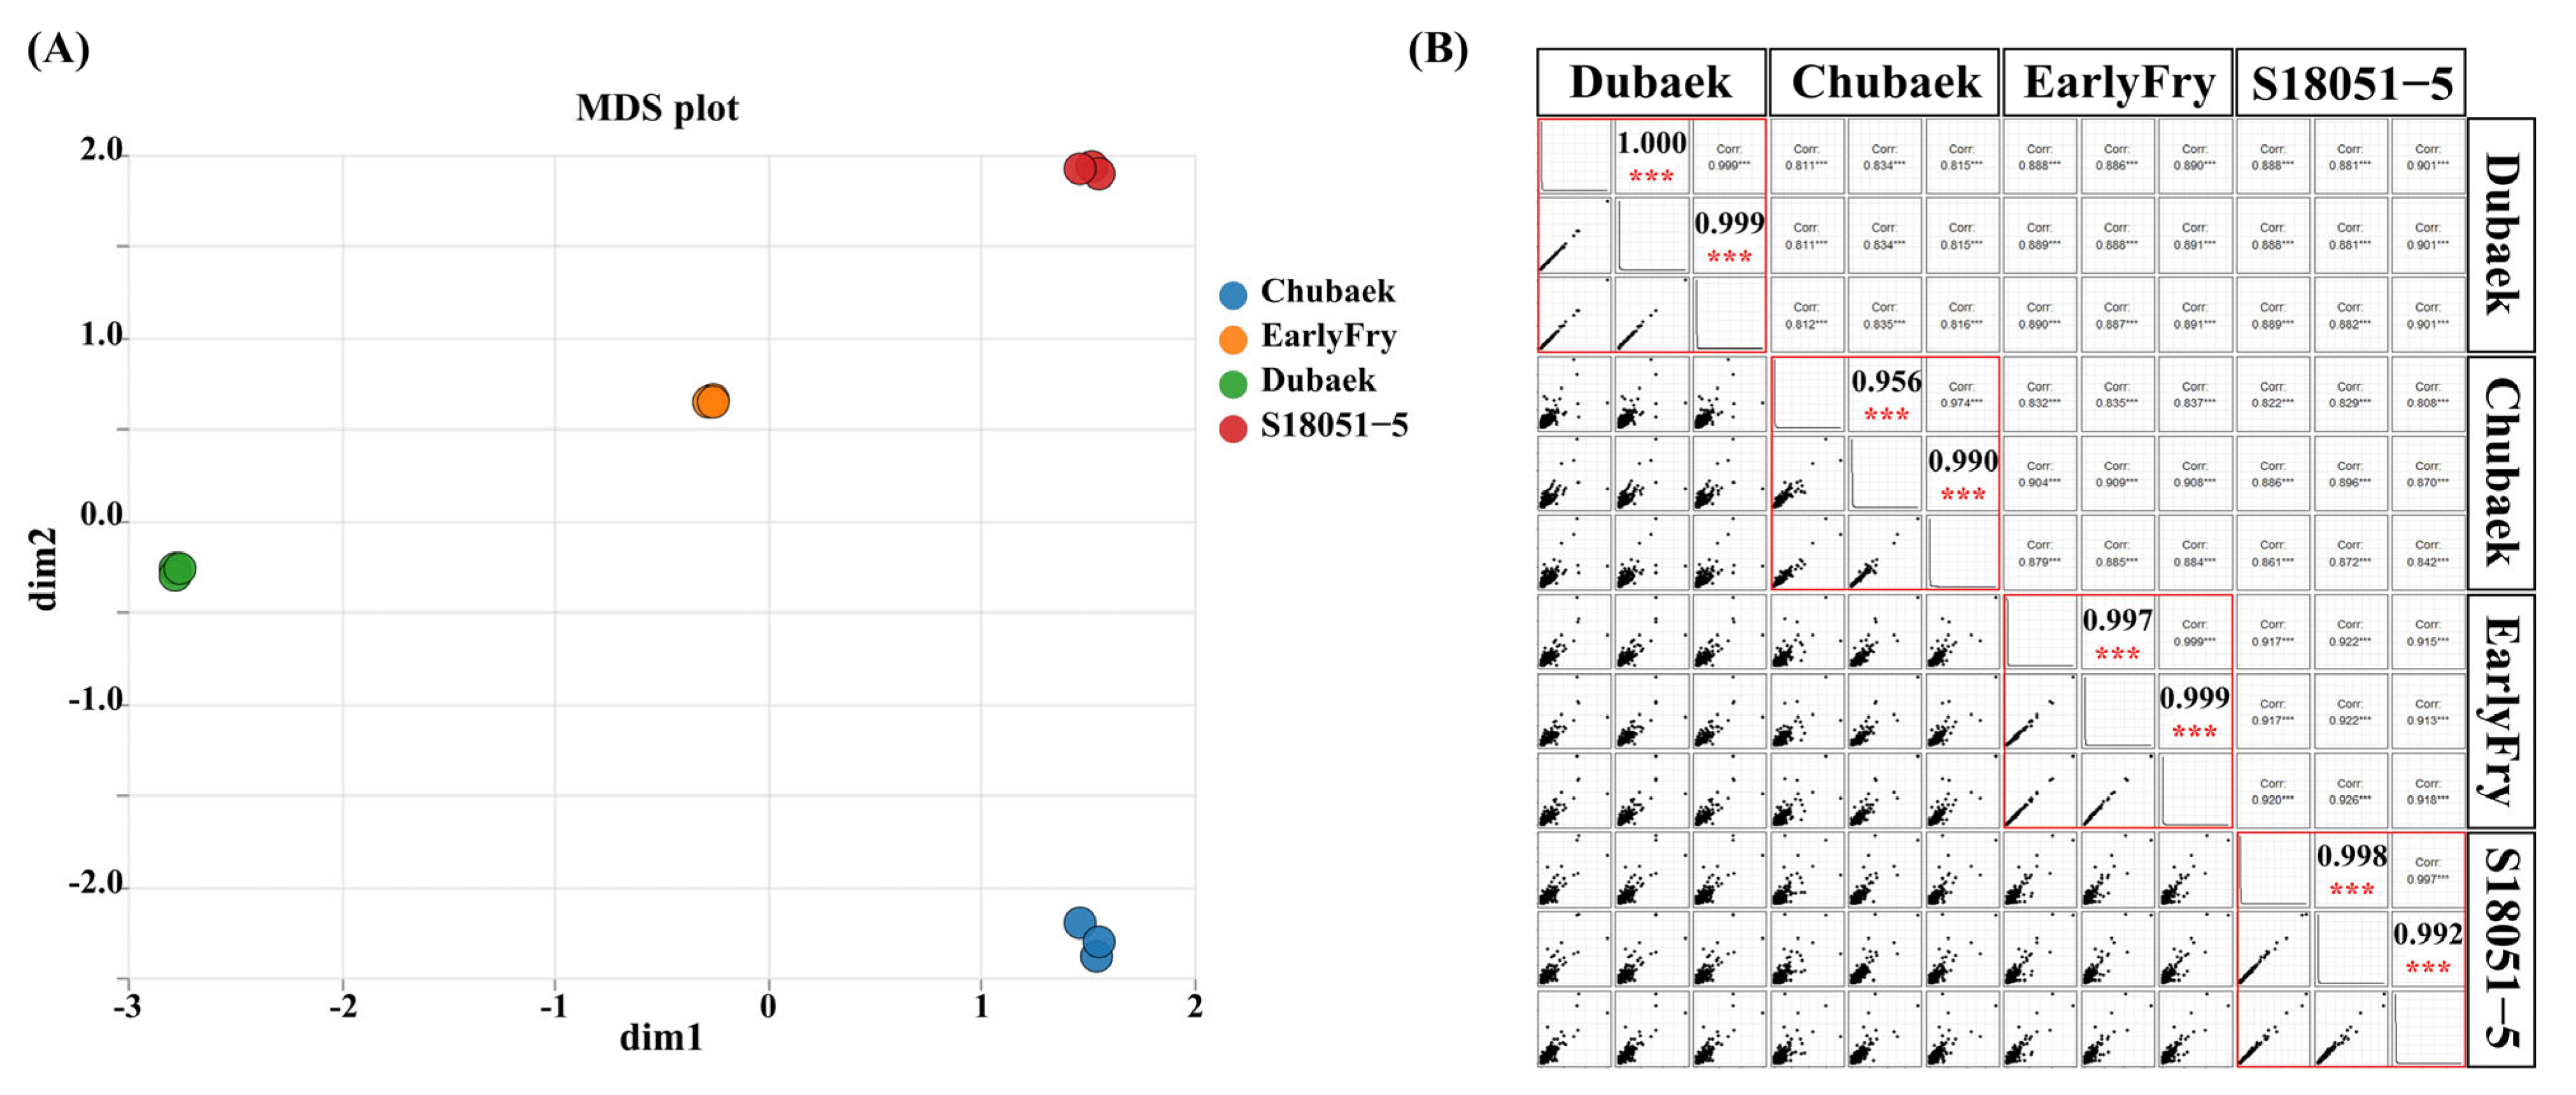
The Q30 base quality of the raw RNA data for the Group A samples exceeded 91.3%, with the number of reads ranging from 13,750,571 to 19,184,177. After quality control, between 13,439,518 and 19,256,166 reads were retained, with an average read length of 146.91 bp. Of the preprocessed reads, 90.84–93.40% were successfully mapped to the reference genome, and 83.64–86.20% were paired correctly (Table 3.). In the MDS plot, the 12 RNA datasets are clearly separated into four groups corresponding to their respective samples, with high correlation values ranging from 0.956 to 1.000 within each replication, indicating a strong reproducibility of the RNA sequencing data (Figure 2). The transcriptome data of Group B potato samples are listed in Table S2.

3.3. Gene Expression Patterns in Two Types of Potato

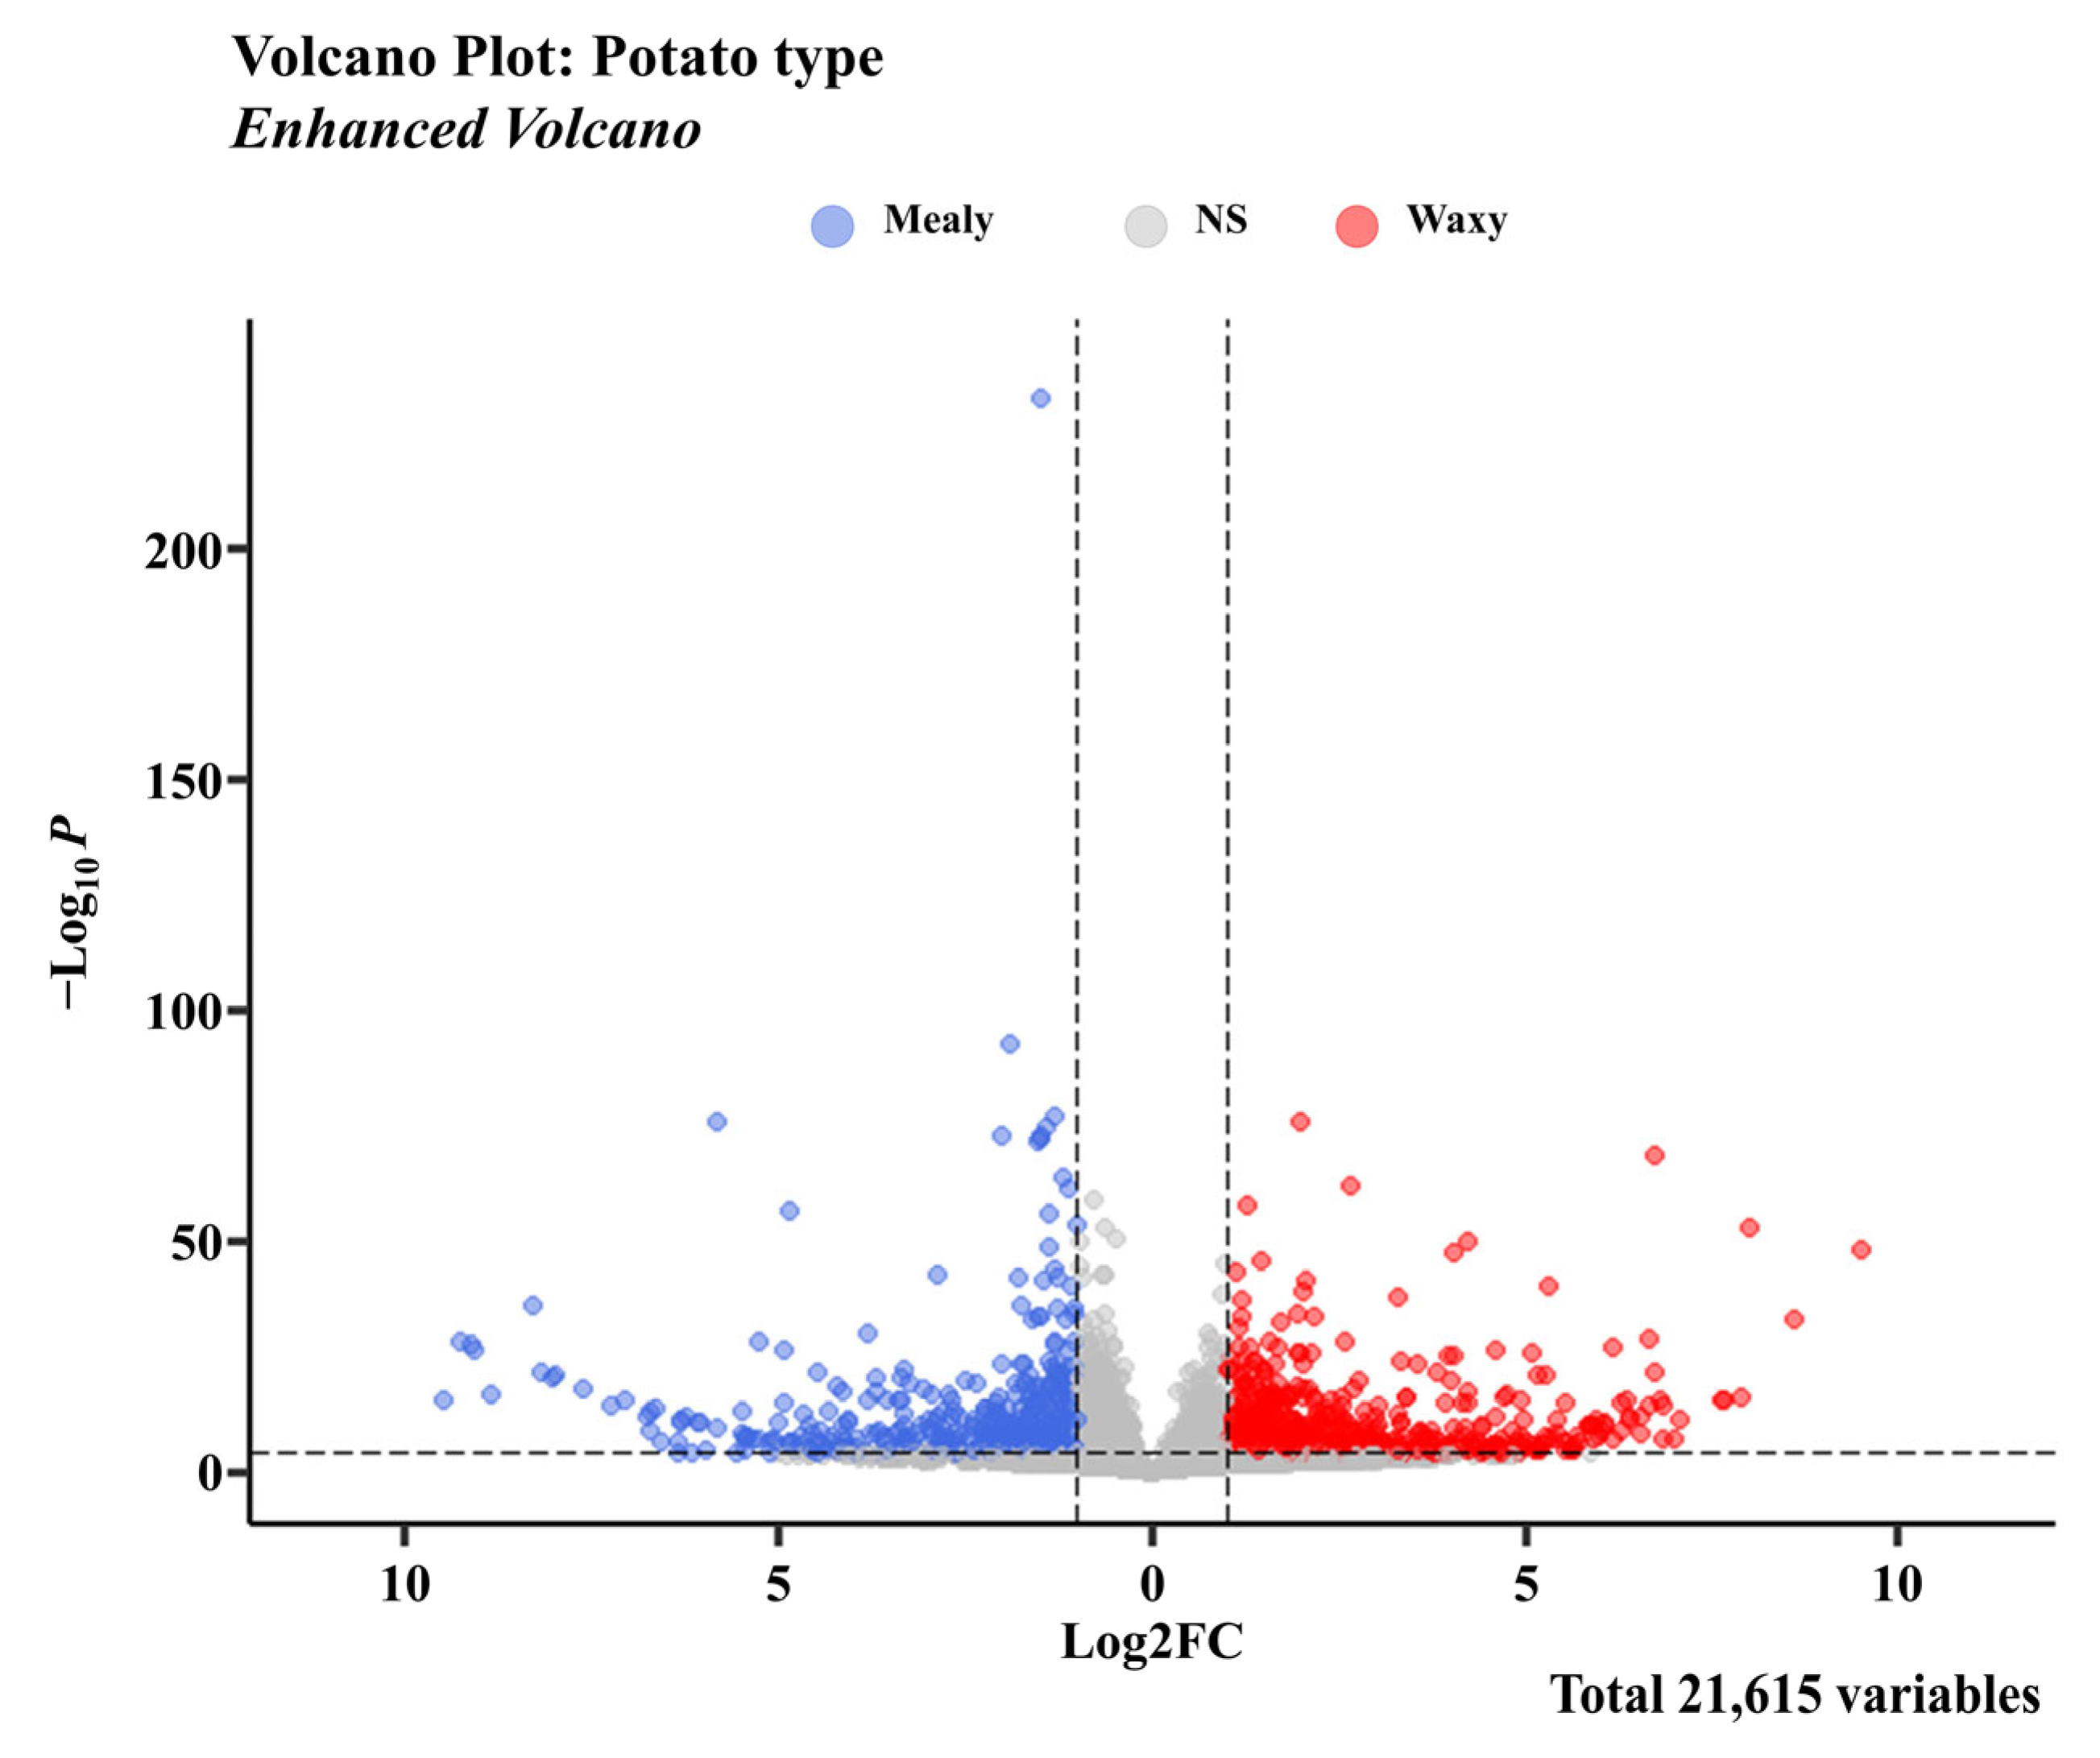
In the DEG analysis of the Group A potato samples, normalized genes with a maximum read count lower than 10 across 12 datasets were filtered out, resulting in 21,615 genes. The subsequent DEG analysis identified 7653 genes with an adjusted p-value of 0.05. From these, we selected 2266 genes with an absolute log2FC greater than 1.00, indicating at least a twofold difference in expression between the mealy and waxy types. DEG analysis revealed that 1431 genes had higher expression in the waxy potatoes, while the remaining 835 genes were significantly expressed in the mealy potatoes (Figure 3).

3.4. Functional Classification of DEGs

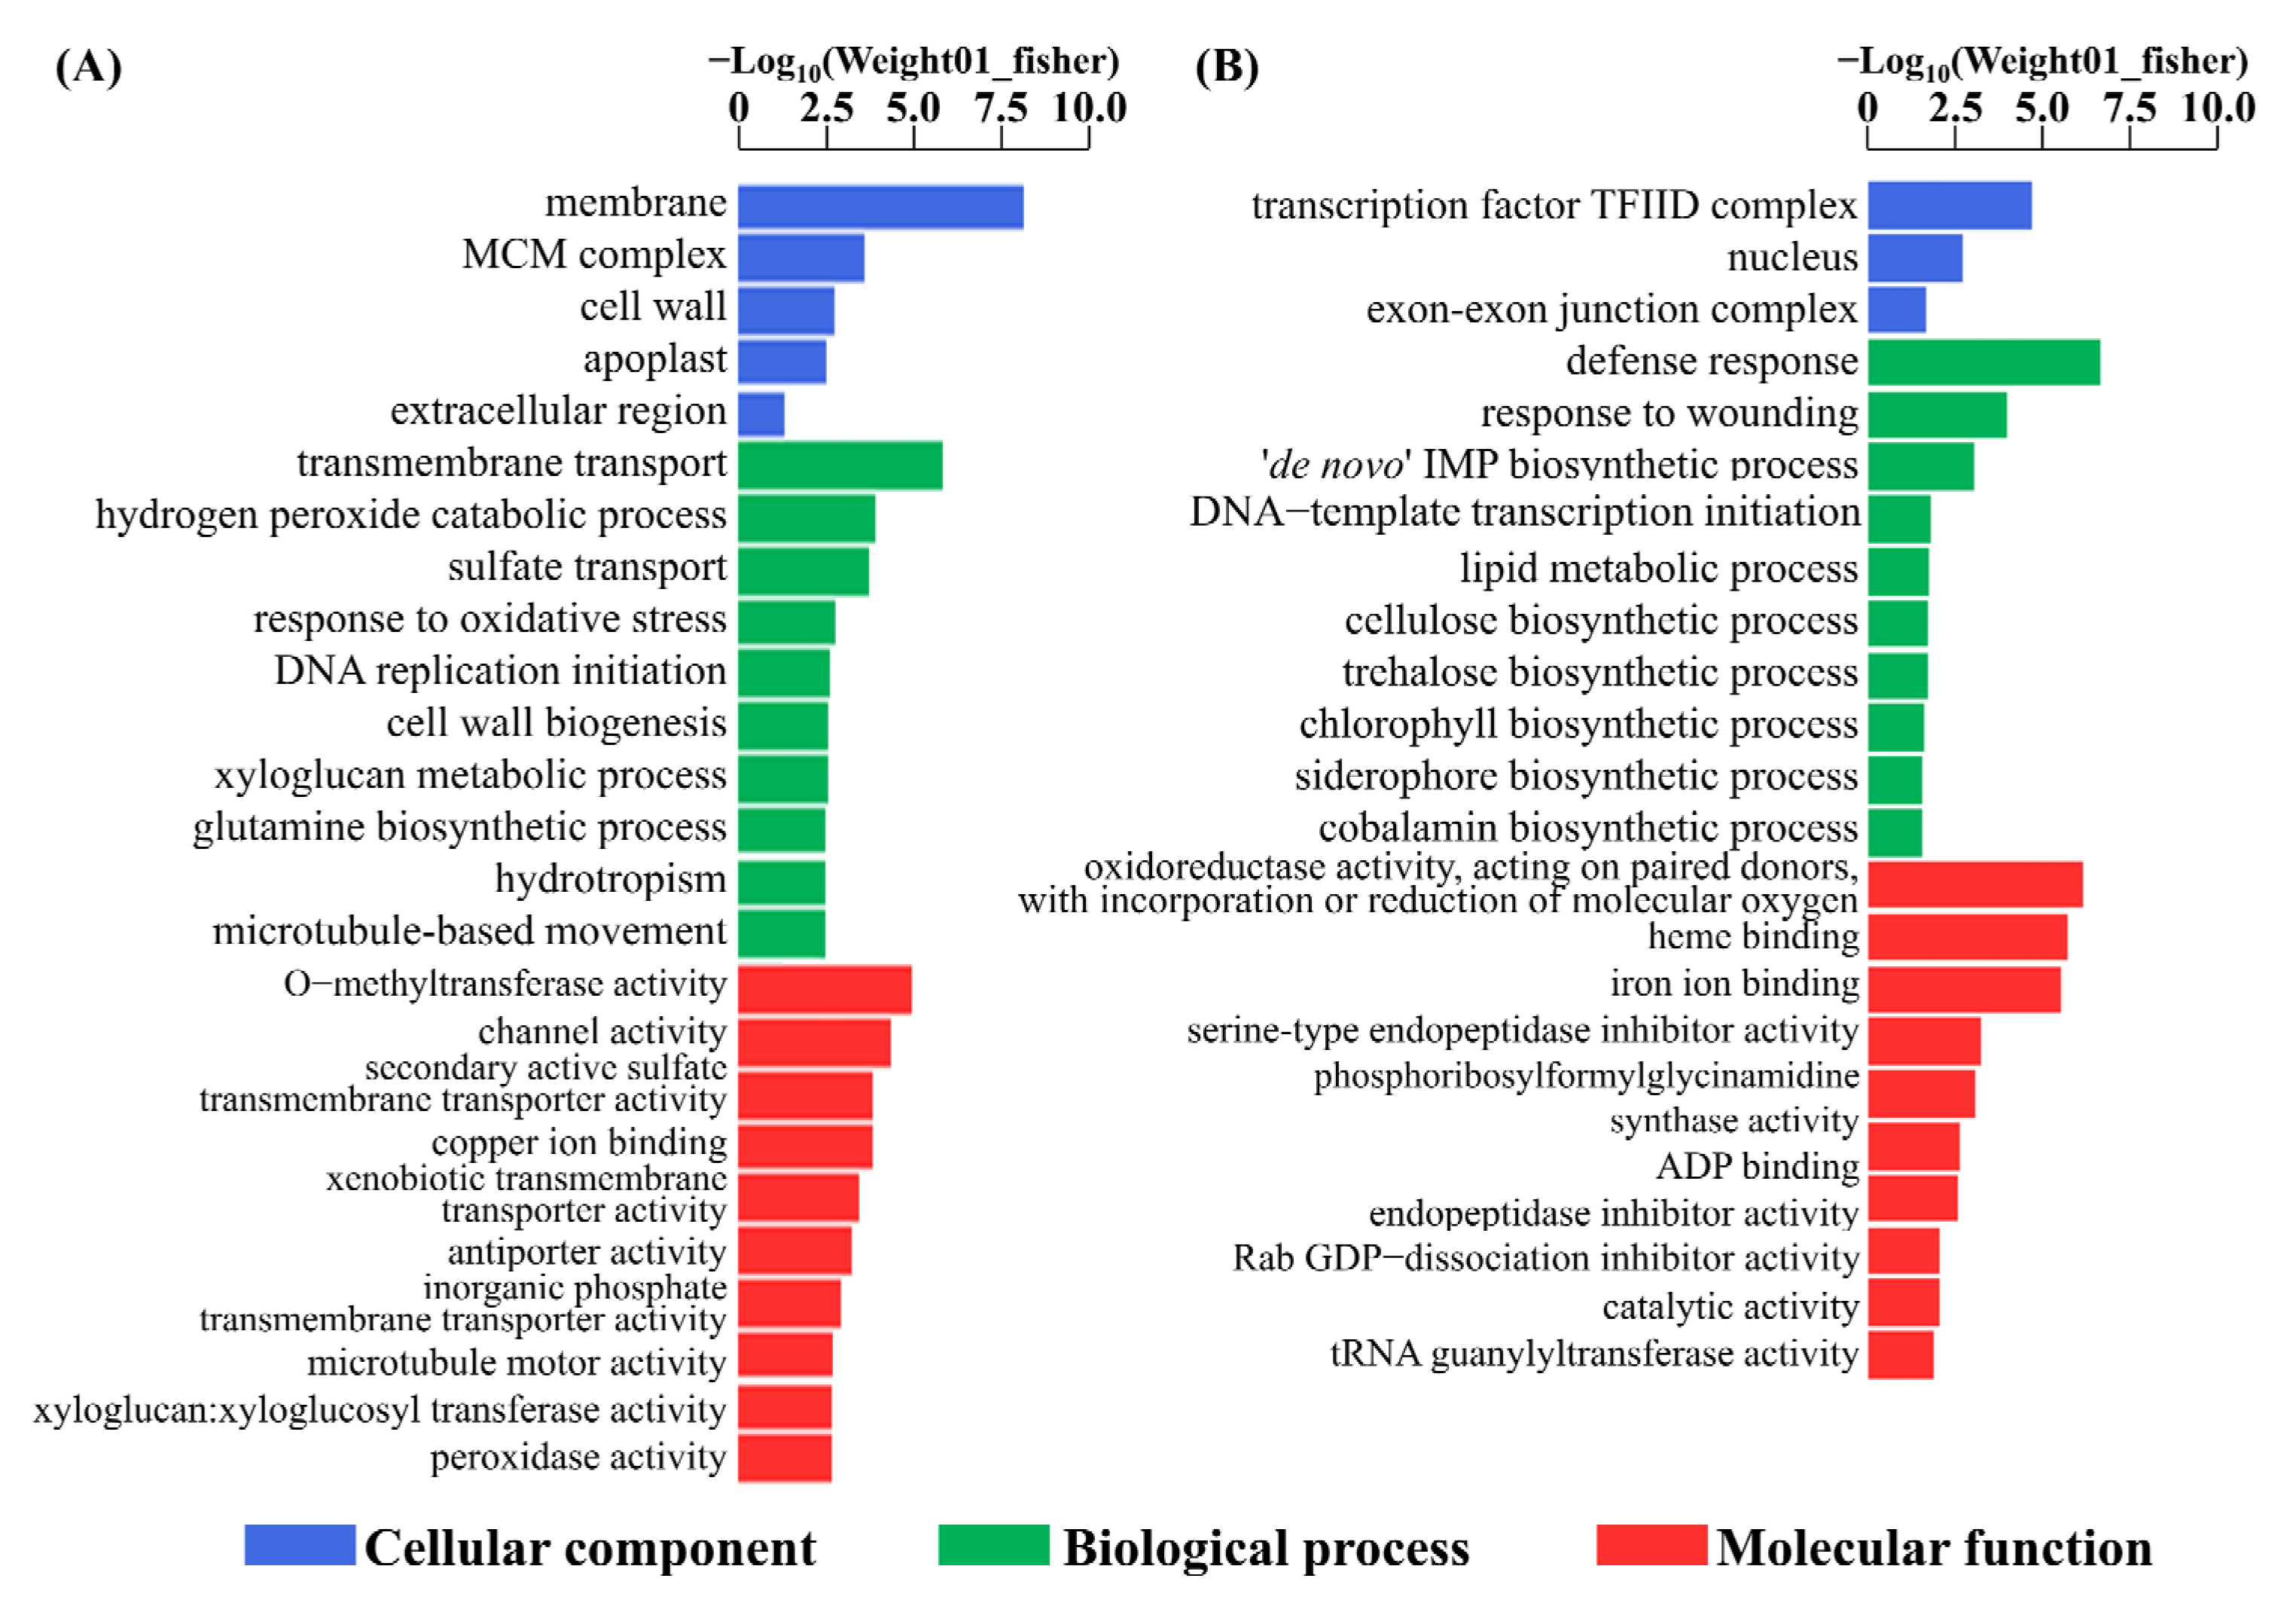
GO enrichment analysis was conducted on the upregulated DEGs in each type to obtain biological insights from the DEGs associated with the differences between the two potato types. GO analysis of the 1431 upregulated genes in waxy potatoes yielded 70 GO terms, including 5 for CC, 26 for BP, and 39 for MF. In mealy potatoes, GO analysis with 835 genes identified 36 GO terms, including 3 for CC, 10 for BP, and 23 for MF. Common GO terms found in the two sets of GO results included defense response (GO:0006952), terpene synthase activity (GO:0010333), and heme binding (GO:0020037). Additionally, metabolic pathways, such as cellulose synthesis, lipid metabolism, purine metabolism, nitrogen metabolism, DNA replication, translation, and transcription, and oxidation–related processes were found in the two sets of GO results. In waxy potatoes, specific GO terms related to glutamine biosynthesis, hydrotropism, microtubule activity for intracellular molecule movement, the transmembrane transport of several molecules, sulfur metabolism, and cell-wall-related processes and functions were identified. Notably, diverse xyloglucan- and pectin-related GO terms were enriched in waxy potatoes. In contrast, the GO terms for mealy potatoes highlighted processes and functions related to chlorophyll biosynthesis, trehalose biosynthesis, terpene synthesis, Rab protein inhibition, vitamin B12 synthesis, and siderophore synthesis (Figure 4). However, no significant GO terms related to starch metabolism were observed in the two sets of GO results. The complete list of GO terms enriched in mealy and waxy potatoes is presented in Table S4.

3.5. Carbohydrate Metabolic Gene Expression Analysis

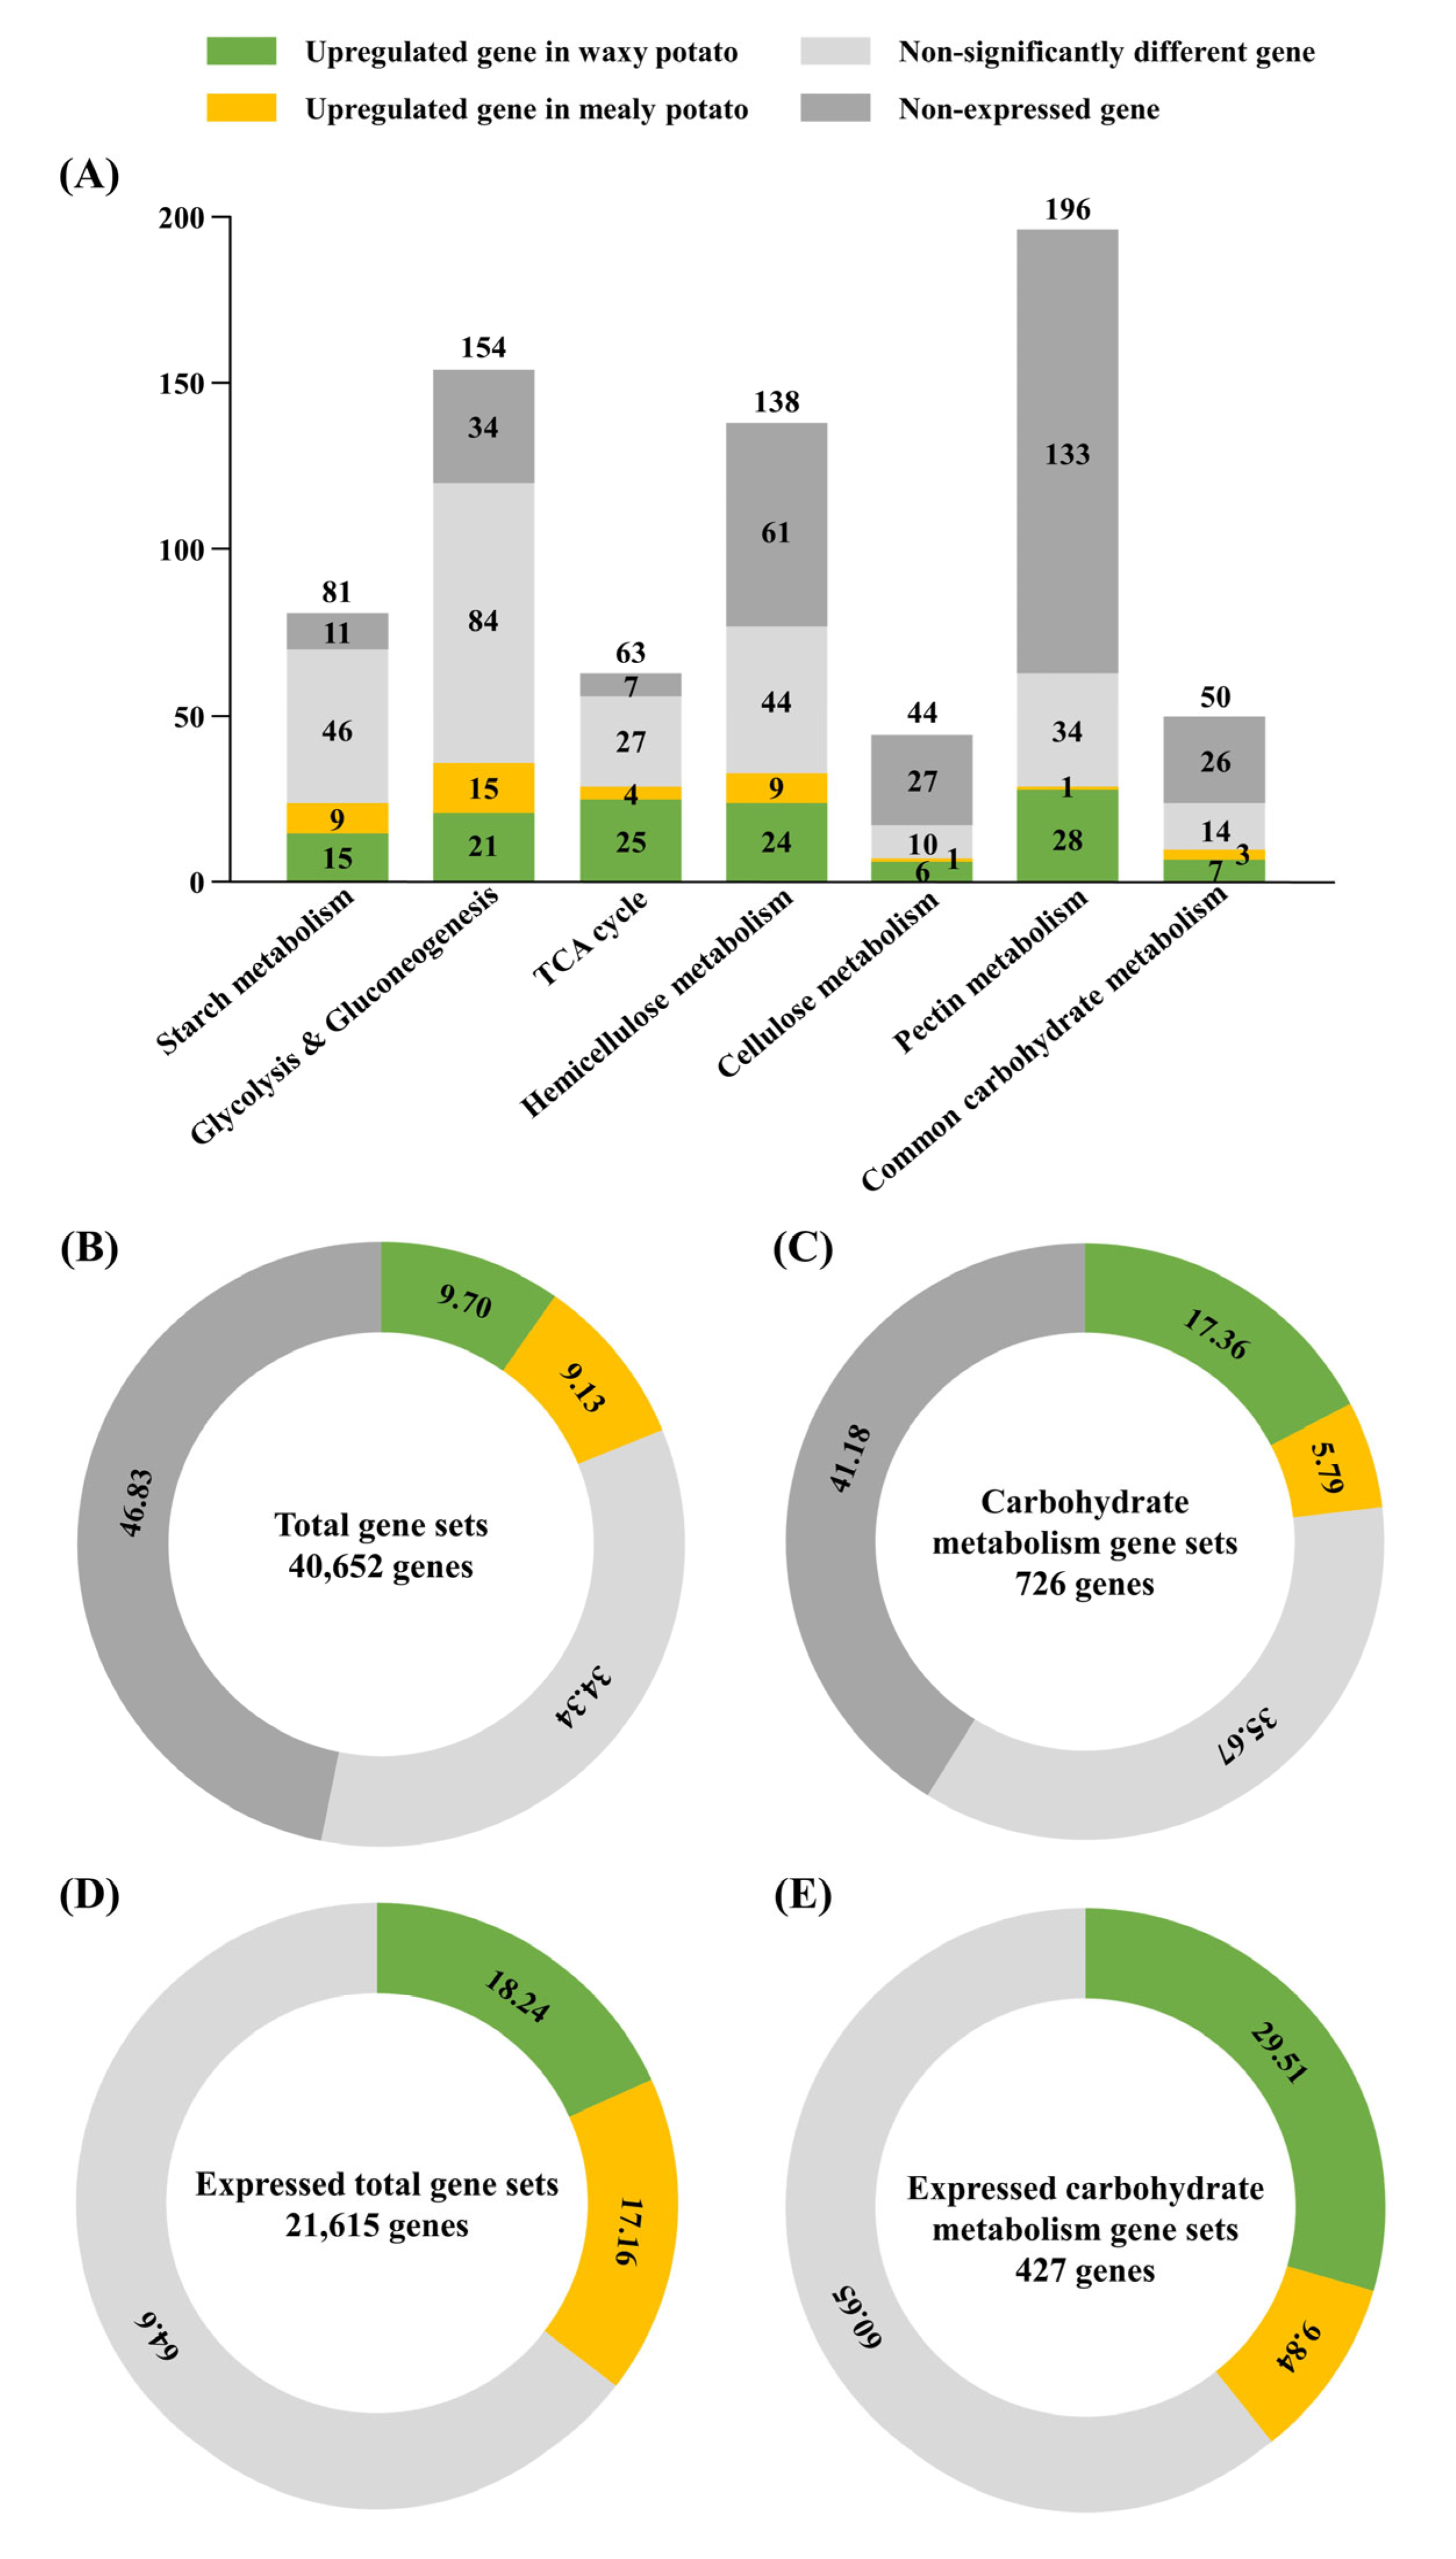
The expression level of the identified genes was analyzed using a similar approach to the DEG analysis, focusing on those with a minimum expression level of 10 across the 12 samples. Genes exhibiting significant differences between the two potato types were filtered based on p < 0.05 and Log2FC = 0. Among the 726 genes associated with carbohydrate metabolic pathways, 427 were expressed (with a minimum expression level of >10), and 168 of these displayed statistically significant differences (p < 0.05). Notably, 126 genes, representing three-quarters of the significant DEGs, were upregulated in waxy potatoes, while the remaining 42 were upregulated in mealy types. Compared to the overall gene expression, where 35.41% of genes were differentially expressed between the two groups, carbohydrate-pathway-related genes exhibited a slightly higher proportion at 39.25%. Interestingly, 29.44% of the carbohydrate-pathway-related genes were upregulated in waxy potatoes, which is over 10% higher than the 18.24% observed in the total gene set, displaying substantial differences in carbohydrate metabolism between the two potato types (Figure 5).
Among the seven carbohydrate metabolic pathways, pectin metabolism exhibited the most notable differences in gene expression patterns between the two potato types. Among the 29 significantly different genes, 28 were highly expressed in waxy potatoes. Similarly, other cell-wall-related pathways and hemicellulose and cellulose metabolism had more genes with a higher expression in waxy potatoes than mealy potatoes, with 24 and 6 upregulated genes compared to 9 and 1, respectively. In the TCA cycle, 29 genes were differentially expressed, with 25 upregulated in waxy potatoes. In the starch metabolism and common-carbohydrate categories, 15 and 7 genes exhibited a higher expression in waxy potatoes, while 9 and 3 had a higher expression in mealy potatoes (Figure 5A).
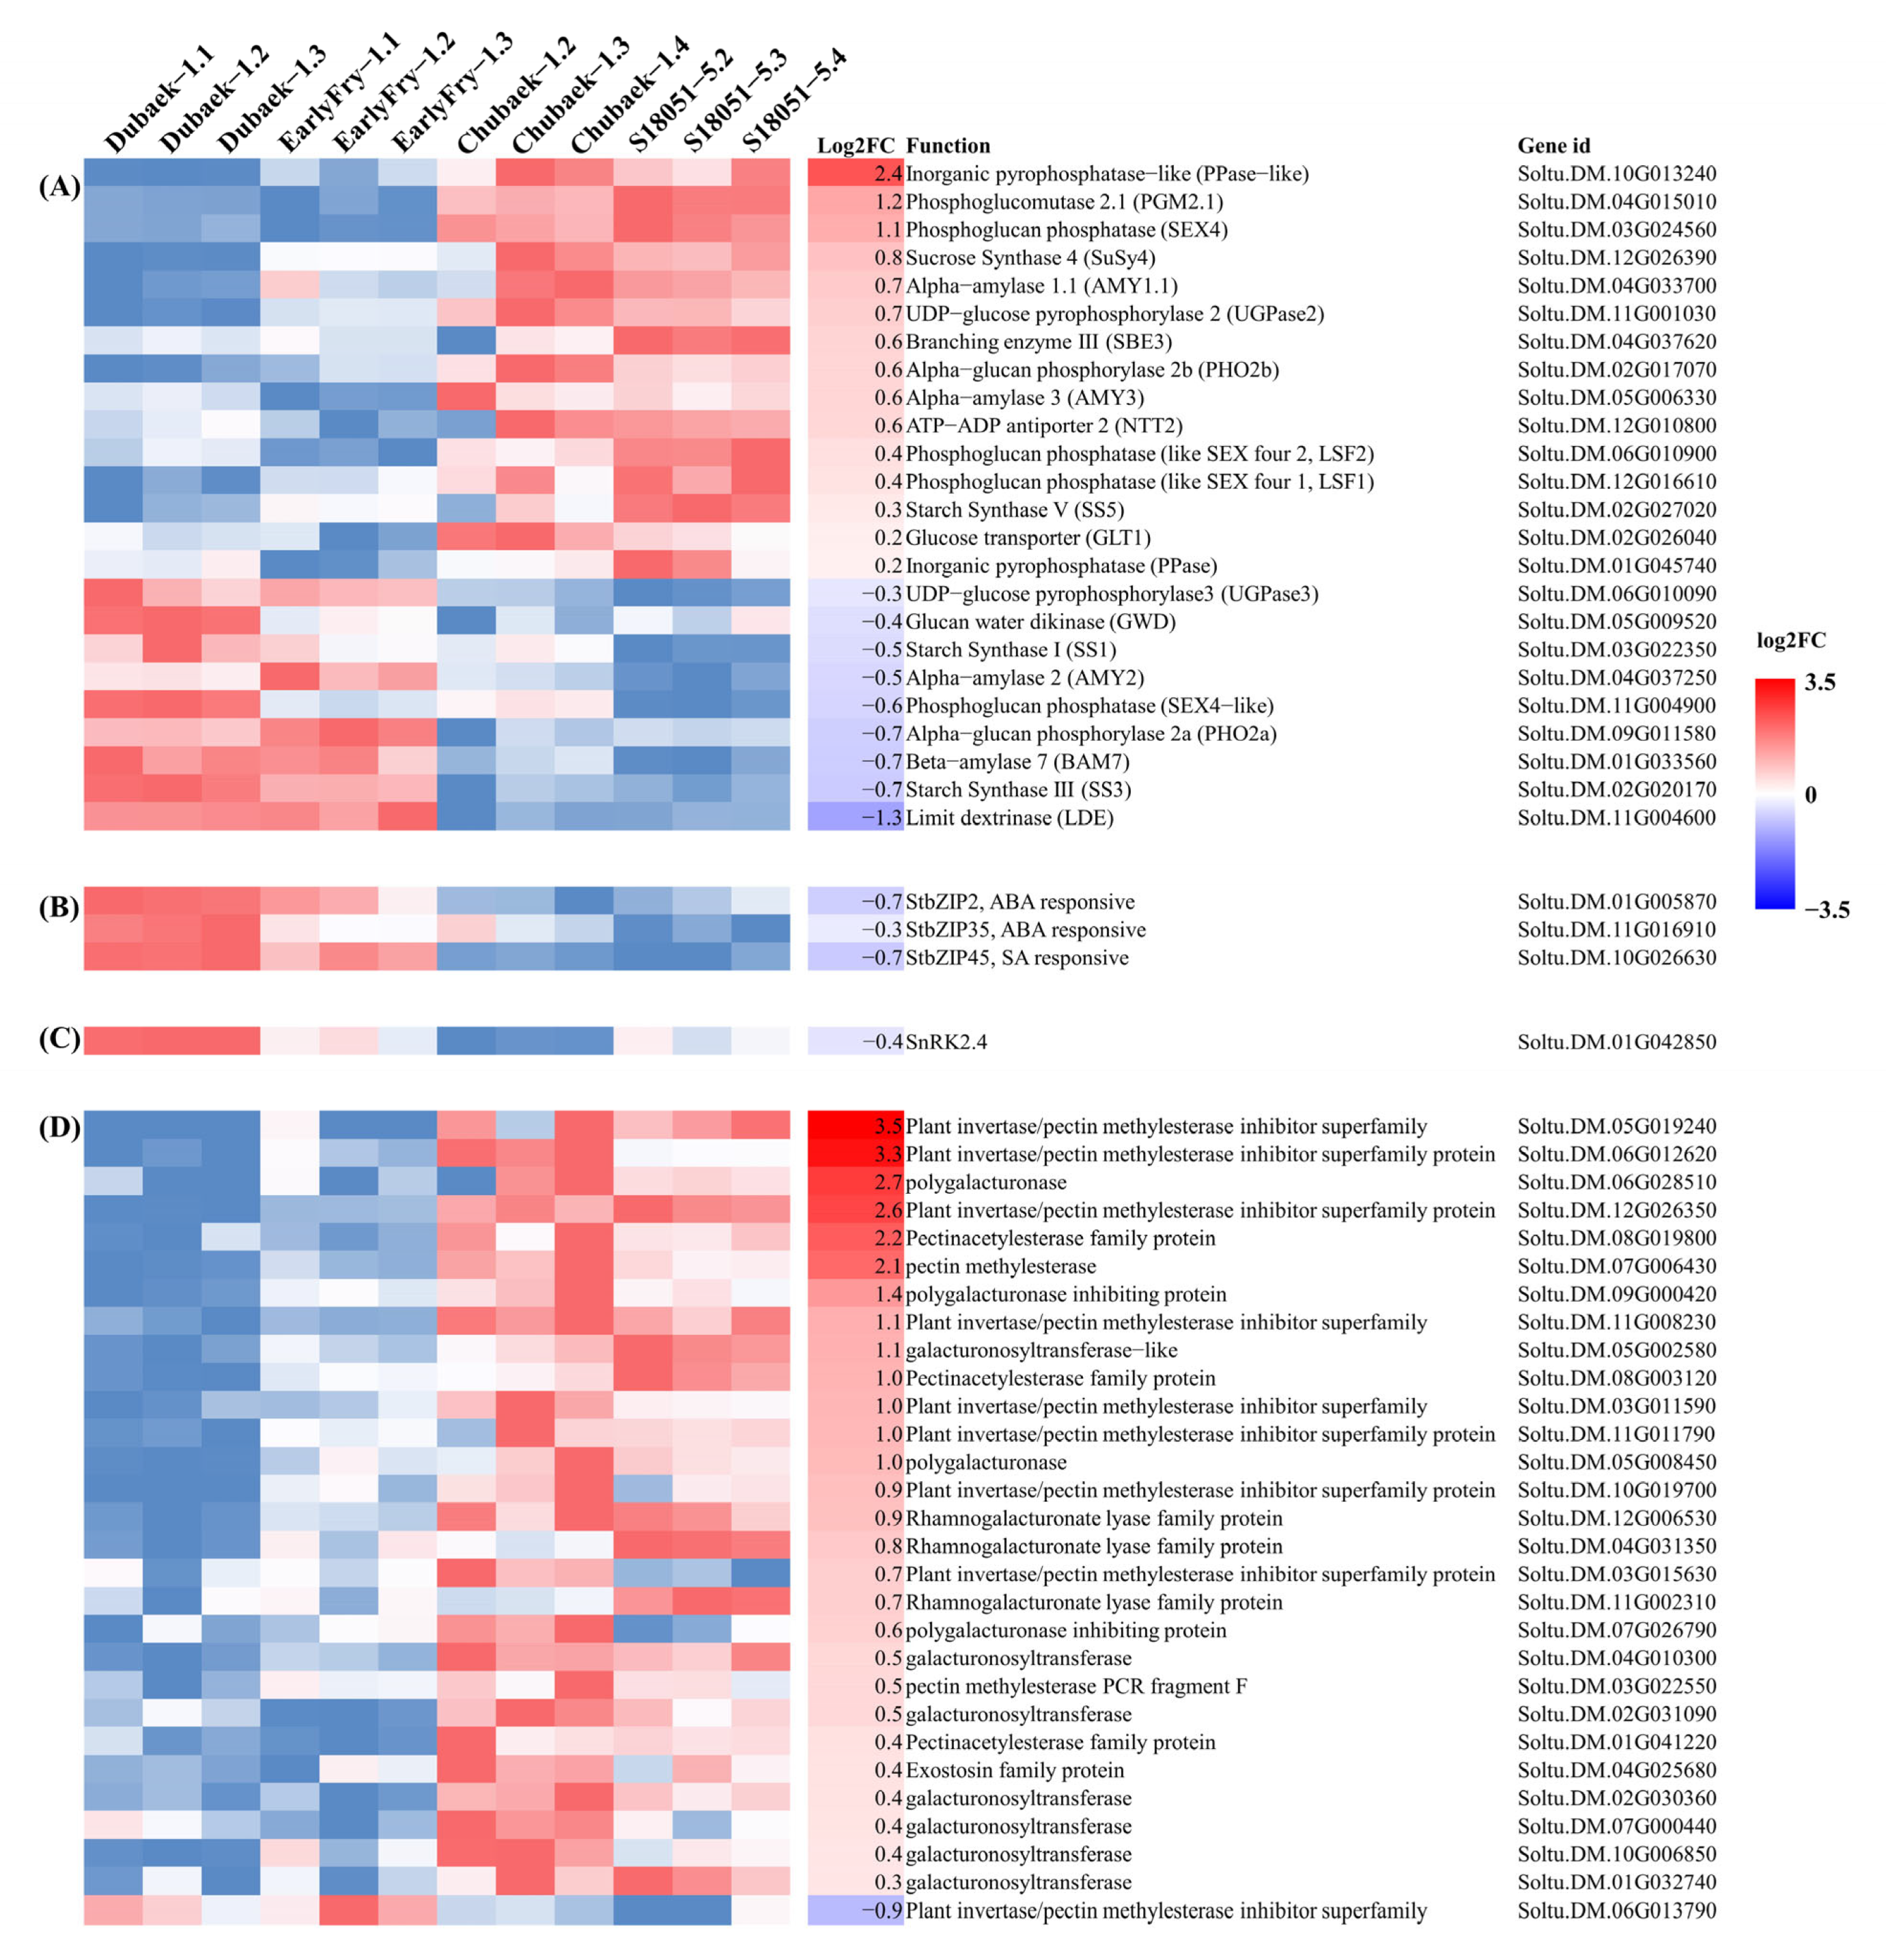
In starch metabolism, the gene encoding the starch branching enzyme (SBE) 2.1, which is involved in amylopectin synthesis, was upregulated in waxy potatoes. Starch synthases (SS) 1 and 3 were upregulated in mealy potatoes, whereas SS5 was upregulated in waxy potatoes. Enzymes involved in starch degradation, such as alpha-amylase (AMY) and beta-amylase (BAM), were upregulated in the two types (Figure 6A). Additionally, sucrose synthase (SuSy) 4 was upregulated in waxy potatoes. Among the common-carbohydrate category genes, five genes encoding invertase, which breaks down sucrose into fructose and glucose—like SuSy—were upregulated in the waxy potatoes. Regarding cell-wall-related genes, 58 genes related to pectin, cellulose, and hemicellulose synthesis and degradation, encoding various enzymes including polygalactrunosyltransferase, polygalacturonase, rhamnogalacturonase lyase, pectin methyl-esterase (PME), pectin methyl-esterase inhibitor (PMEI), cellulase, cellulose synthase, chitinase-like protein, COBRA-like protein, cellulose-synthase-like protein, xylosidase, alpha-galactosidase, xyloglucan hydrolase, xyloglucan, arabinosyltransferase, and fucosyltransferase, were upregulated in waxy potatoes, whereas only 11 genes were upregulated in the mealy type. For the TCA-cycle-related genes associated with energy metabolism, multiple genes encoding citrate synthase, succinate dehydrogenase, isocitrate dehydrogenase, fumarase, malate dehydrogenase, and pyruvate dehydrogenase were upregulated in waxy potatoes. In contrast, only genes encoding 2-oxoglutarate dehydrogenase and two dihydrolipoamide acetyltransferase related to energy metabolism were upregulated in mealy potatoes. Among the genes involved in glycolysis and gluconeogenesis, the two potato types displayed upregulated genes encoding phosphofructokinase, pyruvate kinase, hexokinase, and glyceraldehyde-3-phosphate dehydrogenase, with minimal differences observed between the two types. The gene expressions related to carbohydrate metabolism are provided in Table S3.

3.6. Gene Coexpression Analysis

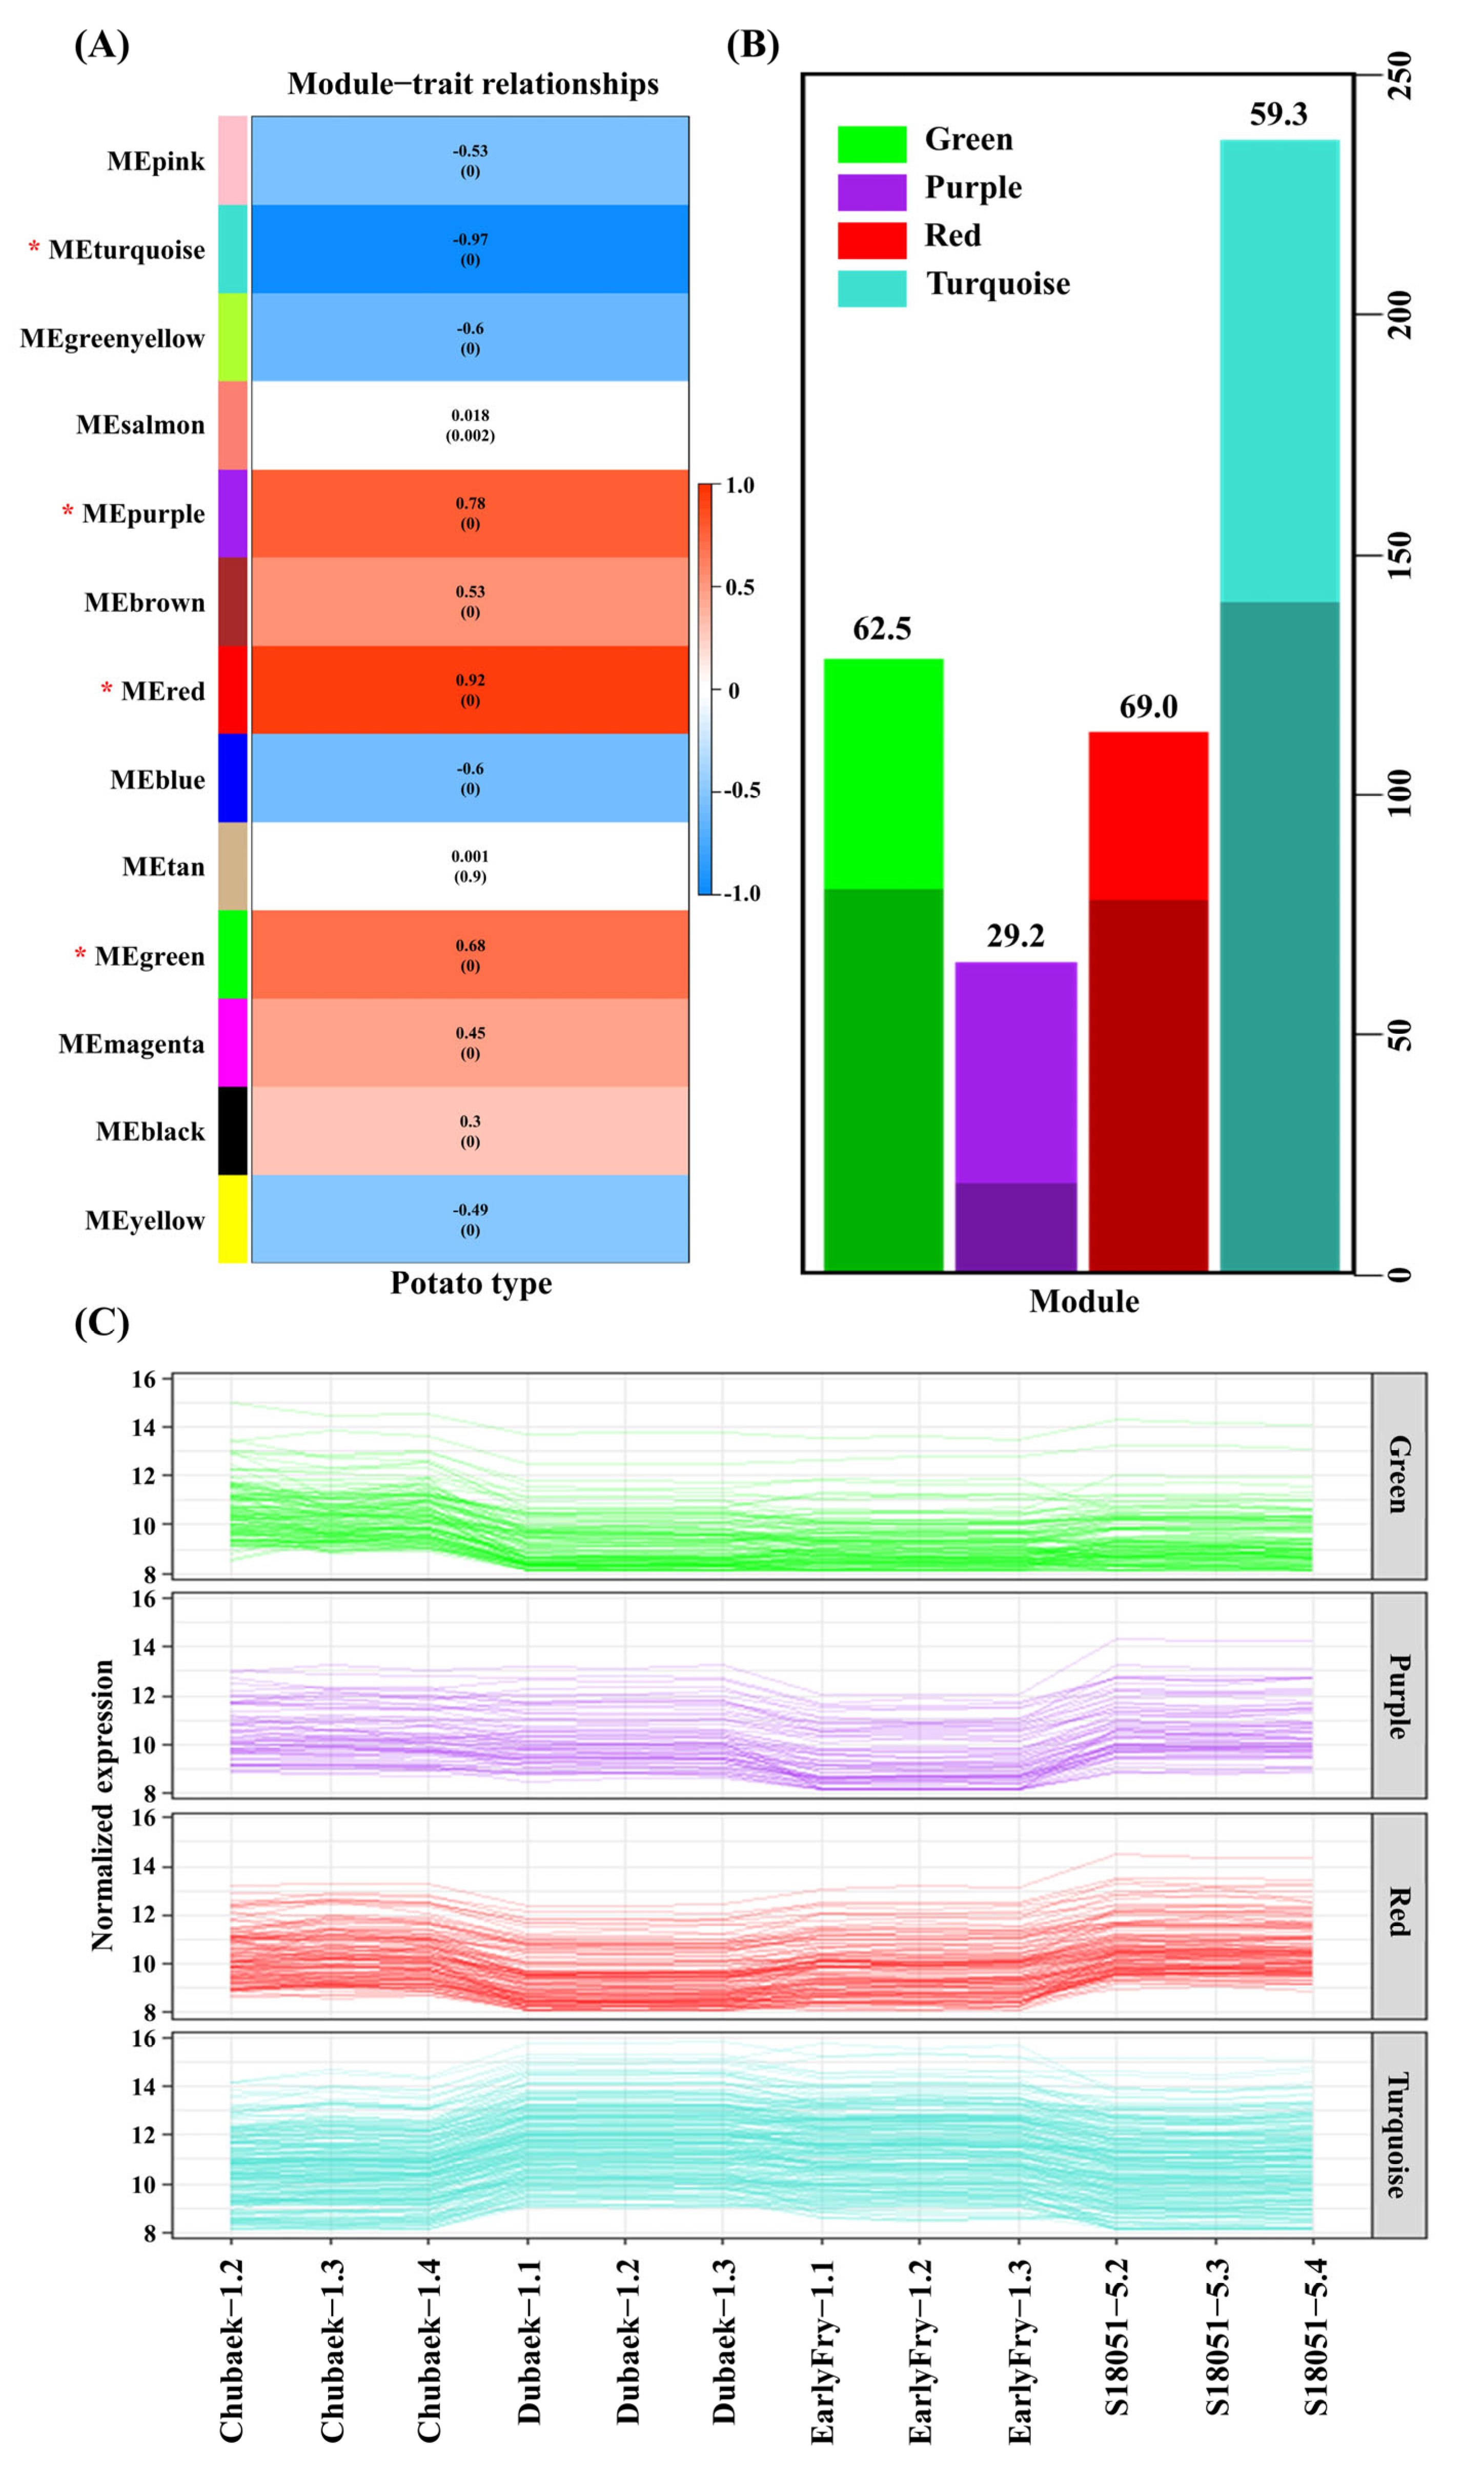
From the 21,615 mapped gene sets, 1391 genes displaying the top 95% of variance were extracted. They were classified into 13 modules using a soft-threshold power of eight. Among the 13 modules, the module–trait relationships, indicating the correlation between frying processing quality and each module, were classified into the following three levels: turquoise, red, and purple modules exhibited a strong correlation (absolute correlation ≥ 0.7); green, blue, green/yellow, brown, pink, yellow, and magenta exhibited a moderate correlation (absolute correlation 0.3–0.7); and black, salmon, and tan displayed a weak correlation (absolute correlation ≤ 0.3) (Figure 7A). In the normalized expression t-test for each module based on frying quality, the green, purple, red, and turquoise modules displayed significant differences between the two potato types (t-test, p < 0.05) (Table 4). These findings align with the top absolute correlation values observed in the module–trait relationship. The green, purple, and red modules showed higher gene expression in the waxy potato samples, while the turquoise module displayed low expression. The overlap of genes between each module and the 2266 DEGs was the highest in the red module, followed by green, turquoise, and purple (Figure 7).
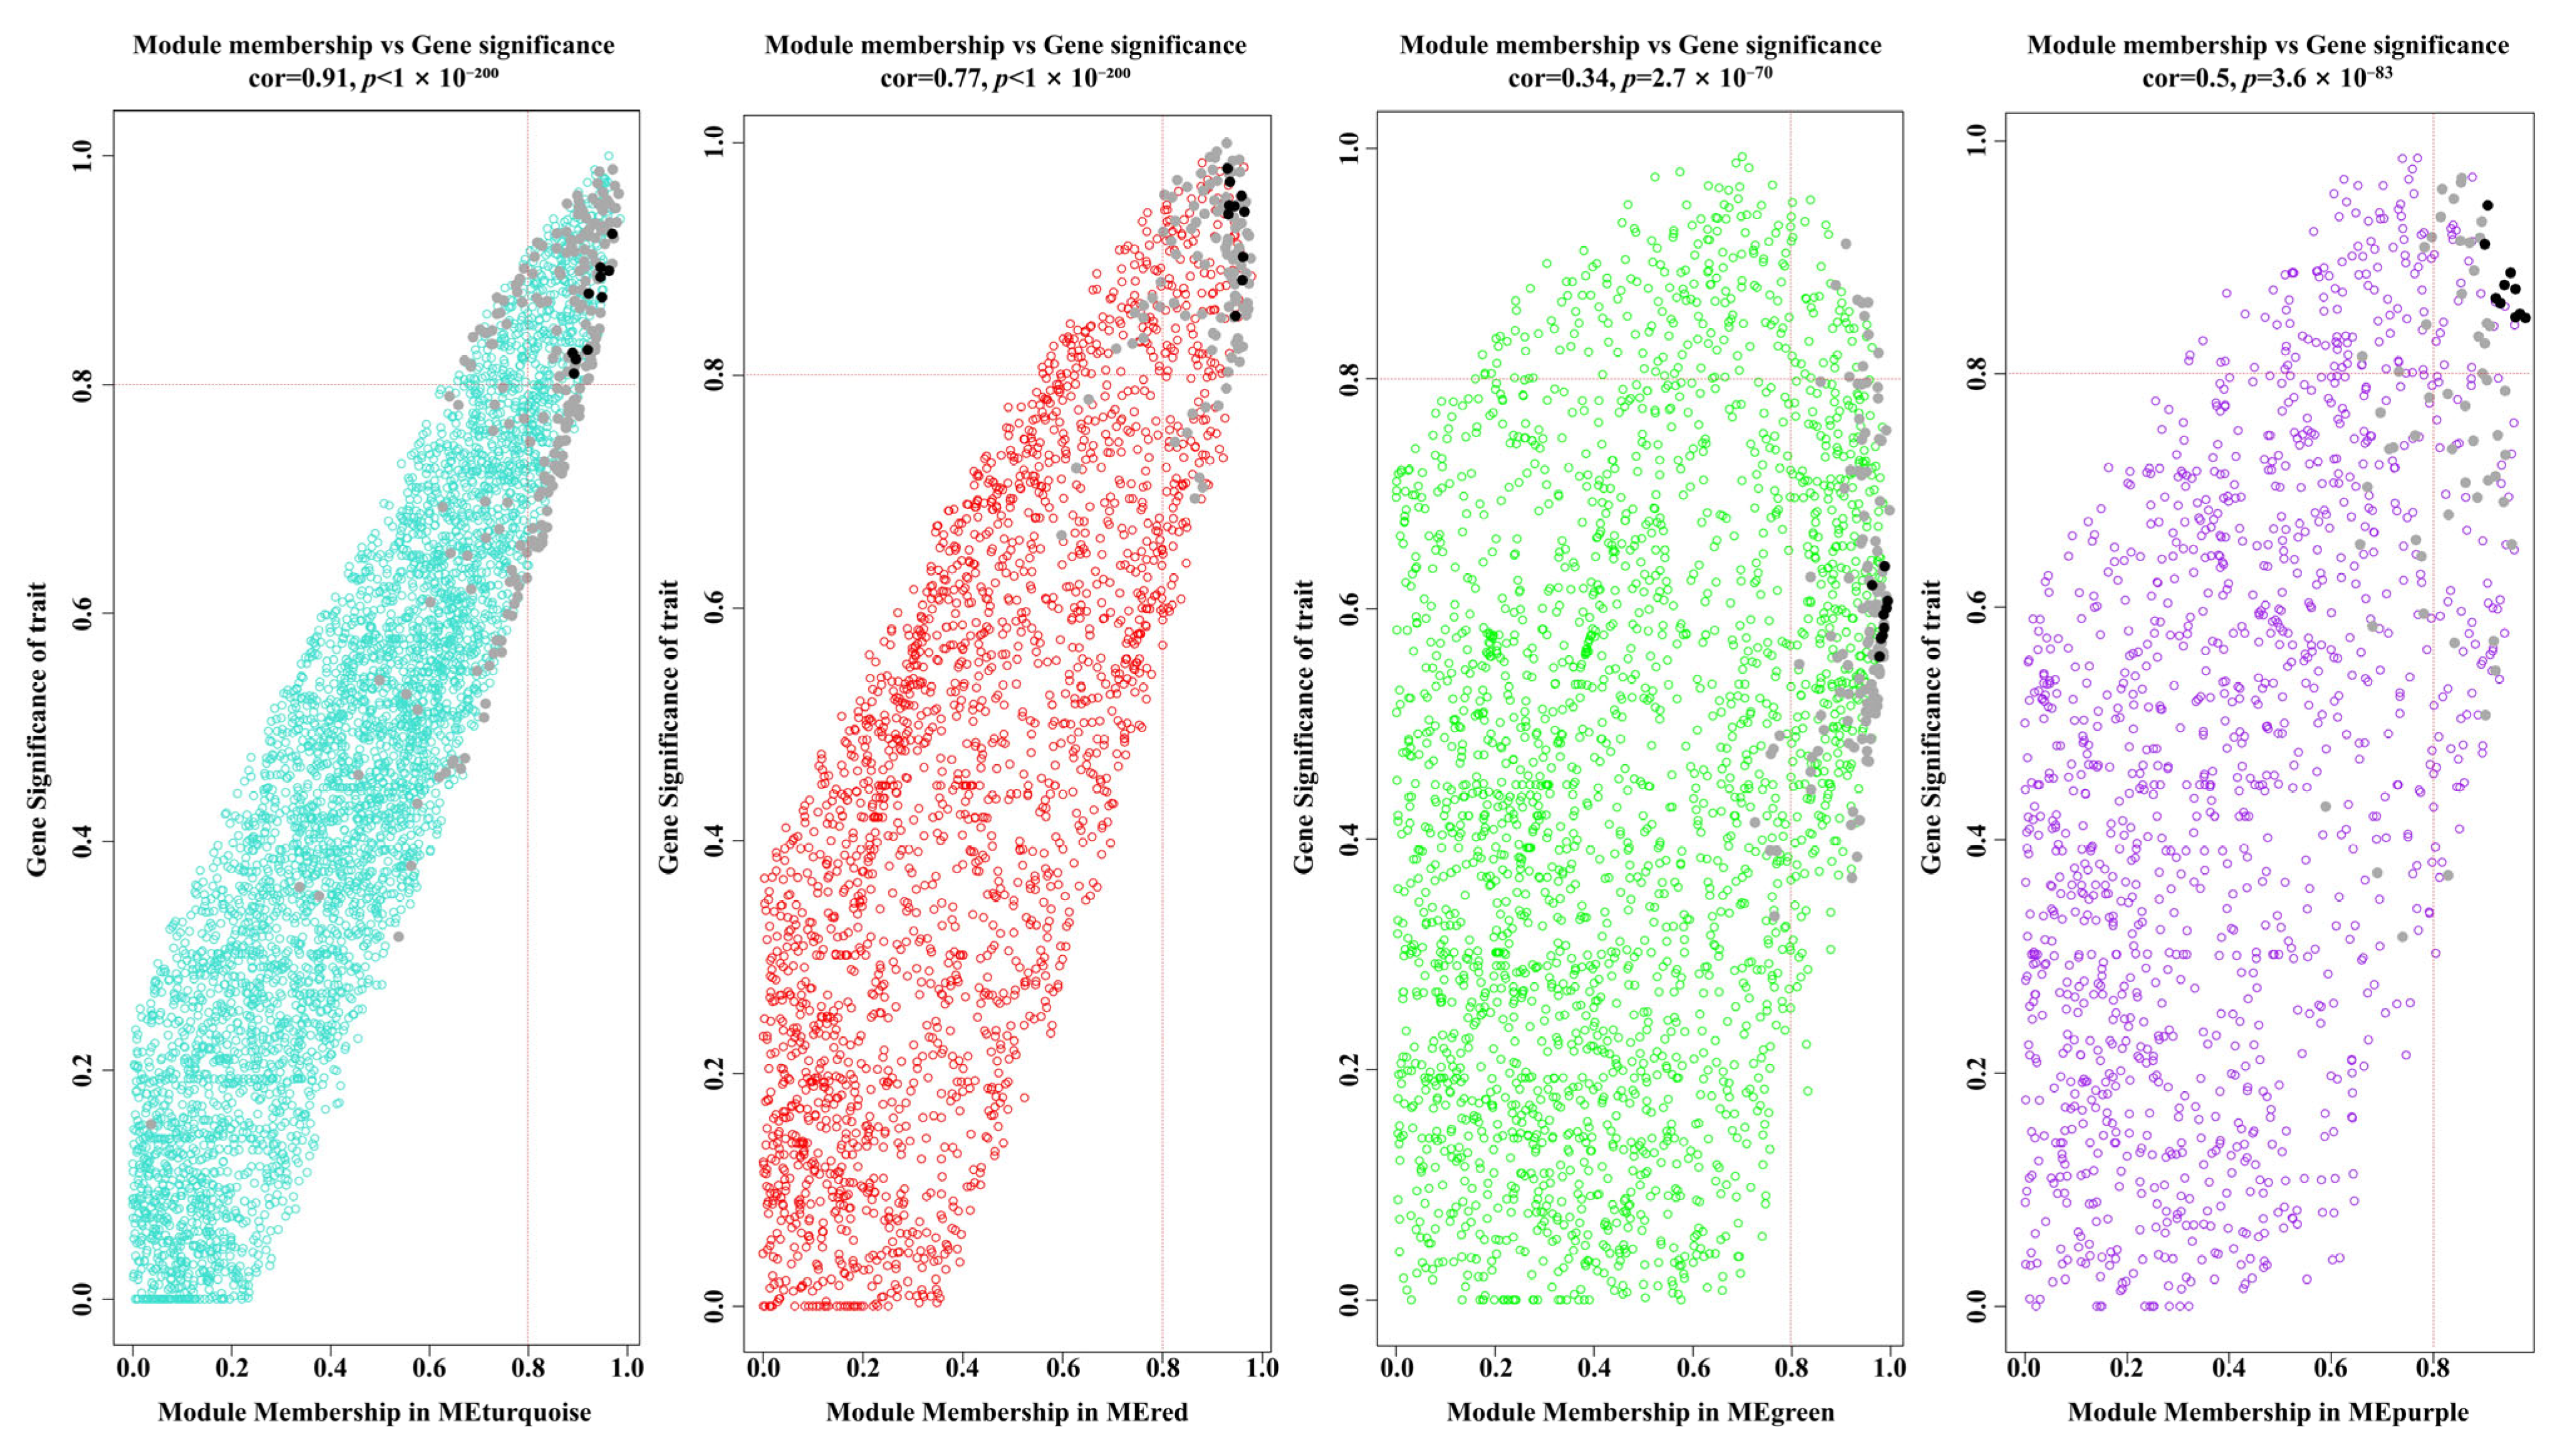
The genes within each module exhibited high kME values, ranging from 0.90 in the turquoise module to 0.93 in the purple module. The GS values were the highest in the red module, followed by turquoise, purple, and green, with values of 0.89, 0.78, and 0.60, respectively. The 10 hub genes selected based on kME values had GS values above 0.8 in the purple, red, and turquoise modules, while the green module exhibited a lower GS value of 0.56–0.64. Similarly, the 10 hub genes chosen based on GS values had high kME values over 0.91 in all modules, except for the green module, where the values ranged from 0.77 to 0.89. The correlation coefficient between GS and the module membership value (MMV) ranged from 0.34 in the green module to 0.91 in the turquoise module, aligning with the module–trait relationship (Figure 8). Among the hub genes selected based on the kME and GS values, only two genes were shared between the kME and GS hub gene sets. Among the 78 hub genes, 60 overlapped with DEGs with a log2FC over 1 and were involved in various metabolic pathways (Table 5). Notably, only one gene (Soltu.DM.12G026350) from the red module, encoding a PMEI, was involved within the genes analyzed in the carbohydrate metabolism pathway.
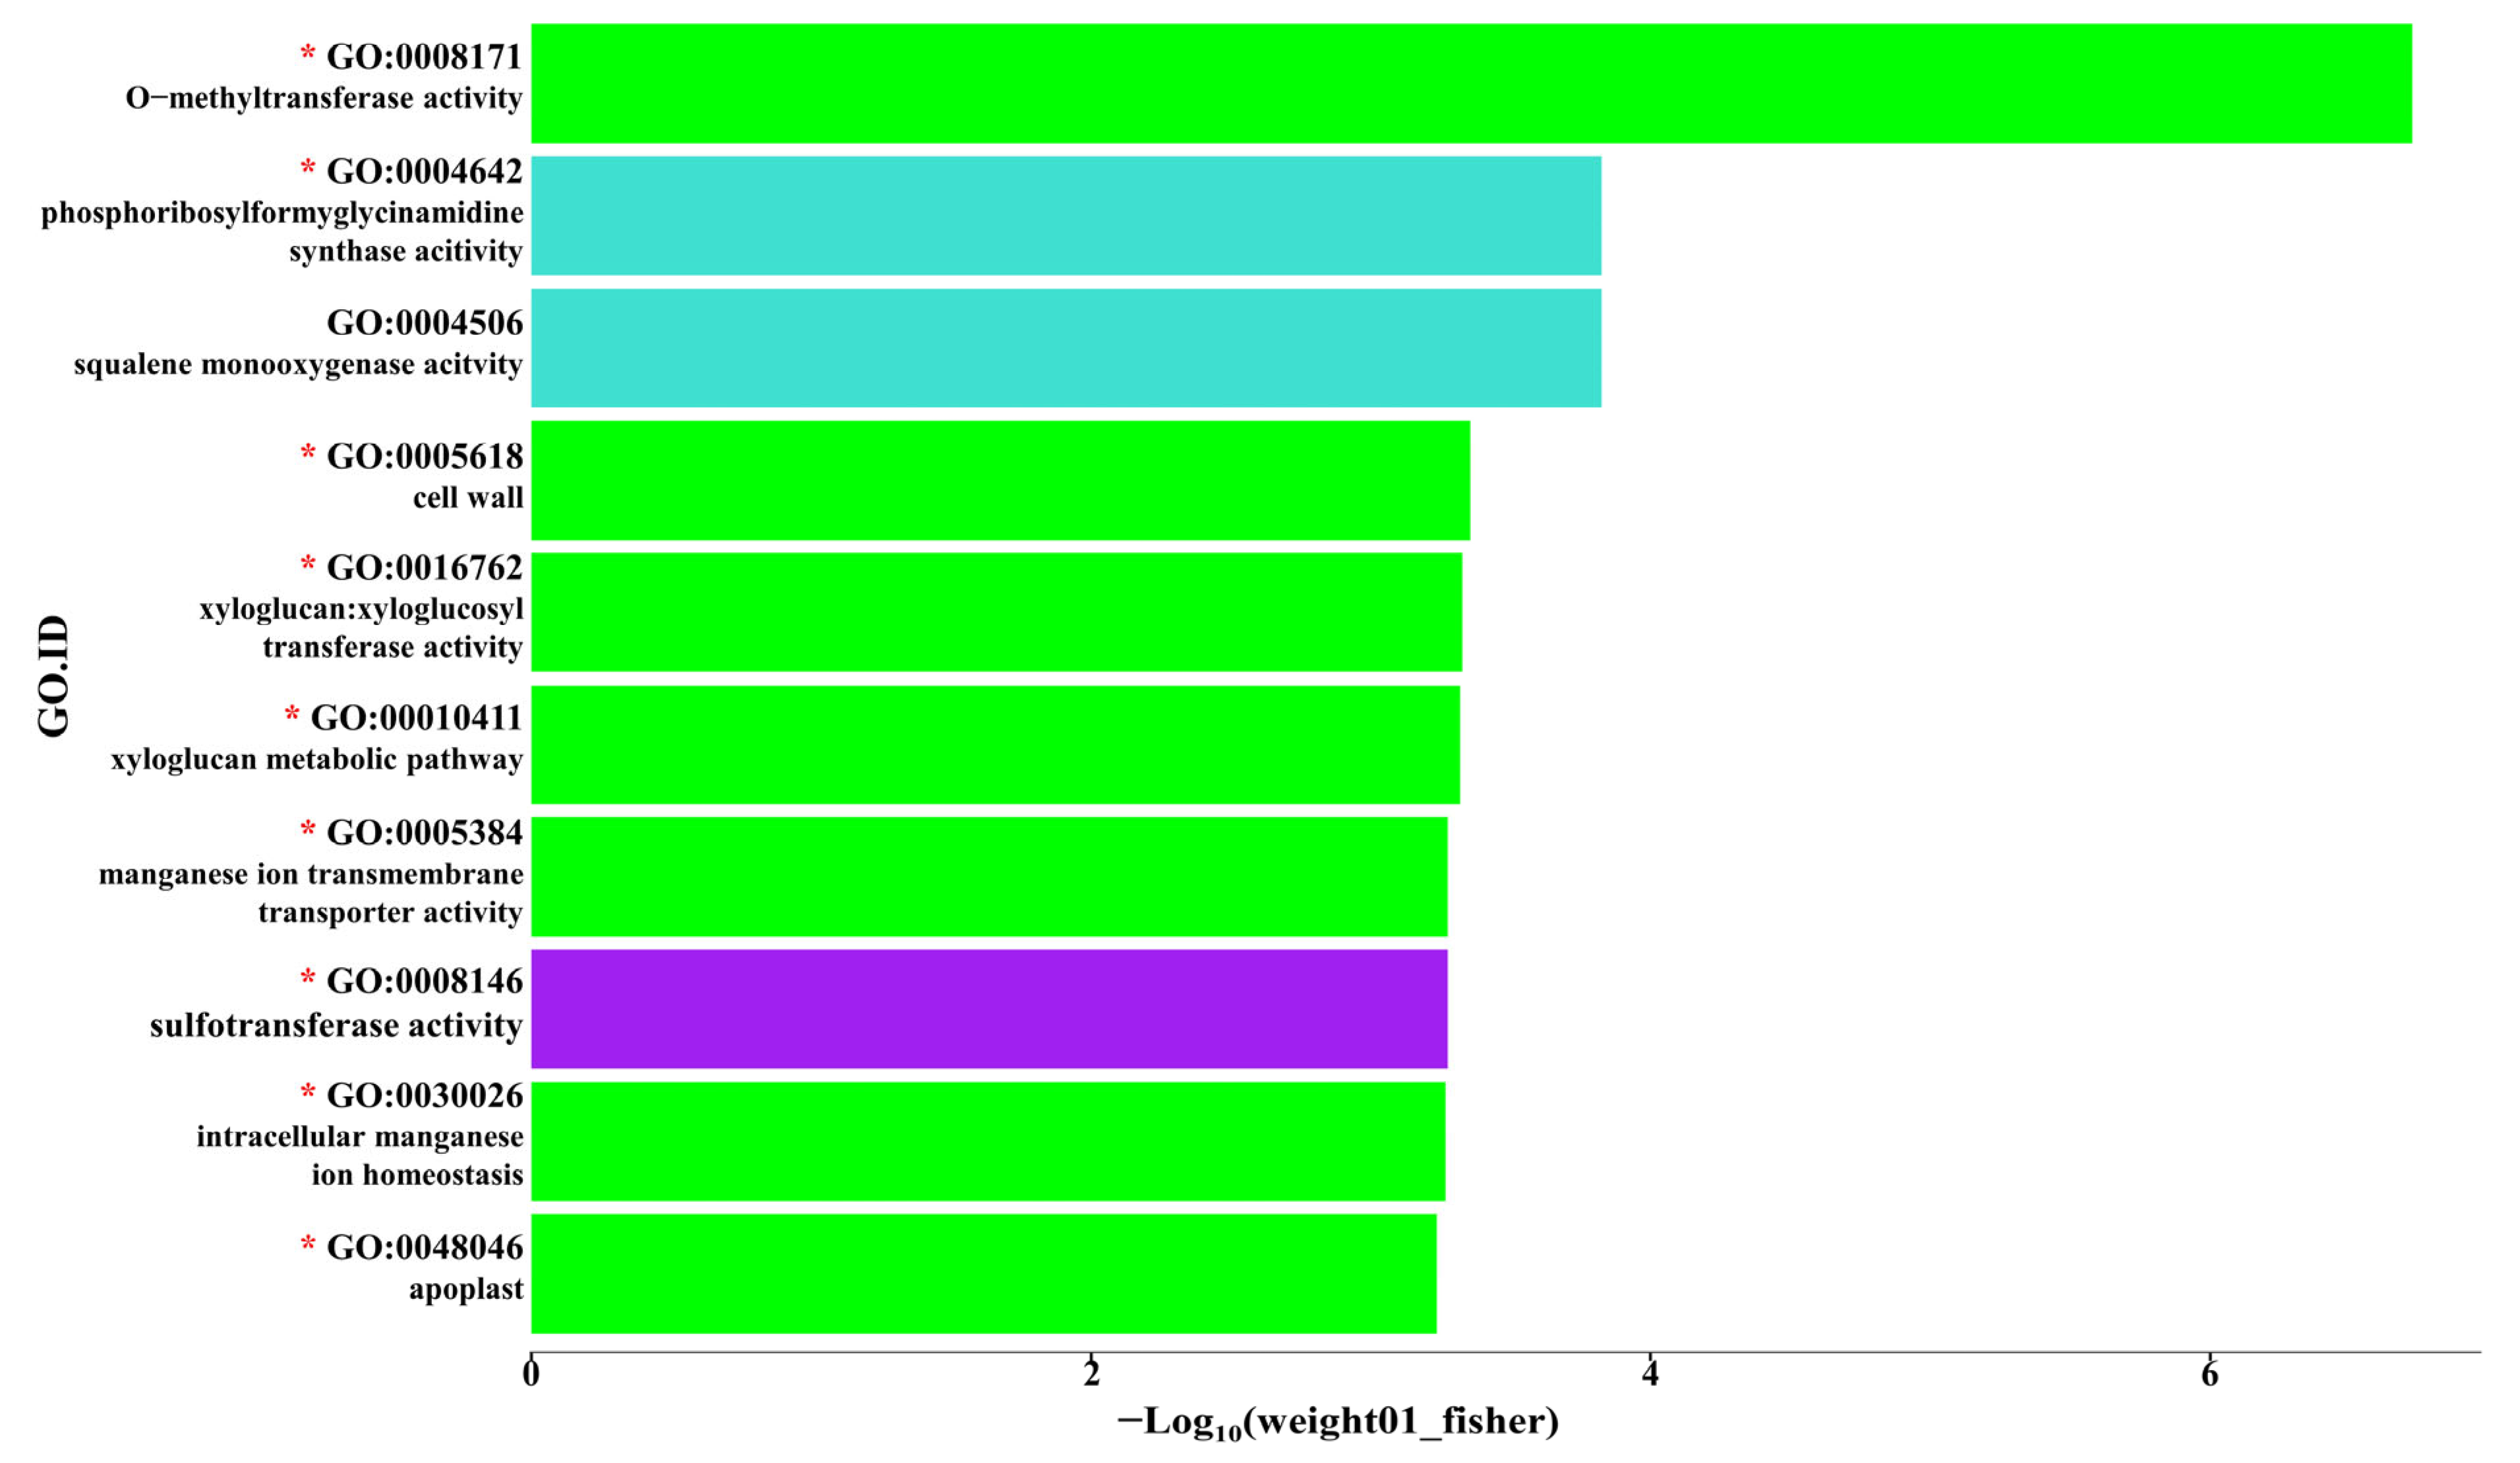
We performed a GO analysis with four significant modules to analyze the function and regulatory mechanisms of coexpressed genes within each module. The results revealed metabolic and biological pathways similar to those identified in the GO analysis of previously analyzed results with DEGs. In the red, purple, and green modules, which displayed higher gene expressions in the waxy potato samples, the GO terms identified were consistent with those found in the waxy potatoes. Additionally, arginine metabolism and pyrimidine synthesis processes were uniquely identified in these modules. Conversely, the turquoise module, which aligned with the upregulated DEGs in the mealy potatoes, exhibited GO terms similar to those observed for the mealy potatoes. In the turquoise module, the newly identified GO terms included branched-chain amino acid metabolism, arginine metabolism, squalene-related processes, S-adenosylmethionine synthesis, glutathione metabolism, and transmembrane transport (Table S5). Among the top 10 GO results, two came from the turquoise module, one came from the purple module, and seven came from the green module. The significant green module GO terms in the top 10 results were O-methyltransferase activity, cell wall, xyloglucan transferase activity, the xyloglucan metabolic pathway, manganese ion transmembrane transporter activity, intracellular manganese ion homeostasis, and the apoplast, some of which are closely associated with cell wall remodeling (Figure 9).
Five transcription factors were identified in the green module, which contained seven significant GO terms among the top 10 GO results from the WGCNA analysis. Among these, the transcription factor Soltu.DM.12G020880 from the M-type MADS-box family was identified as a kME hub gene, displaying a significant association with the coexpression of genes within the green module. In the turquoise module, 12 transcription factors were identified, with Soltu.DM.03G032660 (NF-X1) being the only GS-value-based hub gene. In the purple and red modules, two transcription factors were identified; however, only the Soltu.DM.08G024310 (HD-ZIP) transcription factor in the purple module was recognized as a hub gene based on the GS value (Table 5).

3.7. Transcription Factor Coexpression Analysis

Transcription factor coexpression analysis was conducted to explore the coexpression patterns related to SS1 and SS3 in mealy potatoes with a high starch content. The results identified 35 transcription factors with a correlation coefficient of 0.6 or higher with SS1 and 54 transcription factors with the same threshold for SS3. Among these, 24 transcription factors were common for SS1 and SS3. The transcription factors correlated with SS1 were from the ARF, ARR-B, BBR-BPC, C2H2, C3H, Dof, G2-like, GATA, GRAS, HB-other, HD-ZIP, HSF, LSD, MIKC-MADS, MYB, MYB-related, NAC, TALE, WRKY, bHLH, and bZIP families. For SS3, the correlated transcription factors belonged to the ARF, ARR-B, B3, BBR-BPC, C2H2, Dof, ERF, G2-like, GRAS, HD-ZIP, HSF, MIKC-MADS, MYB, MYB-related, NAC, NF-YB, SBP, TALE, Trihelix, bHLH, and bZIP families (Table S6).

4. Discussion

Overall, the comparative transcriptomic analysis of mealy and waxy potatoes reveals distinct expression patterns in carbohydrate metabolism. These molecular findings align well with the observed differences in frying-related traits, including starch content, glucose levels, texture, and appearance after frying. We interpret how these gene expression patterns may mechanistically contribute to the phenotypic differences between the two potato types and discuss their implications.
The potato tuber is a storage organ where carbohydrates produced during photosynthesis are accumulated as starch, with a typical amylopectin to amylose ratio of approximately 3:1. Based on texture, potatoes are generally classified as either mealy or waxy. This texture distinction is closely associated with starch composition. Mealy potatoes, which are preferred for frying, typically contain lower amylopectin and higher amylose content with a higher overall starch content, whereas waxy potatoes, preferred for general consumption, exhibit the opposite characteristic. The 16 potato samples used in this study—including 4 Group A and 12 Group B samples, comprising 8 mealy- and 8 waxy-type potatoes— exhibited characteristics consistent with their classifications, as well as corresponding gene expression patterns related to carbohydrate metabolism.
In tubers, starch synthesis starts when glucose from leaf photosynthesis (source) is converted to sucrose and transported to the tubers through the phloem. Sucrose enters tuber cells directly through sucrose transporter proteins or is first broken down into glucose and fructose, which are then absorbed by sugar transporters [46]. Amylose is synthesized by adding UDP-glucose units via alpha-1,4-glycosidic bonds, whereas amylopectin is formed by introducing alpha-1,6-glycosidic bonds at specific points along the amylose chain, creating a branched structure [47,48]. In the potato genome, two genes encoding SBE, responsible for amylopectin branching, are annotated in the DM 1–3 R44 516 reference genome, as follows: Soltu.DM.04G037620 (SBE2.1) and Soltu.DM.09G004100 (SBE2.2). In our study, Soltu.DM.04G037620 encoding SBE2.1 was upregulated in waxy potatoes, consistent with the higher amylopectin levels in this potato type (Figure 6A).
In the starch metabolism pathway, sucrose that enters the tuber cells can be broken down into glucose and fructose by two different enzymes. SuSy catalyzes the reversible conversion of sucrose into glucose and fructose, whereas invertase catalyzes an irreversible reaction [46]. The upregulation of SuSy and invertase could promote the conversion of sucrose into reducing sugars, which can participate in the Maillard reaction, leading to the darkening of fried potatoes through the formation of melanoidin pigments. In waxy potatoes, which have higher glucose levels than the mealy type, the gene encoding SuSy4 (Soltu.DM.12G026390), an isoform in the SuSy protein family, was upregulated along with five genes encoding invertases (Soltu.DM.01G018690, Soltu.DM.04G014770, Soltu.DM.06G020260. Soltu.DM.11G006090, and Soltu.DM.11G021450). These genes encoding invertases have previously been associated with fried color and carbon metabolism [25,49]. The upregulation of these genes may have increased the reducing sugar content in the waxy potatoes.
Among starch synthases, the gene Soltu.DM.02G027020, which encodes SS5, was upregulated in waxy potatoes; however, this result did not align with the observed starch levels. The function of SS5 remains poorly understood; however, SS4 in A. thaliana, which is closely related to SS5, regulates starch synthesis indirectly rather than directly, extending glucose units via glucosyltransferase activity [48,50]. This functional difference in glucosyltransferase activity compared with other SSs is presumed to have not significantly impacted the starch content in the two types of potatoes. In contrast, in mealy potatoes, two genes encoding SS1 and SS3, which directly catalyze starch synthesis by extending glucose units, were more highly expressed than in waxy potatoes (Figure 6A), suggesting that these higher expression levels with actual glucosyltransferase activity may contribute to the higher starch content in mealy potatoes.
The WGCNA analysis, using genes accounting for the top 95% of the dataset’s variance, did not reveal any significant coexpression with genes involved in starch metabolism. A more targeted coexpression analysis with genes encoding SSs, using an additional 12 transcriptome datasets from Group B, identified several candidate transcription factors across diverse protein families. Three bZIP transcription factors, which regulate various biological processes, including stress responses, abscisic acid (ABA) signaling, and development, were associated with two genes encoding SS. Among these three bZIP factors, the following two genes were identified as ABA-responsive: Soltu.DM.01G005870 and Soltu.DM.11G016910, which encode StbZIP2 and StbZIP35 (Figure 6B) [51].
Previous studies on maize and rice have highlighted the role of bZIP transcription factors in starch metabolism. One of the maize bZIP factors, ZmbZIP91, upregulates SS1 and SS3 by binding to their promoters, and OsbZIP58 in rice similarly enhances the expression of starch synthesis-related genes [52,53]. In potatoes, ABA signaling, with which bZIP transcription factors are associated, is also closely related to starch metabolism. Under stress conditions, ABA levels are upregulated to promote the breakdown of stored starch into sugars, providing energy to sustain vital biological processes and enhance stress resilience [54]. However, in dormant potato tubers, high ABA levels maintain dormancy and inhibit starch degradation. During tuber development, ABA accumulates, and a high ABA–gibberellin ratio suppresses sprouting and preserves dormancy. As ABA levels decrease, AMY and BAM enzymes are activated, leading to the breakdown of starch into sugars to supply energy for germination during dormancy release [55,56,57]. Additionally, previous studies have suggested that ABA signaling positively influences the development of storage organs, including tubers, roots, and bulbs, along with starch accumulation across various plant species [58,59,60,61]. In dormant grapevine buds, treatment with uniconazole-P, which enhances ABA levels, upregulated SS1 and SS3 and downregulated invertase and sucrose phosphate synthase, mirroring the gene expression patterns observed in mealy potatoes [62]. Based on these results and previous studies, we hypothesize that ABA signaling strengthens the role of the sink organs in the source–sink relationship in mealy potatoes.
In potatoes, ABA signaling is initiated when PYR/PYL/RCAR proteins bind to protein phosphatase 2C (PP2C), inhibiting it and triggering the ABA signaling pathway. Once PP2C is inhibited, the sucrose non-fermenting-1 related protein kinase (SnRK2) is activated, transmitting signals to various target proteins, including transcription factors like AREB and ABF, which further amplify ABA signaling. This cascade ultimately results in the expression or repression of ABA-responsive genes [63,64]. In the DM 1–3 516 R44 reference genome, eight genes encoding SnRK2 were annotated, among which SnRK2.4 was specifically expressed in tubers. The gene Soltu.DM.01G042850 encoding SnRK2.4 was upregulated in mealy potatoes, exhibiting an expression pattern similar to that of StbZIP2 and StbZIP35 observed in this study (Figure 6C) [65]. The gene Soltu.DM.10G017690, which encodes the PP2C enzyme and is situated on chromosome 10 near (~48 Mb,) close to the GWAS peak identified in a previous study, was found to be downregulated in mealy potatoes [27]. Although additional experimental validation such as yeast one-hybrid assay is required, these findings suggest that StbZIP2 and StbZIP35 may act as key regulators of the starch biosynthetic pathways involved in potato carbohydrate metabolism through ABA signaling and explain the differences in frying quality and starch content between the two types.
Enzymes involved in starch degradation were identified in mealy and waxy potatoes, including AMY, BAM, SEX4, alpha-glucan phosphorylase, glucan water dikinase, and limit dextrinase. Amylase proteins, which directly break down starch into sugars, were upregulated in the two types, with AMY2 (Soltu.DM.03G037250) in mealy potatoes and AMY1.1 (Soltu.DM.04G033700) and AMY3 (Soltu.DM.05G006330) in waxy potatoes (Figure 6A). Amylase degrades starch into sugars, resulting in a lower starch content and high reducing sugar concentration. However, previous studies have revealed that significant starch degradation rarely occurs in potato tubers, which are storage organs, even when RNA expressions are present, because amylase activity remains low [66]. Amylase activity in other plants is also associated with ABA levels, suggesting that ABA may act as an amylase inhibitor, suppressing the breakdown of starch in developing organs [56,57].
Our findings suggest that enhanced ABA signaling—evidenced by the upregulation of SnRK2.4—activates the transcription factors StbZIP2 and StbZIP35, which, in turn, promote the expression of SS1 and 3. This leads to an increased conversion of reducing sugars into starch in mealy potatoes, thereby lowering the availability of reducing sugars for the Maillard reaction and resulting in a lighter fired color due to reduced melanoidin pigment formation. In contrast, waxy potatoes exhibit a higher expression of invertase genes with a lower expression of SSs, which likely elevates reducing sugar levels and promotes Maillard browning, producing a darker fried color.
The texture of fried potatoes is another critical factor in assessing frying quality, with key aspects including outer crispiness and inner mealiness. Chips and French fries benefit from a crispy exterior, while an inner mealy texture is especially preferred in French fries [16,18]. A primary factor influencing outer crispiness is the tuber’s low moisture and high starch content, which are inversely related. In mealy potatoes with high dry matter, this combination promotes the formation of a crispy crust during frying. As the moisture inside the tuber evaporates rapidly, the loss of water creates pores and cavities where the water once resided, contributing to a crispy texture. Additionally, the high starch content in mealy potatoes causes cell swelling due to starch gelatinization. During frying, starch absorbs moisture, expands, and gelatinizes, contributing to a mealy texture inside the French fries. The increased expression of SS1 and SS3 through ABA signaling with StbZIP2 and StbZIP35 may contribute to the crispness and mealiness of fried products through an increased starch content.
Cell separation is also influenced by cell wall characteristics. The cell wall comprises the primary cell wall, middle lamella, and secondary cell wall. The primary and secondary cell walls contain cellulose and hemicellulose. The primary cell wall is rich in pectin, which supports cell expansion and adhesion, while the secondary cell wall contains lignin for structural rigidity and typically has little pectin. The middle lamella, primarily composed of pectin, is essential for cell-to-cell adhesion. PME removes methyl groups from pectin, weakening cell adhesion in the middle lamella and leading to cell separation, thus contributing to a mealy texture [17]. In contrast, PMEI, which inhibits PME activity, maintains cell adhesion and prevents cell separation. In this study, several genes encoding PME and PMEI displayed a higher expression in waxy potatoes than in mealy potatoes (Figure 6D). The higher expression of genes encoding PMEI in waxy potatoes may suppress PME activity, resulting in lower cell separation and a waxy texture compared to mealy potatoes, which exhibit higher cell separation and a mealy texture. A previous study using GWAS and selective sweep analysis based on market chip-processing traits identified selection signatures in five PMEI-encoding genes (Soltu.DM.01G031690, Soltu.DM.01G031700, Soltu.DM.01G031740, Soltu.DM.10G019840, and Soltu.DM.10G019850) [27]. Based on previous selection signatures and the expression patterns observed in this study, the pronounced cell separation characteristics in mealy potatoes may be driven by increased PME activity resulting from reduced inhibition by PMEI.
Cell wall strength is another key factor in determining the mealiness of potatoes, as it hinders cell separation. A solid cell wall prevents cell swelling caused by starch gelatinization during frying [67]. Several genes and GO terms identified from DEGs and WGCNA results indicate pathways related to cell wall reconstruction and biological processes in waxy potatoes, including terms associated with cell wall biogenesis (GO:0042546), cell wall modification (GO:0016762), pectinesterase activity (GO:0030599), and xyloglucan:xlyglucosyl transferase activity (GO:0016762). GO analysis from the WGCNA green module also revealed terms for xyloglucan metabolism (GO:0010411) and cell wall (GO:0005618). Additionally, the carbohydrate metabolic gene analysis identified several genes associated with cell wall components, contributing to cell wall reconstruction through degradation and synthesis processes. Genes encoding galacturonosyltransferase (Soltu.DM.04G010300) and xyloglucan endotransglucosylase/hydrolase (Soltu.DM.02G027190) exhibited selection signatures in the selective sweep analysis and were differentially expressed in previous studies [27]. Furthermore, in mealy potatoes, the GO term Rab GDP-dissociation inhibitor (Rab GDI) activity was enriched, indicating vesicle transport inhibition [68]. Rab GDI keeps Rab proteins in their GDP-bound inactive state. Because Rab proteins are essential for vesicle transport by directing vesicles to specific cellular locations, the relatively lower expression of Rab GDI activity in waxy potatoes may enhance intracellular molecular transport [69]. Among the cell wall components, pectin and hemicellulose are synthesized in the Golgi apparatus and transported to the cell wall via vesicles. Increased vesicle-mediated transport of pectin and hemicellulose, along with cell wall reconstruction, may contribute to the stronger cell walls in waxy potatoes. While the complete mechanisms of cell wall reconstruction and its effect on strength remain poorly understood, the relatively lower expression of these genes in mealy potatoes may lead to weaker cell walls, resulting in a mealy texture that facilitates starch gelatinization and contributes to the interior mealiness of French fries.
Among the GO terms enriched in the WGCNA analysis, the green module contained many terms related to the cell wall. Within the green module, the gene Soltu.DM.12G020880, which encodes the M-type MADS-box family transcription factor, was identified as a kME hub gene with a high correlation to other genes in the module (Table 5). Therefore, this transcription factor may be involved in regulating cell wall reconstruction and could be a potential master regulator influencing the mealy texture of fried potatoes. Further research is needed to investigate this gene as a key target for traits related to fried potato texture.
Genes involved in glycolysis and the TCA cycle are typically upregulated when cells have high energy demands. In waxy potatoes, genes related to cell wall reconstruction and transmembrane transport were more highly expressed (Figure 5; Table S7). Transmembrane transport can occur through diffusion, which does not consume ATP, or through active transport, which requires ATP. GO analysis in waxy potatoes revealed increased transmembrane transport activity for several molecules, including ammonium, inorganic phosphate, manganese ions, molybdate ions, nucleotides, oligopeptides, sulfate, phosphate ions, and other antiporter activities. Some are associated with active transport, potentially linking them to enzyme activity in the carbohydrate metabolic pathways and resulting in higher energy demands (Figure 4A). These findings suggest that increased transmembrane transport, along with the cell wall reconstruction in waxy potatoes, may heighten the need for ATP production via the TCA cycle and glycolysis.
This study provides foundational transcriptomic insights into the differences between waxy and mealy potato types, particularly regarding their suitability for frying. However, there were only four Group A samples with genetically distinct backgrounds, and the limited biological replication for Group B potatoes may have influenced the identification of DEGs and the GO enrichment results. As a result, differences were observed in GO terms and genes unrelated to starch metabolism, despite starch composition being a major distinguishing factor between the two potato types. Nonetheless, direct read mapping to 726 genes involved in carbohydrate metabolism revealed differential expression in genes related to starch biosynthesis, ABA signaling, and cell wall remodeling, suggesting their potential roles in phenotypic differentiation. These findings help to explain how mealy potatoes intended for frying exhibit a higher starch content and lower glucose levels compared to waxy potatoes, likely due to differences in starch synthesis within carbohydrate metabolism pathways. These molecular traits align with the superior frying characteristics observed in mealy potatoes, such as a lighter appearance and improved texture. We expect that further studies incorporating a broader diversity of potato samples and integrating approaches such as GWAS, multi-omics analyses, and the function validation of additional candidate genes for individual quality traits within the complex network of frying quality will help to clarify the physiological roles and mechanisms underlying frying performance and support future breeding programs.

5. Conclusions

A transcriptome analysis of four potato samples, comprising two mealy and waxy potato cultivars, was conducted to identify the gene expression patterns associated with frying quality traits. Several genes in the carbohydrate metabolism pathways were upregulated in waxy potatoes compared to the mealy type. The functions related to the frying quality of the identified genes were investigated in starch metabolism, ABA signaling, cell wall reconstruction, pectin metabolism, and energy utilization. Starch metabolism is likely regulated by ABA signaling, and the high reducing sugar content in waxy potatoes is regulated by the degradation activity of SuSy4 and invertases. Downregulated genes involved in cell wall reconstruction in mealy potatoes may enable starch gelatinization with a mealy texture. Although this study is limited by its small sample size, the identified genes provide a valuable foundation for future breeding projects with high-frying-quality potatoes.

Supplementary Materials

The following supporting information can be downloaded at: https://www.mdpi.com/article/10.3390/agronomy15061430/s1, Table S1: List of 726 genes involved in carbohydrate metabolism pathways analyzed in this study; Table S2: Transcriptome data of 12 samples from B group; Table S3: Expression patterns of 427 genes involved in carbohydrate metabolism pathways; Table S4: GO terms enriched in mealy and waxy potatoes; Table S5: GO terms enriched in four significant modules identified through WGCNA analysis; Table S6: List of transcription factors co-expressed with starch synthase 1 and 3; Table S7: List of upregulated 89 genes associated with molecular transport.

Author Contributions

J.-J.C. carried out bioinformatics analysis and wrote the manuscript. D.-H.K. designed the experiments. J.-G.C. and Y.-E.P. managed the Korean potato germplasm and prepared the samples. J.-Y.Y., G.-B.L., H.-T.L. and H.-S.W. performed experiments for assessing frying quality and preparing RNA sequencing. K.-S.C., Y.-I.J. and D.-C.C. approved the final version of the manuscript. All authors have read and agreed to the published version of the manuscript.

Funding

Research described in this paper was funded by the Rural Development Administration (RDA), Republic of Korea, through Crop Science Research Program of NICS (Project No. PJ01739003). This study was supported by 2025 the RDA Fellowship Program of NICS, Rural Development Administration, Republic of Korea.

Data Availability Statement

The original contributions presented in this study are included in the article/Supplementary Materials. Further inquiries can be directed to the corresponding author.

Conflicts of Interest

The authors declare no conflicts of interest.

References

  1. Lutaladio, N.; Castaldi, L. Potato: The hidden treasure. J. Food Compos. Anal. 2009, 22, 491–493. [Google Scholar] [CrossRef]
  2. Hijmans, R.J. Global distribution of the potato crop. Am. J. Potato Res. 2001, 78, 403–412. [Google Scholar] [CrossRef]
  3. Haverkort, A.; Struik, P. Yield levels of potato crops: Recent achievements and future prospects. Field Crops Res. 2015, 182, 76–85. [Google Scholar] [CrossRef]
  4. Zierer, W.; Rüscher, D.; Sonnewald, U.; Sonnewald, S. Tuber and tuberous root development. Annu. Rev. Plant Biol. 2021, 72, 551–580. [Google Scholar] [CrossRef]
  5. Fernie, A.R.; Willmitzer, L. Molecular and biochemical triggers of potato tuber development. Plant Physiol. 2001, 127, 1459–1465. [Google Scholar] [CrossRef]
  6. Stark, J.C.; Love, S.L.; Knowles, N.R. Tuber quality. In Potato Production Systems; Springer: Berlin/Heidelberg, Germany, 2020; pp. 479–497. [Google Scholar]
  7. Mccomber, D.R.; Osman, E.M.; Lohnes, R.A. Factors related to potato mealiness. J. Food Sci. 1988, 53, 1423–1425. [Google Scholar] [CrossRef]
  8. Pavlista, A.D. Potato types: Their characteristics & uses. Am. Biol. Teach. 1997, 59, 26–29. [Google Scholar]
  9. Jaggan, M.; Mu, T.; Sun, H. The effect of potato (Solanum tuberosum L.) cultivars on the sensory, nutritional, functional, and safety properties of French fries. J. Food Process. Preserv. 2020, 44, e14912. [Google Scholar] [CrossRef]
  10. Lusas, E.W.; Rooney, L.W. Snack Foods Processing; CRC Press: Boca Raton, FL, USA, 2001. [Google Scholar]
  11. Kirkman, M.A. Global markets for processed potato products. In Potato Biology and Biotechnology; Elsevier: Amsterdam, The Netherlands, 2007; pp. 27–44. [Google Scholar]
  12. Islam, M.M.; Naznin, S.; Naznin, A.; Uddin, M.N.; Amin, M.N.; Rahman, M.M.; Tipu, M.M.H.; Alsuhaibani, A.M.; Gaber, A.; Ahmed, S. Dry matter, starch content, reducing sugar, color and crispiness are key parameters of potatoes required for chip processing. Horticulturae 2022, 8, 362. [Google Scholar] [CrossRef]
  13. Bradshaw, J.E. Potato-breeding strategy. In Potato Biology and Biotechnology; Elsevier: Amsterdam, The Netherlands, 2007; pp. 157–177. [Google Scholar]
  14. Slater, A.T.; Cogan, N.O.; Hayes, B.J.; Schultz, L.; Dale, M.F.B.; Bryan, G.J.; Forster, J.W. Improving breeding efficiency in potato using molecular and quantitative genetics. Theor. Appl. Genet. 2014, 127, 2279–2292. [Google Scholar] [CrossRef]
  15. Ruiz de Arcaute, R.; Carrasco, A.; Ortega, F.; Rodriguez-Quijano, M.; Carrillo, J.M. Evaluation of Genetic Resources in a Potato Breeding Program for Chip Quality. Agronomy 2022, 12, 1142. [Google Scholar] [CrossRef]
  16. Jaswal, A. Non-starch polysaccharides and the texture of French fried potato. Am. Potato J. 1970, 47, 311–316. [Google Scholar] [CrossRef]
  17. Ross, H.A.; Wright, K.M.; McDougall, G.J.; Roberts, A.G.; Chapman, S.N.; Morris, W.L.; Hancock, R.D.; Stewart, D.; Tucker, G.A.; James, E.K. Potato tuber pectin structure is influenced by pectin methyl esterase activity and impacts on cooked potato texture. J. Exp. Bot. 2011, 62, 371–381. [Google Scholar] [CrossRef] [PubMed]
  18. van der Sman, R.; Schenk, E. Causal factors concerning the texture of French fries manufactured at industrial scale. Curr. Res. Food Sci. 2024, 8, 100706. [Google Scholar] [CrossRef]
  19. Tajner-Czopek, A.; Figiel, A. Effect of the content of potato non-starch polysaccharides (NSP) and lignin on the mechanical properties of French fries. Pol. J. Food Nutr. Sci. 2003, 53, 136–140. [Google Scholar]
  20. Pandey, S.; Singh, S.; Marwaha, R.; Pattanayak, D. Indian potato processing varieties: Their impact and future priorities. Potato J. 2009, 36, 95–114. [Google Scholar]
  21. Burton, W. The sugar balance in some British potato varieties during storage. II. The effects of tuber age, previous storage temperature, and intermittent refrigeration upon low-temperature sweetening. Potato Res. 1969, 12, 81–95. [Google Scholar] [CrossRef]
  22. Roe, M.A.; Faulks, R.M.; Belsten, J.L. Role of reducing sugars and amino acids in fry colour of chips from potatoes grown under different nitrogen regimes. J. Sci. Food Agric. 1990, 52, 207–214. [Google Scholar] [CrossRef]
  23. Li, L.; Paulo, M.-J.; Strahwald, J.; Lübeck, J.; Hofferbert, H.-R.; Tacke, E.; Junghans, H.; Wunder, J.; Draffehn, A.; van Eeuwijk, F. Natural DNA variation at candidate loci is associated with potato chip color, tuber starch content, yield and starch yield. Theor. Appl. Genet. 2008, 116, 1167–1181. [Google Scholar] [CrossRef]
  24. Pandey, J.; Scheuring, D.C.; Koym, J.W.; Endelman, J.B.; Vales, M.I. Genomic selection and genome-wide association studies in tetraploid chipping potatoes. Plant Genome 2023, 16, e20297. [Google Scholar] [CrossRef]
  25. Rak, K.; Bethke, P.C.; Palta, J.P. QTL mapping of potato chip color and tuber traits within an autotetraploid family. Mol. Breed. 2017, 37, 15. [Google Scholar] [CrossRef]
  26. Byrne, S.; Meade, F.; Mesiti, F.; Griffin, D.; Kennedy, C.; Milbourne, D. Genome-wide association and genomic prediction for fry color in potato. Agronomy 2020, 10, 90. [Google Scholar] [CrossRef]
  27. Jo, K.R.; Choi, J.-G.; Kwon, D.-H.; Park, Y.-E.; Kim, S.-J. Revealing genetic variations associated with chip-processing properties in potato (Solanum tuberosum L.). Agronomy 2023, 13, 642. [Google Scholar] [CrossRef]
  28. Scheller, H.V.; Ulvskov, P. Hemicelluloses. Annu. Rev. Plant Biol. 2010, 61, 263–289. [Google Scholar] [CrossRef]
  29. Pauly, M.; Gille, S.; Liu, L.; Mansoori, N.; de Souza, A.; Schultink, A.; Xiong, G. Hemicellulose biosynthesis. Planta 2013, 238, 627–642. [Google Scholar] [CrossRef]
  30. Mohnen, D. Pectin structure and biosynthesis. Curr. Opin. Plant Biol. 2008, 11, 266–277. [Google Scholar] [CrossRef]
  31. Heinze, T. Cellulose: Structure and properties. In Cellulose Chemistry and Properties: Fibers, Nanocelluloses and Advanced Materials; Springer: Berlin/Heidelberg, Germany, 2016; pp. 1–52. [Google Scholar]
  32. Pham, G.M.; Hamilton, J.P.; Wood, J.C.; Burke, J.T.; Zhao, H.; Vaillancourt, B.; Ou, S.; Jiang, J.; Buell, C.R. Construction of a chromosome-scale long-read reference genome assembly for potato. Gigascience 2020, 9, giaa100. [Google Scholar] [CrossRef]
  33. Schönhals, E.; Ortega, F.; Barandalla, L.; Aragones, A.; Ruiz de Galarreta, J.; Liao, J.-C.; Sanetomo, R.; Walkemeier, B.; Tacke, E.; Ritter, E. Identification and reproducibility of diagnostic DNA markers for tuber starch and yield optimization in a novel association mapping population of potato (Solanum tuberosum L.). Theor. Appl. Genet. 2016, 129, 767–785. [Google Scholar] [CrossRef]
  34. Gebhardt, C.; Urbany, C.; Stich, B. Dissection of potato complex traits by linkage and association genetics as basis for developing molecular diagnostics in breeding programs. In Genomics of Plant Genetic Resources: Crop productivity, food security and nutritional quality; Springer: Dordrecht, The Netherlands, 2014; Volume 2, pp. 47–85. [Google Scholar]
  35. Neilson, J.; Lagüe, M.; Thomson, S.; Aurousseau, F.; Murphy, A.; Bizimungu, B.; Deveaux, V.; Bègue, Y.; Jacobs, J.; Tai, H. Gene expression profiles predictive of cold-induced sweetening in potato. Funct. Integr. Genom. 2017, 17, 459–476. [Google Scholar] [CrossRef]
  36. Bolger, A.M.; Lohse, M.; Usadel, B. Trimmomatic: A flexible trimmer for Illumina sequence data. Bioinformatics 2014, 30, 2114–2120. [Google Scholar] [CrossRef]
  37. Anders, S.; Pyl, P.T.; Huber, W. HTSeq—A Python framework to work with high-throughput sequencing data. bioinformatics 2015, 31, 166–169. [Google Scholar] [CrossRef] [PubMed]
  38. Kim, D.; Paggi, J.M.; Park, C.; Bennett, C.; Salzberg, S.L. Graph-based genome alignment and genotyping with HISAT2 and HISAT-genotype. Nat. Biotechnol. 2019, 37, 907–915. [Google Scholar] [CrossRef] [PubMed]
  39. Li, H.; Handsaker, B.; Wysoker, A.; Fennell, T.; Ruan, J.; Homer, N.; Marth, G.; Abecasis, G.; Durbin, R.; Subgroup, G.P.D.P. The sequence alignment/map format and SAMtools. Bioinformatics 2009, 25, 2078–2079. [Google Scholar] [CrossRef]
  40. Love, M.I.; Huber, W.; Anders, S. Moderated estimation of fold change and dispersion for RNA-seq data with DESeq2. Genome Biol. 2014, 15, 550. [Google Scholar] [CrossRef]
  41. Su, S.; Law, C.W.; Ah-Cann, C.; Asselin-Labat, M.-L.; Blewitt, M.E.; Ritchie, M.E. Glimma: Interactive graphics for gene expression analysis. Bioinformatics 2017, 33, 2050–2052. [Google Scholar] [CrossRef]
  42. Alexa, A.; Rahnenführer, J. Gene set enrichment analysis with topGO. Bioconduct. Improv 2009, 27, 776. [Google Scholar]
  43. Li, H.; Brouwer, M.; Pup, E.D.; van Lieshout, N.; Finkers, R.; Bachem, C.W.; Visser, R.G. Allelic variation in the autotetraploid potato: Genes involved in starch and steroidal glycoalkaloid metabolism as a case study. BMC Genom. 2024, 25, 274. [Google Scholar] [CrossRef]
  44. Langfelder, P.; Horvath, S. WGCNA: An R package for weighted correlation network analysis. BMC Bioinform. 2008, 9, 559. [Google Scholar] [CrossRef]
  45. Altschul, S.F.; Gish, W.; Miller, W.; Myers, E.W.; Lipman, D.J. Basic local alignment search tool. J. Mol. Biol. 1990, 215, 403–410. [Google Scholar] [CrossRef]
  46. Stein, O.; Granot, D. An overview of sucrose synthases in plants. Front. Plant Sci. 2019, 10, 95. [Google Scholar] [CrossRef]
  47. Wang, L.; White, P. Structure and properties of amylose, amylopectin. Cereal Chem 1994, 71, 263–268. [Google Scholar]
  48. Nazarian-Firouzabadi, F.; Visser, R.G. Potato starch synthases: Functions and relationships. Biochem. Biophys. Rep. 2017, 10, 7–16. [Google Scholar] [CrossRef] [PubMed]
  49. Abbas, A.; Shah, A.N.; Shah, A.A.; Nadeem, M.A.; Alsaleh, A.; Javed, T.; Alotaibi, S.S.; Abdelsalam, N.R. Genome-wide analysis of invertase gene family, and expression profiling under abiotic stress conditions in potato. Biology 2022, 11, 539. [Google Scholar] [CrossRef] [PubMed]
  50. Roldán, I.; Wattebled, F.; Mercedes Lucas, M.; Delvallé, D.; Planchot, V.; Jiménez, S.; Pérez, R.; Ball, S.; d’Hulst, C.; Mérida, Á. The phenotype of soluble starch synthase IV defective mutants of Arabidopsis thaliana suggests a novel function of elongation enzymes in the control of starch granule formation. Plant J. 2007, 49, 492–504. [Google Scholar] [CrossRef]
  51. Herath, V.; Verchot, J. Insight into the bZIP gene family in Solanum tuberosum: Genome and transcriptome analysis to understand the roles of gene diversification in spatiotemporal gene expression and function. Int. J. Mol. Sci. 2020, 22, 253. [Google Scholar] [CrossRef]
  52. Chen, J.; Yi, Q.; Cao, Y.; Wei, B.; Zheng, L.; Xiao, Q.; Xie, Y.; Gu, Y.; Li, Y.; Huang, H. ZmbZIP91 regulates expression of starch synthesis-related genes by binding to ACTCAT elements in their promoters. J. Exp. Bot. 2016, 67, 1327–1338. [Google Scholar] [CrossRef]
  53. Wang, J.-C.; Xu, H.; Zhu, Y.; Liu, Q.-Q.; Cai, X.-L. OsbZIP58, a basic leucine zipper transcription factor, regulates starch biosynthesis in rice endosperm. J. Exp. Bot. 2013, 64, 3453–3466. [Google Scholar] [CrossRef]
  54. Xu, X.; van Lammeren, A.A.; Vermeer, E.; Vreugdenhil, D. The role of gibberellin, abscisic acid, and sucrose in the regulation of potato tuber formation in vitro. Plant Physiol. 1998, 117, 575–584. [Google Scholar] [CrossRef]
  55. Di, X.; Wang, Q.; Zhang, F.; Feng, H.; Wang, X.; Cai, C. Advances in the Modulation of Potato Tuber Dormancy and Sprouting. Int. J. Mol. Sci. 2024, 25, 5078. [Google Scholar] [CrossRef]
  56. Wei, K.; Jin, X.; Chen, X.; Wu, F.; Zhou, W.; Qiu, B.; Qiu, L.; Wang, X.; Li, C.; Zhang, G. The effect of H2O2 and abscisic acid (ABA) interaction on β-amylase activity under osmotic stress during grain development in barley. Plant Physiol. Biochem. 2009, 47, 778–784. [Google Scholar] [CrossRef]
  57. Zhang, Q.; Pritchard, J.; Mieog, J.; Byrne, K.; Colgrave, M.L.; Wang, J.R.; Ral, J.P.F. Overexpression of a wheat α-amylase type 2 impact on starch metabolism and abscisic acid sensitivity during grain germination. Plant J. 2021, 108, 378–393. [Google Scholar] [CrossRef] [PubMed]
  58. Chen, P.; Yang, R.; Bartels, D.; Dong, T.; Duan, H. Roles of abscisic acid and gibberellins in stem/root tuber development. Int. J. Mol. Sci. 2022, 23, 4955. [Google Scholar] [CrossRef] [PubMed]
  59. Sun, P.; Xiao, X.; Duan, L.; Guo, Y.; Qi, J.; Liao, D.; Zhao, C.; Liu, Y.; Zhou, L.; Li, X. Dynamic transcriptional profiling provides insights into tuberous root development in Rehmannia glutinosa. Front. Plant Sci. 2015, 6, 396. [Google Scholar] [CrossRef] [PubMed]
  60. Wang, G.-L.; Jia, X.-L.; Xu, Z.-S.; Wang, F.; Xiong, A.-S. Sequencing, assembly, annotation, and gene expression: Novel insights into the hormonal control of carrot root development revealed by a high-throughput transcriptome. Mol. Genet. Genom. 2015, 290, 1379–1391. [Google Scholar] [CrossRef]
  61. Wu, Z.-G.; Jiang, W.; Tao, Z.-M.; Pan, X.-J.; Yu, W.-H.; Huang, H.-L. Morphological and stage-specific transcriptome analyses reveal distinct regulatory programs underlying yam (Dioscorea alata L.) bulbil growth. J. Exp. Bot. 2020, 71, 1899–1914. [Google Scholar] [CrossRef]
  62. Rubio, S.; Noriega, X.; Pérez, F.J. ABA promotes starch synthesis and storage metabolism in dormant grapevine buds. J. Plant Physiol. 2019, 234, 1–8. [Google Scholar] [CrossRef]
  63. Hirayama, T.; Umezawa, T. The PP2C–SnRK2 complex: The central regulator of an abscisic acid signaling pathway. Plant Signal. Behav. 2010, 5, 160–163. [Google Scholar] [CrossRef]
  64. Lin, Z.; Li, Y.; Wang, Y.; Liu, X.; Ma, L.; Zhang, Z.; Mu, C.; Zhang, Y.; Peng, L.; Xie, S. Initiation and amplification of SnRK2 activation in abscisic acid signaling. Nat. Commun. 2021, 12, 2456. [Google Scholar] [CrossRef]
  65. Bai, J.; Mao, J.; Yang, H.; Khan, A.; Fan, A.; Liu, S.; Zhang, J.; Wang, D.; Gao, H.; Zhang, J. Sucrose non-ferment 1 related protein kinase 2 (SnRK 2) genes could mediate the stress responses in potato (Solanum tuberosum L.). BMC Genet. 2017, 18, 41. [Google Scholar] [CrossRef]
  66. Zhang, H.; Hou, J.; Liu, J.; Xie, C.; Song, B. Amylase analysis in potato starch degradation during cold storage and sprouting. Potato Res. 2014, 57, 47–58. [Google Scholar] [CrossRef]
  67. McComber, D.R.; Horner, H.T.; Chamberlin, M.A.; Cox, D.F. Potato cultivar differences associated with mealiness. J. Agric. Food Chem. 1994, 42, 2433–2439. [Google Scholar] [CrossRef]
  68. Schalk, I.; Zeng, K.; Wu, S.-K.; Stura, E.A.; Matteson, J.; Huang, M.; Tandon, A.; Wilson, I.A.; Balch, W.E. Structure and mutational analysis of Rab GDP-dissociation inhibitor. Nature 1996, 381, 42–48. [Google Scholar] [CrossRef] [PubMed]
  69. Lycett, G. The role of Rab GTPases in cell wall metabolism. J. Exp. Bot. 2008, 59, 4061–4074. [Google Scholar] [CrossRef] [PubMed]
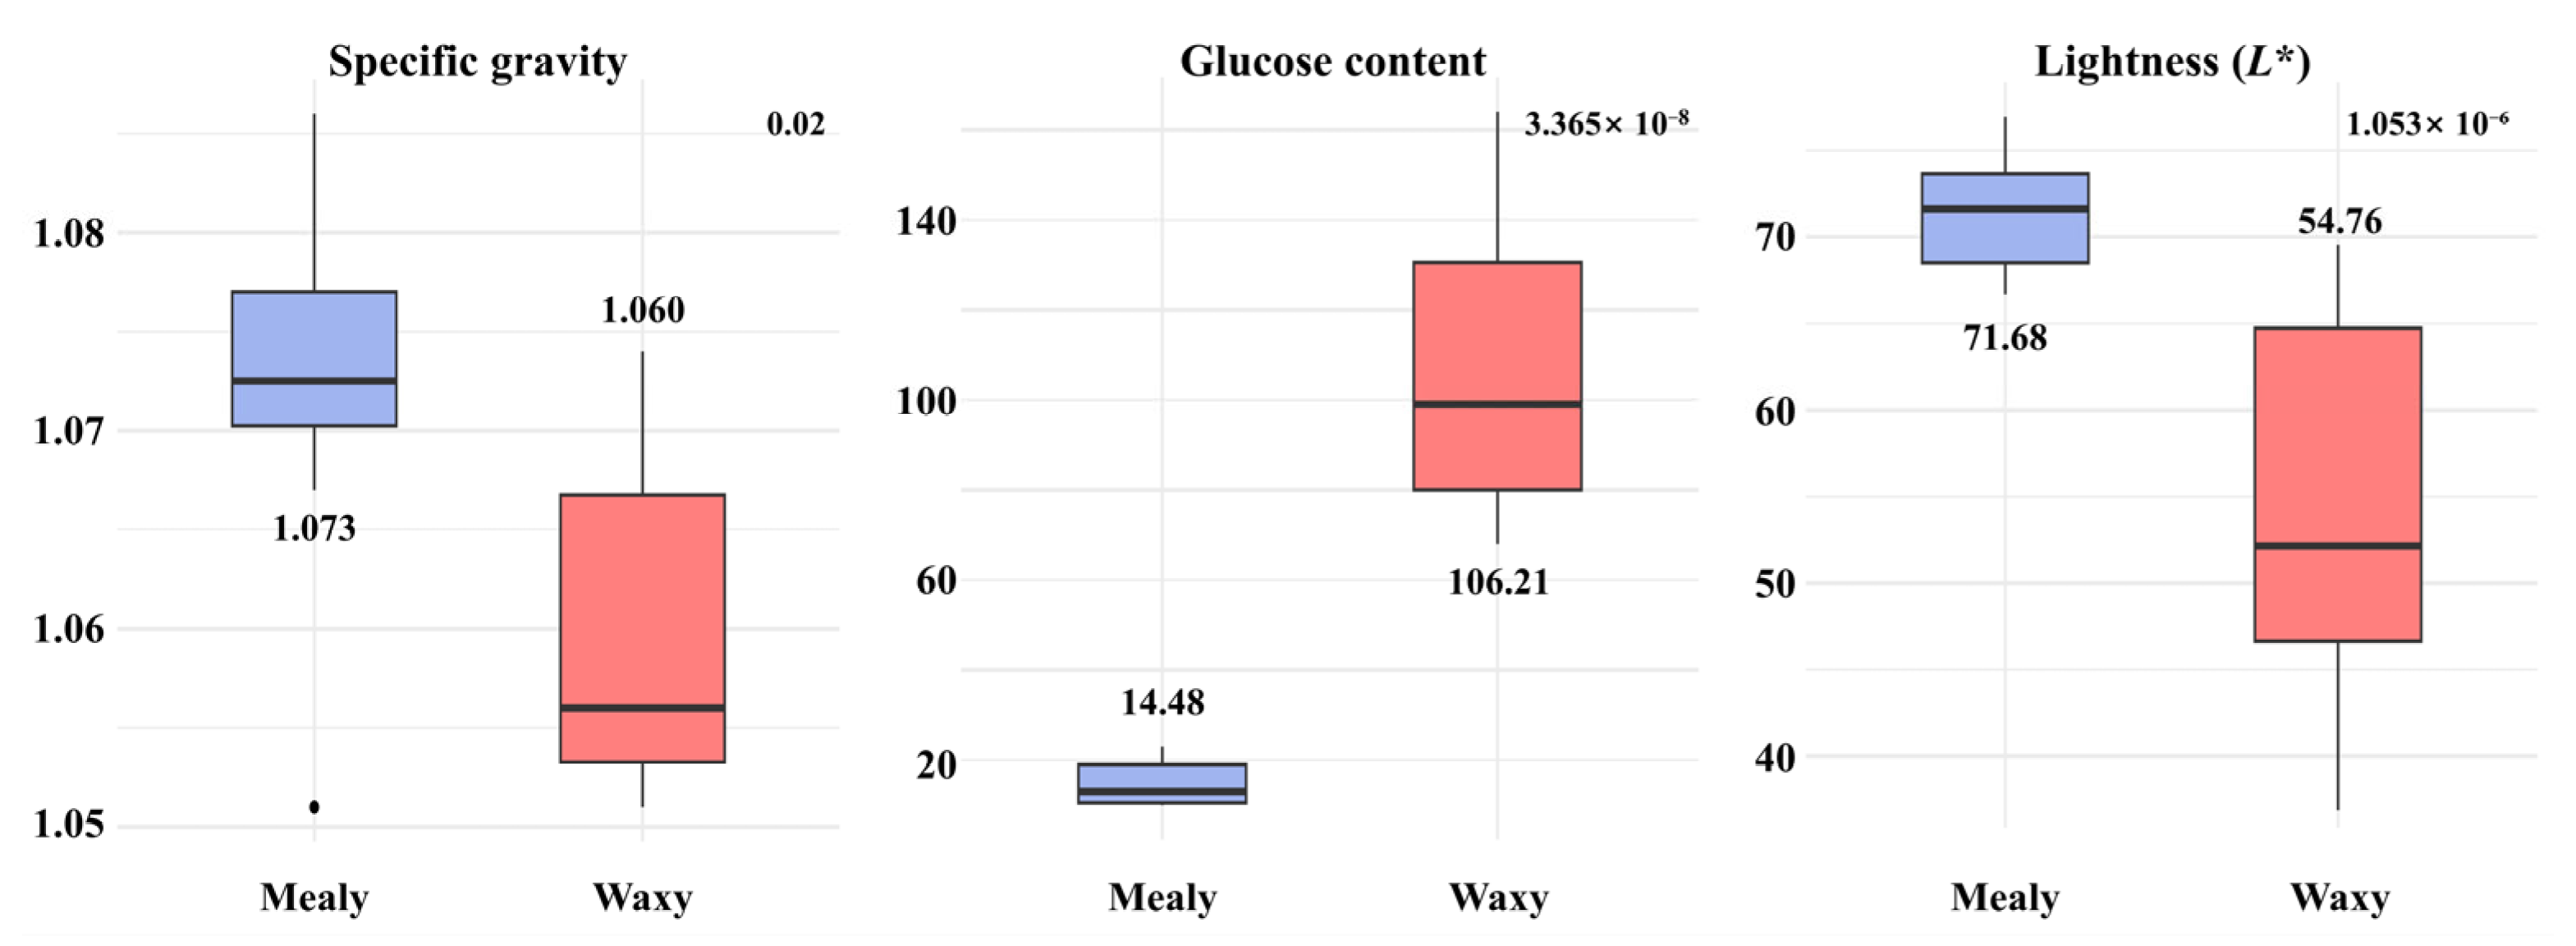
Figure 1. Comparison of three frying-related traits between mealy and waxy potatoes. Mealy and waxy potatoes are indicated by blue and red boxes, respectively. Mean values are displayed above or below each plot. The p-values for each comparison are shown above the plots. Glucose values below the detection limit (10) were substituted with 10 for comparative analysis.
Agronomy 15 01430 g001
Figure 2. Transcriptome data characteristics of four potatoes in Group A. (A) MDS plot illustrating the clustering of transcriptome samples based on expression patterns. Each point represents a replicated sample, and colors correspond to different samples. (B) Correlation plots showing pairwise Pearson correlation coefficients of gene expression profiles across multiple samples. Red boxes highlight comparisons within the same sample and red asterisks indicate statistically significant correlation (p < 0.001).
Agronomy 15 01430 g002
Figure 3. Volcano plot displaying DEGs between two potato types. Blue and red dots represent genes that are significantly upregulated in mealy and waxy potatoes, respectively. Genes with fewer than 10 read counts across 12 replications were excluded, while non-significant genes are represented as gray dots. Genes beyond the dashed lines, indicating a Log2FC of 1 and a p-value of 0.05 are considered as DEGs. NS: Non-significant.
Agronomy 15 01430 g003
Figure 4. The top 10 GO terms enriched in DEGs for each potato type. The Weight01 Fisher test p-value for each GO term are shown on a log 10 scale. GO terms in three categories, cellular component, biological process, and molecular function, were analyzed, and up to 10 enriched terms from each category are displayed with blue, green, and red colors, respectively. (A) Enriched GO terms in waxy-type potatoes. (B) Enriched GO terms in mealy-type potatoes.
Agronomy 15 01430 g004
Figure 5. Graphs displaying the gene expression patterns related to carbohydrate metabolism. The green and yellow color indicate the upregulated genes in waxy- and mealy-type potatoes, while light-gray and gray color show non-significantly different genes and non-expressed genes (less expression than 10 across 12 replication samples). (A) The stacked bar chart indicating gene expression patterns in seven carbohydrate metabolism pathways. (B) Pie chart showing gene expression patterns of a total of 40,652 gene sets annotated in reference genome. (C) Pie chart showing gene expression patterns of a total of 726 gene sets in seven carbohydrate metabolism pathways. (D) Pie chart showing gene expression patterns of expressed total 21,615 gene sets in reference genome. (E) Pie chart showing gene expression patterns of expressed total 427 gene sets in seven carbohydrate metabolism pathways.
Agronomy 15 01430 g005
Figure 6. Gene expression heatmaps. The red and blue colors show relatively upregulated and downregulated genes in waxy-type potatoes. (A) Gene expressions involved in starch metabolism pathway, including starch synthases, sucrose synthases, and amylases. (B) Expression patterns of bZIP transcription factor correlate with starch synthase 1 and 3. (C) Gene expression of SnRK2.4 involved in ABA signaling. (D) Gene expressions in pectin metabolism pathway, which may affect texture during frying.
Agronomy 15 01430 g006
Figure 7. Characteristics of WGCNA modules. (A) Heatmap illustrating the module–trait relationships of 13 modules. Module names marked with asterisk indicate significant modules identified with t-test. (B) The length of bar indicates the number of genes of each module, and dark-colored bars indicate DEGs composition within each module. (C) Line plots displaying the gene expression patterns for four significant modules. Each line indicates gene within each module.
Agronomy 15 01430 g007
Figure 8. Scatter plots between MMV and GS in four significant modules. Each dot indicates gene utilized in WGCNA analysis. X- and Y-axis represent MMV and GS, respectively. Genes and kME-based hub genes within each module are represented with gray and black dots. Red dotted lines indicate 0.7 for MMV and GS.
Agronomy 15 01430 g008
Figure 9. The top 10 enriched GO terms bar graphs in four significant modules. The length of horizontal bar graph indicates the −log10 weight01 fisher values for the top 10 enriched GO terms analyzed for genes within four significant modules. The colors of the bars correspond to the modules to which GO terms belong. The GO terms marked with an asterisk are included in enriched GO lists analyzed with DEGs.
Agronomy 15 01430 g009
Table 1. Information on 16 potato samples utilized in this study.
IDSample NameTypePlanted YearGroupStatusMarket Usage
1ChubaekWaxy2022ACultivarFresh Potato
2S18051-5Waxy2022AAdvanced breeding lineNon-evaluated
3DubaekMealy2022ACultivarChip
4EarlyFryMealy2022ACultivarFrench fries
5B4Waxy2023BBreeding lineNon-evaluated
6B10Mealy2023BBreeding lineNon-evaluated
7B14Waxy2023BBreeding lineNon-evaluated
8B23Waxy2023BBreeding lineNon-evaluated
9B25Mealy2023BBreeding lineNon-evaluated
10B42Waxy2023BBreeding lineNon-evaluated
11B44Waxy2023BBreeding lineNon-evaluated
12B47Mealy2023BBreeding lineNon-evaluated
13B50Waxy2023BBreeding lineNon-evaluated
14B51Mealy2023BBreeding lineNon-evaluated
15B56Mealy2023BBreeding lineNon-evaluated
16B57Mealy2023BBreeding lineNon-evaluated
Table 2. Phenotypic traits related to frying quality of Group A potato samples.
Sample NameGroupTypeTraitValueSample NameGroupTypeTraitValue
ChubaekAWaxySG1.06DubaekAMealySG1.07
Glu80GluLow
L*50.77L*71.0
LW1.06LW1.22
S18051-5AWaxySG1.06EarlyFryAMealySG1.07
Glu100Glu19
L*45.36L*72.12
LW1.62LW1.53
B4AWaxySG1.07
82
B10BMealySG
Glu
1.08
Low
Glu
B14AWaxySG1.06
158
B25BMealySG
Glu
1.09
12
Glu
B23AWaxySG1.07
98
B47BMealySG
Glu
1.07
13
Glu
B42AWaxySG1.05
105
B51BMealySG
Glu
1.07
16
Glu
B44AWaxySG1.05
142
B56BMealySG
Glu
1.07
16
Glu
B50AWaxySG1.07
70
B57BMealySG
Glu
1.05
21
Glu
SG: Specific gravity, Glu: Glucose content (Arbitrary unit), L*: Lightness after frying, LW: Length–Width ratio.
Table 3. Transcriptome data of three replications across four samples from Group A potatoes.
Sample IDTotal ReadsPaired in SequencingPaired Mapped ReadsPaired Mapping Rate (%)Mapped ReadsMapping Rate (%)
Chubaek-1.247,477,45337,309,54631,205,85483.64%43,425,97991.47%
Chubaek-1.338,755,81632,985,45428,015,59484.93%35,205,75490.84%
Chubaek-1.437,878,17232,582,41027,885,73485.59%34,643,82691.46%
S18051-5.247,575,97434,113,02629,186,76885.56%44,218,01992.94%
S18051-5.337,094,59029,920,94425,329,93284.66%33,953,34891.53%
S18051-5.450,175,13037,455,71631,903,14285.18%46,526,07392.73%
Dubaek-1.142,361,50632,870,90628,076,47085.41%38,921,22691.88%
Dubaek-1.251,182,43937,619,86632,427,09486.20%47,527,38892.86%
Dubaek-1.349,844,23335,786,13830,156,04084.27%46,137,73892.56%
EarlyFry-1.151,064,51734,809,28829,764,53485.51%47,694,58193.40%
EarlyFry-1.234,771,85326,879,03622,906,93285.22%32,162,33492.50%
EarlyFry-1.351,932,34838,512,33232,875,80885.36%48,156,47592.73%
Total540,114,031410,844,662349,733,90285.13%498,572,74192.24%
Table 4. Coexpression patterns of 1391 genes in 13 modules.
ModuleChubaek-1.2Chubaek-1.3Chubaek-1.4Dubaek-1.1Dubaek-1.2Dubaek-1.3Early-1.1Early-1.2Early-1.3S18051-5-1S18051-5-2S18051-5-3Adj. p-Value
Red *0.1390.1770.159−0.379−0.377−0.378−0.149−0.162−0.1580.3830.3840.3580.000
Turquoise *−0.344−0.297−0.3240.3710.3740.3760.1710.1990.183−0.245−0.252−0.2110.007
Purple *0.1710.1720.1250.0240.0200.013−0.477−0.468−0.4660.3040.2840.2980.007
Green *0.5580.4260.494−0.199−0.198−0.195−0.193−0.201−0.197−0.096−0.086−0.1120.007
Blue−0.555−0.441−0.4920.1360.1410.1450.1930.2160.2030.1380.1330.1830.068
Magenta0.3640.3220.411−0.416−0.407−0.3960.1710.1240.145−0.114−0.090−0.1160.292
Pink−0.036−0.061−0.0780.4940.4890.474−0.183−0.184−0.175−0.250−0.253−0.2370.292
Green/yellow0.1410.1170.1320.0600.0600.0600.2940.2800.293−0.494−0.459−0.4830.292
Brown−0.225−0.163−0.180−0.214−0.204−0.199−0.095−0.106−0.0990.5030.4990.4820.569
Tan−0.313−0.276−0.3090.2780.2710.280−0.277−0.282−0.2720.2980.2890.3141.000
Salmon0.4380.2530.3040.2360.2340.231−0.238−0.247−0.247−0.325−0.305−0.3331.000
Black−0.114−0.026−0.049−0.445−0.447−0.4430.2800.2630.2720.2320.2530.2231.000
Yellow−0.200−0.140−0.140−0.217−0.211−0.2100.5000.4940.494−0.135−0.108−0.1271.000
* Modules marked with an asterisk are considered significant.
Table 5. The top 10 hub genes based on kME and GS values within four significant modules.
MethodGeneModuleFunctionMethodGeneModuleFunction
KMESoltu.DM.05G009940 *GreenHypothetical proteinKMESoltu.DM.02G008410 *RedCytochrome P450, family 76, subfamily C, polypeptide
KMESoltu.DM.01G045370 *GreenProtein kinase superfamily proteinKMESoltu.DM.07G003160RedSucrose phosphate synthase 1F
KMESoltu.DM.12G007160 *GreenSulfate transporter 1;2KMESoltu.DM.07G026660 *RedMicrotubule-associated proteins 65-1
KMESoltu.DM.08G015680 *GreenAlpha/beta-Hydrolases superfamily proteinKMESoltu.DM.04G001460 *RedDisease resistance protein (CC-NBS-LRR class) family
KMESoltu.DM.07G003630 *GreenNucleoside transporter family proteinKMESoltu.DM.01G023300RedMultidrug-resistance-associated protein
KMESoltu.DM.04G001450 *GreenDisease resistance protein (CC-NBS-LRR class) familyKMESoltu.DM.12G012700 *RedPorphyromonas-type peptidyl-arginine deiminase family protein
KMESoltu.DM.02G007350 *GreenM-type MADS-box transcription factorKMESoltu.DM.09G017000RedRotamase FKBP
KMESoltu.DM.09G001240 *GreenAdenine nucleotide alpha hydrolases-like superfamily proteinKMESoltu.DM.12G020050RedReplication factor-A protein 1-related
KMESoltu.DM.02G003450 *GreenPhloem protein 2-A10KMESoltu.DM.12G014910 *RedNuclear factor Y, subunit C9
KMESoltu.DM.12G010700 *GreenSulfate transporter 3;4KME, GSSoltu.DM.08G025210 *RedBifunctional inhibitor/lipid-transfer protein/seed
storage 2S albumin superfamily protein
GSSoltu.DM.01G020280 *GreenNAD(P)-linked oxidoreductase superfamily proteinGSSoltu.DM.01G002970 *RedDamaged DNA binding;DNA-directed DNA polymerases
GSSoltu.DM.01G030060 *GreenCyclin/Brf1-like TBP-binding proteinGSSoltu.DM.12G029530 *RedFAD/NAD(P)-binding oxidoreductase family protein
GSSoltu.DM.03G025470 *GreenCytochrome P450, family 71, subfamily A, polypeptideGSSoltu.DM.04G015010 *RedPhosphoglucomutase/phosphomannomutase family protein
GSSoltu.DM.12G017990 *GreenRhodanese/Cell cycle control phosphatase superfamilyGSSoltu.DM.12G014430 *RedHypothetical protein
GSSoltu.DM.12G024860 *GreenProtein of unknown function, DUF538GSSoltu.DM.12G021480 *RedBNR/Asp-box repeat family protein
GSSoltu.DM.06G025180GreenCCAAT-displacement protein alternatively spliced proGSSoltu.DM.06G005790 *RedHypothetical protein
GSSoltu.DM.10G026800 *GreenTranslation protein SH3-like family proteinGSSoltu.DM.12G026350 *RedPlant invertase/pectin methylesterase inhibitor superfamily protein
GSSoltu.DM.12G017970 *GreenRhodanese/Cell cycle control phosphatase superfamilyGSSoltu.DM.10G022330 *RedNB-ARC domain-containing disease resistance protein
GSSoltu.DM.11G018210GreenADP/ATP carrierGSSoltu.DM.12G009230 *RedTranslocase of inner mitochondrial membrane
GSSoltu.DM.06G023440 *GreenGibberellin 3-oxidaseKMESoltu.DM.08G030240 *TurquoisePolyketide cyclase/dehydrase and lipid transport superfamily protein
KMESoltu.DM.08G008810PurpleBeta-fructofuranosidaseKMESoltu.DM.08G027980 *TurquoiseHydroxyproline-rich glycoprotein family protein
KMESoltu.DM.11G005660PurpleUDP-Glycosyltransferase superfamily proteinKMESoltu.DM.06G025450TurquoiseHistone-lysine N-methyltransferases
KMESoltu.DM.02G016440PurpleAlpha/beta-Hydrolases superfamily proteinKMESoltu.DM.05G001020 *TurquoiseReversibly glycosylated polypeptide
KMESoltu.DM.01G048270PurpleHypothetical proteinKMESoltu.DM.03G030890 *TurquoisePhox (PX)-domain-containing protein
KMESoltu.DM.01G049750PurpleRING/U-box superfamily proteinKMESoltu.DM.06G021390 *Turquoisetetratricopeptide repeat (TPR)-containing protein
KMESoltu.DM.03G032030 *PurpleNon-intrinsic ABC proteinKMESoltu.DM.05G002470 *TurquoiseEukaryotic translation initiation factor 3 subunit A
KMESoltu.DM.05G014610PurpleLRR- and NB-ARC-domain-containing disease resistance proteinKMESoltu.DM.01G050570TurquoiseATP-dependent RNA helicase, putative
KME, GSSoltu.DM.02G034330 *PurpleConserved hypothetical proteinKMESoltu.DM.03G002170TurquoiseProline-rich spliceosome-associated (PSP) family protein
KMESoltu.DM.12G008090PurpleGlutathione S-transferase THETAKMESoltu.DM.02G006930TurquoiseTCP-1/cpn60 chaperonin family protein
KMESoltu.DM.09G029680 *PurpleDisease resistance protein (TIR-NBS-LRR class) familyGSSoltu.DM.04G002760 *TurquoiseMLP-like protein
GSSoltu.DM.11G023420 *PurpleNB-ARC domain-containing disease resistance proteinGSSoltu.DM.01G008110 *TurquoiseGag-polypeptide of LTR copia-type domain containing protein
GSSoltu.DM.06G016240 *PurpleACT domain repeatGSSoltu.DM.06G026340 *TurquoiseSerine/threonine protein kinase
GSSoltu.DM.07G009630 *PurpleTransposase family tnp2 domain containing proteinGSSoltu.DM.08G016860 *TurquoiseConserved hypothetical protein
GSSoltu.DM.08G024310 *PurpleHomeobox proteinGSSoltu.DM.04G038280 *TurquoiseTBP-associated factor
GSSoltu.DM.12G027440 *PurpleSOS3-interacting proteinGSSoltu.DM.04G029040 *TurquoiseGlycosyl hydrolase family protein
GSSoltu.DM.08G020410 *PurpleTransglutaminase-like superfamily domain containing proteinGSSoltu.DM.09G024430 *TurquoisePapain family cysteine protease
GSSoltu.DM.01G010080PurpleEukaryotic elongation factor 5A-1GSSoltu.DM.04G033150 *TurquoiseF-box family protein
GSSoltu.DM.08G012390 *PurpleMechanosensitive channel of small conductance-likeGSSoltu.DM.03G032660 *TurquoiseNF-X-like
GSSoltu.DM.04G021610 *PurpleNAD(P)-binding Rossmann-fold superfamily proteinGSSoltu.DM.01G027700 *TurquoiseTetratricopeptide repeat (TPR)-like superfamily protein
* Genes marked with an asterisk indicate DEGs.
Disclaimer/Publisher’s Note: The statements, opinions and data contained in all publications are solely those of the individual author(s) and contributor(s) and not of MDPI and/or the editor(s). MDPI and/or the editor(s) disclaim responsibility for any injury to people or property resulting from any ideas, methods, instructions or products referred to in the content.