Article

Transcriptome-Based Analysis of the Co-Expression Network of Genes Related to Nitrogen Absorption in Rice Roots Under Nitrogen Fertilizer and Density

1
Jiangsu Key Laboratory of Crop Genetics and Physiology/Jiangsu Key Laboratory of Crop Cultivation and Physiology, Agricultural College of Yangzhou University, Yangzhou 225009, China
2
Jiangsu Co-Innovation Center for Modern Production Technology of Grain Crops, Yangzhou University, Yangzhou 225009, China
3
Jiangxi Irrigation Experiment Central Station, Nanchang 330045, China
*
Authors to whom correspondence should be addressed.
These authors contributed equally to this work.
Agronomy 2025, 15(6), 1429; https://doi.org/10.3390/agronomy15061429
Submission received: 3 April 2025 / Revised: 4 June 2025 / Accepted: 10 June 2025 / Published: 11 June 2025
(This article belongs to the Section Crop Breeding and Genetics)

Abstract

:
Nitrogen (N) management and planting density critically influence rice (Oryza sativa L.) N use efficiency (NUE) and yield stability, though excessive inputs risk ecological and productivity constraints. This study investigated molecular adaptations in japonica rice Hongyang 5 under three N density regimens: high N/low density (HNLD), medium N/medium density (MNMD), and low N/high density (LNHD). Our previous studies found that the N absorption efficiency, antioxidant enzyme activity, and energy metabolism-related phenotypes of rice roots showed significant differences under different treatments. In this study, we found that root morphology, such as root length, root surface area, root volume, and average root diameter, also showed significant differences among different treatments. Based on this, we further integrated transcriptome and co-expression network analysis, revealing 40,218 expressed genes with differential expression patterns across treatments. Weighted gene co-expression network analysis (WGCNA) identified 13 modules, with the Turquoise and Blue modules notably demonstrating strong associations with N assimilation, antioxidant activity, and ATP metabolism. Ten hub genes emerged through intramodular connectivity analysis, including LOC_Os02g53130 (N metabolism), LOC_Os06g48240 (peroxidase activity), and LOC_Os01g48420 (energy transduction), with RT-qPCR validation confirming transcriptome-derived expression profiles. Functional characterization revealed synergistic coordination between Turquoise module N metabolic pathways and Blue module redox homeostasis, suggesting an integrated regulatory mechanism for root adaptation to N density interactions. These findings establish a gene-network framework that reveals the molecular regulatory network of crop responses to N nutrition and planting density and provides important theoretical support for N fertilizer management, population quality optimization, and variety breeding in precision agriculture.

1. Introduction

Rational N management is pivotal for optimizing rice productivity and environmental sustainability. As an indispensable macronutrient, N fundamentally regulates physiological processes throughout rice development. Extensive research confirms that judicious N fertilization has revolutionized agricultural intensification, elevating global cereal production by 30–50% while ensuring food security [1]. However, excessive N inputs beyond crop demand not only fail to proportionally increase yields but also trigger cascading ecological consequences, including topsoil acidification, aquatic ecosystem eutrophication, and farmland degradation [2]. This paradox underscores the urgent need for precision N management strategies that maximize utilization efficiency while minimizing environmental footprints.
Planting density manipulation emerges as a complementary approach to enhance N use efficiency (NUE) [3]. Appropriate spatial arrangements improve canopy architecture by optimizing light interception and photosynthetic capacity, particularly during critical vegetative stages [4]. Moderate density increases stimulate root proliferation and rhizosphere nutrient mobilization, thereby enhancing N acquisition under both optimal and suboptimal conditions (e.g., drought or low N availability) [5,6]. Nevertheless, overcrowding induces root competition and oxidative stress, exacerbating pathogen susceptibility while diminishing resource use efficiency [7,8]. Conversely, suboptimal planting densities compromise population quality, resulting in inadequate N assimilation and yield penalties [9]. These non-linear responses highlight the necessity for genotype-specific optimization of N density interactions.
Recent advances in functional genomics provide unprecedented opportunities to decode the genetic architecture of N responsiveness [10]. Transcriptome profiling enables systematic identification of N-assimilation-related gene networks and their regulatory dynamics under varying agronomic practices [11,12]. Weighted gene co-expression network analysis (WGCNA) has been widely used in plant research as an effective gene research method [13]. In rice, WGCNA applications have revealed key transcription factors like nitrate-inducible GARP-type transcriptional repressor 1 (NIGT1) that orchestrate root developmental plasticity under nutrient limitations [14]. At the same time, transcriptome analysis also helped reveal the mechanism by which sugar beet adapts to a low-N environment by regulating carbon and N metabolism under low N stress [15]. The transcriptome analysis method used in this study is based on the analysis of the reference genome and relies on the known sequence alignment assembly. It has higher accuracy and annotation completeness for model crops with well-annotated genomes such as rice [16,17]. While de novo assembly is suitable for non-model species, it may lead to detection bias of low-expression or long-coding sequence genes due to sequence fragmentation or assembly errors [18]. This study adopted a reference genome-based strategy combined with WGCNA to ensure the accuracy of gene expression profiles and the reliability of module division, providing a robust method for analyzing the molecular mechanism of N density interaction.
This study combined transcriptome sequencing with WGCNA to comprehensively explore the combined effects of different N fertilizer application rates and field density on rice root growth and N absorption. At the same time, hub genes related to N absorption, antioxidant capacity, and energy metabolism were screened, and the regulatory mechanisms of these genes in rice growth and development were analyzed. This study aims to provide a theoretical basis for N fertilizer management and planting density optimization in rice production.

2. Materials and Methods

2.1. Experimental Materials and Arrangements

Test materials: Japonica rice variety “Hongyang 5” (Wuyujing 3/Nanjing 5055//Huadao 5), provided by the Key Laboratory of Crop Genetics and Physiology, College of Agriculture, Yangzhou University, Yangzhou, Jiangsu 225009, China.
The bucket planting experiment was conducted. The specifications of the cultivation barrel were 26 cm in height, 29 cm in diameter, and 22 cm in inner bottom diameter. Each bucket contained 15 kg of air-dried and sieved (particle size ≤ 0.12 mm) cultivated soil and was flooded. Sowing and transplanting: Sowing was conducted on 25 May 2022, and strong seedlings for transplanting were selected on 18 June (seedling age 25 days), with 2 plants per hole. N fertilization utilized 15N-labeled urea (10% abundance, Shanghai Chemical Industry Research Institute, Shanghai, China) applied in split doses following a 5:3:2 ratio for basal, tillering, and panicle stage applications, respectively. Phosphorus supplementation consisted of 6.0 g calcium magnesium phosphate/bucket applied basally, while potassium chloride (1.5 g/bucket) was administered at both tillering and heading stages. The completely randomized block design incorporated three biological replicates per treatment, each comprising 10 buckets. The cultivated soil was obtained from the experimental farm of Yangzhou University, Yangzhou, Jiangsu 225009, China, and the physical and chemical properties were as follows: pH 6.8 (water–soil = 2.5:1), organic matter content 35.5 g·kg−1, total N 1.2 g·kg−1, available phosphorus 25 mg·kg−1, available potassium 150 mg·kg−1, and cation exchange capacity 15 cmol·kg−1.
The experiment employed a factorial design with three N density treatment combinations: high N/low density (HNLD): 2 holes/bucket, 7 g N/bucket, equivalent to a field of 350 kg·N·ha−2 (converted by fertilizer application amount and bucket area); medium N/medium density (MNMD): 4 holes/bucket, 4.5 g N/bucket, equivalent to 225 kg·N·ha−2; low N/high density (LNHD): 6 holes/bucket, 2 g N/bucket, equivalent to 100 kg·N·ha−2.

2.2. Sample Collection

The experimental materials were sampled at the maturity stage and heading stage and recorded as follows: high N/low density maturity stage sample (HNLD_MS), high N/low density heading stage sample (HNLD_HS), medium N/medium density maturity stage sample (MNMD_MS), medium N/medium density heading stage sample (MNMD_HS), low N/high density maturity stage sample (LNHD_MS), and low N/high density heading stage sample (LNHD_HS).
Three representative rice plants were randomly selected from each treatment group. After the complete root system was dug out, they were returned to the laboratory, and soil was collected from 1 to 2 cm around the root system using an autoclaved shovel. Avoid damaging the root system when collecting soil to ensure that the rhizosphere soil is collected. Subsequently, the roots were gently rinsed with ultrapure water to remove the attached soil, a portion of which was used for the determination of root morphology, and the rest of the root tips of about 5 cm in length were cut as samples. The soil and root samples of each treatment group were sampled three times biologically. After collection, the samples were immediately frozen and stored at −80 °C for subsequent determination.
Root morphology measurements were imaged using an Epson V700 Scanner (Seiko Epson Corporation, Suwa, Nagano, Japan). These images were then analyzed using Win RHIZO2003b software (Regent Instruments, Québec City, QC, Canada). This software allowed for the determination of the total root length (RL), root surface area (RSA), root volume (RV), and root average diameter (RAD).

2.3. High-Throughput Sequencing Preparation and Data Analysis

Total RNA was extracted from tissues using TRIzol® reagent (Invitrogen, Carlsbad, CA, USA), and genomic DNA was removed by DNase I (TaKaRa, Dalian, China). RNA integrity was checked by agarose gel electrophoresis, and quality was further assessed by a 2100 Bioanalyzer (Agilent Technologies, Santa Clara, CA, USA) and quantified using a NanoDrop 2000 Spectrophotometer (NanoDrop Technologies, Wilmington, DE, USA). Only RNA that met high quality standards (OD260/280 = 1.8~2.2, OD260/230 ≥ 2.0, RIN ≥ 8.0, 28S:18S ≥ 1.0, >1 μg) was used for library construction. Library preparation used the TruSeq™ RNA Sample Preparation Kit (Illumina, San Diego, CA, USA), and mRNA was isolated by oligo (dT) beads and fragmented with a fragmentation buffer. Double-stranded cDNA was then synthesized using random hexamer primers (Illumina), and end repair, phosphorylation, and “A” base addition were performed according to the Illumina protocol. A 300 bp fragment size was selected for library construction, and PCR amplification was performed using Phusion DNA polymerase (NEB). Finally, sequencing was performed using the Illumina NovaSeq 6000 system (2 × 150 bp read length), and the raw data were stored in the Genome Sequence Archive (CRA008896).
The raw data were trimmed and quality controlled using fastp [19]. The processed clean reads were compared with the reference genome by HISAT2 [20]. Then, StringTie was used for assembly [21]. Significantly expressed genes were screened out according to the criteria of |log2 (fold change)| ≥ 1 and p ≤ 0.05. In order to further explore the functions, Goatools and KOBAS [22] were used to perform GO and KEGG pathway enrichment analysis on differential genes (DEGs). In addition, rMATS [22] was used to identify alternative splicing events, focusing on analysis of exon inclusion/exclusion, alternative 5′ and 3′ splicing, and intron retention events.

2.4. WGCNA Construction and qRT-PCR Validation

We constructed a weighted gene co-expression network using the WGCNA package in R and input the normalized gene expression matrix of transcriptome samples from all treatment groups in this experiment. The top 50% of genes, with the highest variability in expression, were selected based on their variance. After filtering, we applied a β value of 18 to convert the scale-free matrix into a scale-free adjacency matrix and then into a topological overlap matrix using dissTOM to represent topological differences. Gene clustering and module partitioning were carried out using the dynamic cut method, setting the minimum module size to 30. qRT-PCR was used to verify differentially expressed genes involved in peroxidase activity, metabolism, and ATP metabolism. Gene expression analysis was performed using the QuantStudio 5 system, using SYBR Green (Table S1) as the dye and β-actin as the internal reference gene, and the data were processed by the 2−ΔΔCt method [23].

2.5. Data Analysis

The organization and calculation of raw data were performed using Excel 2019, while data visualization, including PCA plots, Venn diagrams, correlation heatmaps, and correlation analysis charts, was carried out using R (R version 4.1.2, R Foundation for Statistical Computing, Vienna, Austria). Finally, image compilation was completed using Adobe Photoshop CS 2024. The rice reference genome used for transcriptome alignment was Oryza sativa subsp. japonica cv. Nipponbare, version MSU Rice Genome Annotation Project Release 7 (NCBI accession: GCF_000001395.1). Sequence data were obtained from the NCBI Genome database for HISAT2 alignment and StringTie assembly.

3. Results

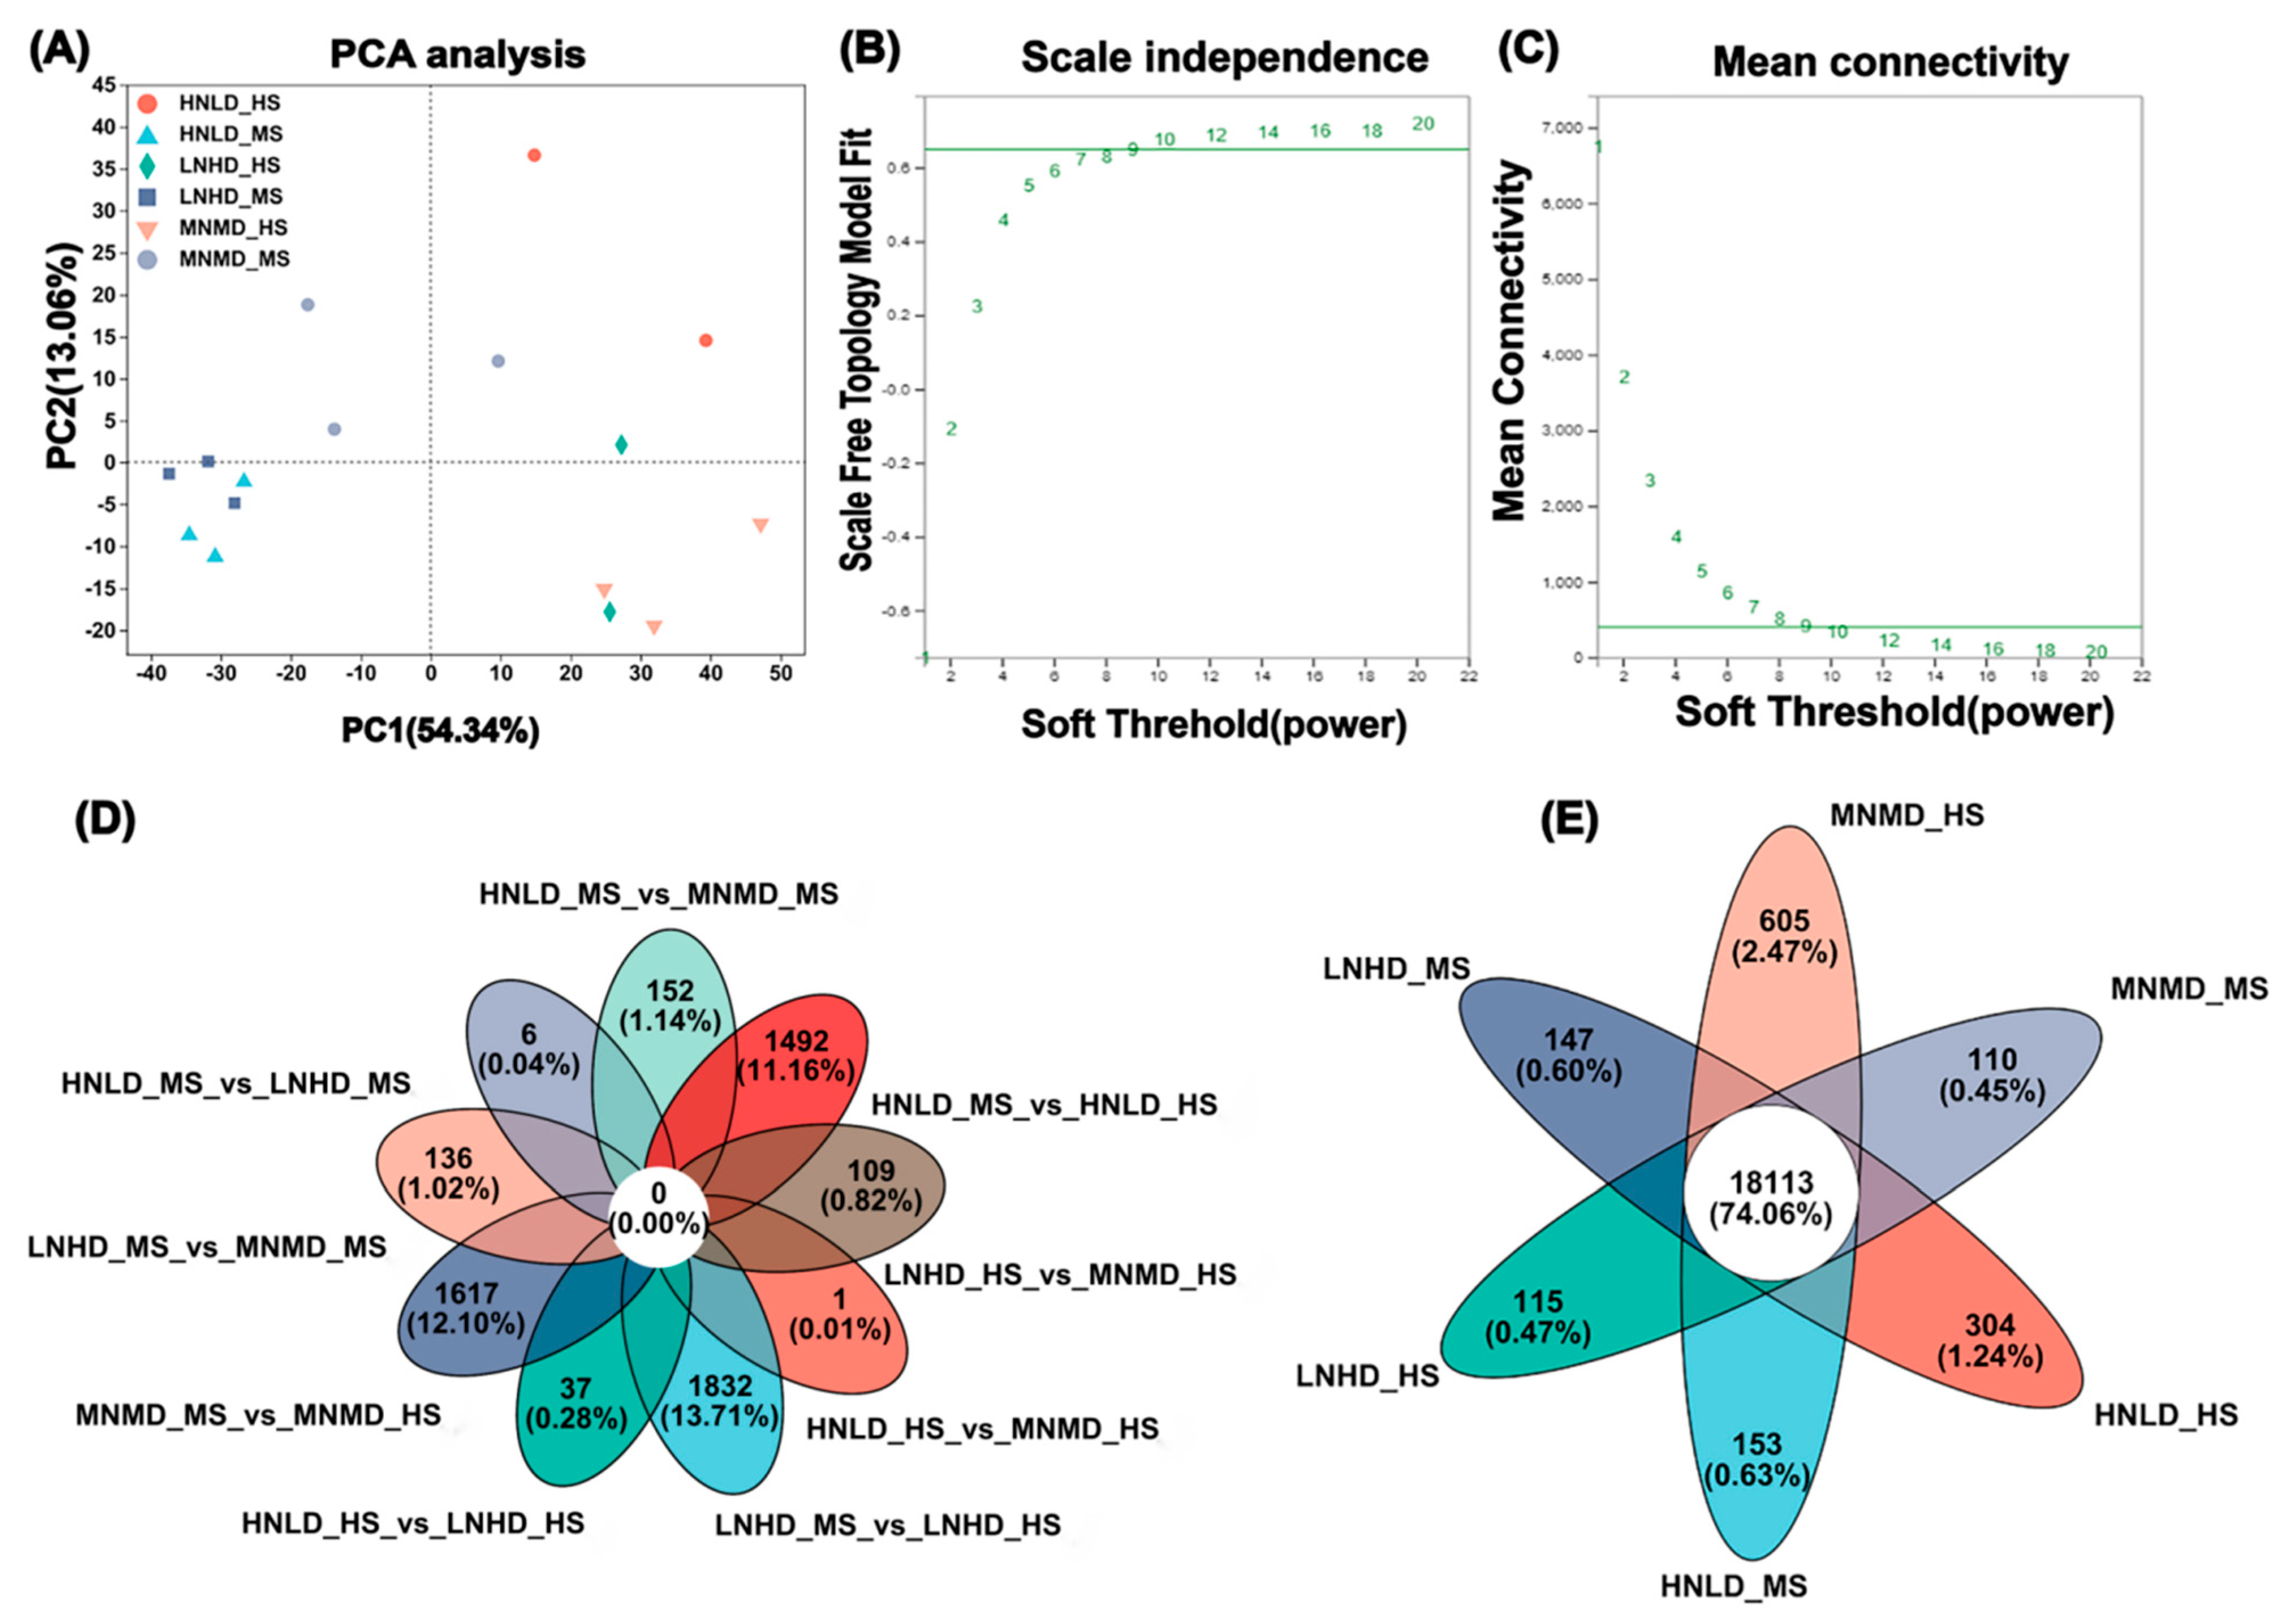
3.1. Transcriptome Data Analysis

Comprehensive transcriptome sequencing generated 119.92 Gb of high-quality sequencing data, identifying 40,218 expressed transcripts, including 38,398 annotated genes and 1820 novel isoforms. At the same time, 79,454 expressed transcripts were identified. Functional annotation of these genes and transcripts was conducted (Table 1 and Table 2). The PCA analysis results showed that PC1 and PC2 could explain the main variation in gene expression data (67.40% in total). PCA analysis results showed that LNHD_HS, MNMD_HS, and HNLD_HS were significantly separated from LNHD_MS, MNMD_MS, and HNLD_MS samples in the PC1 direction, and HNLD_HS and MNMD_MS were significantly separated from HNLD_MS and MNMD_HS samples in the PC2 direction, indicating that gene expression was greatly affected by the growth stage (Figure 1A). These results provide a preliminary understanding of the transcriptional differences between sample groups and the differences within each group.

3.2. Analysis of Root Morphological Characteristics

This study showed that the root morphology indexes showed significant differences under different N fertilizer and planting density treatments (Table 3). Overall, the RL values were generally higher at the heading stage. However, RSA and RV showed a significant growth trend at the maturity stage. The RSA of the HNLD treatment increased from 4901.26 cm2 at the heading stage to 3139.84 cm2 at the maturity stage, and the RV increased from 60.59 cm3 to 85.22 cm3, and the difference was statistically significant compared to other treatments. The RAD changed relatively smoothly throughout the growth process and reached the highest value at the maturity stage, with the largest value of 0.60 mm in the MNMD_MS treatment. The significant differences among the treatments indicate that the combination of N level and planting density has different effects on the root morphology at different growth stages. This lays a data foundation for in-depth exploration of genes and their regulatory networks associated with N-related phenotypic differences.

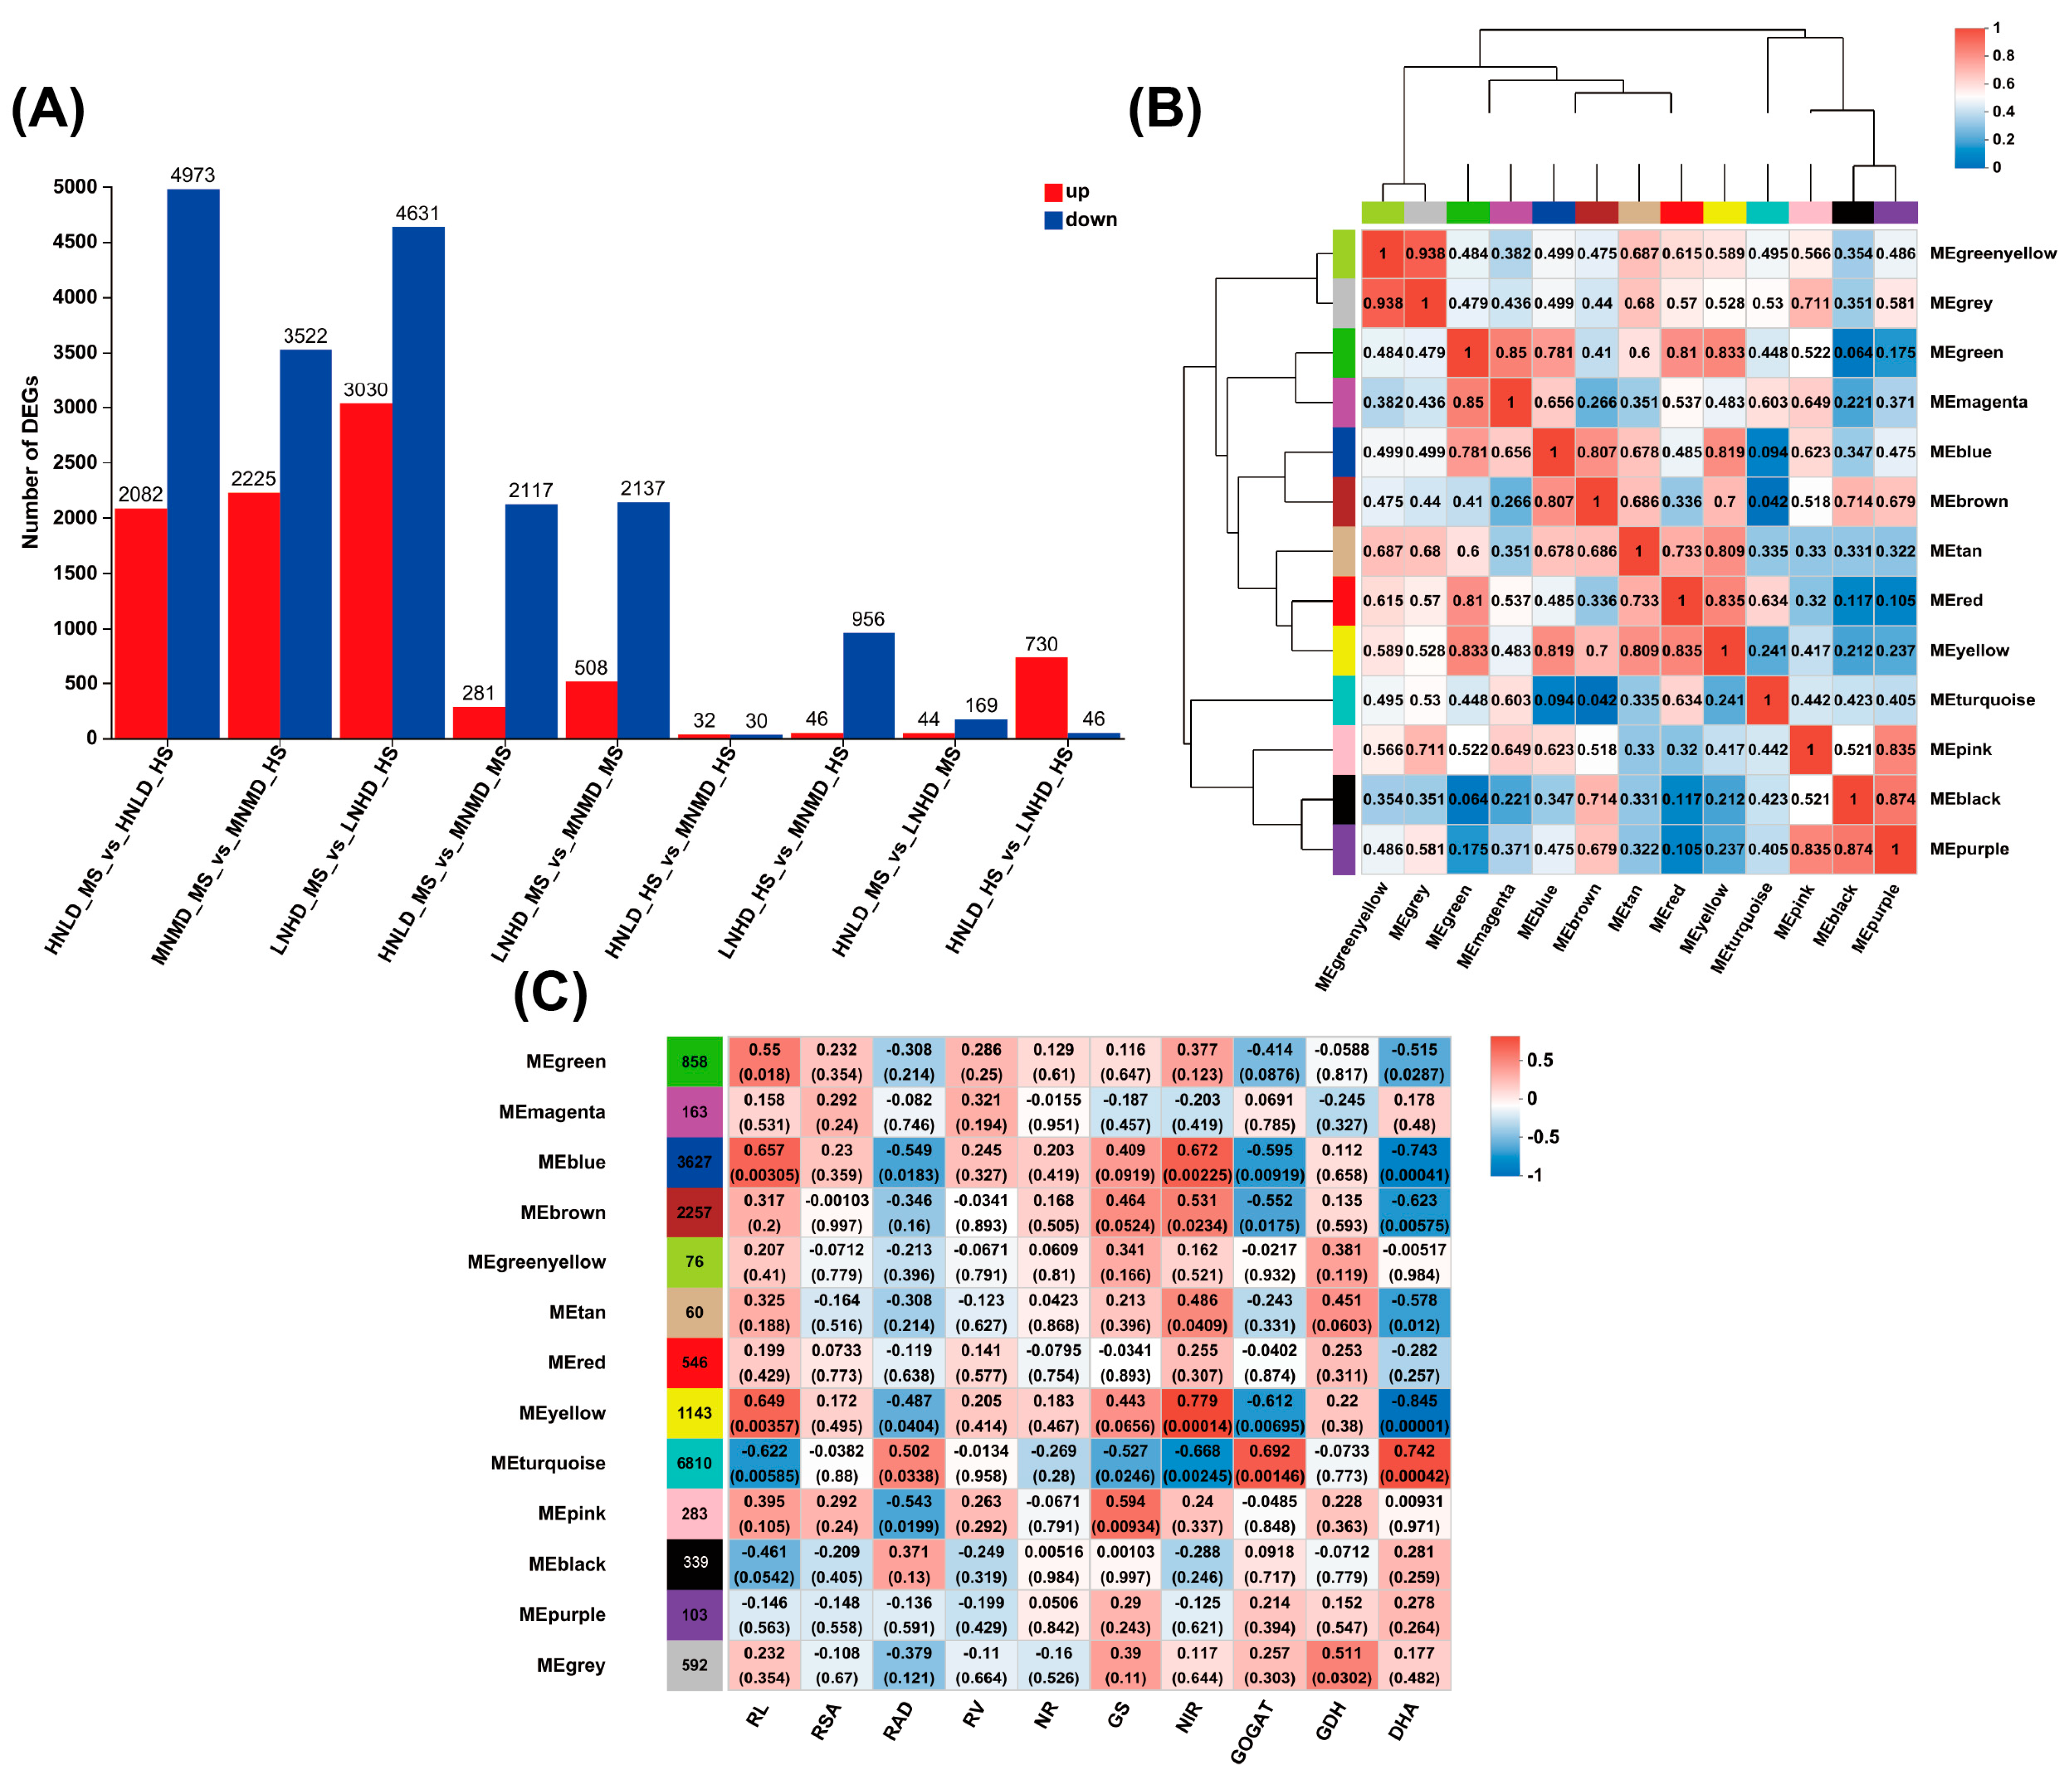
3.3. Differentially Expressed Gene (DEG) Analysis

Based on RNA-seq data, DESeq2 was used for differential gene expression analysis, with the threshold set to |log2FC| ≥ 1 and p < 0.05. The difference in gene expression between heading stage and maturity stage (HS vs. MS) was significantly greater than that of single N or density treatment: in different N and density combination treatments, the number of differentially expressed genes (DEGs) in HS vs. MS showed a dominant characteristic of down-regulated genes (the proportion of down-regulated genes exceeded 60%), and the difference was significantly higher than that between single N or density treatments (Figure 2A) (Tables S2–S4), indicating that the effect of growth stage conversion on gene expression was stronger than that of single environmental factor treatment.
The number of DEGs between different treatments in the same period was small, and the proportion of down-regulated genes generally exceeded 60%. For example, there were only 281 up-regulated and 2117 down-regulated genes in the comparison of HNLD_MS vs. MNMD_MS, and 508 up-regulated and 2137 down-regulated genes in the comparison of LNHD_MS vs. MNMD_MS (Tables S5–S10), indicating that gene expression was mainly inhibited under the interaction of N and density (Figure 1D). A total of 18,113 DEGs were identified in the global analysis, accounting for 74.06% of the total genes, indicating that N density interaction affects root function through extensive transcriptional reprogramming, providing key data support for subsequent WGCNA (Figure 1E).

3.4. WGCNA and Correlation Analysis

Building upon our previous characterization of physiological and biochemical responses in LNHD-, MNMD-, and HNLD-treated rice plants [24]. This study further combined these physiological and biochemical data with differentially expressed genes related to N absorption and identified the hub genes involved in the N absorption regulatory network of rice roots through WGCNA and gene set–phenotype association analysis. The correlation coefficient of each pair of genes was calculated using Pearson correlation (Figure 1B,C), and a gene co-expression network was constructed. Through the hierarchical clustering function (hclust) and the dynamic tree cutting method, genes were divided into different modules according to the similarity of their expression patterns and annotated with different colors (Figure 2B). Through data set analysis, we identified a total of 13 modules related to physiological and biochemical characteristics (Figure 2C), among which the three modules with the largest number of genes were the Turquoise module (6810 genes), the Blue module (3627 genes), and the Tan module (60 genes) (Figure 2B). To streamline the analysis, we used the concept of an eigengene (ME) (Figure 2B), which represents the collective expression of genes within a module. This allowed us to correlate the gene modules with the physiological traits at various treatment stages, highlighting significant relationships between specific modules and traits.
Notably, the Green, Yellow, and Gray modules showed a strong correlation (0.94), and the Black and Purple modules also exhibited a high correlation (0.87) (Figure 2B). Temporal analysis of the Turquoise and Brown modules revealed dynamic shifts in antioxidant trait correlations, transitioning from negative to positive associations during developmental progression (Figure 2C). The Blue and Turquoise modules exhibited persistent correlations with key physiological indicators across treatment stages, nominating them as priority candidates for mechanistic investigation of N-responsive regulation.

3.5. GO Enrichment Analysis

Functional annotation using the AgriGo v2.0 platform identified conserved enrichment patterns across treatments (Table 4). The results revealed that several key pathways, including those associated with N metabolism, antioxidant properties, and energy metabolism, were significantly enriched in the treatments. N metabolism and antioxidant-related pathways were consistently enriched across multiple comparisons, such as HNLD_HS_vs_LNHD_HS, MNMD_MS_vs_MNMD_HS, and LNHD_HS_vs_MNMD_HS. Additionally, flavonoid metabolic processes were enriched in the comparison between HNLD_MS_vs_MNMD_MS, while energy metabolism pathways, particularly ATP binding, were enriched in the HNLD_MS_vs_MNMD_MS group and others. These findings provide insight into the complex regulatory mechanisms underlying the plant’s response to different treatments.
To further investigate the functions of the target gene modules, we conducted GO functional enrichment analysis using the AgriGo v2.0 online tool for the two selected gene modules, Turquoise and Blue (Table 5). The Turquoise module showed N metabolism (GO:0051173; GO:0051172; GO:0051171), energy metabolism (GO:0005524), and antioxidant properties (GO:0016730). Blue module showed antioxidant properties (oxidoreductase activity) (GO:0016684; GO:0052716; GO:0016614; GO:0016616; GO:0016491; GO:0016651; GO:0016682; GO:0016679; GO:0050664; GO:0016628; GO:0016620; GO:0016717; GO:0016860; GO:0016903; GO:0016671; GO:0016655), pathways related to antioxidant activity (GO:0016209), pathways related to antioxidant properties (flavonoid metabolic process) (GO:0009812), and pathways related to energy metabolism (GO:0016052; GO:0044275). This dual-module architecture demonstrates WGCNA’s efficacy in resolving co-regulated gene clusters governing antioxidant defense and energy homeostasis under N density interactions, establishing the Turquoise and Blue modules as central hubs for subsequent mechanistic studies.

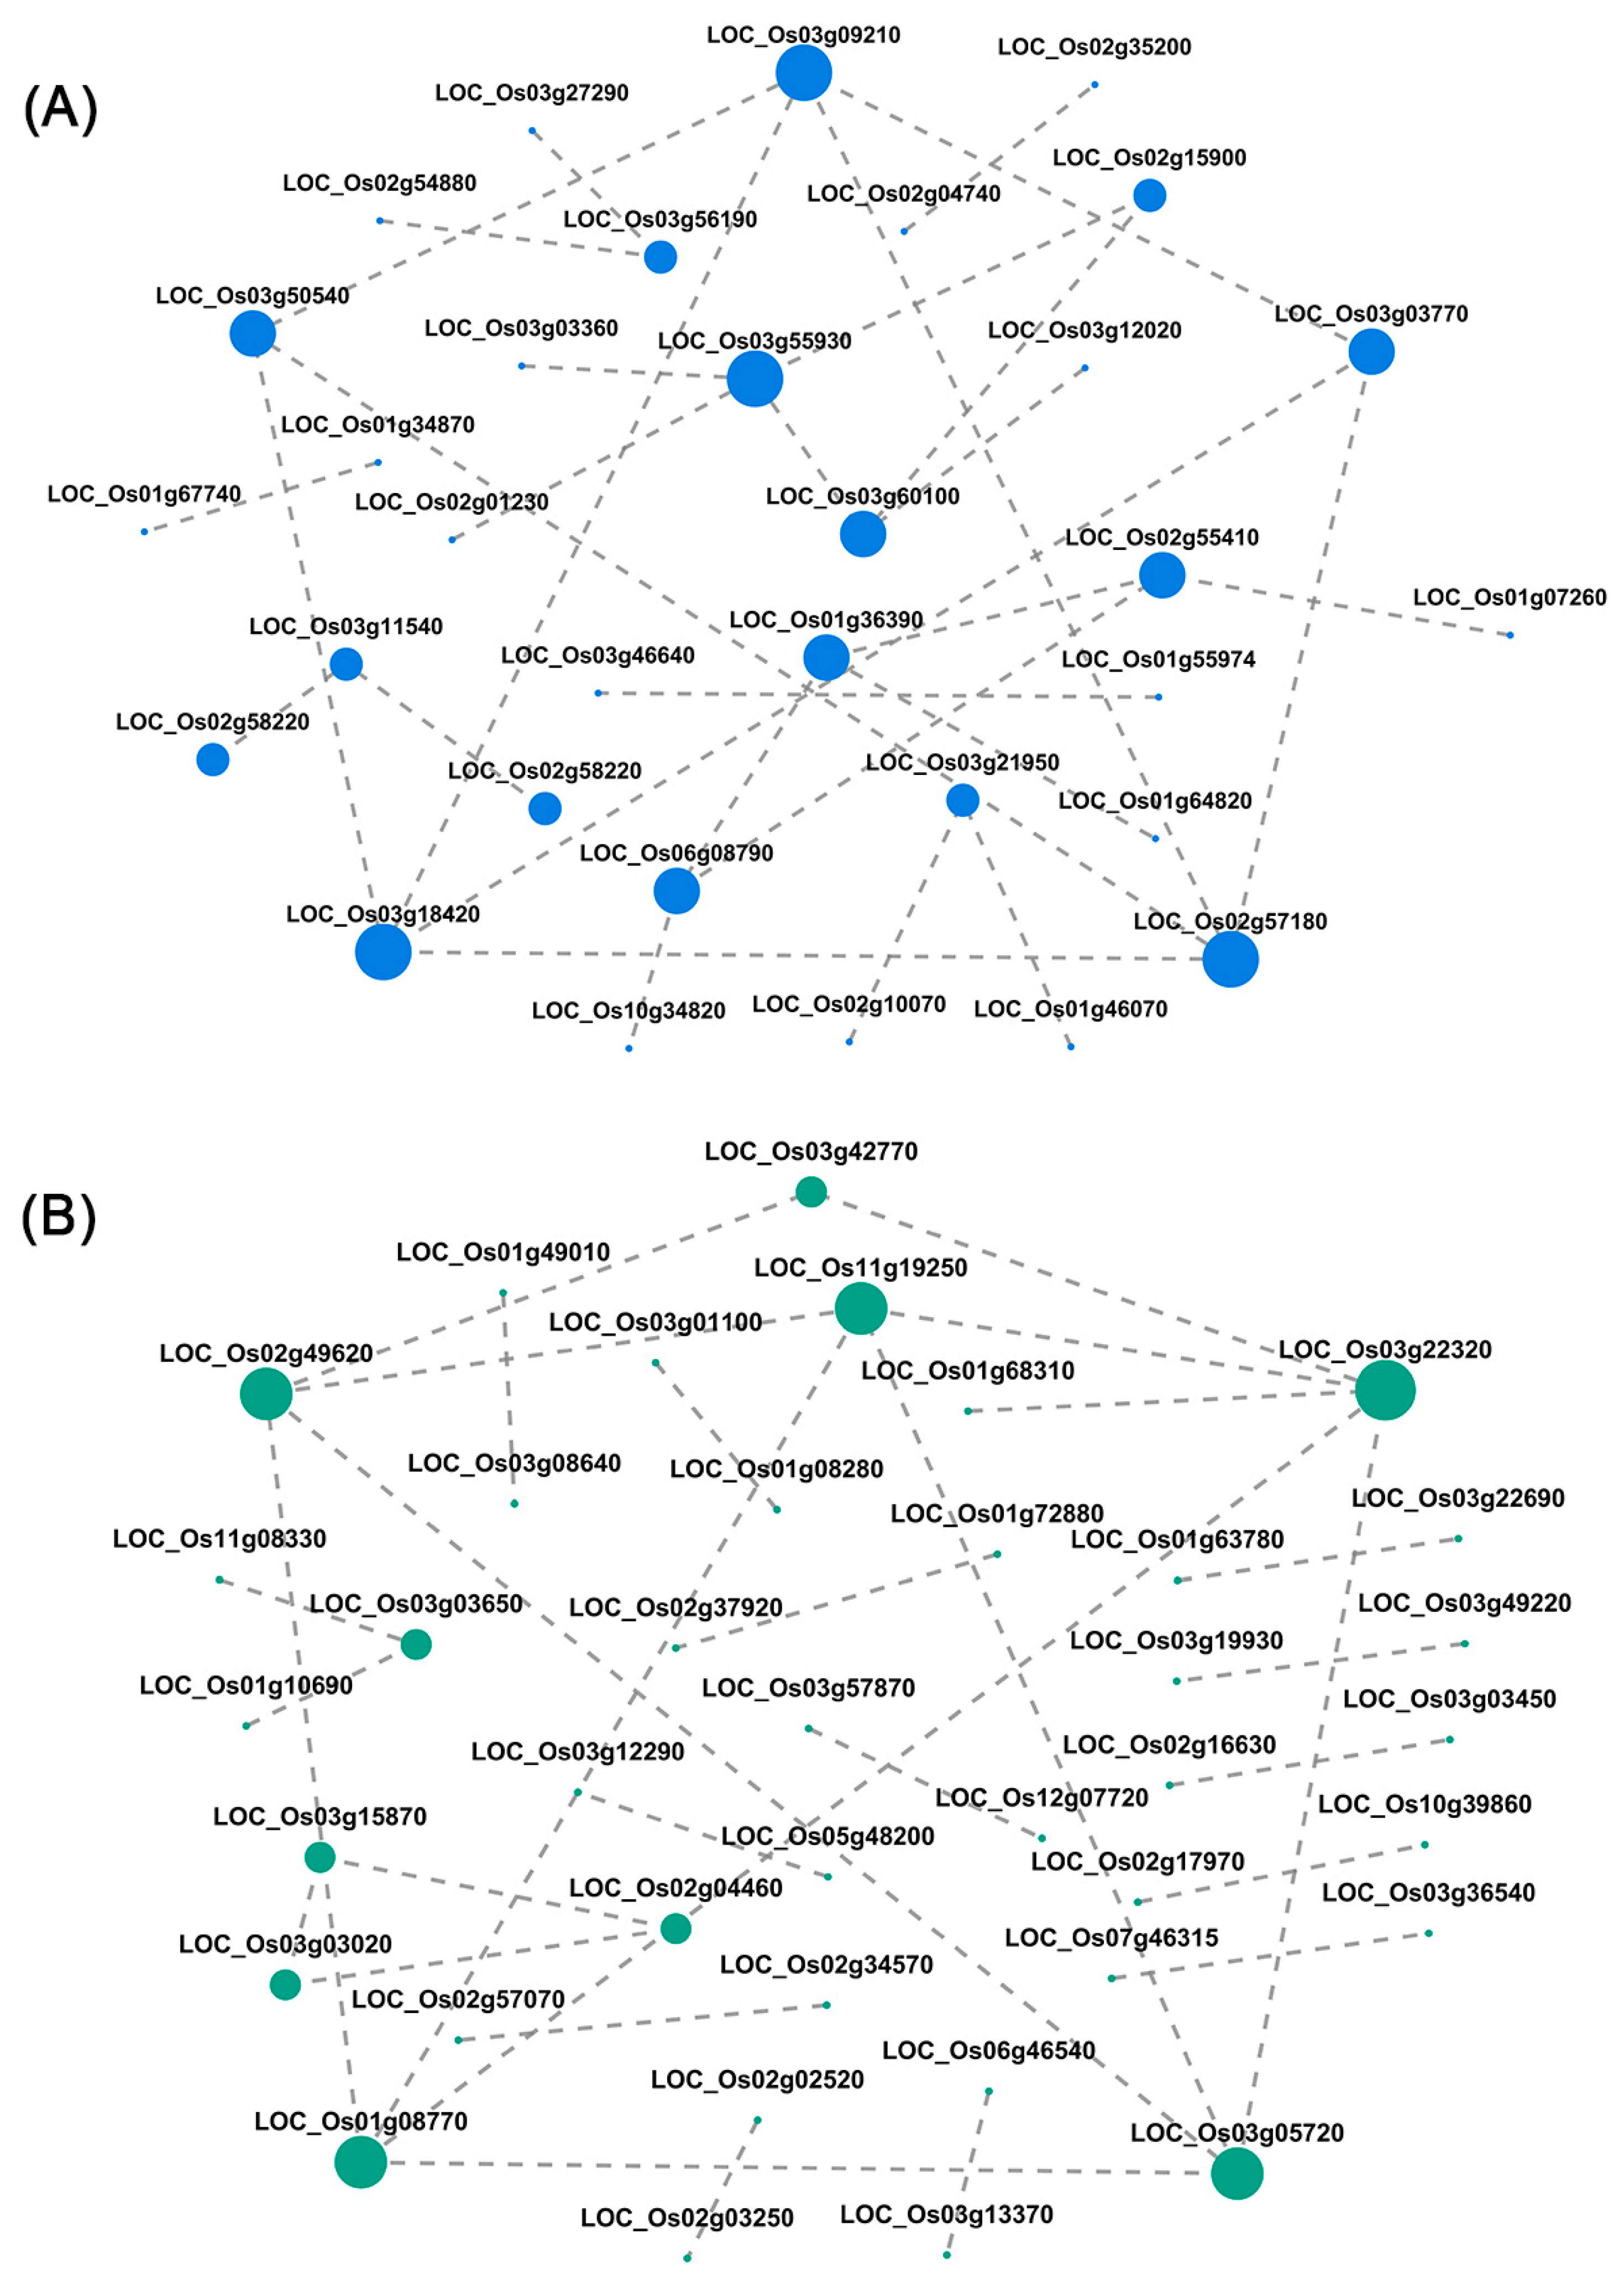
3.6. Hub Gene Network Interactions in Target Modules

Through gene regulatory network analysis, we screened highly connected hub genes, performed functional annotation (Table 6), and found that the hub genes of the two modules were enriched in the “oxidative phosphorylation (map00190)” and “eukaryotic ribosome biogenesis (map03008)” pathways, which were closely related to the N response phenotype. The five hub genes in the Blue module are all annotated to the oxidative phosphorylation pathway (map00190) (Figure 3A), encoding components of mitochondrial respiratory chain complex I: LOC_Os03g09210 is a NADH dehydrogenase subunit located in the mitochondrial inner membrane, LOC_Os03g50540 contains a 2Fe-2S domain and participates in ATP synthesis coupled electron transfer, LOC_Os03g18420 mediates mitochondrial electron transfer, LOC_Os02g57180 participates in ubiquinone synthesis, and LOC_Os03g03770 has NADH dehydrogenase activity and is located in the membrane space; this pathway generates ATP through electron transfer to provide energy for N metabolism, and hub genes act as key metabolic nodes to regulate energy homeostasis. The five hub genes of the Turquoise module are associated with the ribosome biogenesis pathway (map03008) (Figure 3B) and are involved in ribosome small subunit processing (LOC_Os11g19250 has GTPase activity and U3 snoRNA binding activity), assembly (LOC_Os02g49620), processing body function (LOC_Os01g08770, LOC_Os03g22320), and rRNA modification (LOC_Os03g05720 through snoRNA binding). They adapt to the protein synthesis requirements under N changes by regulating ribosome generation, and some genes have both metabolic node and regulatory protein functions. In summary, the hub genes of the Blue module support N transport through energy metabolism, and the Turquoise module coordinates protein synthesis through ribosome biogenesis, providing key targets for analyzing the mechanism of rice root adaptation to N density interaction.

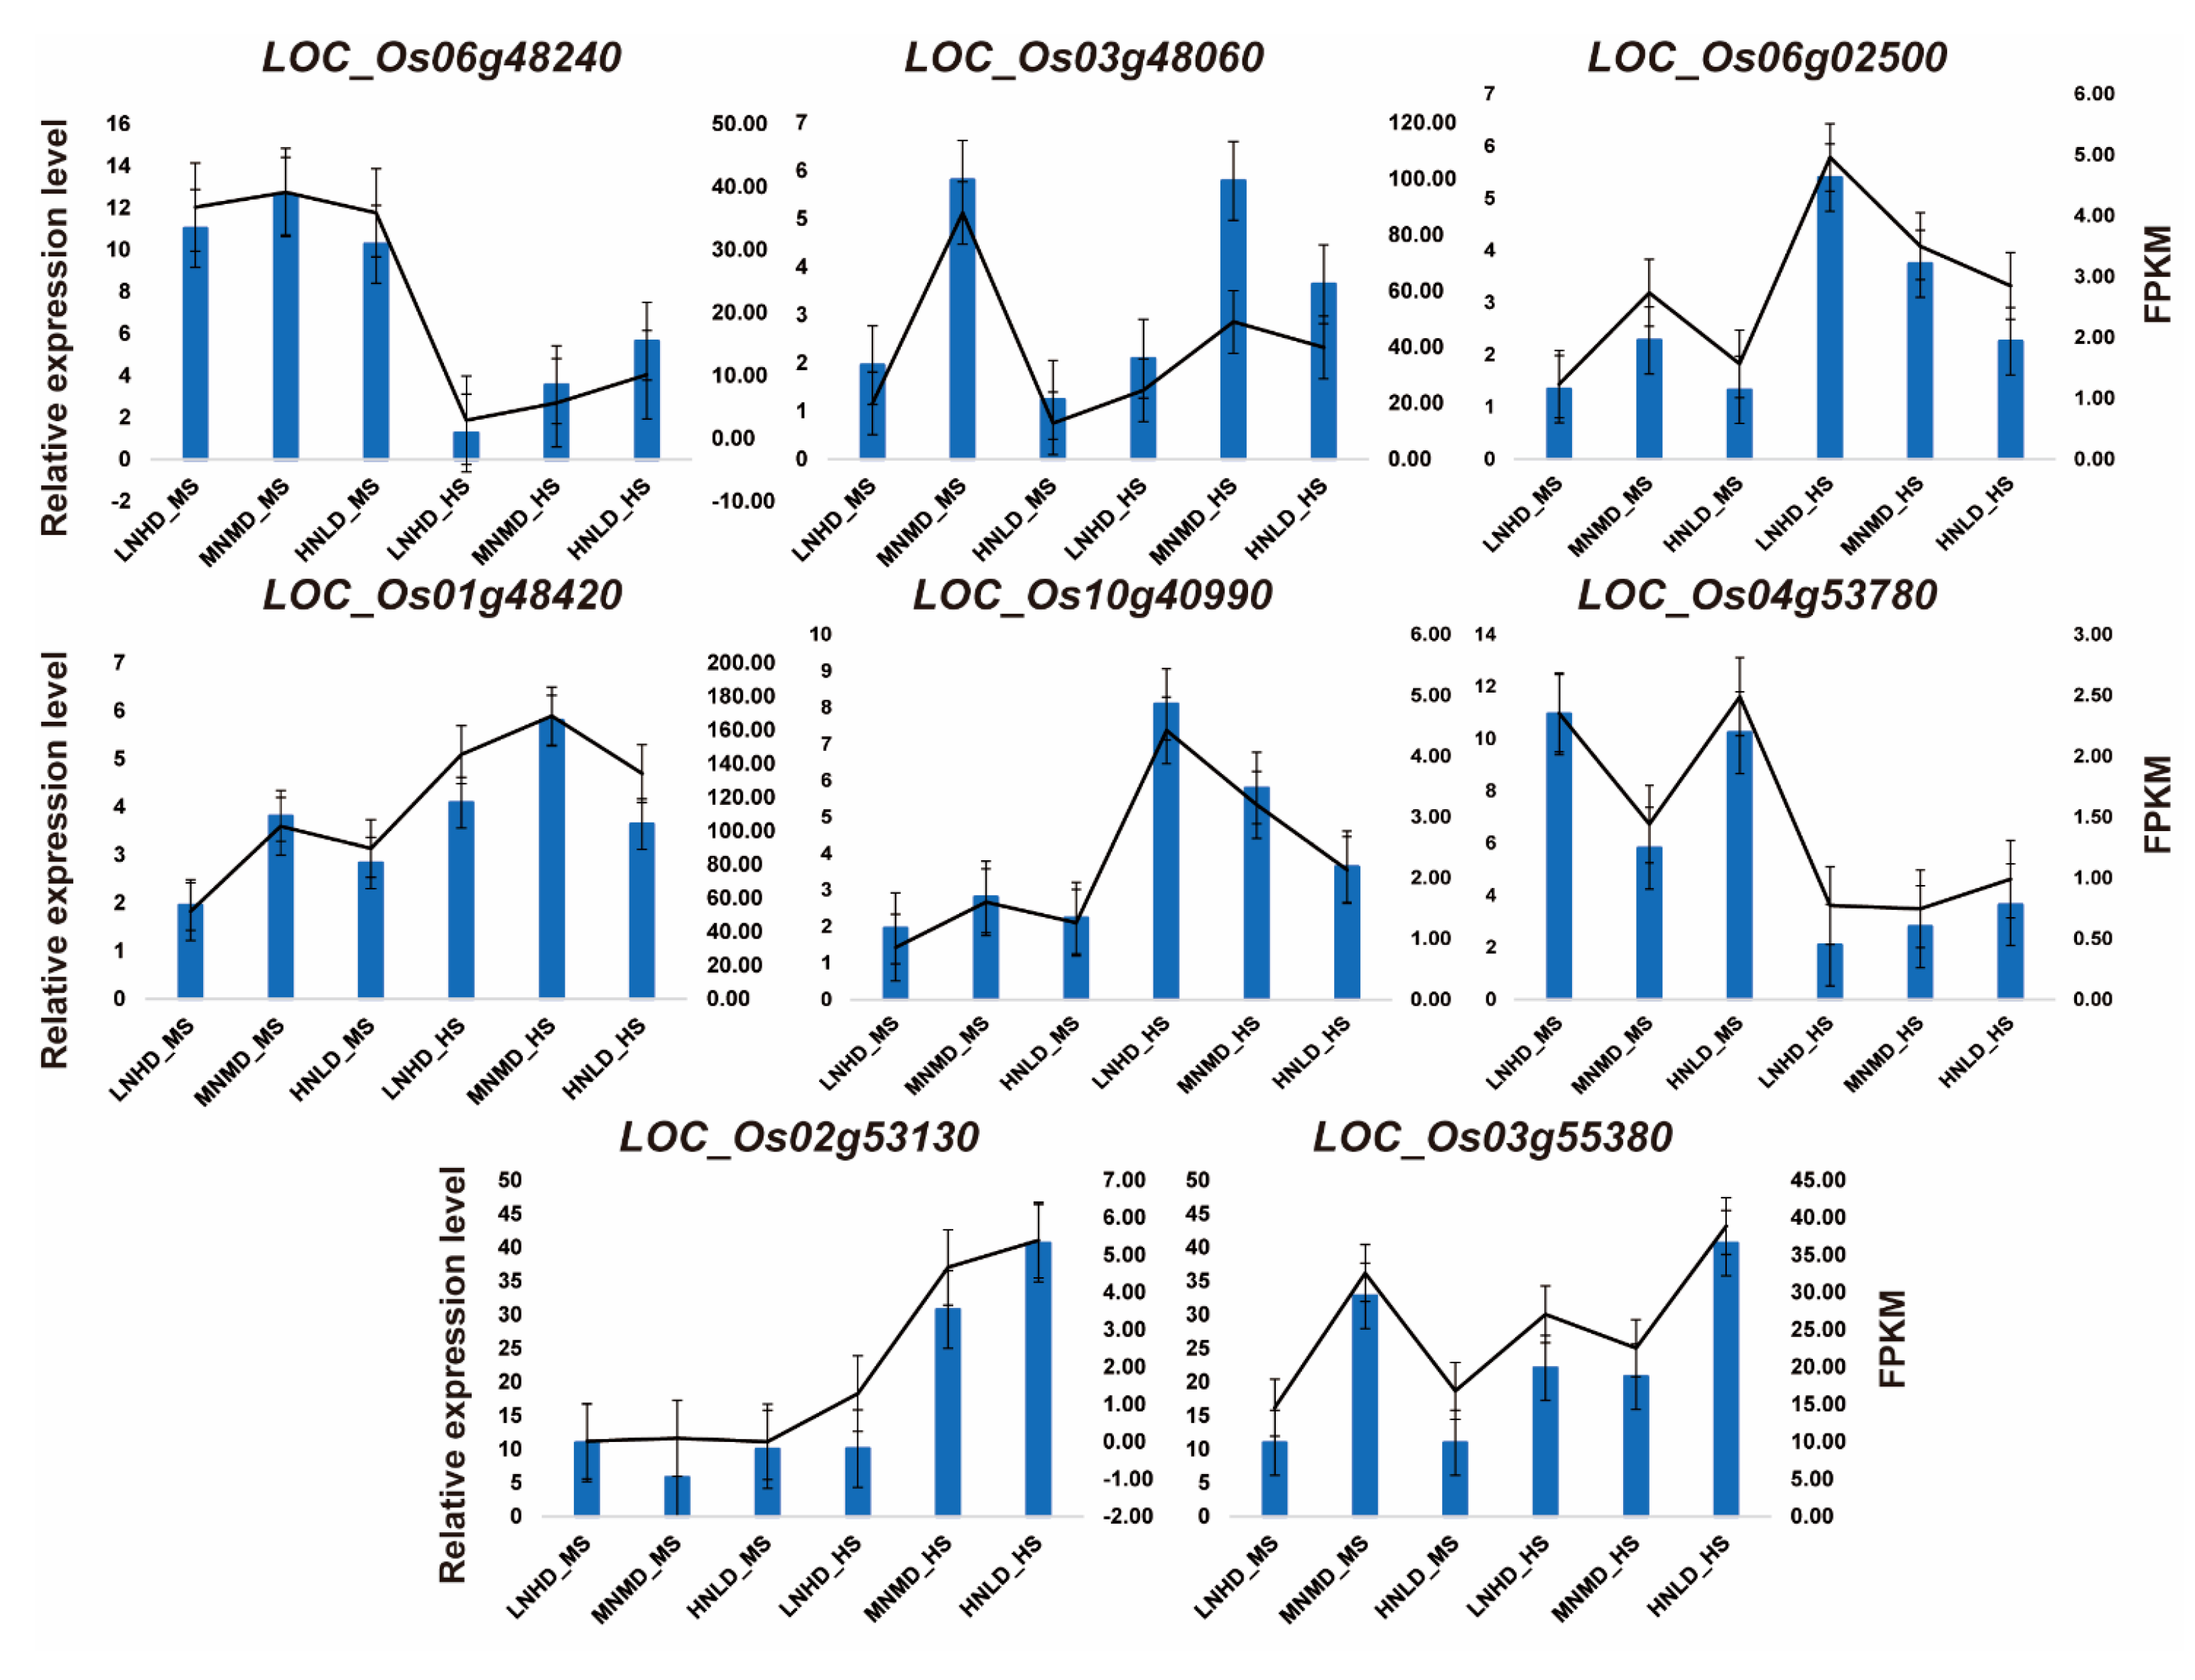
3.7. RT-qPCR Validates Hub Genes

The hub genes in the Turquoise and Blue modules that were most closely related to antioxidant properties and energy metabolism were selected for RT-qPCR validation. The expression trends observed during verification aligned closely with those derived from transcriptome sequencing (Table 5, Figure 4), further supporting the reliability of the sequencing results. We found that hub genes such as LOC_Os06g48240, LOC_Os03g48060, and LOC_Os06g02500 were significantly regulated in a N dose-dependent manner: LOC_Os06g48240 was up-regulated 4.2-fold under HNLD_HS, while LOC_Os10g40990 was gradually up-regulated 3.8-fold in treatments from MNMD_HS to HNLD_HS. LOC_Os06g02500 (NADH dehydrogenase) showed a density-responsive pattern, with its expression level under LNHD being 58% lower than that under HNLD at maturity.

4. Discussion

The N use efficiency and growth development of crops are significantly affected by the amount of N fertilizer applied and transplanting density [25]. Specific N application rate and planting density can effectively increase the activity of N metabolism-related enzymes, thereby improving N utilization efficiency [26]. In this study, the WGCNA-derived co-expression network revealed two key regulatory modules (Turquoise and Blue) that were functionally enriched in N compound metabolism, the oxidoreductase-mediated antioxidant system, and the ATP-dependent energy transduction mechanism (Table 1, Figure 3).
In the Turquoise module, LOC_Os02g53130 and LOC_Os11g19250 were enriched in the regulation of N compound metabolism. The glutamine synthetase (GS) homologous gene (LOC_Os11g19250) has the same N assimilation function as maize GS1;1 [27] and rapeseed NAGs [28]. The glutamine metabolism process (GO:0006541) involved in it constitutes a N absorption–assimilation network together with nitrate transporters NRT2.2/2.5 (maize) and NRT1.1 (ryegrass) [29]. Notably, these genes were significantly up-regulated under high N/low density (HNLD) treatment, which was consistent with the higher glutamine synthase (GR) activity and higher Ndff (N derived from fertilizer) exhibited by the HNLD treatment group at maturity in our previous study [24], indicating that the key genes in the Turquoise module may be directly involved in regulating N absorption efficiency under high N conditions. In addition, some studies have directed the expression of GS genes in the root system through promoter engineering to further enhance N absorption capacity, which provides a precedent for the application of LOC_Os11g19250 in rice improvement [30].
High planting density affects the antioxidant enzyme activities of rice [8]. This study found that pathways related to antioxidant properties are enriched in the Turquoise module and Blue module, and a total of six hub genes are closely related to these pathways. These findings further demonstrate that antioxidant enzyme activities in soil will change significantly under different N fertilizer application rates and planting densities. Blue module hub genes such as LOC_Os03g09210 (peroxidase POD43) and LOC_Os03g50540 (glutathione peroxidase GPX8) are enriched in peroxidase activity and redox homeostasis pathways. Among them, POD43 is induced to scavenge hydrogen peroxide under low N conditions [31], and a high expression of GPX8 is associated with reduced lipid peroxidation levels in high-density roots [8]. These genes maintain redox homeostasis by regulating peroxidase (POD) activity, and their ROS scavenging mechanism is highly conserved with maize POD38 [27]. In addition, oxidative phosphorylation-related genes enriched in the Blue module were expressed at higher levels under medium N/medium density (MNMD) and low N/high density (LNHD) treatments, which was consistent with the higher dehydrogenase (DHA) activity and poorer root morphology observed under these two treatments [24]. The NADH dehydrogenase encoded by LOC_Os03g09210 is a core component of the mitochondrial electron transport chain, which is closely coupled to energy metabolism and N assimilation. Based on previous studies on tissue-specific expression strategies of homologous ribosomal genes in quinoa [32], it is possible to consider using a root-specific promoter in rice to limit the expression of LOC_Os03g09210 in the root system to promote the coordination of root energy supply and N absorption. In future work, CRISPR/Cas9 can be used to verify the function of LOC_Os03g09210, and different density and N allocation patterns can be simulated in the field to evaluate its effect on improving yield and N use efficiency.
Similarly, in the transcriptome and metabolome analysis of the N regulatory mechanism of quinoa seedlings, it was found that differential genes in the arginine biosynthesis and flavonoid biosynthesis pathways were significantly enriched [30]. Our previous research also showed that the contents of flavonoids and phenolic metabolites changed significantly under different N fertilizer dosages and planting density treatments [33]. In this study, the Turquoise module enriched pathways related to the flavonoid metabolic process, further confirming that the increase in planting density has a significant impact on the total flavonoid content and changes [34].
The density-dependent regulation of total soluble solids (TSS) accumulation shows a non-linear relationship with planting density—moderately dense planting can enhance carbohydrate reserves, while overcrowding triggers a metabolic trade-off [35]. This phenomenon aligns with our transcriptomic findings showing that N supplementation enhances starch biosynthesis genes while simultaneously activating carbohydrate catabolic pathways [36]. Excessive N input leads to an abnormal up-regulation of N assimilation enzymes, forming a metabolic bottleneck and prompting photosynthetic products to shift from grain filling to N metabolism [37]. On this basis, this study further found that the ATP-binding gene LOC_Os03g22320 in the Turquoise module activates NADH dehydrogenase in ryegrass [29] and maize glycolysis genes, providing energy support for N transport via oxidative phosphorylation (GO:00190) and carbohydrate catabolism (GO:0016052). Therefore, in the future, we can study the protein interaction between LOC_Os03g22320 and N transporters to analyze its molecular switch mechanism in energy–N metabolism coupling.
Unlike de novo methods, which are prone to assembly errors in low-expressed/long CDS genes, our strategy ensured accurate gene expression quantification and reliable WGCNA modules. This reduced detection bias, enabling precise identification of hub genes in N metabolism and antioxidant pathways [16,17,18,19,20,21,22,23,24,25,26,27,28,29,30,31,32,33,34,35,36,37,38]. While de novo approaches suit non-models, reference-based methods offer superior accuracy for rice, enhancing mechanistic insights into N density interactions. This study uses the japonica rice variety “Hongyang 5” as the material, focusing on analyzing the differences in gene modules under different treatments under the interaction of the N level and planting density. Although the transcriptome analysis of a single variety is limited to a specific genetic background, it accurately captures the differences in molecular responses caused by environmental treatments by controlling genetic variables. Functional items, such as “N compound metabolism regulation” and “oxidoreductase activity”, that were enriched in the module have universal biological significance in the response of rice to changes in the N environment, and the relevant modules provide candidate gene sets for cross-variety functional verification. In the future, the universality and specificity of the molecular mechanism of N density interaction can be analyzed through multi-variety comparisons or genetic transformation experiments, providing theoretical support for the improvement of rice N-efficient varieties and precision fertilization.

5. Conclusions

Through weighted gene co-expression network analysis (WGCNA), this study revealed gene modules exhibiting robust correlations with N metabolism, redox homeostasis, and energy transduction pathways. Our integrative analysis prioritized the Turquoise and Blue modules, which displayed the highest connectivity to target agronomic traits, pinpointing 10 hub genes (LOC_Os03g09210, LOC_Os03g50540, LOC_Os03g18420, LOC_Os02g57180, LOC_Os03g03770, LOC_Os11g19250, LOC_Os02g49620, LOC_Os01g08770, LOC_Os03g22320, and LOC_Os03g05720) as central regulators of N assimilation efficiency. The hub genes identified through systematic screening in this study are significantly enriched in biological processes such as N metabolism, antioxidant defense, and energy metabolism, revealing the molecular regulatory network of crop response to N nutrition and planting density, and, at the same time, providing important theoretical support for N fertilizer management, population quality optimization, and variety breeding in precision agriculture.

Supplementary Materials

The following supporting information can be downloaded at https://www.mdpi.com/article/10.3390/agronomy15061429/s1, Table S1: Primer sequences for real-time fluorescence quantitative PCR; Table S2: Details of expression differences between HNLD_MS vs. HNLD_HS groups; Table S3: Details of expression differences between LNHD_MS vs. LNHD_HS groups; Table S4: Details of expression differences between MNMD_MS vs. MNMD_HS groups; Table S5: Details of expression differences between HNLD_MS vs. MNMD_MS groups; Table S6: Details of expression differences between HNLD_MS vs. LNHD_MS groups; Table S7: Details of expression differences between HNLD_HS vs. LNHD_HS groups; Table S8: Details of expression differences between LNHD_MS vs. MNMD_MS groups; Table S9: Details of expression differences between HNLD_HS vs. MNMD_HS groups; Table S10: Details of expression differences between LNHD_HS vs. MNMD_HS group.

Author Contributions

Conceptualization, Data curation, Writing—original draft, R.W. and Q.Z.; Resources, Project administration, Writing—review and editing, H.W. and Q.X. Accountability confirmation. All authors have read and agreed to the published version of the manuscript.

Funding

This work was supported by the Postgraduate Research & Practice Innovation Program of Jiangsu Province (KYCX25_4018), the Jiangxi Provincial Water Resources Department Science and Technology Project (202425YBKT17), the Natural Science Foundation of Jiangxi (20242BAB20263), and the Priority Academic Program Development of Jiangsu Higher Education Institutions (PAPD).

Institutional Review Board Statement

Not applicable.

Informed Consent Statement

Not applicable.

Data Availability Statement

Sequencing data for this project has been deposited in the Genome Sequence Archive of the Big Data Center at the Beijing Institute of Genomics (BIG), Chinese Academy of Sciences (http://bigd.big.ac.cn); the archive number is CRA008896.

Acknowledgments

The authors would like to thank the College of Agriculture of Yangzhou University for supporting the experimental site and laboratory.

Conflicts of Interest

The authors declare that there is no conflict of interest.

Abbreviations

The following abbreviations are used in this manuscript:
NNitrogen
HNLDHigh N/low density
HNLD_MSHigh N/low density maturity stage
HNLD_HSHigh N/low density heading stage
MNMDMedium N/medium density
MNMD_MSMedium N/medium density maturity stage
MNMD_HSMedium N/medium density heading stage
LNHDLow N/high density
LNHD_MSLow N/high density maturity stage
LNHD_HSLow N/high density heading stage
TSSTotal soluble solids
GOGene Ontology
KEGGKyoto Encyclopedia of Genes and Genomes
COGCluster of orthologous groups
NRNon-redundant protein database
Swiss-ProtSwiss protein database
PfamProtein families database
NRNitrate reductase activity
GS Glutamine synthetase activity
NIRNitrite reductase activity
GOGATGlutamate synthase activity
GDHGlutamate dehydrogenase activity
DHADehydrogenase activity
RLRoot length
RSARoot surface area
RVRoot volume
RADRoot average diameter
NdffNitrogen derived from fertilizer

References

  1. Ma, B.; Karimi, M.S.; Mohammed, K.S.; Shahzadi, I.; Dai, J. Nexus between climate change, agricultural output, fertilizer use, agriculture soil emissions: Novel implications in the context of environmental management. J. Clean. Prod. 2024, 450, 141801. [Google Scholar] [CrossRef]
  2. Sabina, R.; Paul, J.; Sharma, S.; Hussain, N. Synthetic Nitrogen Fertilizer Pollution: Global Concerns and Sustainable Mitigating Approaches. In Agricultural Nutrient Pollution and Climate Change: Challenges and Opportunities; Springer: Berlin/Heidelberg, Germany, 2025; pp. 57–101. [Google Scholar] [CrossRef]
  3. Sher, A.; Zhang, L.G.; Noor, M.A.; Nadeem, M.; Ashraf, U.; Baloch, S.K.; Ameen, A.; Yuan, X.Y.; Guo, P.Y. Nitrogen use efficiency in cereals under high plant density: Manufacturing, management strategies and future prospects. Appl. Ecol. Environ. Res. 2019, 17, 10139. [Google Scholar] [CrossRef]
  4. Murchie, E.H.; Burgess, A.J. Casting light on the architecture of crop yield. Crop Environ. 2022, 1, 74–85. [Google Scholar] [CrossRef]
  5. Zhu, H.; Wen, T.; Sun, M.; Ali, I.; Sheteiwy, M.S.; Wahab, A.; Tan, W.; Wen, C.; He, X.; Wang, X. Enhancing rice yield and nitrogen utilization efficiency through optimal planting density and reduced nitrogen rates. Agronomy 2023, 13, 1387. [Google Scholar] [CrossRef]
  6. Wei, J.; Chai, Q.; Yin, W.; Fan, H.; Guo, Y.; Hu, F.; Fan, Z.; Wang, Q. Grain yield and N uptake of maize in response to increased plant density under reduced water and nitrogen supply conditions. J. Integr. Agric. 2024, 23, 122–140. [Google Scholar] [CrossRef]
  7. Ajmera, I.; Henry, A.; Radanielson, A.M.; Klein, S.P.; Ianevski, A.; Bennett, M.J.; Band, L.R.; Lynch, J.P. Integrated root phenotypes for improved rice performance under low nitrogen availability. Plant Cell Environ. 2022, 45, 805–822. [Google Scholar] [CrossRef]
  8. Wang, W.; Shen, C.; Xu, Q.; Zafar, S.; Du, B.; Xing, D. Grain yield, nitrogen use efficiency and antioxidant enzymes of rice under different fertilizer n inputs and planting density. Agronomy 2022, 12, 430. [Google Scholar] [CrossRef]
  9. Chen, L.; Xie, H.; Wang, G.; Qian, X.; Wang, W.; Xu, Y.; Zhang, W.; Zhang, H.; Liu, L.; Wang, Z. Reducing environmental risk by improving crop management practices at high crop yield levels. Field Crops Res. 2021, 265, 108123. [Google Scholar] [CrossRef]
  10. Satrio, R.D.; Fendiyanto, M.H.; Miftahudin, M. Tools and Techniques Used at Global Scale Through Genomics, Transcriptomics, Proteomics, and Metabolomics to Investigate Plant Stress Responses at the Molecular Level. In Molecular Dynamics of Plant Stress and Its Management; Springer: Berlin/Heidelberg, Germany, 2024; pp. 555–607. [Google Scholar] [CrossRef]
  11. Haq, S.A.U.; Bashir, T.; Roberts, T.H.; Husaini, A.M. Ameliorating the effects of multiple stresses on agronomic traits in crops: Modern biotechnological and omics approaches. Mol. Biol. Rep. 2024, 51, 41. [Google Scholar] [CrossRef]
  12. Li, Q.; Lu, X.; Wang, C.; Shen, L.; Dai, L.; He, J.; Yang, L.; Li, P.; Hong, Y.; Zhang, Q. Genome-wide association study and transcriptome analysis reveal new QTL and candidate genes for nitrogen-deficiency tolerance in rice. Crop J. 2022, 10, 942–951. [Google Scholar] [CrossRef]
  13. Langfelder, P.; Horvath, S. WGCNA: An R package for weighted correlation network analysis. BMC Bioinform. 2008, 9, 559. [Google Scholar] [CrossRef] [PubMed]
  14. Wang, F.; Wang, Y.; Ying, L.; Lu, H.; Liu, Y.; Liu, Y.; Xu, J.; Wu, Y.; Mo, X.; Wu, Z. Integrated transcriptomic analysis identifies coordinated responses to nitrogen and phosphate deficiency in rice. Front. Plant Sci. 2023, 14, 1164441. [Google Scholar] [CrossRef] [PubMed]
  15. Li, J.; Liu, X.; Xu, L.; Li, W.; Yao, Q.; Yin, X.; Wang, Q.; Tan, W.; Xing, W.; Liu, D. Low nitrogen stress-induced transcriptome changes revealed the molecular response and tolerance characteristics in maintaining the C/N balance of sugar beet (Beta vulgaris L.). Front. Plant Sci. 2023, 14, 1164151. [Google Scholar] [CrossRef]
  16. Privitera, G.F.; Treccarichi, S.; Nicotra, R.; Branca, F.; Pulvirenti, A.; Piero, A.R.L.; Sicilia, A. Comparative transcriptome analysis of B. oleracea L. var. italica and B. macrocarpa Guss. genotypes under drought stress: De novo vs reference genome assembly. Plant Stress. 2024, 14, 100657. [Google Scholar] [CrossRef]
  17. Raghavan, V.; Kraft, L.; Mesny, F.; Rigerte, L. A simple guide to de novo transcriptome assembly and annotation. Brief. Bioinform. 2022, 23, b563. [Google Scholar] [CrossRef] [PubMed]
  18. Paik, H.; Yoo, S.; Nam, H.; Stevenson, M.; No, A. DTMBIO 2020: The Fourteenth International Workshop on Data and Text Mining in Biomedical Informatics. In Proceedings of the 29th ACM International Conference on Information & Knowledge Management, Virtual, 23 October 2020; pp. 3537–3538. [Google Scholar] [CrossRef]
  19. Chen, S.; Zhou, Y.; Chen, Y.; Gu, J. fastp: An ultra-fast all-in-one FASTQ preprocessor. Bioinformatics 2018, 34, i884–i890. [Google Scholar] [CrossRef]
  20. Kim, D.; Langmead, B.; Salzberg, S.L. HISAT: A fast spliced aligner with low memory requirements. Nat. Methods 2015, 12, 357–360. [Google Scholar] [CrossRef]
  21. Pertea, M.; Pertea, G.M.; Antonescu, C.M.; Chang, T.; Mendell, J.T.; Salzberg, S.L. StringTie enables improved reconstruction of a transcriptome from RNA-seq reads. Nat. Biotechnol. 2015, 33, 290–295. [Google Scholar] [CrossRef]
  22. Robinson, M.D.; McCarthy, D.J.; Smyth, G.K. edgeR: A Bioconductor package for differential expression analysis of digital gene expression data. Bioinformatics 2010, 26, 139–140. [Google Scholar] [CrossRef]
  23. Livak, K.J.; Schmittgen, T.D. Analysis of relative gene expression data using real-time quantitative PCR and the 2−ΔΔCT method. Methods 2001, 25, 402–408. [Google Scholar] [CrossRef]
  24. Sun, C.; Lu, Y.; Tang, G.; Wang, R.; Wu, H.; Zhang, J.; Cai, S.; Zhu, J.; Xiong, Q. Integrated Metagenomics and 15N Isotope Tracing Reveal the Mechanisms Through which the Nitrogen-Planting Density Interaction Impacts Rice Root Nitrogen Uptake Efficiency. J. Soil Sci. Plant Nutr. 2024, 24, 1–14. [Google Scholar] [CrossRef]
  25. Zhu, X.; Zhang, J.; Zhang, Z.; Deng, A.; Zhang, W. Dense planting with less basal nitrogen fertilization might benefit rice cropping for high yield with less environmental impacts. Eur. J. Agron. 2016, 75, 50–59. [Google Scholar] [CrossRef]
  26. Fortunato, S.; Nigro, D.; Lasorella, C.; Marcotuli, I.; Gadaleta, A.; de Pinto, M.C. The role of glutamine synthetase (GS) and glutamate synthase (GOGAT) in the Improvement of nitrogen use efficiency in cereals. Biomolecules 2023, 13, 1771. [Google Scholar] [CrossRef] [PubMed]
  27. Singh, P.; Kumar, K.; Jha, A.K.; Yadava, P.; Pal, M.; Rakshit, S.; Singh, I. Global gene expression profiling under nitrogen stress identifies key genes involved in nitrogen stress adaptation in maize (Zea mays L.). Sci. Rep. 2022, 12, 4211. [Google Scholar] [CrossRef] [PubMed]
  28. Platzer, M.; Kiese, S.; Asam, T.; Schneider, F.; Tybussek, T.; Herfellner, T.; Schweiggert-Weisz, U.; Eisner, P. Quantitative Structure-Property Relationship (QSPR) of Plant Phenolic Compounds in Rapeseed Oil and Comparison of Antioxidant Measurement Methods. Processes 2022, 10, 1281. [Google Scholar] [CrossRef]
  29. Li, Y.; Wang, M.; Teng, K.; Dong, D.; Liu, Z.; Zhang, T.; Han, L. Transcriptome profiling revealed candidate genes, pathways and transcription factors related to nitrogen utilization and excessive nitrogen stress in perennial ryegrass. Sci. Rep. 2022, 12, 3353. [Google Scholar] [CrossRef]
  30. Li, H.; Wang, Q.; Huang, T.; Liu, J.; Zhang, P.; Li, L.; Xie, H.; Wang, H.; Liu, C.; Qin, P. Transcriptome and Metabolome Analyses Reveal Mechanisms Underlying the Response of Quinoa Seedlings to Nitrogen Fertilizers. Int. J. Mol. Sci. 2023, 24, 11580. [Google Scholar] [CrossRef]
  31. Liao, G.; Yang, Y.; Xiao, W.; Mo, Z. Nitrogen modulates grain yield, nitrogen metabolism, and antioxidant response in different rice genotypes. J. Plant Growth Regul. 2023, 42, 2103–2114. [Google Scholar] [CrossRef]
  32. Brooks, E.G.; Elorriaga, E.; Liu, Y.; Duduit, J.R.; Yuan, G.; Tsai, C.; Tuskan, G.A.; Ranney, T.G.; Yang, X.; Liu, W. Plant promoters and terminators for high-precision bioengineering. BioDesign Res. 2023, 5, 13. [Google Scholar] [CrossRef]
  33. Xiong, Q.; Sun, C.; Shi, H.; Cai, S.; Xie, H.; Liu, F.; Zhu, J. Analysis of related metabolites affecting taste values in rice under different nitrogen fertilizer amounts and planting densities. Foods 2022, 11, 1508. [Google Scholar] [CrossRef]
  34. Wu, L.; Deng, Z.; Cao, L.; Meng, L. Effect of plant density on yield and quality of perilla sprouts. Sci. Rep. 2020, 10, 9937. [Google Scholar] [CrossRef] [PubMed]
  35. Mishra, B.S.; Sharma, M.; Laxmi, A. Role of sugar and auxin crosstalk in plant growth and development. Physiol. Plantarum 2022, 174, e13546. [Google Scholar] [CrossRef] [PubMed]
  36. Ullah, A.; Zhao, C.; Zhang, M.; Sun, C.; Liu, X.; Hu, J.; Zeeshan, M.; Zaid, A.; Dai, T.; Tian, Z. Nitrogen enhances the effect of pre-drought priming against post-anthesis drought stress by regulating starch and protein formation in wheat. Physiol. Plantarum 2023, 175, e13907. [Google Scholar] [CrossRef] [PubMed]
  37. Effah, Z.; Li, L.; Xie, J.; Liu, C.; Xu, A.; Karikari, B.; Anwar, S.; Zeng, M. Regulation of nitrogen metabolism, photosynthetic activity, and yield attributes of spring wheat by nitrogen fertilizer in the semi-arid loess plateau region. J. Plant Growth Regul. 2023, 42, 1120–1133. [Google Scholar] [CrossRef]
  38. Lee, S.; Na, D.; Park, C. Comparability of reference-based and reference-free transcriptome analysis approaches at the gene expression level. BMC Bioinform. 2021, 22, 310. [Google Scholar] [CrossRef]
Figure 1. Multidimensional data analysis and exploration of inter-sample relationships. (A) PCA plot for samples. The separation between every sample point reflects the sample-to-sample distance. A shorter distance implies a greater similarity between samples. In the two-dimensional plot, the x-axis shows the contribution of principal component 1 (PC1) in differentiating samples, while the y-axis shows the contribution of principal component 2 (PC2) in differentiating samples. (B) Scale independence. The x-axis denotes the power-weighted β value. The y-axis represents the goodness-of-fit R2 of the adjacency matrix transformed with the corresponding β value and the scale-free network hypothesis. A larger R2 indicates that the network more closely adheres to the scale-free distribution. The horizontal axis is “Soft Threshold (power)” with values ranging from 1 to 20. This series of numbers represents the different soft thresholds (soft-thresholding powers) selected in WGCNA, which are used to calculate the scale-free topological fit and average connectivity of the weighted network, the same below. (C) Mean connectivity. The x-axis stands for the power-weighted β value. The y-axis represents the average connectivity (k/degree/connectivity) of each node in the network represented by the adjacency matrix transformed with the corresponding β value. (D) Venn distribution plot for each sample. Circles of diverse colors symbolize genes/transcripts selected based on expression in a sample/group, and the figures indicate the quantity of common and distinct genes/transcripts between different samples/groups. (E) Venn distribution diagram for each comparison group. Circles of different colors represent various gene sets, and the values represent the number of common and unique genes/transcripts among different gene sets.
Agronomy 15 01429 g001
Figure 2. Modular data analysis and phenotypic association exploration. (A) Expression level difference statistics. (B) Module correlation diagram. (C) Module and phenotype correlation analysis diagram. Note: RL (root length); RSA (root surface area); RV (root volume); RAD (root average diameter); NR (nitrate reductase activity); GS (glutamine synthetase activity); NIR (nitrite reductase activity); GOGAT (glutamate synthase activity); GDH (glutamate dehydrogenase activity); DHA (dehydrogenase activity). In the correlation analysis chart, the darker the color, the stronger the correlation.
Agronomy 15 01429 g002
Figure 3. Visualization of gene co-expression networks. (A) Blue module. (B) Turquoise module. The circular nodes represent genes, and the edges represent the interaction between two genes/transcripts. The size of the node is proportional to the connectivity of the node.
Agronomy 15 01429 g003
Figure 4. RT-qPCR was used to analyze gene expression. The x-axis stands for various time points. The left y-axis denotes the relative expression levels of genes, which are presented in the form of bars. Meanwhile, the right y-axis indicates the fragments per kilobase million values, depicted as lines.
Agronomy 15 01429 g004
Table 1. Gene and transcript annotation for functional database.
DatabaseExpre_Gene Number (%)Expre_Transcript Number (%)All_Gene Number (%)All_Transcript Number (%)
GO30,731 (0.8003)38,610 (0.8131)41,843 (0.7474)50,705 (0.7643)
KEGG11,132 (0.2899)15,482 (0.326)12,549 (0.2241)17,342 (0.2614)
COG31,543 (0.8215)40,291 (0.8485)40,390 (0.7214)50,157 (0.7561)
NR38,206 (0.995)47,297 (0.996)55,224 (0.9864)65,564 (0.9883)
Swiss-Prot25,139 (0.6547)32,671 (0.688)29,796 (0.5322)38,156 (0.5752)
Pfam29,373 (0.765)36,945 (0.778)36,944 (0.6599)45,409 (0.6845)
Total_anno38,214 (0.9952)47,307 (0.9962)55,235 (0.9866)65,577 (0.9885)
Total38,398 (1.0)47,486 (1.0)55,986 (1)66,338 (1)
Table 2. Sequencing comparison results statistics.
SampleTotal ReadsTotal MappedMultiple MappedUniquely Mapped
LNHD_MS343,788,196.00 40,563,536 (92.64%)1,027,295 (2.35%)39,536,241 (90.29%)
LNHD_MS244,738,918.00 42,442,486 (94.87%)1,123,167 (2.51%)41,319,319 (92.36%)
LNHD_MS141,543,966.00 36,536,385 (87.95%)982,550 (2.37%)35,553,835 (85.58%)
MNMD_MS344,271,468.00 41,234,659 (93.14%)978,466 (2.21%)40,256,193 (90.93%)
MNMD_MS243,717,944.00 41,367,829 (94.62%)1,000,154 (2.29%)40,367,675 (92.34%)
MNMD_MS144,407,378.00 41,329,139 (93.07%)878,963 (1.98%)40,450,176 (91.09%)
HNLD_MS342,980,190.00 40,655,624 (94.59%)1,112,703 (2.59%)39,542,921 (92.0%)
HNLD_MS244,741,482.00 42,198,136 (94.32%)1,153,670 (2.58%)41,044,466 (91.74%)
HNLD_MS143,808,086.00 41,100,507 (93.82%)1,103,059 (2.52%)39,997,448 (91.3%)
LNHD_HS345,854,996.00 43,976,160 (95.9%)1,294,726 (2.82%)42,681,434 (93.08%)
LNHD_HS245,247,476.00 43,222,035 (95.52%)1,211,992 (2.68%)42,010,043 (92.85%)
LNHD_HS153,822,518.00 51,136,296 (95.01%)1,336,284 (2.48%)49,800,012 (92.53%)
MNMD_HS345,275,630.00 43,062,454 (95.11%)1,077,873 (2.38%)41,984,581 (92.73%)
MNMD_HS244,707,566.00 42,658,057 (95.42%)1,184,548 (2.65%)41,473,509 (92.77%)
MNMD_HS154,236,202.00 52,204,495 (96.25%)1,486,009 (2.74%)50,718,486 (93.51%)
HNLD_HS342,556,750.00 37,092,719 (87.16%)994,379 (2.34%)36,098,340 (84.82%)
HNLD_HS245,492,090.00 43,733,711 (96.13%)1,030,136 (2.26%)42,703,575 (93.87%)
HNLD_HS146,356,536.00 44,754,616 (96.54%)1,042,874 (2.25%)43,711,742 (94.29%)
Table 3. Effects of each treatment on root morphological characteristics.
TreatmentRL (cm)RSA (cm2)RAD (mm)RV (cm3)
HNLD_HS301.50 ab4901.26 b0.48 cd60.59 b
MNMD_HS379.95 a4210.94 b0.44 d47.97 bc
LNHD_HS325.99 ab1621.40 cd0.51 abc32.38 c
HNLD_MS230.95 cd3139.84 a0.56 ab85.22 a
MNMD_MS264.17 c2199.35 c0.60 a83.52 a
LNHD_MS237.55 bcd881.64d0.54 abc71.9 b
Different lowercase letters indicate significant differences among treatments (p < 0.05).
Table 4. GO enrichment analysis.
GO IDDescriptionRatio_in_StudyRatio_in_Popp-Value
GO enrichment pathways between HNLD_HS and LNHD_HS
GO:0051171regulation of nitrogen compound metabolic process56/5852505/42,5230.000373735
GO enrichment pathways between HNLD_HS and MNMD_HS
GO:0016052carbohydrate catabolic process3/45339/42,5230.005563181
GO:0019203Carbohydrate phosphatase activity1/4546/42,5230.047562811
GO:0016491oxidoreductase activity7/452654/42,5230.020602351
GO enrichment pathways between LNHD_HS and MNMD_HS
GO:0016209antioxidant activity15/759303/42,5230.000411868
GO:0016052carbohydrate catabolic process16/759339/42,5230.000452965
GO:0005504fatty acid binding2/75920/42,5230.048897966
GO:0016491oxidoreductase activity75/7592654/42,5230.000101426
GO:1901698response to nitrogen compound5/75998/42,5230.031306244
GO enrichment pathways between HNLD_MS and LNHD_MS
GO:0016667oxidoreductase activity, acting on a sulfur group of donors3/145121/42,5230.00834102
GO:1901698response to nitrogen compound2/14598/42,5230.044368267
GO enrichment pathways between HNLD_MS and MNMD_MS
GO:0016209antioxidant activity26/1940303/42,5230.002075187
GO:0005524ATP binding341/19404929/42,5230.00000546
GO:0016052carbohydrate catabolic process30/1940339/42,5230.00056884
GO:0033759flavone synthase activity1/19401/42,5230.045622369
GO:0009812flavonoid metabolic process4/194023/42,5230.019098749
GO:0006541glutamine metabolic process7/194043/42,5230.003098179
GO:0016491oxidoreductase activity182/19402654/42,5230.00000369
GO enrichment pathways between LNHD_MS and MNMD_MS
GO:0016209antioxidant activity33/2162303/42,5230.0000549
GO:0005524ATP binding389/21624929/42,5230.00000609
GO:0016052carbohydrate catabolic process40/2162339/42,5230.00000234
GO:0009812flavonoid metabolic process4/216223/42,5230.02720865
GO:0006541glutamine metabolic process7/216243/42,5230.005604449
GO:0042744hydrogen peroxide catabolic process25/2162202/42,5230.0000642
GO:0016491oxidoreductase activity207/21622654/42,5230.00000473
GO enrichment pathways between HNLD_MS and HNLD_HS
GO:0006757ATP generation from ADP19/574372/42,5230.003029804
GO:0016052carbohydrate catabolic process92/5743339/42,5230.00000196
GO:0006631fatty acid metabolic process59/5743216/42,5230.00000194
GO:0051552flavone metabolic process2/57432/42,5230.018237463
GO:0009812flavonoid metabolic process10/574323/42,5230.000424699
GO:0006541glutamine metabolic process13/574343/42,5230.005375737
GO:0006096glycolytic process19/574372/42,5230.003029804
GO:0016491oxidoreductase activity557/57432654/42,5230.00000706
GO enrichment pathways between MNMD_MS and MNMD_HS
GO:0016209antioxidant activity59/4670303/42,5230.000012
GO:0005524ATP binding782/46704929/42,5230.00000914
GO:0016052carbohydrate catabolic process81/4670339/42,5230.00000188
GO:0006541glutamine metabolic process11/467043/42,5230.005660847
GO:0016491oxidoreductase activity429/46702654/42,5230.00000697
GO:0051171regulation of nitrogen compound metabolic process364/46702505/42,5230.00000621
GO enrichment pathways between LNHD_MS and LNHD_HS
GO:0005524ATP binding1053/62484929/42,5230.0000104
GO:0016051carbohydrate biosynthetic process105/6248339/42,5230.00000208
GO:0051552flavone metabolic process2/62482/42,5230.021586138
GO:0006541glutamine metabolic process14/624843/42,5230.00356955
GO:0006096glycolytic process24/624872/42,5230.0000682
GO:0016491oxidoreductase activity607/62482654/42,5230.00000754
Table 5. GO enrichment statistics of gene functions within the module.
Gene ModuleGO NumberFunctional ClassificationStudy Gene RatioReference Gene RatioEnrichment
p-Value
TurquoiseGO:0051173positive regulation of N compound metabolic process112/5133548/42,5230.00000328
TurquoiseGO:0051172negative regulation of N compound metabolic process69/5133317/42,5230.00000362
TurquoiseGO:0051171regulation of N compound metabolic process509/51332505/42,5230.00000697
TurquoiseGO:0005524ATP binding926/51334929/42,5230.00000985
TurquoiseGO:0016730oxidoreductase activity, acting on iron–sulfur proteins as donors4/513312/42,5230.047268181
BlueGO:0016684oxidoreductase activity, acting on peroxide as acceptor76/2886263/42,5230.00000164
BlueGO:0052716hydroquinone–oxygen oxidoreductase activity12/288636/42,5230.00000251
BlueGO:0016614oxidoreductase activity, acting on CH-OH group of donors46/2886322/42,5230.00000357
BlueGO:0016616oxidoreductase activity, acting on the CH-OH group of donors, NAD or NADP as acceptor40/2886268/42,5230.00000368
BlueGO:0016491oxidoreductase activity352/28862654/42,5230.00000527
BlueGO:0016651oxidoreductase activity, acting on NAD(P)H18/288694/42,5230.0000549
BlueGO:0016682oxidoreductase activity, acting on diphenols and related substances as donors, oxygen as acceptor14/288664/42,5230.0000808
BlueGO:0016679oxidoreductase activity, acting on diphenols and related substances as donors15/288675/42,5230.000134451
BlueGO:0050664oxidoreductase activity, acting on NAD(P)H, oxygen as acceptor6/288614/42,5230.0001814
BlueGO:0016628oxidoreductase activity, acting on the CH-CH group of donors, NAD or NADP as acceptor11/288646/42,5230.000200178
BlueGO:0016620oxidoreductase activity, acting on the aldehyde or oxo group of donors, NAD or NADP as acceptor11/288670/42,5230.007278342
BlueGO:0016717oxidoreductase activity, acting on paired donors, with oxidation of a pair of donors resulting in the reduction in molecular oxygen to two molecules of water5/288620/42,5230.009410658
BlueGO:0016860intramolecular oxidoreductase activity9/288658/42,5230.015659569
BlueGO:0016903oxidoreductase activity, acting on the aldehyde or oxo group of donors12/288690/42,5230.020260485
BlueGO:0016671oxidoreductase activity, acting on a sulfur group of donors, disulfide as acceptor5/288624/42,5230.020597531
BlueGO:0016655oxidoreductase activity, acting on NAD(P)H, quinone or similar compound as acceptor9/288666/42,5230.043312538
BlueGO:0016209antioxidant activity79/2886303/42,5230.0000027
BlueGO:0016052carbohydrate catabolic process43/2886339/42,5230.0000779
BlueGO:0044275cellular carbohydrate catabolic process11/288680/42,5230.022650601
BlueGO:0009812flavonoid metabolic process6/288623/42,5230.003591583
Table 6. Turquoise and Blue module core hub function annotation details.
ModuleGene IDGene DescriptionGO IDGO DescriptionKEGG Pathway IDKEGG
Pathway Definition
Blue LOC_Os03g09210NADH dehydrogenase 1 alpha subcomplex subunit 13, putative, expressedGO: 0005743; GO: 0016021; GO: 0070469; GO: 0005747; GO: 0008137CC: mitochondrial inner membrane; CC: integral component of membrane; CC: respiratory chain; CC: mitochondrial respiratory chain complex I; MF: NADH dehydrogenas;map00190Oxidative phosphorylation
LOC_Os03g505402Fe-2S iron-sulfur cluster binding domain containing protein, expressedGO: 0042773; GO: 0006979; GO: 0005743; GO: 0005747; GO: 0009507; GO: 0051539; GO: 0008137BP: ATP synthesis coupled electron transport; BP: response to oxidative stress; CC: mitochondrial inner membrane; CC: mitochondrial respiratory chain complex I; CC: chloroplast; MF: 4 iron, 4 sulfur cluster binding; MF: NADH dehydrogenas;map00190Oxidative phosphorylation
LOC_Os03g18420CHCH domain-containing protein, expressedGO: 0006120; GO: 0070469; GO: 0005747; GO: 0005739BP: mitochondrial electron transport, NADH to ubiquinone; CC: respiratory chain; CC: mitochondrial respiratory chain complex I; CC: mitochondrion;map00190Oxidative phosphorylation
LOC_Os02g57180NADH dehydrogenase 1 alpha subcomplex subunit 9, mitochondrial precursor, putative, expressedGO: 1901006; GO: 0016021; GO: 0005739; GO: 0005747; GO: 0003824; GO: 0044877BP: ubiquinone-6 biosynthetic process; CC: integral component of membrane; CC: mitochondrion; CC: mitochondrial respiratory chain complex I; MF: catalytic activity; MF: macromolecular complex binding;map00190Oxidative phosphorylation
LOC_Os03g03770expressed proteinGO: 0070469; GO: 0005758; GO: 0005747; GO: 0005743; GO: 0008137CC: respiratory chain; CC: mitochondrial intermembrane space; CC: mitochondrial respiratory chain complex I; CC: mitochondrial inner membrane; MF: NADH dehydrogenas;map00190Oxidative phosphorylation
Turquoise LOC_Os11g19250AARP2CN domain-containing protein, expressedGO: 0042254; GO: 0000462; GO: 0000479; GO: 0030688; GO: 0005730; GO: 0005634; GO: 0003924; GO: 0034511; GO: 0005525BP: ribosome biogenesis; BP: maturation of SSU-rRNA from tricistronic rRNA transcrip; BP: endonucleolytic cleavage of tricistronic rRNA transcrip; CC: preribosome, small subunit precursor; CC: nucleolus; CC: nucleus; MF: GTPase activity; MF: U3 snoRNA binding; MF: GTP binding;------------
LOC_Os02g49620expressed proteinGO: 0000028; GO: 0006364; GO: 0032545; GO: 0034456BP: ribosomal small subunit assembly; BP: rRNA processing; CC: CURI complex; CC: UTP-C complex;map03008Ribosome biogenesis in eukaryotes
LOC_Os01g08770WD domain, G-beta repeat domain-containing protein, expressedGO: 0000462; GO: 0032040; GO: 0005730BP: maturation of SSU-rRNA from tricistronic rRNA transcrip; CC: small-subunit processome; CC: nucleolus;------------
LOC_Os03g22320utp14 protein, putative, expressedGO: 0006364; GO: 0032040; GO: 0005730BP: rRNA processing; CC: small-subunit processome; CC: nucleolus;map03008Ribosome biogenesis in eukaryotes
LOC_Os03g05720WD domain, G-beta repeat domain-containing protein, expressedGO: 0030490; GO: 0034388; GO: 0032040; GO: 0005730; GO: 0030515BP: maturation of SSU-rRNA; CC: Pwp2p-containing subcomplex of 90S preribosome; CC: small-subunit processome; CC: nucleolus; MF: snoRNA binding;map03008Ribosome biogenesis in eukaryotes
Disclaimer/Publisher’s Note: The statements, opinions and data contained in all publications are solely those of the individual author(s) and contributor(s) and not of MDPI and/or the editor(s). MDPI and/or the editor(s) disclaim responsibility for any injury to people or property resulting from any ideas, methods, instructions or products referred to in the content.

