
Insect Abundance and Richness in Squash Agroecosystems of Georgia, United States: The Role of Cultivar Selection and Weather Conditions


Abstract
1. Introduction
2. Materials and Methods
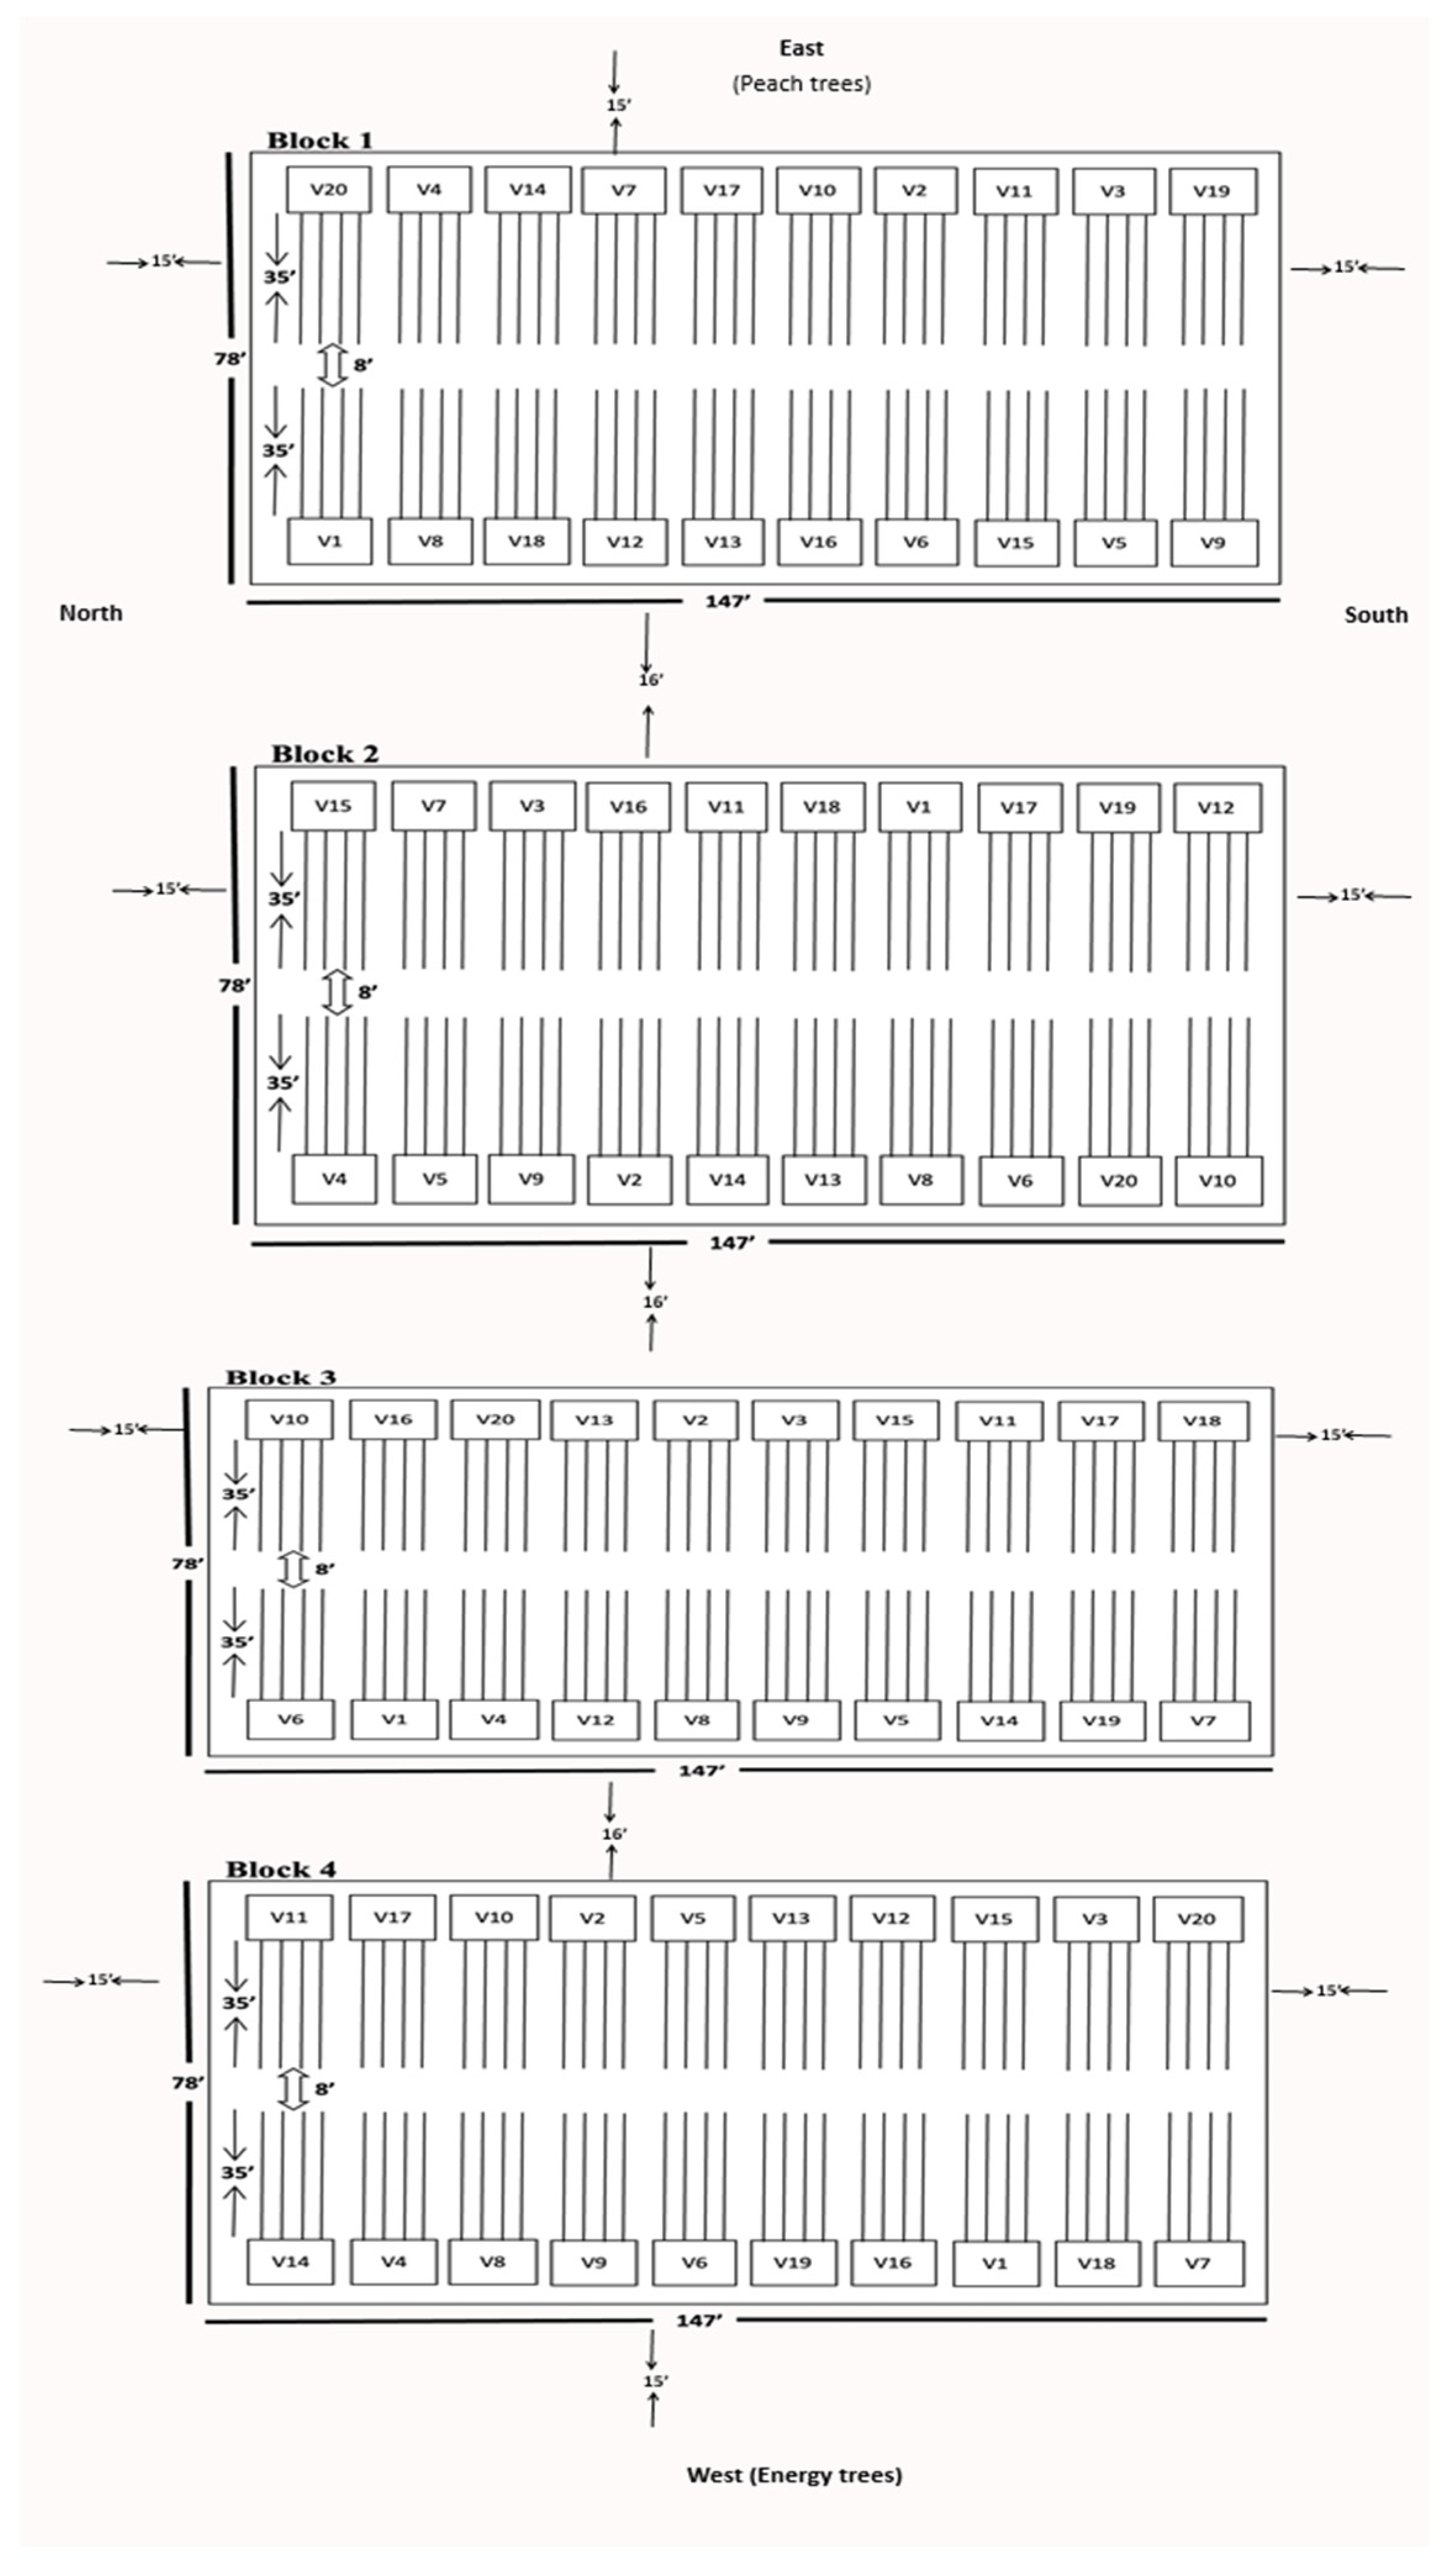
2.1. Experimental Site Description
2.2. Squash Cultivars
2.3. Field Management Practices
2.4. Experimental Design
2.5. Insect Sampling
2.6. Weather Information
2.7. Data Analysis
3. Results
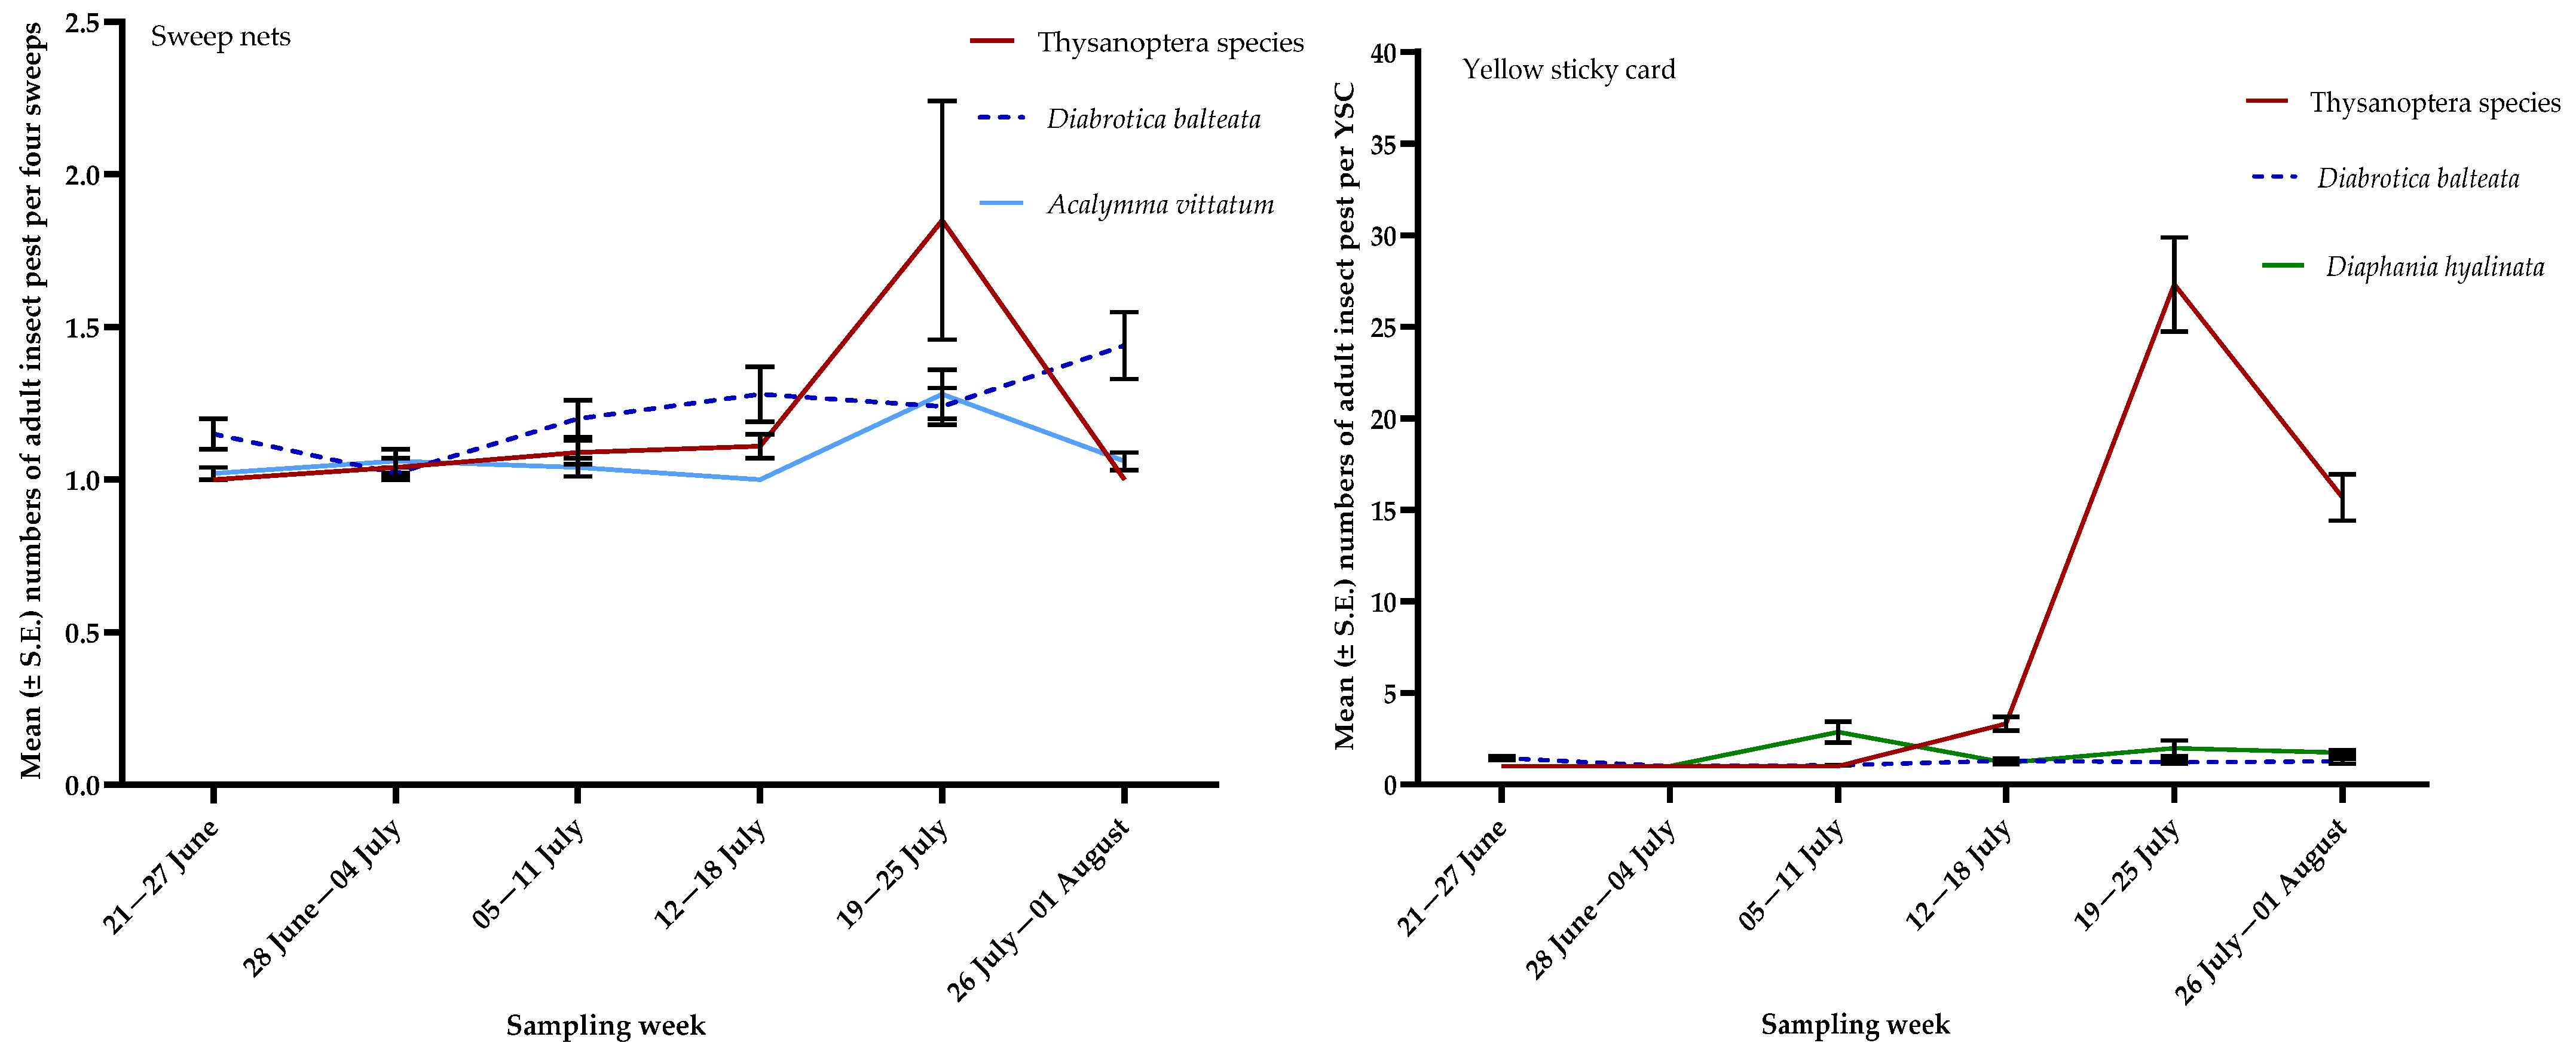
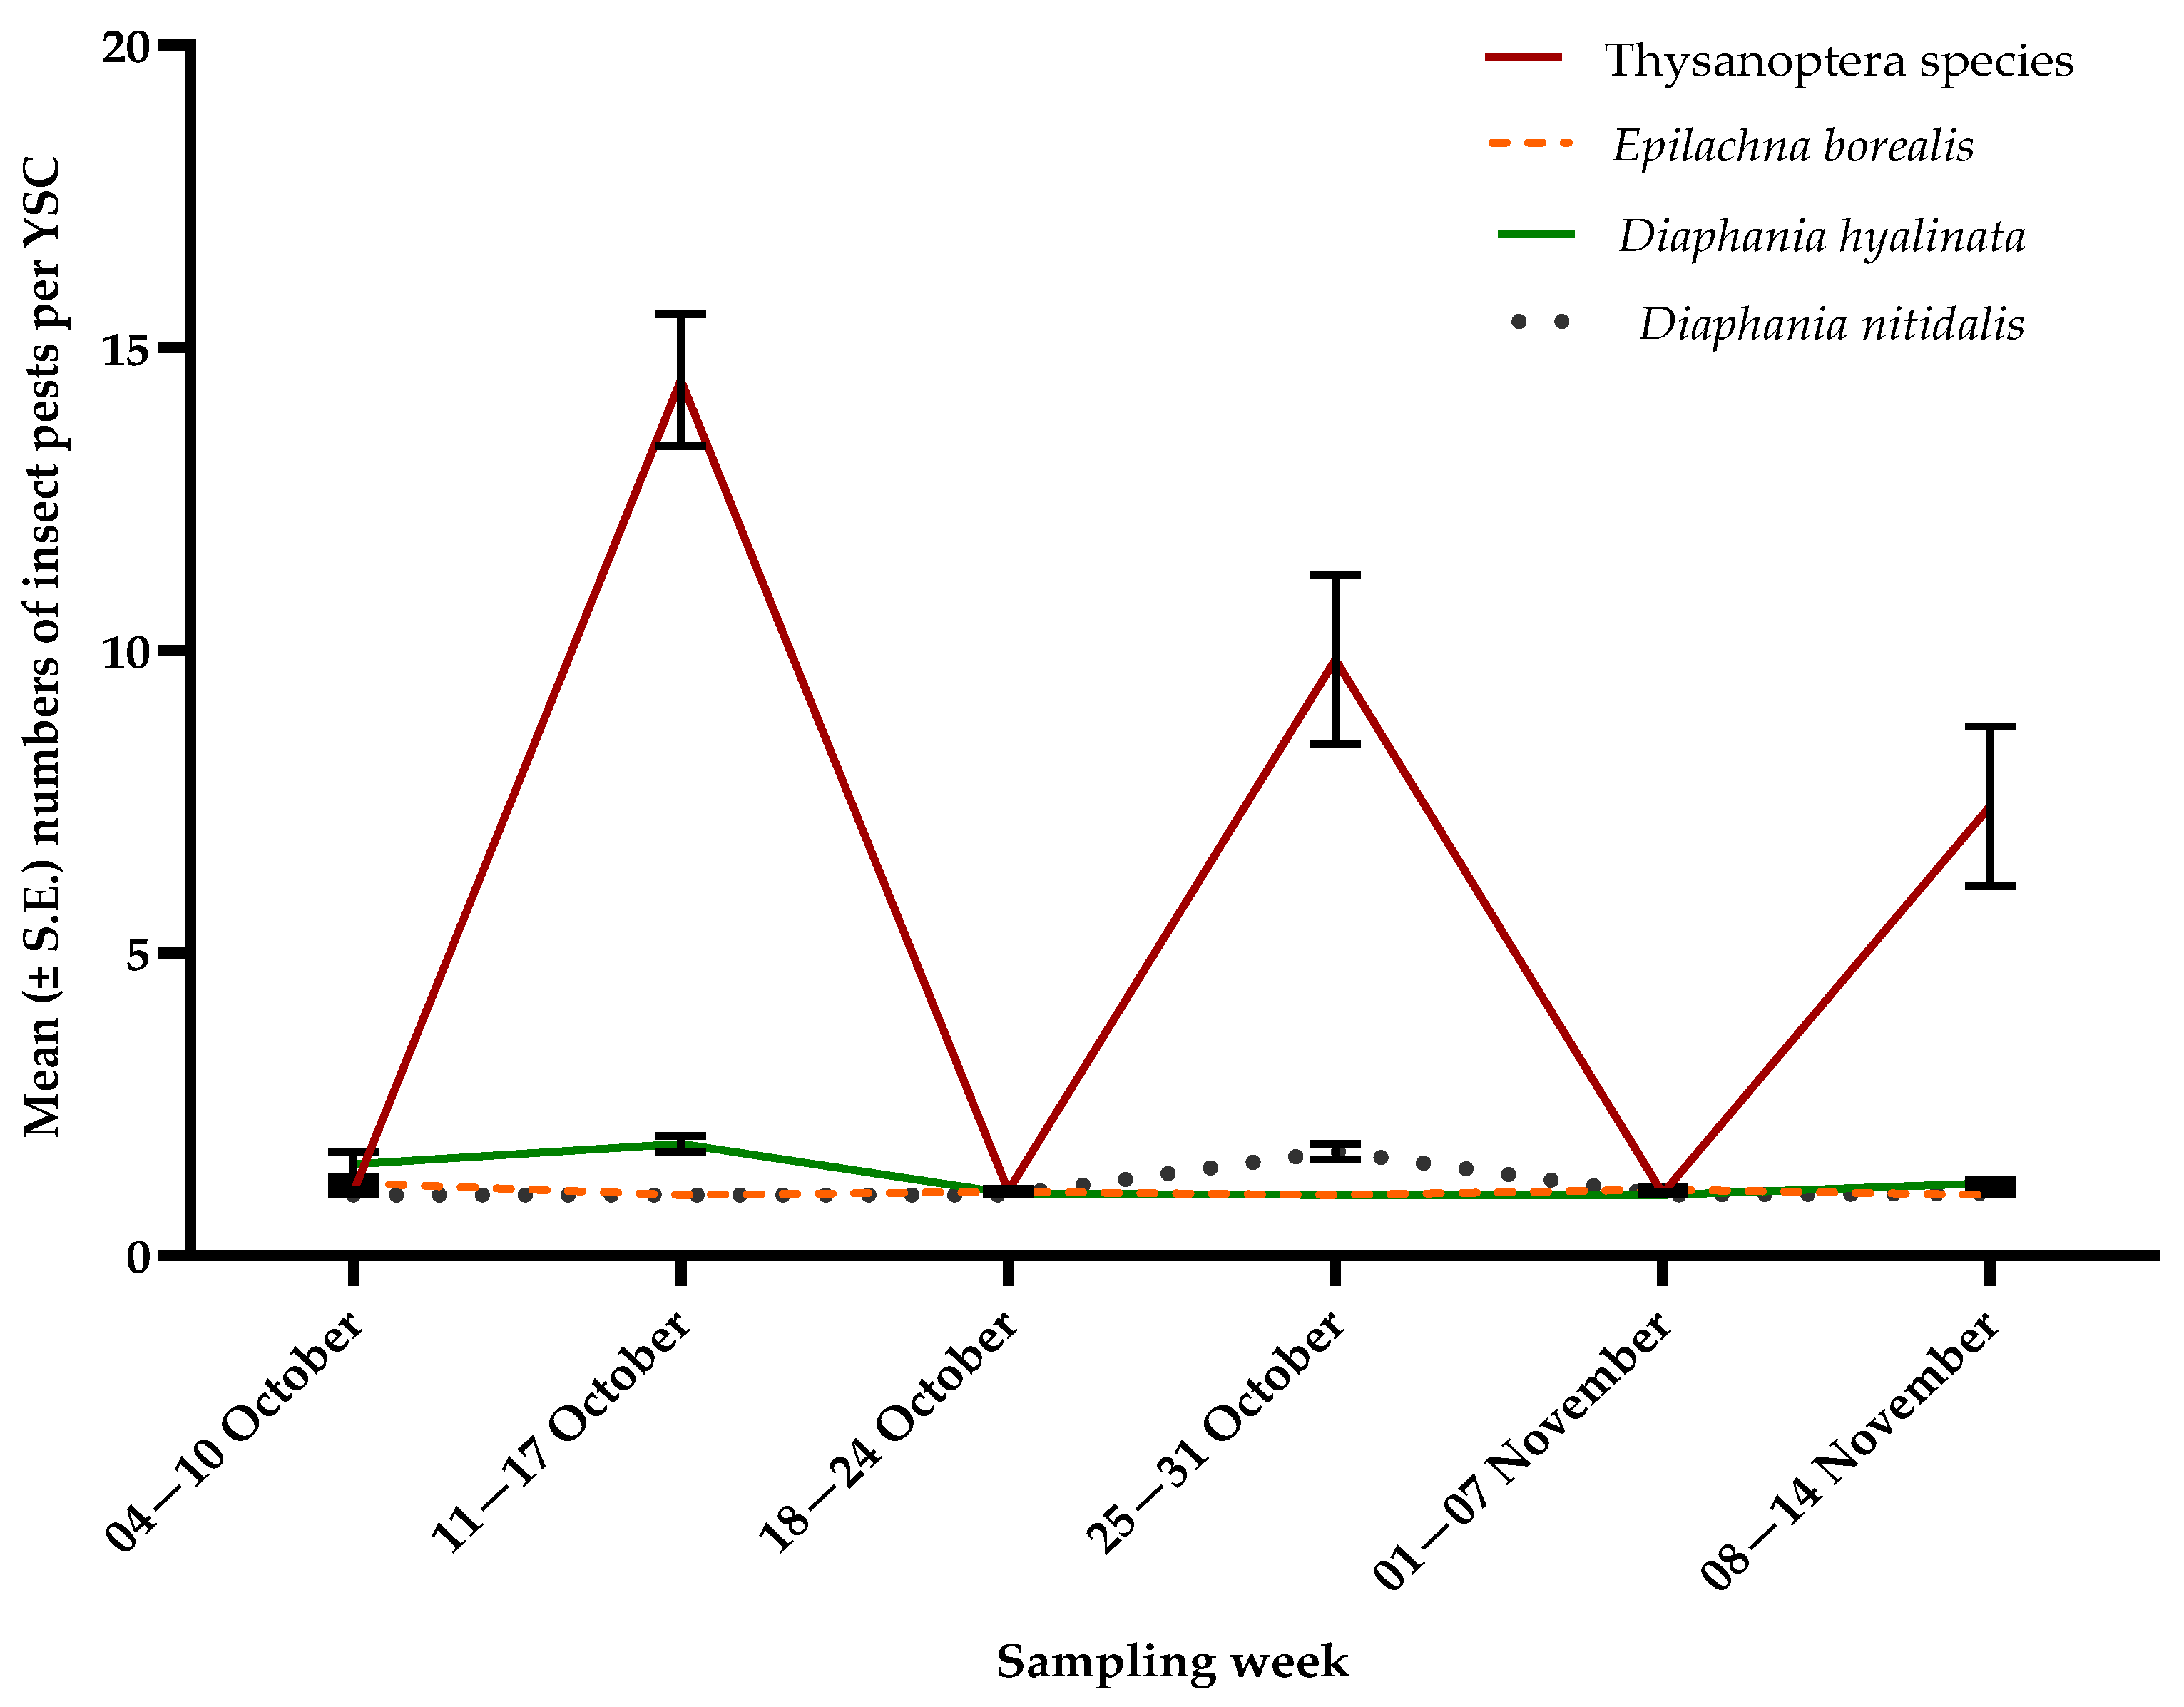
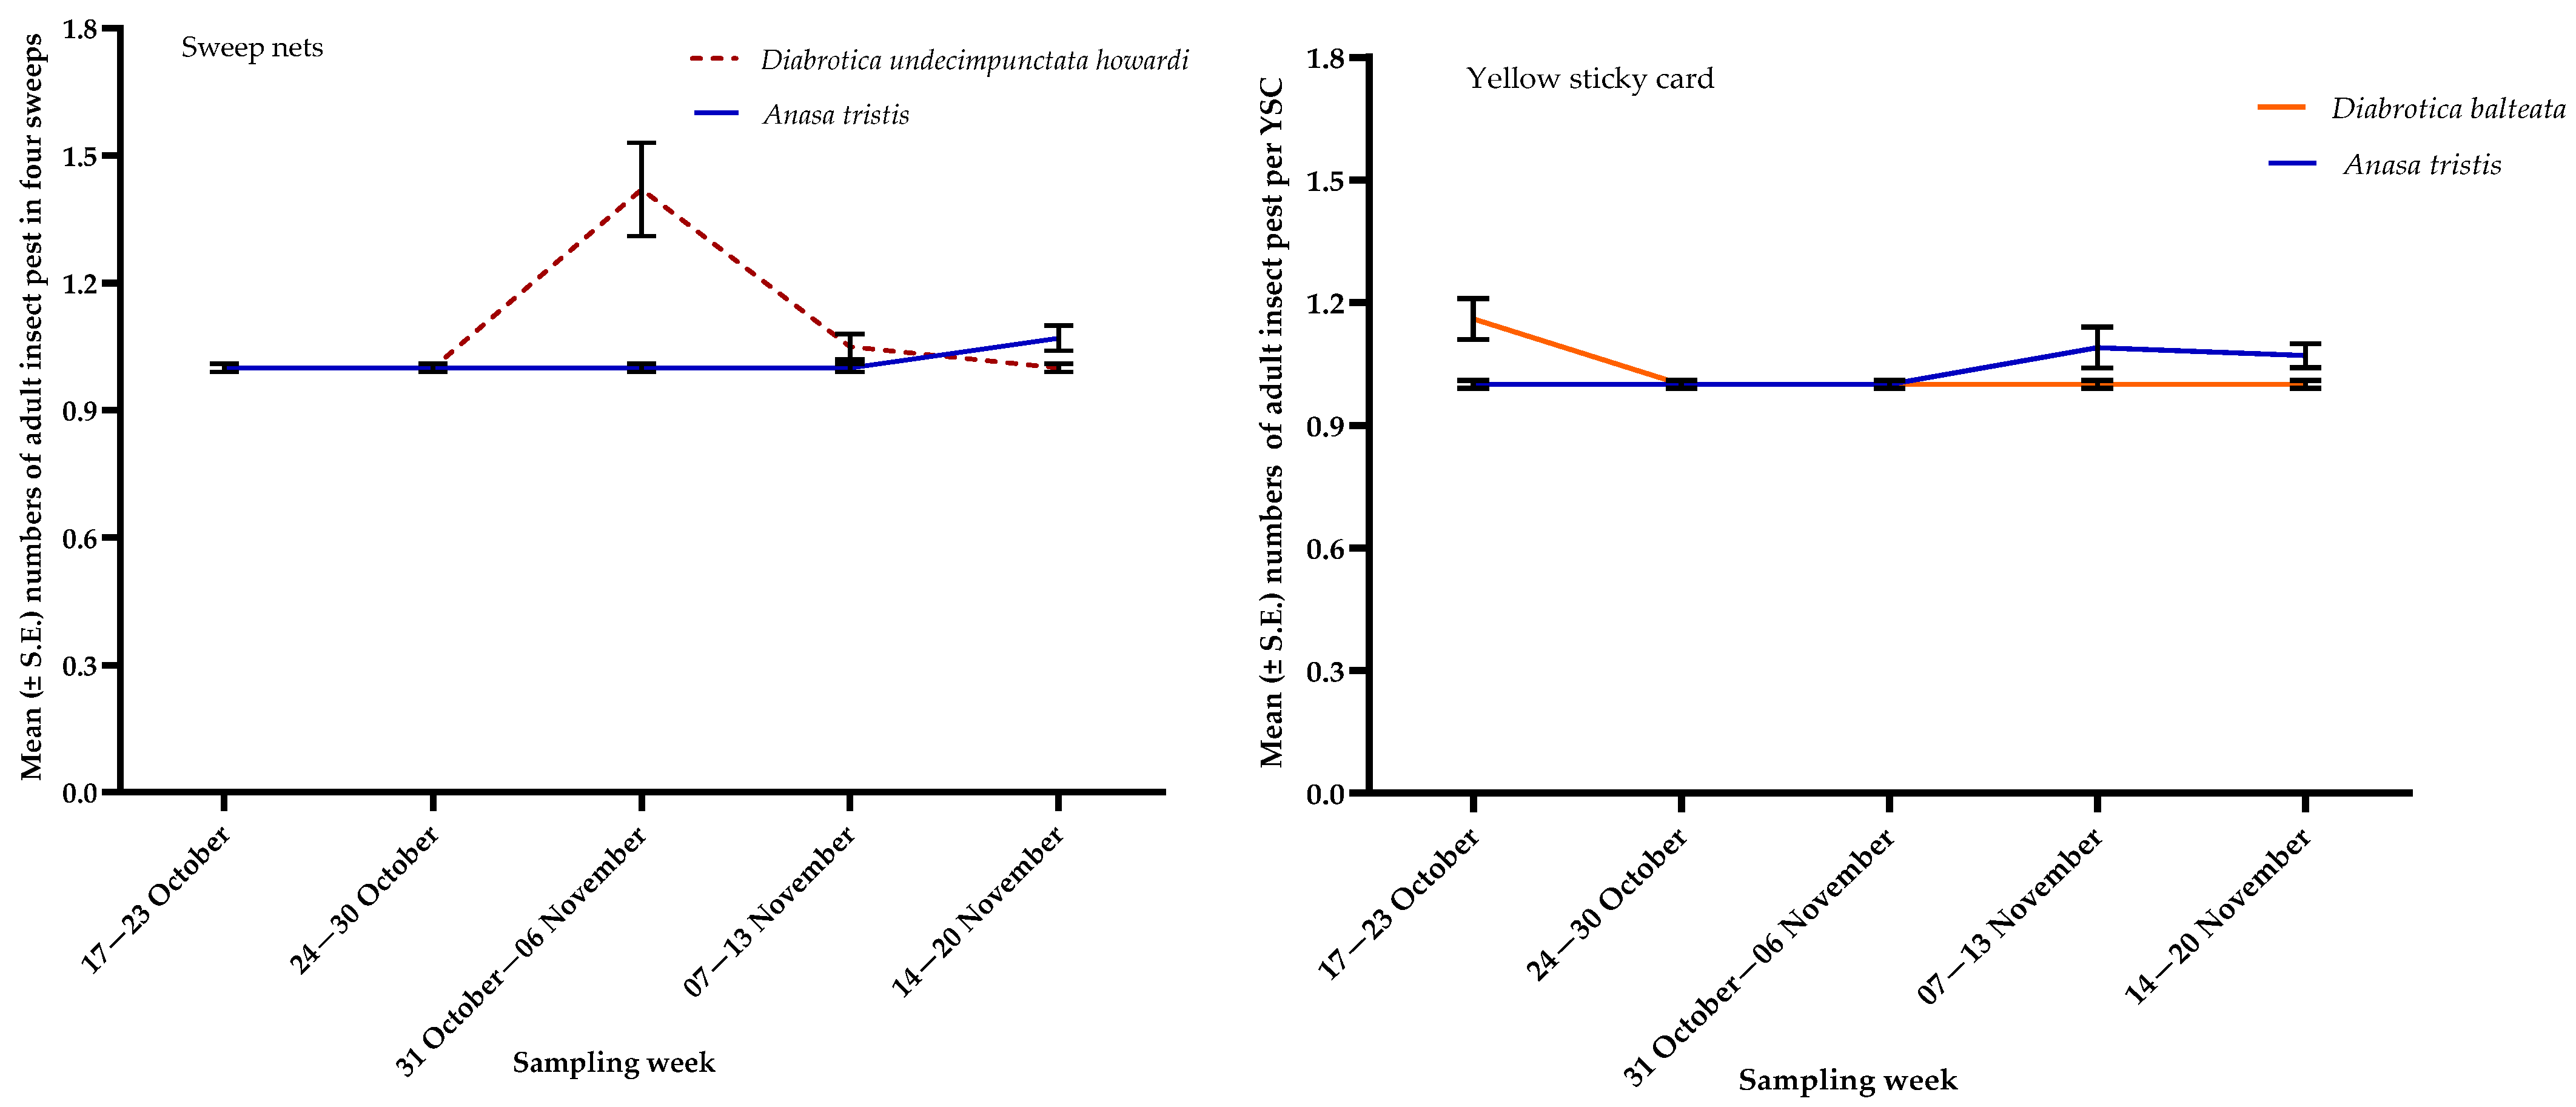
3.1. Insect Pests
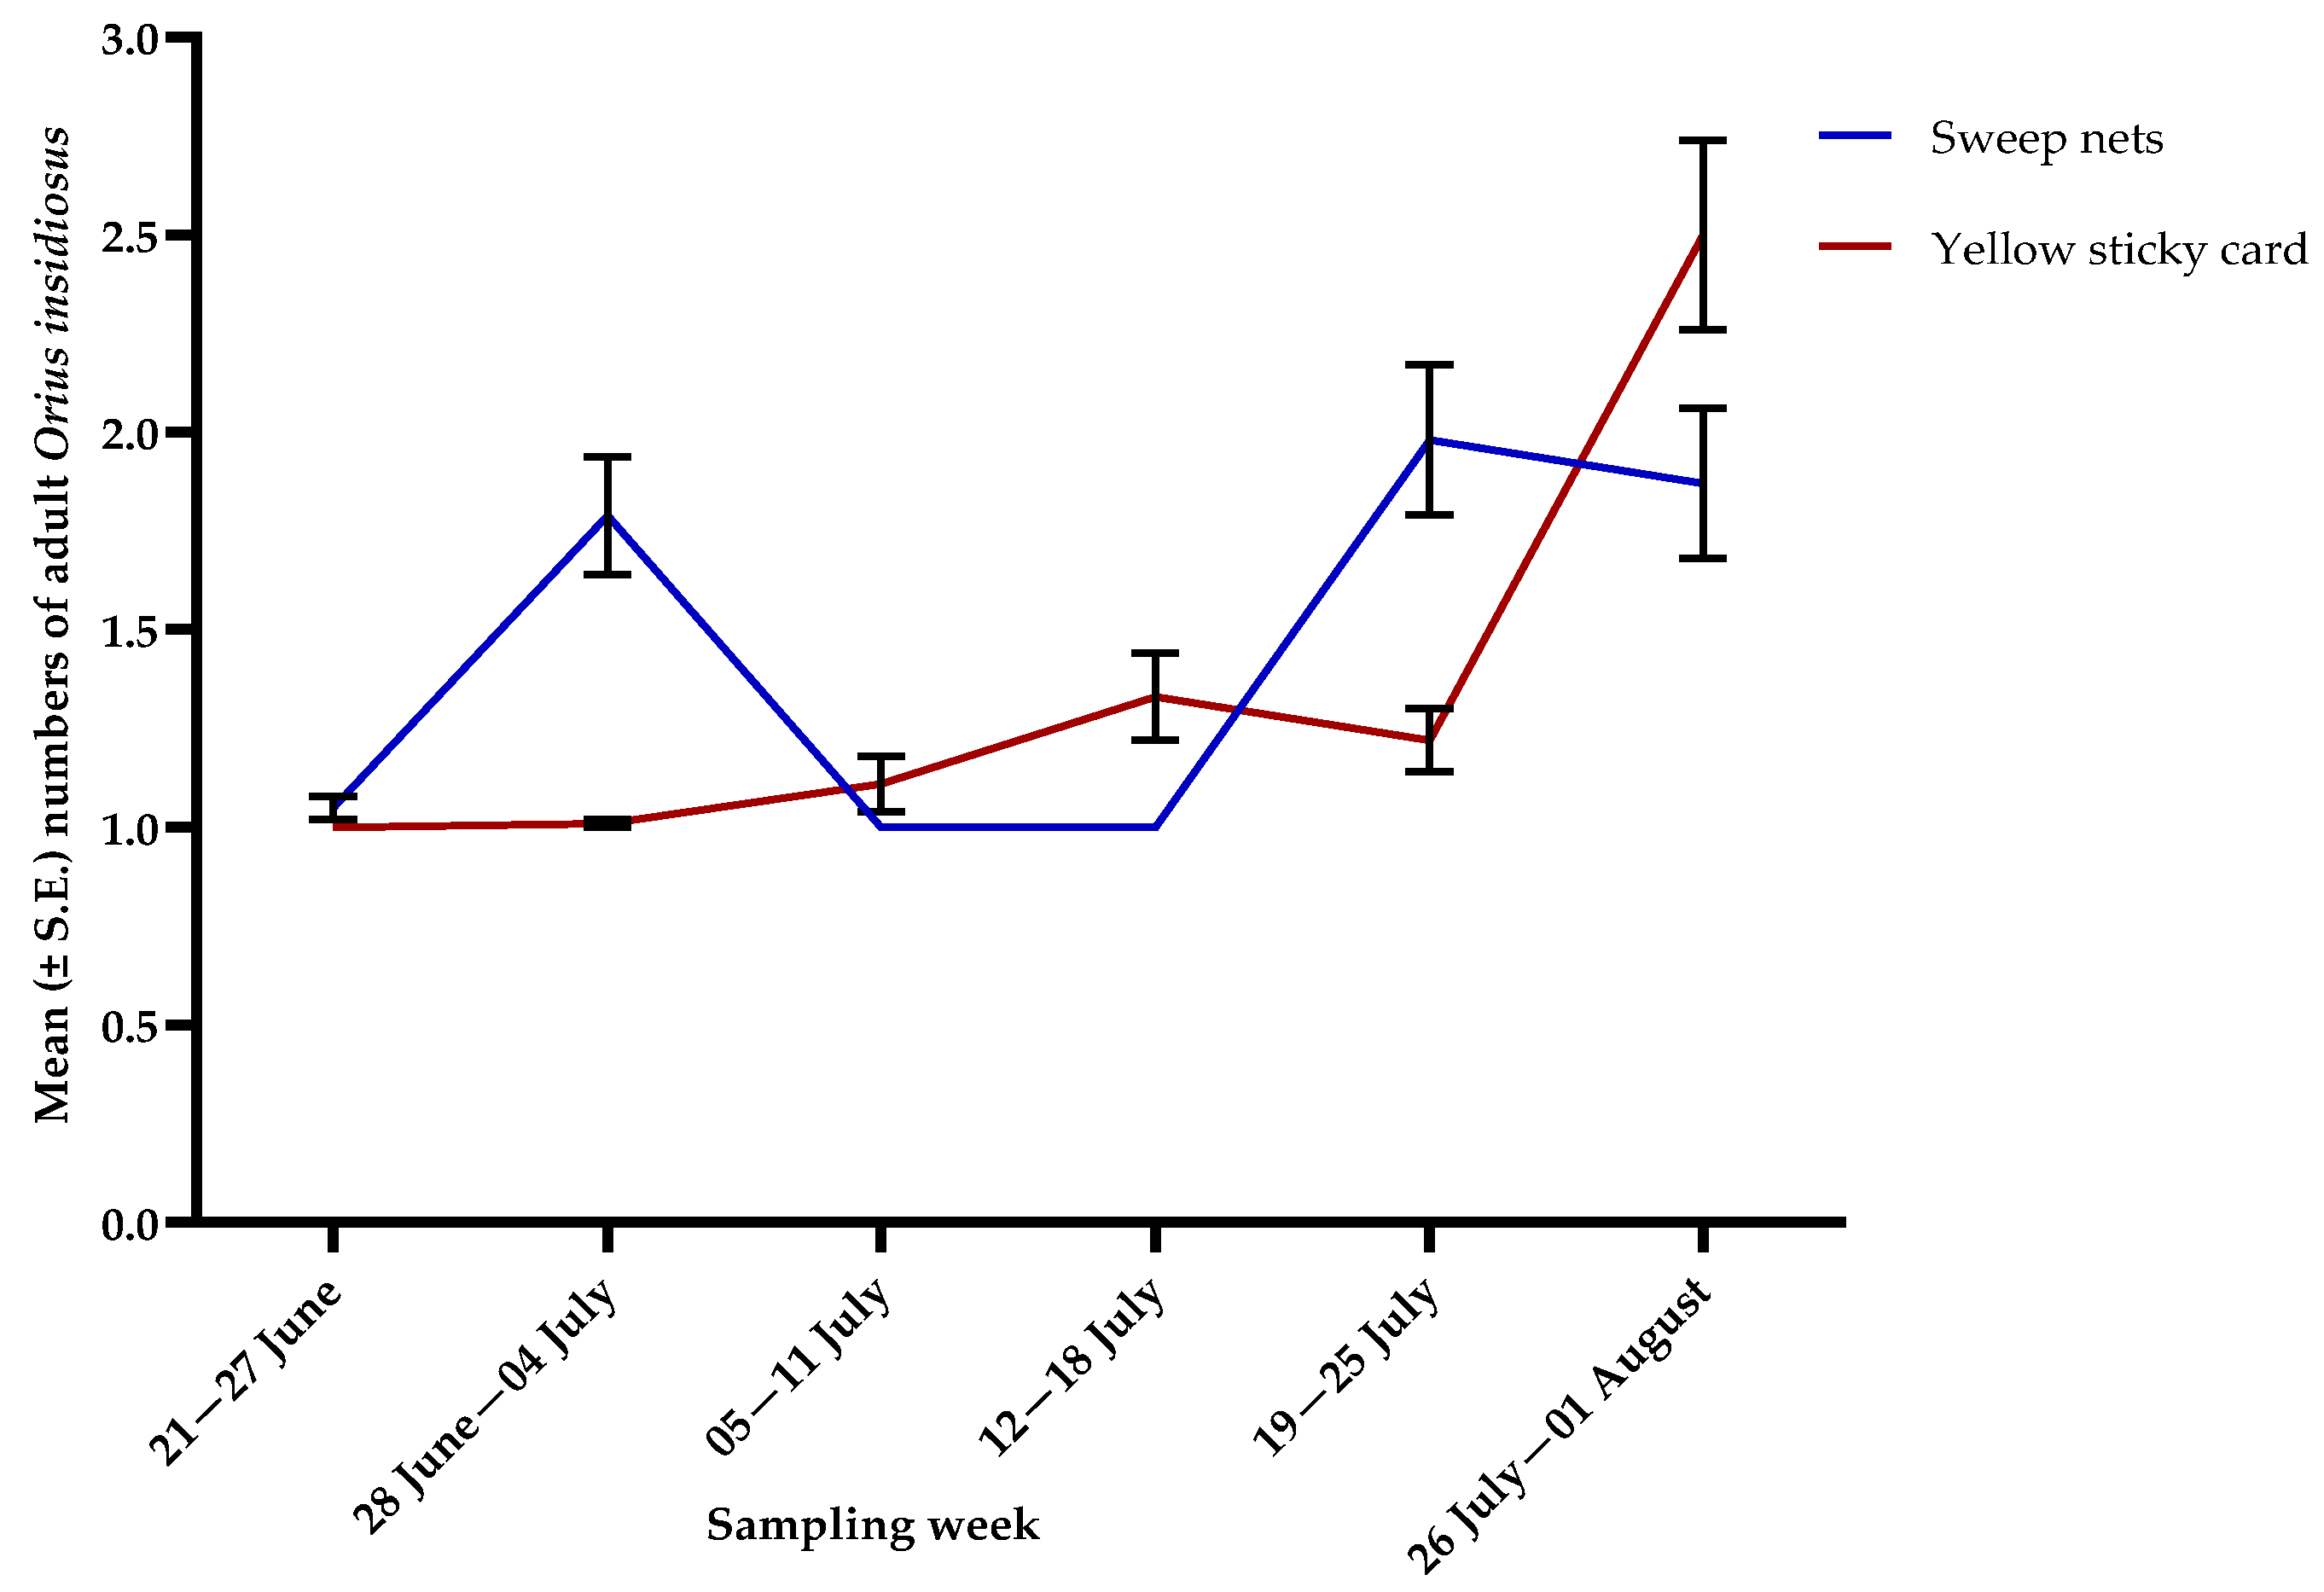
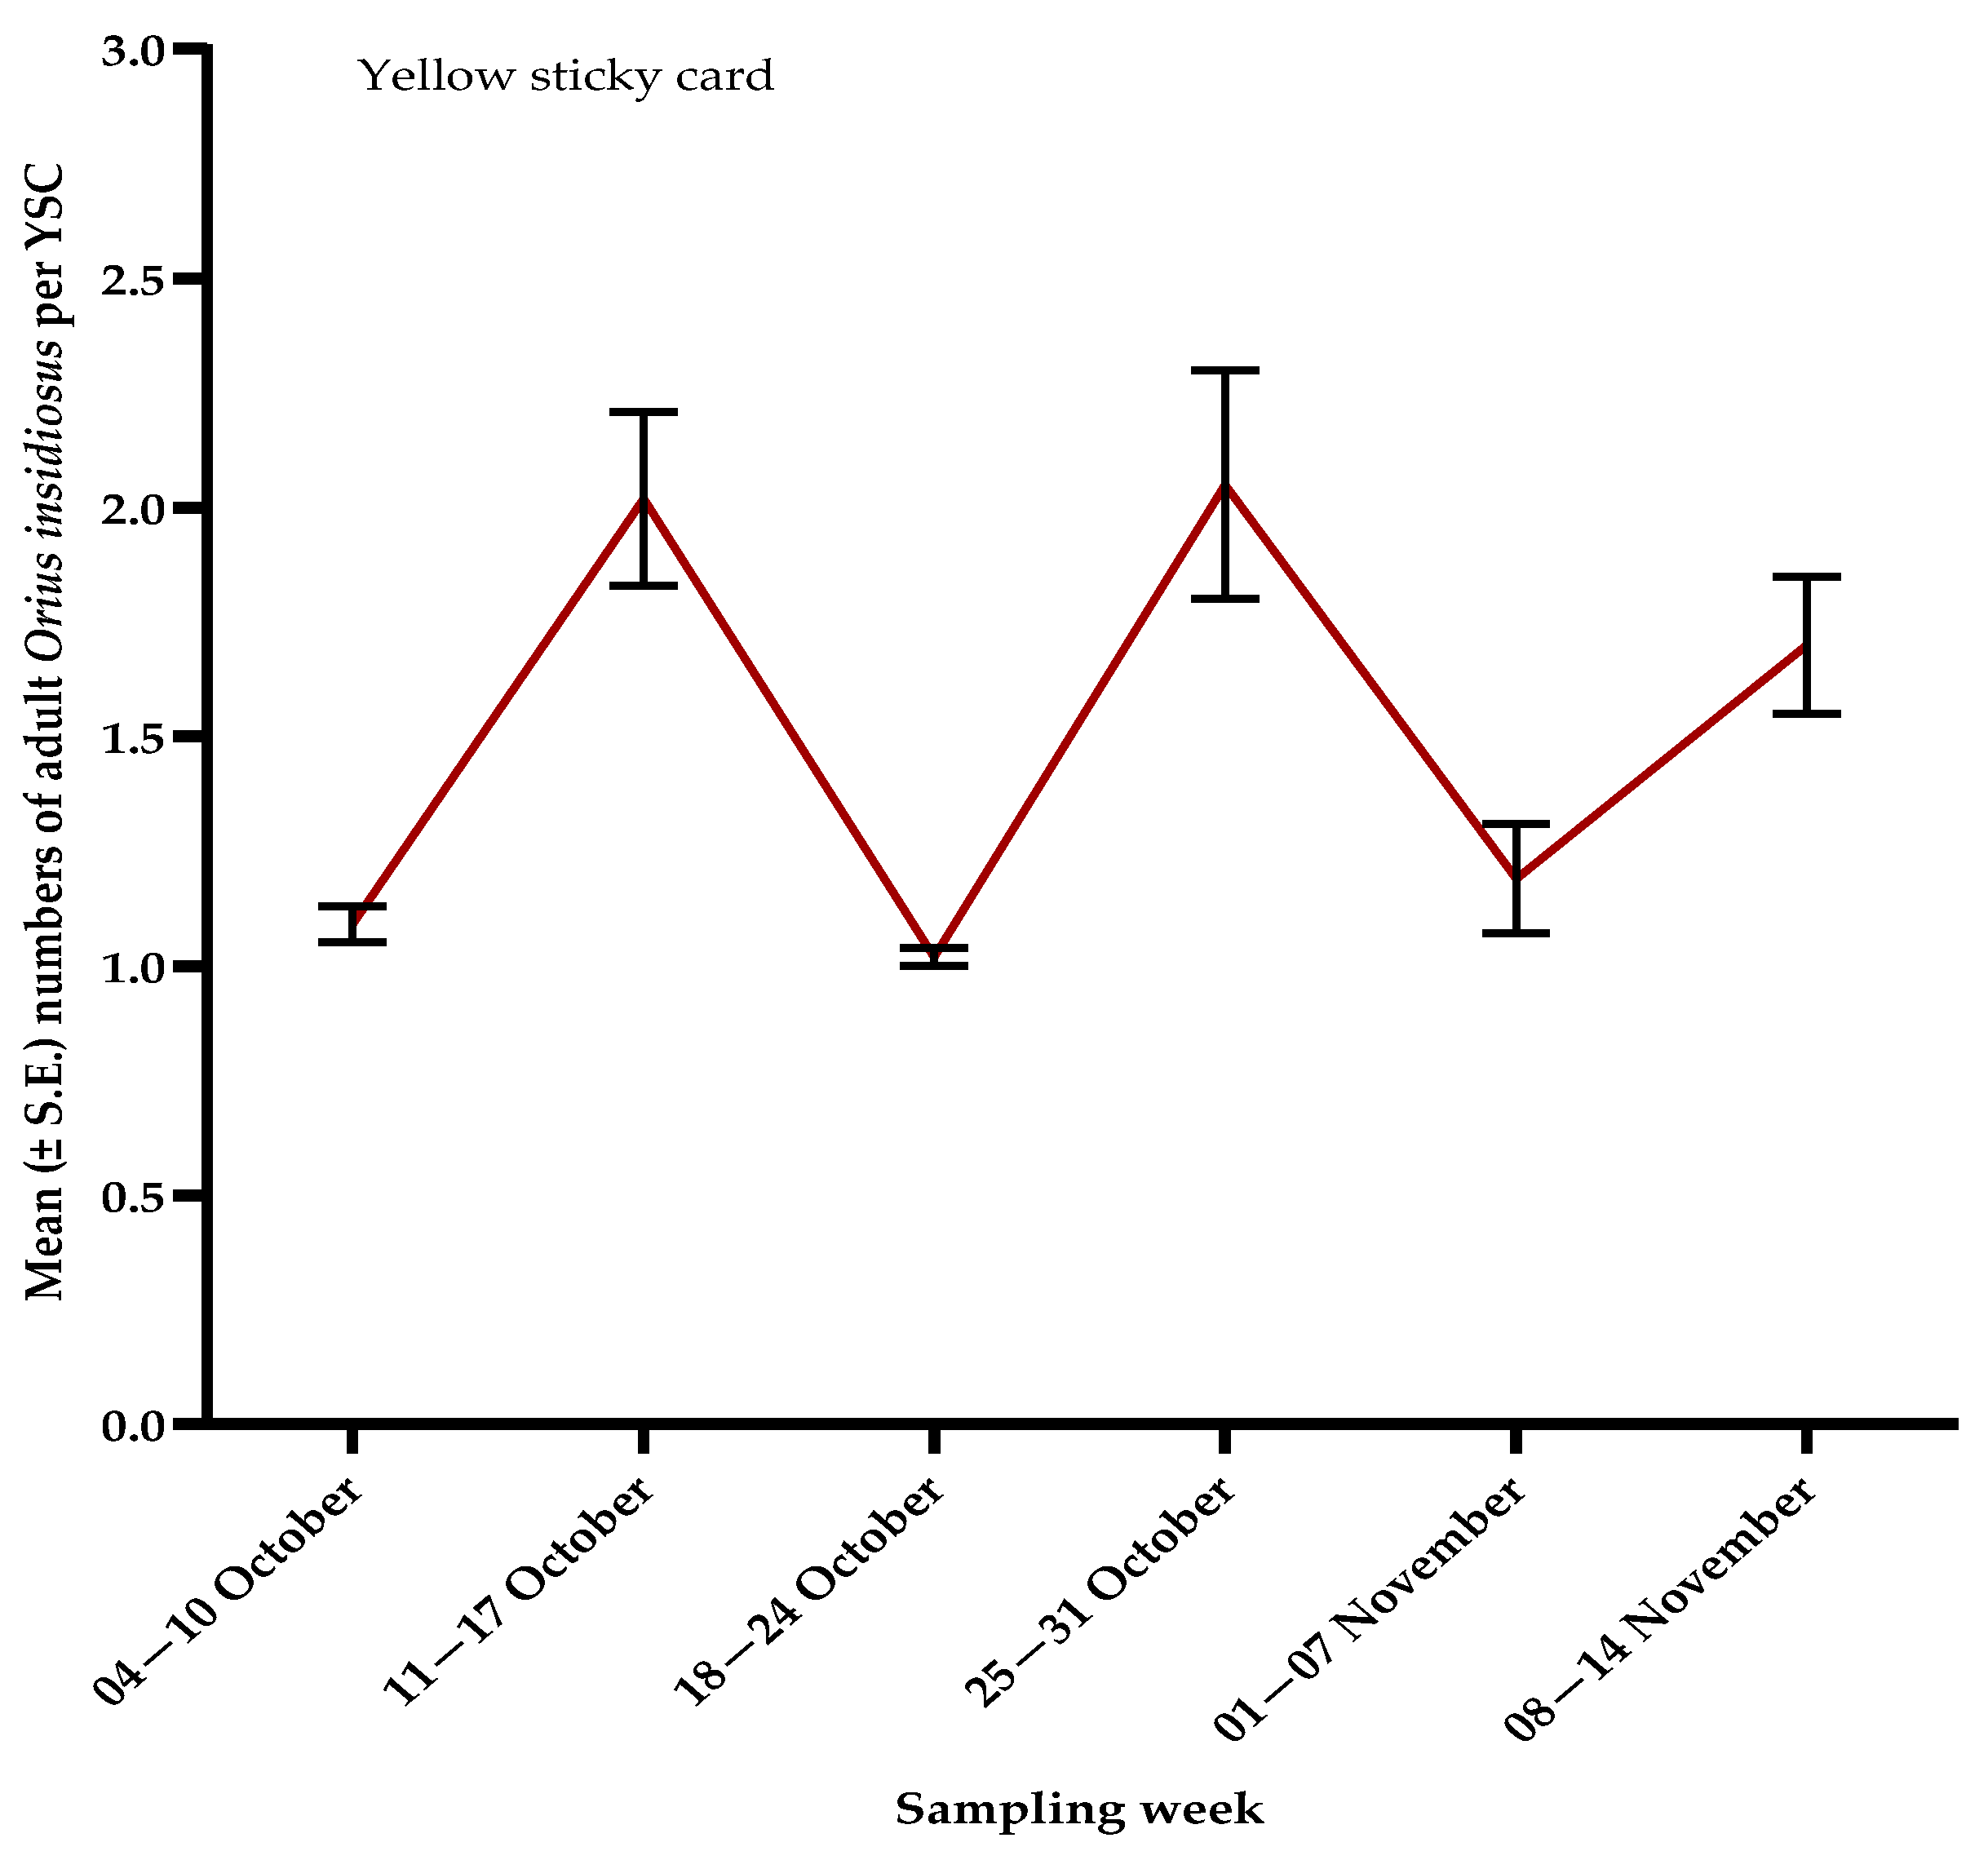
3.2. Natural Enemies
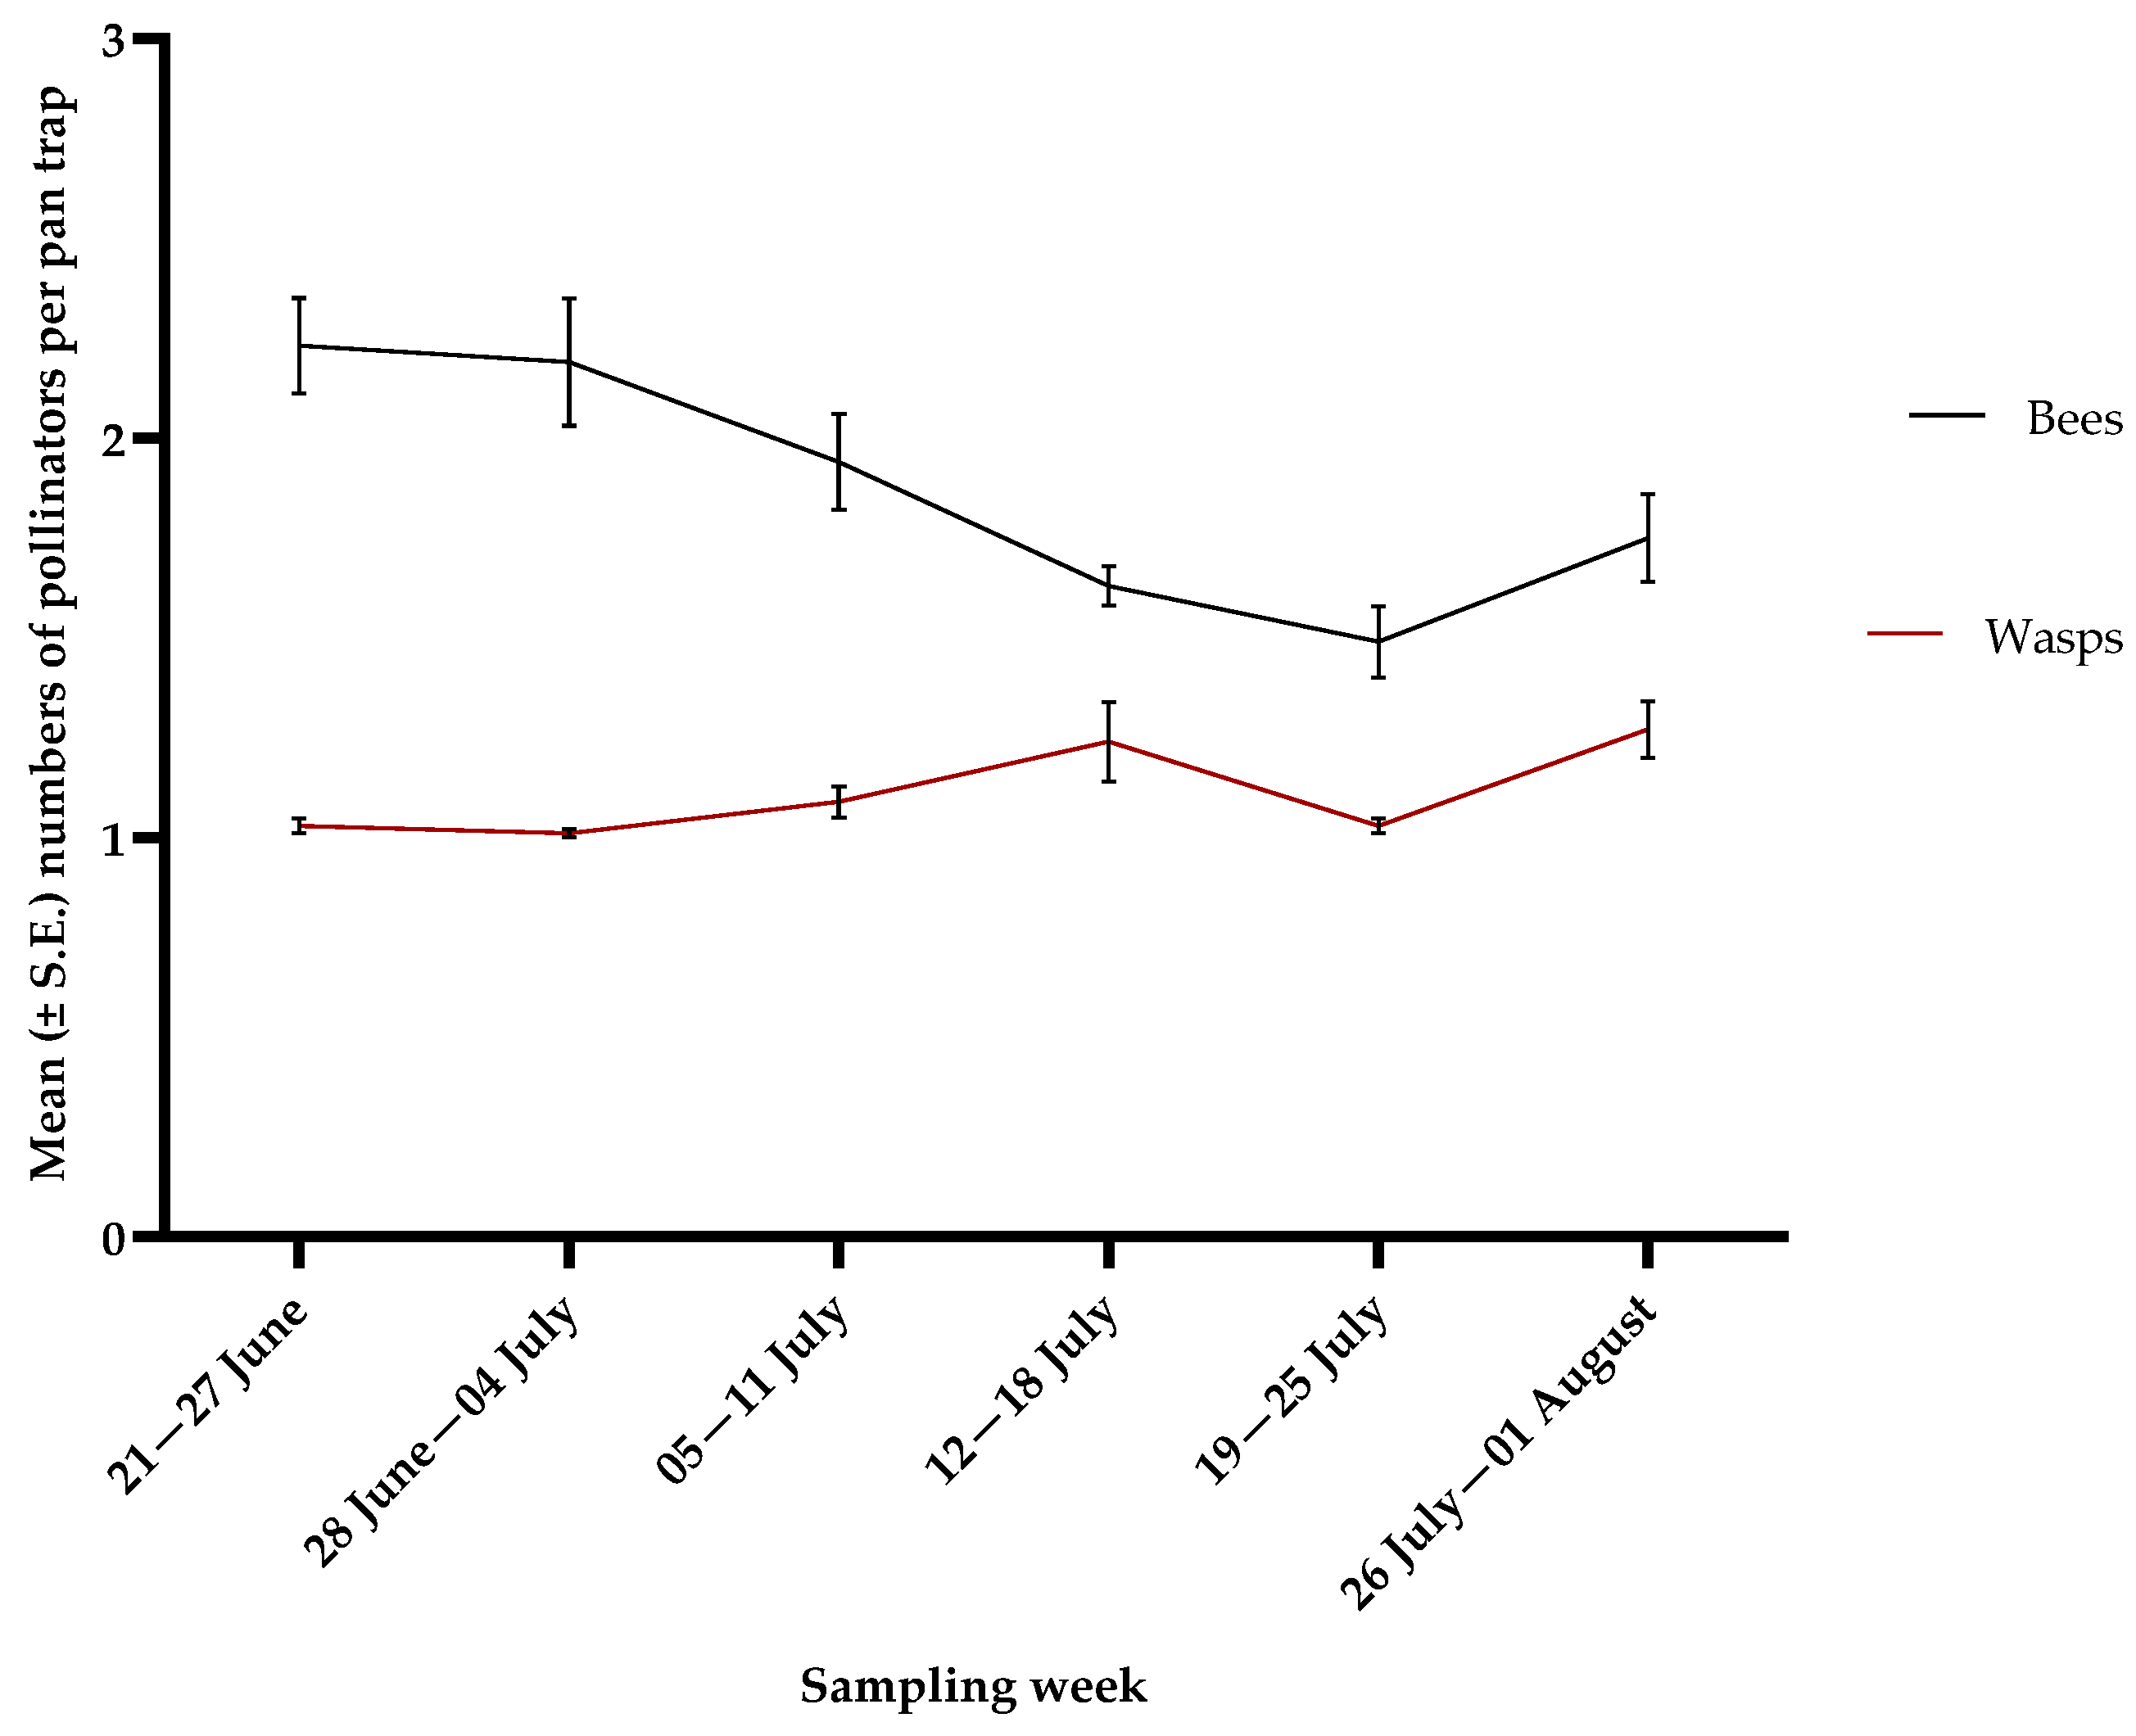
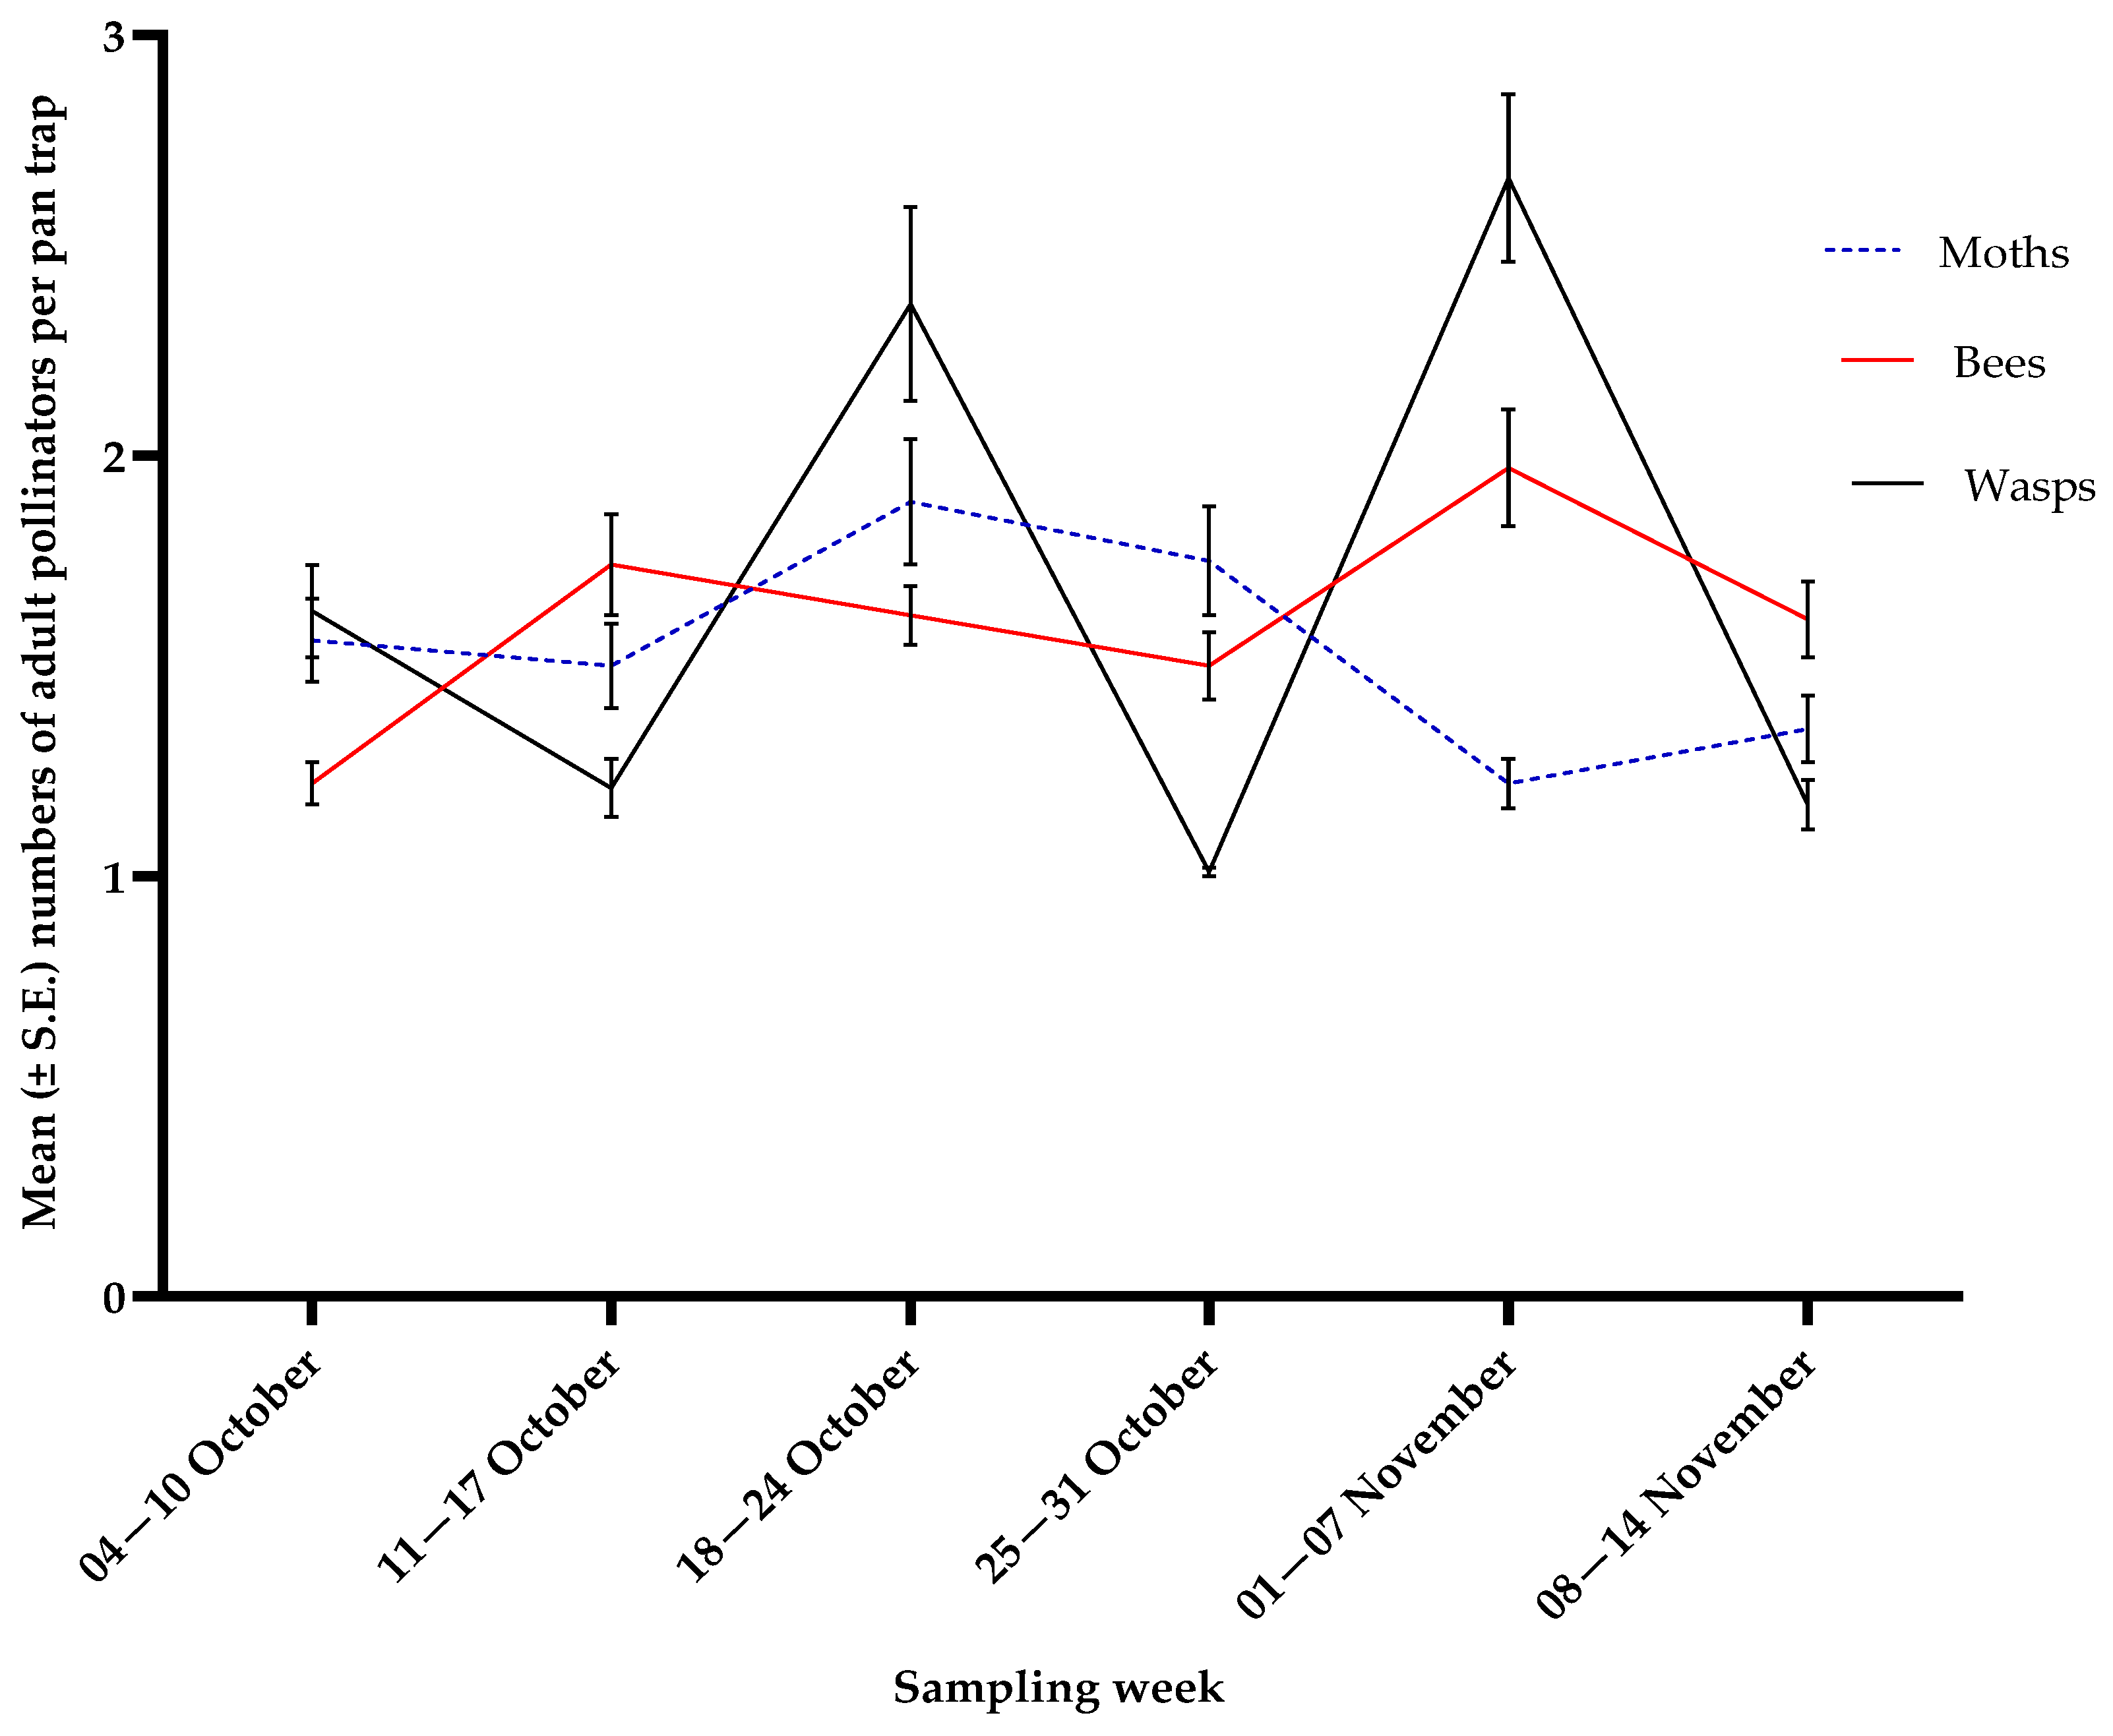
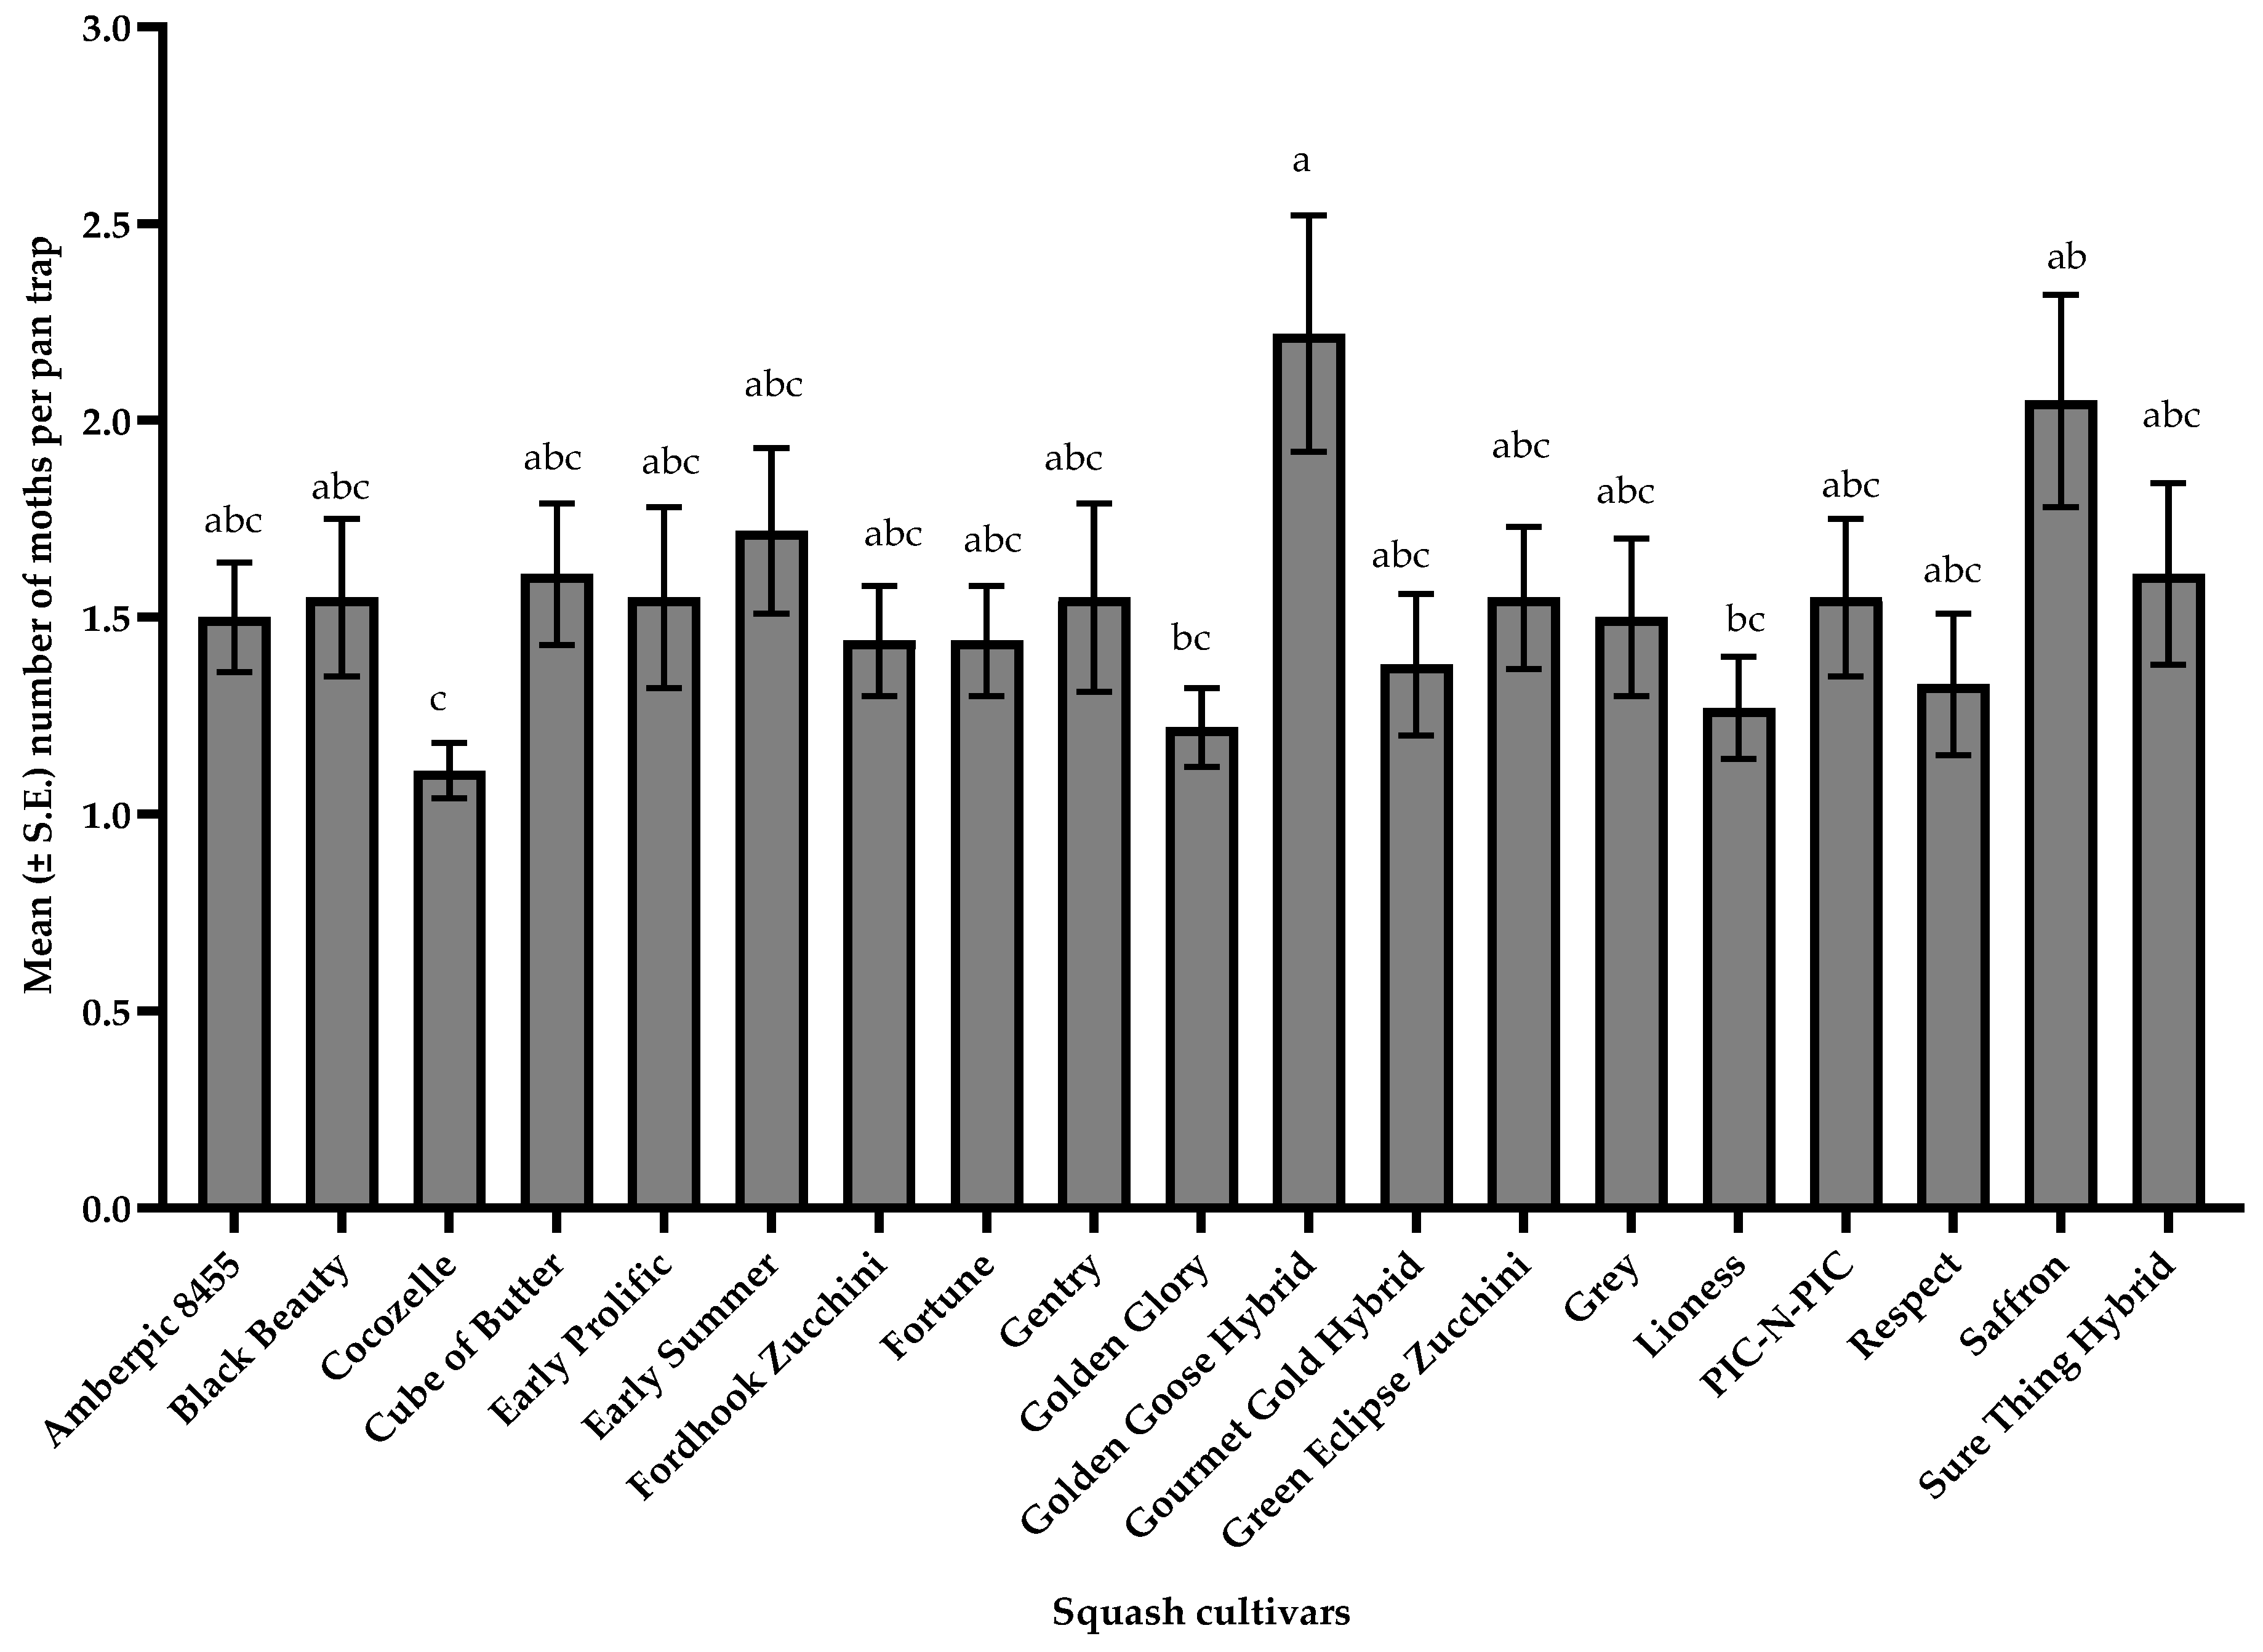
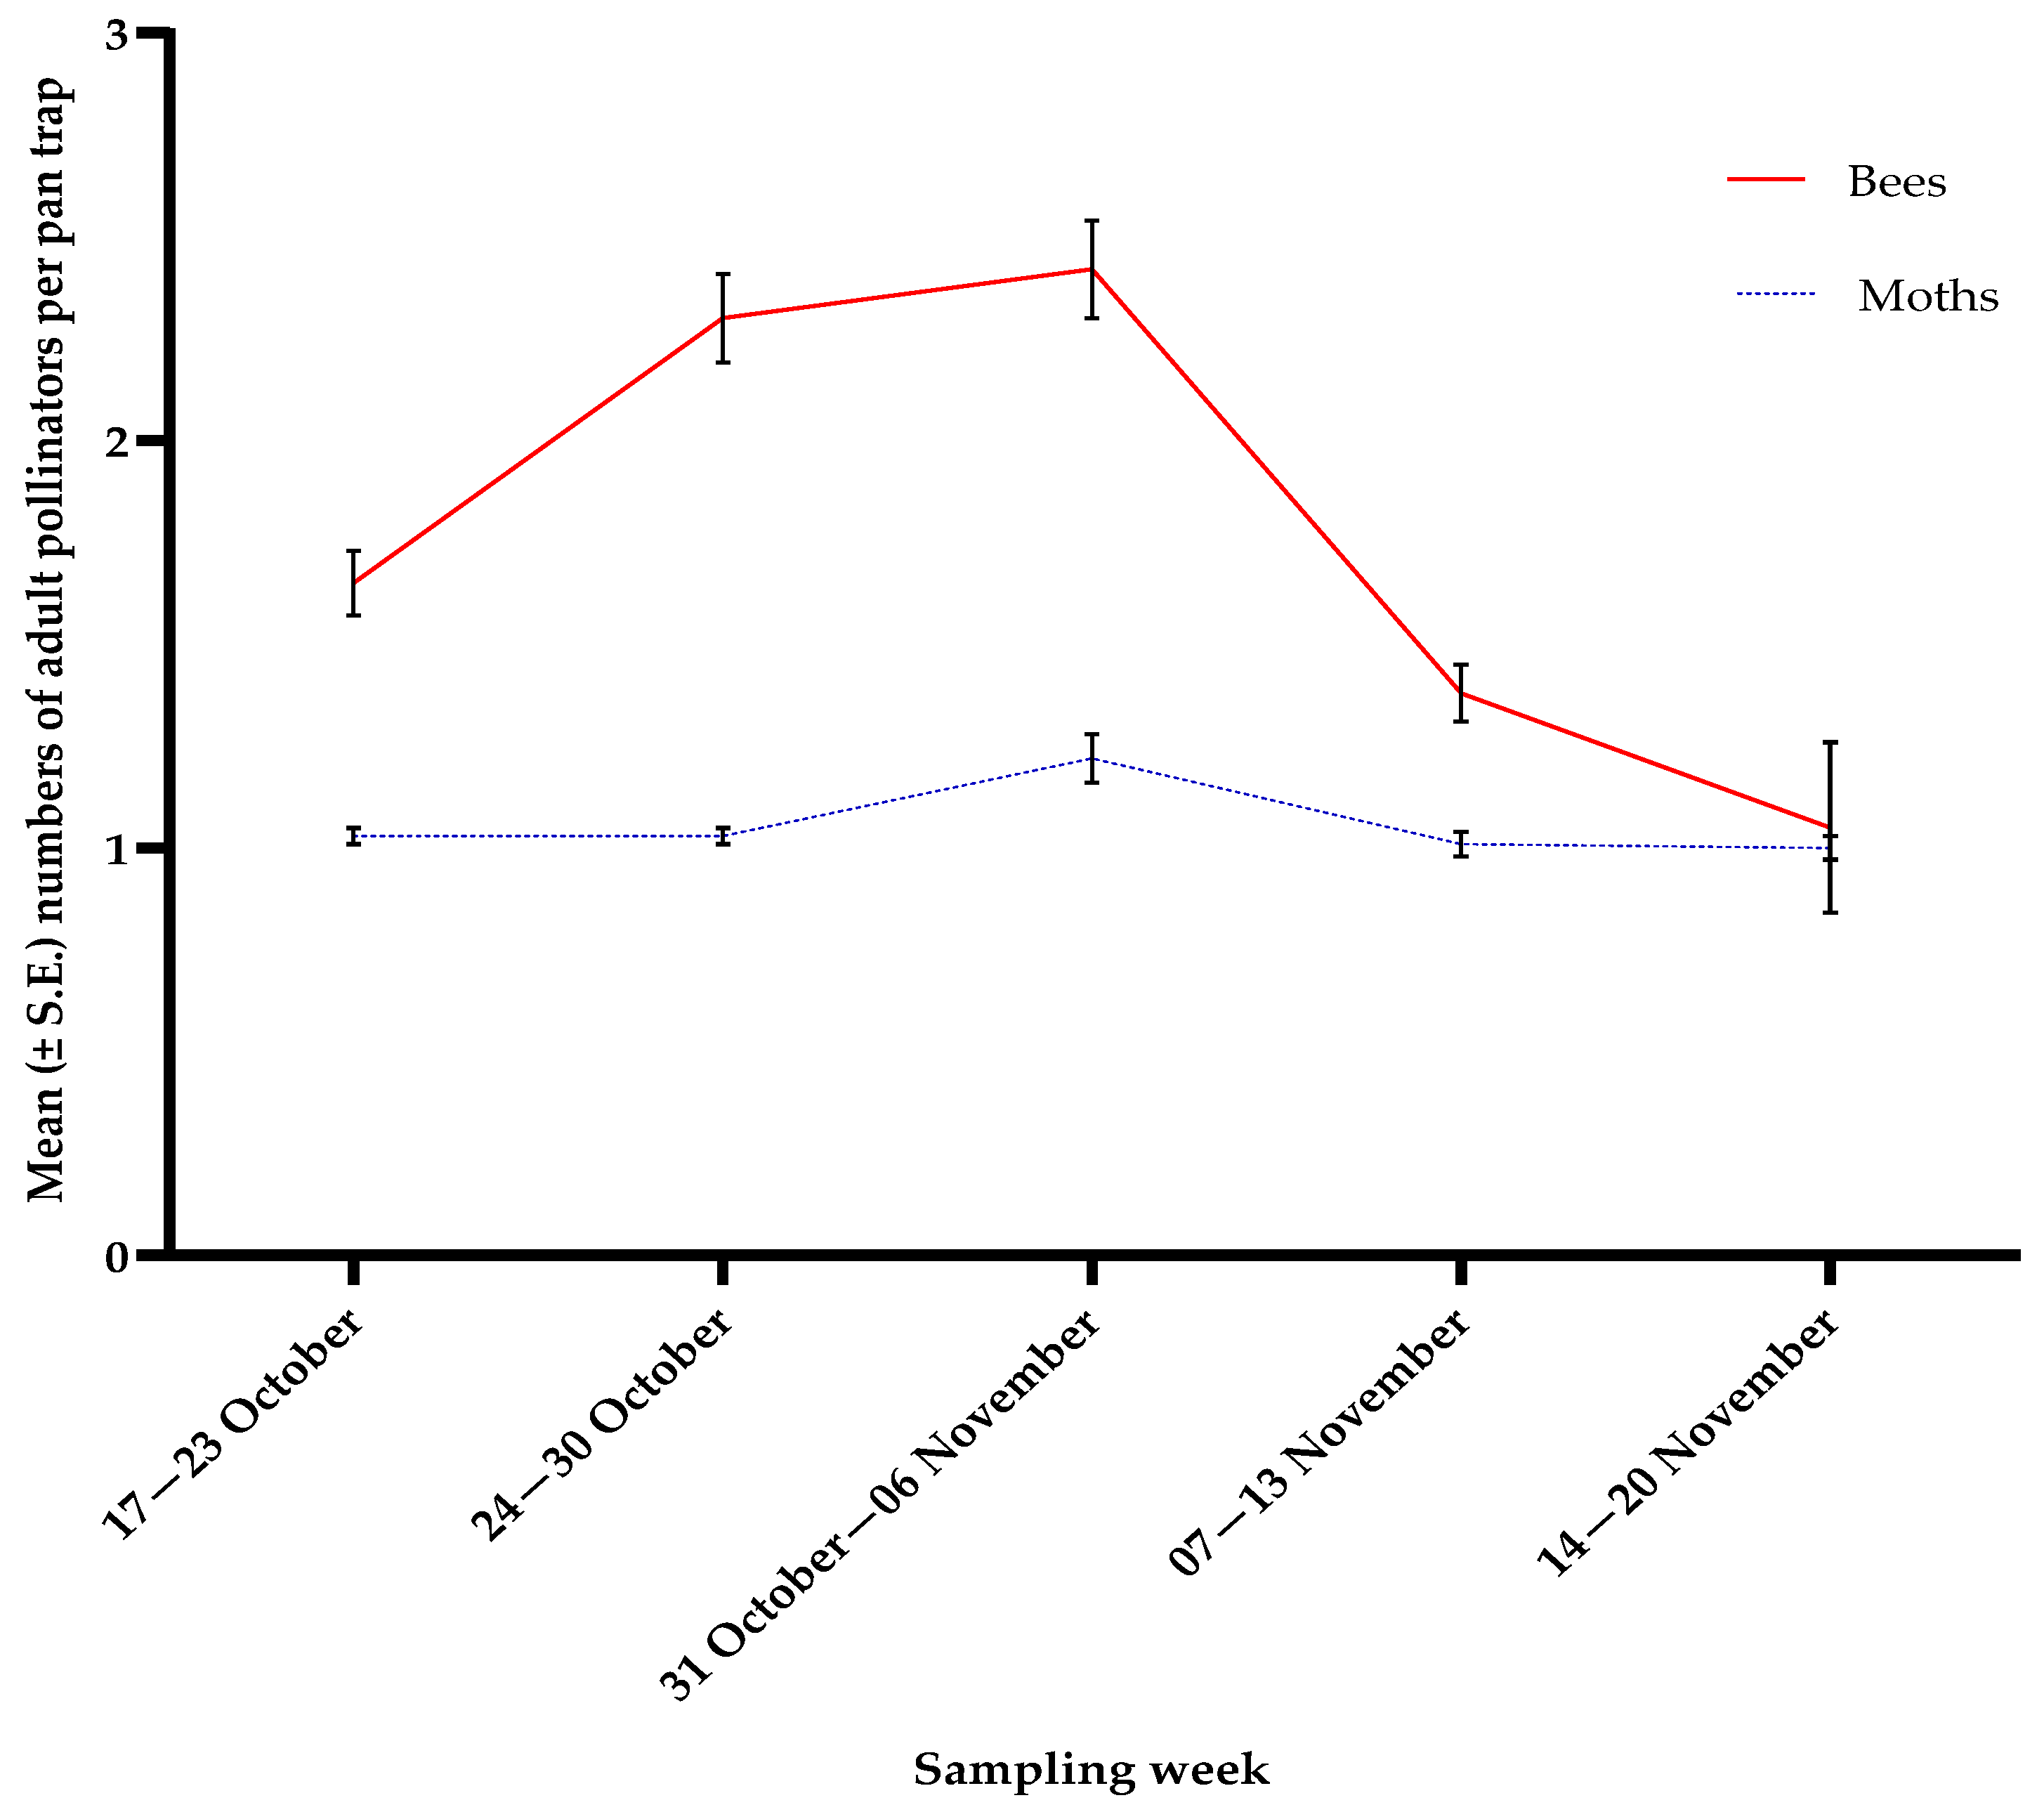
3.3. Pollinators
3.4. Correlations Between Insect Counts and Weather Factors
4. Discussion
5. Conclusions
Supplementary Materials
Author Contributions
Funding
Data Availability Statement
Acknowledgments
Conflicts of Interest
References
- USDA-NASS Summary by Crop Area Cultivated: 2022; Department of Agriculture, National Agricultural Statistics Service: Harrisburg, PA, USA, 2022.
- Stubbs, K. Georgia Farm Gate Value Report 2022. University of Georgia College of Agricultural and Environmental Sciences. Report No. AR-24-01. 2024. Available online: https://caed.uga.edu/content/dam/caes-subsite/caed/publications/annual-reports-farm-gate-value-reports/2022%20Farm%20Gate%20Value%20Report.pdf (accessed on 10 February 2024).
- USDA-NASS Crop Values 2024 Summary; Department of Agriculture, National Agricultural Statistics Service: Harrisburg, PA, USA, 2025.
- Sharma, A.; Rana, C.; Shiwani, K. Important insect pests of cucurbits and their management. In Handbook of Cucurbits: Growth, Cultural Practices and Physiology; Pessarakli, M., Ed.; CRC Press: Boca Raton, FL, USA, 2016; pp. 327–360. [Google Scholar]
- Haber, A.I.; Pasteur, K.; Guzman, F.; Boyle, S.M.; Kuhar, T.P.; Weber, D.C. Spotted cucumber beetle (Diabrotica undecimpunctata howardi) is attracted to vittatalactone, the pheromone of striped cucumber beetle (Acalymma vittatum). J. Pest. Sci. 2023, 96, 21–27. [Google Scholar] [CrossRef]
- Li, Y.; Mbata, G.N.; Punnuri, S.; Simmons, A.M.; Shapiro-Ilan, D.I. Bemisia tabaci on vegetables in the Southern United States: Incidence, impact, and management. Insects 2021, 12, 198. [Google Scholar] [CrossRef] [PubMed]
- Mbata, G.N.; Li, Y.; Warsi, S.; Simmons, A.M. Susceptibility of yellow squash and zucchini cultivars to the sweetpotato whitefly, Bemisia tabaci Gennadius (MEAM1), in the southeastern United States. Insects 2024, 15, 429. [Google Scholar] [CrossRef] [PubMed]
- McLeod, P. Identification, Biology and Management of Insects Attacking Commercially Produced Vegetables in Arkansas; University of Arkansas: Fayetteville, AR, USA, 2008. [Google Scholar]
- Gangwar, R.K.; Gangwar, C. Lifecycle, distribution, nature of damage and economic importance of whitefly, Bemisia tabaci (Gennadius). Acta Sci Agric. 2018, 2, 36–39. [Google Scholar]
- Abrahamian, P.E.; Abou-Jawdah, Y. Whitefly-transmitted criniviruses of cucurbits: Current status and future prospects. Virusdisease. 2014, 25, 26–38. [Google Scholar] [CrossRef]
- Srinivasan, R. Whitefly and Whitefly Transmitted Viruses in Squash Production. Srinivasan Lab. 2022. Available online: https://site.caes.uga.edu/srinivasanlab/2022/03/whiteflies-and-whitefly-transmitted-viruses-in-squash-production/ (accessed on 10 June 2024).
- Painkra, K.L.; Kerketta, A.; Jha, M.K. Pest management of cucurbits. J. Entomol. Zool. Stud. 2019, 7, 1371–1373. [Google Scholar]
- Horowitz, A.R.; Ghanim, M.; Roditakis, E.; Nauen, R.; Ishaaya, I. Insecticide resistance and its management in Bemisia tabaci species. J. Pest. Sci. 2020, 93, 893–910. [Google Scholar] [CrossRef]
- Bhat, P.S.; Kumar, N.P.; Ranganath, H.R.; Saroja, S. Pests and their management in cucurbits. In Trends in Horticultural Entomology; Springer: Singapore, 2022; pp. 1013–1030. [Google Scholar] [CrossRef]
- Gergerich, R.C.; Scott, H.A.; Fulton, J.P. Evaluation of Diabrotica beetles as vectors of plant viruses. In Methods for the Study of Pest Diabrotica; Krysan, J.L., Miller, T.A., Eds.; Springer: New York, NY, USA, 1986; pp. 227–249. [Google Scholar]
- Palumbo, J.C.; Horowitz, A.R.; Prabhaker, N. Insecticidal control and resistance management for Bemisia tabaci. Crop. Prot. 2001, 20, 739–765. [Google Scholar] [CrossRef]
- Nyoike, T.W.; Liburd, O.E. Effect of living (buckwheat) and UV reflective mulches with and without imidacloprid on whiteflies, aphids and marketable yields of zucchini squash. Int. J. Pest. Manag. 2010, 56, 31–39. [Google Scholar] [CrossRef]
- Dent, D.; Binks, R.H. Host plant resistance. In Insect Pest Management, 3rd ed.; Dent, D., Binks, R.H., Eds.; CAB International: Wallingford, UK, 1991; pp. 103–150. [Google Scholar]
- Horber, E. Types and classification of resistance. In Breeding Plants Resistant to Insects; Maxwell, F.G., Jennings, P.R., Eds.; Wiley: New York, NY, USA, 1980; pp. 15–21. [Google Scholar]
- Mitchell, C.; Brennan, R.M.; Graham, J.; Karley, A.J. Plant defense against herbivorous pests: Exploiting resistance and tolerance traits for sustainable crop protection. Front. Plant Sci. 2016, 7, 1132. [Google Scholar] [CrossRef]
- Smith, H.A.; Shrestha, D.; van Santen, E.; Masroor, Q.; Wong, A. Development of Bemisia tabaci MEAM1 and MED on tomato (Solanum lycopersicum) alone and in a mixed population. Fla. Entomol. 2020, 103, 72–79. [Google Scholar] [CrossRef]
- Eigenbrode, S.D.; Ding, H.; Shiel, P.; Berger, P.H. Volatiles from potato plants infected with potato leafroll virus attract and arrest the virus vector, Myzus persicae (Homoptera: Aphididae). Proc. Biol. Sci. 2002, 269, 455–460. [Google Scholar] [CrossRef]
- Werner, B.J.; Mowry, T.M.; Bosque-Pérez, N.A.; Ding, H.; Eigenbrode, S.D. Changes in green peach aphid responses to Potato leafroll virus-induced volatiles emitted during disease progression. Environ. Entomol. 2009, 38, 1429–1438. [Google Scholar] [CrossRef] [PubMed]
- Rajabaskar, D.; Ding, H.; Wu, Y.; Eigenbrode, S.D. Behavioral responses of green peach aphid, Myzus persicae (Sulzer), to the volatile organic compound emissions from four potato varieties. Am. J. Potato Res. 2013, 90, 171–178. [Google Scholar] [CrossRef]
- Scott, R.A.; Worrall, W.D.; Frank, W.A. Screening for resistance to Russian wheat aphid in triticale. Crop Sci. 1991, 31, 32–36. [Google Scholar] [CrossRef]
- Tiffin, P. Mechanisms of tolerance to herbivore damage: What do we know? Evol. Ecol. 2000, 14, 523–536. [Google Scholar] [CrossRef]
- Sullivan, M.J.; Brett, C.H. Resistance of cucurbit varieties to the spotted cucumber beetle in the coastal plain of North Carolina. J. Econ. Entomol. 1971, 64, 1205–1208. [Google Scholar] [CrossRef]
- Margolies, D.C.; Nechols, J.R.; Vogt, E.A. Rapid adaptation of squash bug, Anasa tristis, populations to a resistant cucurbit cultivar. Entomol. Exp. Appl. 1998, 89, 65–70. [Google Scholar] [CrossRef]
- Baldin, E.L.; Marchi, L.S.; Schlick, E.C. Resistance of squash cultivars to Aphis gossypii. Hortic. Bras. 2009, 27, 366–370. [Google Scholar] [CrossRef]
- Tooker, J.F.; Frank, S.D. Genotypically diverse cultivar mixtures for insect pest management and increased crop yields. J. Appl. Ecol. 2012, 49, 974–985. [Google Scholar] [CrossRef]
- Free, J.B. Insect Pollination of Crops, 2nd ed.; Academic Press: London, UK, 1993; 684p. [Google Scholar]
- Nicolson, S.W. Sweet solutions: Nectar chemistry and quality. Philos. Trans. R Soc. B. 2022, 377, 20210163. [Google Scholar] [CrossRef] [PubMed]
- Adler, L.S.; Bronstein, J.L. Attracting antagonists: Does floral nectar increase leaf herbivory? Ecology 2004, 85, 1519–1526. [Google Scholar] [CrossRef]
- Strauss, S.Y.; Siemens, D.H.; Decher, M.B.; Mitchell-Olds, T. Ecological costs of plant resistance to herbivores in the currency of pollination. Evolution 1999, 53, 1105–1113. [Google Scholar] [CrossRef]
- Hare, J.D. Effects of plant variation on herbivore-natural enemy interactions. In Plant Resistance to Herbivores and Pathogens; Fritz, R.S., Simms, E.L., Eds.; The University of Chicago Press: Chicago, IL, USA, 1992; pp. 278–298. [Google Scholar]
- Fatouros, N.E.; Dicke, M.; Mumm, R.; Meiners, T.; Hilker, M. Foraging behavior of egg parasitoids exploiting chemical information. Behav. Ecol. 2008, 19, 677–689. [Google Scholar] [CrossRef]
- SoilWeb, 2nd ed.; University of California: Davis, CA, USA; Available online: https://casoilresource.lawr.ucdavis.edu/gmap/ (accessed on 21 February 2024).
- Hicks-Hamblin, K. 21 of the Best Summer Squash Varieties for your Garden. 2023. Available online: https://gardenerspath.com/plants/vegetables/best-summer-squash-varieties/#Early-Summer (accessed on 21 April 2023).
- Seedway LLC. Available online: https://www.seedway.com/vegetable-seed/seedway_2025-us-commercial-vegetable-seed-catalog/ (accessed on 1 January 2025).
- Amazon, Mountain Valley Seed Company Store. Available online: https://www.amazon.com/stores/MountainValleySeedCompany/page (accessed on 1 January 2025).
- Cornell University. Disease-Resistant Cucurbit Varieties. 2024. Available online: https://www.vegetables.cornell.edu/pest-management/disease-factsheets/disease-resistantvegetable-varieties/disease-resistant-cucurbit-varieties/ (accessed on 4 September 2024).
- Paris, H.S.; Burger, Y.; Schaffer, A.A. Genetic variability introgression of horticulturally valuable traits in squash pumpkins of Cucurbita pepo. Isr. J. Plant Sci. 2006, 54, 223–231. [Google Scholar] [CrossRef]
- Ferris, H.; Ball, D.; Beem, L.; Gudmundson, L. Using nematode count data in crop management decisions. Calif. Agric. 1986, 40, 12–14. [Google Scholar]
- Nature Guard. What Time of Day are Pests Most Active? MyNatureGuard. n.d. Available online: https://mynatureguard.com/blog/what-time-of-day-are-pests-most-active/ (accessed on 21 February 2024).
- Gill, K.A.; O’Neal, M.E. Survey of soybean insect pollinators: Community identification and sampling method analysis. Environ. Entomol. 2015, 44, 488–498. [Google Scholar] [CrossRef]
- Campbell, J.W.; Hanula, J.L. Efficiency of Malaise traps and colored pan traps for collecting flower visiting insects from three forested ecosystems. J. Insect Conserv. 2007, 11, 399–408. [Google Scholar] [CrossRef]
- Li, Y.; Mbata, G.N.; Simmons, A.M. Population dynamics of insect pests and beneficials on different snap bean cultivars. Insects 2023, 14, 230. [Google Scholar] [CrossRef]
- Mohamed, S.; Abdullah, S.N.; Musa, N.S.; Ngah, N. Population abundance of insect trapped on different colours of sticky trap in pumpkin (Cucurbita moschata) field. J. Agrobiotechnology 2020, 11, 103–111. [Google Scholar]
- Dawood, M.Z. Susceptibility of certain commonly cultivated squash and cucumber cultivars to Bemisia tabaci (Genn.) (Homoptera: Aleyrodidae) in Beni-Suef Governorate. Egypt. J. Agric. Res. 1999, 77, 1075–1080. [Google Scholar] [CrossRef]
- Novero, E.S.; Painter, R.H.; Hall, C.V. Interrelations of the squash bug, Anasa tristis, and six varieties of squash (Cucurbita spp.). J. Econ. Entomol. 1962, 55, 912–919. [Google Scholar] [CrossRef]
- Brett, C.H.; McCombs, C.L.; Daugherty, D.M. Resistance of squash varieties to the pickleworm and the value of resistance to insecticidal control. J. Econ. Entomol. 1961, 54, 1191–1197. [Google Scholar] [CrossRef]
- Gui, H.L. Susceptibility of Bean Varieties to Insect Infestation; Ohio Agricultural Experiment Station: Wooster, OH, USA, 1945; p. 112. [Google Scholar]
- Taksdal, G. Ecology of plant resistance to the tarnished plant bug, Lygus lineolaris. Ann. Entomol. Soc. Am. 1963, 56, 69–74. [Google Scholar] [CrossRef]
- Wolfenbarger, D.; Sleesman, J.P. Resistance in common bean lines to the potato leafhopper. J. Econ. Entomol. 1961, 54, 846–849. [Google Scholar] [CrossRef]
- Hagel, G.T. Lygus spp.: Damage to beans by reducing yields, seed pitting, and control by varietal resistance and chemical sprays. J. Econ. Entomol. 1978, 71, 613–615. [Google Scholar] [CrossRef]
- Jesus, F.G.; Martins, F.S.; Rocha, F.S.; Boiça Júnior, A.L.; Carbonell, S.A.M.; Chiorato, A.F. Behavior of bean genotypes to attack by Bemisia tabaci (Genn.) biotype B (Hemiptera: Aleyrodidae). Arq. Inst. Biol. 2010, 77, 635–641. [Google Scholar] [CrossRef]
- Silva, A.D.; Boiça Junior, A.L.; Farias, P.R.S.; Rodrigues, N.E.L.; Souza, B.D.; Bottega, D.B.; Chiorato, A.F. Nonpreference for oviposition and antibiosis in bean cultivars to Bemisia tabaci biotype B (Hemiptera: Aleyrodidae). Rev. Colomb. Entomol. 2014, 40, 7–14. [Google Scholar]
- Silva, A.G.D.; Boiça, A.L.; Farias, P.R.D.S.; Souza, B.H.S.D.; Rodrigues, N.E.L.; Carbonell, S.A.M. Common bean resistance expression to whitefly in winter and rainy seasons in Brazil. Sci. Agric. 2019, 76, 389–397. [Google Scholar] [CrossRef]
- Li, Y.; Mbata, G.N.; Simmons, A.M.; Punnuri, S. Susceptibility of snap bean cultivars to the sweetpotato whitefly, Bemisia tabaci, in the southern United States. Crop Prot. 2022, 159, 106022. [Google Scholar] [CrossRef]
- Ghallab, M.M.; Habashi, N.H.; Iskandar, A.K.; Rizk, M.A. Sensitivity of four cucumber cultivars to some piercing sap sucking pests infestation and their impact on yield. Egypt. J. Agric. Res. 2011, 89, 1363–1373. [Google Scholar] [CrossRef]
- Jaccard, C.; Cuny, M.A.; Bustos-Segura, C.; Arce, C.C.; Giollo, L.; Glauser, G.; Benrey, B. Squash varieties domesticated for different purposes differ in chemical and physical defense against leaf and root herbivores. Front. Agron. 2021, 3, 683936. [Google Scholar] [CrossRef]
- Nault, B.A.; Huseth, A.S. Evaluating an action threshold-based insecticide program on onion cultivars varying in resistance to onion thrips (Thysanoptera: Thripidae). J. Econ. Entomol. 2016, 109, 1772–1778. [Google Scholar] [CrossRef] [PubMed]
- Candian, J.S.; Coolong, T.; Dutta, B.; Srinivasan, R.; Sparks, A.; Barman, A.; da Silva, A.L.B.R. Yellow squash and zucchini cultivar selection for resistance to cucurbit leaf crumple virus in the southeastern United States. HortTechnology 2021, 31, 504–513. [Google Scholar] [CrossRef]
- Pedigo, L.P.; Rice, M.E. Entomology and Pest Management, 6th ed.; Waveland Press: Long Grove, IL, USA, 2014. [Google Scholar]
- Logan, J.A.; Régnière, J.; Powell, J.A. Assessing the impacts of global warming on forest pest dynamics. Front. Ecol. Environ. 2003, 1, 130–137. [Google Scholar] [CrossRef]
- Parmesan, C. Ecological and evolutionary responses to recent climate change. Annu. Rev. Ecol. Evol. Syst. 2006, 37, 637–669. [Google Scholar] [CrossRef]
- Bale, J.S.; Hayward, S.A.L. Insect overwintering in a changing climate. J. Exp. Biol. 2010, 213, 980–994. [Google Scholar] [CrossRef] [PubMed]
- Kappers, I.F.; Verstappen, F.W.A.; Luckerhoff, L.L.P.; Bouwmeester, H.J.; Dicke, M. Genetic variation in jasmonic acid- and spider mite-induced plant volatile emission of cucumber accessions and attraction of the predator Phytoseiulus persimilis. J. Chem. Ecol. 2010, 36, 500–512. [Google Scholar] [CrossRef]
- Goulson, D. Bumblebees: Behaviour, Ecology, and Conservation; Oxford University Press: Oxford, UK, 2010. [Google Scholar]
- Forrest, J.R.K.; Thomson, J.D. An examination of synchrony between insect emergence and flowering in Rocky Mountain meadows. Ecol. Monogr. 2011, 81, 469–491. [Google Scholar] [CrossRef]
- Van der Sluijs, J.P.; Simon-Delso, N.; Goulson, D.; Maxim, L.; Bonmatin, J.M.; Belzunces, L.P. Neonicotinoids, bee disorders and the sustainability of pollinator services. Curr. Opin. Environ. Sustain. 2013, 5, 293–305. [Google Scholar] [CrossRef]
- Ogilvie, J.E.; Forrest, J.R.K. Interactions between bee foraging and floral resource phenology shape bee populations and communities. Curr. Opin. Insect Sci. 2017, 21, 75–82. [Google Scholar] [CrossRef] [PubMed]
- Rader, R.; Reilly, J.; Bartomeus, I.; Winfree, R. Native bees buffer the negative impact of climate warming on honey bee pollination of watermelon crops. Glob. Change Biol. 2013, 19, 3103–3110. [Google Scholar] [CrossRef] [PubMed]
- Polatto, L.P.; Chaud-Netto, J.; Alves-Junior, V.V. Influence of abiotic factors and floral resource availability on daily foraging activity of bees. J. Insect Behav. 2014, 27, 593–612. [Google Scholar] [CrossRef]
- Stowe, H.E.; Michaud, J.P.; Kim, T.N. Floral resources enhance fecundity, but not flight activity, in a specialized aphid predator, Hippodamia convergens (Coleoptera: Coccinellidae). Front. Ecol. Evol. 2021, 9, 748870. [Google Scholar] [CrossRef]
- van Asch, M.; Visser, M.E. Phenology of forest caterpillars and their host trees: The importance of synchrony. Annu. Rev. Entomol. 2007, 52, 37–55. [Google Scholar] [CrossRef]
- Amjad Bashir, M.; Batool, M.; Khan, H.; Nisar, M.S. Effect of temperature & humdity on population dynamics of insects’ pest complex of cotton crop. PLoS ONE. 2022, 17, e0263260. [Google Scholar] [CrossRef]
- Muchhadiya, D.V.; Saradava, D.A.; Kabaria, B. Population dynamics of insect pests and some of their natural enemies and their correlation with weather parameters on Bt cotton. Indian. J. Agric. Sci. 2014, 84, 572–578. [Google Scholar] [CrossRef]
- Klingauf, F. Interrelations between pests and climatic factors. In Food-Climate Interactions; Láng, G., Ed.; Springer: Dordrecht, The Netherlands, 1981; pp. 285–301. [Google Scholar]
- Karuppaiah, V.; Sujayanad, G.K. Impact of climate change on population dynamics of insect pests. World J. Agric. Sci. 2012, 8, 240–246. [Google Scholar]
- Logan, J.D.; Wolesensky, W.; Joern, A. Temperature-dependent phenology and predation in arthropod systems. Ecol. Model. 2006, 196, 471–482. [Google Scholar] [CrossRef]
- Puškadija, Z.; Štefanić, E.; Mijić, A.; Zdunić, Z.; Parađiković, N.; Florijančić, T.; Opačak, A. Influence of weather conditions on honey bee visits (Apis mellifera carnica) during sunflower (Helianthus annuus L.) blooming period. Poljoprivreda. 2007, 13, 230–233. [Google Scholar]
- Jocić, S. Stepen oplodnje kod hibrida suncokreta u 1999. godini. Zb. Rad. Instituta Za Ratar. I povrtarstvo 2000, 33, 81–90. [Google Scholar]
- Afroz, M.; Amin, M.R.; Miah, M.R.U.; Hossain, M.M. Effects of weather on the abundance and infestation of major insect pests of sweet gourd in Gazipur. Bangladesh J. Zool. 2019, 47, 285–291. [Google Scholar] [CrossRef]
- Cabrera Walsh, G.; Ávila, C.J.; Cabrera, N.; Nava, D.E.; de Sene Pinto, A.; Weber, D.C. Biology and management of pest Diabrotica species in South America. Insects 2020, 11, 421. [Google Scholar] [CrossRef] [PubMed]
- Chaudhary, M.; Sahu, P.; Singh, K.; Kumar, R.; Shukla, A.; Singh, C.; Dinkar, V.; Singh, A.K.; Singh, N.; Keval, R.; et al. Effect of Humidity on Pest and Disease Incidence in Crops. In Climate Change and Biotic Factors; Apple Academic Press: Cambridge, MA, USA, 2025; pp. 3–42. [Google Scholar]
- Yamamura, K.; Kiritani, K. A simple method to estimate the potential increase in the number of generations under global warming in temperate zones. Appl. Entomol. Zool. 1998, 33, 289–298. [Google Scholar] [CrossRef]
- Lange, H.; Økland, B.; Krokene, P. Thresholds in the life cycle of the spruce bark beetle under climate change. Interjournal Complex. Syst. 2006, 1648. [Google Scholar]
- Jaworski, T.; Hilszczański, J. The effect of temperature and humidity changes on insects development their impact on forest ecosystems in the context of expected climate change. For. Res. Pap. 2013, 74, 345–355. [Google Scholar]
- Cornell Cooperative Extension. Integrated crop and pest management guidelines for commercial vegetable production. In Cornell Cooperative Extension; Cornell University: New York, NY, USA, 2007. [Google Scholar]
- Yadav, T.; Baloda, A.S.; Jakhar, B.; Yadav, A. Impact of climate changes on insect pest and integrated pest management: A review. J. Entomol. Zool. Stud. 2019, 7, 1150–1156. [Google Scholar]

| No. | Squash Cultivar | Key Characteristics | First Bud Visible Days After Sowing (DAS) | First Flower Open Days After Sowing (DAS) | Relative Maturity (Days) | References | Seed Vendor |
|---|---|---|---|---|---|---|---|
| 1 | Early Summer | Early maturity and productivity | 34–37 | 38–41 | 53 | [38] | Burpee |
| 2 | PIC-N-PIC | High productivity | 38–40 | 44–49 | 50 | [38] | Burpee |
| 3 | Saffron | Very high yielding, sunburn resistant | 38–41 | 44–47 | 50–55 | [38] | Burpee |
| 4 | Early Prolific | High yield, early harvest | 38–40 | 44–46 | 50 | [38] | Burpee |
| 5 | Lioness | Tolerant to ZYMV, WMV, PRSV, CMV | 34–38 | 44–45 | 52 | [38] | Seedway |
| 6 | Fortune | High yield | 33–35 | 38–41 | 49 | [39] | Seedway |
| 7 | Amberpic 8455 | High germination rates | 30–32 | 36–39 | 42 | [40] | Amazon |
| 8 | Golden Goose Hybrid | Disease resistance | 28–31 | 34–37 | 40–50 | [41] | Burpee |
| 9 | Gourmet Gold Hybrid | Disease resistance | 43–45 | 49–51 | 55 | [41] | Burpee |
| 10 | Black Beauty | Open-pollinated heirloom cultivar | 38–41 | 44–48 | 50 | [38] | Burpee |
| 11 | Caserta | Open-pollinated heirloom cultivar | NA | NA | NA | [38] | Amazon |
| 12 | Grey | Heat-resistant, good general disease resistance | 32–35 | 40–43 | 45–50 | [38] | Amazon |
| 13 | Cocozelle | Resistance to powdery mildew and ZYMV | 43–45 | 49–52 | 55 | [42] | Amazon |
| 14 | Cube of Butter | Resistant to ZYMV, downy mildew, PODIV | 38–41 | 44–45 | 50 | [38] | Amazon |
| 15 | Respect | Resistant to powdery mildew, PRSV, WMV, ZYMV | 31–33 | 35–36 | 44 | [41] | Seedway |
| 16 | Golden Glory | Powdery Mildew, WMV, ZYMV | 33–35 | 38–40 | 50 | [41] | Seedway |
| 17 | Fordhook Zucchini | Resistant to Meloidogyne incognita | 45–47 | 51–53 | 57 | [43] | Burpee |
| 18 | Sure Thing Hybrid | Cold resistant | 36–37 | 42–45 | 48 | [41] | Burpee |
| 19 | Green Eclipse Zucchini | Earliest and most productive zucchini | 32–34 | 38–40 | 44 | [39] | Seedway |
| 20 | Gentry | Stress resistant, resistant to disorders | 32–33 | 44–46 | 50 | [41] | Seedway |
| Insect Pests | Sampling Method | Sampling Week |
|---|---|---|
| F-Value, p-Value | ||
| Diabrotica balteata | S | 4.09, 0.0014 |
| YSC | 3.75, 0.0028 | |
| Diaphania hyalinata | YSC | 5.51, <0.0001 |
| Acalymma vittatum | S | 5.88, <0.0001 |
| YSC | 2.24, 0.0515 | |
| Thysanoptera species | S | 3.92, 0.0020 |
| YSC | 80.60, <0.0001 |
| Insect Pests | Sampling Method | Sampling Week |
|---|---|---|
| F-Value, p-Value | ||
| Diaphania hyalinata | YSC | 10.19, <0.0001 |
| Diaphania nitidalis | YSC | 34.70, <0.0001 |
| Epilachna borealis | YSC | 5.99, <0.0001 |
| Thysanoptera species | YSC | 40.39, <0.0001 |
| S | 12.24, <0.0001 |
| Cultivar | Week 1 (4–10 October) | Week 2 (11–17 October) | Week 3 (18–24 October) | Week 4 (25–31 October) | Week 5 (1–7 November) | Week 6 (8–14 November) |
|---|---|---|---|---|---|---|
| Amberpic8455 | 1.00 ± 0.00 cA | 1.00 ± 0.00 aA | 3.67 ± 2.67 bA | 1.00 ± 0.00 cA | 1.00 ± 0.00 aA | 1.00 ± 0.00 aA |
| Black beauty | 6.33 ± 2.91 abA | 1.00 ± 0.00 aB | 1.00 ± 0.00 cB | 7.67 ± 4.41 aA | 1.00 ± 0.00 aB | 1.00 ± 0.00 aB |
| Cocozelle | 2.33 ± 1.33 bcAB | 1.00 ± 0.00 aB | 1.00 ± 0.00 cB | 5.00 ± 4.00 abA | 4.00 ± 3.00 aA | 1.00 ± 0.00 aB |
| Cube of Butter | 6.00 ± 2.52 abA | 1.00 ± 0.00 aB | 5.33 ± 4.33 abA | 1.00 ± 0.00 cB | 1.00 ± 0.00 aB | 1.00 ± 0.00 aB |
| Early Prolific | 1.00 ± 0.00 cA | 1.00 ± 0.00 aA | 1.00 ± 0.00 cA | 1.00 ± 0.00 cA | 1.00 ± 0.00 aA | 1.00 ± 0.00 aA |
| Early summer | 8.33 ± 2.40 aA | 1.00 ± 0.00 aB | 4.33 ± 3.33 bAB | 4.33 ± 3.33 abAB | 1.00 ± 0.00 aB | 1.00 ± 0.00 aB |
| Fordhook Zucchini | 6.00 ± 5.00 abAB | 1.00 ± 0.00 aB | 1.00 ± 0.00 cB | 8.33 ± 4.33 aA | 1.00 ± 0.00 aB | 1.00 ± 0.00 aB |
| Fortune | 6.33 ± 3.53 abA | 1.00 ± 0.00 aC | 4.00 ± 3.00 bAB | 4.33 ± 3.33 abAB | 1.00 ± 0.00 aC | 1.00 ± 0.00 aC |
| Gentry | 1.00 ± 0.00 cB | 1.00 ± 0.00 aB | 6.00 ± 5.00 aA | 1.00 ± 0.00 cB | 1.00 ± 0.00 aB | 1.00 ± 0.00 aB |
| Golden Glory | 1.00 ± 0.00 cB | 1.00 ± 0.00 aB | 1.00 ± 0.00 cB | 8.67 ± 4.98 aA | 1.00 ± 0.00 aB | 1.33 ± 0.33 aB |
| Golden Goose Hybrid | 4.00 ± 3.00 bAB | 1.00 ± 0.00 aC | 2.33 ± 1.33 bB | 7.00 ± 6.00 aA | 1.00 ± 0.00 aC | 1.00 ± 0.00 aC |
| Gourmet Gold Hybrid | 1.00 ± 0.00 cA | 1.00 ± 0.00 aA | 1.00 ± 0.00 cA | 1.00 ± 0.00 cA | 1.00 ± 0.00 aA | 1.00 ± 0.00 aA |
| Green Eclipse Zucchini | 1.00 ± 0.00 cB | 1.00 ± 0.00 aB | 3.33 ± 2.33 bA | 1.00 ± 0.00 cB | 1.00 ± 0.00 aB | 1.00 ± 0.00 aB |
| Grey | 2.33 ± 1.33 bcAB | 1.00 ± 0.00 aB | 1.00 ± 0.00 cB | 8.33 ± 5.46 aA | 1.00 ± 0.00 aB | 1.00 ± 0.00 aB |
| Lioness | 1.00 ± 0.00 cA | 1.00 ± 0.00 aA | 1.00 ± 0.00 cA | 1.67 ± 0.67 cA | 1.00 ± 0.00 aA | 1.33 ± 0.33 aA |
| PIC-N-PIC | 1.00 ± 0.00 cB | 1.00 ± 0.00 aB | 1.00 ± 0.00 cB | 3.00 ± 2.00 bA | 3.33 ± 2.33 aA | 1.00 ± 0.00 aB |
| Respect | 1.00 ± 0.00 cB | 1.00 ± 0.00 aB | 6.33 ± 5.33 aA | 1.00 ± 0.00 cB | 1.00 ± 0.00 aB | 1.00 ± 0.00 aB |
| Saffron | 3.00 ± 2.00 bA | 1.00 ± 0.00 aA | 4.00 ± 3.00 bA | 1.00 ± 0.00 cA | 1.00 ± 0.00 aA | 1.00 ± 0.00 aA |
| Sure Thing Hybrid | 4.33 ± 3.33 bA | 1.00 ± 0.00 aB | 2.33 ± 1.33 bAB | 1.00 ± 0.00 cB | 1.00 ± 0.00 aB | 1.00 ± 0.00 aB |
| Insect Pests | Sampling Method | Sampling Week |
|---|---|---|
| F-Value, p-Value | ||
| Diabrotica balteata | YSC | 11.57, <0.0001 |
| Diabrotica undecimpunctatahowardi | S | 12.53, <0.0001 |
| Anasa tristis | S | 4.00, 0.0039 |
| YSC | 2.82, 0.0265 |
| Season | Sampling Method | Sampling Week |
|---|---|---|
| F-Value, p-Value | ||
| Summer 2021 (21 June–1 August) | S | 13.30, < 0.0001 |
| YSC | 26.24, < 0.0001 | |
| Fall 2021 (4 October–14 November) | YSC | 9.66, < 0.0001 |
| Season | Pollinators | Sampling Week |
|---|---|---|
| F-Value, p-Value | ||
| Summer 2021 (21 June–1 August) | Apis mellifera, Bombus species, Xylocopa species, Halictus species | 5.00, < 0.0002 |
| Dolichovespula maculata, Vespula germanica, and Ammophila species | 3.71, 0.003 | |
| Fall 2021 (4 October–14 November) | Atteva aurea | 5.17, 0.0001 |
| Apis mellifera, Bombus species, Xylocopa species, Halictus species | 6.09, < 0.0001 | |
| Dolichovespula maculata, Vespula germanica, and Ammophila species | 20.81, < 0.0001 | |
| Fall 2022 (17 October–20 November) | Atteva aurea | 7.90, 0.0001 |
| Apis mellifera, Bombus species, Xylocopa species, Halictus species | 6.09, < 0.0001 |
Disclaimer/Publisher’s Note: The statements, opinions and data contained in all publications are solely those of the individual author(s) and contributor(s) and not of MDPI and/or the editor(s). MDPI and/or the editor(s) disclaim responsibility for any injury to people or property resulting from any ideas, methods, instructions or products referred to in the content. |
© 2025 by the authors. Licensee MDPI, Basel, Switzerland. This article is an open access article distributed under the terms and conditions of the Creative Commons Attribution (CC BY) license (https://creativecommons.org/licenses/by/4.0/).
Share and Cite
Warsi, S.; Li, Y.; Mbata, G.N.; Simmons, A.M. Insect Abundance and Richness in Squash Agroecosystems of Georgia, United States: The Role of Cultivar Selection and Weather Conditions. Agronomy 2025, 15, 1411. https://doi.org/10.3390/agronomy15061411
Warsi S, Li Y, Mbata GN, Simmons AM. Insect Abundance and Richness in Squash Agroecosystems of Georgia, United States: The Role of Cultivar Selection and Weather Conditions. Agronomy. 2025; 15(6):1411. https://doi.org/10.3390/agronomy15061411
Chicago/Turabian StyleWarsi, Sanower, Yinping Li, George N. Mbata, and Alvin M. Simmons. 2025. "Insect Abundance and Richness in Squash Agroecosystems of Georgia, United States: The Role of Cultivar Selection and Weather Conditions" Agronomy 15, no. 6: 1411. https://doi.org/10.3390/agronomy15061411
APA StyleWarsi, S., Li, Y., Mbata, G. N., & Simmons, A. M. (2025). Insect Abundance and Richness in Squash Agroecosystems of Georgia, United States: The Role of Cultivar Selection and Weather Conditions. Agronomy, 15(6), 1411. https://doi.org/10.3390/agronomy15061411