Article

Weed Seedbank Changes Associated with Temporary Tillage After Long Periods of No-Till

by
Fernando Oreja
1,*,
Marianne Torcat Fuentes
2,
Antonio Barrio
2,
Dario Javier Schiavinato
3,
Virginia Rosso
3 and
Elba de la Fuente
2
1
Department of Plant and Environmental Sciences, Clemson University, Clemson, SC 29631, USA
2
Departamento de Producción Vegetal, Facultad de Agronomía, Universidad de Buenos Aires, Buenos Aires C1417DSE, Argentina
3
Departamento de Recursos Naturales y Ambiente, Facultad de Agronomía, Universidad de Buenos Aires, Buenos Aires C1417DSE, Argentina
*
Author to whom correspondence should be addressed.
Agronomy 2025, 15(6), 1410; https://doi.org/10.3390/agronomy15061410
Submission received: 12 May 2025 / Revised: 3 June 2025 / Accepted: 5 June 2025 / Published: 8 June 2025

Abstract

Long-term no-till systems have led to shifts in weed communities and reduced the effectiveness of herbicide-based control. Occasional tillage is proposed as an alternative strategy to disrupt weed emergence patterns by redistributing seeds within the soil profile. This study aimed to evaluate the impact of occasional tillage on weed seedbank composition and vertical distribution of viable weed seeds and propagules within the soil profile, after more than 20 years of continuous no-till. A paired-plot experiment was conducted in Carlos Casares, Buenos Aires, Argentina, with three replications. Treatments included continuous no-till and occasional tillage (two disk harrow passes in August 2022 and April 2023) combined with three soil depths (0–5, 5–10, and 10–15 cm). Soil samples were collected in spring 2022 and fall 2023, and weed emergence was recorded under semi-controlled conditions. Overall species richness did not differ significantly between tillage treatments but was consistently greater in the upper 0–5 cm soil layer. Weed abundance also declined with depth. Five species, Chenopodium album, Stellaria media, Eleusine indica, Oxybasis macrosperma, and Heliotropium curassavicum, were frequent across treatments. Some species were exclusive to either no-till or tilled plots, for example, Datura ferox, Poa annua, and Veronica peregrina were found only in tilled plots, while Portulaca oleracea, Medicago lupulina, and Trifolium repens were exclusive to no-till plots. These results indicate that occasional tillage alters species composition and vertical seed distribution in the seedbank without significantly reducing total richness or abundance, offering an additional, but not always effective, tool to influence weed community structure in no-till systems.

1. Introduction

Agriculture in the Pampas region of Argentina is characterized by simplified production systems and limited diversity in agricultural activities. The region’s predominant summer crops, soybean and corn, are managed largely through no-till practices and weed management relies mainly on chemical control [1]. Over the last 30 years, the widespread adoption of no-till systems has been closely linked to the introduction of herbicide-tolerant crops, which promised both soil conservation and effective weed management [2]. However, this reliance on a few herbicides has had unintended consequences. Despite the benefits of no-till systems, such as improved soil structure and moisture retention, the repetitive use of the same herbicides has led to significant shifts in weed communities [3,4]. Many fields are now dominated by herbicide-resistant species, which are weed biotypes that have evolved to survive herbicide applications that once effectively controlled them, and herbicide-tolerant species, which are weed species that were never adequately controlled by specific herbicides. This combination is making effective weed management increasingly challenging [1,5].
In recent years, the increased presence of herbicide-tolerant species and resistant biotypes has become a persistent problem for growers, together with the environmental problems related to the reduction in biodiversity [3,6] and pollution from chemical inputs [7]. Thus, it is difficult to manage weed populations with current herbicide-based strategies alone. In addition, the shift in weed dynamics, particularly the increasing evolution of herbicide-resistant biotypes, has imposed substantial costs on agricultural production, both in terms of escalating herbicide use and diminishing the effectiveness of chemical controls [5].
Given the reduced effectiveness of chemical control against herbicide-resistant or tolerant weeds, occasional soil tillage presents a possible alternative to manage these species. Tillage impacts the dynamics of the weed seedbank by redistributing seeds across different soil layers and altering soil conditions [8] and controlling seedlings emerged, while no-till promotes the concentration of weed seeds at the soil surface [9]. Under this scenario, the tillage favors germination of some seeds by exposing them to light and temperature stimuli necessary to break dormancy [10], while deeply buried seeds, particularly those species with high light or alternating temperature requirements for germination [11], do not germinate. Additionally, there is evidence that tillage affects the habitat of certain predators and buries seeds, protecting them and reducing seed predation [12]. Thus, occasional tillage may prolong the persistence of certain species in the seedbank by burying their seeds deeper, although they may emerge later if tillage continues [13]. In this context, the tillage could alter the weed community and seedbank composition by eliminating seedlings and placing seeds outside their optimal germination zone [12].
The structure of communities is built following a set of “assembly rules” [14], which act as hierarchical biotic and abiotic filters on the species pool [15]. These filters limit the number of species based on their functional response to changes in the magnitude and characteristics of the factors associated with each environmental filter [16]. For instance, crop rotations, cover crops, tillage, crop architecture (e.g., canopy height and density), planting dates, weed control methods, fertilizer placement and timing, and harvesting practices all act as ecological filters [17] that can influence weed dispersal, establishment, and competition. Mechanical (tillage) or chemical (herbicides) weed control creates a variety of factors that impact weed populations, acting as different filters [17]. These filters can have direct effects on weed growth through variations in resource availability (light, water, and nutrients) and demographic rates (establishment, survival, mortality, and fecundity) due to the direct effects of mechanical or chemical control. Additionally, they have indirect effects, as residue and herbicide management modify the chemical, physical, and biological characteristics of the soil.
The soil seedbank plays a fundamental role in weed ecology and management serving as both a reservoir and a source of future infestations. Its composition reflects past management practices, while the vertical and horizontal distribution of seeds affects emergence patterns, control timing, and long-term population dynamics. Seedbank dynamics, including seed dormancy, longevity, and the balance between seed losses (via germination, decay, or predation) and new seed inputs, influence the persistence of weed species and the success of both chemical and non-chemical control strategies [18]. Soil characteristics such as texture, moisture, temperature, and microbial activity strongly influence seed survival, dormancy, and emergence, and therefore play a critical role in determining the likelihood and timing of future weed infestations [19]. Within the seedbank, seeds can undergo processes such as dormancy entry and exit, germination, predation, or death, which can result in changes in the number of viable seeds. Therefore, understanding seedbank dynamics is crucial for predicting future infestations, developing control strategies, and creating population models [18,20].
The objective of this study was to evaluate the impact of temporary tillage, soil depth, and sampling time on weed seedbank composition, species richness, abundance, and vertical distribution of viable weed seeds and propagules within the soil profile, after more than 20 years of continuous no-till. We hypothesized that occasional tillage would alter the vertical distribution of weed seeds in the soil profile and shift species composition, without significantly reducing overall seedbank richness or abundance. We used seedling emergence from soil samples in a controlled environment as a proxy to assess species composition and richness by depth, recognizing that this approach may not fully reflect the in-field community due to depth-related emergence constraints.

2. Materials and Methods

Experiments were conducted in an agricultural field located in Carlos Casares, Buenos Aires province, Argentina (35°38′39″ S; 61°25′49.9″ W). The study site is in the Pampas region of Argentina, a vast and productive plain characterized by flat topography and fertile Mollisol soils with a silty loam texture. The regional climate is temperate with a northeast-to-southwest precipitation gradient and a north-to-south temperature gradient. Annual rainfall ranges from 750 to 1100 mm and is concentrated in the warm season (October–March). The area is subject to alternating wet and dry periods influenced by El Niño–Southern Oscillation (ENSO) events, with prevailing humid winds from the Atlantic and variable weather patterns throughout the year [21]. The site has a no-till farming history of over 20 years, providing a relevant context for evaluating soil seedbank and weed dynamics. The cropping history in the last five years prior to the experiments is detailed in Table 1. The plots were located in a homogeneous section of the field regarding soil type, topography, crop history, management, and weed community.
Monthly precipitation during the study years was recorded in the location using standard rain gauges, while air temperature was measured with a Davis Vantage Pro2 Plus weather station (Davis Instruments, Hayward, CA, USA). Total annual rainfall amounted to 835.5 mm in 2021, 846.5 mm in 2022, 659.5 mm in 2023, and 950.5 mm in 2024. Rainfall was unevenly distributed across months, with high summer precipitation (e.g., January and February) and variable autumn rainfall across years. Monthly average maximum temperatures ranged between 19 °C and 38 °C, with warmer months typically occurring between December and February. Detailed monthly climate data are presented in Supplementary Table S1. Additionally, Supplementary Table S2 summarizes dominant weed species recorded during the study, organized by tillage system and soil depth based on emergence abundance.
Experiments were conducted using a paired-plot design with two treatments, occasional tillage and continuous no-till. Each plot measured 20 m × 3 m (60 m2), and three replicated pairs of plots (n = 3) were established in a uniform area of the field. Within each pair, one plot was maintained under continuous no-till, and the other received the occasional tillage treatment. In the tilled plots, three passes with a disk harrow penetrating the first 15 cm of soil were performed, on the same day, at the end of winter 2022 (August), approximately 60 days before sunflower planting, and again in fall 2023 (April), shortly before cereal rye planting.
Using the same experimental plots, seed banks were sampled in different sectors. in late winter, 21 August 2022, and early fall, 20 April 2023, within 1–2 days after each tillage event. In each moment, 10 soil cores per plot were randomly collected using a 5 cm diameter probe. Each core was sectioned into three depth intervals: 0–5 cm, 5–10 cm, and 10–15 cm. The samples from the same depth across all 10 cores were pooled to form a composite sample for each depth layer, resulting in a total of 6000 cm3 of soil per plot per sampling date (i.e., 2000 cm3 per depth). These dates were selected to capture potential seasonal variation in the weed seedbank response to tillage. The samples were then transported to the Facultad de Agronomia, Universidad de Buenos Aires, placed in trays three days after collection and arranged in a completely randomized design. The trays had holes to allow drainage and prevent waterlogging. Watering was applied as needed to sustain field capacity conditions.
The seedlings’ emergence was examined weekly, and species were identified over a period of eight weeks. Once recorded, seedlings were removed by cutting them at the soil surface. The process continued until no further seedlings emerged. Species identification at seedling stages was supported by botanical keys, expert consultation, photographic databases, and computer-based identification programs [22,23,24,25]. Species richness (number of species per treatment), abundance (number of individuals of each species per treatment), and frequency (percentage of treatments in which each species was present) were calculated.
A three-way ANOVA was conducted to evaluate the effects of sampling time (August 2022 and April 2023), tillage system (no-till, occasional tillage), and soil depth (0–5 cm, 5–10 cm, 10–15 cm) on mean species richness and seedling abundance. The model included the main effects of each factor and all possible two-way and three-way interactions. Separate ANOVAs were performed for each response variable, including species richness, total weed abundance, and the abundance of individual dominant species. Prior to analysis, the assumptions of normality and homogeneity of variances were checked using the Shapiro–Wilk test and Levene’s test, respectively. For abundance and richness, when assumptions were not met, data were square root-transformed. Significant differences were analyzed using Tukey’s HSD post hoc test. All analyses were performed in R version 4.1.1 (R Core Team 2024), with a significance level set at α = 0.05. Additionally, a principal components analysis (PCA) was performed using species abundance data to explore patterns in weed community composition across treatments and soil depths. The analysis was conducted in Infostat software version 2020 (Grupo InfoStat, Universidad Nacional de Córdoba, Córdoba, Argentina) [26].

3. Results

The three-way ANOVA revealed a significant interaction between soil depth and tillage system (p < 0.05) for both species richness and seedling abundance, indicating that the effect of tillage varied depending on soil depth (Table 2). Therefore, the effects of tillage and depth were further analyzed separately to better understand their influence on vertical species distribution. Sampling time had a marginal effect on richness but did not affect overall abundance. In general, the floristic composition was dominated by annual broadleaf species concentrated in the upper soil layers, particularly in no-till plots. Occasional tillage redistributed seeds and seedlings to deeper layers, decreasing richness and abundance in the surface layer (0–5 cm) and increasing them at 5–10 and 10–15 cm depths. These patterns were more pronounced in 2023.

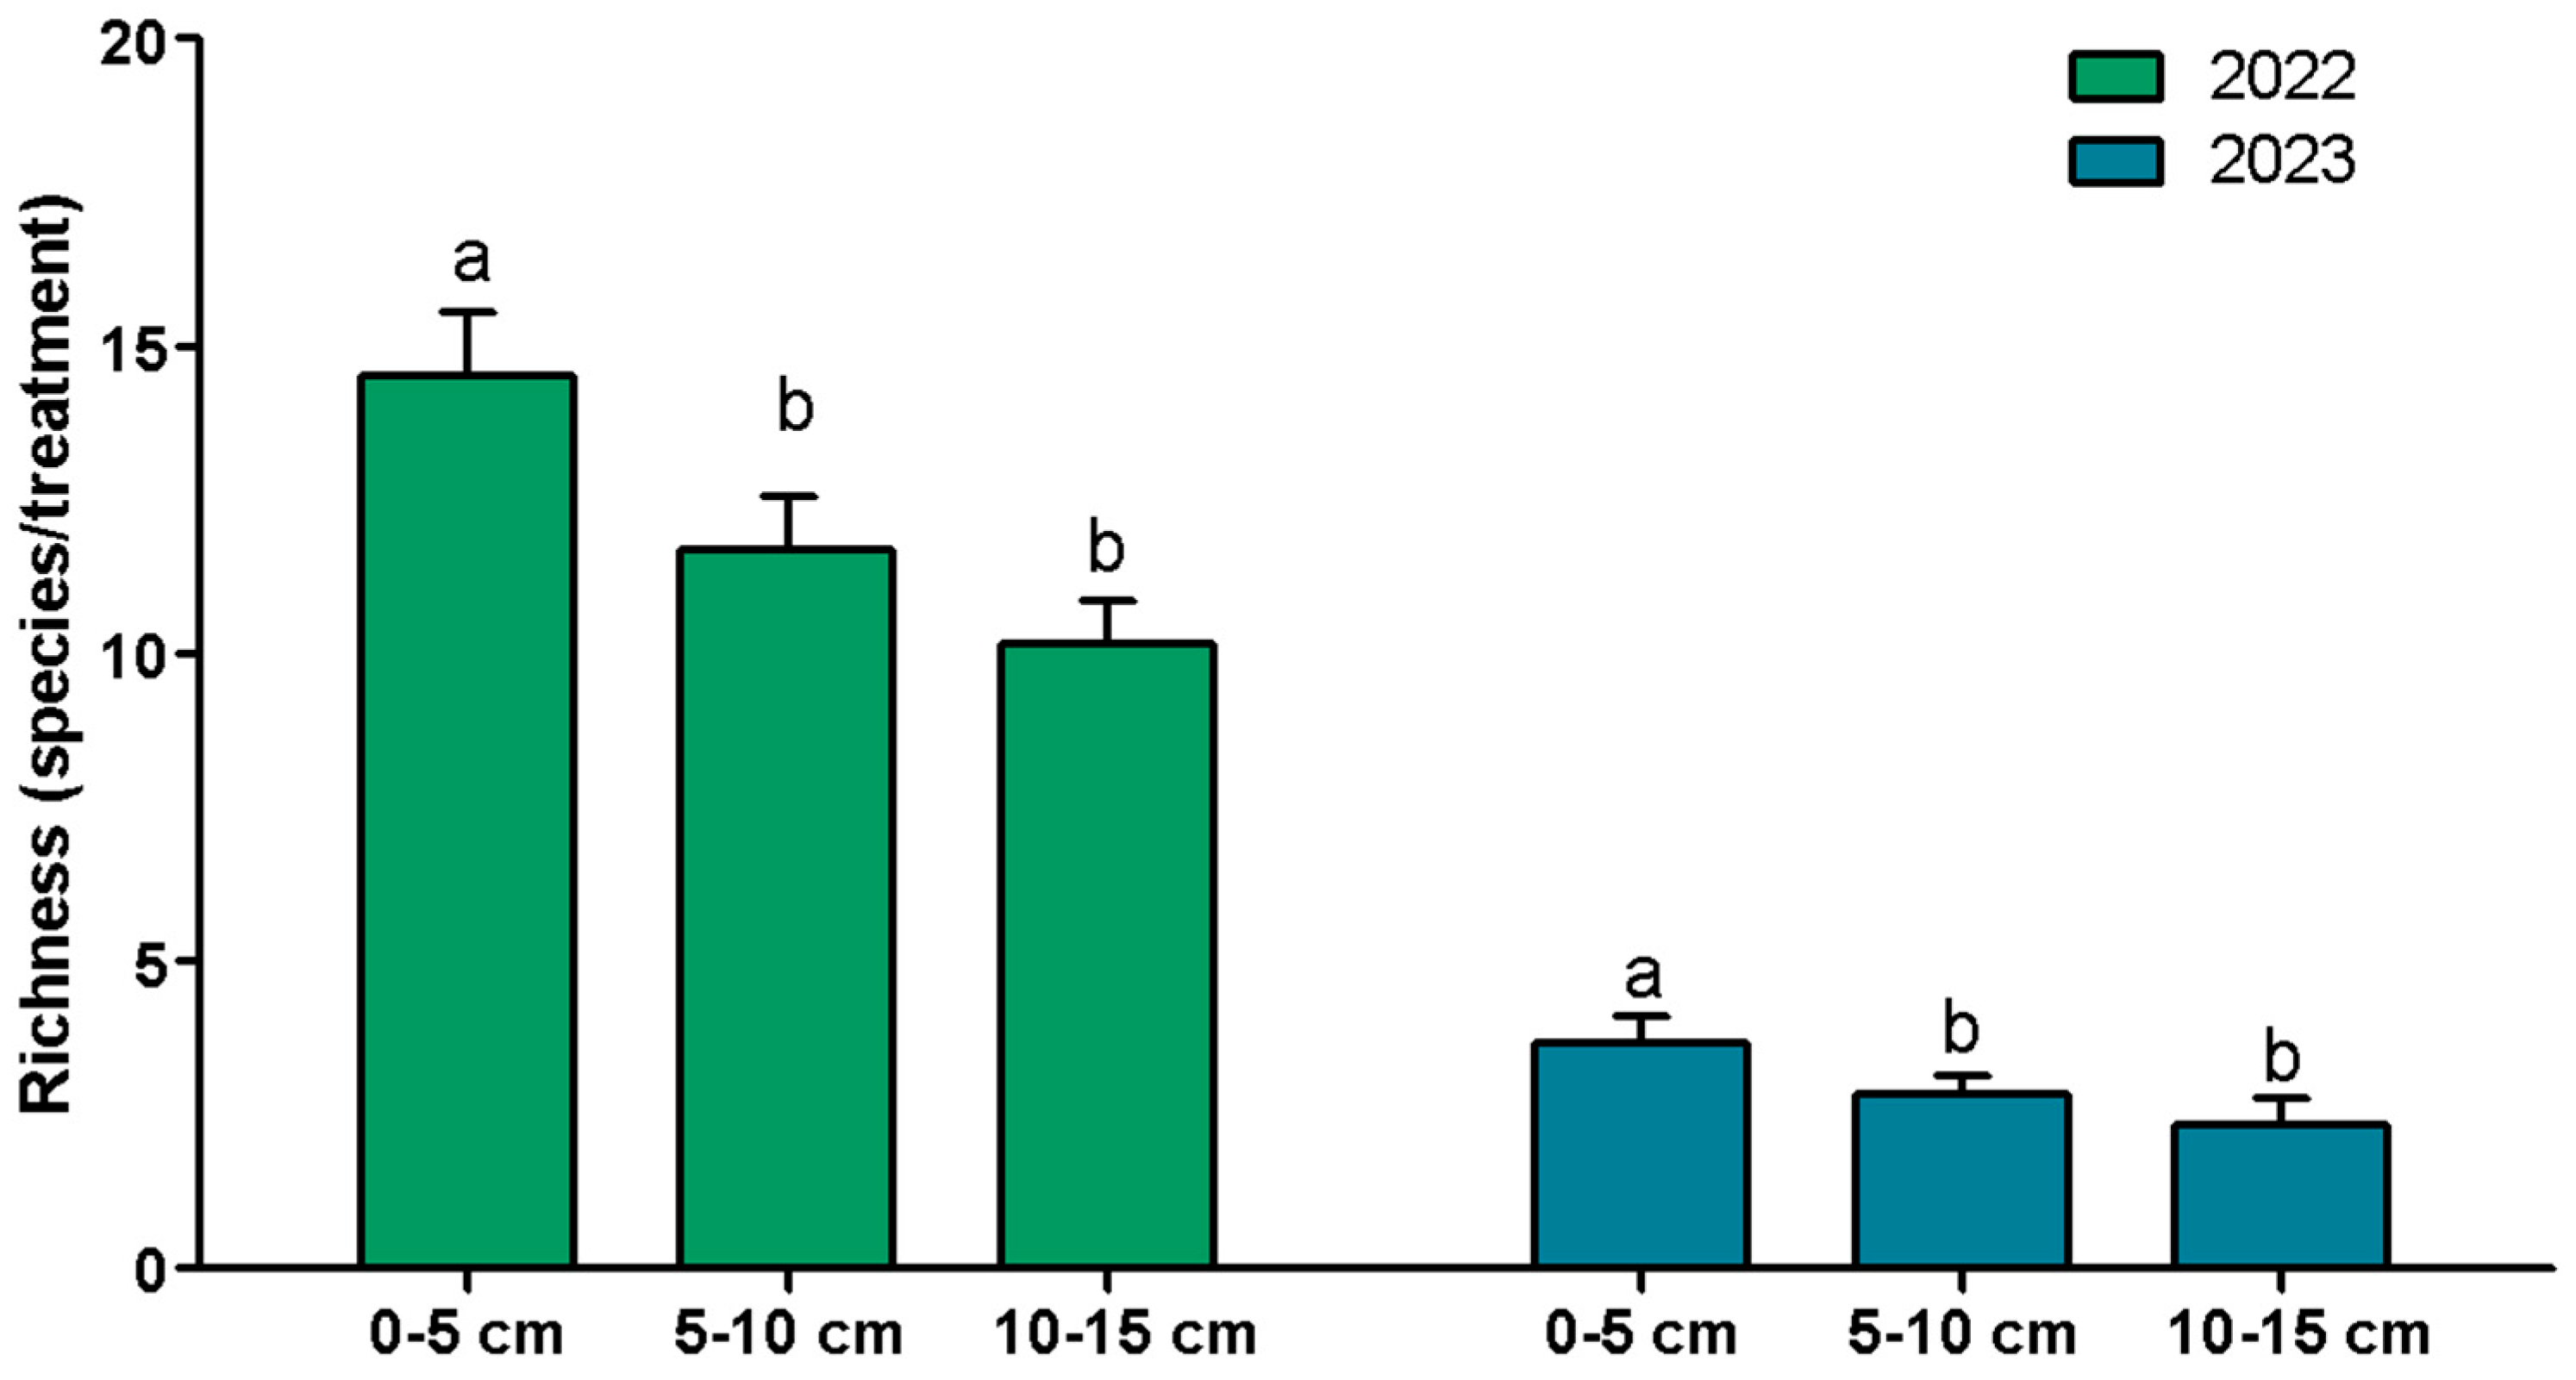
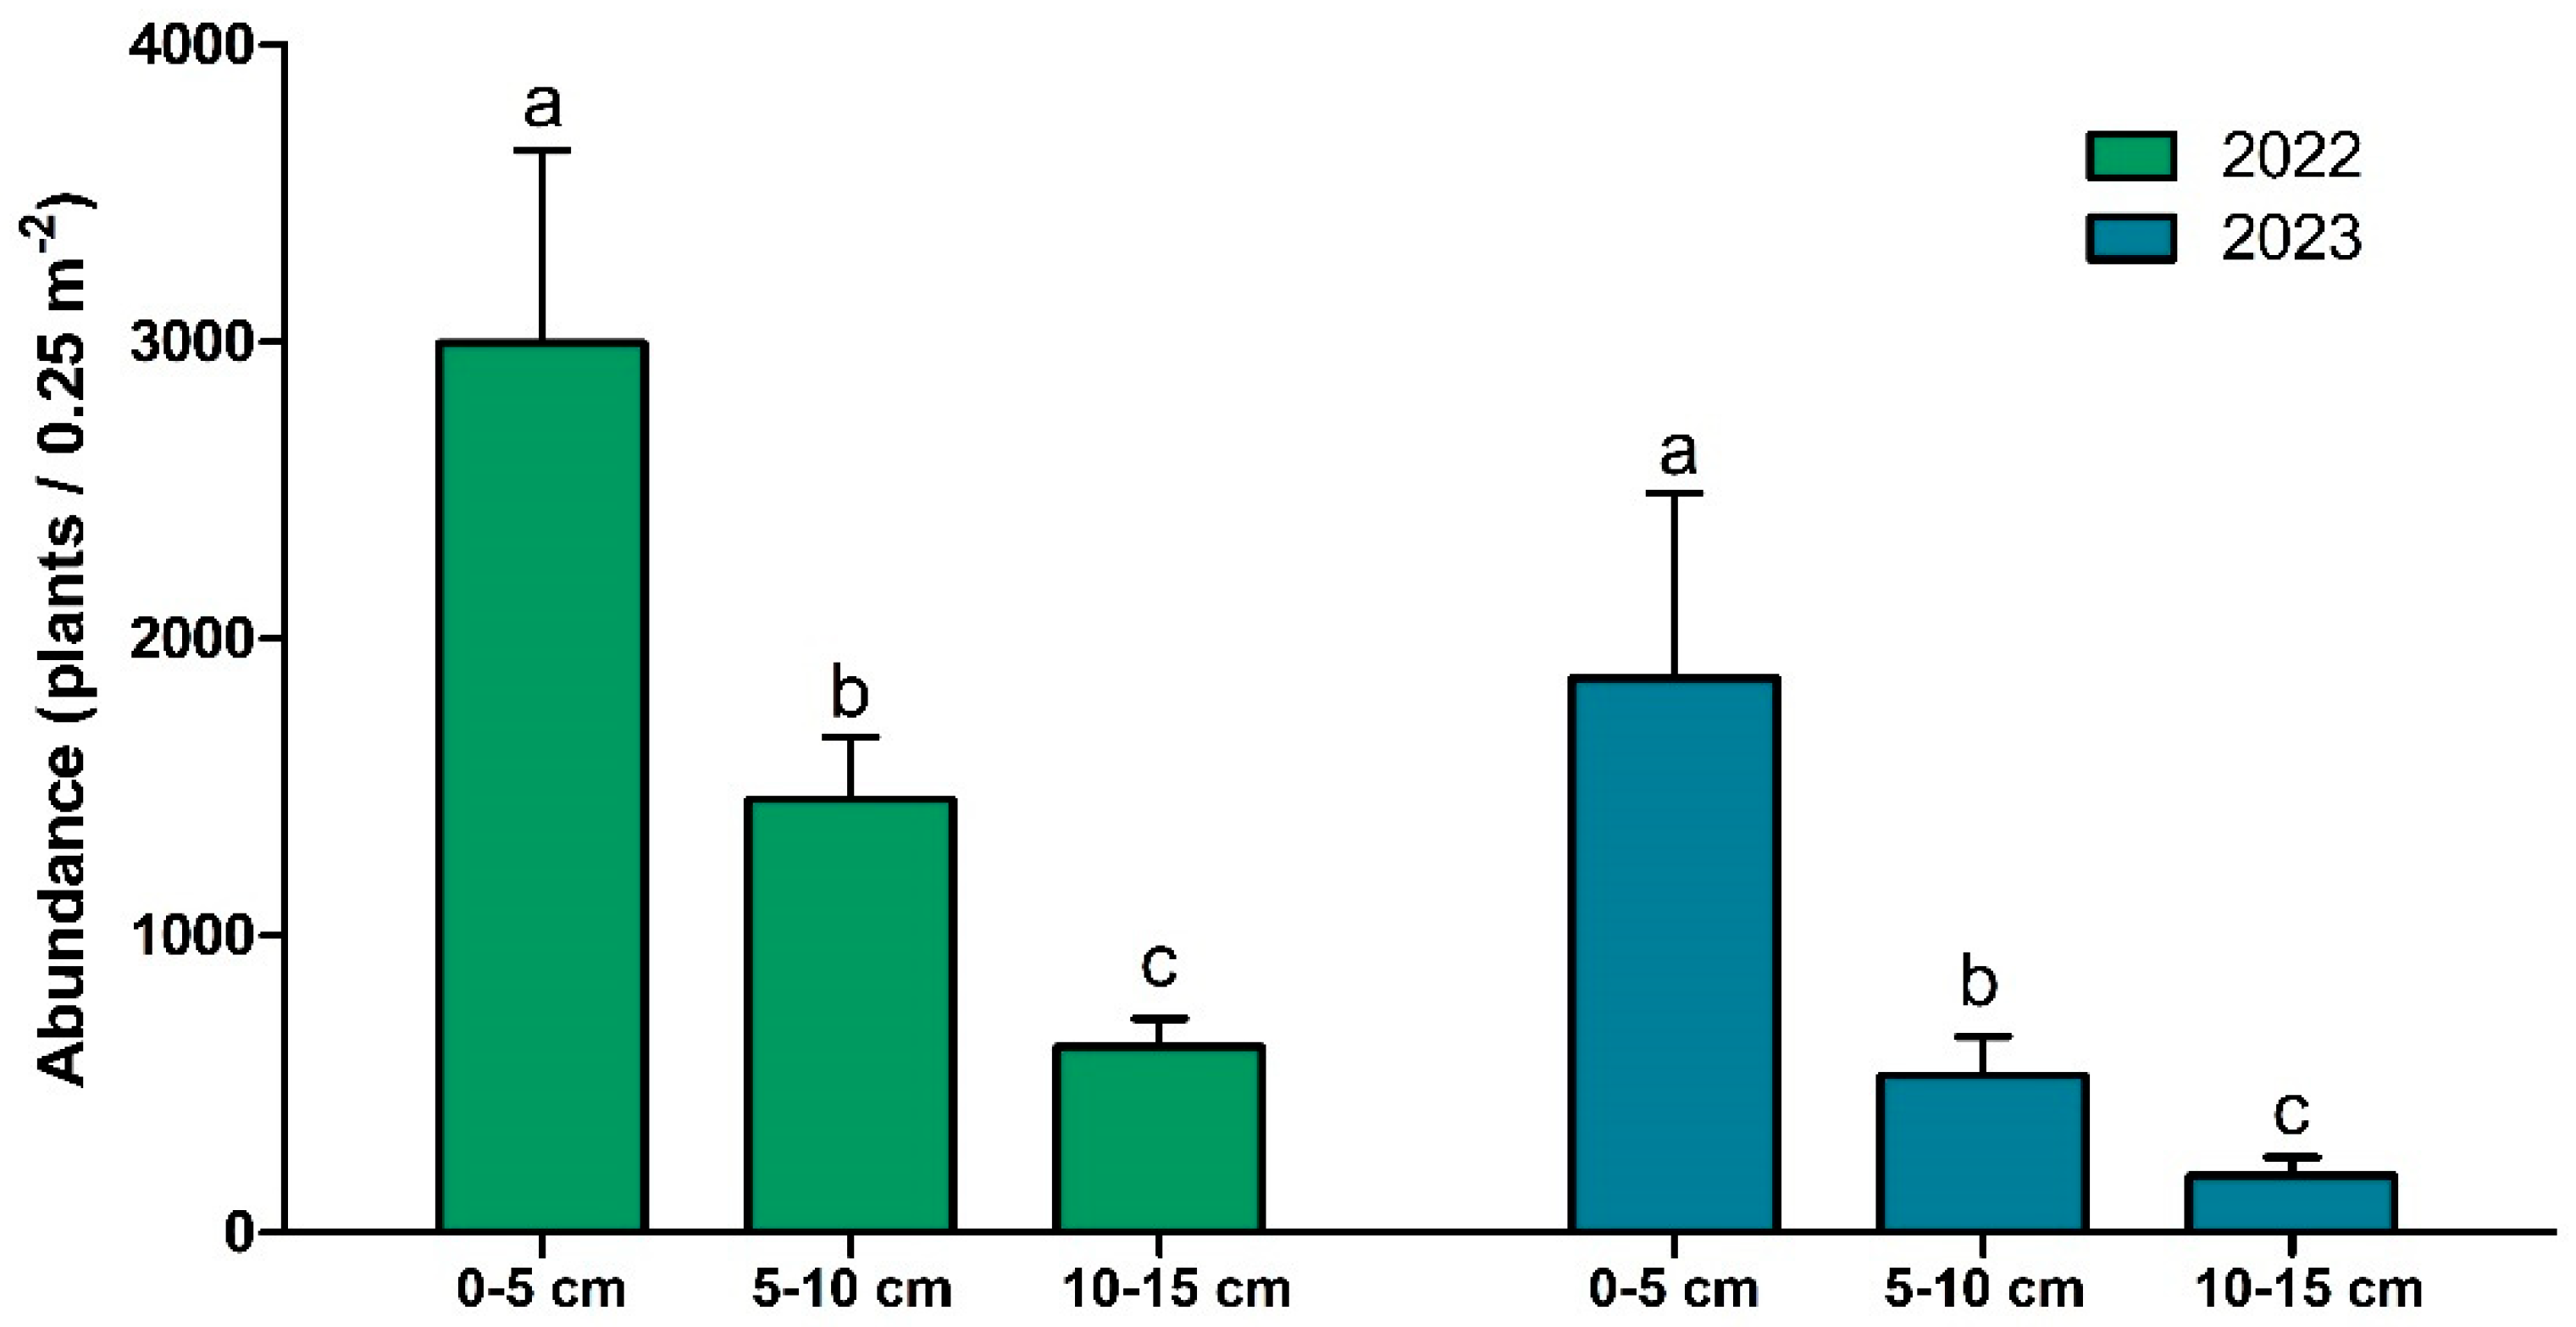
3.1. Weed Species Composition

The weed floristic composition in 2022 and 2023 shows notable shifts among treatments, as well as species richness and abundance among soil depths. In the studied soil seed banks, 33 and 11 were identified in 2022 and 2023, respectively (Table 3 and Table 4).
In 2022, the following species showed a frequency of more than 80% across all treatments: Chenopodium album, Oxybasis macrosperma, Echinochloa sp., Eleusine indica, Heliotropium curassavicum, Lepidium didymum, Nicotiana longiflora, Stellaria media, Amaranthus hybridus, Cyperus entrerianus, Dichondra repens, and Verbena bonariensis (Table 3). In 2023, this group was limited to L. didymum, S. media, and D. repens (Table 4).
In 2022, Datura ferox, Poa annua, Lythrum hyssopifolia, Setaria parviflora, and Rumex crispus were observed with occasional tillage. In contrast, Portulaca oleracea, Sesuvium americanum, Medicago lupulina, and Polygonum aviculare were present only in no-till treatments. In 2023, species like Veronica peregrina L. were observed exclusively with occasional tillage, while H. curassavicum, M. lupulina, and Trifolium repens were only found in the absence of tillage (Table 4). Differences were also observed among soil depths; for instance, Sonchus oleraceus, Vicia villosa, Conyza bonariensis, and Carduus thoermeri were present only at 0–5 cm, regardless of tillage (Table 3).

3.2. Species Richness and Abundance

No differences were observed between tillage systems in the mean species richness (p = 0.15) or abundance (p = 0.85). Additionally, no interactions were found among the factors between year, tillage system, and soil depth for these variables. However, differences were observed between years and soil depth. Mean species richness was greater (p < 0.001) in 2022, with 12 species, compared to 2023, with only three species. Abundance also differed between years (p < 0.001), with an average of 1693 plants per 0.25 m−2 in 2022, compared to 863 plants in 2023. Regarding soil depth, differences (p < 0.001) were observed in both mean richness and abundance. The 0–5 cm soil layer contained the highest number of species, with 14.5 species in 2022 and 3.7 species in 2023, which were greater (p < 0.05) than the number of species at 5–10 cm and 10–15 cm depths (Figure 1). The shallowest soil layer (0–5 cm) also exhibited the highest mean abundance (p < 0.05), with 2996 plants per 0.25 m−2 (59%) in 2022 and 1867 plants per 0.25 m−2 (62% of all the seeds) in 2023. In comparison, the 5–10 cm depth accounted for 29% of seeds in 2022 and 36% in 2023, while the 10–15 cm depth contained only 12% of seeds in 2022 and 2% in 2023 (Figure 2).

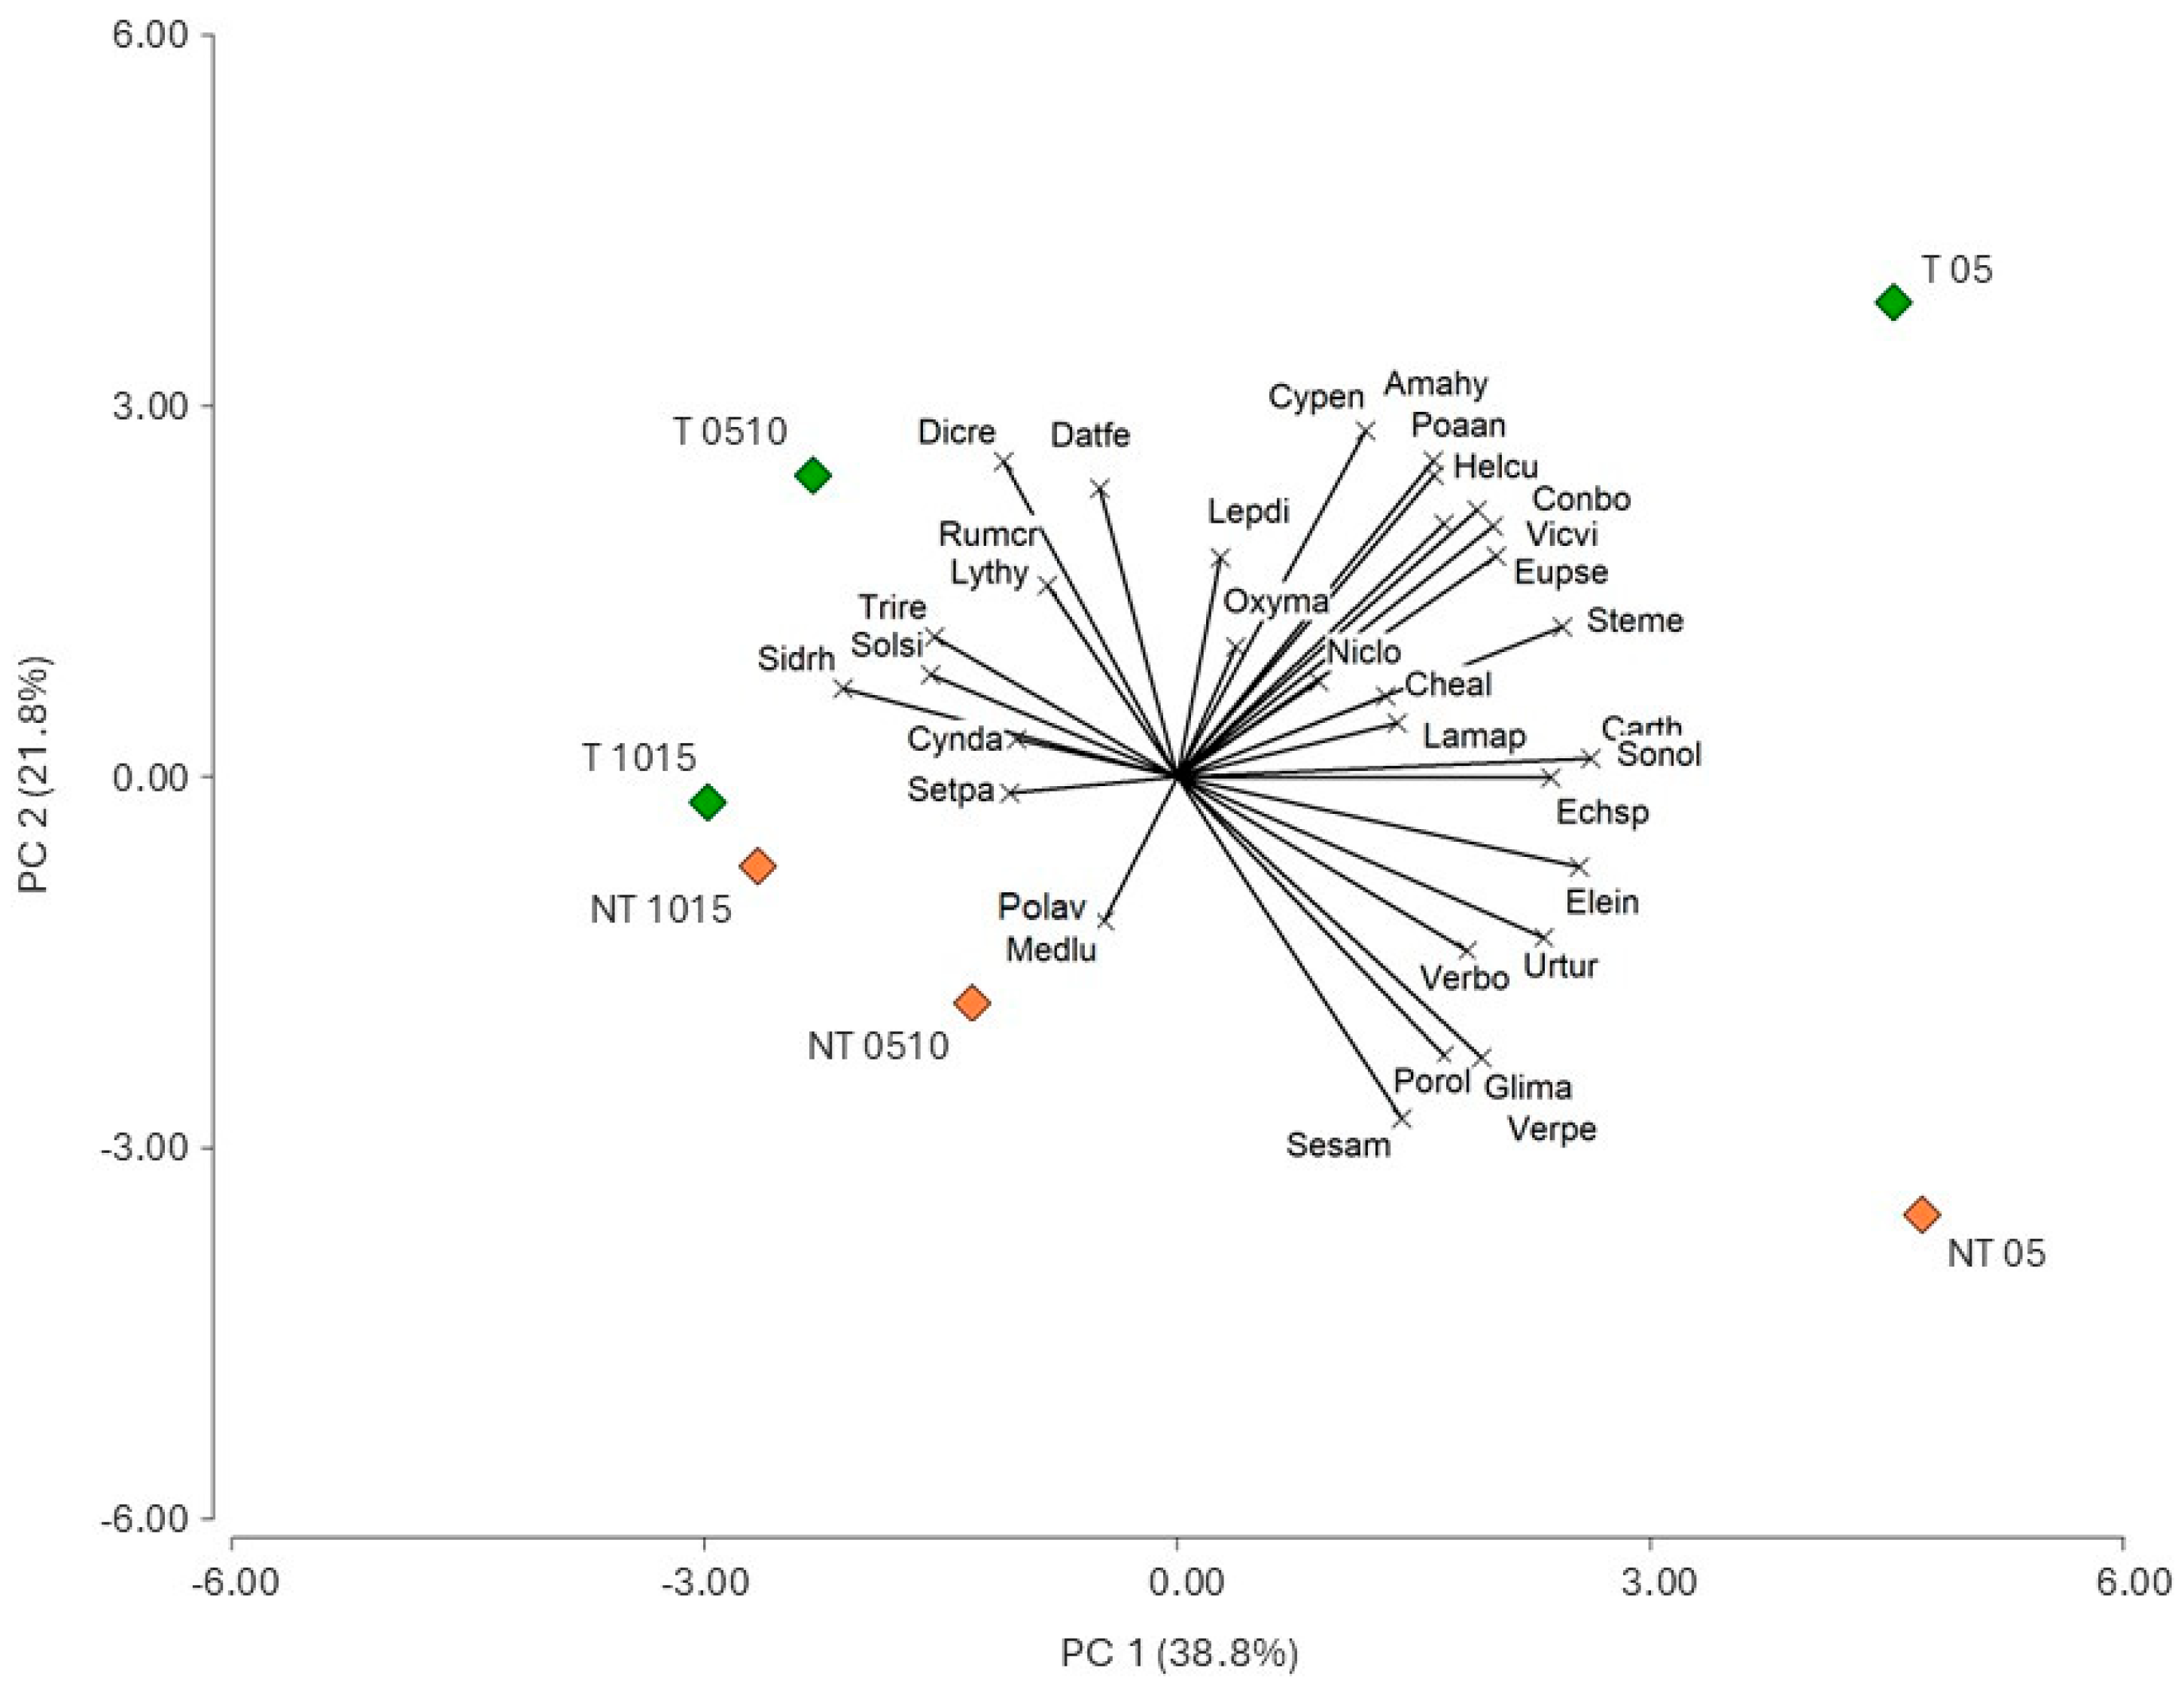
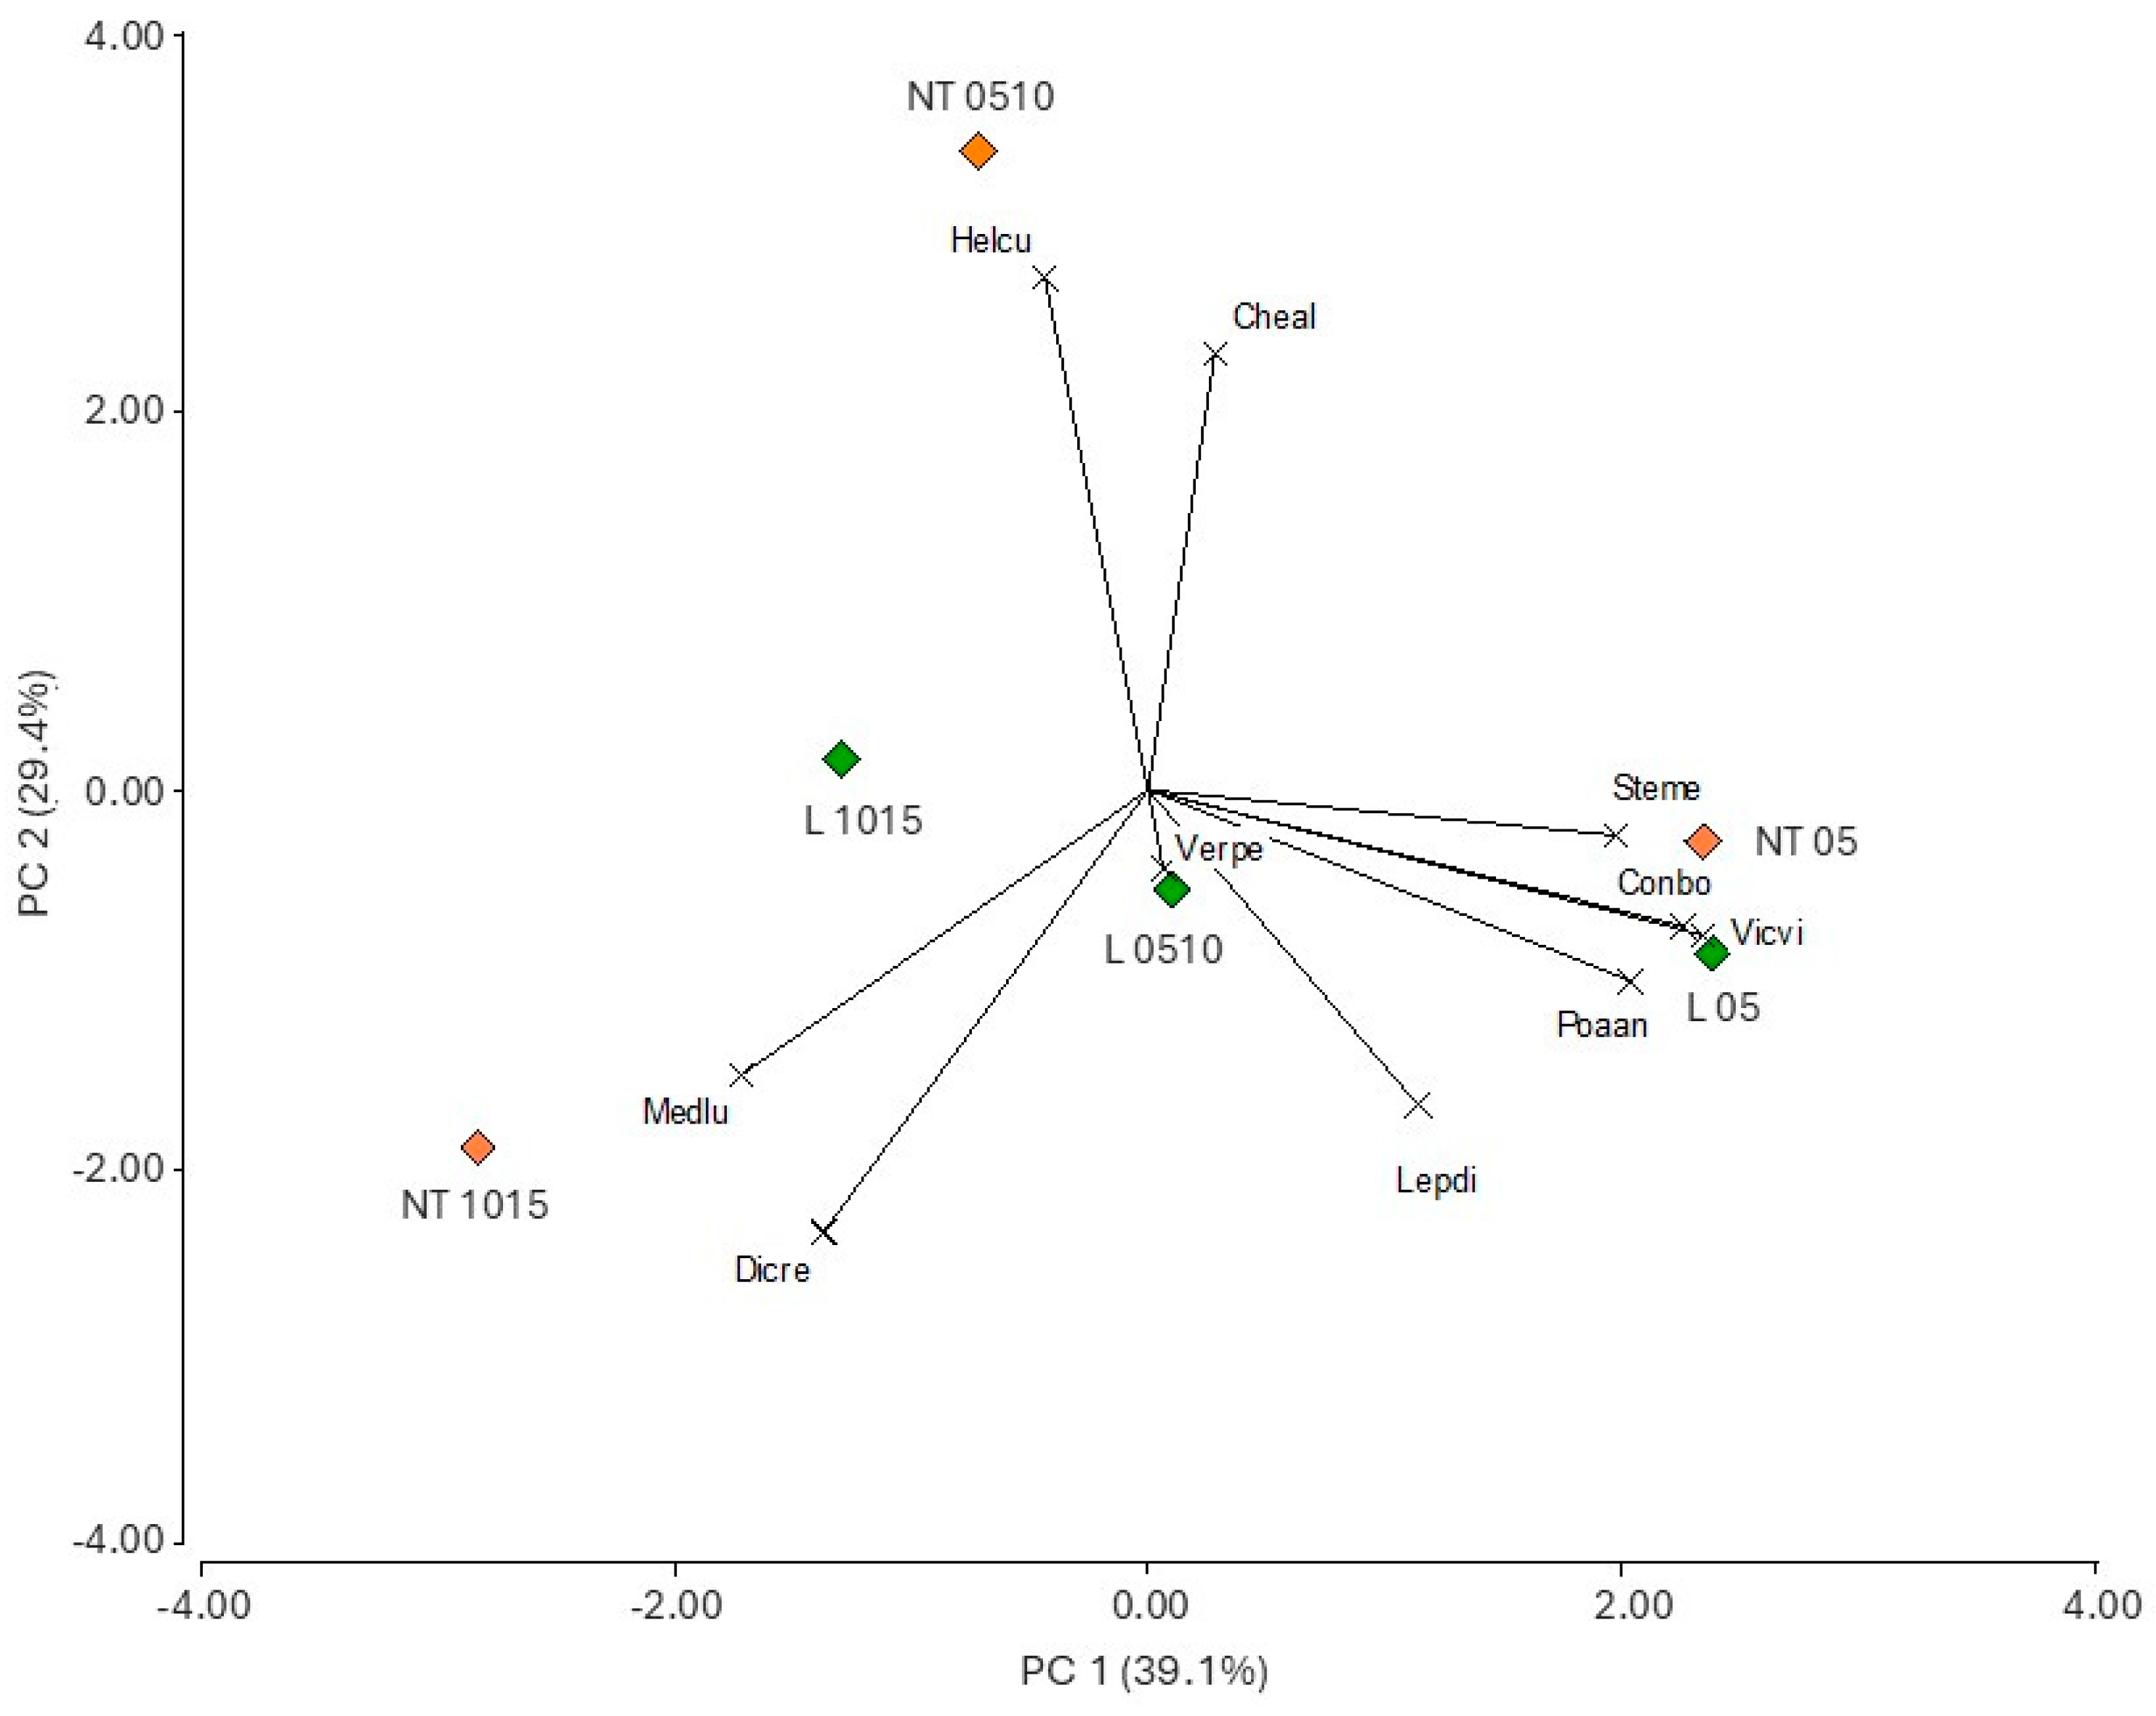
3.3. Treatment Effects on Weed Species Composition

The PCA based on species abundance data collected in 2022 explained 60.6% of the variance (Figure 3) (Supplementary Table S3). Axis 1 (38.8% of the variance) primarily separated treatments by soil depth. The 0–5 cm depth was associated with greater abundances of S. media, S. oleraceus, Carduus thoermeri, Echinochloa sp., and E. indica. The no-till 0–5 cm treatment was associated with species such as P. oleracea and V. peregrina. The occasional tillage 0–5 cm treatment was linked to A. hybridus, P. annua and H. curassavicum. Deeper depths (5–10 and 10–15 cm) were associated with S. rhombifolia, S. sisymbriifolium, T. repens, C. dactylon and S. parviflora. Axis 2 (21.8% of the variance) captured differences between tillage systems, with occasional tillage linked to species such as D. repens, D. ferox, and C. entrerianus. In contrast, no-till treatments were associated with greater abundance of P. aviculare, M. lupulina, S. americanum, P. oleracea, and V. peregrina. At the 10–15 cm depth, no notable differences in species composition were observed between tillage systems (Figure 3).
In 2023, PCA explained 68.5% of the variance (Figure 4). Axis 1 (39.1% of the variance) captured differences related to soil depth. The 0–5 cm depth was associated with S. media, C. bonariensis, V. villosa, and P. annua. The 5–10 and 10–15 cm depths were associated with M. lupulina, D. repens, and H. curassavicum. Axis 2 (29.4% of the variance) distinguished tillage treatments, with no-till favoring H. curassavicum and C. album, while occasional tillage showed a greater abundance of V. peregrina, L. didymum, and species associated with the upper soil layer, including P. annua and V. villosa. Similarly to the 2022 experiment, no differences were observed between tillage systems at the 10–15 cm soil depth and other upper layers.

4. Discussion

Species richness analysis revealed a decline in 2023, attributed to severe drought conditions during summer 2023 [27]. Extreme drought conditions, such as those observed in 2023 by the markedly lower rainfall recorded during that year (see Supplementary Table S2) may promote reduction in species richness, especially in exotic annual grasses [28], as also seen in our work with Echinochloa sp. and E. indica. This decline reflects the vulnerability of species to water stress, particularly during germination and seedling establishment [29]. Weed emergence depends heavily on rainfall events, which also affect weed growth and fecundity, reducing seedbank replenishment. Under drought, seeds that do germinate may fail to establish or reproduce successfully, resulting in fewer seeds being added to the seedbank. At the same time, viable seeds near the soil surface may die due to prolonged exposure to heat and desiccation. Together, these effects reduce seedbank replenishment and may contribute to its long-term depletion. In addition, these results suggest that occasional tillage influences weed composition but has limited impact on seedbank richness, highlighting the soil seedbank buffer effect in response to management practices [30]. This aligns with studies showing relatively stable weed community richness despite different management practices [6,31].
In our study, weed communities were predominantly concentrated in the 0–5 cm soil layer, which accounted for 59 to 62% of total emergence. This result aligns with previous findings showing limited vertical seed mobility and a higher emergence potential of seeds near the surface [32,33,34]. This pattern is further supported by studies showing that no-till systems tend to concentrate seeds in the upper soil layers, thereby increasing the likelihood of germination under favorable environmental conditions [35]. For instance, [36] found that approximately 75% of seeds were concentrated in the upper 5 cm, with decreasing densities at greater depths. Likewise, ref. [37] reported that about 60% of weed seeds were located in the top 5 cm under no-till, compared to only 30% in chisel-plowed plots. A comparable trend was reported by [32], where 60–70% of seeds were found in the upper 5 cm under no-till conditions, but only 40–50% under minimum tillage. The more pronounced redistribution in those studies is likely due to the repeated and consistent soil disturbance associated with minimum or conventional tillage systems. In contrast, the occasional tillage applied in our study resulted in more limited seed mixing, with a larger proportion of seeds remaining in the topsoil.
The composition of weed communities varied notably across years, treatments, and soil depths, with certain species maintaining high frequency regardless of management conditions. Certain species showed no significant changes in abundance in response to occasional tillage or soil depth, which aligns with previous studies, as some species are well adapted to the environmental conditions created by specific cropping systems [38]. For example, Stellaria media, Lepidium didymum, Eleusine indica, and Amaranthus hybridus have been reported as consistently present across multiple surveys in the same region [4,6,38]. Several of these species, such as E. indica, Echinochloa sp., and A. hybridus, are not only frequent but are also considered highly competitive and have documented cases of herbicide resistance in Argentina [1,5]. Their consistent emergence across treatments underscores the need for integrated approaches beyond occasional tillage.
In contrast to the consistently frequent group species, other weeds exhibited clear preferences for specific tillage regimes or soil depths, reflecting more nuanced shifts in species distribution across treatments. Species whose emergence is strongly influenced by tillage and burial depth can serve as indicators of management effects [15]. For example, the emergence of D. ferox following tillage could be attributed to its sensitivity to light, which terminates dormancy even with a brief exposure during soil disturbance [39]. In contrast, species whose seeds are buried beyond their emergence threshold may show reduced emergence, highlighting the role of tillage depth in weed seedbank dynamics. Without tillage, seeds in the upper soil layer (0–5 cm in our study) may lose viability or leave the seedbank through germination [40]. In contrast, seeds buried deeper may not receive the necessary light stimulus to break dormancy. This pattern may apply to R. crispus [41], S. parviflora [42], and P. annua [43], which have high light requirements for germination. Occasional tillage exposes these seeds to light, promoting germination. While light plays a critical role in stimulating germination for many species, adequate temperature and moisture conditions must also be present. Seeds of species like P. aviculare, which are adapted to fluctuating moisture levels in the upper soil layers, can germinate across a wider range of environmental conditions [44]. While P. oleracea and M. lupulina, found only in no-till treatments, do not germinate when buried deeper than 2 cm [45,46].
Asteraceae species such as S. oleraceus, C. bonariensis, and C. thoermeri were only found at 0–5 cm. These species have small fruits with a single seed (cypsela), which cannot emerge from greater depths due to seed reserve depletion [47]. Burial beyond 2 cm significantly reduces emergence in C. bonariensis [48] and S. oleraceus [49]. Shallow soil layers provide favorable environmental conditions for dormancy release and germination, as both temperature fluctuation and light penetration decrease with increasing soil depth [50]. Moreover, seed size and morphology influence the ability of seedlings to emerge from deeper soil layers. Small-seeded dicotyledonous species, such as those from the Asteraceae family, face morphological constraints, including a bent hypocotyl hook and limited energy reserves, that restrict their emergence depth. In contrast, many monocots possess both larger seeds and a protective coleoptile, enabling successful emergence through compacted or deeper soil layers. This combination of seed size and structural adaptation contributes to the generally greater cumulative emergence of grasses compared to dicots [51]. Therefore, occasional tillage might be more effective when implemented before annual grass populations become dominant in the seedbank.
In summary, our results indicate that not all species respond similarly to tillage. Two occasional tillage passes, each followed by soil sampling, affected vertical redistribution and species composition, rather than causing a substantial reduction in overall seedbank richness or abundance. These results support our initial expectation that occasional tillage, even when applied more than once, would alter the vertical distribution and composition of the weed seedbank, but would be insufficient on its own to significantly reduce overall richness or abundance. This outcome reflects the persistence of viable seeds at depths beyond their emergence threshold and the resilience of certain dominant species to occasional soil disturbance. Some species showed clear responses to soil management, including key regional weeds such as P. oleracea and C. bonariensis, which exhibited reduced emergence or altered vertical distribution following occasional tillage. In contrast, other problematic weeds such as Echinochloa sp., E. indica, and A. hybridus were largely unaffected by the treatments, maintaining stable emergence patterns across soil depths and tillage regimes. The highest seed abundance and species richness observed in the surface layers, even with occasional tillage, highlights the role of this section of the soil seedbank in weed management strategies. These results emphasize the importance of monitoring weed species in order to plan occasional tillage when some sensitive weeds are part of the community and developing integrated weed management. Considering other management strategies, occasional tillage can be temporarily effective at altering the seedbank structure, but control may not be sustained over time. Agriculture is a managed system characterized by intentional disturbances aimed at maximizing productivity. Occasional tillage, as shown in our study, can shift weed flora expression by favoring certain species while suppressing others. These shifts underscore the need for farmers and agronomists to monitor weed community responses and adjust management strategies accordingly, especially when alternating between no-till and tillage under changing weather conditions.

5. Conclusions

While not all of the most abundant species in this study are classified as the most competitive or herbicide-resistant weeds, many, such as A. hybridus, Echinochloa sp., and E. indica, are widely recognized for their impact on crop productivity and their increasing resistance to herbicides. Other species like C. album, though less dominant in terms of abundance, remain important due to their persistent seedbanks, early emergence, and competitive ability in reduced tillage systems. Additionally, species like C. bonariensis are of particular concern due to widespread glyphosate resistance and their ability to survive and reproduce under no-till regimes. Thus, both dominant and emergent species in this community present distinct management challenges that warrant attention in integrated weed control strategies.

Supplementary Materials

The following supporting information can be downloaded at: https://www.mdpi.com/article/10.3390/agronomy15061410/s1. Table S1: Monthly average maximum and minimum temperatures, and total monthly rainfall recorded at the experimental site in Carlos Casares, Buenos Aires, Argentina, from 2021 to 2024. Data were collected using a Davis Vantage Pro2 Plus weather station and rain gauges, and are used to contextualize climatic conditions during the study period. Table S2: Total counts of the most frequent weed species observed across all treatments. The table summarizes cumulative seedling emergence from soil samples collected under no-till and occasional tillage treatments, combining all depths and replications. Table S3: Eigenvalues and species loadings on the first two axes of the principal components analysis (PCA) conducted on species abundance data. Axis loadings reflect the contribution of each species to the ordination patterns used in Figure 3 and Figure 4 of the main text

Author Contributions

Conceptualization, F.O. and E.d.l.F.; methodology, F.O.; formal analysis, F.O. and M.T.F.; investigation, M.T.F., A.B. and E.d.l.F.; data curation, M.T.F., D.J.S. and V.R.; writing—original draft preparation, F.O. and M.T.F.; writing—review and editing, F.O., M.T.F., A.B., D.J.S., V.R. and E.d.l.F.; visualization, F.O. and M.T.F.; supervision, F.O. and E.d.l.F.; project administration, A.B.; resources, M.T.F., E.d.l.F., A.B., D.J.S. and V.R.; funding acquisition, E.d.l.F. All authors have read and agreed to the published version of the manuscript.

Funding

This research was funded by the Universidad de Buenos Aires through the UBACyT Program (Project No. 20020190100285BA). Open access publication was supported by Clemson University.

Data Availability Statement

The data supporting this study are available from the corresponding author upon reasonable request.

Acknowledgments

We sincerely thank the team at Establecimiento Tomas Hermanos for their invaluable support, granting us access to their fields, and assisting with the implementation of the occasional tillage treatments. Their collaboration and generosity were essential to the success of this study.

Conflicts of Interest

The authors declare no conflicts of interest.

References

  1. Oreja, F.H.; Moreno, N.; Gundel, P.E.; Vercellino, R.B.; Pandolfo, C.E.; Presotto, A.; Perotti, V.; Permingeat, H.; Tuesca, D.; Scursoni, J.A.; et al. Herbicide-resistant weeds from dryland agriculture in Argentina. Weed Res. 2024, 64, 89–106. [Google Scholar] [CrossRef]
  2. Gianessi, L.P. The increasing importance of herbicides in worldwide crop production. Pest Manag. Sci. 2013, 69, 1099–1105. [Google Scholar] [CrossRef] [PubMed]
  3. de la Fuente, E.B.; Suárez, S.A.; Ghersa, C.M. Soybean weed community composition and richness between 1995 and 2003 in the Rolling Pampas (Argentina). Agric. Ecosyst. Environ. 2006, 115, 229–236. [Google Scholar] [CrossRef]
  4. Satorre, E.H.; de la Fuente, E.B.; Mas, M.T.; Suárez, S.A.; Kruk, B.C.; Guglielmini, A.C.; Verdú, A.M. Crop rotation effects on weed communities of soybean (Glycine max L. Merr.) agricultural fields of the Flat Inland Pampa. Crop Prot. 2020, 130, 105068. [Google Scholar] [CrossRef]
  5. Oreja, F.H.; Vera, A.C.D.; Kruk, B.C.; de la Fuente, E.B.; Scursoni, J.A. Survey of major weed problems, management practices, and herbicide use in extensive row crops from Argentina. Adv. Weed Sci. 2024, 42, e02024. [Google Scholar] [CrossRef]
  6. de la Fuente, E.B.; Oreja, F.H.; Lenardis, A.E.; Fuentes, M.T.; Agosti, B.; Barrio, A.; Barberis, S.; Robredo, J.; Gil, A.; Marzetti, M.; et al. Intensification of crop rotation affecting weed communities and the use of herbicides in the rolling Pampa. Heliyon 2021, 7, e05874. [Google Scholar] [CrossRef]
  7. Özkara, A.; Akyıl, D.; Konuk, M. Pesticides, environmental pollution, and health. In Environmental Health Risk; Larramendy, M.L., Soloneski, S., Eds.; IntechOpen: London, UK, 2016; pp. 1–27. [Google Scholar]
  8. Mohler, C.L.; Galford, A.E. Weed seedling emergence and seed survival: Separating the effects of seed position and soil modification by tillage. Weed Res. 1997, 37, 147–155. [Google Scholar] [CrossRef]
  9. Bàrberi, P.; Lo Cascio, B. Long-term tillage and crop rotation effects on weed seedbank size and composition. Weed Res. 2001, 41, 325–340. [Google Scholar] [CrossRef]
  10. Benech-Arnold, R.L.; Sánchez, R.A.; Forcella, F.; Kruk, B.C.; Ghersa, C.M. Environmental control of dormancy in weed seed banks in soil. Field Crops Res. 2000, 67, 105–122. [Google Scholar] [CrossRef]
  11. Chauhan, B.S.; Gill, G.S.; Preston, C. Influence of environmental factors on seed germination and seedling emergence of rigid ryegrass (Lolium rigidum). Weed Sci. 2006, 54, 1004–1012. [Google Scholar] [CrossRef]
  12. Baraibar, B.; Westerman, P.R.; Carrión, E.; Recasens, J. Effects of tillage and irrigation in cereal fields on weed seed removal by seed predators. J. Appl. Ecol. 2017, 54, 819–828. [Google Scholar] [CrossRef]
  13. Steckel, L.E.; Sprague, C.L.; Stoller, E.W.; Wax, L.M. Tillage effects on common waterhemp (Amaranthus rudis) emergence and vertical distribution in the soil seedbank. Weed Sci. 2007, 55, 255–260. [Google Scholar] [CrossRef]
  14. Weiher, E.; Keddy, P. Ecological Assembly Rules: Perspectives, Advances, Retreats; Cambridge University Press: Cambridge, UK, 2001. [Google Scholar]
  15. Booth, B.D.; Swanton, C.J. Assembly theory applied to weed communities. Weed Sci. 2002, 50, 2–13. [Google Scholar] [CrossRef]
  16. Keddy, P.A. Assembly and response rules: Two goals for predictive community ecology. J. Veg. Sci. 1992, 3, 157–164. [Google Scholar] [CrossRef]
  17. Ryan, M.R.; Smith, R.G.; Mirsky, S.B.; Mortensen, D.A.; Seidel, R. Management filters and species traits: Weed community assembly in long-term organic and conventional systems. Weed Sci. 2010, 58, 265–277. [Google Scholar] [CrossRef]
  18. Christoffoleti, P.J.; Caetano, R.S.X. Weed seed bank dynamics under no-tillage in southern Brazil. Soil Tillage Res. 1998, 48, 175–183. [Google Scholar]
  19. Hossain, M.I.; Begum, M. Weed seedbank in different tillage systems in rice cultivation. J. Agric. Crop Res. 2016, 4, 48–56. [Google Scholar]
  20. Young, S.L. Decision support for integrated weed management. In Integrated Weed Management for Sustainable Agriculture; Naylor, R.E., Ed.; Burleigh Dodds Science Publishing: Cambridge, UK, 2021; pp. 277–292. [Google Scholar]
  21. Aliaga, V.; Ferrelli, F.; Piccolo, M.C. Regionalization of climate over the Argentine Pampas. Int. J. Climatol. 2017, 37, 1237–1247. [Google Scholar] [CrossRef]
  22. Cabrera, A.L. (Ed.) Flora de la Provincia de Buenos Aires. In Colección Científica del Instituto Nacional de Tecnología Agropecuaria, Volume 4; Instituto Nacional de Tecnología Agropecuaria: Buenos Aires, Argentina, 1963–1970; Volumes 1–6. [Google Scholar]
  23. Petetin, C.A.; Molinari, E. Clave Ilustrada para el Reconocimiento de Malezas en el Campo al Estado Vegetativo; Colección Científica del Instituto Nacional de Tecnología Agropecuaria; Instituto Nacional de Tecnología Agropecuaria: Buenos Aires, Argentina, 1977; Volume XIV, pp. 1–243. [Google Scholar]
  24. Molina, A.R. Malezas Argentinas; Molina, A.R.: Buenos Aires, Argentina, 2005–2011; Volumes 1–5. [Google Scholar]
  25. Zubizarreta, L.; Díaz Panizza, L. Guía de Reconocimiento de Malezas; Syngenta: Vicente López, Argentina, 2014. [Google Scholar]
  26. Di Rienzo, J.A.; Casanoves, F.; Balzarini, M.G.; Gonzalez, L.; Tablada, M.; Robledo, C.W. InfoStat, Versión 2018; Grupo InfoStat, FCA, Universidad Nacional de Córdoba: Córdoba, Argentina, 2018. [Google Scholar]
  27. Kucheruk, L.; Spennemann, P.; Rivera, J.; Naumann, G.; Otkin, J. Olas de Calor Récord del Verano 2023 y su rol en el Desarrollo de Sequías de Rápido Desarrollo en la Pampa Húmeda Argentina. Available online: https://sissa.crc-sas.org/wp-content/uploads/2024/05/IT-Olas-de-calor.pdf (accessed on 29 October 2024).
  28. Copeland, S.M.; Harrison, S.P.; Latimer, A.M.; Damschen, E.I.; Eskelinen, A.M.; Fernandez-Going, B.; Spasojevic, M.J.; Anacker, B.L.; Thorne, J.H. Ecological effects of extreme drought on Californian herbaceous plant communities. Ecol. Monogr. 2016, 86, 295–311. [Google Scholar] [CrossRef]
  29. Yamashita, O.M.; Guimarães, S.C. Germination of Conyza canadensis and Conyza bonariensis seeds in function of water availability in the substrate. Planta Daninha 2010, 28, 309–317. [Google Scholar] [CrossRef]
  30. Storkey, J.; Neve, P. What good is weed diversity? Weed Res. 2018, 58, 239–243. [Google Scholar] [CrossRef] [PubMed]
  31. Armengot, L.; Jose-Maria, L.; Chamorro, L.; Sans, F.X. Weed harrowing in organically grown cereal crops avoids yield losses without reducing weed diversity. Agron. Sustain. Dev. 2013, 33, 405–411. [Google Scholar] [CrossRef]
  32. Chauhan, B.S.; Gill, G.; Preston, C. Seedling recruitment pattern and depth of recruitment of 10 weed species in minimum tillage and no-till seeding systems. Weed Sci. 2006, 54, 658–668. [Google Scholar] [CrossRef]
  33. Benvenuti, S. Weed seed movement and dispersal strategies in the agricultural environment. Weed Biol. Manag. 2007, 7, 141–157. [Google Scholar] [CrossRef]
  34. Benvenuti, S. Natural weed seed burial: Effect of soil texture, rain and seed characteristics. Seed Sci. Res. 2007, 17, 211–219. [Google Scholar] [CrossRef]
  35. Clements, D.R.; Benoit, D.L.; Murphy, S.D.; Swanton, C.J. Tillage effects on weed seed return and seedbank composition. Weed Sci. 1996, 44, 314–322. [Google Scholar] [CrossRef]
  36. Reuss, S.A.; Buhler, D.D.; Gunsolus, J.L. Effects of soil depth and aggregate size on weed seed distribution and viability in a silt loam soil. Appl. Soil Ecol. 2001, 16, 209–217. [Google Scholar] [CrossRef]
  37. Hoffman, M.L.; Owen, M.D.; Buhler, D.D. Effects of crop and weed management on density and vertical distribution of weed seeds in soil. Agron. J. 1998, 90, 793–799. [Google Scholar] [CrossRef]
  38. de la Fuente, E.B.; Perelman, S.; Ghersa, C.M. Weed and arthropod communities in soybean as related to crop productivity and land use in the Rolling Pampas, Argentina. Weed Res. 2010, 50, 561–571. [Google Scholar] [CrossRef]
  39. Scopel, A.L.; Satorre, E.H.; Benech-Arnold, R.L.; Radosevich, S.R. Modelling the effect of environment on dormancy and germination of weed seed banks in no-tillage systems. Field Crops Res. 1991, 30, 263–277. [Google Scholar]
  40. Masin, R.; Zuin, M.C.; Otto, S.; Zanin, G. Seed longevity and dormancy of four summer annual grass weeds in turf. Weed Res. 2006, 46, 362–370. [Google Scholar] [CrossRef]
  41. Taylorson, R.B.; Hendricks, S.B. Seed dormancy in Rumex crispus as related to its endogenous content of abscisic acid and other inhibitors. Plant Physiol. 1972, 50, 635–638. [Google Scholar]
  42. Mollard, F.P.; Insausti, P. Breaking Setaria parviflora seed dormancy by nitrates and light is part of a mechanism that detects a drawdown period after flooding. Aquat. Bot. 2009, 91, 57–60. [Google Scholar] [CrossRef]
  43. Ohadi, S.; Rahimian Mashhadi, H.; Tavakkol-Afshari, R.; Beheshtian Mesgaran, M. Modelling the effect of light intensity and duration of exposure on seed germination of Phalaris minor and Poa annua. Weed Res. 2010, 50, 209–217. [Google Scholar] [CrossRef]
  44. Batlla, D.; Benech-Arnold, R.L. The role of fluctuations in soil water content on the regulation of dormancy changes in buried seeds of Polygonum aviculare L. Seed Sci. Res. 2006, 16, 47–59. [Google Scholar] [CrossRef]
  45. Chauhan, B.S.; Johnson, D.E. Seed germination ecology of Portulaca oleracea L.: An important weed of rice and upland crops. Ann. Appl. Biol. 2009, 155, 61–69. [Google Scholar] [CrossRef]
  46. Sharpe, S.M.; Boyd, N.S. Black medic (Medicago lupulina) emergence and emergence predictors within Florida strawberry fields. Weed Sci. 2019, 67, 253–260. [Google Scholar] [CrossRef]
  47. Benvenuti, S.; Macchia, M.; Miele, S. Light, temperature and burial depth effects on Rumex obtusifolius seed germination and emergence. Weed Res. 2001, 41, 177–186. [Google Scholar] [CrossRef]
  48. Wu, H.; Walker, S.; Rollin, M.J.; Tan, D.K.; Robinson, G.; Werth, J. Germination, persistence, and emergence of flaxleaf fleabane (Conyza bonariensis [L.] Cronquist). Weed Biol. Manag. 2007, 7, 192–199. [Google Scholar] [CrossRef]
  49. Widderick, M.J.; Walker, S.R.; Sindel, B.M.; Bell, K.L. Germination, emergence, and persistence of Sonchus oleraceus, a major crop weed in subtropical Australia. Weed Biol. Manag. 2010, 10, 102–112. [Google Scholar] [CrossRef]
  50. Saatkamp, A.; Affre, L.; Baumberger, T.; Dumas, P.J.; Gasmi, A.; Gachet, S.; Arène, F. Soil depth detection by seeds and diurnally fluctuating temperatures: Different dynamics in 10 annual plants. Plant Soil 2011, 349, 331–340. [Google Scholar] [CrossRef]
  51. Hartzler, R.G.; Buhler, D.D.; Stoltenberg, D.E. Emergence characteristics of four annual weed species. Weed Sci. 1999, 47, 578–584. [Google Scholar] [CrossRef]
Figure 1. Richness in 2022 (green columns) and 2023 (blue columns) across the different soil depths (0–5 cm, 5–10 cm, and 10–15 cm). Columns are the means, and the error bars are the mean square error. Different letters indicate significant differences according to Tukey’s test (5%) on each year. Means are presented on the original scale. Statistical analyses were performed on square root-transformed data; significance groupings are based on the transformed analysis.
Agronomy 15 01410 g001
Figure 2. Abundance (plants/0.25 m−2) in 2022 (green columns) and 2023 (blue columns) across the different soil depths (0–5 cm, 5–10 cm, and 10–15 cm). Columns are the means, and the error bars are the mean square error. Different letters indicate significant differences according to Tukey’s test (5%) on each year. Means are presented on the original scale. Statistical analyses were performed on square root-transformed data; significance groupings are based on the transformed analysis.
Agronomy 15 01410 g002
Figure 3. Principal Components Analysis (PCA) of species abundance data from the seedbank during 2022. Treatment codes: T, green symbols for occasional tillage, NT, orange symbols for no-till, and 05, 510, and 1015 for the three studied depths (0–5, 5–10 and 10–15 cm, respectively). The vectors represent weed species, labeled with the first three letters of the genus and the first two letters of the species.
Agronomy 15 01410 g003
Figure 4. Principal Components Analysis (PCA) of species abundance data from the seedbank during 2023. Treatment codes: L, green symbols for occasional tillage, NT, orange symbols for no-till, and 05, 510, and 1015 for the three studied depths (0–5, 5–10 and 10–15 cm, respectively). The vectors represent weed species, labeled with the first three letters of the genus and the first two letters of the species.
Agronomy 15 01410 g004
Table 1. Crop sequence, approximate planting and harvest months, herbicide programs (active ingredients, concentrations, and rates), and fertilization practices used at the experimental field from 2018 to 2024. The table reflects the Southern Hemisphere cropping calendar (Argentina). Cover crops (cereal rye and hairy vetch) were used between summer crops to maintain year-round soil cover and support weed management.
SeasonCropsTiming (Approximate Months)HerbicidesFertilizers
2018/19SoybeanNov 2018–Apr 2019Long fallow: glyphosate (62%) (1.5 L ha−1), 2,4-D (100%) (0.8 L ha−1)Mix 7–40 (80 kg ha−1)
Preemergence: sulfentrazone (50%) (0.38 L ha−1), thiencarbazone-methyl + iodosulfuron-methyl-sodium (46 g ha−1), glyphosate (64%) (2 L ha−1)
Postemergence: glyphosate (54%) (1.7 L ha−1), clethodim (0.7 L ha−1)
2019/20Wheat—soybean (double crop)Wheat: Jun–Nov 2019, Soybean: Dec 2019–Apr 2020Fallow: Chlorsulfuron + metsulfuron-methyl (10 g ha−1), glyphosate (54%) (1.9 L ha−1), 2,4-D (100%) (0.7 L ha−1)Wheat: mix 7–40 (80 kg ha−1), urea (244 kg ha−1); Soybean: mix 7–40 (75 kg ha−1)
2020/21Early cornSep 2020–Feb 2021Fallow: glyphosate (62%) (1.5 L ha−1), 2,4-D (100%) (0.8 L ha−1), atrazine (90%) (1.5 kg ha−1), picloram (24%) (0.1 L ha−1)Mix 7–40 (80 kg ha−1)
Postemergence: glyphosate (62%) (1.5 L ha−1), 2,4-D (100%)Urea (196 kg ha−1)
2021/22Cover crop cereal rye + hairy vetch − cornCover: Apr–Oct 2021; Soybean: Nov 2021–Apr 2022Fallow CC: glyphosate (62%) (1.5 L ha−1), 2,4-D (100%). Termination: Glyphosate (48%) (1.5 kg ha−1), flumioxazin (48%)Soybean MAP 11–52-0 (80 kg ha−1)
Postemergence: fomesafen (24%) (1.2 L ha−1), haloxyfop-R-methyl (10.4%) (0.19 L ha−1), clopiralyd (30%) (0.4 L ha−1), imazethapyr (10%) (0.23 L ha−1)
2022/23SunflowerAug 2022–Jan 2023Fallow: glyphosate (48%) (2 kg ha−1), pyroxasulfone (8.5%) (0.5 L ha−1), sulfentrazone (50%) (0.45 L ha−1) Mix 12–11–18 + micronutrients (80 kg ha−1)
Postemergence: imazethapyr (10%) (60 g ha−1), clethodim (10%) (0.8 L ha−1)
2023/24Cover crop cereal rye − cornCover: Apr–Oct 2023; Corn: Nov 2023–Apr 2024Fallow CC: glyphosate (48%) (1.5 kg ha−1), pyroxasulfone (8.5%) (1 L ha−1)CC: Mix 7–40 (60 kg ha−1)
Corn preemergence: S-metolachlor (29.7%) + atrazine (27.4%) + mesotrione (3.9%) + bicyclopyrone (0.7%) (0.8 L ha−1), S-metolachlor (96%) (0.85 L ha−1), glyphosate (48%) (1.5 kg ha−1)Corn: Mix 7–40 (116 kg ha−1),
Postemergence: glyphosate (48%) (1.5 kg ha−1), atrazine (90%) (0.6 kg ha−1), picloram (24%) (0.15 L ha−1)urea (116 kg ha−1), Urea solution (18%) (10 L ha−1)
Table 2. Results of three-way ANOVA testing the effects of year, tillage system, soil depth, and their interactions on weed species richness and abundance. The table includes degrees of freedom (df), sums of squares (SS), mean squares (MS), F-values, and p-values for each source of variation. Significant effects are indicated by asterisks (*** p < 0.001).
ResponseSourcedfSSMSFp-ValueSignificance
RichnessYear128.21928.219368.88<0.001***
System10.1700.1702.220.149
Depth21.5730.78710.280.00051***
Year × System10.1330.1331.740.198
Year × Depth20.0750.0380.490.617
System × Depth20.4680.2343.060.064
Residuals261.9890.077
AbundanceYear164.03164.03115.720.00051***
System10.1500.1500.0370.850
Depth2193.29496.64723.731.37 × 10−6***
Year × System17.6487.6481.880.182
Year × Depth20.8300.4151.020.903
System × Depth25.1532.5770.630.539
Residuals26105.8894.073
Table 3. Weed species, code names, abundance (mean number of emerged seedlings per 2000 cm3 of soil per treatment per depth) and frequency (%) based on samples collected in August 2022 (late winter/early spring) from a long-term no-till field located in Carlos Casares, Buenos Aires Province, Argentina (35°37′ S, 61°21′ W). Weed emergence was grouped by treatment (occasional tillage vs. continuous no-till) and soil depth (0–5 cm, 5–10 cm, 10–15 cm). Frequency (%) represents the proportion of plots in which each species was observed (n = 6).
SpeciesCodesAbundance
(Plants Treatment−1)
Frequency (%)
Occasional TillageNo-Till
0–5 cm5–10 cm10–15 cm0–5 cm5–10 cm10–15 cm
Chenopodium album L.Cheal61426406622100
Oxybasis macrosperma (Hook.f.) S.Fuentes, Uotila & BorschOxyba20348202311100
Echinochloa sp.Echsp412412100
Eleusine indica (L.) Gaertn.Elein18412754100
Heliotropium curassavicum L.Helcu464013322519100
Lepidium didymum L.Lepdi8124581100
Nicotiana longiflora Cav.Niclo111851497100
Stellaria media (L.) Vill.Steme117426423100
Amaranthus hybridus L.Amahy13813453 83
Cyperus entrerianus BoeckelerCypen821 2183
Dichondra repens J.R.Forst. & G.Forst.Dicre443 1583
Verbena bonariensis L.Verbo21 32283
Datura ferox L.Datfe223 50
Poa annua L.Poaan4 17
Lythrum hyssopifolia L.Lythy 1 17
Setaria parviflora (Poir.) KerguélenSetpa 1 17
Rumex crispus L.Rumcr 2 17
Glycine maxGlyma 1 17
Portulaca oleracea L.Porol 3 17
Sesuvium americanum (Gillies ex Arn.) A.I.Jocou & C.R.MinuéSesam 21 33
Medicago lupulina L.Medlu 1 17
Polygonum aviculare L.Polav 1 17
Sonchus oleraceus L.Sonol1 1 33
Vicia villosa RothVicvi10 2 33
Conyza bonariensis (L.) CronquistConbo7 1 33
Carduus thoermeri Weinm.Carth1 1 33
Urtica urens L.Urtur41 101 67
Lamium amplexicaule L.Lamam12 2 50
Solanum sisymbriifolium Lam.Solsi 3 1250
Trifolium repens L.Trire253 867
Cynodon dactylon (L.) Pers.Cynda 1 1 33
Sida rhombifolia L.Sidrh 22 250
Euphorbia serpens KunthEupse5223 67
Veronica peregrina L.Verpe1 41167
Table 4. Weed species, code names, abundance (mean number of emerged seedlings per 2000 cm3 of soil per treatment per depth) and frequency (%) based on samples collected in April 2023 (fall season) from a long-term no-till field located in Carlos Casares, Buenos Aires Province, Argentina (35°37′ S, 61°21′ W). Weed emergence was grouped by treatment (occasional tillage vs. continuous no-till) and soil depth (0–5 cm, 5–10 cm, 10–15 cm). Frequency (%) represents the proportion of plots in which each species was observed (n = 6).
SpeciesCodesAbundance
(Plants Treatment−1)
Frequency (%)
Occasional TillageNo-Till
0–5 cm5–10 cm10–15 cm0–5 cm5–10 cm10–15 cm
Lepidium didymum L.Lepdi21121519100
Stellaria media (L.) Vill.Steme9955142834113100
Dichondra repens J.R.Forst. & G.Forst.Dicre2231 483
Poa annua L.Poaan1810 9 50
Vicia villosa RothVicvi41 5 50
Conyza bonariensis (L.) CronquistConbo1 1 33
Chenopodium album L.Cheal1 4 33
Veronica peregrina L.Verpe 1 17
Heliotropium curassavicum L.Helcu 2 17
Medicago lupulina L.Medlu 217
Trifolium repens L.Trire 217
Disclaimer/Publisher’s Note: The statements, opinions and data contained in all publications are solely those of the individual author(s) and contributor(s) and not of MDPI and/or the editor(s). MDPI and/or the editor(s) disclaim responsibility for any injury to people or property resulting from any ideas, methods, instructions or products referred to in the content.

