Article

Comparison of Main Agronomic Traits and Identification of Important Genes in Japonica Rice Cultivars Grown in the Jianghuai Region

1
Key Laboratory of Crop Germplasm Innovation and Green Production, College of Agriculture, Anhui Science and Technology University, Chuzhou 239000, China
2
College of Life Sciences, Shihezi University, Shihezi 832003, China
*
Authors to whom correspondence should be addressed.
These authors contributed equally to this work.
Agronomy 2025, 15(6), 1409; https://doi.org/10.3390/agronomy15061409
Submission received: 29 April 2025 / Revised: 4 June 2025 / Accepted: 5 June 2025 / Published: 8 June 2025
(This article belongs to the Section Crop Breeding and Genetics)

Abstract

An exploration and understanding of cultivar adaptability to specific environmental conditions are critical in rice breeding. This study aimed to compare the agro-morphological data of 36 japonica rice cultivars (Oryza sativa L.) from Chinese rice accessions grown under two different environments (Fengyang and Hexian) and to identify important genes associated with key traits in the cultivars. Higher significant differences were observed between Fengyang and Hexian in traits like, grain width, grain length, yield per plot, plant height, and tiller number with cultivars grown in Hexian having the greatest values. This revealed that the environment in Hexian favored these traits, and most cultivars performed better in Hexian than in Fengyang. Correlation analysis also showed strong positive correlations between tiller number and yield per plot in both environments, indicating the influence of tiller number on rice yield potential. The PCR analysis showed the amplification of DEP1, Ghd7, Wx, Chalk5, COLD1, DST, Xa13, and Bph6 in most japonica cultivars, indicating presence of these genes in the cultivars. This study suggests that differences in agronomic performance between the cultivars grown in Fengyang and Hexian might be caused by differences in environmental conditions. This finding could be valuable for future breeding of high-yielding and climate-resilient cultivars.

1. Introduction

Rice (Oryza sativa L.) is a pivotal crop that serves as a staple food for more than half of the world’s population [1]. During 2015–2030, the global population is expected to increase by 12.8%. To meet the global rice demand by 2030, the total rice production output must reach 771 million tons, reflecting an increase of at least 11.8% from 2015 output levels [2]. Therefore, cultivation of high-yielding rice varieties is crucial for the increasing population demand for rice. China is the world’s leading producer, importer, and consumer of rice. Rice serves as a major food for more than 80% of the population [3]. China plays a vital role in the cultivation of Asian rice, specifically O. sativa, due to its abundant genetic resources [4]. Oryza. sativa spp. japonica is one of the two main ecogeographic species of rice cultivated in northern and eastern China [5] and is mainly grown in more temperate regions at higher latitudes. Japonica rice is distinct from indica rice in terms of plant architecture, and agronomic and physiological traits such as stress resistance, cold tolerance, and grain quality [6]. Its production area has increased over time in China, with yield accounting for 45% of national production [7].
The Jianghuai region, located between the Yangtze River and the Huai River in Anhui Province, is known for rice cultivation due to its favorable environmental conditions and fertile soil [8,9]. However, climate change and climatic factors such as flood and drought pose challenges for rice cultivation, highlighting the need for cultivars with high yield and strong adaptability. Different rice cultivars thrive in specific ecological conditions. However, it is vital to select cultivars adaptable to specific conditions to ensure optimum yield. Photoperiod is the main climatic factor influencing rice’s ability to adapt to various ecological circumstances [10]. There are many reports that photoperiod sensitivity is crucial for grain filling and affects flowering time regulation [11,12]. Rice cultivars can only be grown in a limited range of latitude due to photoperiod sensitivity and this is an important factor in cultivar adaptation to different ecological zones. Rice grows in a wide range of latitudes across the world (50° N–35° S) [13]. Therefore, it is important to identify traits that help define the performance of the most stable cultivars at different latitudes [14]. Although Jianghuai provides unique prospects for japonica rice cultivation, the development of superior cultivars faces significant challenges [15].
Despite decades of enormous breeding efforts, progress in developing high-yielding and adaptable rice cultivars has not met expectations, because most agronomic traits such as plant height, tiller number, and panicle length, and other morphological traits are quantitative in nature [16]. These traits are typically controlled by several genes rather than single genes, and their expression is influenced by various environmental factors [17]. The genes controlling these quantitative trait loci may reside on different chromosomes, but their products work together as part of complex metabolic pathways and physiological processes [18]. Previous studies investigated individual genes that influence rice productivity [19,20]. However, the influence of genetic factors on agronomic traits in japonica cultivars under different environments remains unknown. This is important for developing high-yielding cultivars that can thrive in different ecological zones.
The objective of this study was to collect, analyze, and compare the morphological and agronomic traits of 36 japonica cultivars from the Chinese rice accessions grown in two planting areas: Fengyang and Hexian. To achieve this objective, PCR analysis was performed using molecular markers associated with eight key genes—DENSE AND ERECT PANICLE 1 (DEP1) and GRAIN NUMBER, PLANT HEIGHT, AND HEADING DATE 7 (Ghd7) for grain yield and heading date; CHALKINESS 5 (Chalk5) and WAXY (Wx) for grain quality; COLD-TOLERANCE 1 (COLD1) and DROUGHT AND SALT TOLERANCE (DST) for stress tolerance; and XANTHOMONAS RESISTANCE 13 (Xa13) and BROWN PLANTHOPPER RESISTANCE 6 (Bph6) for disease resistance—across the 36 japonica cultivars to understand the influence of these genes on cultivar performance. The comparison of agronomic traits and PCR analysis of japonica cultivars will facilitate development of rice varieties with high adaptability and superior qualities.

2. Materials and Methods

2.1. Plant Materials

In this study, 36 rice accessions were collected from academic and research institutes located in different provinces in China. Among the 36 rice cultivars, 1 was from Shanxi Province, 5 were from Zhejiang Province, 1 was from Chongqing Province, 16 were from Jiangsu Province, 11 were from Anhui Province, and 2 were from Shandong Province. In total, 10 indica rice cultivars were used as controls to understand the genetic differences between the two subspecies. The detailed background information for each cultivar is presented in Table S1.

2.2. Field Trials

All rice germplasms were cultivated in two distinct locations of Anhui Province, Fengyang County, Chuzhou (32°52′30″ N, 117°33′15″ E), and Hexian County Maashan (118°17′12.02″ N, 31°56′25.45″ E) in the summer of 2023. Both locations are situated within the Jianghuai region. Each rice cultivar’s seeds were soaked and treated before being planted in a nursery field. Thirty days after nursery, the seedlings were transplanted onto the main paddy field in a Randomized Complete Block Design with 3 replications per cultivar, with a row spacing of 20 cm and an intra-row spacing of 15 cm, accommodating 30 plants per cultivar. Throughout the growth period, crop management practices were applied. The rice fields were irrigated at 5–7 cm water depth during vegetative growth, and reduced to intermittent flooding during the post-tillering stage; fertilization included 150 kg/ha of nitrogen (urea), 60 kg/ha of phosphorus (P2O5) and 80 kg/ha of potassium (K2O); and weeding was performed manually every 15 days after transplanting, and it was supplemented by herbicide application to protect and manage the crops until they reached maturity stage.

2.3. Data Collection

In total, 10 agronomic traits were recorded on 36 japonica cultivars following the Standard Evaluation System for Rice [21]. Data were recorded on randomly selected cultivars for traits such as plant height (average of 15 plants per cultivar) abbreviated as PH, tiller number (average of 15 plants per cultivar) abbreviated as TN, panicle length (average of 15 plants per cultivar) abbreviated as PL, number of primary branches (average of 15 plants per cultivar) abbreviated as PB, number of secondary branches (average of 15 plants per cultivar) abbreviated as SB, grain length (average of 15 plants per cultivar) abbreviated as GL, grain width (average of 15 plants per cultivar) abbreviated as GW, thousand-grain weight (average of 5 plants per cultivar) abbreviated as TGW, seed-setting rate (average of 5 plants per cultivar) abbreviated as SR, and yield per plot (estimated average yield per cultivar from a 0.9 m2 plot) abbreviated as YD.

2.4. Analysis of Molecular Markers

DNA extraction for PCR amplification was carried out by the CTAB method [22]. Eight genes, including DEP1 [23], Ghd7 [24], Wx [25], Chalk5 [26], COLD1 [27], DST [28], Xa13 [29], and Bph6 [30], were selected as target genes in this study. Based on the above research, primers were designed to amplify molecular markers associated with these genes (Table S6), and they were confirmed in the Gramene database (http://www.gramene.org/, accessed on 15 October 2024) and RiceData (https://www.ricedata.cn/, accessed on 17 October 2024).
A 10 μL volume of PCR reaction mixture containing 50 ng genomic DNA, 5 μL 2 × Santaq PCR mix (Vazyme Biotech Co., Ltd., Nanjing, China) and 30 ng of each forward and reverse primer was obtained using LongGene (T20, LongGene Scientific Instrument Co., Ltd., Hangzhou, China). The PCR conditions were 95 °C for 3 min; 34 cycles of 95 °C for 30 s; 56 °C for 1 min; 72 °C for 30 s and 72 °C for 5 min. The amplified PCR products were separated on 2% agarose gels alongside a 1 kb DNA ladder (GeneRuler 1 kb DNA Ladder, Thermo Fisher Scientific, Waltham, MA, USA), stained with ethidium bromide and visualized using GelDocXR (Waltham, MA, USA).

2.5. Statistical Analysis

Several statistical methods were used in the data analysis. Descriptive statistics were used to analyze the means (±) and standard deviation (SD) for all the agronomic traits among the cultivars grown in Fengyang and Hexian. Student’s t-test was used to determine the significant difference between agronomic traits in a pairwise comparison (p < 0.05) and significant difference percentages were calculated by dividing the number of cultivars that showed significant differences in each environment by the total number of significant differences observed across both environments. Pearson correlation coefficient was used to assess the linear relationship between agronomic traits and GraphPad Prism 8.4.3 (GraphPad Software Inc., San Diego, CA, USA) was used to visualize the data.

3. Results

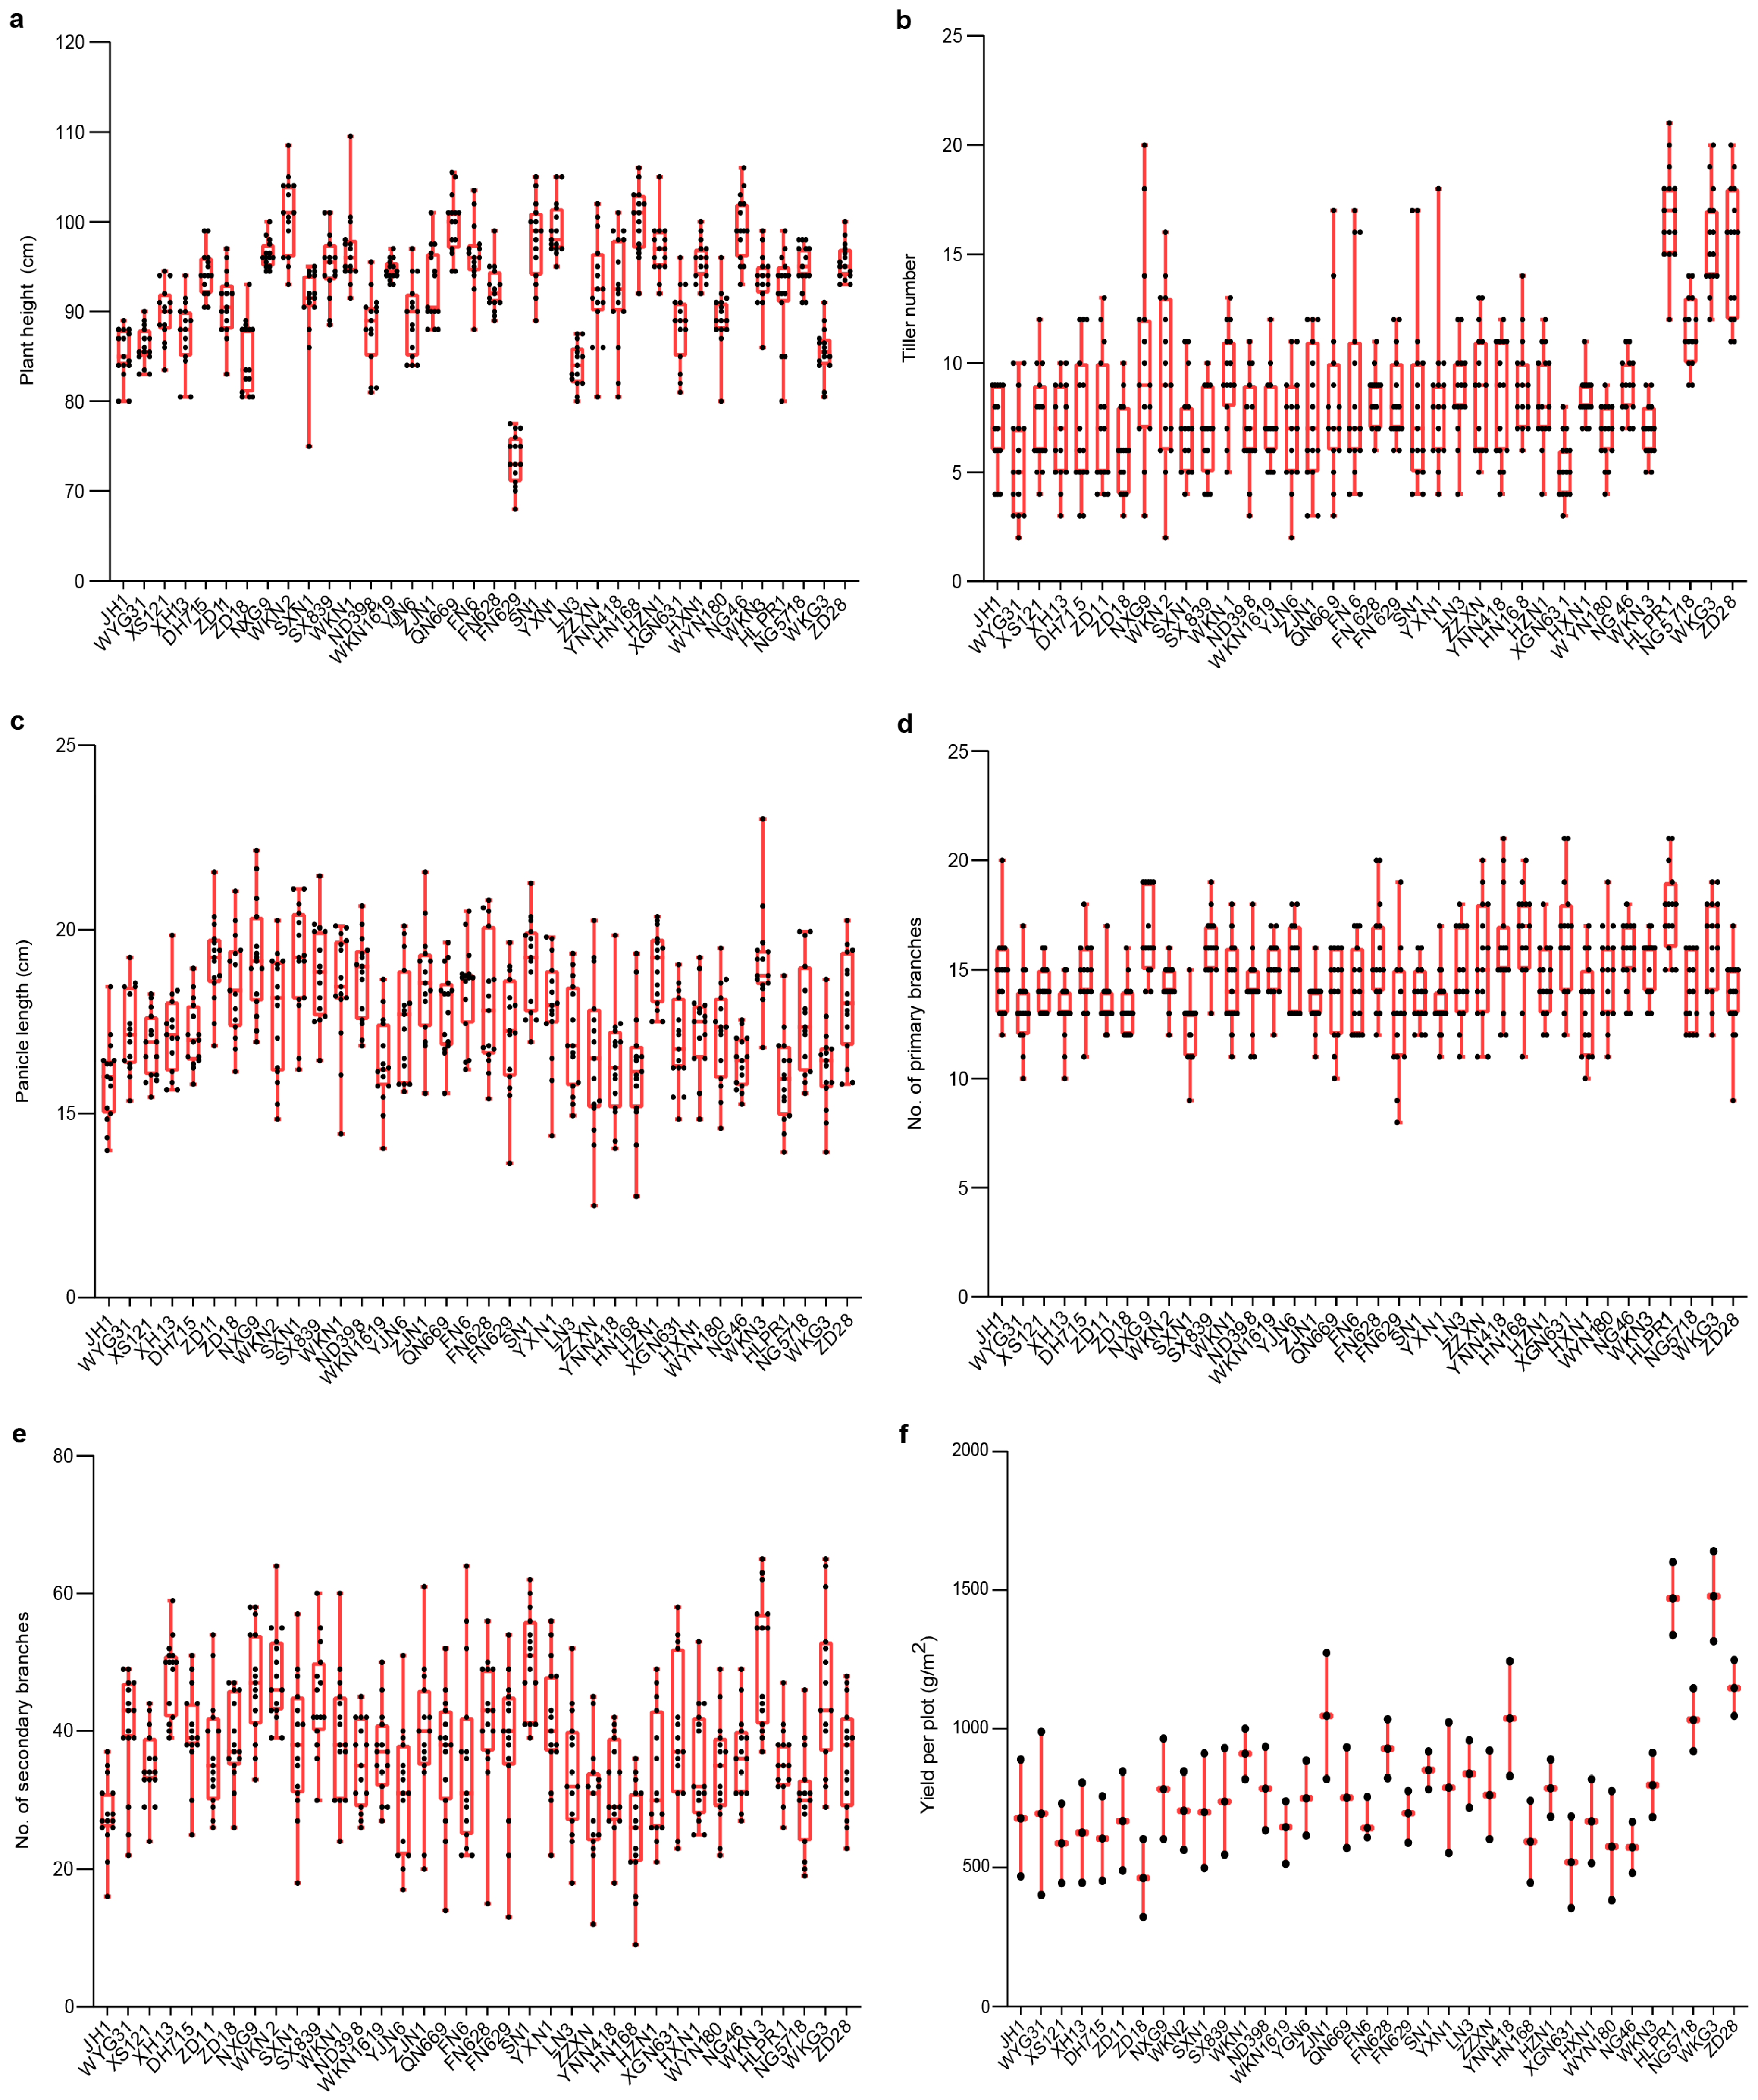
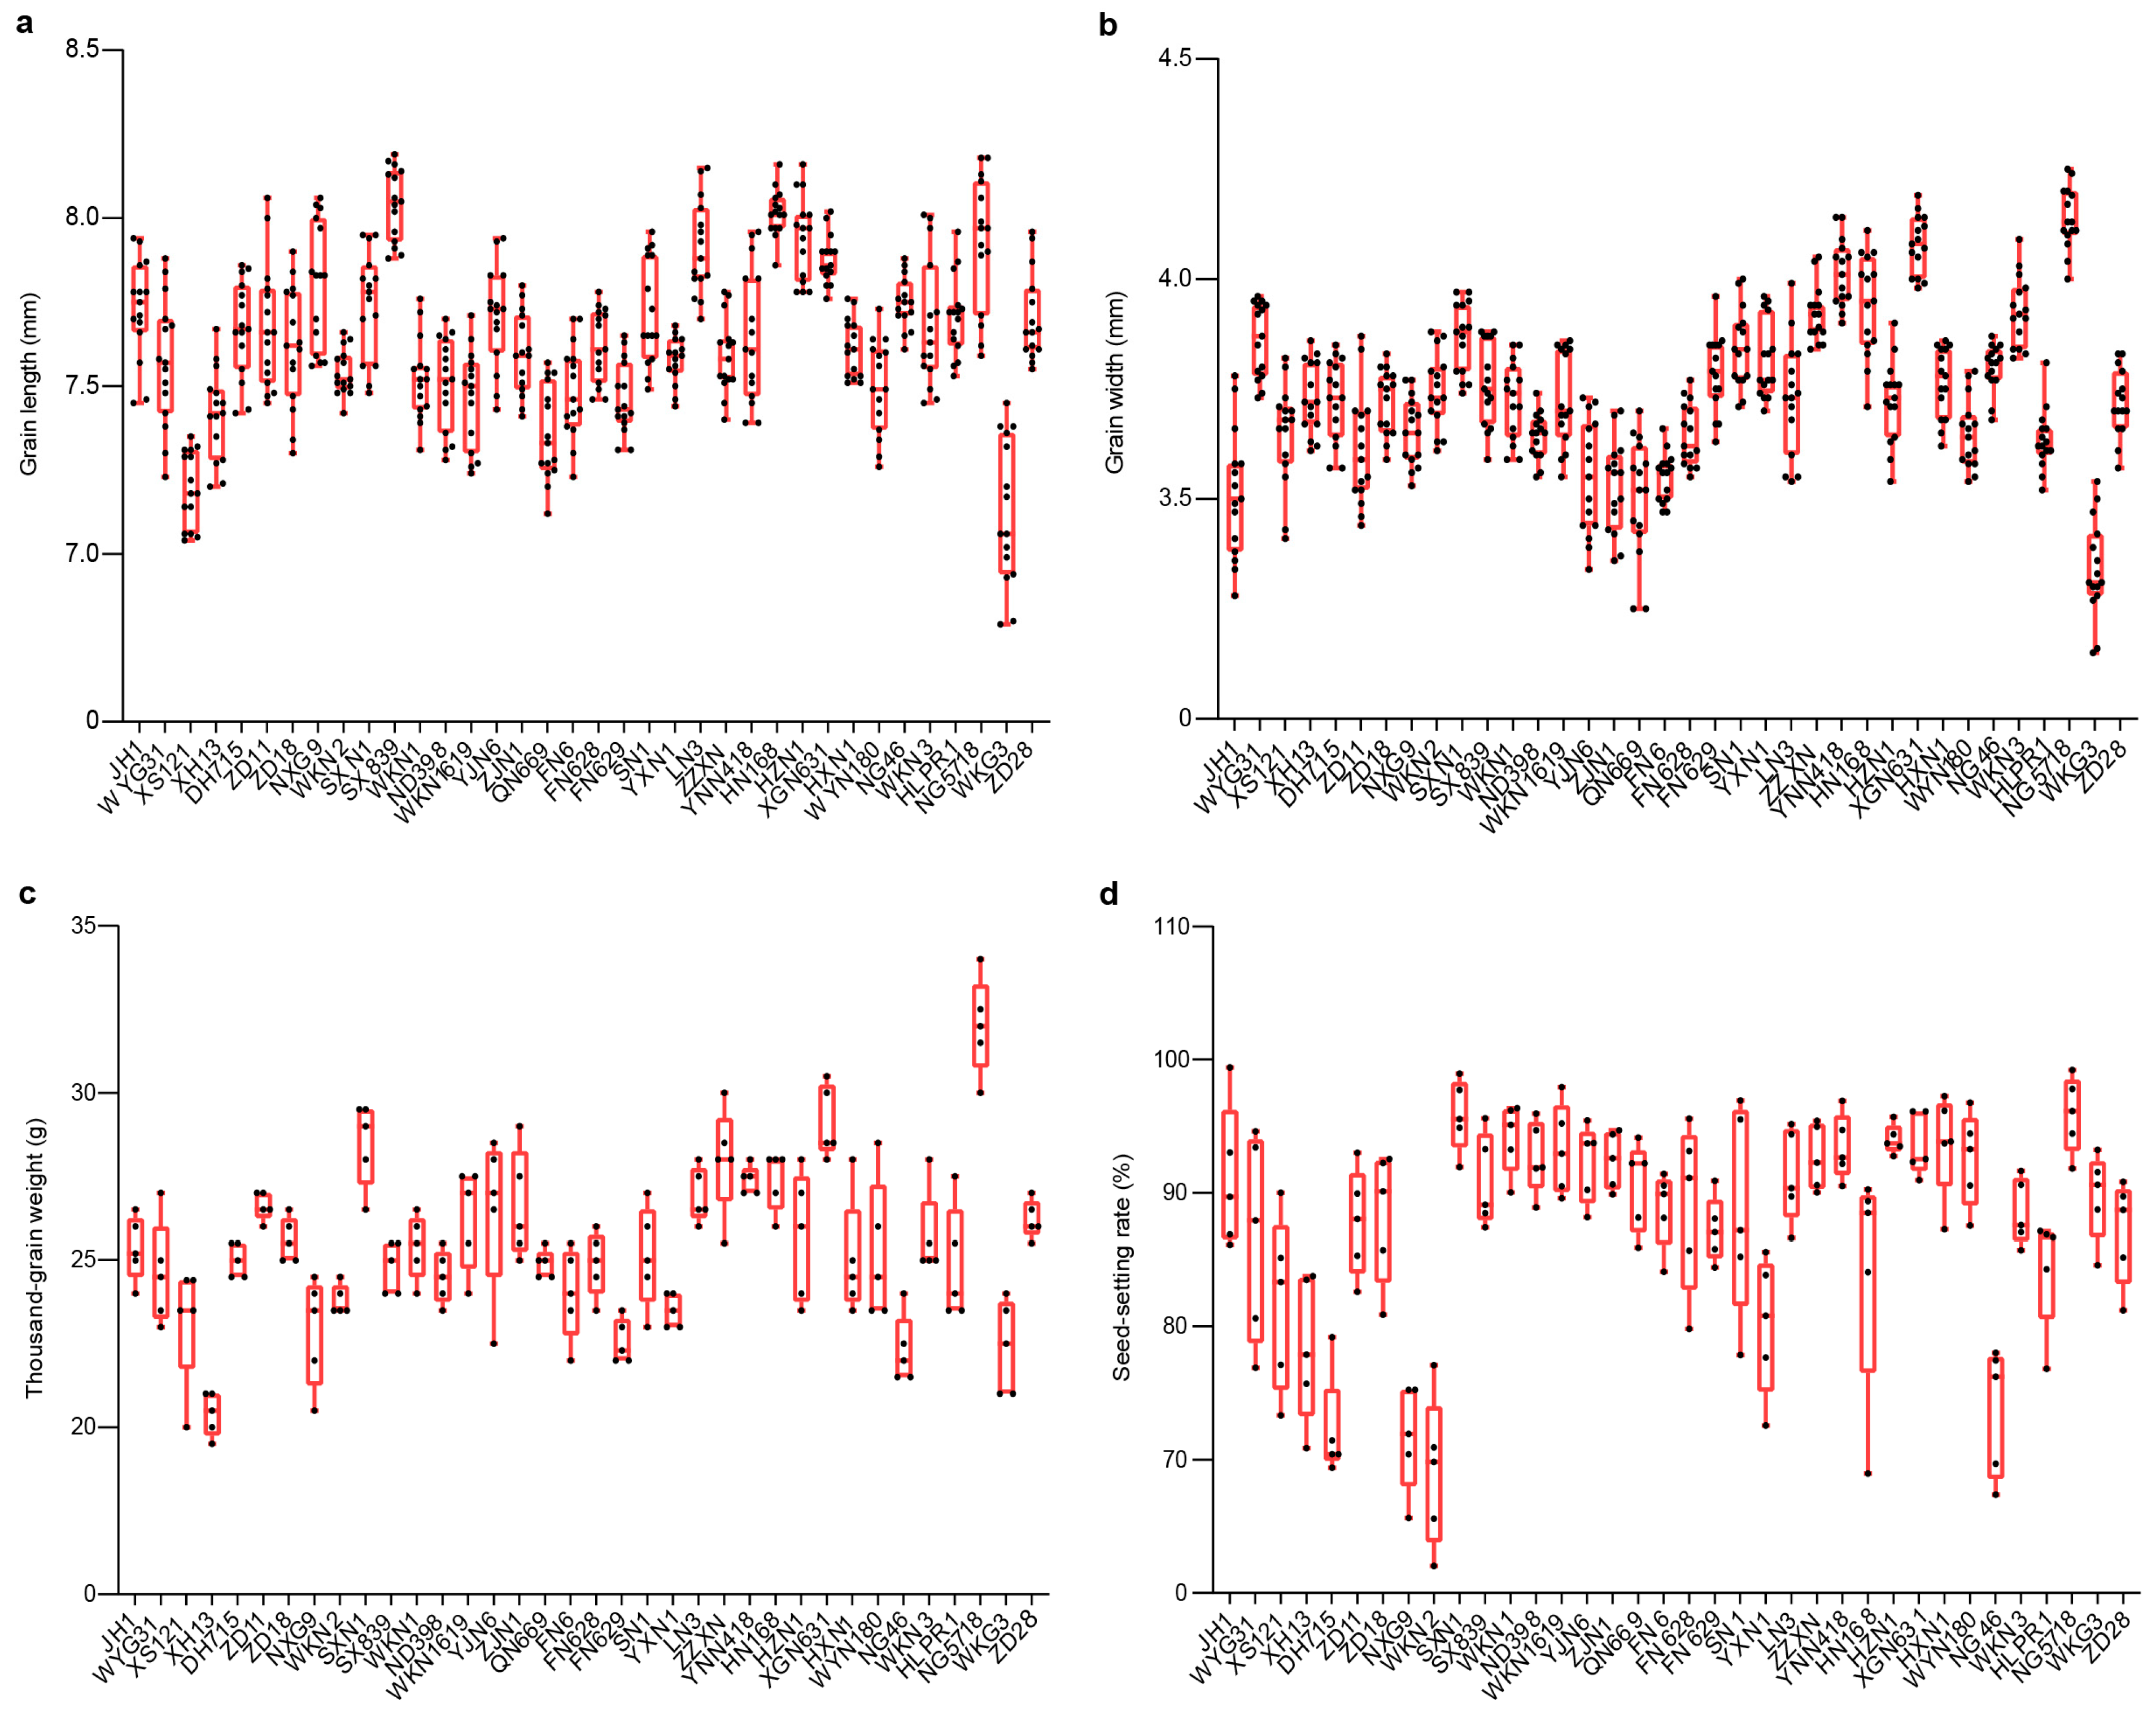
3.1. Variation in Agronomic Traits Under Different Environmental Conditions

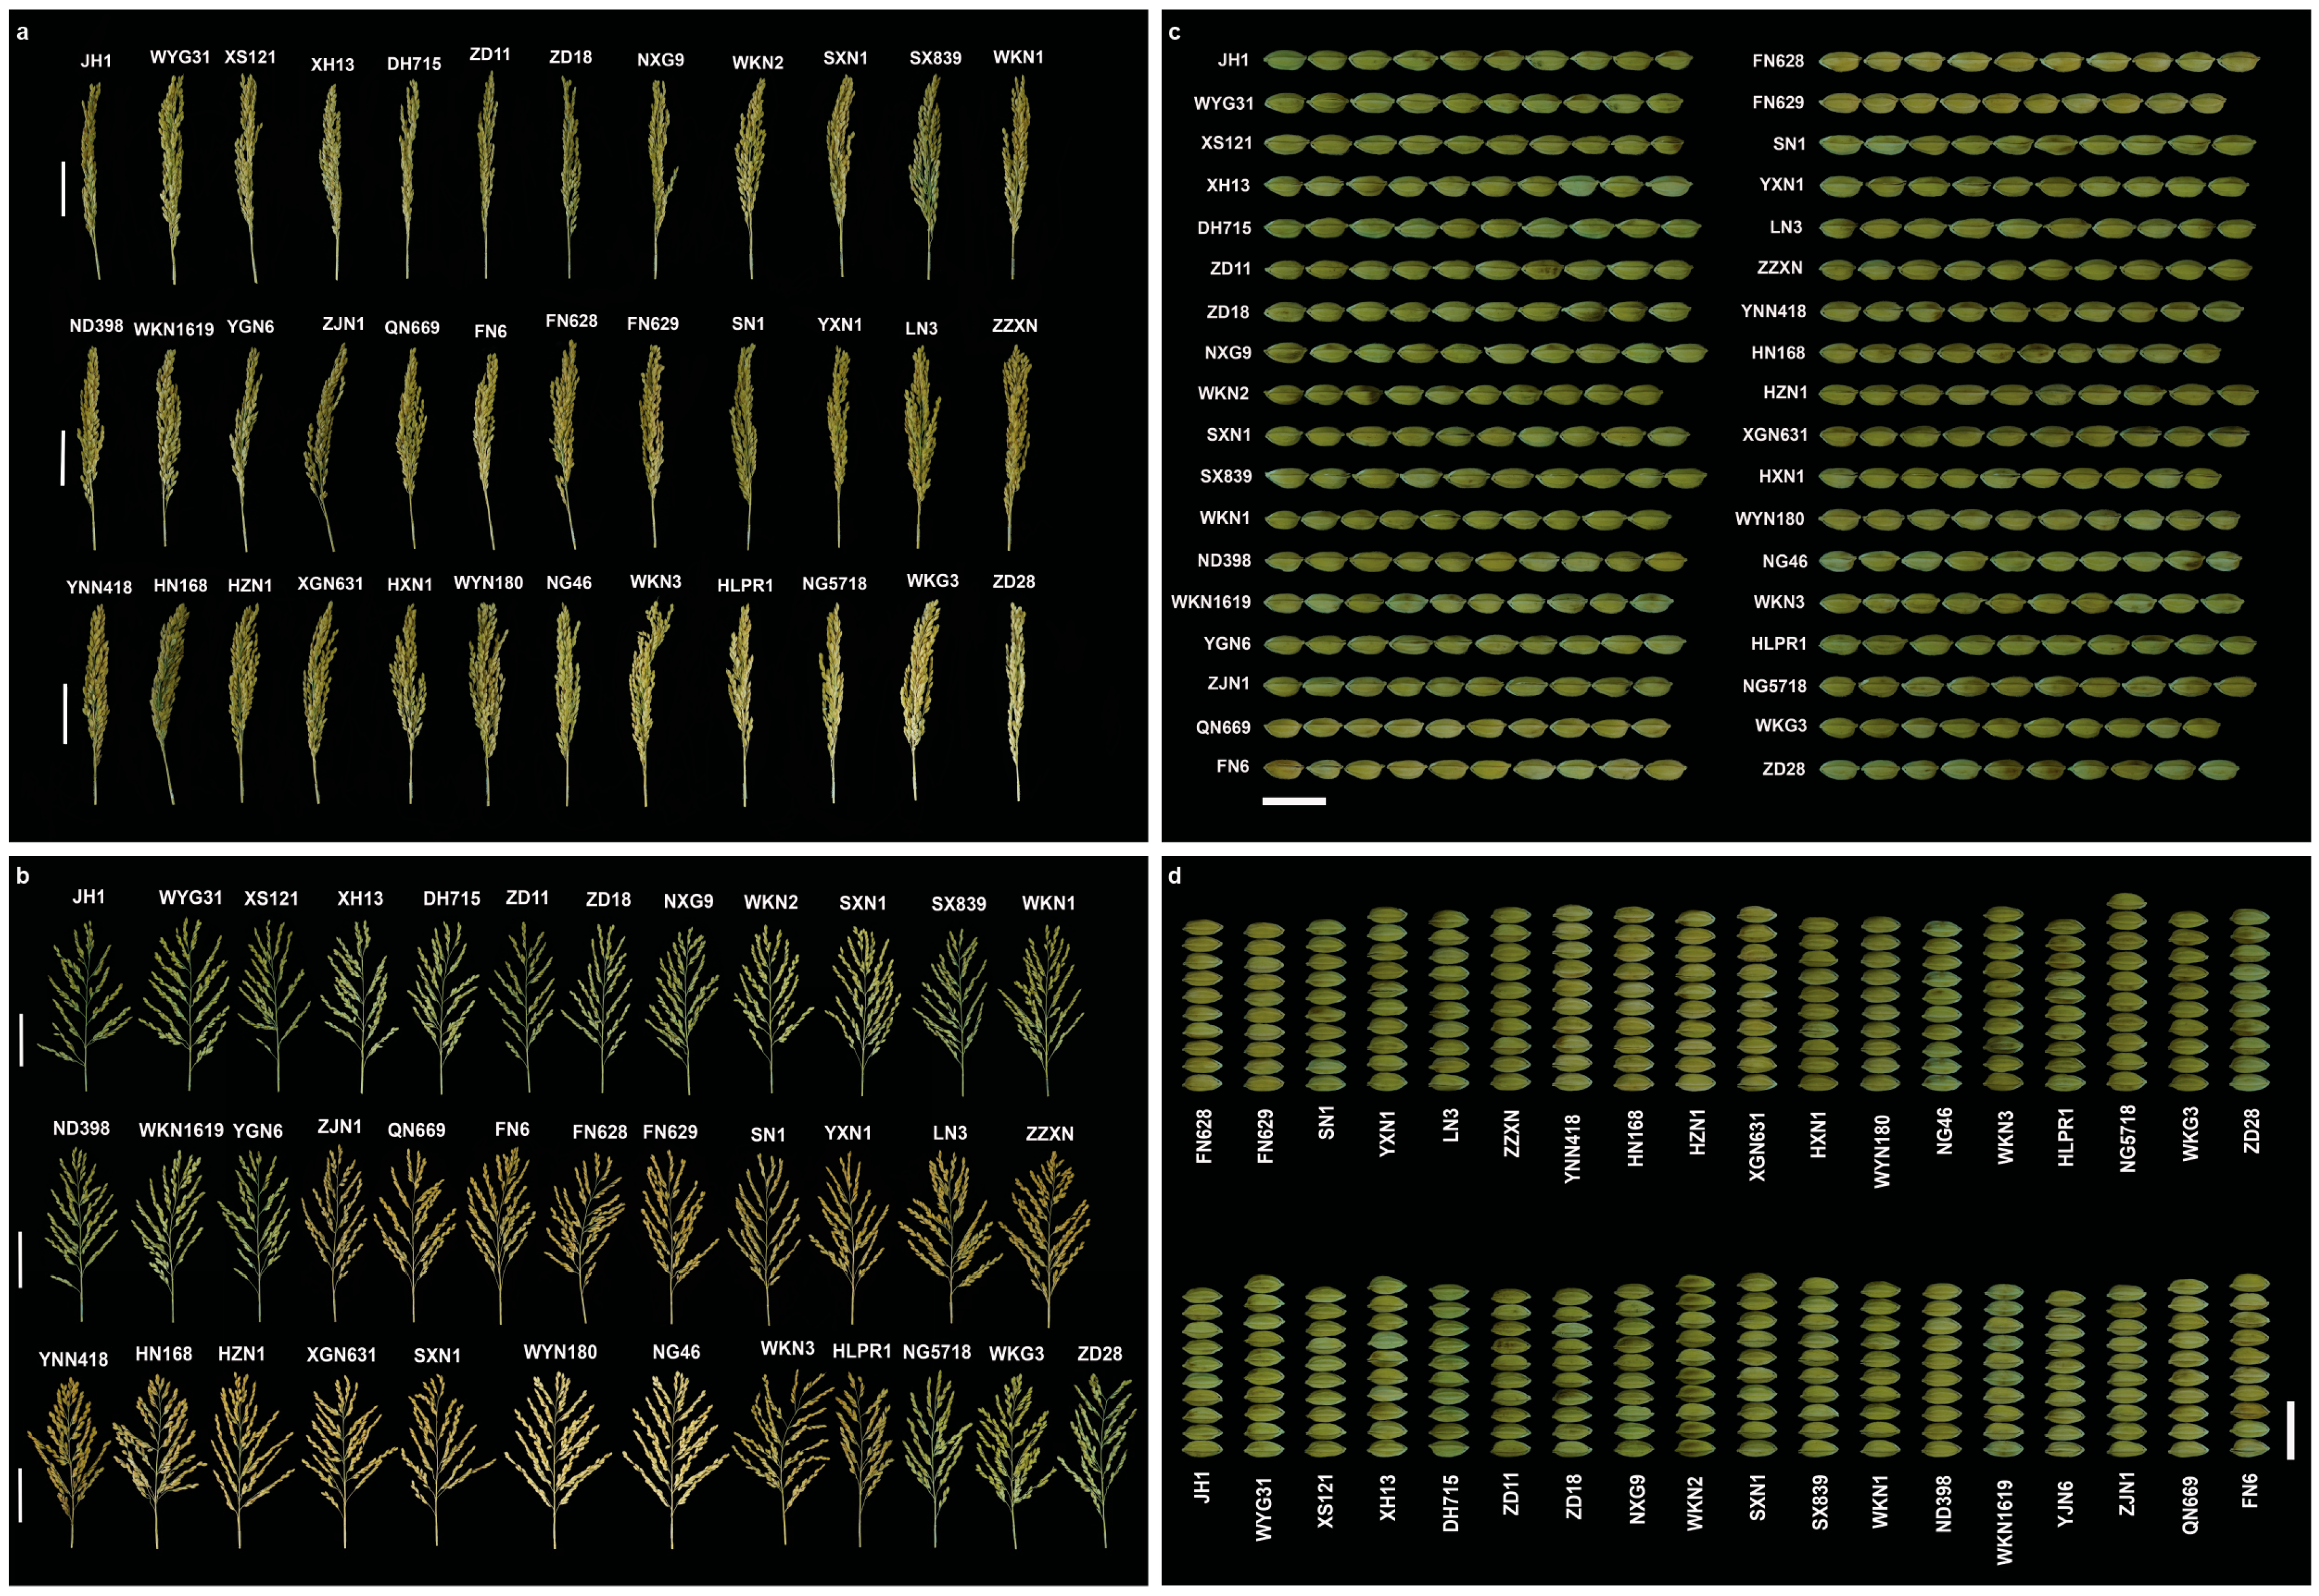
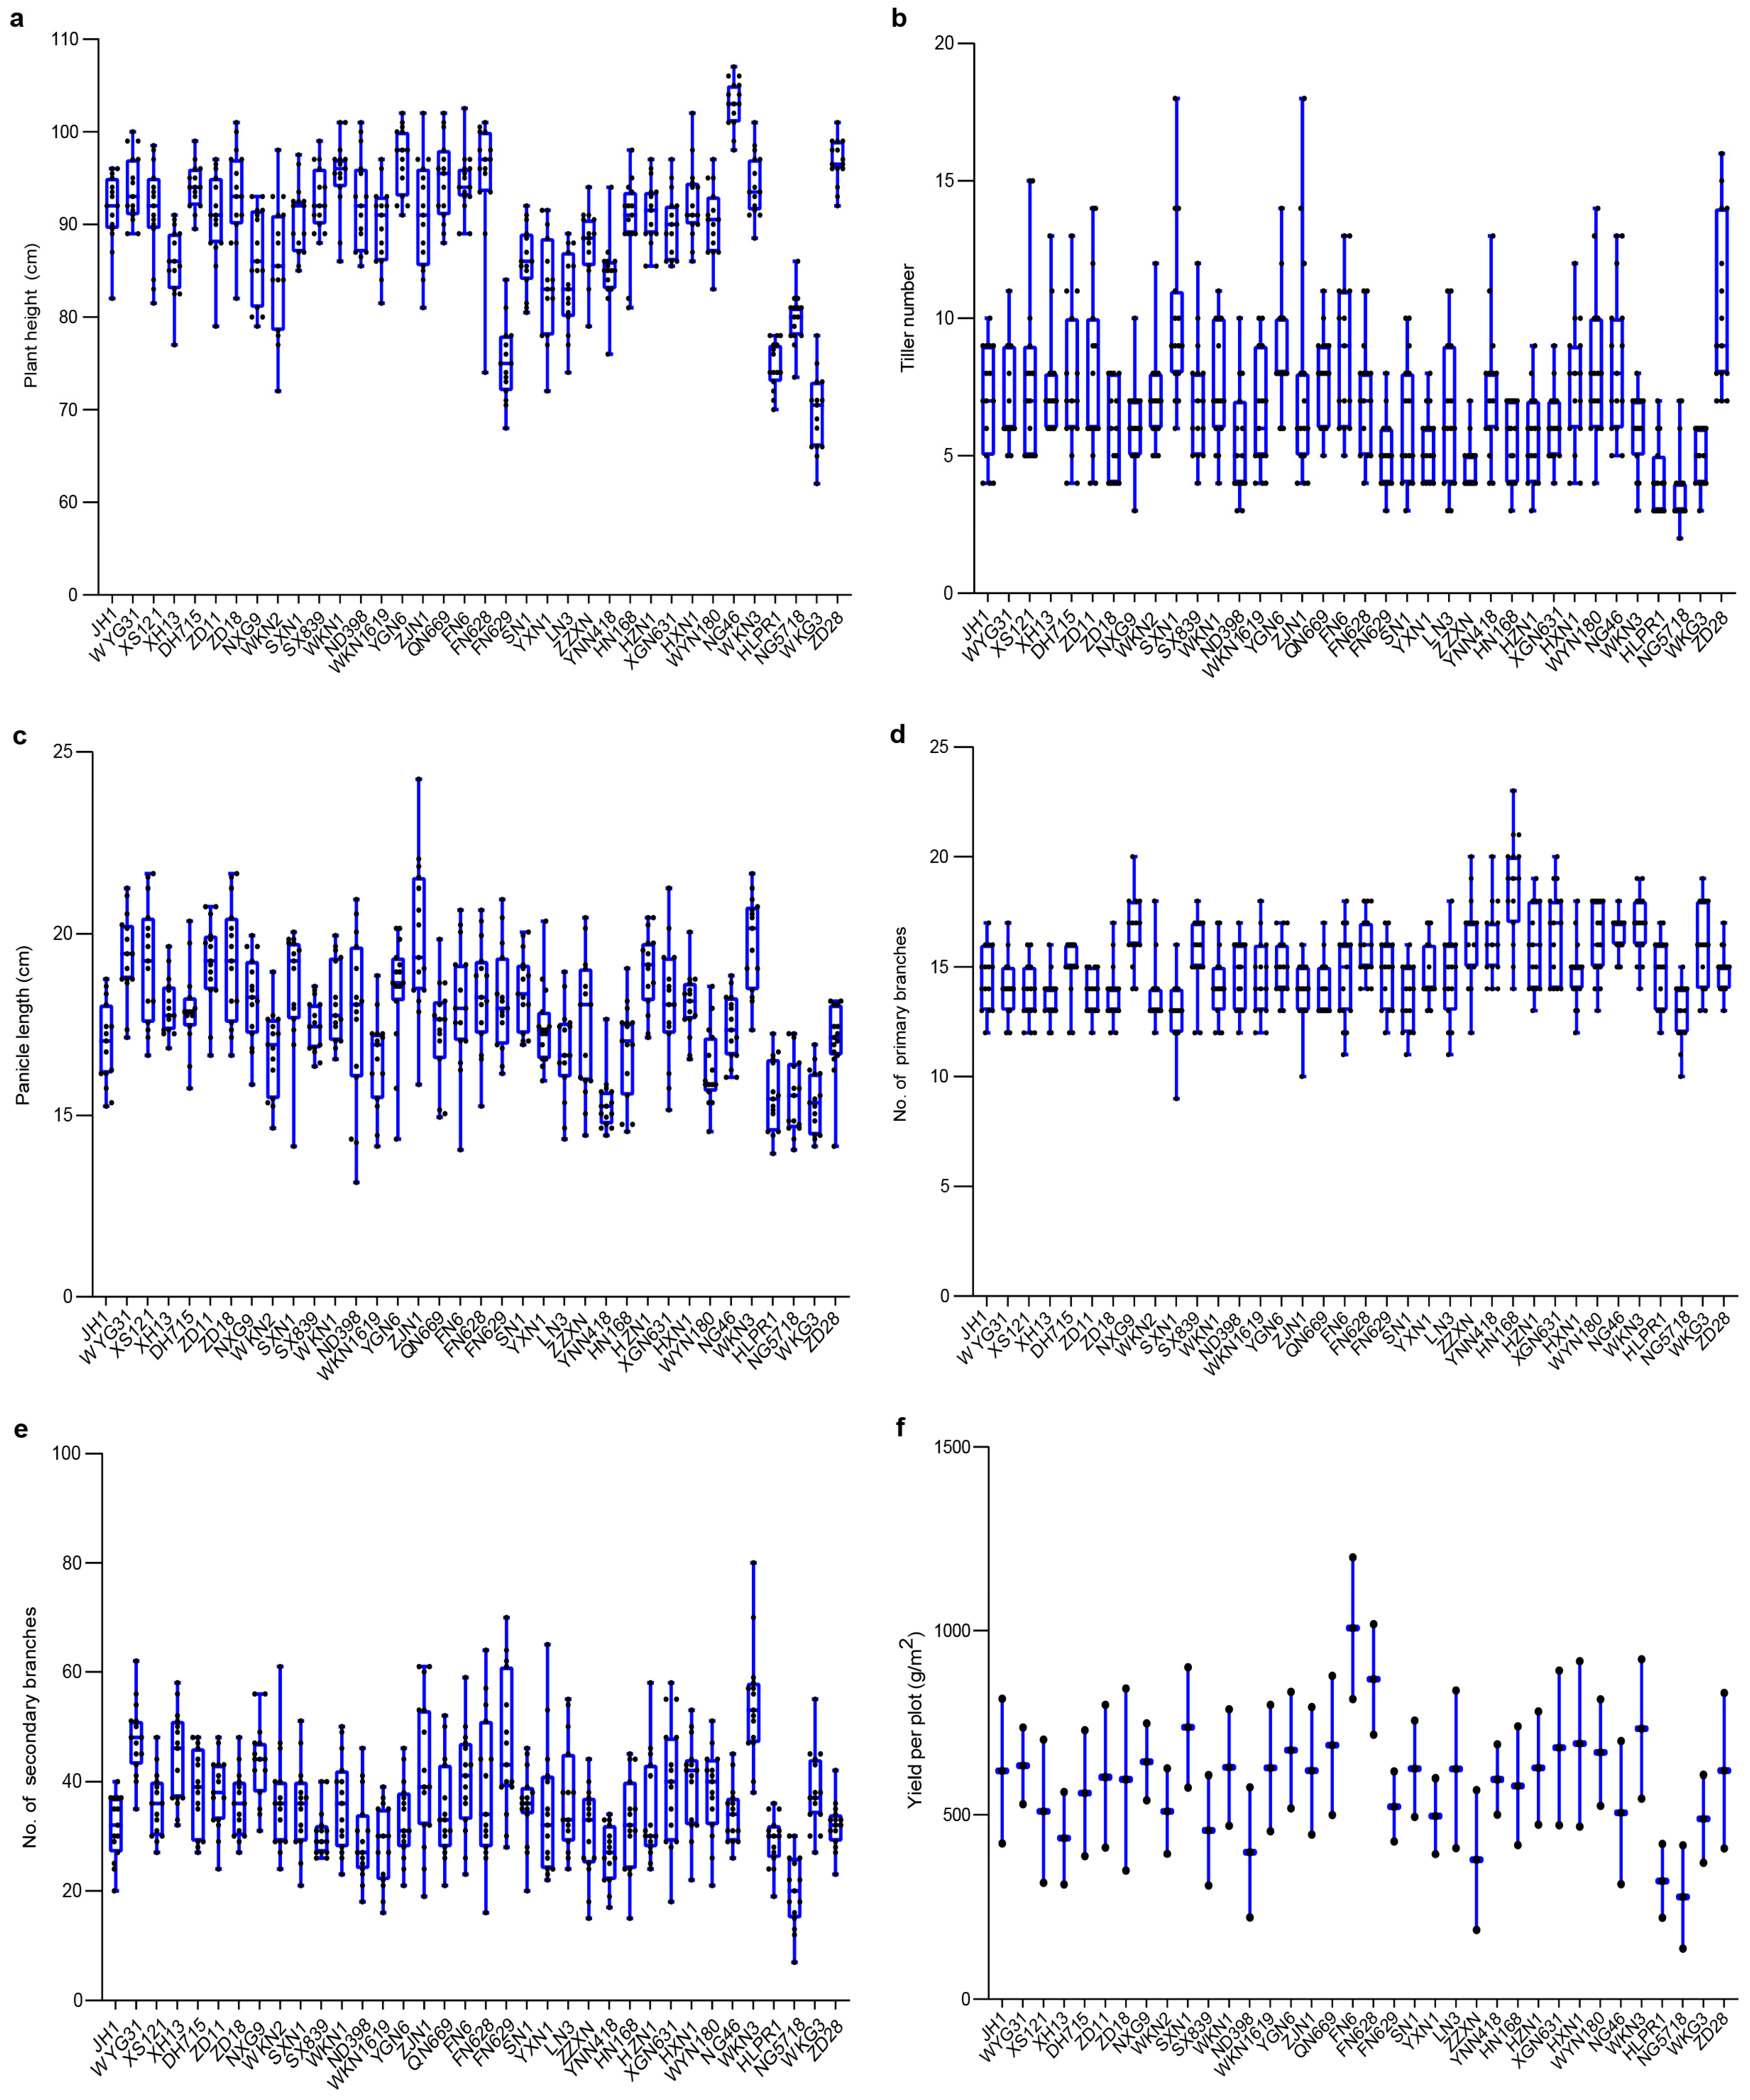
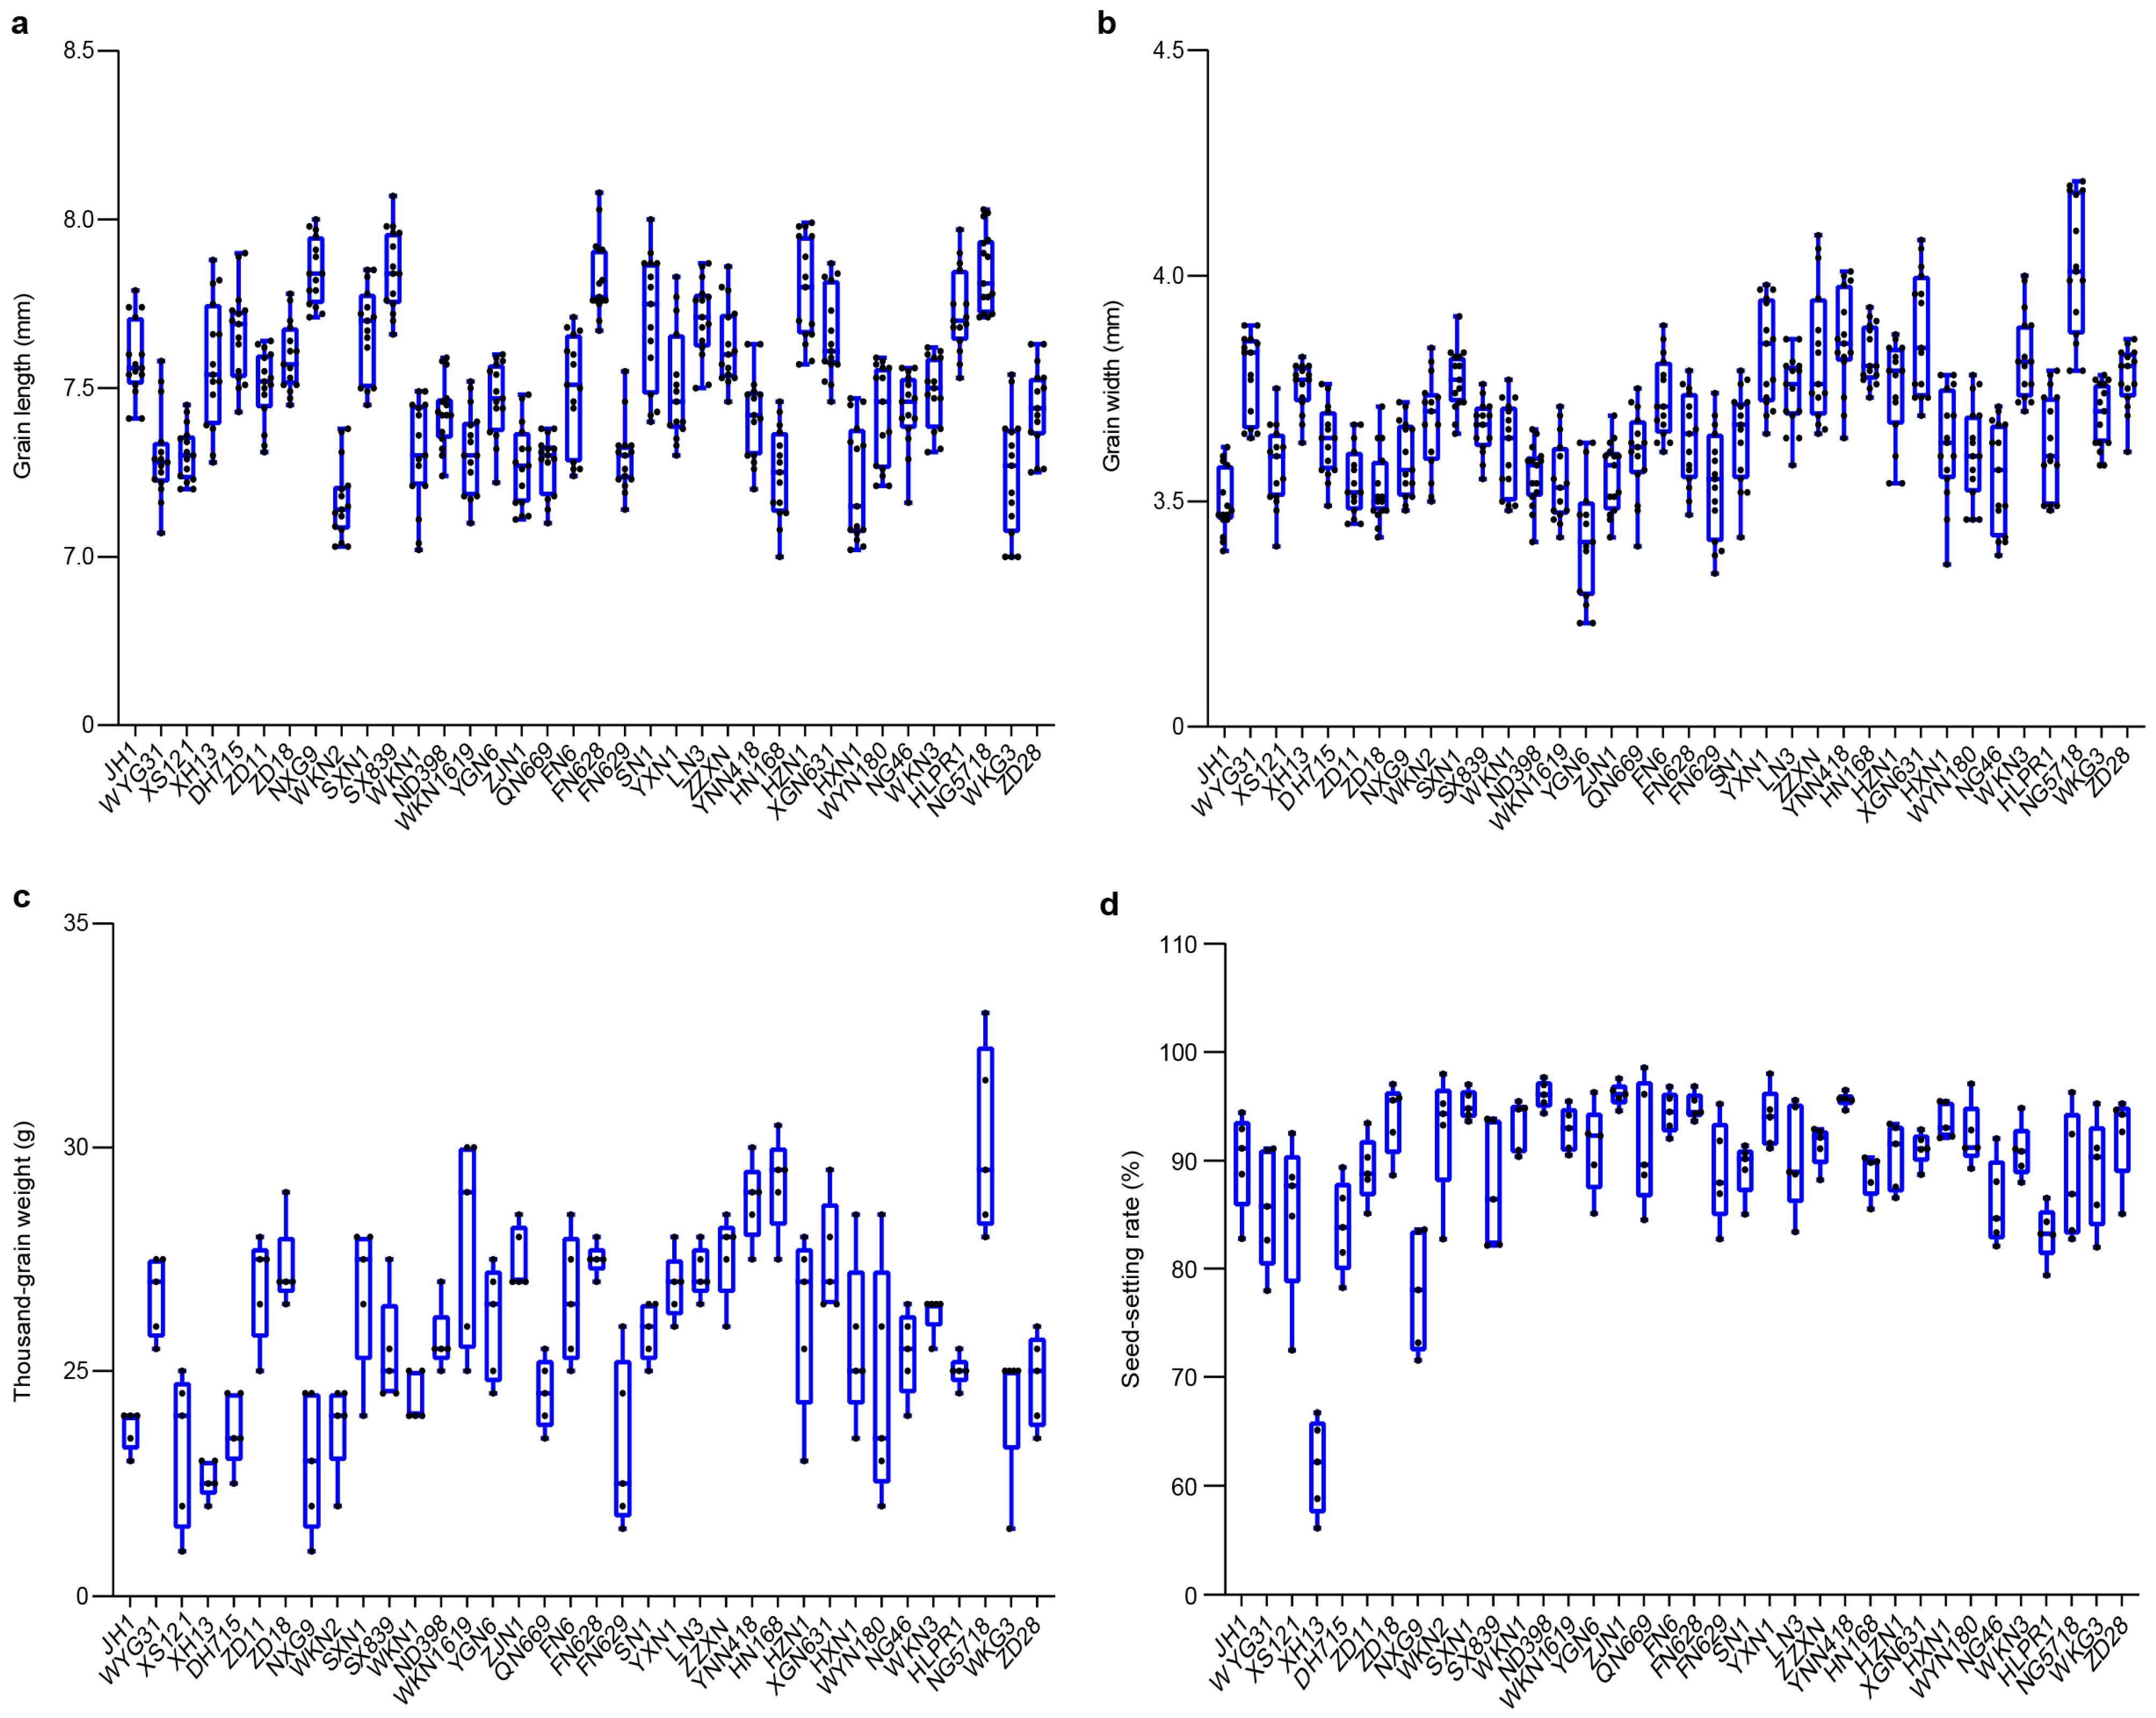
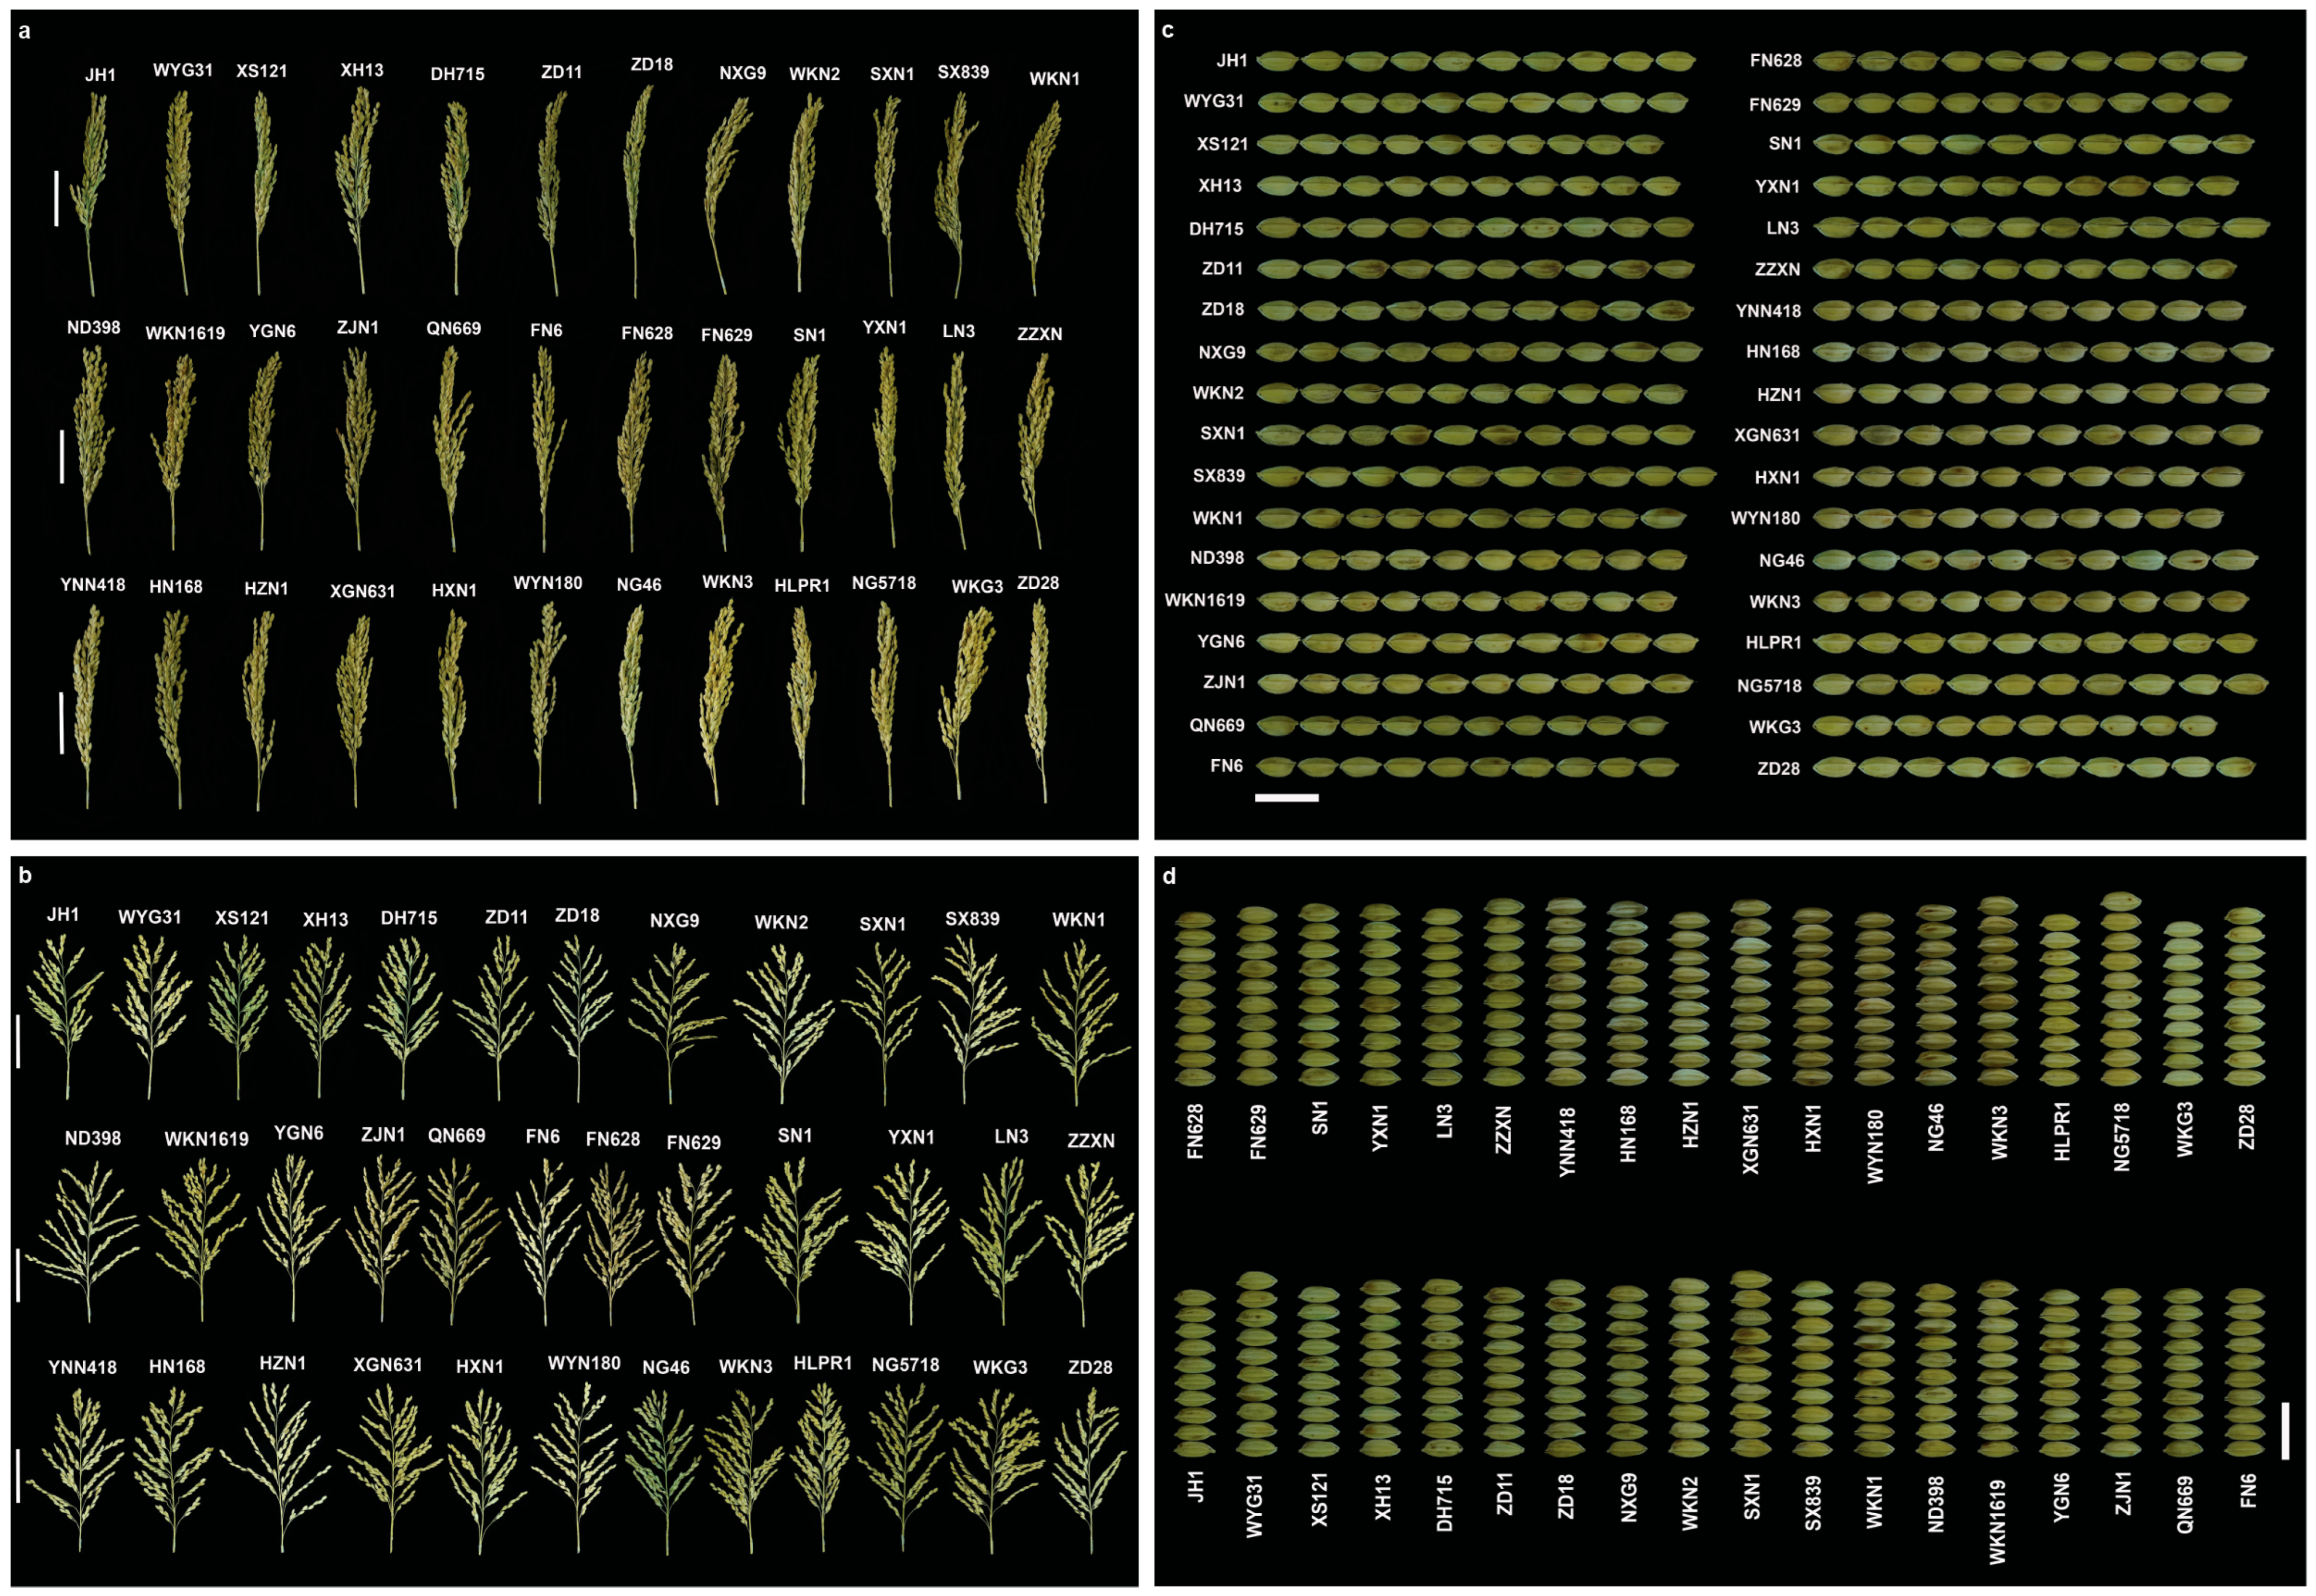
3.1.1. Variation in Agronomic Traits in Fengyang

Under the environmental conditions in Fengyang, the 36 japonica accessions showed variation in agro-morphological traits including plant height, tiller number, panicle length, number of primary branches, number of secondary branches, grain length, grain width, thousand-grain weight, seed-setting rate, and yield per plot (Figure 1, Figure 2 and Figure 3 and Table S2). Cultivars NJ46, YJG6, and ZD28 showed the greatest plant heights with means and standard deviations of 103.13 ± 2.59, 96.90 ± 3.60, and 96.73 ± 2.43 cm, respectively. Cultivars WKG3, HLPR1, and FG629 had the lowest plant height, with 69.63 ± 4.23, 74.83 ± 2.62, and 79.83 ± 2.83 cm, respectively (Figure 2a and Table S2). The number of tillers varied greatly among cultivars (Table 1 and Table S2) and was reported as the highest for ZD28 (10.3 ± 3.1) and SXN1 (9.9 ± 3.1) while NG5718 (3.9 ± 1.5) and HLPR1 (4.1 ± 1.3) showed the lowest values (Figure 2b and Table S2). Similarly, ZJN1 (19.86 ± 2.10 cm), WKN3 (19.75 ± 1.30 cm), WYG31 (19.36 ± 1.20 cm), ZD11 (19.20 ± 1.20 cm), ZD18 (19.20 ± 1.65 cm), and HZN1 (19.08 ± 1.10 cm) had the longest panicles, whereas YNN418 (15.33 ± 0.77 cm), WKN3 (15.40 ± 0.87 cm), HLPR1 (15.55 ± 1.00 cm), and NG5718 (15.58 ± 1.10 cm) had the shortest (Figure 1a and Figure 2c and Table S2). The greatest number of primary branches was observed in HN168 (18.67 ± 2.41), while SXN1 (13.61 ± 1.45) and NG5718 (13.00 ± 1.30) had the least (Figure 1b and Figure 2d and Table S2). In contrast, WKN3 (54.20 ± 10.67) had the highest number of secondary branches, whereas NG5718 (20.00 ± 6.74) had the lowest (Figure 2e and Table S2). Cultivar FN6 (1006 ± 192 g/m2) had the highest yield per plot and NG5718 (277 ± 139 g/m2) had the lowest among the cultivars (Figure 2f and Table S2).
Among grain characteristics, SX839 (7.85 ± 0.12 mm), NG5718 (7.85 ± 0.12 mm), NXG9 (7.85 ± 0.10 mm), and FN628 (7.83 ± 0.12 mm) had the greatest grain lengths while WKN2 (7.16 ± 0.11 mm) had the lowest (Figure 1c and Figure 3a and Table S2). For grain width, NG5718 (4.02 ± 0.15 mm) had the highest and YGN6 (3.42 ± 0.12 mm) the lowest (Figure 1d and Figure 3b and Table S2). The highest thousand-grain weight was for NG5718 (30.10 ± 2.10 g), while XH13 (22.60 ± 0.42 g) had the lowest (Figure 3c and Table S2). For seed-setting rate, ND398 (96.07 ± 1.08%) and ZJN1 (96.08 ± 1.08%) had the highest, while XH13 (61.77 ± 4.36%) had the lowest (Figure 3d and Table S2).

3.1.2. Variation in Agronomic Traits in Hexian Rice Fields

In Hexian, the 36 japonica cultivars exhibited distinct variations in agronomic traits (Figure 4, Figure 5 and Figure 6 and Table S3). Cultivars WKN2, HN168, QN669, NG46, and YXN1 had the greatest plant heights, with means of 100.67 ± 4.28, 100.07 ± 3.75, 99.73 ± 3.35, 99.40 ± 3.66, and 99.17 ± 3.03 cm, respectively. The shortest plants were for FN629 with 73.53 ± 2.86 cm (Figure 5a and Table S3). Tiller numbers varied significantly among cultivars (Table 1 and Table S3), with the greatest for HLPR1 (16.9 ± 2.3), WKG3 (15.6 ± 2.3), and ZD28 (15.2 ± 3.0) while WYG31 (5.3 ± 1.4) and XGN631 (5.7 ± 2.6) had the least (Figure 5b and Table S3). Panicle length was greatest for NXG9 (19.22 ± 1.52 cm), ZD11 (19.15 ± 1.16 cm), SXN1 (19.14 ± 1.53 cm), WKN3 (19.14 ± 1.36 cm), and SN1(19.07 ± 1.25 cm) while JH1 (15.94 ± 1.15 cm) and HLPR1 (15.96 ± 1.23 cm) had the least (Figure 4a and Figure 5c and Table S3). The greatest number of primary branches was for HLPR1 (17.67 ± 2.00), NXG9 (16.67 ± 1.88), HN168 (16.53 ± 2.33), XGN631 (16.53 ± 2.61), WKG3 (65.20 ± 1.33), and SX839 (16.07 ± 1.44), while SXN1 (12.33 ± 1.65) had the least (Figure 4b and Figure 5d and Table S3). Cultivar WKN3 (50.53 ± 9.59) and SN1 (50.07 ± 7.35) had the highest number of secondary branches while HN168 (24.93 ± 7.75) and JH1 (27.93 ± 5.30) had the least (Figure 5e and Table S3). Yield per plot was the greatest for WKG3 (1478 ± 162 g/m2) and HLPR1 (1469 ± 131 g/m2) but least for ZD18 (462 ± 140 g/m2) (Figure 5f and Table S3).
Grain length was the greatest for SX839 (8.04 ± 0.19 mm) and HN168 (8.01 ± 0.07 mm), whereas WKG3 (7.12 ± 0.22 mm) and XS121 (7.19 ± 0.11 mm) had the smallest (Figure 4c and Figure 6a and Table S3). However, grain width was the greatest for NG5718 (4.14 ± 0.08 mm), XGN631 (4.07 ± 0.06 mm), and YNN418 (4.01 ± 0.07 mm), while WKG3 (3.34 ± 0.11 mm) had the smallest (Figure 4d and Figure 6b and Table S3). Thousand-grain weight was the greatest for NG5718 (32.00 ± 1.46 g) but lowest for XH13 (20.40 ± 0.65 g) (Figure 6c and Table S3). Seed-setting rate was the highest in NG5718 (95.88 ± 2.87%) and SXN1 (95.80 ± 2.71%), and lowest in WKN2 (69.09 ± 5.70%) among the cultivars (Figure 6d and Table S3).

3.2. Trait Variation and Distribution Patterns in Fengyang and Hexian

A statistical summary of agronomic traits across the 36 japonica cultivars grown in Fengyang and Hexian is presented in Table 1. The average mean values indicated that GL and GW showed high uniformity in both sites, shown by their low coefficient of variations (CVs) (1.73–2.72%). In contrast, TN (28.69–30.70%) and SB (21.61–22.53%) exhibited the highest CVs, indicating substantial variation among cultivars. Skewness for most traits was between −0.5 and 0.5 (Table 1) in both environments, showing an approximate symmetry except for PL (−1.07) and SR (−2.83) in Fengyang, which showed obvious left skewness, suggesting a concentration of higher mean values in these traits. In Hexian, TN (2.03) and YD (1.84) showed right skewness, indicating more cultivars with lower mean values in these traits. The kurtosis coefficient for most traits exhibited moderate deviation from zero. However, SR in Fengyang (11.18) and TN in Hexian (4.22) showed a heavily tailed distribution, indicating the presence of outliers.

3.3. Comparative Analysis of Agronomic Traits Between Fengyang and Hexian Rice Fields

The agronomic traits exhibited variation between Fengyang and Hexian across the 36 japonica cultivars (Table 2 and Table S4). Overall, 52.8% of the cultivars exhibited significant differences in PH, with a higher proportion of cultivars showing higher significant differences in Hexian (36.11%) than in Fengyang (16.66%). Similarly, TN showed significant differences in 44.44% of the cultivars, with 38.89% of significant differences observed in Hexian and 5.55% in Fengyang. Trait PL exhibited significant differences in 30.77% of cultivars, with 19.44% and 11.11% of significant differences in Fengyang and Hexian, respectively. Traits PB and SB showed lower levels of significant differences, with 12.12% and 25% of the cultivars affected, respectively. Notably, more significant differences in SB were observed in cultivars in Hexian (19.44%) compared to Fengyang (5.55%). Traits GL and GW displayed significant differences of 61.11% and 72.22%, respectively. The highest significant differences in GL were in Hexian (52.78%) compared to Fengyang (8.33%) and GW also showed higher significant differences in Hexian (44.44%) than Fengyang (27.78%). For TGW, significant differences were observed in 36.11% of cultivars, with 25.00% of significant differences in Fengyang and 11.11% in Hexian. Trait SR displayed significant differences in 22.22% of cultivars, with Fengyang (16.67%) having slightly higher significant differences than Hexian (5.55%). Trait YD showed significant differences in 61.11% of cultivars, with higher significant differences in Hexian (50.00%). The p-values for all traits ranged within 0.0001–0.0492, confirming the environmental influence on trait performance between cultivars in Fengyang and Hexian.

3.4. Trait Relationships Between Fengyang and Hexian

We next analyzed the relationships between agronomic traits across the 36 japonica cultivars grown in Fengyang and Hexian (Table 3 and Table S5). The results from Fengyang showed strong positive correlations of PH with TN (0.65), PL (0.50), and YD (0.47), indicating taller cultivars with higher TN, PL, and YD. Trait TN was also positively correlated with YD (0.57), indicating that higher TN contributed to higher YD. Traits PH (0.47), TN (0.57), PL (0.40), SB (0.44), and SR (0.35) were positively correlated with YD, suggesting their influence on YD in this environment. Trait TGW was positively correlated with GW (0.48) and SR (0.48) but not significantly correlated with YD (0.07). In Fengyang, agronomic traits such as PB (0.07), GL (−0.07), and GW (−0.14) showed no significant correlations with YD and other key traits, indicating their limited contribution to YD.
In Hexian, there was a strong positive correlation between TN and YD (0.87), indicating the critical role of TN in YD. Trait PL was positively correlated with SB (0.46), indicating that higher PL contributed to higher SB. In contrast, PL was negatively correlated with PB (−0.40), indicating a trade-off between these traits in Hexian. Trait TGW was positively correlated with GL (0.53) and GW (0.53), indicating interdependence of grain size traits. Trait SR was positively correlated with TGW (0.59) but negatively with SB (−0.40), suggesting that higher SR contributes to higher TGW but lower SB. There were no significant correlations between YD and PH (−0.02), PL (−0.13), PB (0.29), SB (0.08) GL (−0.12), GW (−0.23), TGW (0.03), and SR (0.14), indicating that these traits did not contribute to YD in Hexian.

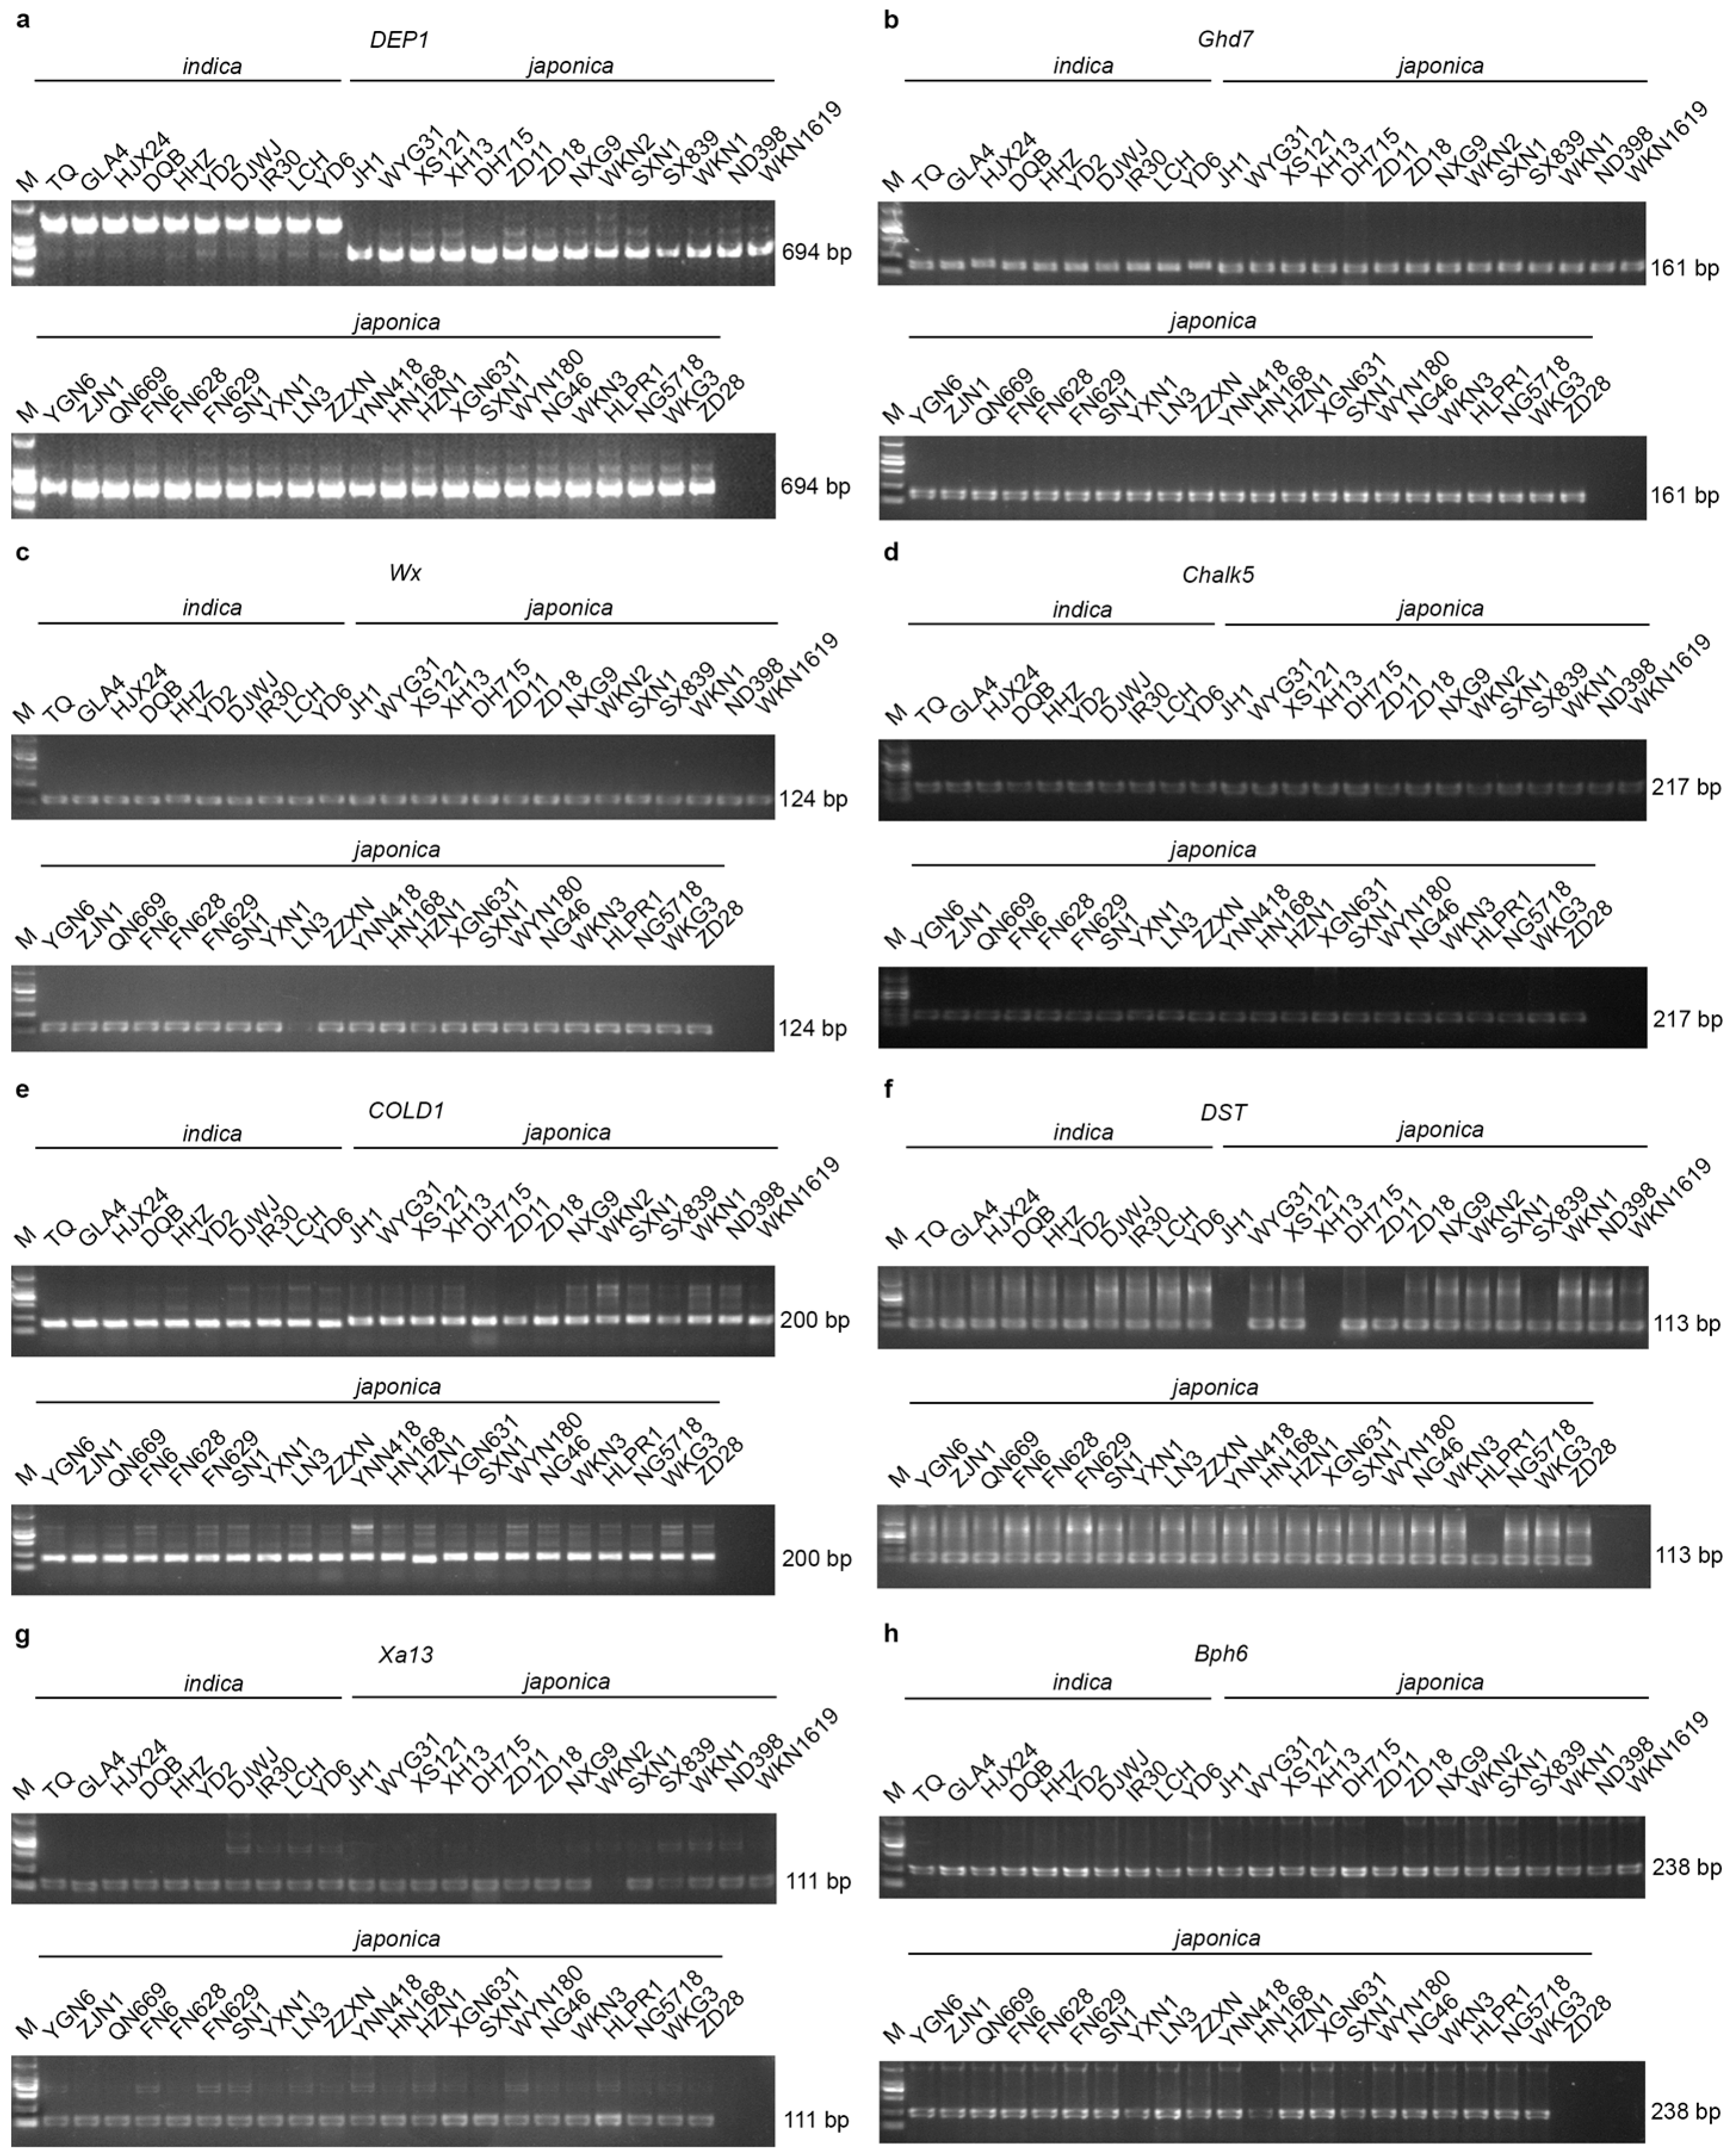
3.5. PCR Analysis of Japonica Cultivars

To study the genes linked with these agronomic traits, seven Simple Sequence Repeat (SSR) markers were used in this study: Ghd7 for heading date; Wx, and Chalk5 for grain quality; COLD1, and DST for stress tolerance; Xa13, and Bph6 for disease resistance; and an EST marker DEP1 for grain yield. The PCR amplification and gel electrophoresis revealed distinct band patterns across the 36 japonica cultivars, while the indica cultivars exhibited variation in some genes (Figure 7a–h). There were consistent band locations among most japonica cultivars at the expected fragment sizes for each gene: DEP1 (694 bp) (Figure 7a), Ghd7 (161 bp) (Figure 7b), Wx (124 bp) (Figure 7c), Chalk5 (217 bp) (Figure 7d), COLD1 (200 bp) (Figure 7e), DST (113 bp) (Figure 7f), Xa13 (111 bp) (Figure 7g), and Bph6 (238 bp) (Figure 7h and Supplementary Figures S3–S10). However, gene Wx was absent from japonica rice cultivar LN3, and two indica cultivars (HHZ and YD6) showed band variation (Figure 7c and Figure S5), suggesting a null allele and an allelic difference in Wx between japonica and indica rice cultivars. Similarly, DST was absent for japonica cultivars JH1 and XH13 (Figure 7f and Figure S8), indicating that they may lack DST alleles or carry a non-functional variant. Japonica cultivar WKN2 showed no amplification of Xa13 (Figure 7g and Figure S9), suggesting absence of a Xa13 allele, which is associated with bacterial blight resistance. Gene Bph6 was also absent from japonica cultivar ZD28 (Figure 7h and Figure S10), indicating lack of a Bph6 allele, which confers resistance to brown planthopper. Interestingly, japonica cultivar HZN1 showed band variation in COLD1 similar to indica cultivars (Figure 7e and Figure S7), suggesting that the function of the COLD1 allele in HZN1 may be similar to that in indica cultivars. The indica cultivars displayed variation in band pattern for DEP1 (Figure 7a), Ghd7 (Figure 7b), Wx (Figure 7c), COLD1 (Figure 7e), and Xa13 (Figure 7g and Supplementary Figures S3–S5, S7 and S9).

4. Discussion

The Jianghuai region is the main japonica rice cultivation zone in Anhui Province, with Fengyang tending to have slightly more sunshine hours and Hexian to receive more rainfall [31]. These climatic differences influence the type of rice cultivars suitable for each environment. Our findings of agronomic performance and gene detection in the japonica cultivars grown in Fengyang and Hexian confirmed the influence of environmental conditions on trait expression, consistent with previous findings [32,33,34,35]. Our results clearly showed significant differences among cultivars, with traits like grain width, grain length, yield per plot, and plant height having the highest significant differences (Table 2 and Table S4). There were strong positive correlations between tiller number and yield per plot in both Fengyang and Hexian (Table 3 and Table S5), while gene identification showed minimal band variation among the 36 japonica cultivars (Figure 7 and Figures S3–S10).

4.1. Analysis of Trait Variability and Distribution

In this study, cultivars like WKG3 and HLPR1 recorded the highest yield per plot (1478 ± 169 and 1469 ± 131 g/m2, respectively) and tiller number (15.6 ± 2.3 and 16.9 ± 2.3, respectively) in Hexian (Figure 5f and Table S3), compared to Fengyang, where WKG3 and HLPR1 displayed a low yield per plot (488 ± 119 and 320 ± 99 g/m2, respectively) and tiller number (4.9 ± 1.0 and 4.1 ± 1.3, respectively) (Figure 2f and Table S2). This suggests that the higher rainfall and warmer climate in Hexian [31] enhanced vegetative growth and promoted higher tillering and yield. In contrast, FN6 recorded the highest yield per plot in Fengyang (1006 ± 192 g/m2) (Figure 2f and Table S2) but only moderate yield in Hexian (669 ± 76 g/m2) (Figure 5f and Table S3). This suggests that FN6 may be suited for the slightly longer sunshine hours and reduced rainfall conditions in Fengyang [31]. Cultivar FN628 showed balanced performance in Fengyang and Hexian for traits like plant height (95.27 ± 2.68 and 92.47 ± 2.60 cm, respectively) (Figure 2a and Figure 5a; Tables S2 and S3), tiller number (7.3 ± 2.1 and 8.4 ± 1.3, respectively) (Figure 2b and Figure 5b; Tables S2 and S3), panicle length (18.31 ± 1.50 and 18.01 ± 1.80 cm, respectively) (Figure 1a and Figure 2c and Table S2) (Figure 4a and Figure 5c and Table S3), number of primary branches (15.87 ± 1.46 and 15.60 ± 2.41, respectively) (Figure 1b and Figure 2d and Table S2) (Figure 4b and Figure 5d and Table S3) and yield per plot (867 ± 150 and 928 ± 106 g/m2, respectively) (Figure 2f and Figure 5f; Tables S2 and S3). This indicates a balanced and adaptable cultivar suited for diverse growing conditions.
The CVs showed differences in trait stability among cultivars grown at both sites (Table 1). Compared to other traits, TN, SB, and YD displayed higher variability in both environments, suggesting that these traits are more environmentally sensitive and genetically influenced [13,36]. The higher CVs for these traits could result from the influence of environmental factors such as soil type, temperature fluctuation, and water availability [37]. However, GL and GW showed the lowest CVs (Table 1), suggesting that these traits were relatively stable in both environments. The lower variability in most agronomic traits in Fengyang and Hexian suggests more consistent growing conditions, resulting in more uniform plant growth and development [35]. The skewness and kurtosis values further showed that most traits exhibited approximate symmetry (Table 1), indicating a normal distribution with no extreme deviations. However, there were exceptions for cultivars in Fengyang, where PH and SR exhibited negative skewness. This suggests that the majority of the cultivars had higher values for these traits, with fewer cultivars exhibiting lower values. These trends suggest potential limitations of the adaptability of certain cultivars to the environmental conditions in Fengyang [38,39]. In Hexian, tiller number and yield per plot exhibited positive skewness, indicating that fewer high-performing cultivars contributed to the overall distribution, while the majority had lower values. Kurtosis values for most traits showed moderate deviation from zero. However, SR in Fengyang showed high kurtosis, suggesting the presence of extreme values and potential outliers within the cultivars. These findings align with a previous study [40] that suggested the need for evaluating cultivars for location-specific breeding strategies to identify stable and high-yielding cultivars.

4.2. Influence of Environment on Trait Expression

We also observed significant differences in agronomic traits between cultivars grown in each environment, highlighting the influence of environmental conditions on cultivar performance [41,42]. Traits PH and TN were significantly greater in Hexian compared to Fengyang (Table 2), suggesting that environmental factors such as soil composition and climatic conditions have a stronger influence on these traits in this environment. This is consistent with studies [43,44] suggesting that plant height and tiller number are highly responsive to environmental variations including temperature and soil compositions. Grain-related traits like GL and GW also showed high sensitivity to environmental conditions in Hexian, likely due to temperature and nutrient availability during grain-filling stages. Similar reported findings emphasize the impact of environmental factors on grain development [33,45]. Trait YD was significantly higher in Hexian than in Fengyang (Table 2), indicating that yield-related traits are more influenced by location-specific factors such as soil fertility and management practice [46]. Other traits, such as PL and TGW, showed lower values but notable significant differences, in Fengyang. Several studies have shown that environmental conditions such as temperature, soil type, and water availability significantly affect rice agronomic traits, leading to variation in cultivar performance across different growing conditions [13,47]. The observed significant differences across multiple traits emphasize the importance of genotype–environment interactions in determining cultivar performance [32,41].

4.3. Correlation Analysis

Correlation analysis is important in the indirect selection for high yield in genotypes [48]. The relationship between cultivars grown in Fengyang and Hexian will provide insight into how agronomic traits perform across these two environments. In Fengyang, PH showed strong positive correlations with TN, PL, and YD (Table 3 and Table S5). This suggests that taller cultivars with a greater number of tillers and longer panicles contribute to higher yield per plot, similar to previous studies that linked plant height with tiller number to increase biomass and grain production in an environment with favorable growing conditions [49]. The positive correlation between TN and YD highlights the importance of tiller formation in yield improvement as observed in other japonica cultivars [44,50]. Traits PL, SB, and SR were also positively correlated with YD, indicating their roles in enhancing yield in japonica cultivars. These results align with studies on the influence of longer panicles and seed-setting rates on increased grain filling and yield stability in an environment with adequate water and nutrient availability [51,52]. In contrast, GL, GW, and TGW showed no significant correlations with YD, suggesting that grain size may not directly contribute to yield, as reported in similar environments where yield is mainly influenced by panicle size and tiller number [16,53].
Trait TN exhibited a strong positive correlation with YD in Hexian, highlighting its critical role in rice yield (Table 3 and Table S5). This finding is similar to studies that have linked tiller number as the key determinant of yield in high-yielding rice cultivars, particularly in environments with moderate stress levels [54]. Trait PL was positively correlated with SB, suggesting that longer panicles are associated with increased numbers of secondary branches, which may enhance grain production. However, the negative correlation between SB and TGW indicates a trade-off between branch formation and grain weight, similar to other rice-growing regions with similar environmental constraints [55]. This trade-off suggests that while increased numbers of secondary branches may contribute to yield potential, this may also reduce grain weight, highlighting the need for balanced trait selection in rice breeding. Trait TGW was positively correlated with GL and GW, indicating interdependence of these traits [55]. Additionally, SR was positively correlated with TGW but negatively with SB, suggesting that a higher seed-setting rate is associated with higher grain weight but reduced numbers of secondary branches. These findings help us to understand the complexity of trait interactions in rice yield formation, particularly in environments where environmental factors play a critical role in rice growth and development [13].

4.4. Molecular Characterization and Gene Detection

The PCR results highlighted the influence of rice genes among key traits including grain yield, heading date, grain quality, stress tolerance, and disease resistance. Genes DEP1 and Ghd7 play important roles in regulating grain yield and heading date in rice. Gene DEP1 is associated with dense and erect panicles and influences rice yield. Gene DEP1 was amplified at a 694 bp band in all 36 japonica cultivars (Figure 7a and Figure S3), which aligns with previous findings [23], indicating the presence of the DEP1 mutant allele, which is widely utilized in japonica breeding programs. This suggests its contribution to higher tiller number and grain yield [23]. However, the indica cultivars displayed a slightly higher band size, suggesting a different allele, leading to less dense panicles and lower grain yield [56]. Similarly, Ghd7, which regulates heading date, was amplified at 161 bp in japonica cultivars (Figure 7b and Figure S4), suggesting a similar maturity rate among these cultivars [24]. This is consistent with their adaptation to temperate regions with predictable growing seasons [57]. However, Ghd7 displayed higher bands in some indica cultivars (HJX24 and YD6), indicating alleles linked to delayed flowering, which is advantageous in long-day environmental conditions [58,59]. Grain quality traits in rice including appearance, size, and milling quality are important traits in the marketing and consumption of rice [60]. Genes Wx and Chalk5 are two key genes regulating grain quality. Gene Wx regulates amylose content at 124 bp in both japonica and indica cultivars (Figure 7c and Figure S5), suggesting a low amylose content (≤20) consistent with the Wxb allele resulting in a soft and sticky texture [61]. However, slightly higher bands in two indica cultivars (HHZ and YD6) suggest allelic variations that may elevate amylose levels while the absence of amplification in japonica cultivar LN3 suggests a null allele or structural deletion [25]. Gene Chalk5, known to affect grain chalkiness, was amplified at 217 bp in both japonica and indica cultivars (Figure 7d and Figure S6), indicating no observable variation across all rice accessions. Unlike previous reports that link Chalk5 polymorphism to increased chalkiness in indica cultivars [62], this uniformity suggests that both subspecies share a common allele at this locus, which is associated with high gene expression and reduced chalkiness, as observed in japonica cultivars with improved grain quality [63]. Chinese breeders selected this gene to eliminate chalkiness in rice for grain quality improvement [60]. Genes COLD1 and DST are regulatory and can be used to develop rice cultivars more resistant to cold, drought, and salinity [64]. Gene COLD1 confers chilling tolerance in rice through a critical single nucleotide polymorphism (SNP2), which differentiates phenotype between japonica and indica cultivars [27]. In our study, COLD1 was amplified at 200 bp in all japonica cultivars (Figure 7e and Figure S7), consistent with its role in enhancing cold adaptation by increasing RGA1 GTPase activity and triggering Ca2+ influx under cold stress, a trait selected during japonica rice domestication of Chinese Oryza rufipogon for colder environments [27]. However, japonica cultivar HZN1 showed a slightly lower band pattern similar to indica cultivars. This suggests the presence of a COLD1 allele in these cultivars, encoding methionine or threonine, which is linked to reduced chilling tolerance due to weaker RGA1 activation and reduced Ca2+ signaling [65]. Similarly, DST, which regulates drought and salt tolerance in rice, was amplified at 113 bp in both indica and japonica cultivars (Figure 7f and Figure S8), suggesting that stress tolerance differences arise from sequential level differences rather than structural changes. Notably, the absence of amplification in JH1 and XH13 indicates a potential deletion, which could increase drought and salt tolerance by reducing DST function. This can lead to stomatal closure, thereby improving tolerance to drought and salt as observed in dst mutants [28]. Also, genes like Xa13 and Bph6 confer resistance to bacterial blight and planthopper disease. Gene Xa13 was amplified at 113 bp in both japonica and indica cultivars (Figure 7g and Figure S9). This confirms the presence of promoter mutation leading to expression of Xa13 and confers resistance to Xanthomanas oryzae pv. oryzae. However, the absence of amplification in WKN2 indicates complete deletion or a null allele, which suggests susceptibility due to lack of Xa13-mediated resistance [29]. Similarly, Bph6 was amplified at 238 bp in both subspecies (Figure 7h and Figure S10), indicating the presence of a functional Bph6 encoding an exocyst-localized protein [30,66], suggesting resistance to brown planthopper. In contrast, its absence in ZD28 suggests a non-functional Bph6 due to a null allele or deletion.

5. Conclusions

This study revealed significant geographical variation in agronomic traits among the 36 japonica cultivars grown in Fengyang and Hexian, with key implications for breeding programs in the Jianhuai region. Traits like tiller number, number of secondary branches, and yield per plot displayed high mean variation as reflected by their high CV, indicating greater environmental influence compared to traits like plant height, panicle length, and grain length. Greater significant differences were observed in grain width (72.22%), grain length (61.11%), yield per plot (61.11%), plant height (52.77%) and tiller number (44.44%) in Hexian; this revealed that the environment in Hexian favored these traits. A strong positive correlation between tiller number and yield per plant in Fengyang (0.57 ***) and Hexian (0.87 ****) highlighted the key role of tiller number in rice yield and how localized environmental conditions like temperature, solar radiation, and soil fertility differentially influence these traits. Gene identification revealed eight key genes, DEP1, Ghd7, Wx, Chalk5, COLD1, DST, Xa13, and Bph6, in most of the cultivars, with cultivars like FN628 exhibiting exceptional balance and adaptability and achieving a consistent moderate to high plant height, tiller number, panicle length, number of primary branches, and yield per plot, making this cultivar suitable for breeding programs targeting stable performance in the Jianghuai region.

Supplementary Materials

The following supporting information can be downloaded at: https://www.mdpi.com/article/10.3390/agronomy15061409/s1: Figure S1: Boxplot showing variation in yield per plant among the 36 japonica cultivars grown in Fengyang; Figure S2: Boxplot showing variation in yield per plant among the 36 japonica cultivars grown in Hexian; Figure S3: PCR amplification of DEP1 gene in the 36 japonica cultivars and 10 indica cultivars; Figure S4: PCR amplification of Ghd7 gene in the 36 japonica cultivars and 10 indica cultivars; Figure S5: PCR amplification of Wx gene in 36 japonica cultivars and 10 indica cultivars; Figure S6: PCR amplification of Chalk5 gene in the 36 japonica cultivars and 10 indica cultivars; Figure S7: PCR amplification of COLD1 gene in the 36 japonica cultivars and 10 indica cultivars; Figure S8: PCR amplification of DST gene in the 36 japonica cultivars and 10 indica cultivars; Figure S9: PCR amplification of Xa13 gene in the 36 japonica cultivars and 10 indica cultivars; Figure S10: PCR amplification of Bph6 gene in the 36 japonica cultivars and 10 indica cultivars; Table S1: List of rice cultivars and their place of origin; Table S2: Agronomic traits measurement of 36 japonica cultivars grown in Fengyang; Table S3: Agronomic traits measurement of 36 japonica cultivars grown in Hexian; Table S4: Comparison of agronomic traits between Fengyang and Hexian for each japonica cultivar; Table S5: Relationship between agronomic traits in Fengyang and Hexian; Table S6: List of genes and their corresponding primer sequence.

Author Contributions

Conceptualization, H.A. and X.H.; Methodology, E.A.O. and Z.S.; Validation, E.A.O., Z.S., S.L., D.X. and H.F.; Formal analysis, E.A.O., S.L., D.X. and H.F.; Investigation, E.A.O., Z.S., S.L., D.X. and H.F.; Writing—original draft, E.A.O., H.A. and X.H.; Writing–review and editing, H.A. and X.H. All authors have read and agreed to the published version of the manuscript.

Funding

This work was funded by the Excellent Scientific Research and Innovation Team of the Education Department of Anhui Province (2022AH010087), the Science and technology innovation team of Anhui Sciences and Technology University (2023KJCXTD001), the Talent Introduction Start-up Fund Project of Anhui Science and Technology University (NXYJ202001), and the Construction Funds for Crop Science of Anhui Science and Technology University (No.XK-XJGF001).

Data Availability Statement

The data reported in this study are available in the article and Supplementary Materials.

Conflicts of Interest

The authors declare no conflicts of interest.

References

  1. Mather, K.A.; Caicedo, A.L.; Polato, N.R.; Olsen, K.M.; McCouch, S.; Purugganan, M.D. The Extent of Linkage Disequilibrium in Rice (Oryza sativa L.). Genetics 2007, 177, 2223–2232. [Google Scholar] [CrossRef] [PubMed]
  2. Proceedings of the FAO Rice Conference. Available online: https://www.fao.org/4/y5682e/y5682e0f.htm (accessed on 18 November 2024).
  3. Saud, S.; Wang, D.; Fahad, S.; Alharby, H.F.; Bamagoos, A.A.; Mjrashi, A.; Alabdallah, N.M.; AlZahrani, S.S.; AbdElgawad, H.; Adnan, M.; et al. Comprehensive Impacts of Climate Change on Rice Production and Adaptive Strategies in China. Front. Microbiol. 2022, 13, 926059. [Google Scholar] [CrossRef] [PubMed]
  4. Gao, L.Z. The Conservation of Chinese Rice Biodiversity: Genetic Erosion, Ethnobotany and Prospects. Genet. Resour. Crop Evol. 2003, 50, 17–32. [Google Scholar] [CrossRef]
  5. Panesar, P.S.; Kaur, S. Rice: Types and Composition. In Encyclopedia of Food and Health; Elsevier: Amsterdam, The Netherlands, 2015; pp. 646–652. [Google Scholar] [CrossRef]
  6. Hu, C.; Shi, J.; Quan, S.; Cui, B.; Kleessen, S.; Nikoloski, Z.; Tohge, T.; Alexander, D.; Guo, L.; Lin, H.; et al. Metabolic Variation between Japonica and Indica Rice Cultivars as Revealed by Non-Targeted Metabolomics. Sci. Rep. 2014, 4, 5067. [Google Scholar] [CrossRef]
  7. Cordero-Lara, K.I.; Cordero-Lara, K.I. Temperate Japonica Rice (Oryza sativa L.) Breeding: History, Present and Future Challenges. Chil. J. Agric. Res. 2020, 80, 303–314. [Google Scholar] [CrossRef]
  8. Wang, Y.; Peng, Z.; Wu, H.; Wang, P. Spatiotemporal Variability in Precipitation Extremes in the Jianghuai Region of China and the Analysis of Its Circulation Features. Sustainability 2022, 14, 6680. [Google Scholar] [CrossRef]
  9. Yang, K.; Liu, C.; Cai, J.; Cao, N.; Liao, X.; Su, Q.; Jin, L.; Zheng, R.; Zhang, Q.; Wang, L. The North–South Shift of the Ridge Location of the Western Pacific Subtropical High and Its Influence on the July Precipitation in the Jianghuai Region from 1978 to 2021. Front. Earth Sci. 2023, 11, 1251294. [Google Scholar] [CrossRef]
  10. Deng, N.; Ling, X.; Sun, Y.; Zhang, C.; Fahad, S.; Peng, S.; Cui, K.; Nie, L.; Huang, J. Influence of Temperature and Solar Radiation on Grain Yield and Quality in Irrigated Rice System. Eur. J. Agron. 2015, 64, 37–46. [Google Scholar] [CrossRef]
  11. Zhou, S.; Zhu, S.; Cui, S.; Hou, H.; Wu, H.; Hao, B.; Cai, L.; Xu, Z.; Liu, L.; Jiang, L.; et al. Transcriptional and Post-Transcriptional Regulation of Heading Date in Rice. New Phytol. 2021, 230, 943–956. [Google Scholar] [CrossRef]
  12. Molla, K.A. Flowering Time and Photoperiod Sensitivity in Rice: Key Players and Their Interactions Identified. Plant Cell 2022, 34, 3489–3490. [Google Scholar] [CrossRef]
  13. Huang, X.; Jang, S.; Kim, B.; Piao, Z.; Redona, E.; Koh, H.-J. Evaluating Genotype × Environment Interactions of Yield Traits and Adaptability in Rice Cultivars Grown under Temperate, Subtropical and Tropical Environments. Agriculture 2021, 11, 558. [Google Scholar] [CrossRef]
  14. Li, M.; Liu, Y.; Wang, C.; Yang, X.; Li, D.; Zhang, X.; Xu, C.; Zhang, Y.; Li, W.; Zhao, L. Identification of Traits Contributing to High and Stable Yields in Different Soybean Varieties Across Three Chinese Latitudes. Front. Plant Sci. 2020, 10, 1642. [Google Scholar] [CrossRef]
  15. Ma, Z.; Ma, H.; Chen, Z.; Chen, X.; Liu, G.; Hu, Q.; Xu, F.; Wei, H.; Zhang, H. Quality Characteristics of Japonica Rice in Southern and Northern China and the Effect of Environments on Its Quality. Agronomy 2022, 12, 2757. [Google Scholar] [CrossRef]
  16. Li, N.; Xu, R.; Li, Y. Molecular Networks of Seed Size Control in Plants. Annu. Rev. Plant Biol. 2019, 70, 435–463. [Google Scholar] [CrossRef]
  17. Shrestha, S.; Asch, F.; Dusserre, J.; Ramanantsoanirina, A.; Brueck, H. Climate Effects on Yield Components as Affected by Genotypic Responses to Variable Environmental Conditions in Upland Rice Systems at Different Altitudes. Field Crops Res. 2012, 134, 216–228. [Google Scholar] [CrossRef]
  18. Zhong, Q.; Jia, Q.; Yin, W.; Wang, Y.; Rao, Y.; Mao, Y. Advances in Cloning Functional Genes for Rice Yield Traits and Molecular Design Breeding in China. Front. Plant Sci. 2023, 14, 1206165. [Google Scholar] [CrossRef] [PubMed]
  19. Gross, B.L.; Zhao, Z. Archaeological and Genetic Insights into the Origins of Domesticated Rice. Proc. Natl. Acad. Sci. USA 2014, 111, 6190–6197. [Google Scholar] [CrossRef]
  20. Subudhi, P.K. Molecular Research in Rice. Int. J. Mol. Sci. 2023, 24, 10063. [Google Scholar] [CrossRef] [PubMed]
  21. IRRI. The Standard Evaluation System for Rice; International Rice Research Institute: Luguna, Philippines, 2014. [Google Scholar]
  22. Allen, G.C.; Flores-Vergara, M.A.; Krasynanski, S.; Kumar, S.; Thompson, W.F. A Modified Protocol for Rapid DNA Isolation from Plant Tissues Using Cetyltrimethylammonium Bromide. Nat. Protoc. 2006, 1, 2320–2325. [Google Scholar] [CrossRef]
  23. Huang, X.; Qian, Q.; Liu, Z.; Sun, H.; He, S.; Luo, D.; Xia, G.; Chu, C.; Li, J.; Fu, X. Natural Variation at the DEP1 Locus Enhances Grain Yield in Rice. Nat. Genet. 2009, 41, 494–497. [Google Scholar] [CrossRef]
  24. Xue, W.; Xing, Y.; Weng, X.; Zhao, Y.; Tang, W.; Wang, L.; Zhou, H.; Yu, S.; Xu, C.; Li, X.; et al. Natural Variation in Ghd7 Is an Important Regulator of Heading Date and Yield Potential in Rice. Nat. Genet. 2008, 40, 761–767. [Google Scholar] [CrossRef]
  25. Zeng, D.; Tian, Z.; Rao, Y.; Dong, G.; Yang, Y.; Huang, L.; Leng, Y.; Xu, J.; Sun, C.; Zhang, G.; et al. Rational Design of High-Yield and Superior-Quality Rice. Nat. Plants 2017, 3, 4–8. [Google Scholar] [CrossRef] [PubMed]
  26. Li, Y.; Fan, C.; Xing, Y.; Yun, P.; Luo, L.; Yan, B.; Peng, B.; Xie, W.; Wang, G.; Li, X.; et al. Chalk5 Encodes a Vacuolar H+-Translocating Pyrophosphatase Influencing Grain Chalkiness in Rice. Nat. Genet. 2014, 46, 398–404. [Google Scholar] [CrossRef]
  27. Ma, Y.; Dai, X.; Xu, Y.; Luo, W.; Zheng, X.; Zeng, D.; Pan, Y.; Lin, X.; Liu, H.; Zhang, D.; et al. COLD1 Confers Chilling Tolerance in Rice. Cell 2015, 160, 1209–1221. [Google Scholar] [CrossRef] [PubMed]
  28. Huang, X.Y.; Chao, D.Y.; Gao, J.P.; Zhu, M.Z.; Shi, M.; Lin, H.X. A Previously Unknown Zinc Finger Protein, DST, Regulates Drought and Salt Tolerance in Rice via Stomatal Aperture Control. Genes Dev. 2009, 23, 1805–1817. [Google Scholar] [CrossRef] [PubMed]
  29. Chu, Z.; Fu, B.; Yang, H.; Xu, C.; Li, Z.; Sanchez, A.; Park, Y.J.; Bennetzen, J.L.; Zhang, Q.; Wang, S. Targeting Xa13, a Recessive Gene for Bacterial Blight Resistance in Rice. Theor. Appl. Genet. 2006, 112, 455–461. [Google Scholar] [CrossRef]
  30. Liu, M.; Fan, F.; He, S.; Guo, Y.; Chen, G.; Li, N.; Li, N.; Yuan, H.; Si, F.; Yang, F.; et al. Creation of Elite Rice with High-Yield, Superior-Quality and High Resistance to Brown Planthopper Based on Molecular Design. Rice 2022, 15, 17. [Google Scholar] [CrossRef]
  31. Zou, Y.; Hassan, M.A.; Xu, E.; Ren, Y.; Wang, J.; Zhan, X.; Ni, D.; Zhang, P. Evaluation of Breeding Progress and Agronomic Traits for Japonica Rice in Anhui Province, China (2005–2024). Agronomy 2024, 14, 2957. [Google Scholar] [CrossRef]
  32. Xu, F.-F.; Tang, F.-F.; Shao, Y.-F.; Chen, Y.-L.; Tong, C.; Bao, J.-S. Genotype × Environment Interactions for Agronomic Traits of Rice Revealed by Association Mapping. Rice Sci. 2014, 21, 133–141. [Google Scholar] [CrossRef]
  33. Li, X.; Wu, L.; Geng, X.; Xia, X.; Wang, X.; Xu, Z.; Xu, Q. Deciphering the Environmental Impacts on Rice Quality for Different Rice Cultivated Areas. Rice 2018, 11, 7. [Google Scholar] [CrossRef]
  34. Zhang, J.; Zhang, S.; Cheng, M.; Jiang, H.; Zhang, X.; Peng, C.; Lu, X.; Zhang, M.; Jin, J. Effect of Drought on Agronomic Traits of Rice and Wheat: A Meta-Analysis. Int. J. Environ. Res. Public Health 2018, 15, 839. [Google Scholar] [CrossRef] [PubMed]
  35. Reig-Valiente, J.L.; Marqués, L.; Talón, M.; Domingo, C. Genome-Wide Association Study of Agronomic Traits in Rice Cultivated in Temperate Regions 06 Biological Sciences 0604 Genetics. BMC Genom. 2018, 19, 706. [Google Scholar] [CrossRef]
  36. Khan, M.A.R.; Mahmud, A.; Islam, M.N.; Ghosh, U.K.; Hossain, M.S. Genetic Variability and Agronomic Performances of Rice Genotypes in Different Growing Seasons in Bangladesh. J. Agric. Food Res. 2023, 14, 100750. [Google Scholar] [CrossRef]
  37. Sommer, R.J. Phenotypic Plasticity: From Theory and Genetics to Current and Future Challenges. Genetics 2020, 215, 1–13. [Google Scholar] [CrossRef]
  38. Vitali, A.; Moretti, B.; Bertora, C.; Miniotti, E.F.; Tenni, D.; Romani, M.; Facchi, A.; Martin, M.; Fogliatto, S.; Vidotto, F.; et al. The Environmental and Agronomic Benefits and Trade-Offs Linked with the Adoption Alternate Wetting and Drying in Temperate Rice Paddies. Field Crops Res. 2024, 317, 109550. [Google Scholar] [CrossRef]
  39. Moreno-Ramón, H.; Ulzurrum, J.; Lidon, A.; Sanjuán, N. Assessing the Environmental Impacts of Rice in an Anthropized Mediterranean Wetland: Towards Carbon Farming. Sustain. Prod. Consum. 2024, 45, 476–487. [Google Scholar] [CrossRef]
  40. Muraleedharan, A. Utilizing Genetic Traits Distributions to Enhance Rice Breeding Programs: A Study of Skewness and Kurtosis in Segregating Generations. J. Exp. Agric. Int. 2024, 46, 741–760. [Google Scholar] [CrossRef]
  41. Napier, J.D.; Heckman, R.W.; Juenger, T.E. Gene-by-Environment Interactions in Plants: Molecular Mechanisms, Environmental Drivers, and Adaptive Plasticity. Plant Cell 2022, 35, 109. [Google Scholar] [CrossRef]
  42. El-Aty, M.S.A.; Abo-Youssef, M.I.; Sorour, F.A.; Salem, M.; Gomma, M.A.; Ibrahim, O.M.; Yaghoubi Khanghahi, M.; Al-Qahtani, W.H.; Abdel-Maksoud, M.A.; El-Tahan, A.M. Performance and Stability for Grain Yield and Its Components of Some Rice Cultivars under Various Environments. Agronomy 2024, 14, 2137. [Google Scholar] [CrossRef]
  43. Kovi, M.R.; Bai, X.; Mao, D.; Xing, Y. Impact of Seasonal Changes on Spikelets per Panicle, Panicle Length and Plant Height in Rice (Oryza sativa L.). Euphytica 2011, 179, 319–331. [Google Scholar] [CrossRef]
  44. Yuan, R.; Mao, Y.; Zhang, D.; Wang, S.; Zhang, H.; Wu, M.; Ye, M.; Zhang, Z. The Formation of Rice Tillers and Factors Influencing It. Agronomy 2024, 14, 2904. [Google Scholar] [CrossRef]
  45. Xu, X.; Xu, Z.; Matsue, Y.; Xu, Q. Effects of Genetic Background and Environmental Conditions on Texture Properties in a Recombinant Inbred Population of an Inter-Subspecies Cross. Rice 2019, 12, 32. [Google Scholar] [CrossRef] [PubMed]
  46. Gao, P.; Zhang, T.; Lei, X.Y.; Cui, X.W.; Lu, Y.X.; Fan, P.F.; Long, S.P.; Huang, J.; Gao, J.S.; Zhang, Z.H.; et al. Improvement of Soil Fertility and Rice Yield after Long-Term Application of Cow Manure Combined with Inorganic Fertilizers. J. Integr. Agric. 2023, 22, 2221–2232. [Google Scholar] [CrossRef]
  47. Zhao, H.; Mo, Z.; Lin, Q.; Pan, S.; Duan, M.; Tian, H.; Wang, S. Relationships between Grain Yield and Agronomic Traits of Rice in Southern China. Chil. J. Agric. Res. 2019, 80, 72–79. [Google Scholar] [CrossRef]
  48. Mbuma, N.W.; Gerrano, A.S.; Lebaka, N.; Labuschagne, M. Interrelationship between Grain Yield Components and Nutritional Quality Traits in Cowpea Genotypes. S. Afr. J. Bot. 2022, 150, 34–43. [Google Scholar] [CrossRef]
  49. Peng, S.; Khush, G.S.; Virk, P.; Tang, Q.; Zou, Y. Progress in Ideotype Breeding to Increase Rice Yield Potential. Field Crops Res. 2008, 108, 32–38. [Google Scholar] [CrossRef]
  50. Martínez-Eixarch, M.; del Mar Català, M.; Tomàs, N.; Pla, E.; Zhu, D. Tillering and Yield Formation of a Temperate Japonica Rice Cultivar in a Mediterranean Rice Agrosystem. Span. J. Agric. Res. 2015, 13, e0905. [Google Scholar] [CrossRef]
  51. Mai, W.; Abliz, B.; Xue, X. Increased Number of Spikelets per Panicle Is the Main Factor in Higher Yield of Transplanted vs. Direct-Seeded Rice. Agronomy 2021, 11, 2479. [Google Scholar] [CrossRef]
  52. Farooq, M.S.; Khaskheli, M.A.; Uzair, M.; Xu, Y.; Wattoo, F.M.; Rehman, O.U.; Amatus, G.; Fatima, H.; Khan, S.A.; Fiaz, S.; et al. Inquiring the Inter-Relationships amongst Grain-Filling, Grain-Yield, and Grain-Quality of Japonica Rice at High Latitudes of China. Front. Genet. 2022, 13, 988256. [Google Scholar] [CrossRef]
  53. Huang, M.; Shan, S.; Cao, J.; Fang, S.; Tian, A.; Liu, Y.; Cao, F.; Yin, X.; Zou, Y. Primary-Tiller Panicle Number Is Critical to Achieving High Grain Yields in Machine-Transplanted Hybrid Rice. Sci. Rep. 2020, 10, 2811. [Google Scholar] [CrossRef]
  54. Kalaitzidis, A.; Kadoglidou, K.; Mylonas, I.; Ghoghoberidze, S.; Ninou, E. Investigating the Impact of Tillering on Yield and Yield-Related Traits in European Rice Cultivars. Agriculture 2025, 15, 616. [Google Scholar] [CrossRef]
  55. Chen, K.; Łyskowski, A.; Jaremko, Ł.; Jaremko, M. Genetic and Molecular Factors Determining Grain Weight in Rice. Front. Plant Sci. 2021, 12, 605799. [Google Scholar] [CrossRef] [PubMed]
  56. Xu, H.; Zhao, M.; Zhang, Q.; Xu, Z.; Xu, Q. The DENSE AND ERECT PANICLE 1 (DEP1) Gene Offering the Potential in the Breeding of High-Yielding Rice. Breed. Sci. 2016, 66, 659. [Google Scholar] [CrossRef] [PubMed]
  57. Weng, X.; Wang, L.; Wang, J.; Hu, Y.; Du, H.; Xu, C.; Xing, Y.; Li, X.; Xiao, J.; Zhang, Q. Grain Number, Plant Height, and Heading Date7 Is a Central Regulator of Growth, Development, and Stress Response. Plant Physiol. 2014, 164, 735. [Google Scholar] [CrossRef]
  58. Wang, P.; Gong, R.; Yang, Y.; Yu, S. Ghd8 controls rice photoperiod sensitivity by forming a complex that interacts with Ghd7. BMC Plant Biol. 2019, 19, 462. [Google Scholar] [CrossRef]
  59. Sun, K.; Huang, M.; Zong, W.; Xiao, D.; Lei, C.; Luo, Y.; Song, Y.; Li, S.; Hao, Y.; Luo, W.; et al. Hd1, Ghd7, and DTH8 Synergistically Determine the Rice Heading Date and Yield-Related Agronomic Traits. J. Genet. Genom. 2022, 49, 437–447. [Google Scholar] [CrossRef]
  60. Chen, L.; Li, X.; Zheng, M.; Hu, R.; Dong, J.; Zhou, L.; Liu, W.; Liu, D.; Yang, W. Genes Controlling Grain Chalkiness in Rice. Crop J. 2024, 12, 979–991. [Google Scholar] [CrossRef]
  61. Fu, Y.; Luo, T.; Hua, Y.; Yan, X.; Liu, X.; Liu, Y.; Liu, Y.; Zhang, B.; Liu, R.; Zhu, Z.; et al. Assessment of the Characteristics of Waxy Rice Mutants Generated by CRISPR/Cas9. Front. Plant Sci. 2022, 13, 881964. [Google Scholar] [CrossRef]
  62. Fan, G.; Jiang, J.; Long, Y.; Wang, R.; Liang, F.; Liu, H.; Xu, J.; Qiu, X.; Li, Z. Generation of Two-Line Restorer Line with Low Chalkiness Using Knockout of Chalk5 through CRISPR/Cas9 Editing. Biology 2024, 13, 617. [Google Scholar] [CrossRef]
  63. Gann, P.J.I.; Dharwadker, D.; Cherati, S.R.; Vinzant, K.; Khodakovskaya, M.; Srivastava, V. Targeted Mutagenesis of the Vacuolar H+ Translocating Pyrophosphatase Gene Reduces Grain Chalkiness in Rice. Plant J. 2023, 115, 1261–1276. [Google Scholar] [CrossRef]
  64. Debnath, S.; Aisha, S.; Malakar, A.; Perveen, K.; Alfagham, A.T.; Nisha Khanam, M.; Adawiyah Ahmad, R.; Pramanik, B.; Ahmed Mohammed, Y. Understanding the Cross-Talk of Major Abiotic-Stress-Responsive Genes in Rice: A Computational Biology Approach. J. King Saud Univ. Sci. 2023, 35, 102786. [Google Scholar] [CrossRef]
  65. Manishankar, P.; Kudla, J. Cold Tolerance Encoded in One SNP. Cell 2015, 160, 1045–1046. [Google Scholar] [CrossRef] [PubMed]
  66. Guo, J.; Xu, C.; Wu, D.; Zhao, Y.; Qiu, Y.; Wang, X.; Ouyang, Y.; Cai, B.; Liu, X.; Jing, S.; et al. Bph6 Encodes an Exocyst-Localized Protein and Confers Broad Resistance to Planthoppers in Rice. Nat. Genet. 2018, 50, 297–306. [Google Scholar] [CrossRef] [PubMed]
Figure 1. Variation in morphological traits among the 36 japonica cultivars grown in Fengyang. (a) Panicle length and (b) number of primary branches; scale bar, 5 cm. (c) grain length and (d) grain width; scale bar, 1 cm.
Agronomy 15 01409 g001
Figure 2. Box plot showing variation in agronomic traits among the 36 japonica cultivars grown in Fengyang. (a) Plant height, (b) tiller number, (c) panicle length, (d) number of primary branches, (e) number of secondary branches, and (f) yield per plot. The box plot represents the median (line), 25–75 quartiles (boxes), and individual data points (dots).
Agronomy 15 01409 g002
Figure 3. Box plot showing variation in agronomic traits among the 36 japonica cultivars grown in Fengyang. (a) Grain length, (b) grain width, (c) thousand-grain weight, and (d) seed-setting rate. The box plot represents the median (line), 25–75 quartiles (boxes), and individual data points (dots).
Agronomy 15 01409 g003
Figure 4. Variation in morphological traits among the 36 japonica cultivars grown in Hexian. (a) Panicle length and (b) number of primary branches; scale bar, 5 cm. (c) Grain length and (d) grain width; scale bar, 1 cm.
Agronomy 15 01409 g004
Figure 5. Box plot showing variation in agronomic traits among the 36 japonica cultivars grown in Hexian. (a) Plant height, (b) tiller number, (c) panicle length, (d) number of primary branches, (e) number of secondary branches, and (f) yield per plot. The box plot represents the median (line), 25–75 quartiles (boxes), and individual data points (dots).
Agronomy 15 01409 g005
Figure 6. Box plot showing variation in agronomic traits among the 36 japonica cultivars grown in Hexian. (a) Grain length, (b) grain width, (c) thousand-grain weight, and (d) seed-setting rate. The box plot represents the median (line), 25–75 quartiles (boxes), and individual data points (dots).
Agronomy 15 01409 g006
Figure 7. A representative gel picture depicting PCR amplification of key rice genes in 36 japonica cultivars and 10 indica cultivars. PCR product of (a) DEP1 gene, (b) Ghd7 gene, (c) Wx gene, (d) Chalk5 gene, (e) COLD1 gene, (f) DST gene, (g) Xa13 gene, and (h) Bph6 gene in the 36 japonica cultivars and 10 indica cultivars: TQ, GLA4, HJX24, DQB, HHZ, YD2, DJWJ, IR30, LCH, and YD6. M represents 1000 bp DNA marker.
Agronomy 15 01409 g007
Table 1. Descriptive statistics of agronomic traits of japonica rice cultivars grown in Fengyang and Hexian.
TraitsEnv.Mean ± SDRangeCV (%)SkewnessKurtosis
PH/cmFY89.44 ± 4.1269.63–103.134.60−1.071.63
HX92.32 ± 3.4773.53–100.683.76−0.101.90
TNFY6.8 ± 2.13.9–10.330.700.16−0.02
HX8.5 ± 2.45.3–16.928.692.034.22
PL/cmFY17.71 ± 1.2915.33–19.867.28−0.28−0.42
HX17.63 ± 1.3415.94–19.237.600.03−1.20
PBFY14.95 ± 1.5412.93–18.6710.300.760.74
HX14.60 ± 1.7912.33–17. 6712.260.47−0.31
SBFY36.20 ± 8.1620.00–54.2022.530.341.46
HX37.94 ± 7.1824.93–50.5321.610.31−0.14
GL/mmFY7.50 ± 0.137.16–7.851.730.18−0.9
HX7.64 ± 0.147.12–8.041.83−0.250.58
GW/mmFY3.67 ± 0.103.43–4.212.720.460.03
HX3.74 ± 0.093.29–4.142.410.240.53
TGW/gFY25.89 ± 1.1522.60–30.104.440.15−0.50
HX25.36 ± 1.1520.40–32.104.530.541.75
SR/%FY89.69 ± 3.4661.77–96.083.86−2.8311.18
HX87.69 ± 4.0669.09–95.884.63−1.310.95
YD/g/m2FY590 ± 161277–100615.950.301.72
HX786 ± 151462–147812.891.843.60
Note: Data represent plant height (PH), tiller number (TN), panicle length (PL), number of primary branches (PBs), number of secondary branches (SBs), grain length (GL), grain width (GW), thousand-grain weight (TGW), seed-setting rate (SR), yield per plot (YD), environment (Env), Fengyang (FY), Hexian (HX), standard deviation (SD), and coefficient of variation (CV).
Table 2. Proportional analysis of significant differences in agronomic traits in Fengyang and Hexian.
TraitsNo. of CultivarsSig. Diff. (%)FY (%)HX (%)p-Value Range
PH3652.7716.6636.110.0001 < 0.0460
TN3644.445.5538.890.0001 < 0.0455
PL3630.7719.4411.110.0001–0.0443
PB3612.128.332.780.0004–0.0473
SB3625.005.5519.440.0001 < 0.0362
GL3661.118.3352.780.0001 < 0.0126
GW3672.2227.7844.440.0001 < 0.0448
TGW3636.1125.0011.110.0004–0.0393
SR3622.2216.675.550.0009–0.0492
YD3661.1111.1150.000.0001 < 0.0165
Note: Data show plant height (PH), tiller number (TN), panicle length (PL), number of primary branches (PBs), number of secondary branches (SBs), grain length (GL), grain width (GW), thousand-grain weight (TGW), seed-setting rate (SR), yield per plant (YD), significant difference (Sig. Diff.), Fengyang (FY), Hexian (HX) and p-value (p < 0.05).
Table 3. Relationship between agronomic traits in Fengyang and Hexian.
TraitsEnv.PHTNPLPBSBGLGWTGWSRYD
PHFY-
HX-
TNFY0.65 ****-
HX0.15-
PLFY0.50 ***0.27-
HX0.20−0.23-
PBFY0.06−0.21−0.18 *-
HX0.190.35 *−0.40 *-
SBFY0.080.140.62 ****0.11-
HX0.07−0.010.46 **−0.06-
GLFY−0.05−0.200.010.02−0.20-
HX0.14−0.090.190.27−0.22-
GWFY−0.24−0.25−0.260.17−0.110.23-
HX0.14−0.21−0.030.01−0.090.51 ***-
TGWFY0.04−0.22−0.090.14−0.38 *0.150.48 **-
HX0.10−0.060.030.05−0.49 ***0.53 ***0.53 ***-
SRFY0.180.08−0.010.02−0.25−0.22−0.040.48 **-
HX−0.25−0.110.08−0.12−0.40 *0.090.090.59 ***-
YDFY0.47 **0.57 ***0.40 *0.070.44 **−0.07−0.140.070.35 *-
HX−0.020.87 ****−0.130.290.08−0.12−0.230.030.14-
Note: Data represent plant height (PH), tiller number (TN), panicle length (PL), number of primary branches (PBs), number of secondary branches (SBs), grain length (GL), grain width (GW), thousand-grain weight (TGW), seed-setting rate (SR), yield per plot (YD), environment (Env), Fengyang (FY), Hexian (HX), significant at 5% level (*), significant at 1% level (**), significant at 0.1% level (***), and significant at 0.01% level (****).
Disclaimer/Publisher’s Note: The statements, opinions and data contained in all publications are solely those of the individual author(s) and contributor(s) and not of MDPI and/or the editor(s). MDPI and/or the editor(s) disclaim responsibility for any injury to people or property resulting from any ideas, methods, instructions or products referred to in the content.

