1. Introduction
Environmental, social, and economic sustainability have been the most debated issues by governments, organizations, companies, and consumers over the last 20 years, with the United Nations setting ambitious goals in the Paris Agreement and Europe taking the lead with the creation of the Europe 2020 Strategy [
1,
2,
3]. Companies are increasingly focused on their environmental performance and carbon footprint, not only due to the climate change already underway, but also because of the demands of increasingly aware consumers, which are reflected in their choices [
1,
3,
4,
5]. The wine industry is not immune to these demands and is aware that its contribution to greenhouse gas emissions (GHGs) is significant in winegrowing practices, energy consumption, mechanization, transport, and packaging [
1]. It can look for ways to reduce its environmental impact through more sustainable agricultural technologies [
6]. This awareness leads to a search for more information on environmental products and services [
2].
Vineyards and wine represent one of the most important agricultural activities in the world according to the International Organization of Vine and Wine (OIV), which revealed that the area under vines in 2016 increased to 7.5 million hectares [
7,
8]. However, in 2024 it fell to 7.1 million hectares, after a reduction in the vineyard area to 7.2 million hectares in 2023, due not only to changes in consumer habits, but also to climate change [
9,
10]. Although this sector is often perceived as environmentally friendly, studies indicate significant environmental pressures associated with its practices [
6]. The functioning of the vineyard ecosystem is threatened by the new temperature and rainfall regimes, which increase the threat of pests and diseases with serious consequences for grape production and quality [
11]. Terms, such as regenerative, organic, biodynamic, and ecological are becoming increasingly popular among producers and consumers, signalling concern about the impact on the environment [
2]. However, according to the OIV, the culture of vineyards and wine is more than just agricultural practices, such as integrated production, organic, biodynamic, and others, it is also landscape, history, local economy, etc., [
6]. As sustainability is based on the environment–social–economic trilogy, most sustainability benchmarks and programs focus on environmental premises [
4,
6], such as a production’s vulnerability to climate change, global warming, compliance with legislation, and restrictions on the use of phytopharmaceuticals (i.e., synthetic plant protection chemicals, such as herbicides, fungicides, and insecticides), the impact of wine production, and consumer awareness [
2,
4]. Sustainability assessment must deal with information traps and social values, must be spatial, ethical, and systemic, and must cover the economic, environmental, and social aspects [
4].
Analysing the carbon footprint can help identify which areas have the greatest impact and lead to the search for practices that improve environmental performance in these areas [
1]. Intensive viticulture has led to an increase in productivity, but also to an increase in agrochemicals, which are harmful to the soil, ecosystem, biodiversity, and to workers and consumers [
11,
12]. The carbon footprint is not synonymous with environmental sustainability; there are other indicators, such as water consumption, soil erosion, ecological resources, maintenance of ecosystems, etc. The combination of various indicators will tell us the sustainability of the activity and the company [
1].
Portugal has 14 wine regions stretching from the North to the South and all the way to the islands, and all are very different in terroir, climate, and soils, which gives the wines very distinct characteristics. The Douro region is the oldest demarcated and regulated region in the world, some 270 years old, and it is here that we will focus on in this study. Located along the Douro River basin that has given the region its name, the soil is made up of diverse geology, the majority of which is shale that contributes to the definition of three sub-regions, “Cima-Corgo”, “Baixo-Corgo”, and “Douro Superior”, and has an area of around 250,000 ha of vineyards [
13,
14]. Protected by the Marão and Montemuro mountains, it has asymmetrical rainfall, between 50 mm and 204 mm in December and January, and 6.9 mm to 16.2 mm in the less rainy months, which gives an average of 1200 mm to 380 mm per year from the west to east [
14]. Temperatures are also asymmetrical, with an increase in amplitude from the West to the East (further from the sea). Vineyards on the northern slopes are exposed to drier, hotter southerly winds, while vineyards on the southern slopes are more exposed to wetter winds [
14]. This heterogeneity is reflected in the vineyard management and agricultural practices of each sub-region.
Cooperatives enable small producers to succeed [
15] by promoting them to large-scale trading, which was not possible on an individual basis. Small winegrowers realized that a cooperative could help maximize wine sales without disturbing their quality, penetrating more solidly into markets for which they were unable to respond [
15]. This business model has attracted attention; it is a very resilient business model that sometimes performs better than large companies, especially in times of crisis [
16]. Cooperatives centre their decisions on people and are based on human values. In 2009, in Portugal, cooperatives accounted for 4.8% and 1.3% of employment [
16], which demonstrates their importance in a country like Portugal; if we look at sectors, such as agriculture, and more specifically, the wine sector, they account for 41% of production [
16]. However, we are talking about a sector that is not very professionalized, in which the members have low literacy levels and are older, and it is also a family activity, often practiced in their spare time [
16]. Mozas-Moral, in 2021, analysed the capacity of cooperative wineries to respond to the Sustainable Development Goals (SDGs), and found that they easily responded to social sustainability, but that they fell a little short on the environment and innovation [
5].
The challenge is to find tools that can contribute to the sustainable development of winegrowers and assess the sustainability of agricultural practices. The aim was to explore the indicators of the sustainability benchmarks mentioned by Marques [
17], select the ones that stood out the most and apply them in a survey of winegrowers from a cooperative winery in the Douro Demarcated Region. This survey was also part of the response to the National Sustainability Benchmark for the Wine Sector, which allowed the winery to respond to the self-assessment and consequently obtain certification in the referred benchmark.
The present study was structured around a systematic methodology for data collection and analysis. A targeted survey was developed to capture indicators with the greatest environmental relevance, drawing upon the National Sustainability Certification Benchmark for the Wine Sector (RNCSSV) and internationally recognized frameworks, such as the California Sustainable Wine (CSW) program. The resulting data were analysed to identify the sustainability status of winegrowers and to diagnose critical gaps and areas for improvement needed to meet certification requirements. Particular attention was given to the relationship between yield per hectare and viticultural practices, culminating in an assessment of producers’ readiness to meet increasing market demands for sustainability certification.
This study aimed to assess the capacity of small-scale winegrowers affiliated with a cooperative winery in the Douro region of Northern Portugal to comply with current sustainability benchmark requirements. It also examined their viticultural practices and their respective environmental and local impacts. Data were collected through a survey instrument grounded in the RNCSSV, OIV Guidelines, and complementary international sustainability benchmarks for the wine sector [
17]. The survey responses reflect practices undertaken during the 2022/2023 viticultural season.
2. Materials and Methods
2.1. Characterization of the Area
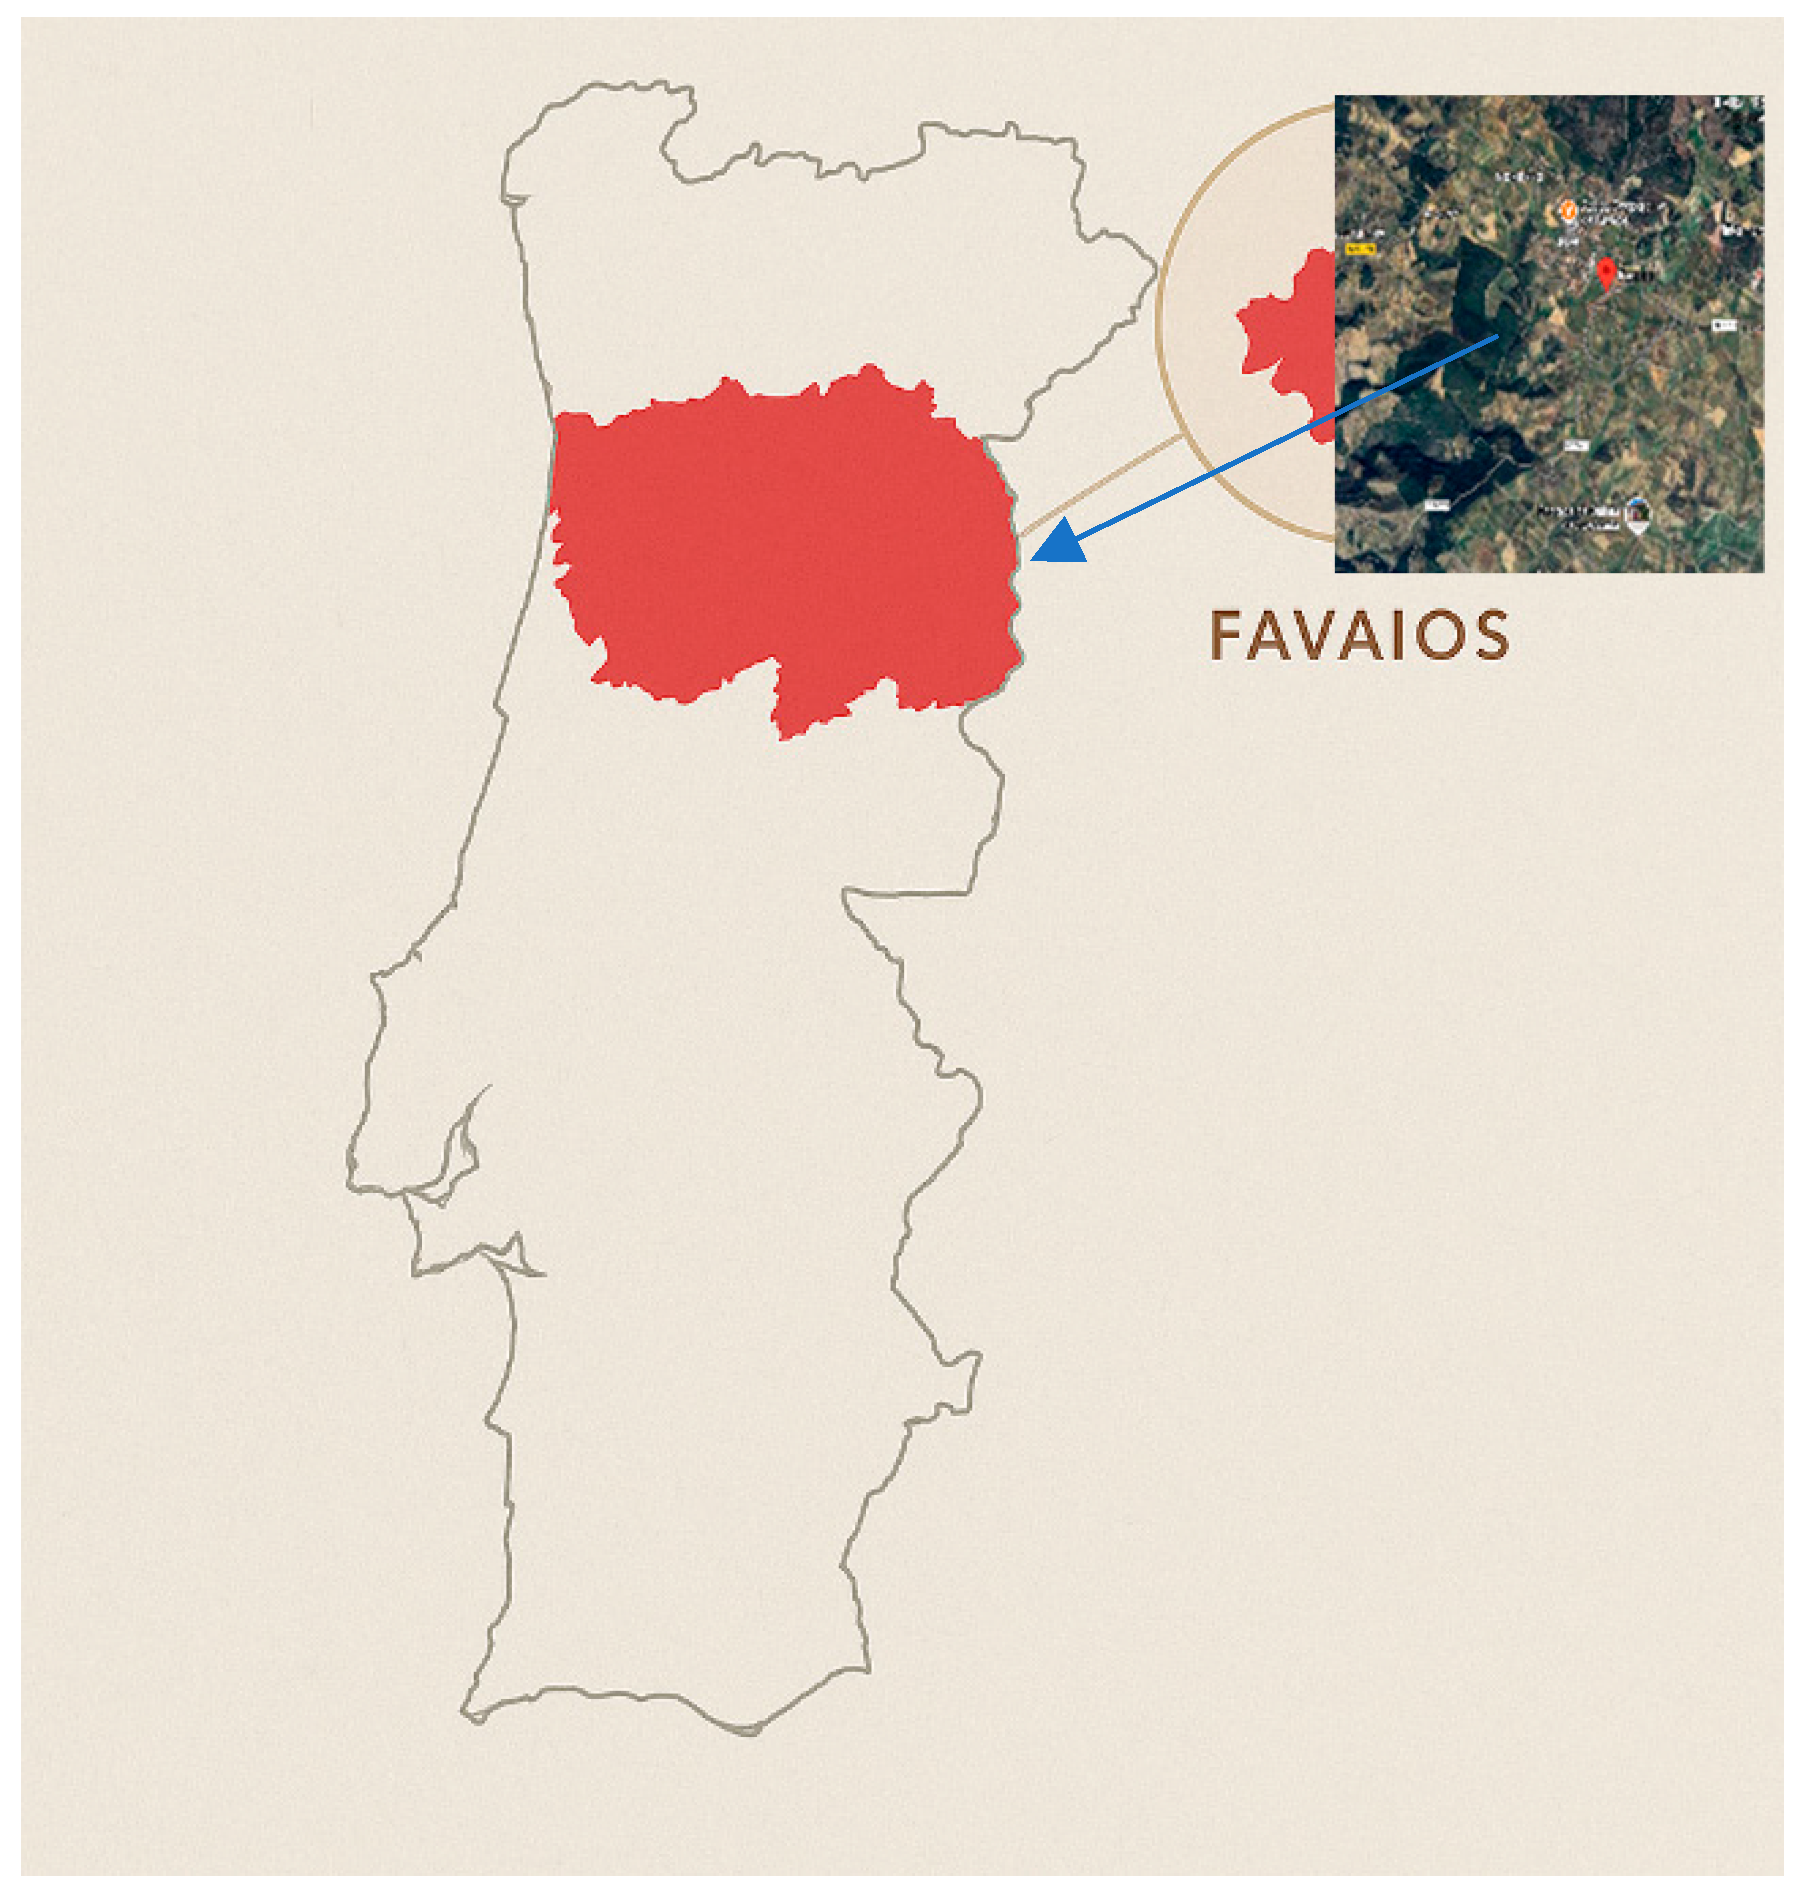
The winegrowers in the study have their vineyards located on the Alijó plateau (
Figure 1) (Douro region, Portugal), where the soils are mostly granitic, as opposed to the prevailing shale in the region. The zone is 550 m above sea level and the vineyards are mostly flat, unlike the rest of the region, which is known worldwide for its terraced vineyards. This makes the area a different ecosystem to the rest of the Douro, due to the soil, the slope, and also the temperature, where there are lower thermal amplitudes. Like the rest of the region, the vineyard plots are small and often form part of a cluster of plots. The average size of a vineyard is 2.52 hectares, but the smallest vineyard owner surveyed has 0.6 hectares of vines and the largest has 42 hectares. The average production in the area is 7400 kg/ha [
14], with the winegrowers surveyed producing 6600 kg/ha.
2.2. Drawing Up the Survey
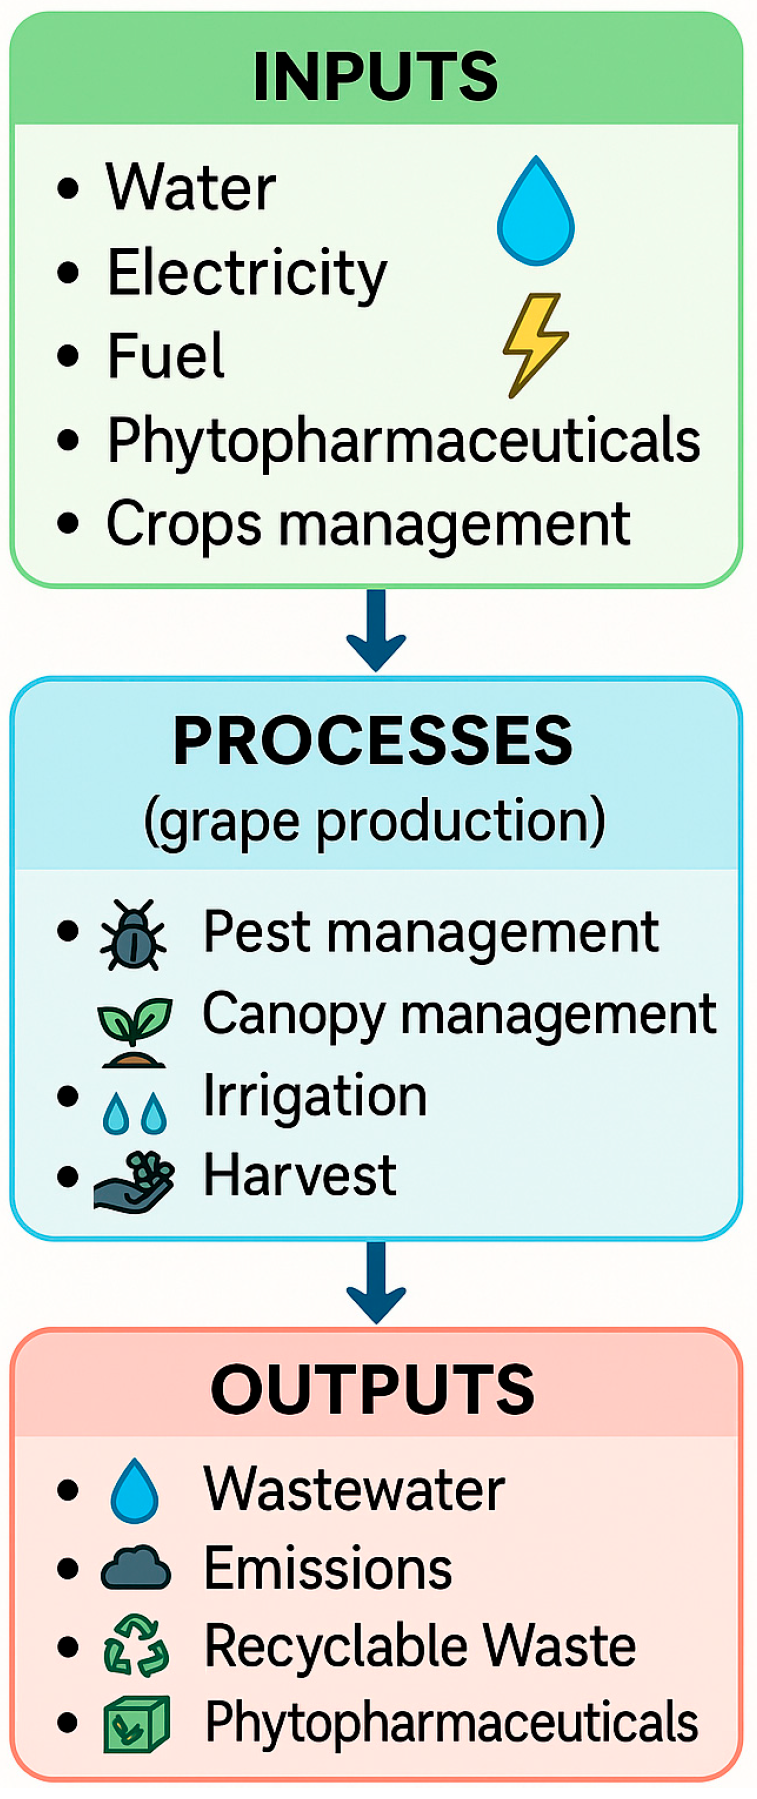
To prepare for the survey, the flow diagram (
Figure 2) was first drawn, identifying the inputs, processes, and outputs based on the RNCSSV sustainability indicators [
18] and the references studied by Marques [
17]. This includes inputs (e.g., fuel, fertilizers), processes (e.g., soil management, tillage, pesticide application), and outputs (e.g., emissions, crop yield, residues from phytopharmaceuticals). The most significant indicators for sustainability were identified and transformed into questions, such as the type of tillage, soil erosion, use of phytopharmaceuticals, management, and human resources.
The survey consists of 83 questions, 52 of which are dedicated to the vineyard and viticultural practices,
Table 1. The questions concerning viticulture are divided into two large groups, white grapes and red grapes. These groups are subdivided into two, one of context, with questions about grape varieties, vineyard management, altitude, terrain, which are questions that do not vary much over the years. The other sub-group was made up of questions about energy consumption and vineyard management, such as fertilization, the application of phytopharmaceuticals, irrigation, water availability, soil erosion, and cover crops.
The context-related section of the survey included questions regarding the size of the enterprise and the presence of any agricultural certification, such as Integrated Production, Organic Production, Regenerative Agriculture, Biodynamic Agriculture, Global GAP, among others. Respondents were also asked about the types of agriculture they practiced, regardless of certification status. In addition, information was collected on water, energy, and fuel consumption. Two legally required items—the applicator card and field notebook—were excluded from the analysis since all respondents confirmed their possession.
The survey was distributed to selected cooperative members via email during the second quarter of 2024, enabling them to complete it autonomously and at their convenience, using data from the 2022/2023 campaign. This mode of distribution allowed participants to consult supporting documentation (e.g., field logs, invoices), promoting accuracy. However, the absence of interviewer guidance may have introduced variability in interpretation and response quality. In addition to completing the survey, participants conducted a self-assessment based on the RNCSSV document provided by ViniPortugal [
18]. Approximately 10% of cooperative members were invited to participate.
Although the final sample includes only 16 winegrowers (approximately 3.3% of the cooperative’s membership), they account for around 21% of the total grape volume delivered to the winery. The sample was selected to reflect the operational diversity of the membership—representing family-run, micro, and small enterprises—thus ensuring internal representativeness despite the limited size.
2.3. Statistical Analysis
Firstly, a database was created with the responses obtained in the surveys, which made it possible to see which responses had data and from which ones it was not possible to collect information. Questions with less than 4 answers were removed from the analysis. It was also possible to see that some questions needed to be reformulated, as they either had no answer or the answer was not clear.
All indicators were considered with equal weight in the descriptive analysis, following the structure of the RNCSSV self-assessment, which does not prescribe a weighting system. Nonetheless, future work could explore differentiated weighting based on environmental relevance or expert judgment.
In a second step, we aimed to establish relationships using the functional unit of kg/ha, allowing the impact to be assessed in terms of production rather than the cultivation area. This approach is based on the assumption that the cultivated area remains constant, whereas production varies annually as a result of yearly factors, such as treatments, climatic conditions, irrigation, and other management practices.
The statistical analysis was carried out using the R programming language (version 4.4.1), which is internationally recognized for its robustness and flexibility in scientific data analysis. The data were initially organized and processed to ensure their integrity, followed by descriptive exploratory analysis aimed at identifying patterns, outliers, and distributions.
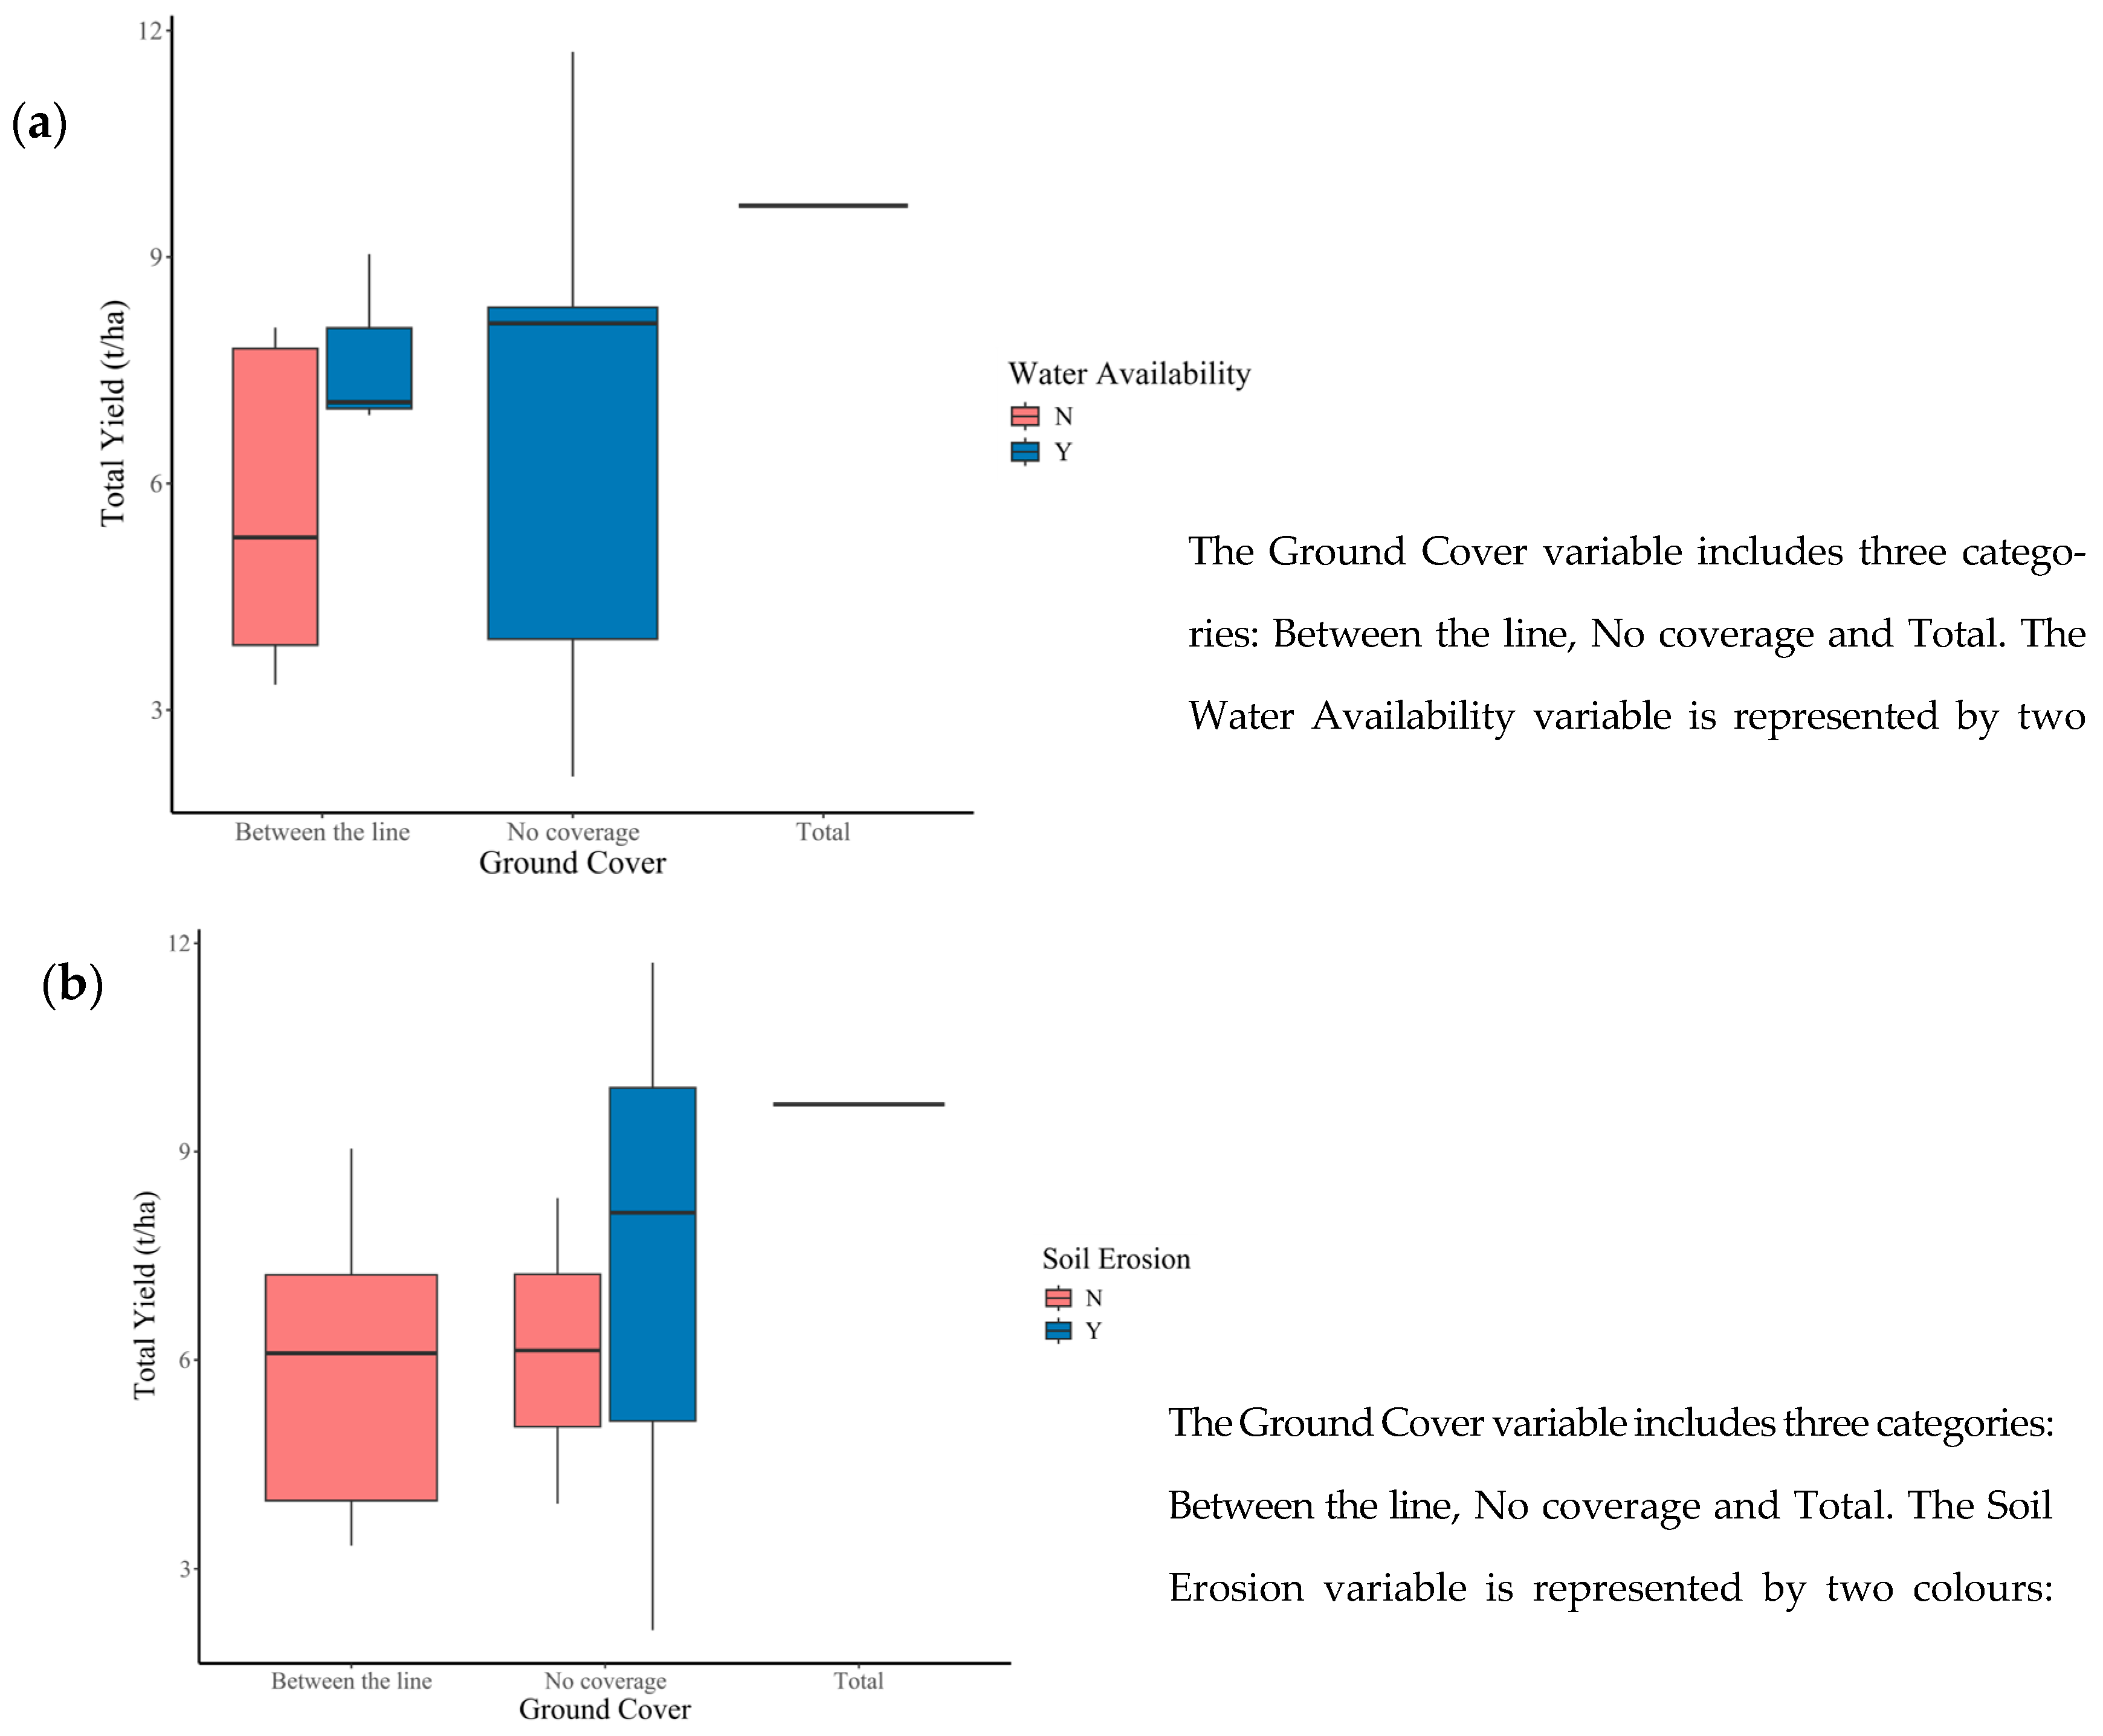
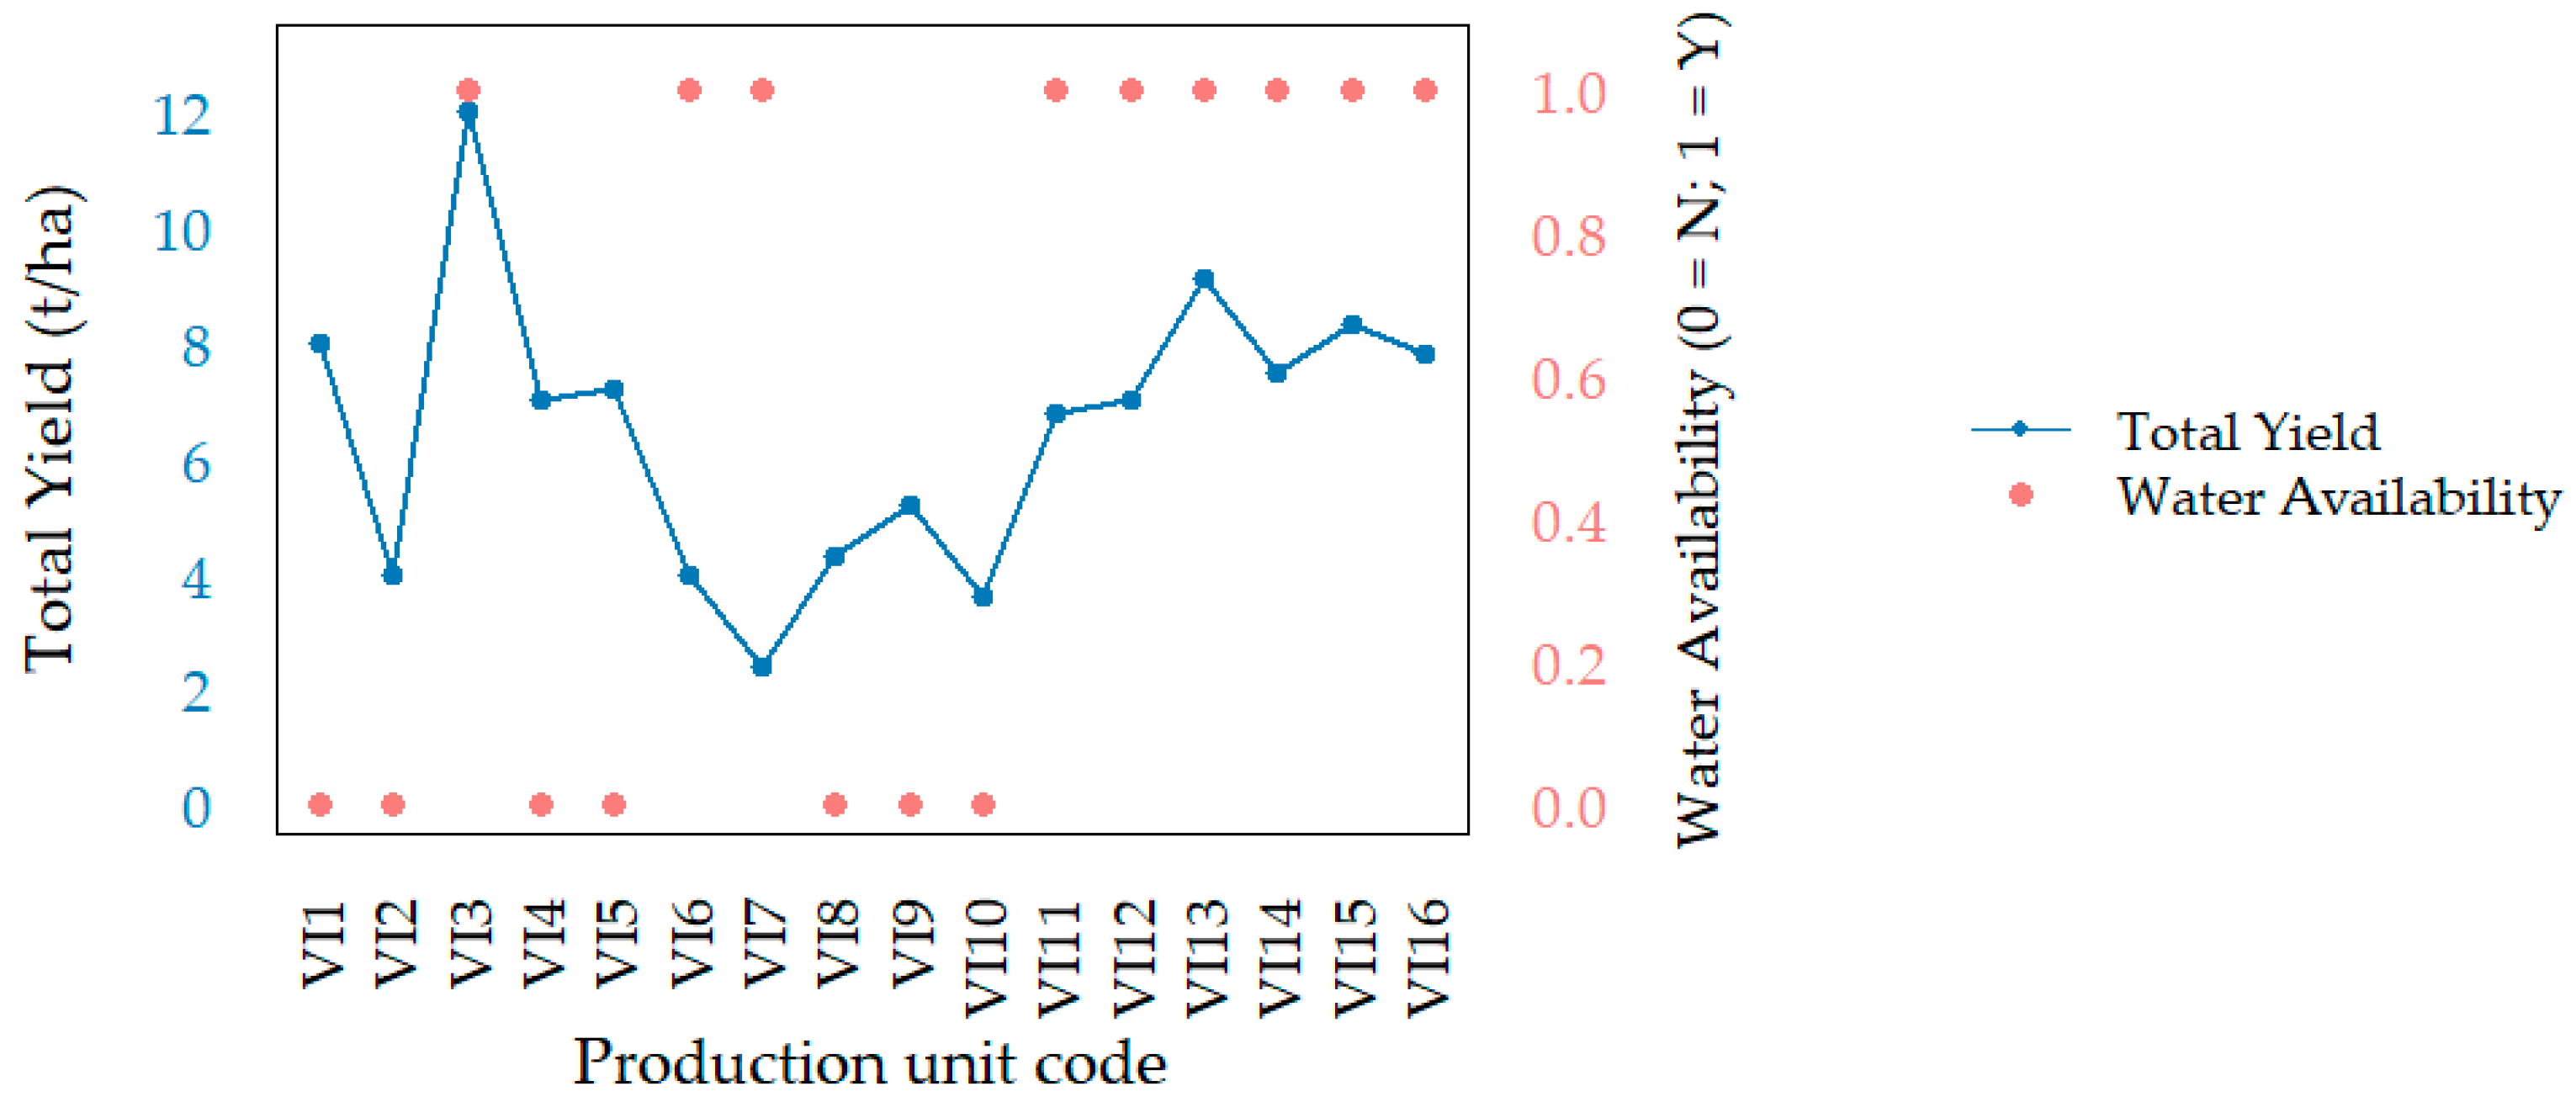
Data visualization and representation of statistical results were performed using the ggplot2 package, which allows for the creation of high-quality and interpretable graphical outputs. Through these visualizations, it was possible to observe interactions between variables, detect potential outliers, and characterize data distributions according to different factors, such as the type of ground cover or water availability.
All analyses were conducted in a script-based environment, ensuring full reproducibility of the results.
4. Discussion
This study was carried out in the context of a cooperative winery located in a small village in Northern Portugal, where viticulture constitutes the main axis of socio-economic and environmental development. With 486 members in 2023, the cooperative directly or indirectly involves more than half of the local population, underscoring its pivotal role in the local economy and community structure [
21]. The impact is not only economic, in the sense of obtaining benefits for the partners, but also social level, with the maintenance of jobs and support services (schools, banks, agricultural trade, etc.), and also environmental, as it is in an area where the monoculture of vines prevails [
22,
23]. In environmental terms, it has a major impact on biodiversity with the elimination of ecological niches that can provide shelter for pest predators. An entire ecosystem grew around this organization, commerce, tourism, services, other organizations with the same activity, support structures for social development, etc., [
23].
The challenge of sustainability was launched to all the members, but it was soon realised that there would be great difficulty in obtaining data. As described by Figueiredo in his study of cooperative wineries in the Dão region (centre of Portugal), the cooperative sector is old, has low literacy, and is mostly male [
22]. This is also true in the case of Adega Cooperativa de Favaios; however, this information was only validated in interviews with the winery’s management bodies and agricultural support technicians on the winery’s staff. Therefore, we were not able to measure the percentages of education level, gender or age. This is one of the indicators to be considered in the next survey.
The initiative to assess sustainability practices was motivated by the cooperative’s intention to access international markets—particularly Nordic countries—that increasingly demand evidence of environmental and social responsibility. A global survey was carried out, identifying the indicators with the greatest prevalence and importance in each reference [
17]. One of the conditions was the supply of raw materials, more specifically, grapes. In other words, the participation of wine cooperative members was essential. The RNCSSV was identified in Portugal and based on the eliminatory indicators of this reference and the indicators identified in the other references, the survey was constructed. This benchmark has an eliminatory indicator in which 50% of the raw material must comply with the mandatory indicators, that is, eliminatory indicators [
24]. Based on this premise, the research was created, with the goal of creating a document that helps partners respond to sustainability indicators in a practical and bureaucracy-free way.
The findings reveal a highly asymmetric operational and structural landscape. Although the survey reached only 3.3% of the total membership, the results provide a valuable exploratory diagnosis of the cooperative’s readiness. Challenges were identified in data collection, especially for critical indicators, such as pesticide use and fuel consumption. Some partners provided the quantities of phytopharmaceuticals applied, but the majority did not do so, justifying this with the complexity of accounting and introduction into the research [
6,
25].
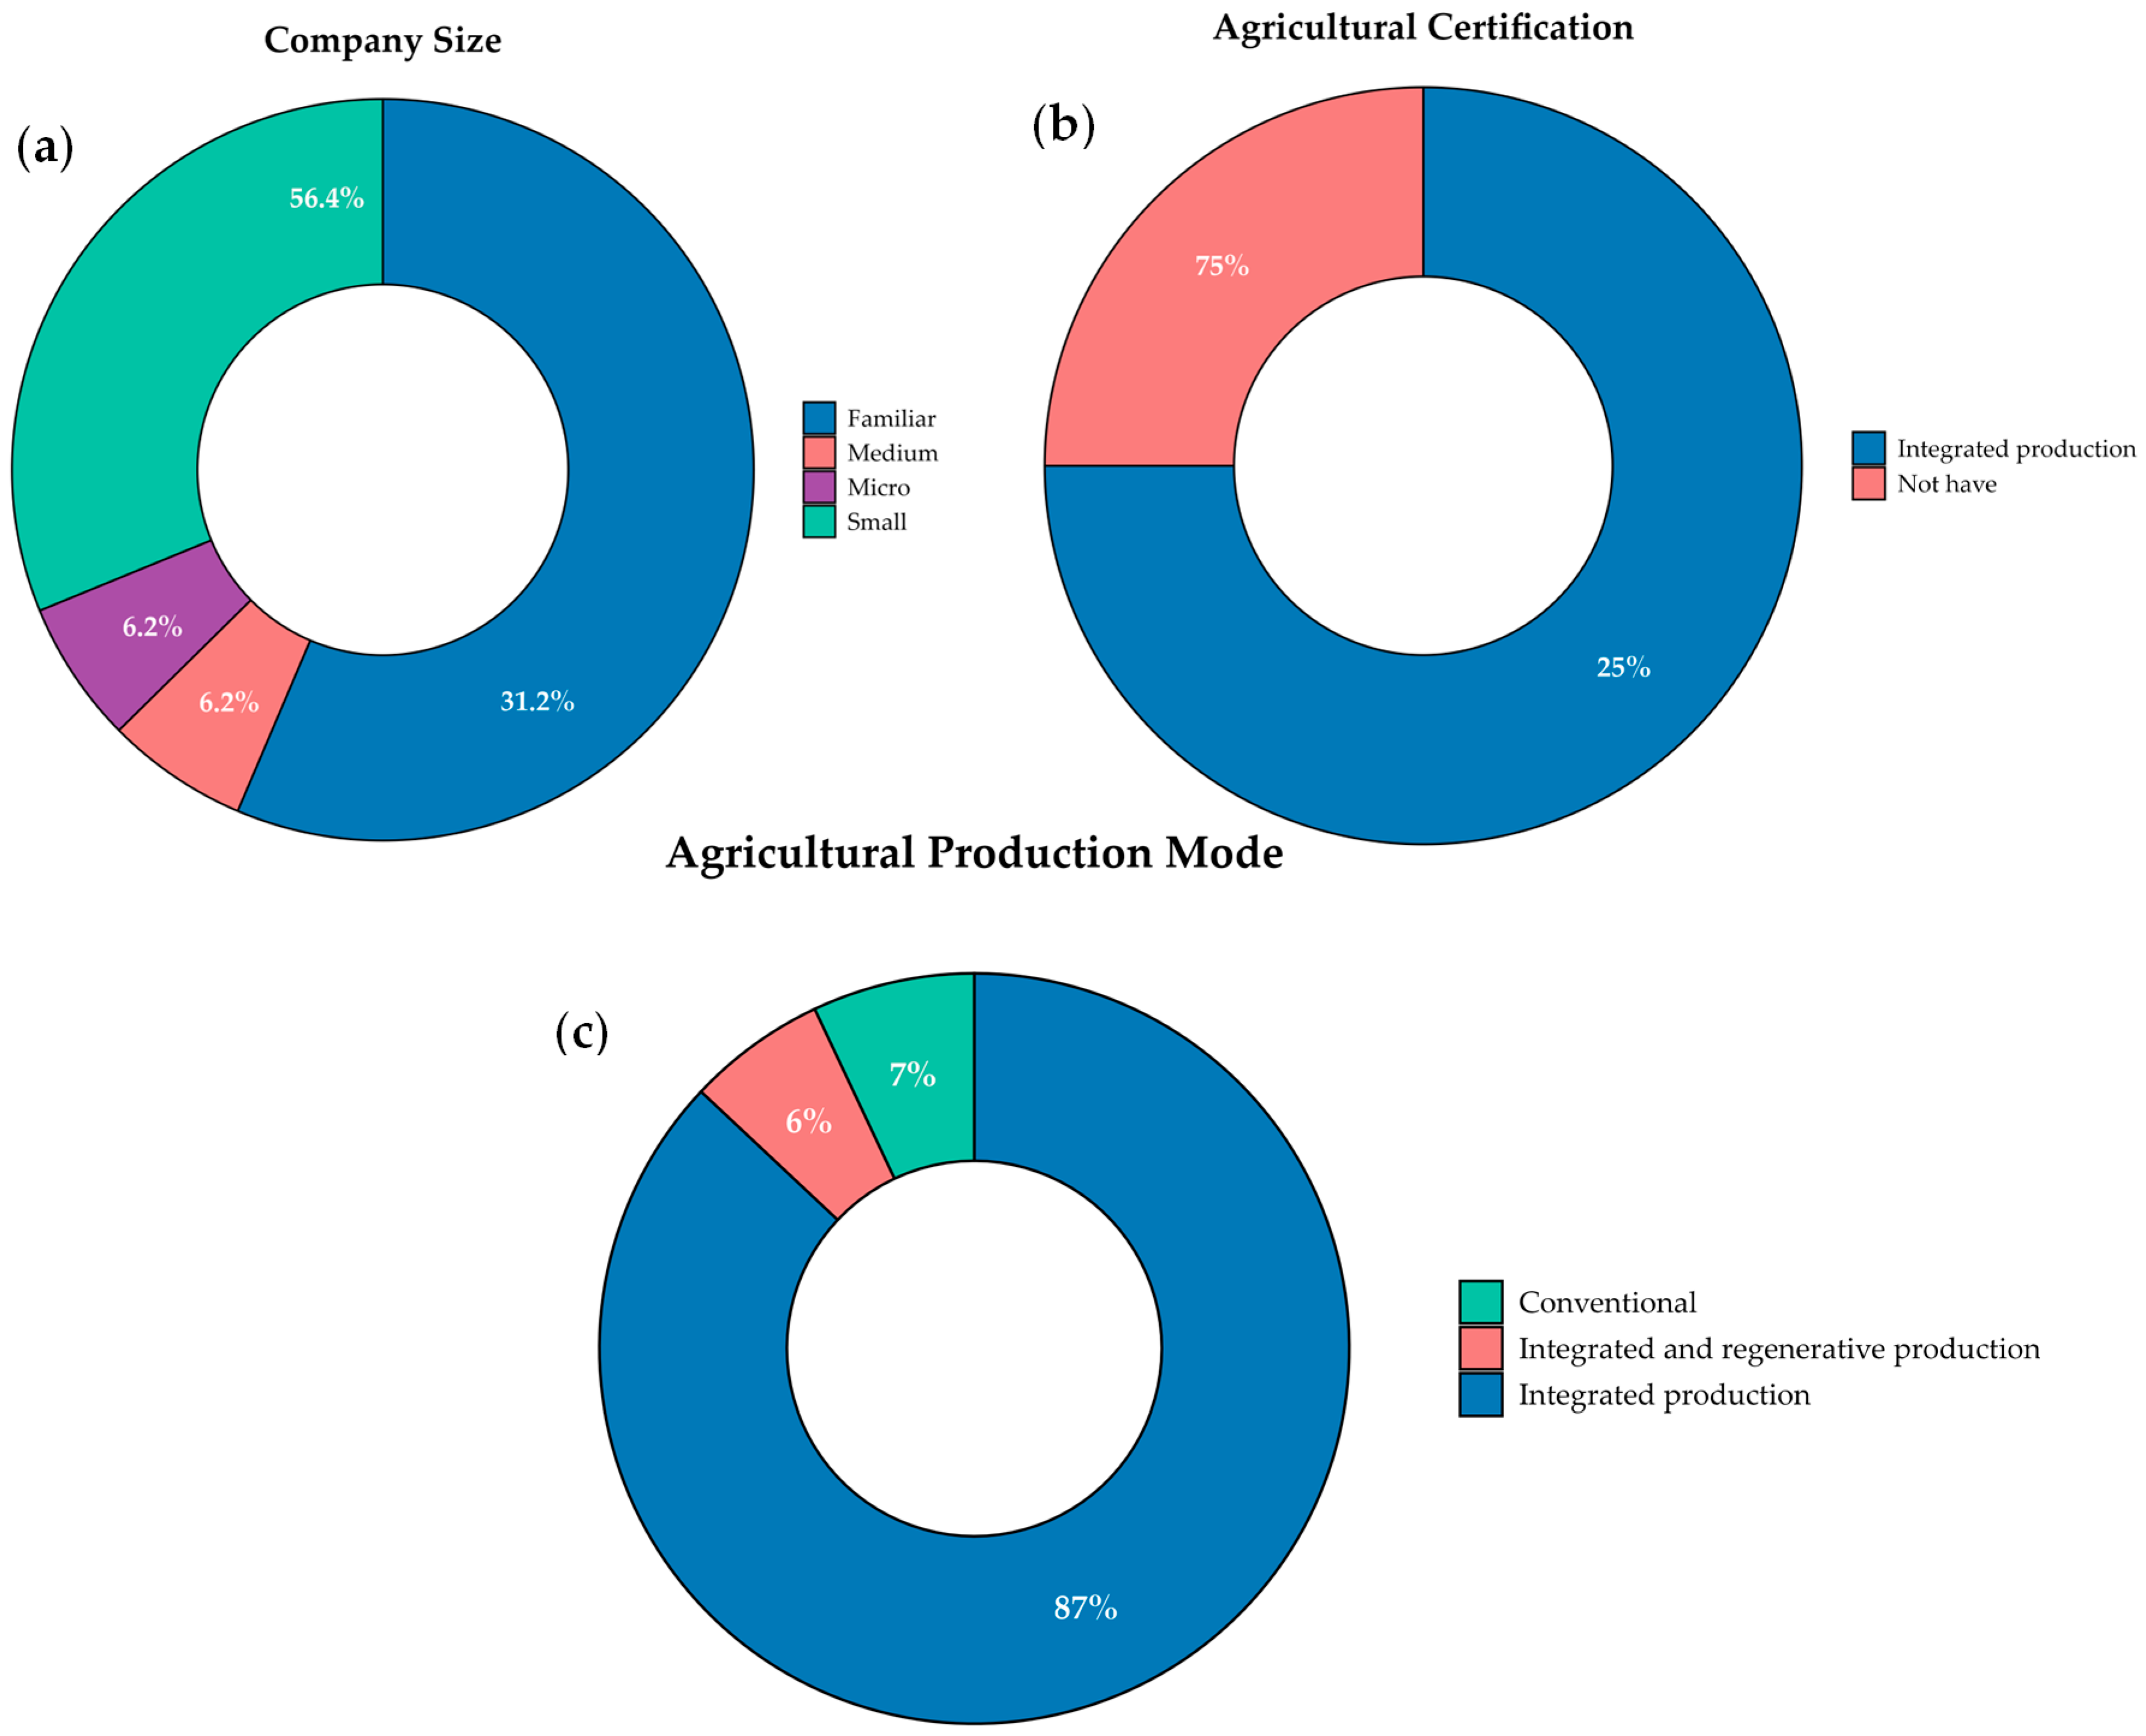
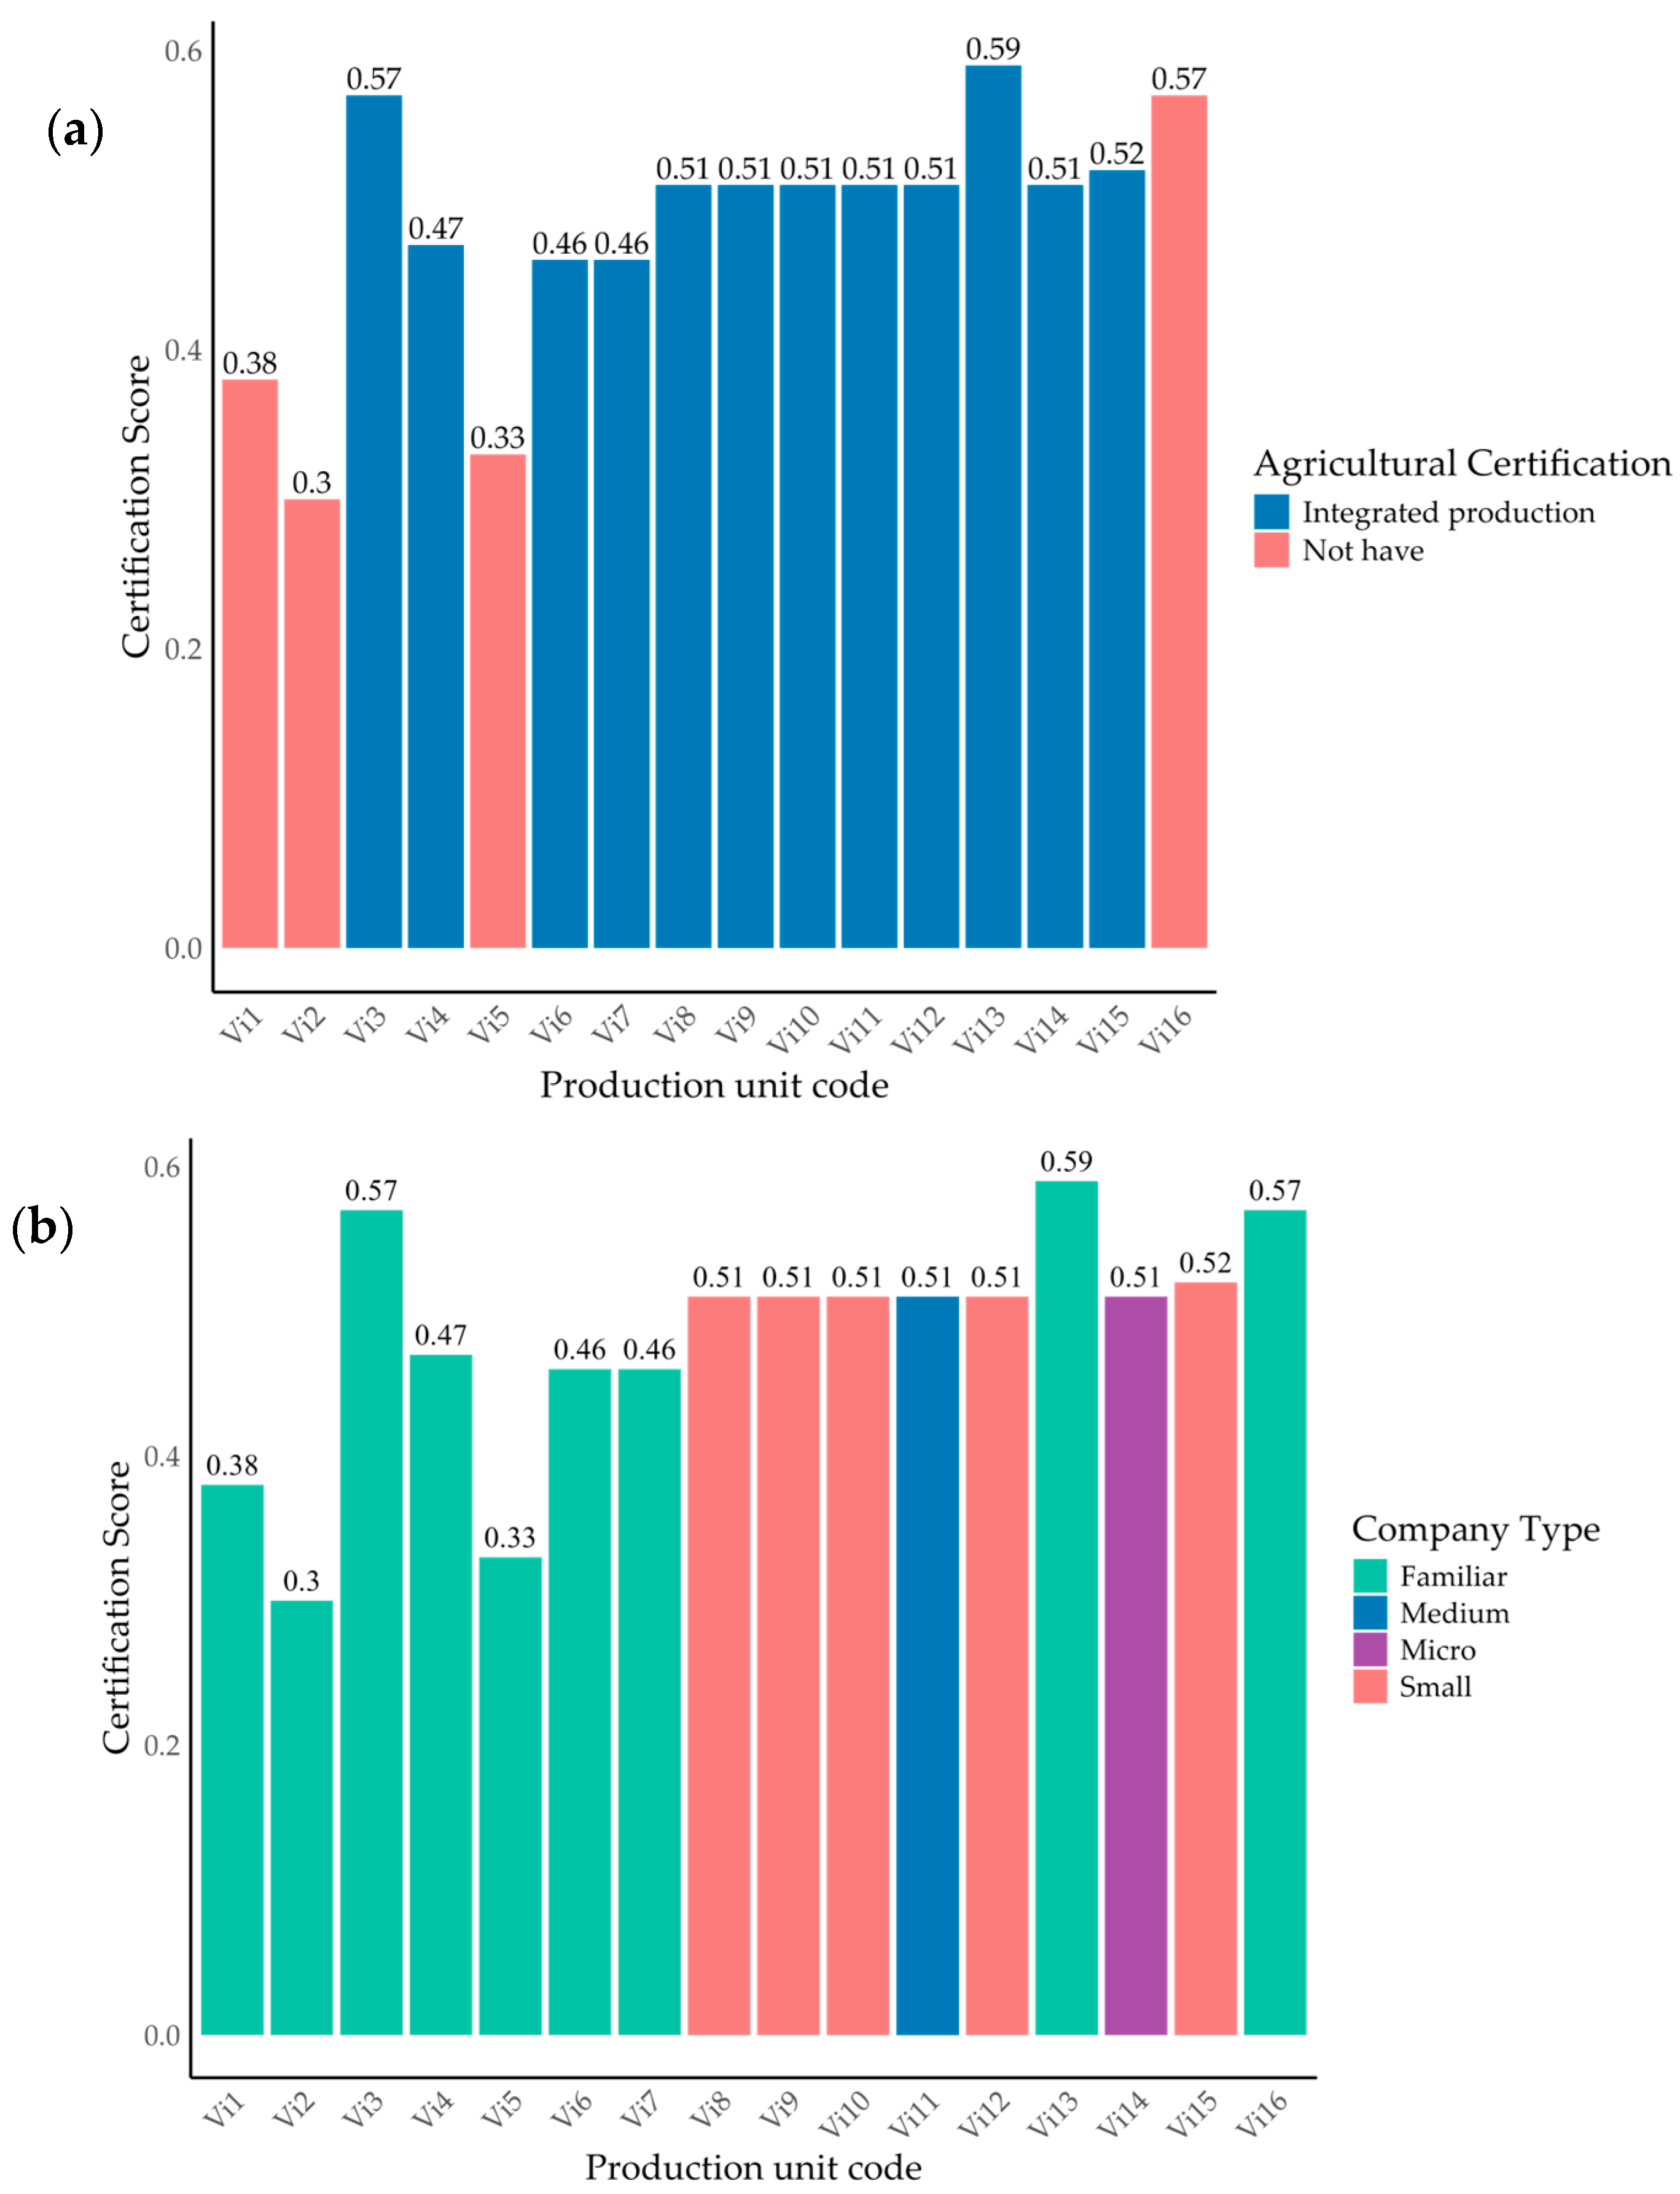
The predominance of family-run farms (57% of respondents) emerged as a key determinant of underperformance. These enterprises typically operate with informal structures [
23,
25], which may delay their ability to comply with benchmark requirements or to engage in long-term strategic planning. This structural vulnerability was evident in the self-assessment scores, which were generally lower among family businesses compared to micro, small, or medium-sized enterprises [
23,
25]. Only three family businesses have a score above 50%, that is, of the 57%, only 1/3 achieved certification at the time of the survey. In this regard, when we look at a more common type of certification in agriculture, we see that some members of Adega Cooperativa de Favaios have certification in Integrated Production, in the case of those interviewed, 70%. Maintaining this certification guarantees a monetary supplement from the Ministry of Agriculture, which raises the possibility that economic incentives may play a significant role in the decision to pursue certification. While this assumption is plausible, it remains speculative without attitudinal or behavioural data. Future research should consider including motivational items to better understand the drivers of certification. Therefore, we inquired what type of agricultural production they practiced, and we found that the majority followed the guidelines for integrated production and there was one case that was applying the concepts of regenerative agriculture. This suggests an awareness of environmentally sustainable cultural practices. Despite these challenges, the study revealed several examples of sustainable practice adoption. Inter-row vegetative cover was commonly implemented, aligning with well-established environmental benefits, such as improved water retention, erosion control, and soil fertility [
19,
20]. Furthermore, partial herbicide abandonment among several respondents suggests a growing awareness of sustainable weed management. However, inconsistencies in pesticide use raise concerns regarding data accuracy and highlight the need for strengthened record-keeping and training.
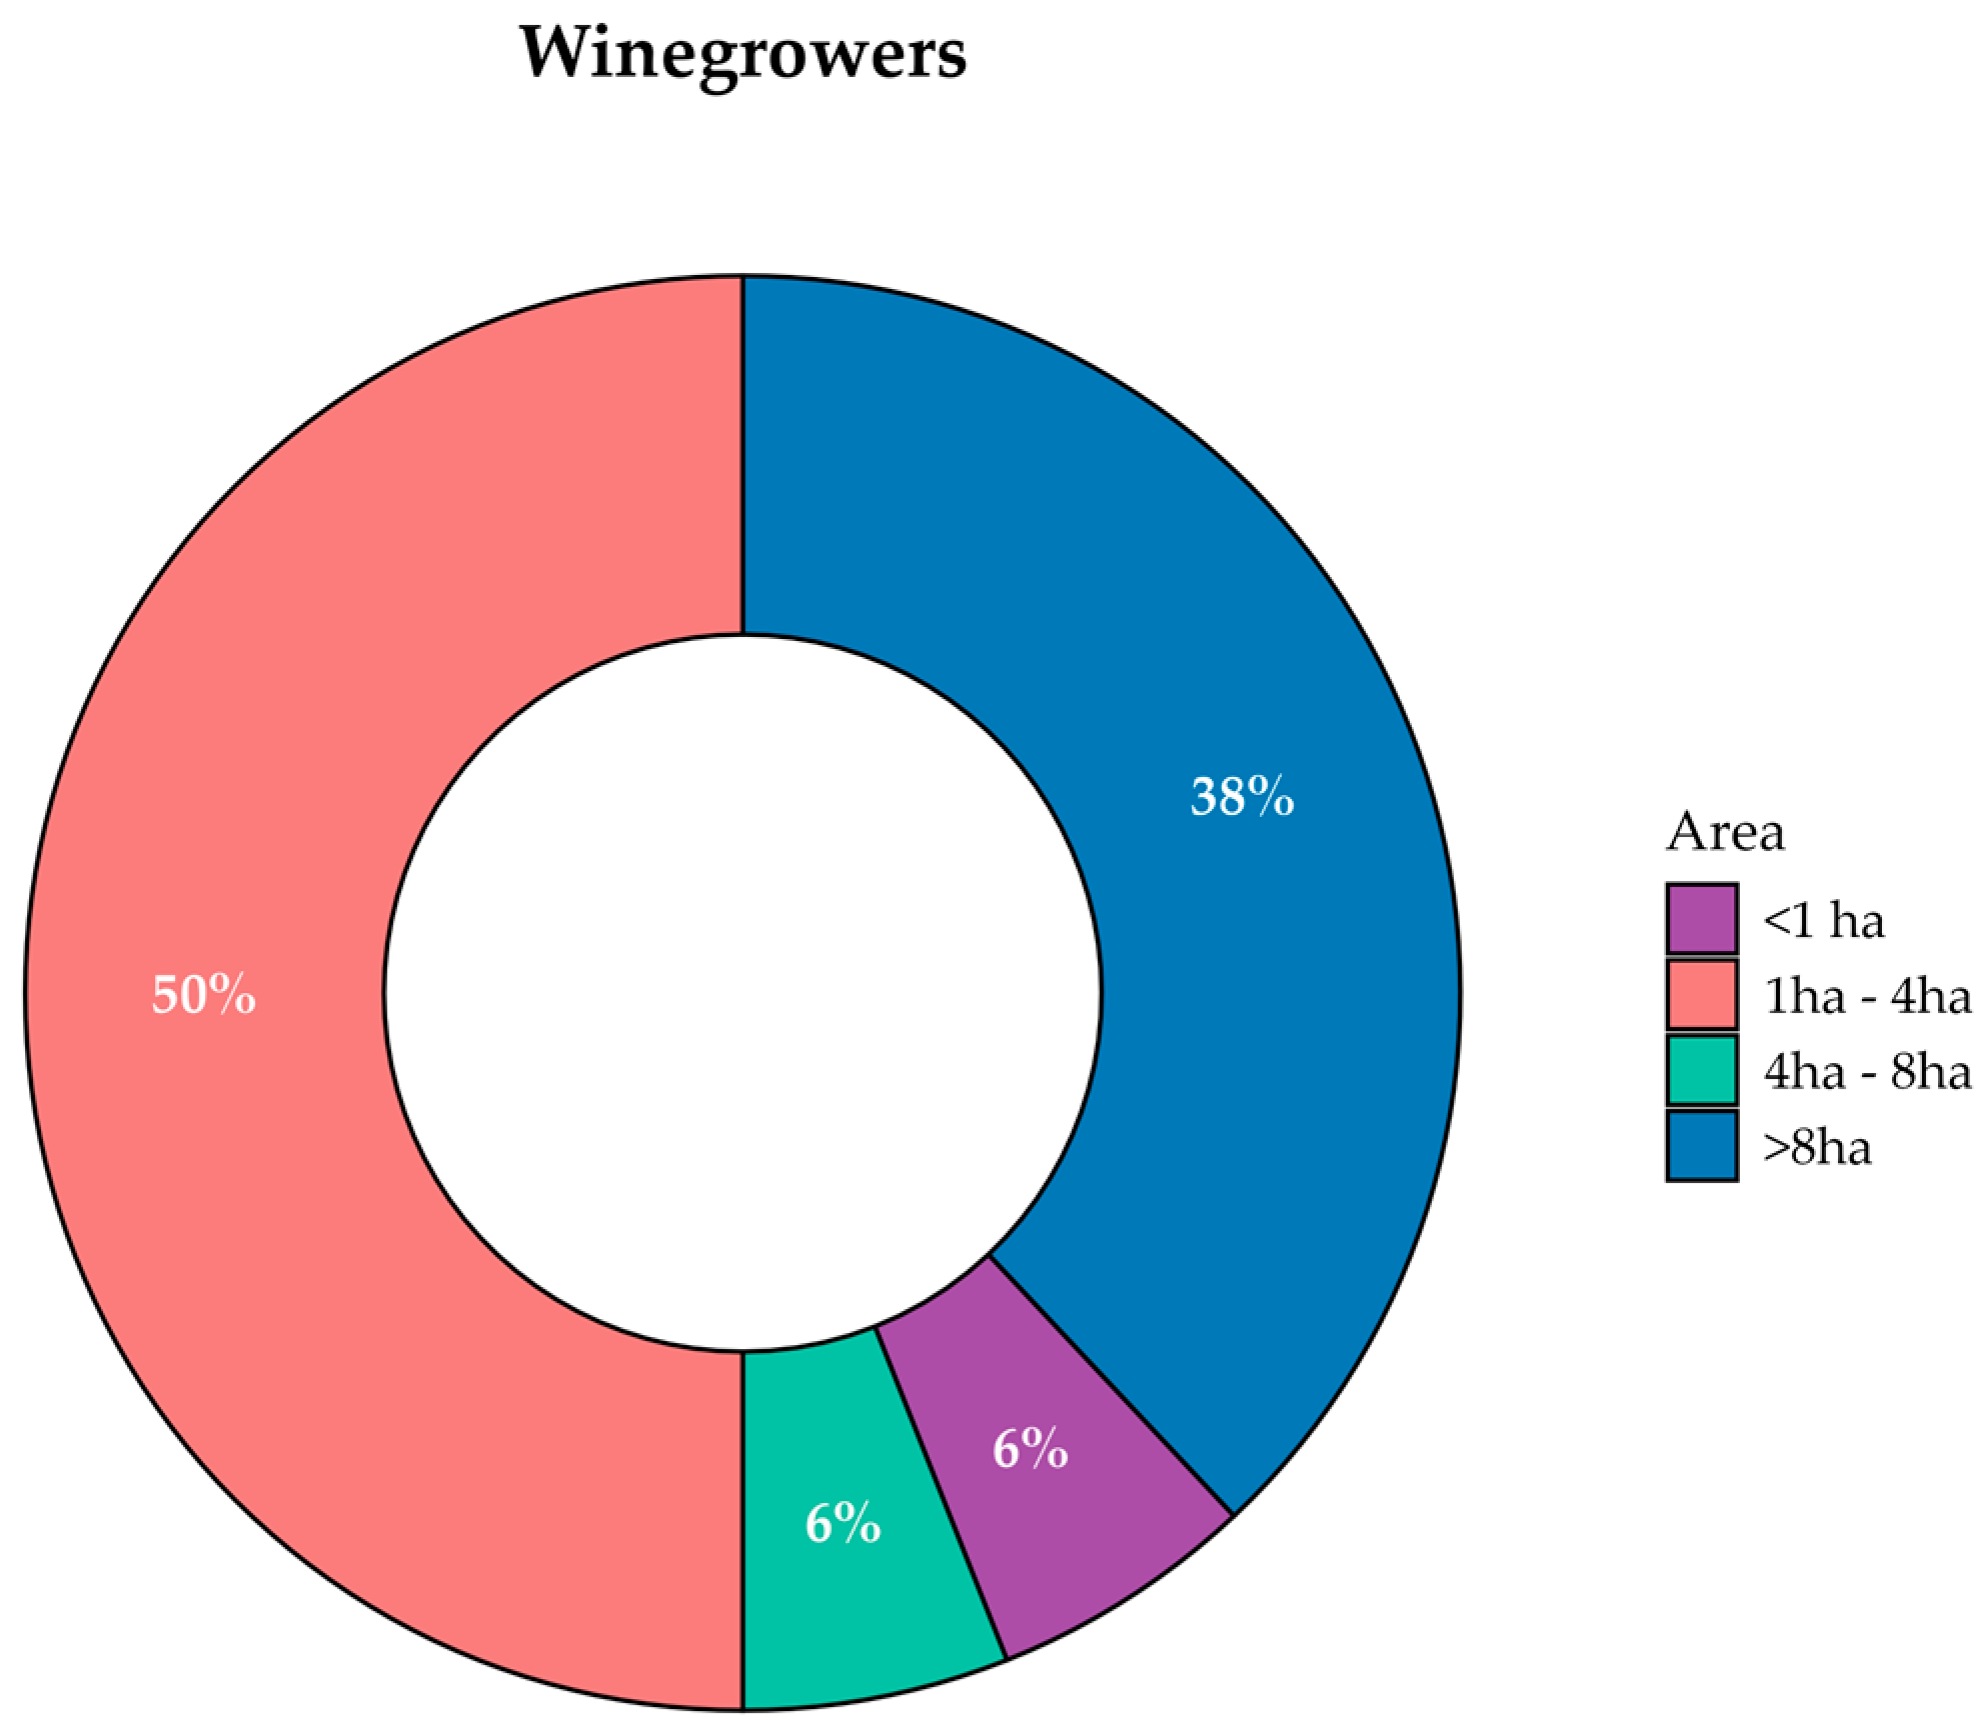
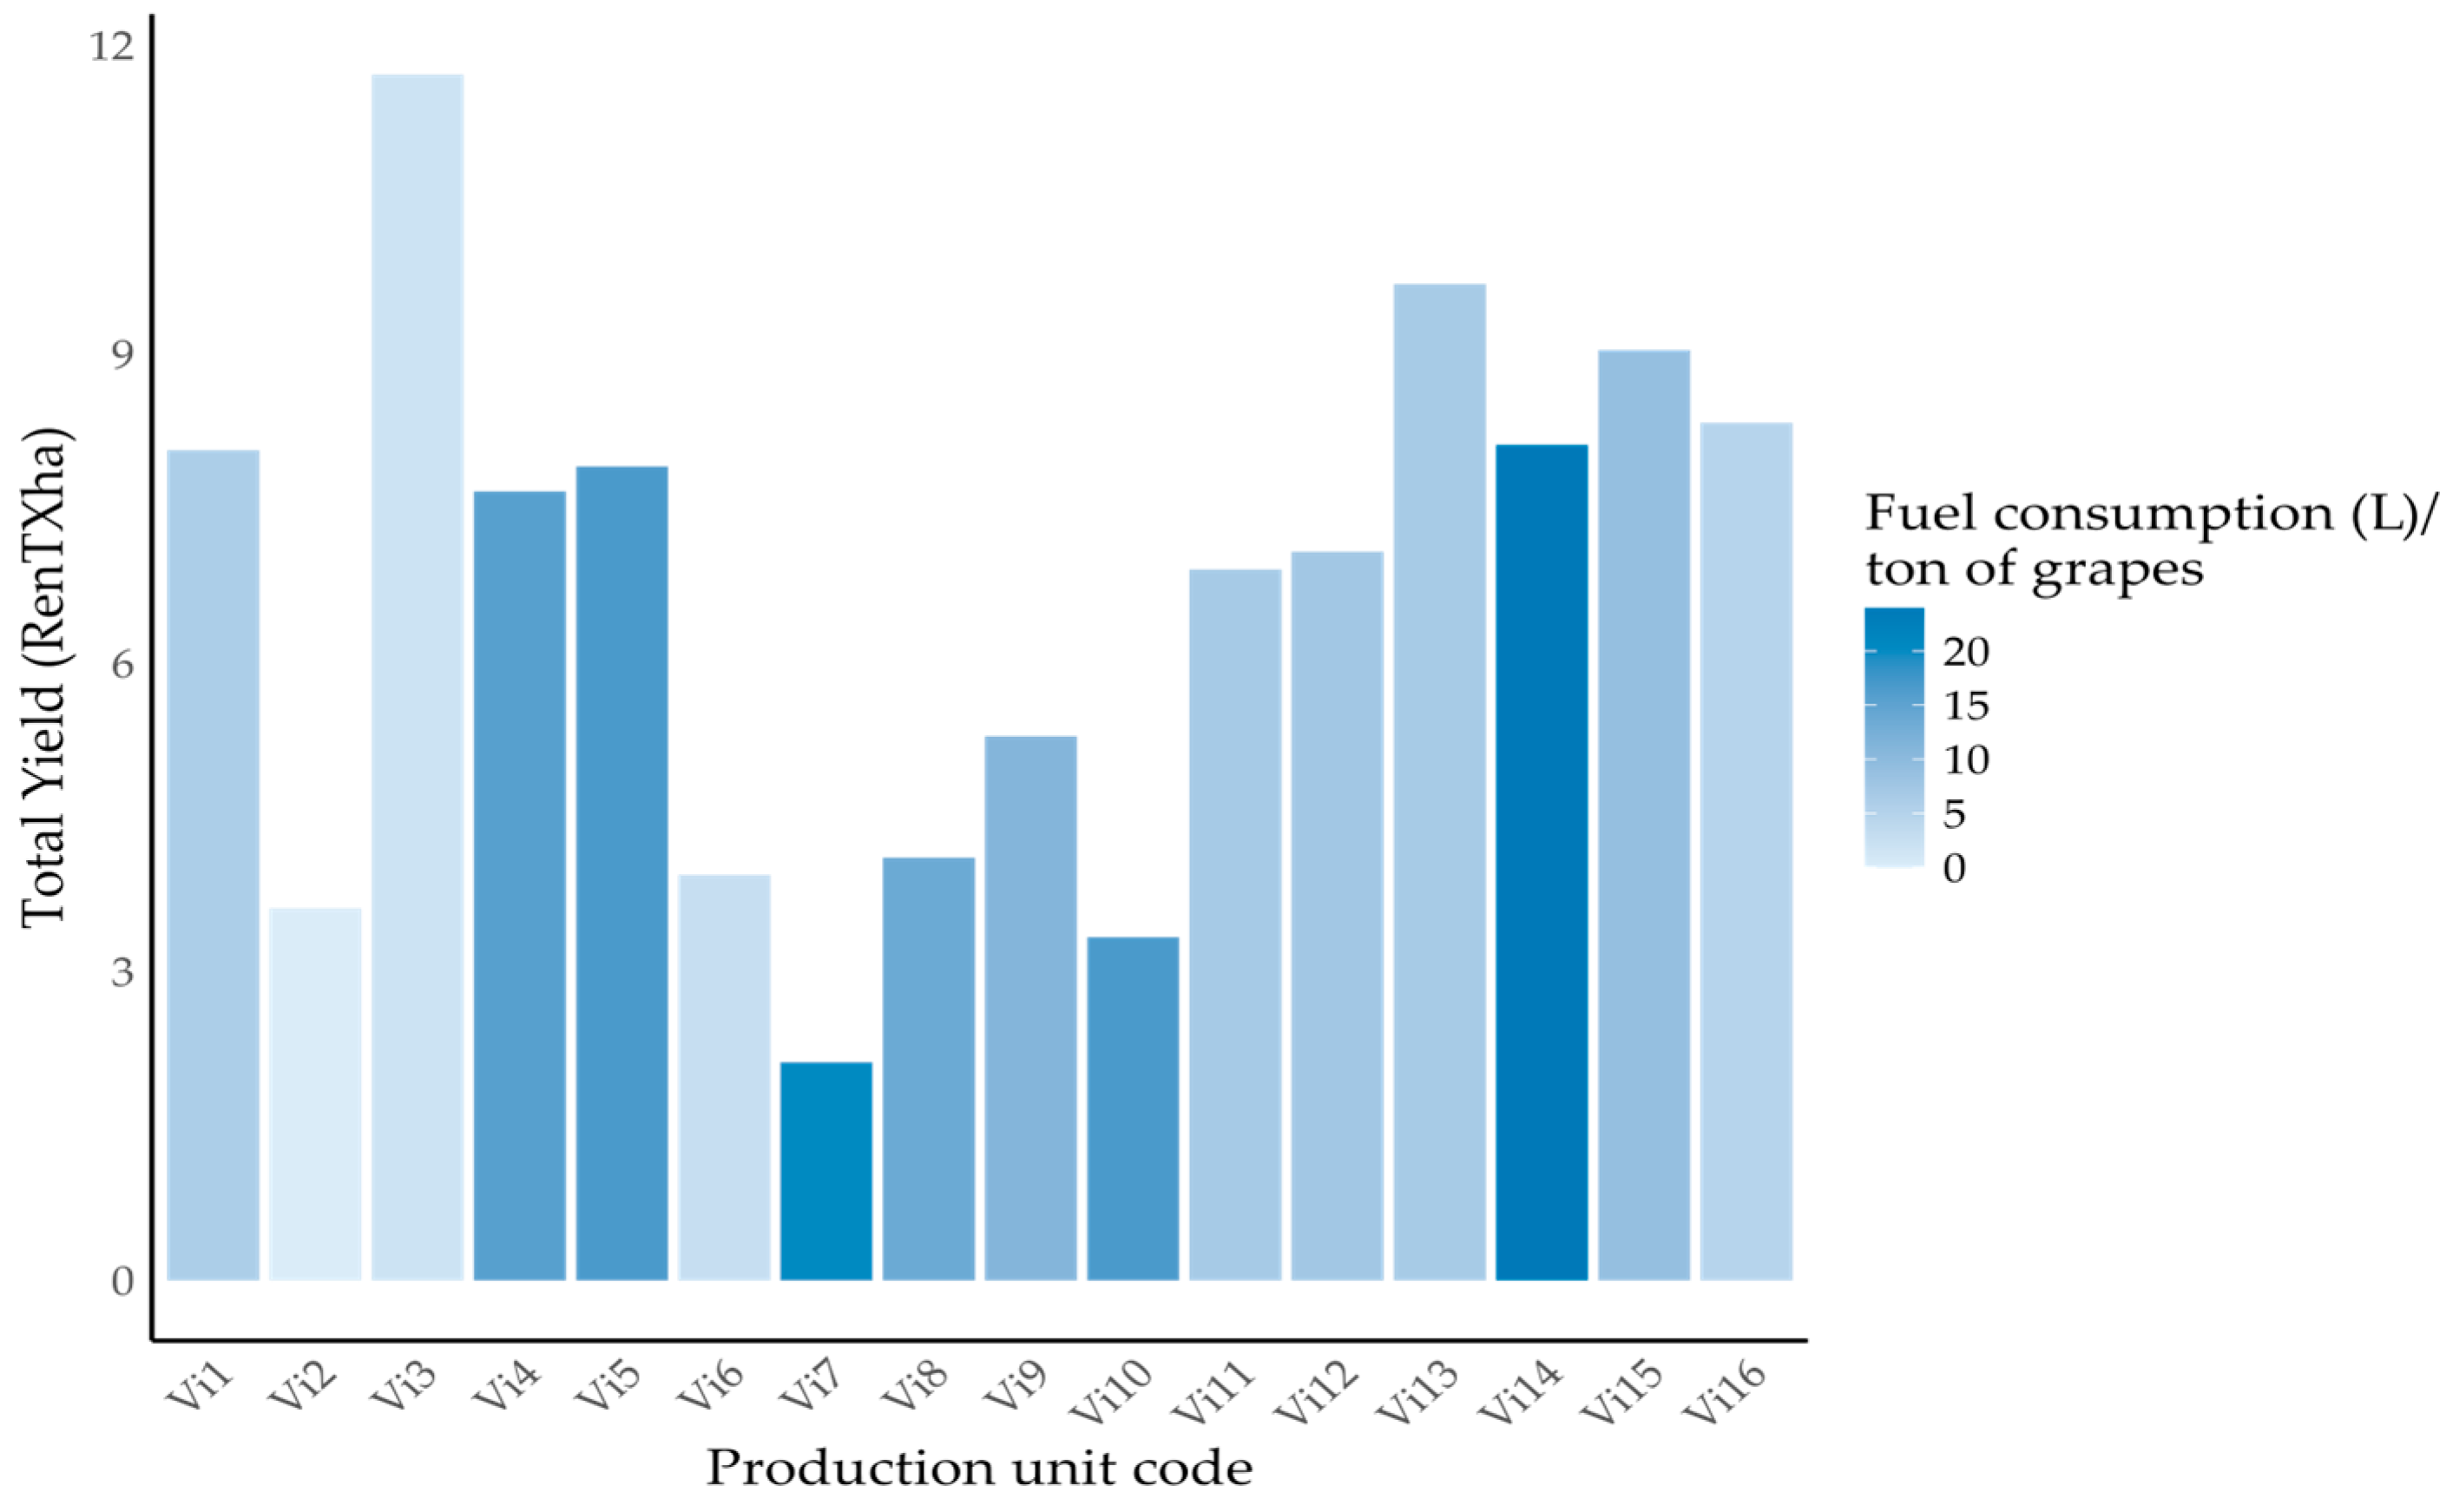
The Douro region has a complex orography, in addition to being a mountain viticulture, winegrowers have small areas of vineyards; among those interviewed, the smallest area of vineyard is 0.6 ha, but 50% have between 1 and 4 ha. Here we do not specify the size of the plots, but each winegrower has more than one plot. This factor greatly limits many cultural operations and increases GHGs, for example, in moving between plots, the profitability of operations, difficulty in using machinery, difficulty in justifying the acquisition of equipment to make operations more efficient. The assessment of fuel consumption per ton of grapes produced, versus production per hectare, was not conclusive, as we did not assess the size of each winemaker’s vineyard plots, which winemakers prefer manual labour versus machinery, nor the sophistication of the equipment used. These are questions that we will explore in future work, as we consider them fundamental for determining the carbon footprint and environmental impact.
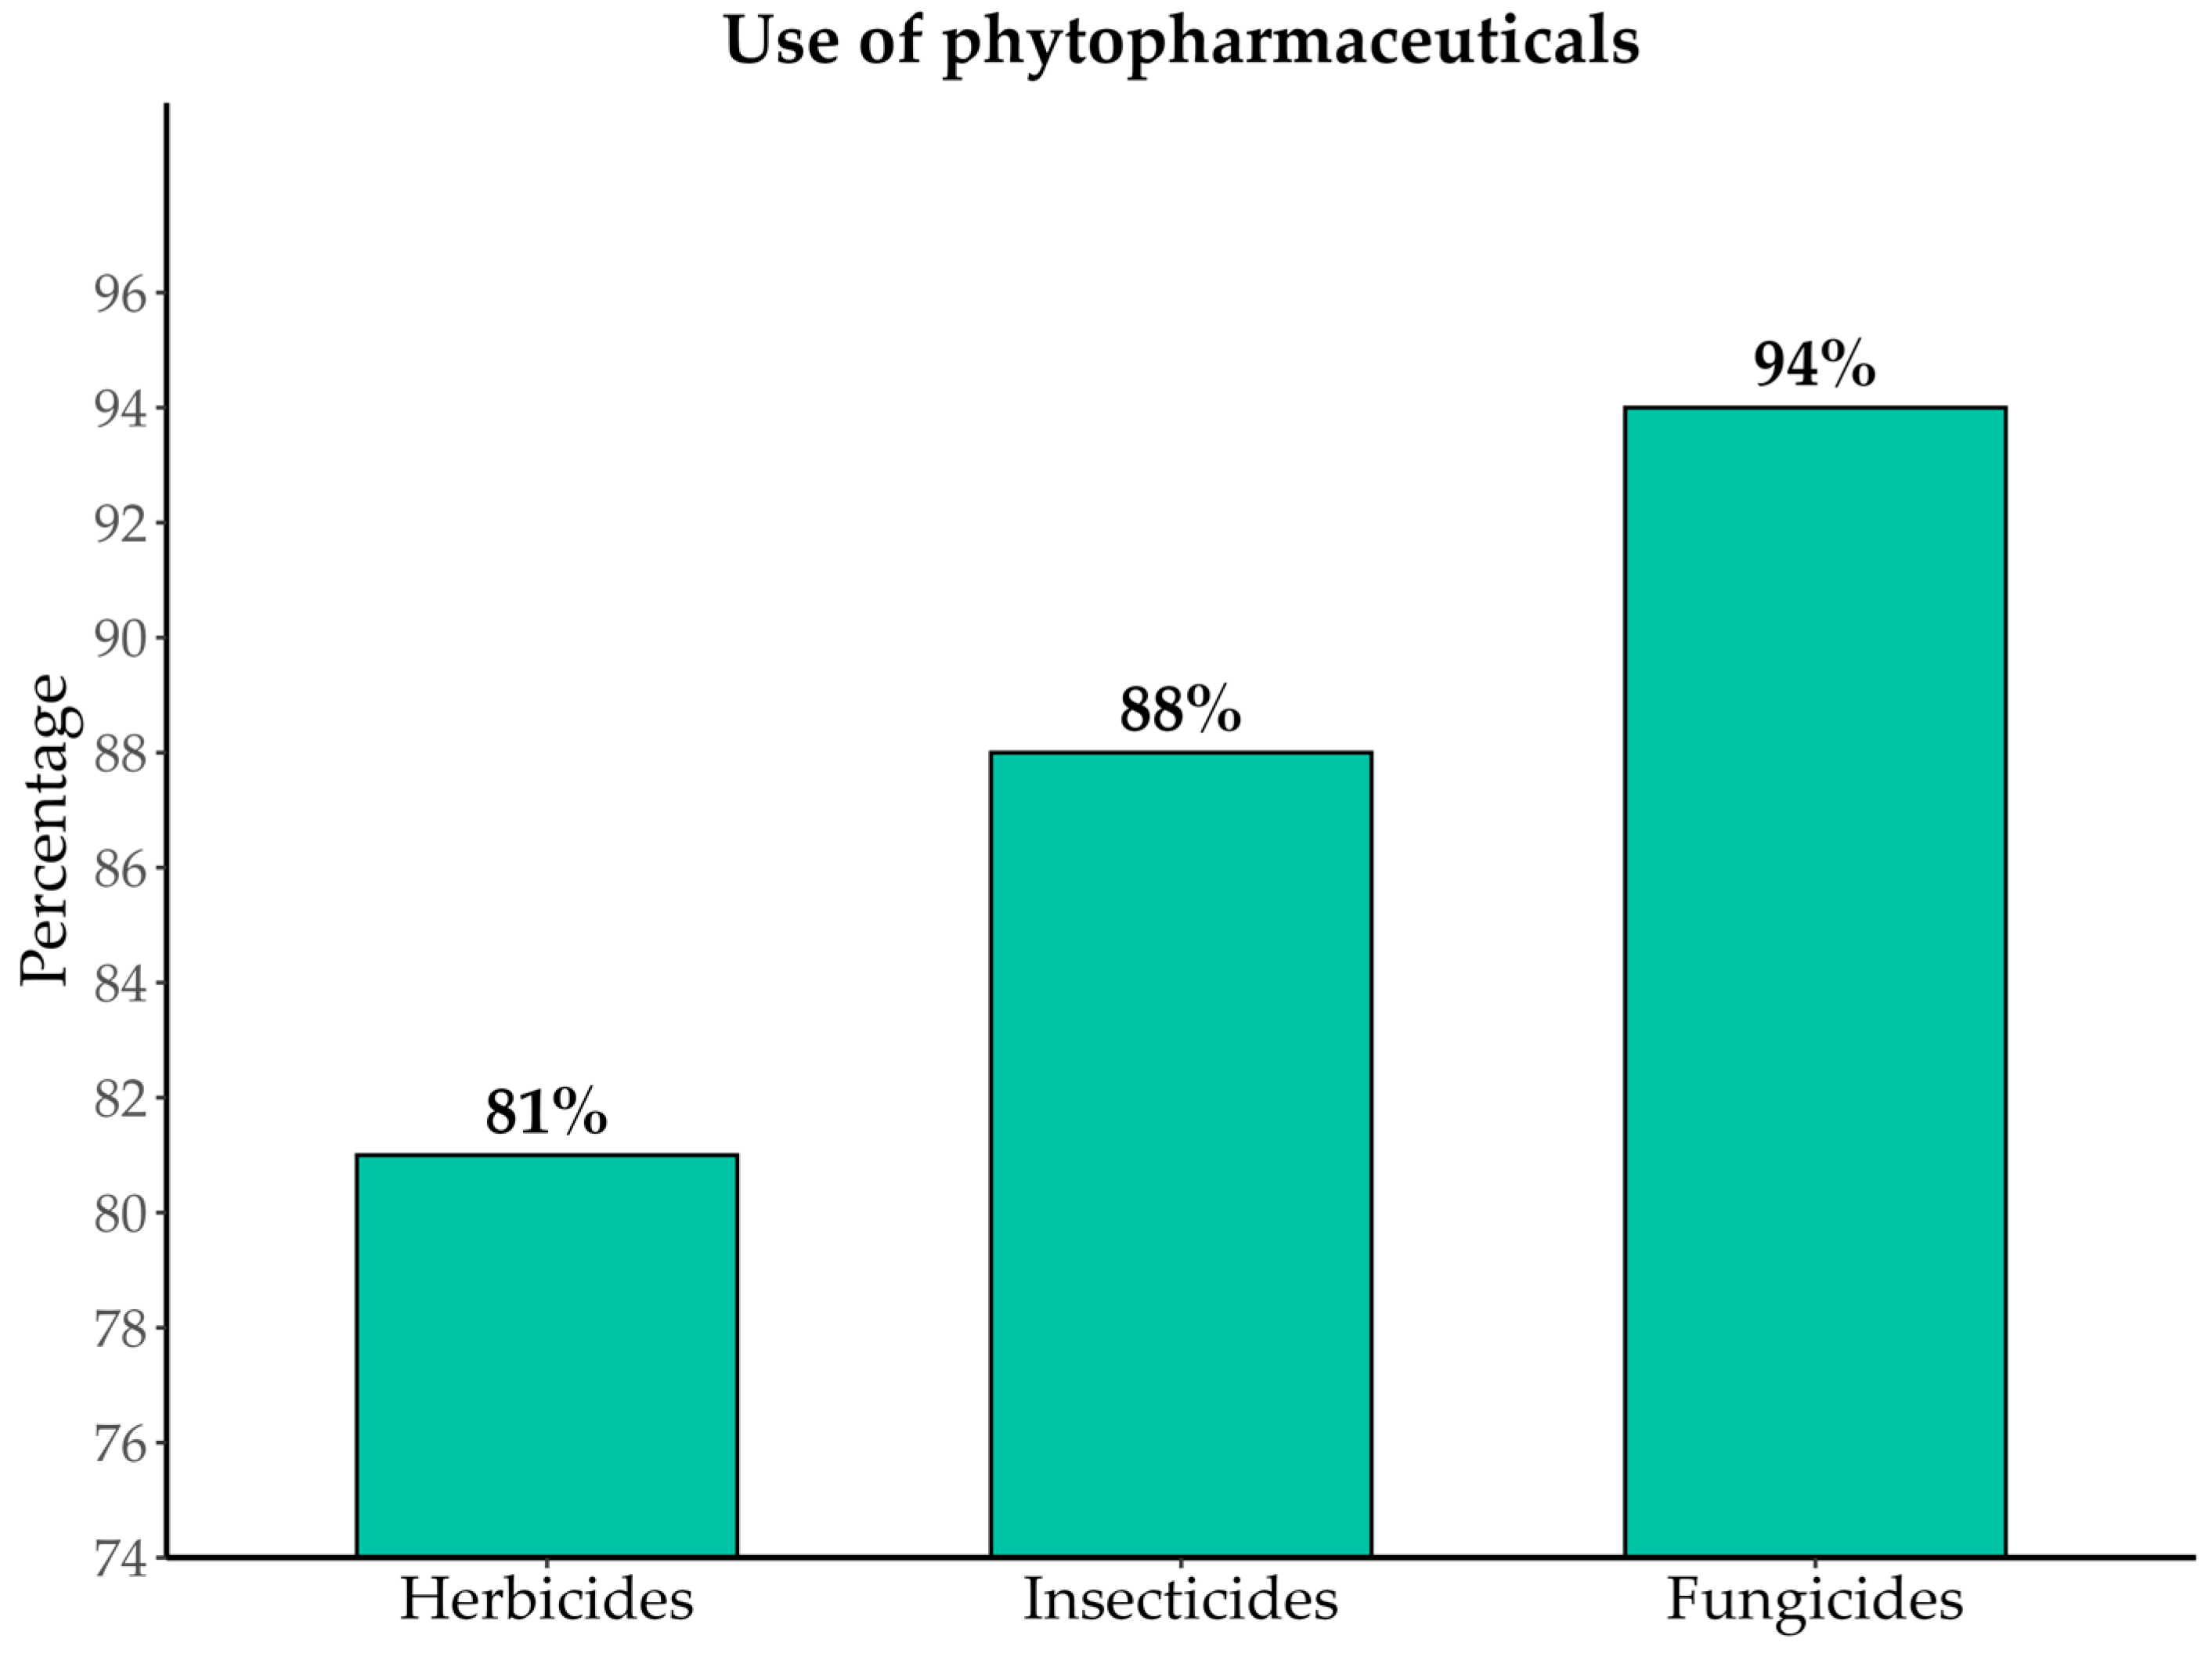
The use of phytopharmaceuticals is associated with one of the causes of the increase in GHGs, in the consumer’s opinion [
26]; however, according to some studies, they represent only 6% of GHGs [
1,
8]. We were unable to obtain quantitative data on the use of these products, as mentioned above, so we improved the survey to facilitate data entry. With the data obtained, we analysed the type of phytopharmaceuticals used, asking whether three types were used: herbicides, fungicides, and insecticides. As for herbicides, we discovered that some winegrowers have stopped using them; only 81% still use herbicides. This is supported by the reported use of plant coverage methods, indicating that it does not use herbicide; however, the inter-row method may or may not use herbicide, as it may use herbicide or mechanical means of removing weeds in the row [
27,
28]. Through the individual analysis of the winegrower in the two questions, we can determine whether he uses herbicide when following the plant cover method between the rows, and in this case, 3 of the 10 winegrowers do not use herbicide in the row. Although the use of fungicide is not 100%, (a winegrower does not apply it) we have some doubts that the information is correct, due to the climate of the region, the usual practices and the type of agriculture practiced. In the case of insecticides, we also have the same doubts; however, it is not strange to not apply them. Therefore, further research is required to clarify this point in future research.
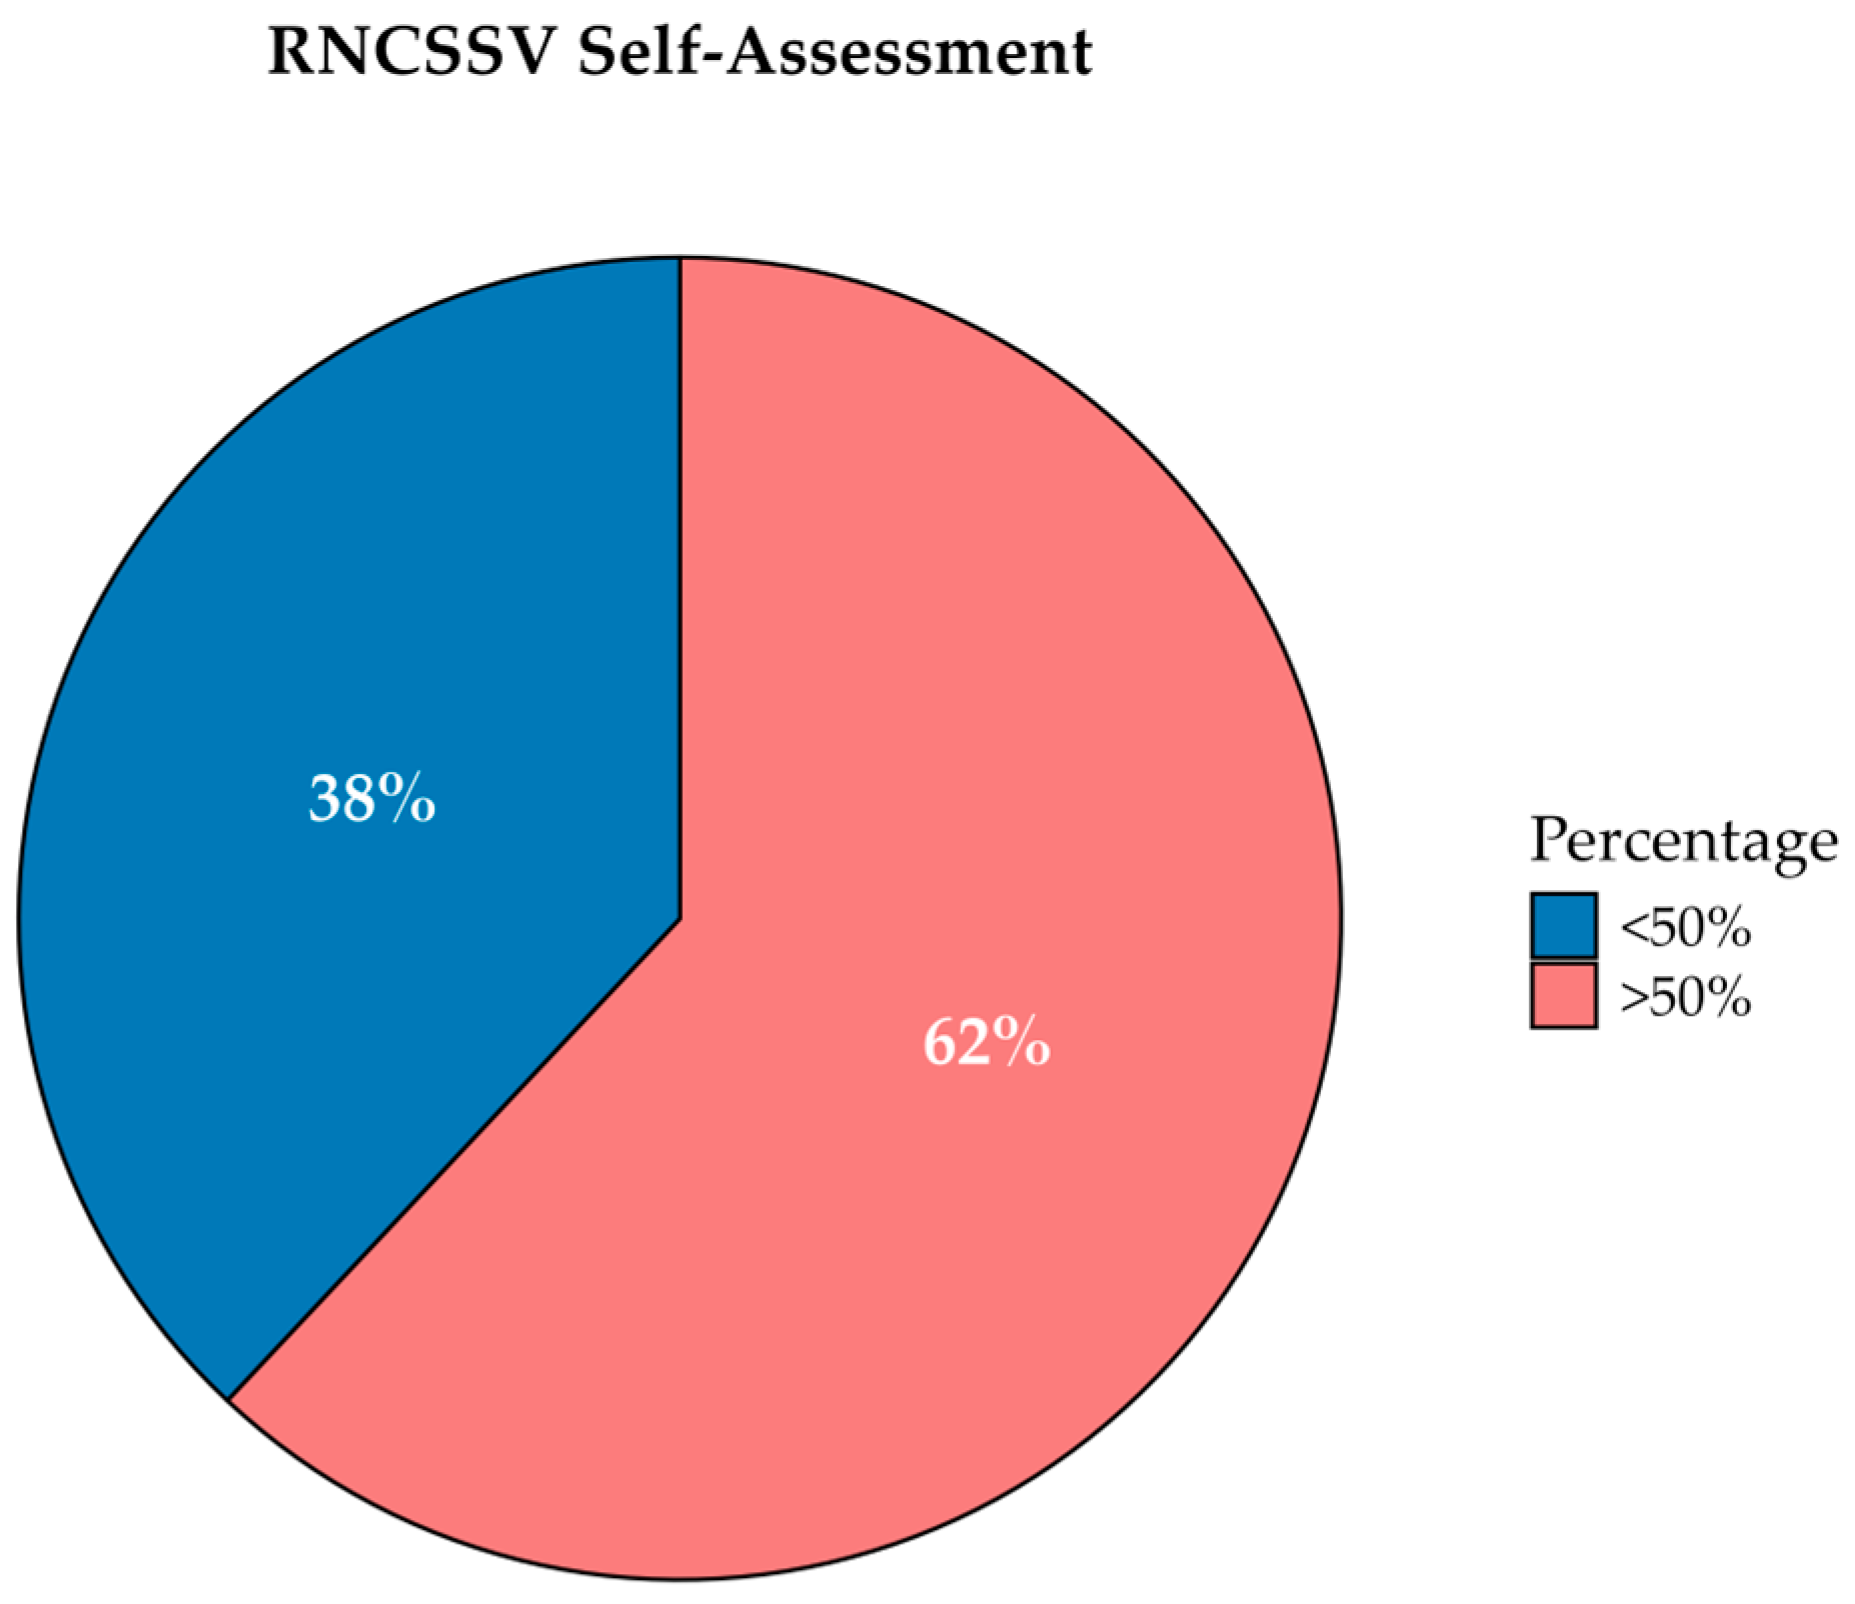
Finally, in relation to the main objective of the study, 62% of the companies achieved a self-assessment score above 50%, thereby qualifying for certification under the RNCSSV framework. However, the majority of family-run businesses scored below this threshold. As previously discussed, the limited degree of professionalization in such enterprises may hinder their organizational development and capacity to implement structured sustainability practices.
The uneven distribution of sustainability performance—strongly associated with the structural and operational characteristics of each enterprise—highlights the need for differentiated strategic approaches. Rather than relying solely on standardized compliance models, interventions should be tailored to the specific needs of each business type. This includes addressing technical, organizational, and strategic deficiencies that limit the ability of smaller and less formal enterprises to actively participate in sustainability transitions.
Although the sector is predominantly composed of family-run rather than entrepreneurial operations—a pattern reflected in this study—it is reasonable to assume that a sample larger than 3.3% of the cooperative’s membership could reveal additional operational realities. This is not necessarily in terms of enterprise size, but in aspects, such as organizational structure, cultural practices, pesticide use, energy consumption, and work organization. In fact, the absence of formal record-keeping among many producers posed a significant challenge to collecting consistent data on specific practices, such as pesticide application and whether field operations were carried out manually or mechanically.
Despite the internal coherence of the dataset, its relatively small size and localized scope (n = 16; 3.3% of the members) limit the statistical generalizability of the findings. Nevertheless, this methodological constraint is mitigated by the strong internal consistency of responses and the diversity represented within the sample. The 16 winegrowers surveyed account for approximately 21% of the total grape volume delivered to the winery, encompassing a wide range of vineyard sizes and operational profiles. This heterogeneity reinforces the value of intra-sample comparisons and provides a solid foundation for exploratory analysis. Rather than a weakness, the limited but representative sample offers valuable contributions to understanding broader sustainability transitions. Future studies should aim to expand the dataset and include a broader range of viticultural profiles and geographic contexts, thereby supporting more robust comparisons and a wider applicability of findings.
Moreover, reliance on self-reported data introduces potential bias. While some responses were informally verified through field visits and cross-checking with cooperative records, no systematic triangulation or observational validation was conducted. Future studies should incorporate such methods to enhance data reliability.
This study focused on a single cooperative in the Douro region, characterized by distinctive geographical, structural, and socio-economic conditions. Although the findings are context-specific, comparative analysis with other wine-producing regions—both within Portugal and internationally—would support benchmarking and allow broader generalization. Additionally, contrasting cooperative and non-cooperative structures could shed light on how different organizational models influence the implementation of sustainability practices, particularly regarding data availability, record-keeping, and technical support.
5. Conclusions
This study aimed to examine the challenges associated with implementing a sustainability benchmark in a cooperative winery. A key issue lies in addressing the raw-material indicator, which concerns a product not directly controlled by the winery itself but sourced from its members—producers who face various structural and operational limitations.
Notably, 57% of the respondents are structured as family-run companies, which often operate with informal or limited organizational systems. This characteristic was reflected in the self-assessment scores, where only one-third of these enterprises achieved a score above 50%, in contrast with other business types. Such structural informality represents a critical challenge not only for cooperative wineries but for the wine sector more broadly.
Despite these constraints, the survey results indicate a growing orientation toward sustainable viticulture. Although 7% of winegrowers still practice conventional agriculture, there is evidence of a shift toward nature-respecting practices, including regenerative agriculture and informal adherence to Integrated Production guidelines. These changes are reflected in reduced herbicide use (with 81% still applying them), and in efforts to maintain vegetative ground cover, which helps mitigate soil erosion and improve water retention. This practice also correlates with more stable grape yields, particularly in the presence of water availability.
Although the small sample size (3.3% of members) limits broad generalization, the inclusion of producers responsible for 21% of the cooperative’s grape volume—representing a range of vineyard sizes and business structures—adds value. These exploratory results provide a solid empirical foundation for future research and may inform targeted strategies to foster sustainability transitions in similar cooperative contexts.
The study also identified several methodological limitations. It was not possible to collect precise data on pesticide quantities or determine whether specific field operations were carried out manually or mechanically. Additionally, a lack of systematic record-keeping among producers constrained data reliability and completeness.
There is a clear need to develop simplified tools to support winegrowers in understanding and responding to sustainability benchmarks. Future research should focus on environmental sustainability within cooperatives and explore practical solutions for improving data collection, training, and operational organization.


 ,
, 
