Article

Humic Acids Properties of Luvisol of 40-Year Fertilizer Experiment

by
Bożena Dębska
*,† and
Magdalena Banach-Szott
Department of Biogeochemistry, Soil Science and Irrigation and Drainage, Bydgoszcz University of Science and Technology, 6 Bernardynska St., 85-029 Bydgoszcz, Poland
*
Author to whom correspondence should be addressed.
These authors contributed equally to this work.
Agronomy 2025, 15(6), 1405; https://doi.org/10.3390/agronomy15061405
Submission received: 9 May 2025 / Revised: 28 May 2025 / Accepted: 5 June 2025 / Published: 6 June 2025

Abstract

The purpose of this research was to determine the properties of humic acids isolated from soil samples taken from a 40-year static experiment—the experimental factors were fertilization with manure (30 t ha−1; FYM) and nitrogen at rates of 40, 60 and 120 t ha−1. From the soil samples (Luvisol), humic acids (HAs) were extracted and the following were determined: elemental composition, hydrophilic and hydrophobic properties and spectrometric properties in the UV–VIS and IR range. The HAs of the soil fertilized with manure and N compared to the HAs of the soil fertilized with N (without manure) were characterized by a higher degree of aliphaticity and, consequently, a higher share of hydrophilic fractions and lower values of internal oxidation. Based on the spectrometric parameters, it was indicated that the HA particles of the manure-fertilized soil are characterized by a higher share of undecomposed lignin fragments, a lower degree of humification and at the same time, a higher susceptibility to oxidation. The obtained relationships showed that the aromaticity and hydrophobicity of the HA molecules of the manure-fertilized soil can be increased at certain N doses (60 and 120 t ha−1), which is particularly important in terms of the role that humic substances play in carbon sequestration.

1. Introduction

One of the basic soil components that determines the edaphic properties of soils is organic matter (OM). The effect of organic matter on plant growth and nutrient uptake has long been reported, i.e., OM is one of the components that shapes soil fertility [1,2,3]. OM is a dynamic system and undergoes continuous transformations, i.e., mineralization and humification processes. Humification is a series of complex processes of decomposition, remodeling and synthesis of various organic compounds, which undergo condensation and polymerization processes. These transformations take place with the participation of microorganisms and soil micro- and mesofauna, and lead to the formation of humic substances (HS) [4,5]. Humic substances are not chemically defined compounds, but are a complex in which the aromatic nucleus is linked to aliphatic radicals (chain and heterocyclic). Humic substances include different groups of compounds, which were distinguished based on solubility in aqueous solutions of acids, bases and organic solvents. Based on solubility in aqueous solutions of acids and alkaline, three humic substance (HS) fractions were separated: humic acids (HAs, soluble in only alkaline medium), fulvic acids (FAs, soluble in acids and bases) and humins (H, insoluble in acids and alkaline) [6].
The humic acid fraction plays an important role in shaping the physical (e.g., stability of soil aggregates, soil density, water retention), chemical (buffering and sorption properties of soils) and biological properties of soils (biodiversity, energy source for microorganisms). Often, the content of the HA fraction is associated with the fertility of soils. Soils in which the HA fraction predominates over FAs are classified as more fertile soils [5,7,8,9]. According to data presented in the work of Olk et al. [10], humic acids play a huge role in detoxifying the soil environment and, through their participation in the global carbon cycle, play an important role in carbon sequestration [6].
The properties of humic acids, due to their polydisperse nature, are determined based on various instrumental methods, including elemental composition, UV–VIS and IR spectroscopy, 13CNMR and chromatography (HPLC, GCMS) [11,12,13,14,15,16,17,18]. Humic acids are composed of carbon, hydrogen, oxygen and nitrogen [19,20,21]. Their structure consists of an aromatic core, which is linked to amino acids, sugars, peptides, aliphatic acids and other aliphatic components. An important part of the structure of HAs is functional groups, e.g., carboxyl, phenolic, methoxyl, carbonyl, alcohol, etc., which determine many of their properties.
The properties of HAs are determined by the choice of plants in the rotation and the use of natural fertilizers (manure, slurry, liquid manure), organic fertilizers (composts, green manures) and mineral fertilizers [1,5,8,12,22,23,24,25].
Valuable information on the effect of agrotechnical treatments on the properties of humic acids is provided by long-term field experiments. Zhang et al. [25], on the basis of many years of experience, showed that fertilization of organic manure with and without NPK addition causes an increase in the degree of aliphaticity of humic acid molecules. Also, Mohammed et al. [26] showed, based on a 17-year experiment using swine manure, an increase in the degree of aliphaticity of humic acid molecules. However, the authors stressed that the intensity of the changes depended on the form in which the fertilizer was introduced (solid swine manure, liquid swine manure and swine manure compost). At the same time, they showed that left-over post-harvest residues (without fertilizers) caused an increase in the degree of aromaticity of soil HAs by incorporating condensed aromatic lignin fragments into the structure of HAs molecules. According to Zavyalova [27], the humic acids of soil without an inflow of fresh organic matter should be characterized by a high degree of maturity and the organic matter by a high degree of humification. According to previous studies, as the humification process progresses, the proportion of aromatic rings and their degree of condensation in HAs molecules increase [5,28,29,30,31,32,33].
Soil is a hard-to-renew resource of the natural environment that requires protection, shapes the landscape and provides the basis for human life. The problem of soil quality is constantly raised by the European Union. It should be emphasized that “healthy soil” is “healthy food”. Thus, in the search for methods of plant cultivation, the main task is, among other things, to increase soil fertility by improving the physical, chemical and biological parameters. As shown earlier, one of the main soil components shaping the above properties is humic acids. Therefore, research has been undertaken to determine the properties of humic acids isolated from soil samples taken from a 40-year static experiment in which the experimental factors were fertilization with manure and nitrogen at rates of 40, 60 and 120 t ha−1. Given the role played by HAs in the soil environment, this research is important for the quality (fertility) of soils and the stability of organic matter (limiting the release of CO2—reducing the greenhouse effect). A valuable aspect of the research presented in this paper is the choice of many years of experience. This choice will provide reliable information on the transformation of organic matter. Such knowledge will not be provided by results based on short-term experiments.

2. Materials and Methods

2.1. Experiment Design

The soil samples were sampled from a long-time field experiment that was established in 1979 at the experimental field WRiB PBŚ (Wierzchucinek, Kujawsko-Pomorskie province, Poland; 53°14′58″ N, 17°46′36″ E). The experiment was established on Luvisol with a grain size of sandy loam, carbon (TOC) content of 6.90 g kg−1 and nitrogen 0.78 g kg−1.
The experiment was carried out in a three-course crop rotation, potato, rice and rye, in a randomized split-plot design. The experiment was set up in four replications with the surface area of each plot 20 m2.
Factors of the experiment:
Factor I—dose of manure: 0 and 30 t ha−1;
Factor II—dose of nitrogen: 0, 40, 60, 120 kg ha−1.
The samples were taken after 40 years of experimentation from a depth of 0–30 cm. From each plot, 9 samples were taken randomly with Egner’s sampler. All the samples from the plot were combined and carefully mixed then dried at room temperature and sieved (2 mm).

2.2. Methods

From the soil samples the humic acids (HAs) were extracted by following the standard procedure described by Debska et al. [11]. In the humic acid preparations, the ash content was lower than 2%.
The humic acids separated were analyzed for the following:
Elemental composition (Perkin Elmer Series II 2400 CHN analyzer, Shelton, CT, USA)—results are presented in weight % ash-free dry weight and atomic %. The H/C, O/C, O/H, N/C atomic ratios and internal oxidation degree (ω = (2O + 3N–H)/C)) were calculated, where O, N, H, C—content in atomic %.
Hydrophilic and hydrophobic shares were determined with an HPLC Series 200 liquid chromatograph with an FL detector (Perkin-Elmer, Shelton, USA). The separation involved the use of an X-Terra C18 column, 5 μm, 250 × 4.6 mm. The solutions of humic acids were applied in 0.01 mol L−1 NaOH at the concentration of 2 mg mL−1; injection of the sample—10 μL; solvent—acetonitrile–water; solvent flow in the gradient. From the resulting chromatograms, the areas under the peaks were determined and the proportions of the hydrophilic (HIL) and hydrophobic fractions were calculated (HOB-1, HOB-2, HOB-3) [29].
UV–VIS absorption spectra (Perkin Elmer UV-VIS Spectrometer, Lambda 20, Ueberlinger, Germany). The absorbance measurement in the VIS range was performed for a 0.02% solution of humic acids in 0.1 mol L−1 NaOH, and in the UV range after a five-fold dilution. Absorbance was measured at 280 nm (A280), 400 nm (A400), 465 nm (A465), 600 nm (A600) and 665 nm (A665) to calculate the coefficient values:
A2/4—280 nm and 465 nm absorbance ratio;
A2/6—280 nm and 665 nm absorbance ratio;
A4/6—465 nm and 665 nm absorbance ratio;
ΔlogK = log A400 − log A600 [19].
Susceptibility to oxidation was determined with hydrogen peroxide through the measurement of decreased HA solutions’ absorbance (0.02% HAs and 1.5% H2O2 in 0.1 mol L−1 NaOH), at the wavelength of 465 and 665 nm (Perkin Elmer UV–VIS Spectrometer, Lambda 20, Ueberlinger, Germany). The susceptibility to oxidation was calculated from the following formula:
∆Au = (A − Au)/A∙100%
where A—initial absorbance (prior to adding H2O2); Au—absorbance after oxidation.
Infrared spectra (Perkin-Elmer FT-IR Spectrometer, Spectrum BX, Llantrisant, Great Britain) over 400–4400 cm−1 were obtained for HAs (3 mg) in KBr (800 mg). Deconvolution was applied, with a filter making the bands of γ = 4 narrower, and using the process of smoothing, for which the length parameter was l = 80% [29].

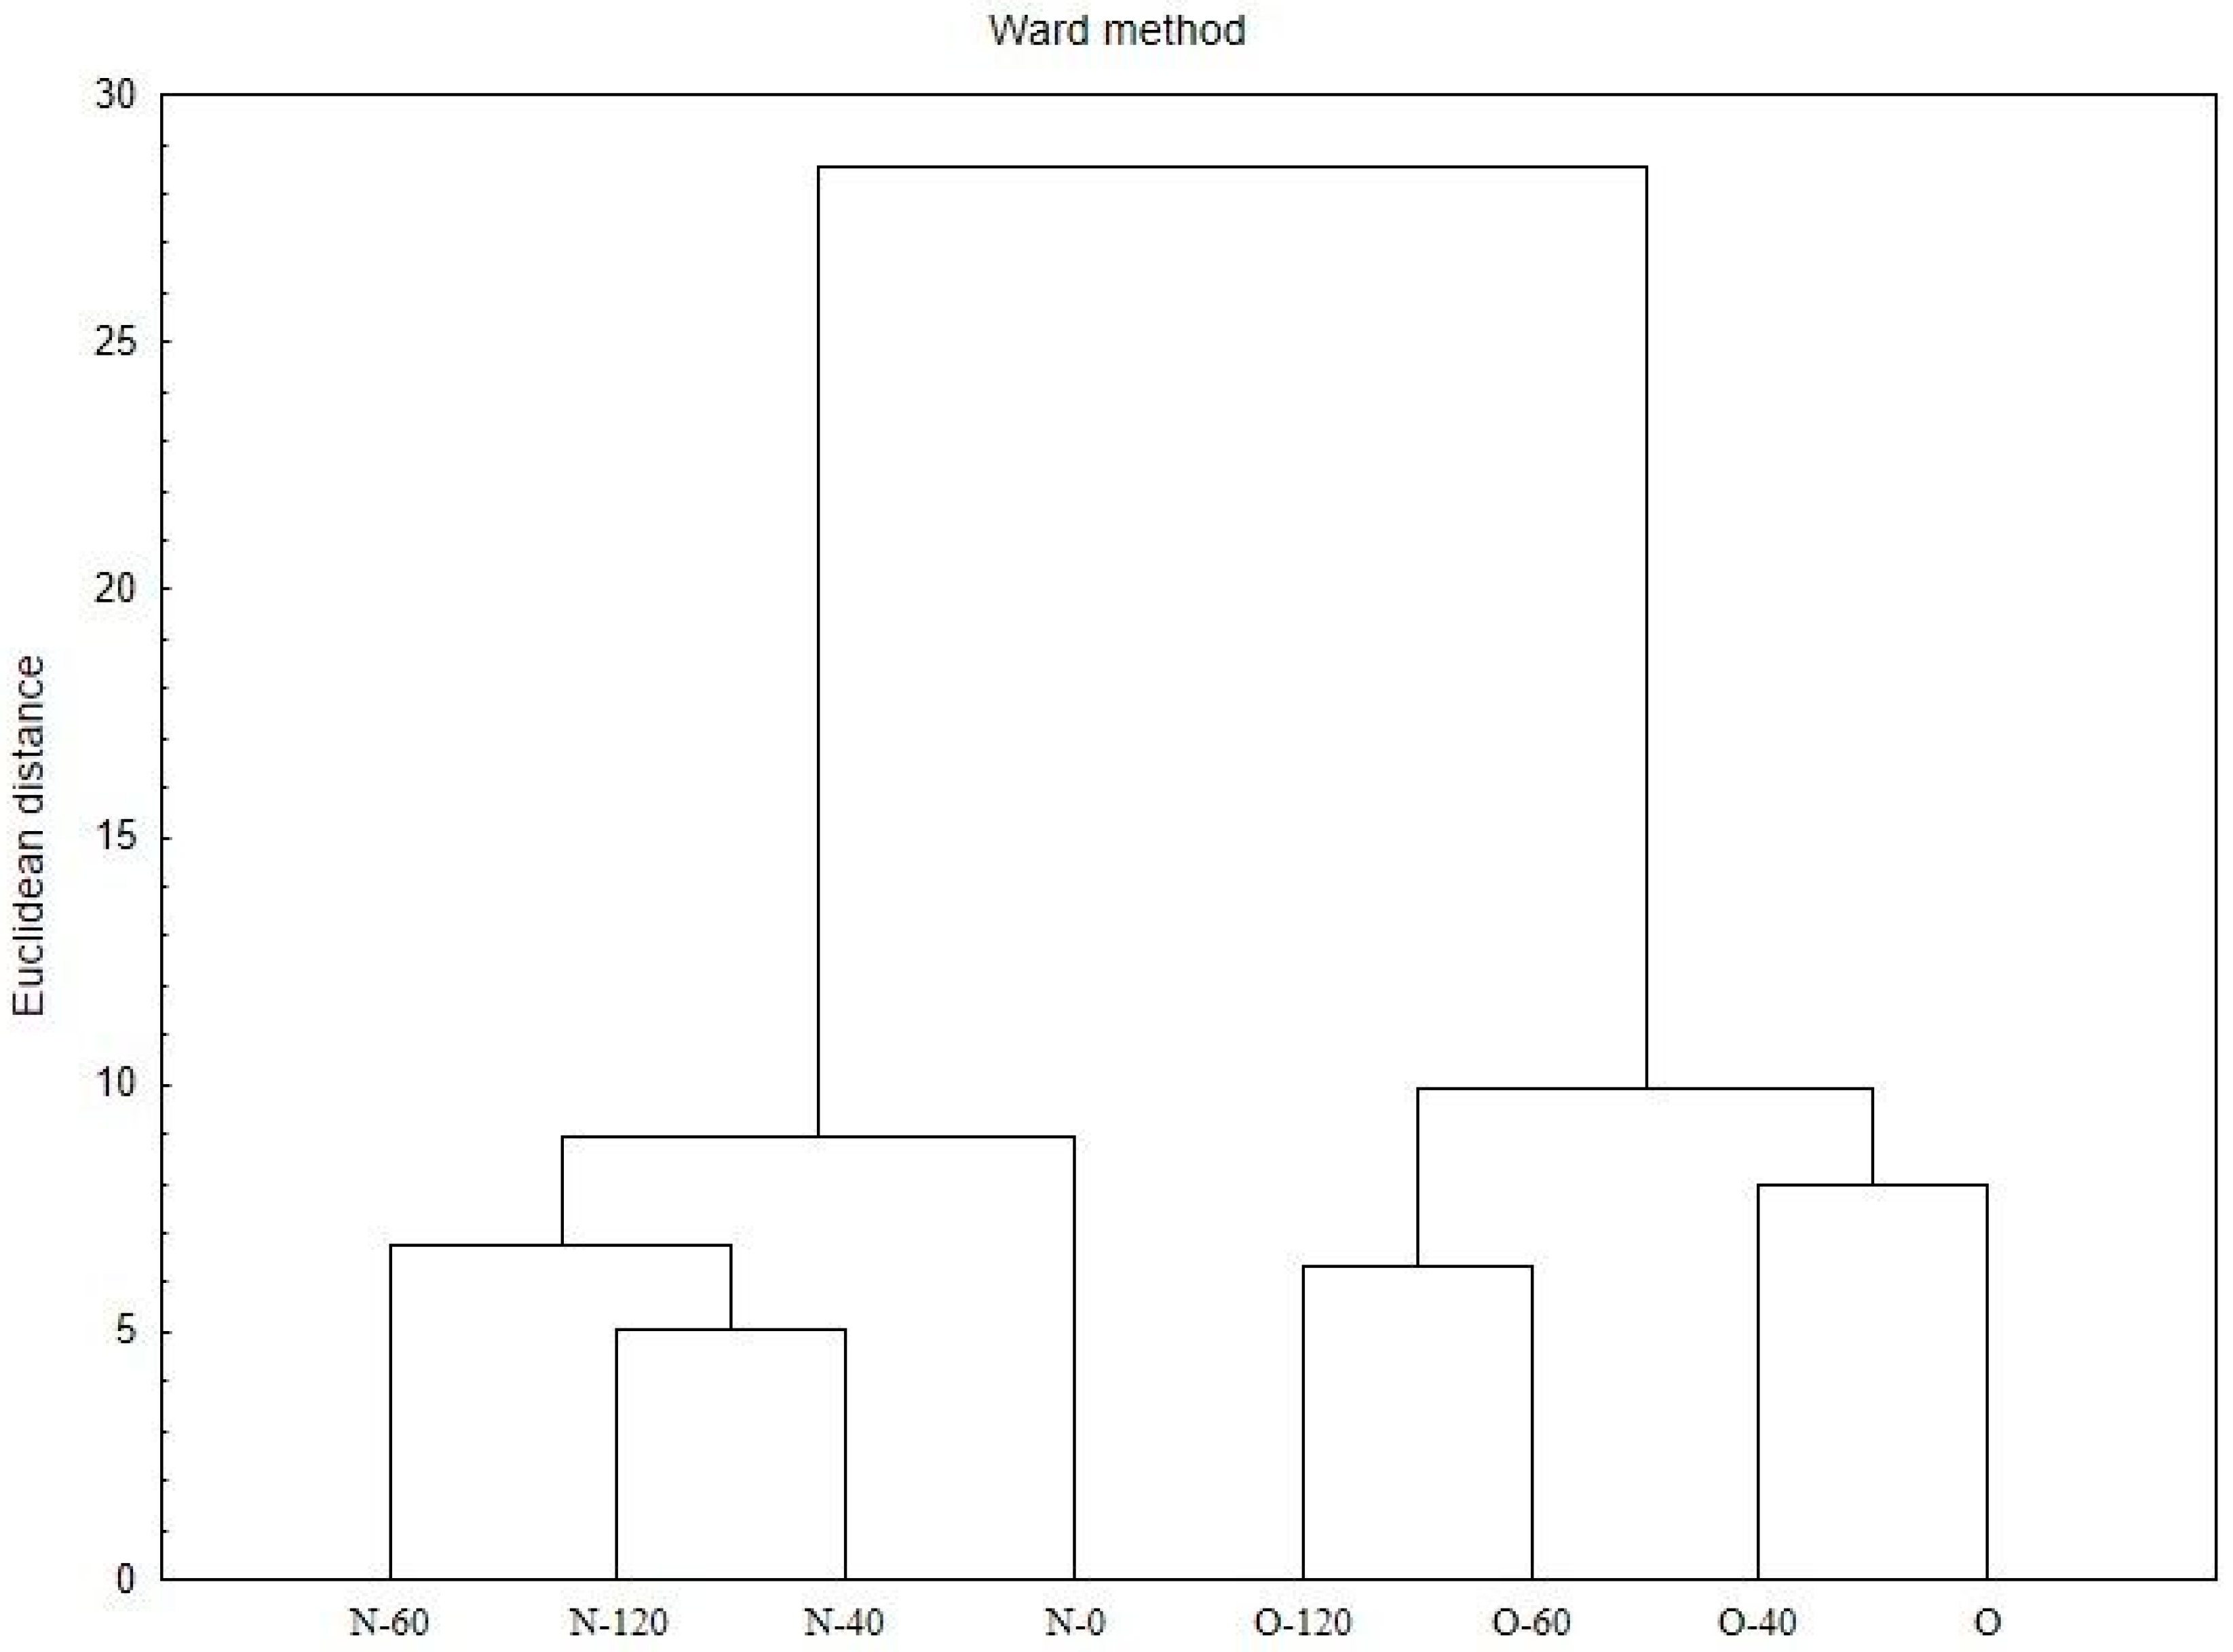
2.3. Statistical Analyses

A two-factors analysis of variance was used to determine the effect of FYM fertilization (0 and 30 FYM; Factor I), while the second was the mineral N fertilization (0, 40, 60 and 120 N; Factor II). In the event that significant treatment effects were found, Tukey’s test with a significance level p ≤ 0.05 was used to compare the means. Microsoft Excel-based FR-ANALWAR program was used for the calculations. A cluster analysis was performed to determine similarities/differences in HAs between the studied objects. Cluster analysis involves dividing a set of data into groups so as to obtain clusters in which the elements are similar to each other, yet different from the elements in the other groups [34]. Groups of similar treatments are presented in the form of a dendrogram. Within a given group, the smaller the Euclidean distance, the more similar the objects are to each other. Data clustering was performed with the Ward method. The analysis was performed after data were standardized. The above relationships were determined using statistics software STATISTICA MS 12 (StatSoft Inc., Tulsa, OK, USA).

3. Results

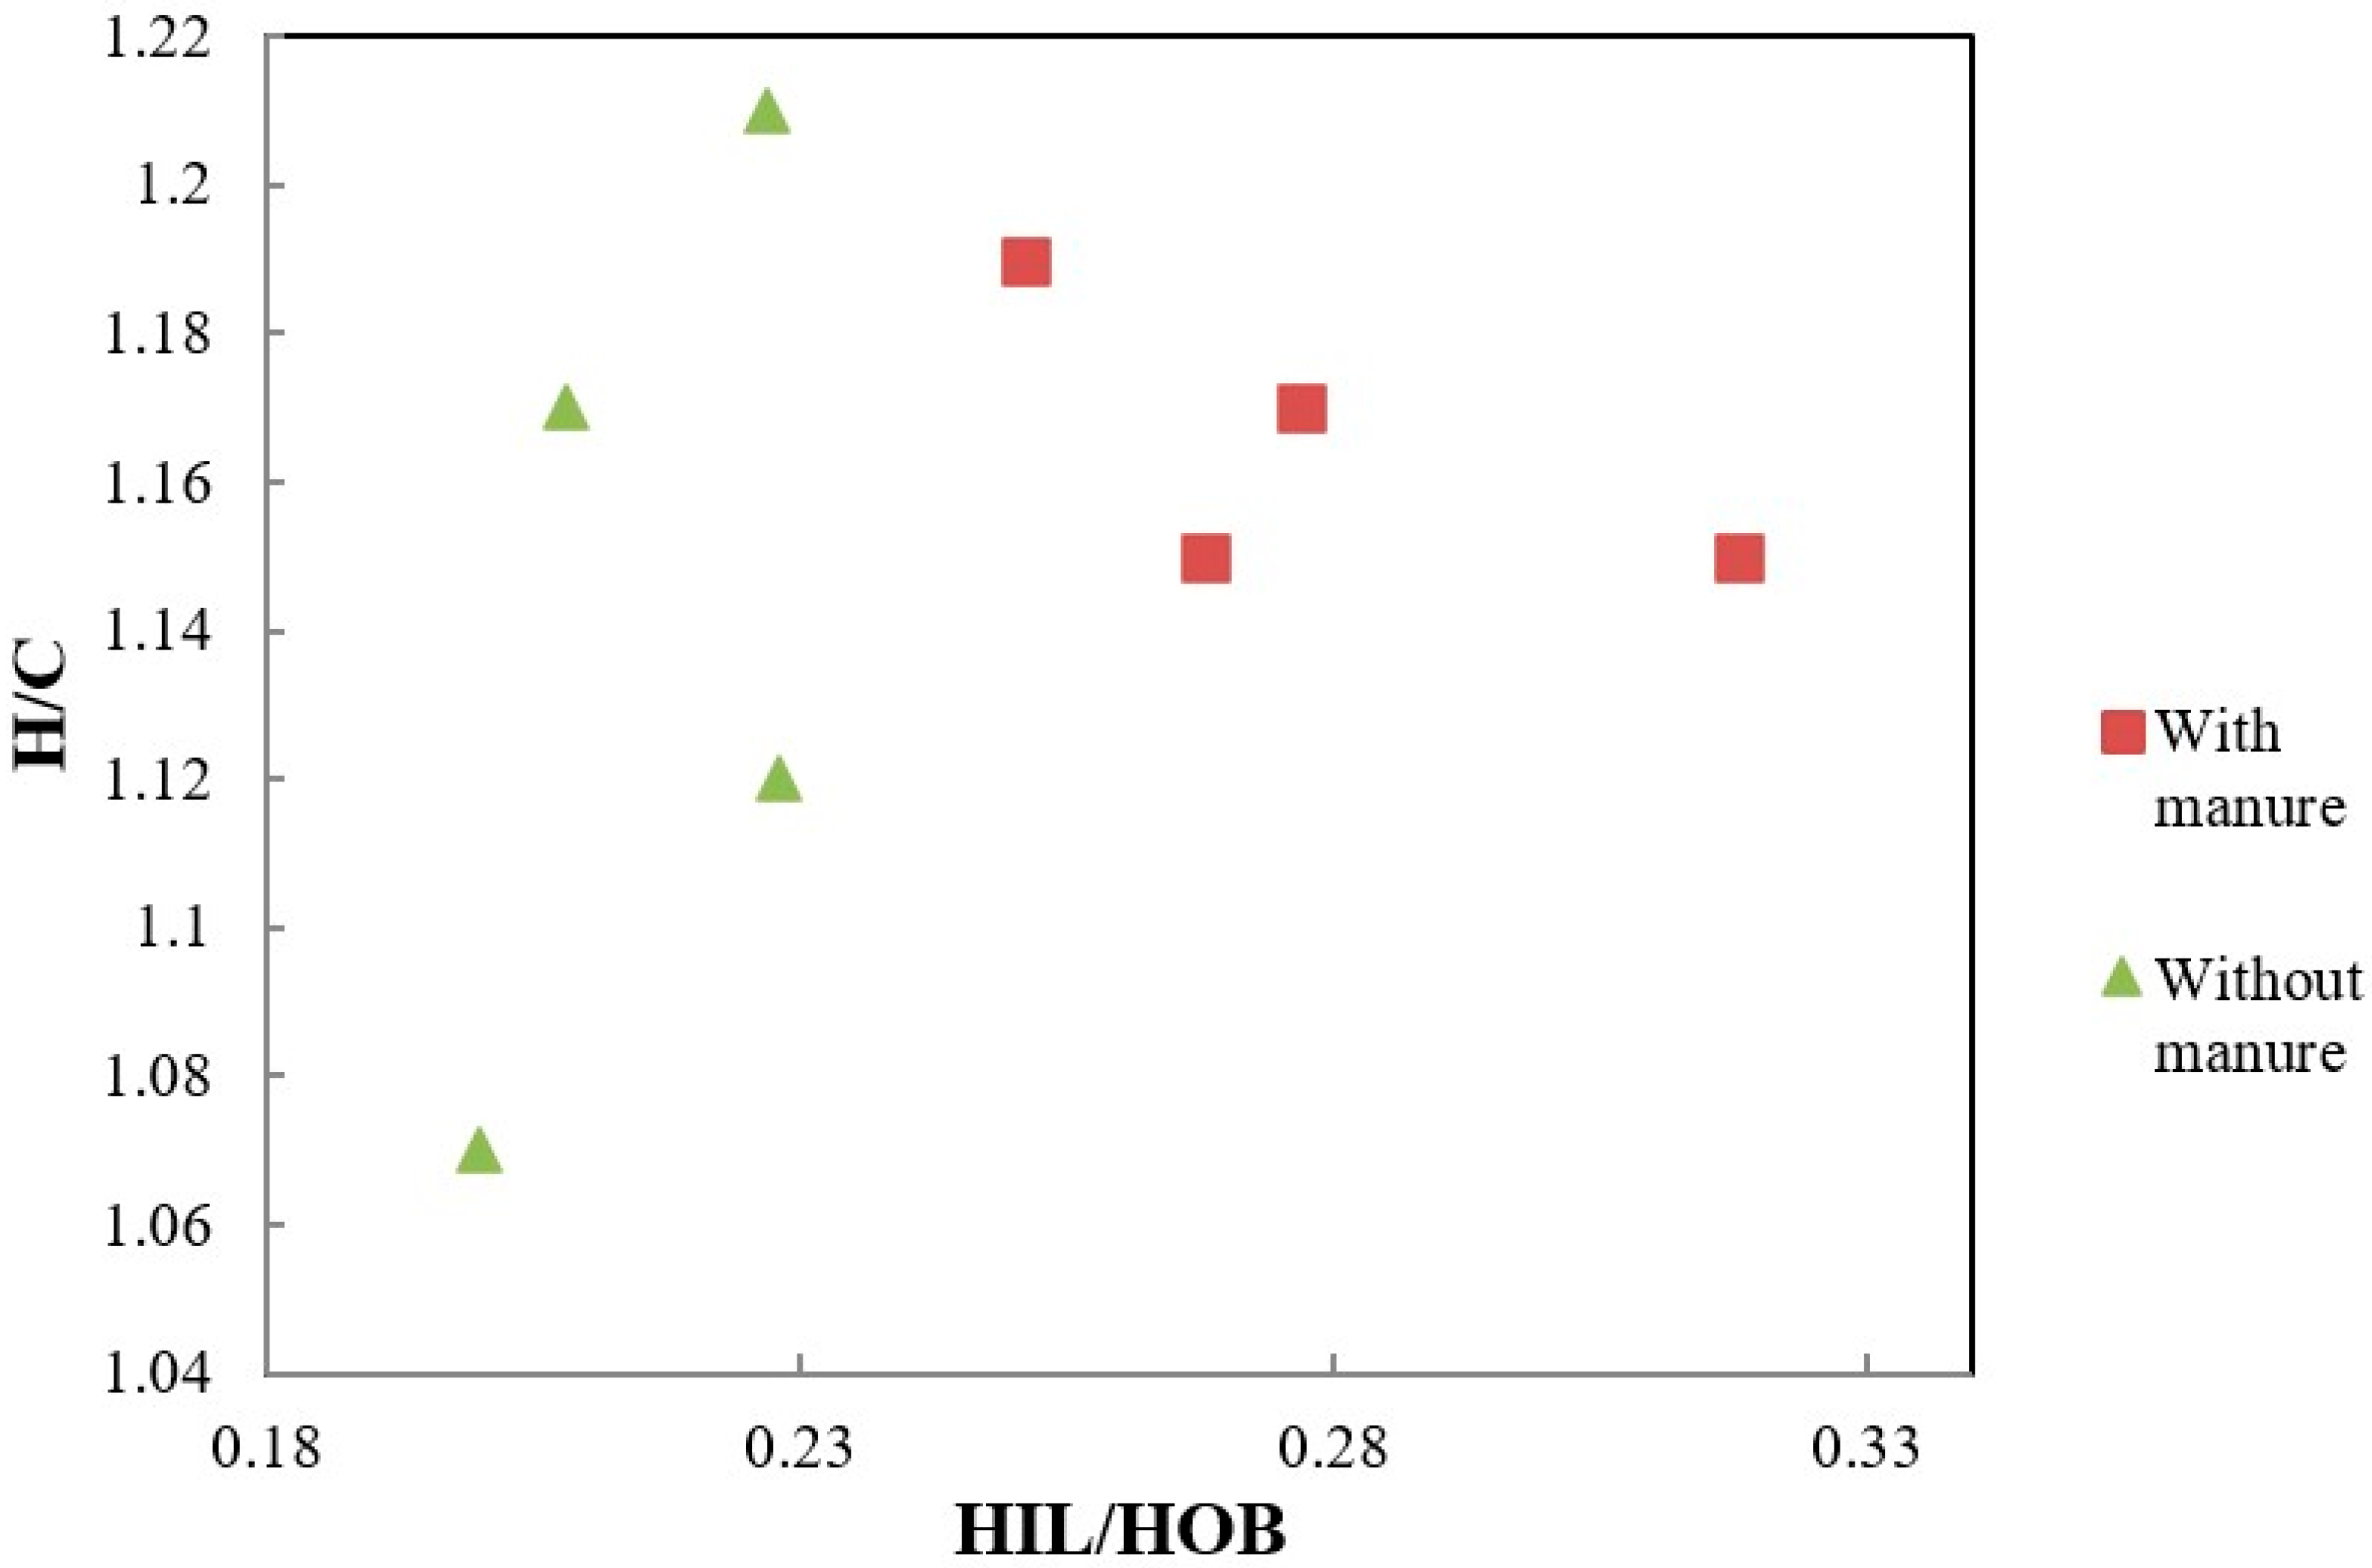
3.1. Elemental Analysis

The basic elements of which humic acids are composed are carbon, oxygen, nitrogen and hydrogen. As can be seen from the data presented in Table 1, in the molecules of humic acids, carbon is the dominant element (above 50%) followed by oxygen, while hydrogen accounted for only 4.69 to 5.40% and the share of nitrogen ranged from 4.46 to 4.97%.
The share of carbon was slightly higher in the HAs particles isolated from soil samples taken from variants with manure compared to the HAs of variants without manure. The humic acids of the soil fertilized with manure and the highest dose of nitrogen had the lowest carbon content (significant interaction). The share of hydrogen was also determined by fertilization. The HAs of the soil with manure (Factor I) were characterized by a higher share of hydrogen than the HAs of the soil without manure. The lowest share of hydrogen was recorded in the HAs particles of the soil of the variant with the highest nitrogen rate (60 and 120 kg ha−1) without and with the addition of manure. The share of nitrogen in the HAs molecules of the soils without manure was significantly lower in the HAs of the nitrogen-fertilized soil compared to the HAs of the control object. The mass share of oxygen in the humic acid molecules of the soil fertilized with N only was significantly higher compared to the soil without fertilization. For the variants with manure, the highest share of oxygen was characterized by the HAs of the soil without N fertilization and with the highest dose of nitrogen. It was also shown that nitrogen fertilization at a dose of 120 kg ha−1 causes an increase in (variants without manure) or stabilization of the share of oxygen in HAs particles. In order to approximate the structure of the humic acids, the elemental composition expressed in mass % was converted to atomic % (Table 2).
Hydrogen was the dominant element in the structure of the humic acids studied. Its atomic % ranged from 39.8 to 43.36% and was higher in the particles of the HAs of the manure-fertilized soil compared to the HAs of the soil without manure (the exception being the HAs of the soil without N fertilization). The next element in terms of its quantitative contribution was carbon. The proportion of carbon atoms in the HAs molecules ranged from 35.27 to 37.36%. There was no effect of manure fertilization on the share of carbon in the HAs molecules. Only for the variants without manure did N fertilization at doses of 60 and 120 kg ha−1 affect the share of C compared to the N0 and N40 variants. The share of oxygen was significantly higher in the HAs particles of the variants without manure (N40, N60 and N120). The HAs of the variants with the highest dose of nitrogen were characterized by the highest share of this element. The share of nitrogen in the structure of the HAs ranged from 2.64 (variant N0 with manure) to 2.89% (variant N60 without manure).
The consequences of the changes in elemental composition are the values of the ratios H/C, N/C, O/C and O/H and the values of the internal oxidation degree (ω) (Table 3). The values of the H/C ratio ranged from 1.07 to 1.21 and generally did not change under the influence of the factors studied. Only for the N60 and N120 without manure variants were lower H/C values obtained compared to the HAs of the other variants. The N/C ratio values ranged from 0.073 to 0.080 and did not depend on any of the factors. For the O/C and O/H parameters as well, no significant effect of fertilization on their values was recorded. The most sensitive parameter changing under fertilization with manure and/or nitrogen was the degree of internal oxidation (ω). The HAs of the soil fertilized with N alone were characterized by higher values compared to the HAs of the soil fertilized with manure. For both the variants with and without manure, the highest values of the internal oxidation degree were obtained for N120.

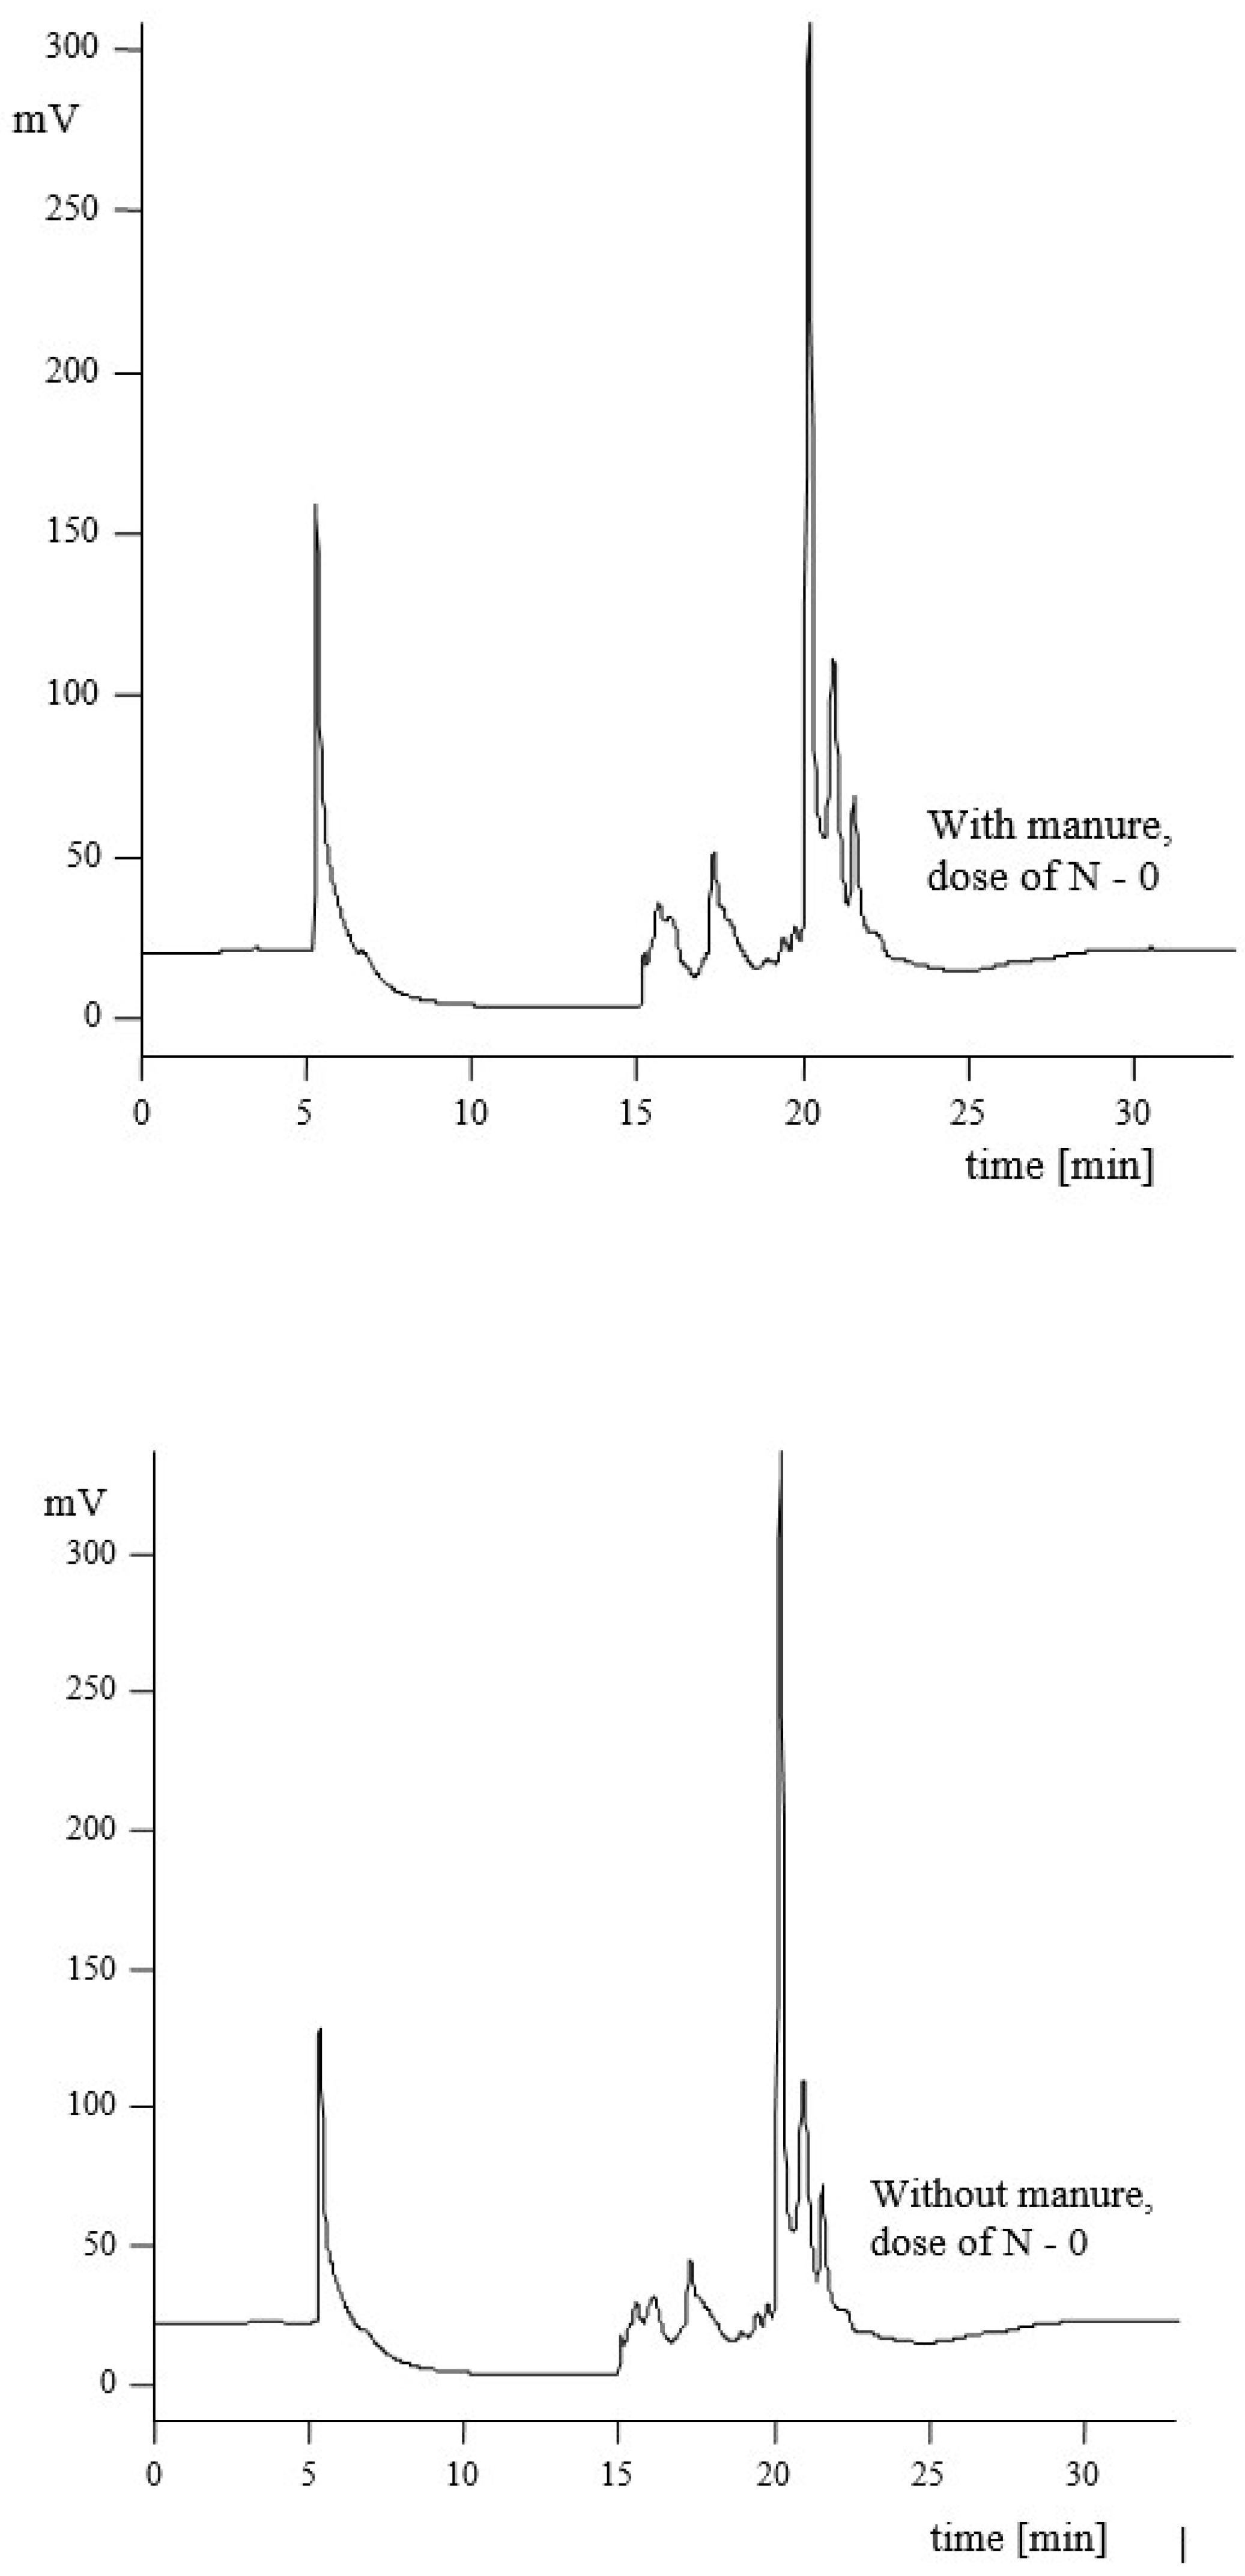
3.2. Hydrophilic–Hydrophobic Properties of Humic Acids

Figure 1 shows an example chromatogram of the HAs analyzed, where the hydrophilic and hydrophobic fractions are marked. The hydrophilic fraction occurred in the time interval from 5.3 to 7.0 min, the HOB-1 fraction from 15.0 to 16.8 min, HOB-2 from 16.9 to 18.7 min and HOB-3 from 19.5 to 22.2 min.
As can be seen from the values shown in Table 4, the fraction with the longest retention time, HOB-3, is dominant (51.19 to 59.73%). The share of the other hydrophobic fractions was much lower; the share of HOB-1 ranged from 9.67 to 11.40% and HOB-2 from 12.75 to 13.63%. The share of the hydrophilic fraction was higher than HOB-1 and HOB-2 and lower than HOB-3, and ranged from 16.65 to 24.09%. The share of HIL was significantly higher in the HAs particles of the manure-fertilized soil compared to the HAs of the soil without manure. Nitrogen fertilization generally resulted in a decrease in the share of hydrophilic fractions and an increase in the hydrophobic fraction with the longest retention time (HOB-3). The share of HOB-1 and HOB-2 fractions in the HAs particles was not determined by any of the factors studied. The consequences of changes in the proportion of hydrophilic and hydrophobic fractions are the obtained values of the HIL/ΣHOB ratio. The HAs of the manure-fertilized soil were characterized by higher values of this parameter compared to the HAs without manure. The highest values of HIL/ΣHOB-0.318 were obtained for the HAs of the soil fertilized with manure without nitrogen addition. In general, nitrogen fertilization reduced the HIL/ΣHOB values.

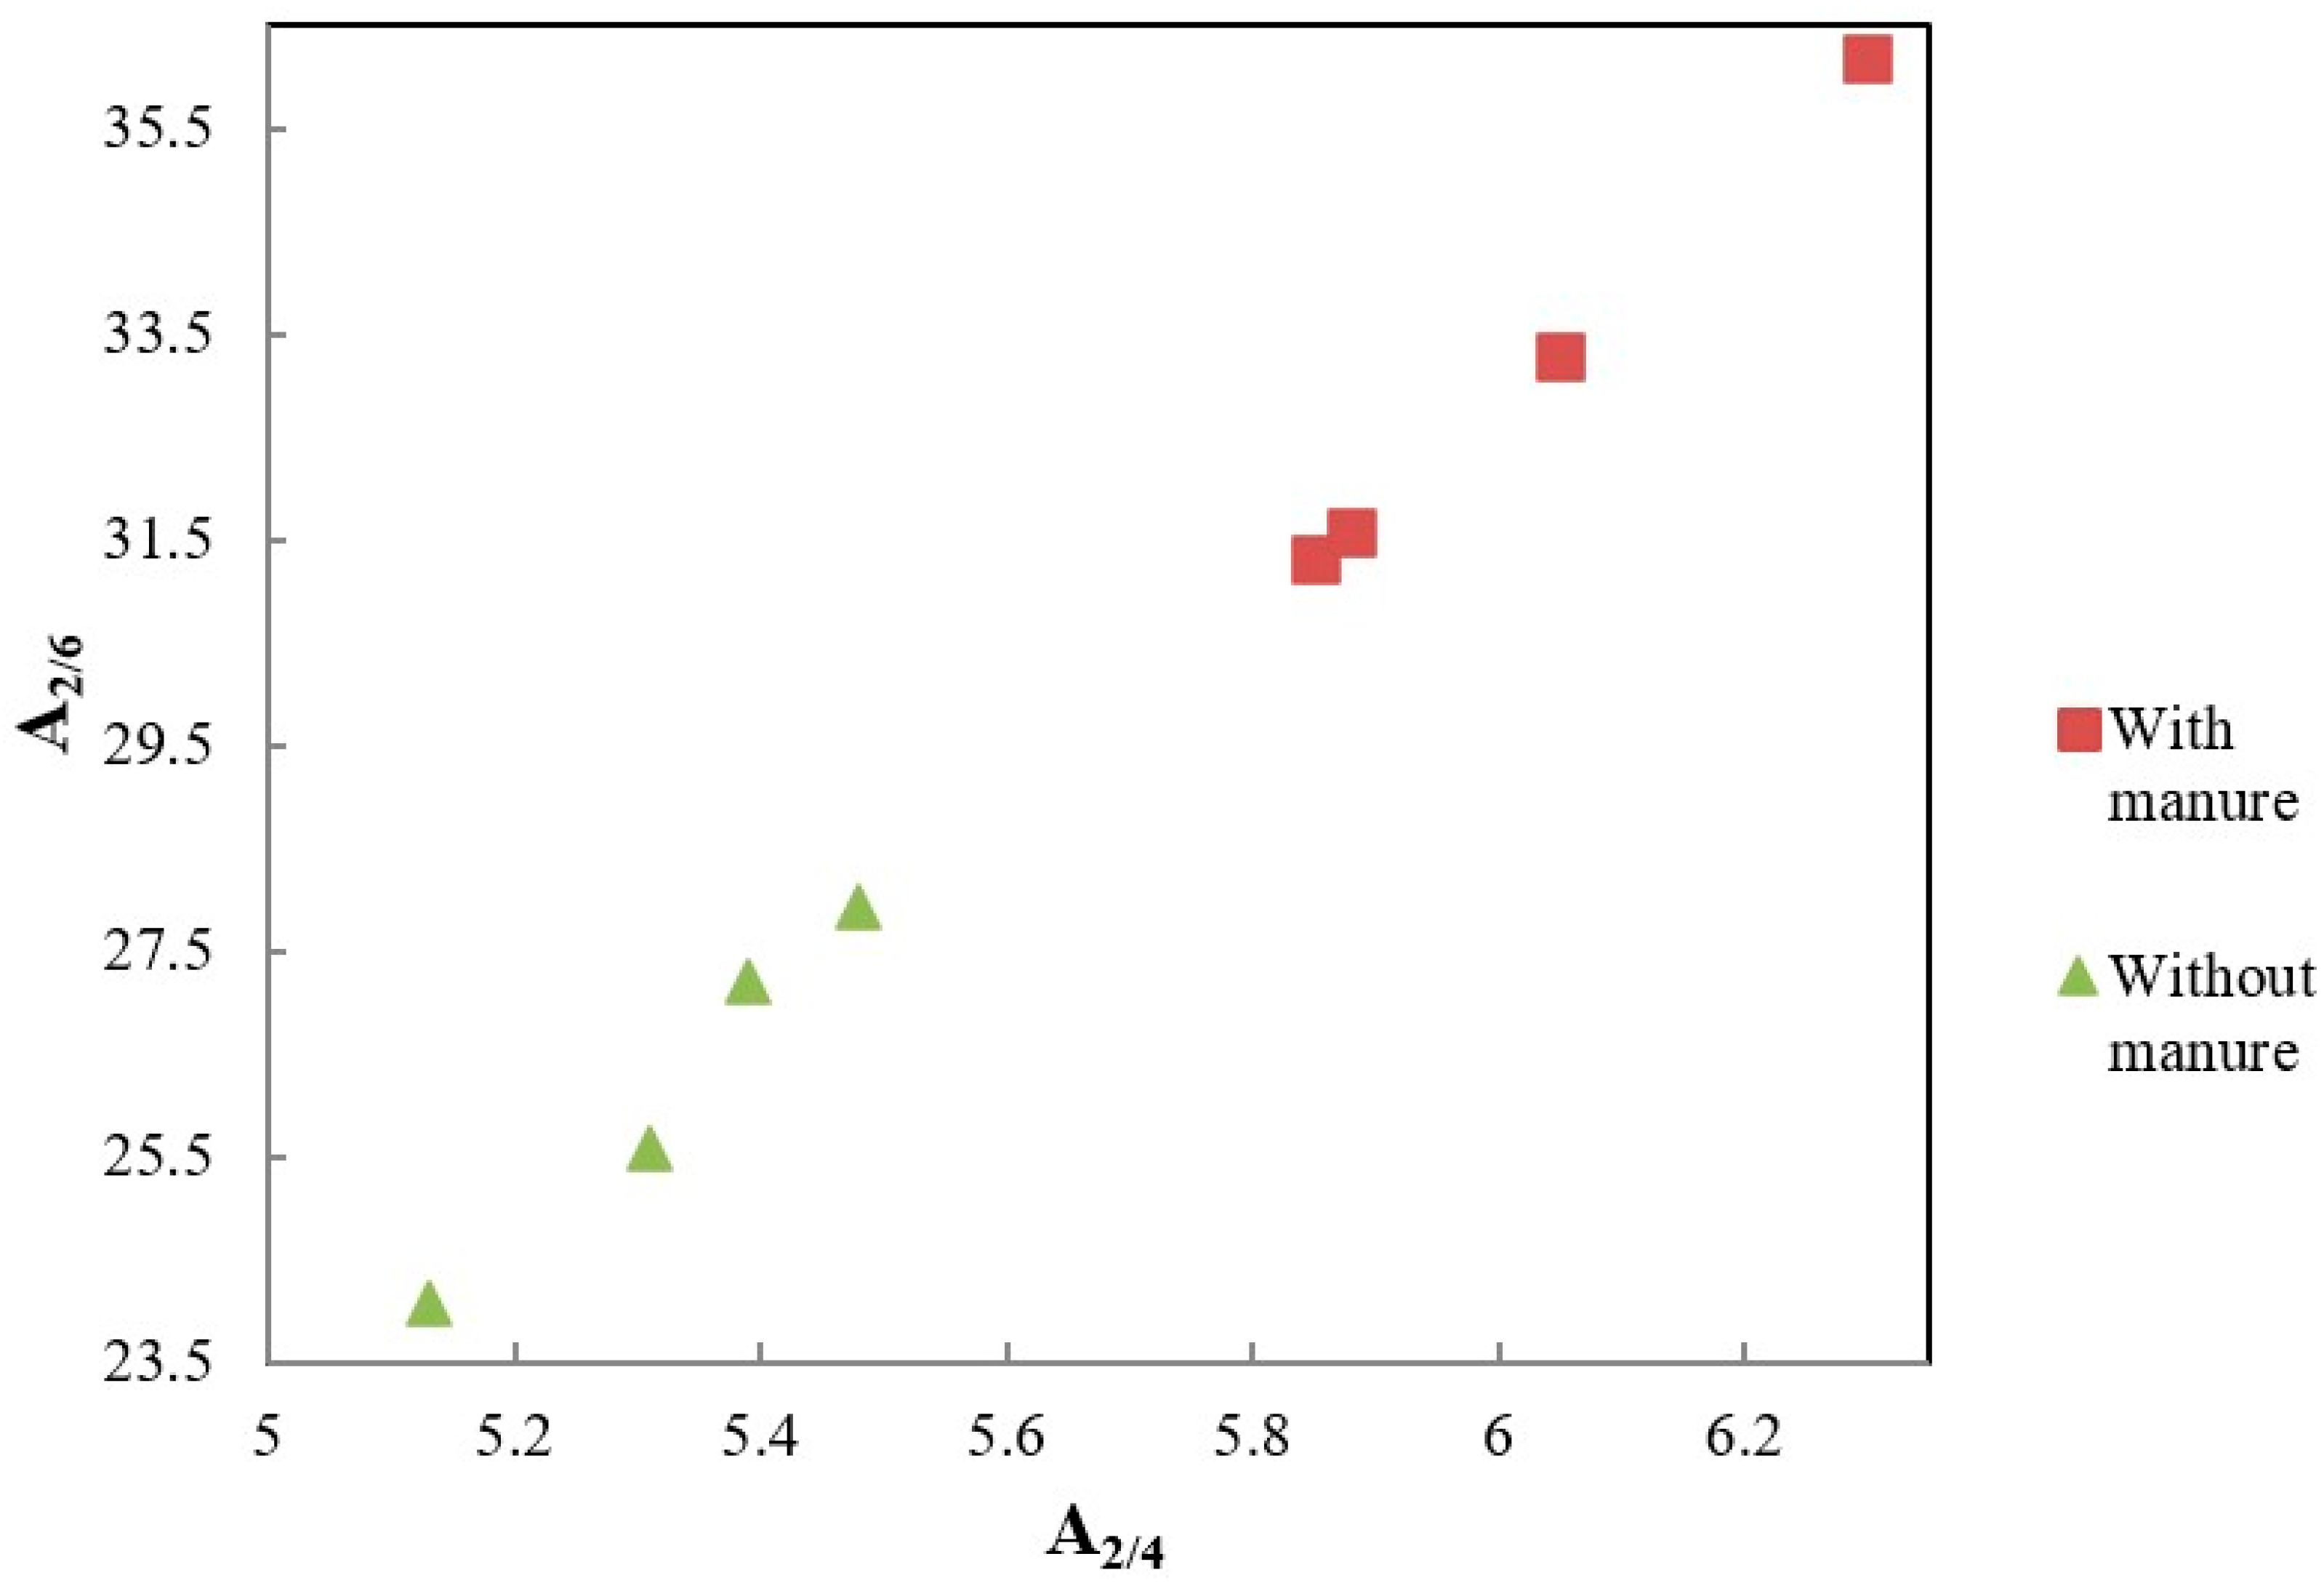
3.3. Spectrometric Properties of HAs

As reported in the literature [13,16,17,19,29], important indicators of the degree of maturity of humic acid molecules are calculated from the absorbance values at wavelengths 280, 400, 465, 600 and 665 nm and spectrometric parameters A2/4, A2/4, A4/6 and ΔlogK. The A2/4 values describe the ratio of decomposition-resistant lignin-type compounds (A280) to weakly humified organic matter (A465); A2/6 describes the ratio of decomposition-resistant lignin-type compounds to strongly humified organic matter A665; A4/6 and ΔlogK are indicators of the degree of HA maturity (OM humification).
The determined absorbance values and their coefficients are shown in Table 5 and Table 6. The HAs of the soil fertilized only with nitrogen (without the addition of manure) had higher absorbance values compared to the HAs of the soil with manure. However, no clear relationships were obtained between the nitrogen dose and the HAs absorbance values. The consequences of the changes in the absorbance values were the calculated values of the absorbance coefficients. The HAs of the manure-fertilized soil regardless of the nitrogen dose (Factor II) were characterized by higher values of A2/6, A2/4, A4/6 and ΔlogK compared to the HAs of the soil without manure. Measurements of the absorbance values were used to determine the oxidation susceptibility of the HAs (Table 5 and Table 6). The humic acids of the manure-fertilized soil were characterized by lower absorbance values of Au465 and Au665 and higher values of ΔAu465 and ΔAu665 compared to the HAs of the soil without manure. The ΔAu465 and ΔAu665 parameters determine the susceptibility to oxidation of HAs; the higher the values, the greater the susceptibility of HAs to oxidation [35,36]. No effect of the nitrogen dose on the values of the parameters discussed was obtained.

3.4. FT-IR Spectra

The FTIR spectra are shown in Figure 2. The FT-IR spectra of the analyzed humic acids were characterized by the presence of the following absorption bands: 3400–3100 cm−1 corresponding to O–H stretching of alcohols, phenols and acids, and N–H stretching; 3100–3000 cm−1 associated with the presence of C–H groups of aromatic and alicyclic compounds; 2960–2920 and 2850 cm−1 corresponding to asymmetric and symmetric C–H stretching of C–H3 and C–H2 group; 1730–1710 cm−1 band indicating the presence of C=O stretching of carboxyl, aldehyde and ketone group; 1660–1620 cm−1—C=O stretching of amide groups; N–H deformation; 1610–1600 cm−1 is associated with the presence of C–C stretching of aromatic rings; 1550–1530 cm−1 is N–H deformation, C=N stretching (amide II bands); 1520–1500 cm−1—C–C stretching of aromatic rings; 1460–1440 cm−1 corresponds to C–H bonds—asymmetric of C–H3 and C–H2; 1420–1400 cm−1—C=O stretching and O–H deformation of phenols groups; 1380–1320 cm−1—C=N aromatic amine, –COO, C–H stretching; 1280–1200 cm−1 corresponds to C–O bond stretching of aryl ethers, esters and phenols; and 1160–1030 cm−1; C=O stretching of alcohols, ethers and polysaccharides [13,15,24,37]. The HAs of the manure-fertilized soil, compared to the HAs of the soil without manure, generally had a higher band intensity in the following range: 2960–2920 and 2850 cm−1, 1460–1440 cm−1 and band 1160 cm−1. The HAs of the soil without manure compared to the HAs of the manure-fertilized soil were characterized by a higher intensity of the band 1730–1710 cm−1.

4. Discussion

Changes in the HAs properties of cultivated soils on which exogenous organic matter (EOM) fertilization, including manure, is applied continuously result in, among other things, a decrease in the degree of “maturity”, i.e., a decrease in aromatic carbon content and an increase in aliphatic carbon content [38,39,40]. These changes are a consequence of parallel processes of the humification of soil organic matter and EOM [39,41]. According to Mohammed et al. [26], after 17 years of swine manure application, the share of carbon, hydrogen and nitrogen in humic acid molecules increases, resulting in an increase in the H/C and N/C ratios and an increase in the O/C values. Zhang et al. [25], after 15 years of fertilization with manure in combination with NPK, also obtained an increase in the value of the H/C ratio, while for the HAs of variants fertilized with NPK, only a decrease in H/C. In the present experiment, after 40 years of fertilization with manure and/or N, there were no significant differences in the H/C values between N and manure fertilization. However, interactions were obtained that indicate differences between the variants depending on the nitrogen dose. Significantly higher values of the degree of internal oxidation (ω) were obtained for the HAs of the soil fertilized with N alone compared to the HAs fertilized with manure. In addition, it was observed that the degree of internal oxidation increases with the increase in the N dose. The highest values of this parameter were recorded for the N 120 variant without and with manure. Figure 3, showing the relationship between the values of H/C and ω, shows that N fertilization leads to an increase in the degree of aromaticity of humic acid molecules and the degree of oxidation. Confirmation of the above relationships is provided by the FTIR spectra (Figure 2), which showed that the HAs of the manure-fertilized soil were characterized by higher aliphaticity compared to the HAs of the non-manure-fertilized soil, while the soils fertilized with N alone had a higher share of carbonyl groups [13,15,24,37]. It should be noted that an increase in the proportion of aromatic structures in humic acid molecules leads to the stabilization of organic matter in soils, and consequently carbon sequestration [42].
As can be seen from the relationships shown in Figure 4 for the HAs of the soil fertilized with manure, we observe a decrease in the value of the A2/6 parameter with an increase in the N dose. For the HAs of the soil fertilized only with N, for doses of N60 and N120, a decrease in A2/6 and A4/6 was obtained. As reported earlier [13,16,17,19], coefficient A2/6 describes the ratio of decomposition-resistant lignin-type compounds (A280) to strongly humified organic matter (A665), while coefficient A4/6 is an indicator of the degree of HAs maturity (OM humification). HAs with lower A4/6 values are characterized by a higher degree of maturity compared to HAs with higher values of this parameter. Thus, it can be unequivocally concluded that the HAs of the soil fertilized only with N are characterized by a higher degree of humification compared to the HAs of the soil fertilized with manure without and with N. The obtained values of the discussed spectrometric parameters also indicate that nitrogen fertilization accelerates the decomposition of macromolecular organic compounds (lignins and their derivatives), introduced into the soil with manure and post-harvest residues, and thus leads to obtaining HAs with a higher degree of humification (decrease in A2/6 and A4/6 values).
In the graph showing the relationship between H/C and HIL/ΣHOB (Figure 5), there is a clear division into two areas: one includes the HAs of the soil fertilized with N alone, the other includes the HAs of the soil fertilized with manure and N.
The consequence of manure application is an increase in the degree of aliphaticity (increase in H/C ratio values) and the share of hydrophilic fractions in humic acid molecules (higher HIL/ΣHOB values). N fertilization increases the degree of aromaticity and hydrophobicity of HAs molecules. Song et al. [23] emphasize that the higher the share of hydrophobic fractions, the higher the stability of HAs molecules and the more intensive the carbon sequestration. Trubetskaya et al. [18] reported that HAs with a higher share of hydrophobic fractions are characterized by a higher molecular weight. Kumada [43] showed that the share of hydrophobic fractions in HAs molecules increases as the maturity of HAs increases. As can be seen from the relationships presented, HAs molecules with a higher degree of maturity are characterized by lower values of the HIL/ΣHOB ratio [41].
The determined quality parameters of HAs were used to perform cluster analysis. The relationships shown in the dendrogram (Figure 6) clearly indicate how great a role fertilization plays in shaping the properties of HAs molecules. On the dendrogram, the HAs analyzed were divided into two main groups: the first are the HAs of the soil fertilized with N and the HAs of the soil without fertilization, the second are the humic acids of the soil fertilized with manure and N and the soil fertilized only with manure. The second group includes two subgroups: the first includes the HAs of the soil fertilized with manure and N at 60 and 120 kg N ha−1, the second includes the HAs of the soil fertilized with manure without N and the soil fertilized with manure and N at 40 kg ha−1.
The results presented here indicate that in order to increase the stability of organic matter components, manure fertilization should be combined with an adequate dose of mineral fertilization. Changing lifestyles, with a strong emphasis on healthy food, are contributing to the development of organic farms. With the above in mind, the use of mineral fertilizers is increasingly being eliminated in agriculture. Therefore, special attention should be paid to the proper selection of plants in the rotation. It would be advisable to include in the rotation plants whose post-harvest residues will be a source of nitrogen in the soil.

5. Conclusions

The long-term application of manure and mineral fertilizers determines the properties of soil HAs. The HAs molecules of the soil fertilized with manure and N (40, 60, 120 kg ha−1) at different rates compared to the HAs of the soil fertilized with N alone were characterized by a higher degree of aliphaticity (higher H/C values and band intensities: 2960–2920 and 2850 cm−1) and consequently a higher share of hydrophilic fractions and a lower degree of internal oxidation. Spectrometric parameters indicate a higher proportion of undecomposed lignin fragments and, at the same time, a higher susceptibility to oxidation of the HAs molecules of the manure-fertilized soil compared to only the N-fertilized soil. The obtained relationships also indicate that the aromaticity and hydrophobicity of the HAs particles of manure-fertilized soil can be increased at higher N doses (60 and 120 kg ha−1), which is particularly important in terms of the role humic substances play in carbon sequestration. An increase in organic matter content as a consequence of an increase in the stability of humic acid molecules will affect soil quality (including structure, sorption and buffering capacity). Soil quality, in turn, will shape the yield and its health parameters (“healthy soil” is “healthy food”).

Author Contributions

Conceptualization, B.D. and M.B.-S.; data curation, B.D. and M.B.-S.; formal analysis, B.D. and M.B.-S.; investigation, B.D. and M.B.-S.; methodology, B.D. and M.B.-S.; writing—original draft, B.D. and M.B.-S.; writing—review and editing, B.D. and M.B.-S. All authors have read and agreed to the published version of the manuscript.

Funding

The research has been made as part of BN-WRiB-1/2022 research project, Bydgoszcz University of Science and Technology.

Data Availability Statement

The original contributions presented in this study are included in the article. Further inquiries can be directed to the corresponding author.

Conflicts of Interest

The authors declare no conflicts of interest.

References

  1. Cao, Z.Y.; Wang, Y.; Li, J.; Zhang, J.J.; He, N.P. Soil organic carbon contents, aggregate stability, and humic acid composition in different alpine grasslands in Qinghai-Tibet plateau. J. Mt. Sci. 2016, 13, 2015–2027. [Google Scholar] [CrossRef]
  2. Chen, H.; Hou, R.; Gong, Y.; Li, H.; Fan, M.; Kuzyakov, Y. Effects of 11 years of conservation tillage on soil organic matter fractions in wheat monoculture in Loess Plateau of China. Soil Till. Res. 2009, 106, 85–94. [Google Scholar] [CrossRef]
  3. Zhao, S.; Yu, F.; Zhai, C.; Zhong, R.; Zhao, Y.; Wang, Y.; Zhang, J.; Meng, Q. Long-term effects of cattle manure application on the soil aggregate stability of salt-affected soil on the Songnen Plain of North-Eastern China. J. Soils Sediments 2023, 23, 344–354. [Google Scholar] [CrossRef]
  4. Bezuglova, O.; Komarov, A.; Komarov, A. Identification of humic substances on the transformation of an organic substrate. Eurasian J. Soil Sci. 2022, 11, 10–16. [Google Scholar] [CrossRef]
  5. Orlov, D.S. Humus Acids of Soils, 1st ed.; Balkema: Rotterdam, The Netherlands, 1986. [Google Scholar]
  6. Weber, J.; Chen, Y.; Jamroz, E.; Miano, T. Preface: Humic substances in the environment. J. Soils Sediments 2018, 18, 2665–2667. [Google Scholar] [CrossRef]
  7. Debska, B.; Dlugosz, J.; Piotrowska-Dlugosz, A.; Banach-Szott, M. The impact of bio-fertilizer on the soil organic matter status and carbon sequestration-results from a fiel-scale study. J. Soils Sediments 2016, 16, 2335–2343. [Google Scholar] [CrossRef]
  8. Kwiatkowska-Malina, J. The comparison of the structure of humic acids from soil amended with different sources of organic matter. Pol. J. Soil Sci. 2015, 48, 57–64. [Google Scholar] [CrossRef]
  9. Schindler, F.V.; Mercer, E.J.; Rice, J.A. Chemical characteristics of glomalin-related soil protein (GRSP) extracted from soils of varying organic matter content. Soil Biol. Biochem. 2007, 39, 320–329. [Google Scholar] [CrossRef]
  10. Olk, D.C.; Bloom, P.R.; De Nobili, M.; Chen, Y.; McKnight, D.M.; Wells, M.J.M.; Weber, J. Using humic fractions to understand natural organic matter processes in soil and water: Selected studies and applications. J. Environ. Qual. 2019, 48, 1633–1643. [Google Scholar] [CrossRef]
  11. Debska, B.; Banach-Szott, M.; Dziamski, A.; Gonet, S.S. Chromatographic characteristics (HPLC, HPSEC) of humic acids of soil fertilized with various organic fertilizers. Chem. Ecol. 2010, 26, 49–57. [Google Scholar] [CrossRef]
  12. Debska, B.; Drąg, M.; Tobiasova, E. Effect of post-harvest residue of maize, rapeseed, and sunflower on humic acids properties in various soils. Pol. J. Environ. Stud. 2012, 21, 603–613. [Google Scholar]
  13. Enev, V.; Pospisilova, L.; Klucakova, M.; Liptaj, T.; Doskocil, L. Spectral characterization of selected humic substances. Soil Water Res. 2014, 9, 9–17. [Google Scholar] [CrossRef]
  14. Ferreira, F.P.; Vidal-Torrado, P.; Otero, X.L.; Buurman, P.; Martin-Neto, L.; Boluda, R.; Macias, F. Chemical and spectroscopic characteristics of humic acids in marshes from the Iberian Peninsula. J. Soils Sediments 2013, 13, 253–264. [Google Scholar] [CrossRef]
  15. Hayes, M.H.B.; Swift, R.S. An appreciation of the contribution of Frank Stevenson to the advancement of studies of soil organic matter and humic substances. J. Soils Sediments 2018, 18, 1212–1231. [Google Scholar] [CrossRef]
  16. Rodriguez, F.J.; Schlenger, P.; García-Valverde, M. Monitoring changes in the structure and properties of humic substances following ozonation using UV-Vis, FTIR and H NMR techniques. Sci. Total Environ. 2016, 541, 626–637. [Google Scholar] [CrossRef]
  17. Tinoco, P.; Almendros, G.; Francisco, J.; Gonzalez-Vila, F.J.; Sanz, J.; Gonzalez-Perez, J.A. Revisiting molecular characteristics responsive for the aromaticity of soil humic acids. J. Soils Sediments 2015, 15, 781–791. [Google Scholar] [CrossRef]
  18. Trubetskaya, O.; Trubetskoj, O.; Richard, C. Hydrophobicity of electrophoretic fractions of different soil humic acids. J. Soils Sediments 2014, 14, 292–297. [Google Scholar] [CrossRef]
  19. Kumada, K. Chemistry of Soil Organic Matter, 1st ed.; Elsevier: Amsterdam, The Netherlands, 1988. [Google Scholar]
  20. Senesi, N. Binding mechanisms of pesticides to soil humic substances. Sci. Total Environ. 1992, 123–124, 63–76. [Google Scholar] [CrossRef]
  21. Stevenson, F.J. Reactive functional groups of humic substances. In Humus Chemistry; Genesis, Composition, Reactions; John Wiley & Sons, Inc.: New York, NY, USA, 1982; pp. 221–243. [Google Scholar]
  22. Dou, S.; Zhang, J.J.; Li, K. Effect of organic matter applications 13C-NMR spectra of humic acids of soil. Eur. J. Soil. Sci. 2008, 59, 532–539. [Google Scholar] [CrossRef]
  23. Song, X.; Liu, J.; Jin, S.; He, X.; Liu, S.; Kong, X.; Dong, F. Differences of C sequestration in functional groups of soil humic acid under long term application of manure and chemical fertilizers in North China. Soil Till. Res. 2018, 176, 51–56. [Google Scholar] [CrossRef]
  24. Zhang, J.; Wang, J.; An, T.; Wei, D.; Chi, F.; Zhou, B. Effects of long-term fertilization on soil humic acid composition and structure in Black Soil. PLoS ONE 2017, 12, e0186918. [Google Scholar] [CrossRef] [PubMed]
  25. Zhang, J.; An, T.; Chi, F.; Wei, D.; Zhou, B.; Hao, X.; Jin, L.; Wang, J. Evolution over years of structural characteristics of humic acids in Black Soil as a function of various fertilization treatments. J. Soils Sediments 2019, 19, 1959–1969. [Google Scholar] [CrossRef]
  26. Mohammed, I.; Kodaolu, B.; Zhang, T.; Wang, Y.; Audette, Y.; Longstaffe, J. Analysis of molecular structure changes in humic acids from manure-amended soils over 17-years using elemental analysis and Solid-State 13C Nuclear Magnetic Resonance Spectroscopy. Soil Syst. 2023, 7, 76. [Google Scholar] [CrossRef]
  27. Zavyalova, N.E. Elemental composition of humic acids of Sod-Podzolic Clay Loam Soil of Cisuralia during long-term use of fertilizer systems. Russ. Agric. Sci. 2011, 37, 140–142. [Google Scholar] [CrossRef]
  28. Banach-Szott, M.; Jaskulska, I.; Debska, B.; Jaskulski, D. Effect of the tillage system on the properties of humic acids of soil of the Kujawy Region in Poland. J. Agric. Sci. 2020, 12, 14–24. [Google Scholar] [CrossRef]
  29. Banach-Szott, M.; Debska, B.; Tobiasova, E. Properties of humic acids depending on the land use in different parts of Slovakia. Environ. Sci. Pollut. Res. 2021, 28, 58068–58080. [Google Scholar] [CrossRef] [PubMed]
  30. Gonet, S.S.; Debska, B. Properties of humic acids developed during humification process of post-harvest plant residues. Environ. Int. 1998, 24, 603–608. [Google Scholar] [CrossRef]
  31. Gonet, S.S.; Debska, B. Properties of humic acids produced during decomposition of plant residues in soil. Rostl. Vyrob. 1999, 45, 455–460. [Google Scholar]
  32. Ikeya, K.; Sleighter, R.L.; Hatcher, P.G.; Watanabe, A. Characterization of the chemical composition of soil humic acids using Fourier transform ion cyclotron resonance mass spectrometry. Geochim. Cosmochim. Acta 2015, 153, 169–182. [Google Scholar] [CrossRef]
  33. Zhang, Y.; Dou, S.; Ma, R.; Zhang, D.; Ndzelu, B.S.; Zhou, J.; Yang, H. Effects of returning corn straw incorporated with fungi, and fermented corn straw on soil humic acid structural characteristics. J. Soils Sediments 2023, 23, 2048–2064. [Google Scholar] [CrossRef]
  34. Ward, J.H. Hierarchical grouping to optimise an objective function. J. Am. Stat. Assoc. 1963, 58, 236–244. [Google Scholar] [CrossRef]
  35. Drag, M.; Debska, B.; Dziamski, A. Properties of humic substances of forest and meadow soil in the area of the Wierzchlas Reserve. Humic Subst. Ecosys. 2007, 7, 141–151. [Google Scholar]
  36. Kobierski, M.; Banach-Szott, M. Organic matter in Riverbank Sediments and Fluvisols from the flood zones of Lower Vistula River. Agronomy 2022, 12, 536. [Google Scholar] [CrossRef]
  37. Mathew, J.; Gopinath, A.; Vareed, R.A. Spectroscopic characterization of humic substances isolated from tropical mangrove sediments. Arab. J. Geosci. 2021, 14, 668. [Google Scholar] [CrossRef]
  38. Dorado, J.; Zancada, M.-C.; Almendros, G.; Lopez-Fando, C. Changes in soil properties and humic substances after long-term amendments with manure and crop residues in dryland farming systems. J. Plant Nutr. Soil Sci. 2003, 166, 31–38. [Google Scholar] [CrossRef]
  39. Kawasaki, S.; Maie, N.; Kitamura, S.; Watanabe, A. Effect of organic amendment on amount and chemical characteristics of humic acids in upland field soils. Eur. J. Soil Sci. 2008, 59, 1027–1037. [Google Scholar] [CrossRef]
  40. Mao, J.; Olk, D.C.; Fang, X.; He, Z.; Schmidt-Rohr, K. Influence of animal manure application on the chemical structures of soil organic matter as investigated by advanced solid-state NMR and FT-IR spectroscopy. Geoderma 2008, 146, 353–362. [Google Scholar] [CrossRef]
  41. Debska, B.; Kotwica, K.; Banach-Szott, M.; Spychaj-Fabisiak, E.; Tobiasova, E. Soil fertility improvement and carbon sequestration through exogenous organic matter and biostimulant application. Agriculture 2022, 12, 1478. [Google Scholar] [CrossRef]
  42. Abakumov, E.; Yaneva, R.; Polyakov, V.; Zhiyanski, M. Characterization of humic acids isolated from selected soils of Livingston Island by CP/MAS 13CNMR and ESR Spectroscopy. Appl. Environ. Soil Sci. 2022, 7540077. [Google Scholar] [CrossRef]
  43. Kumada, K. Elementary composition and absorption spectra of humic and fulvic acids. Soil Sci. Plant Nutr. 1985, 31, 437–448. [Google Scholar] [CrossRef]
Figure 1. RP-HPLC chromatogram of humic acids isolated from soil with manure, dose of N-0, and without manure, dose of N-0.
Agronomy 15 01405 g001
Figure 2. FT-IR spectra of humic acids isolated from soil with manure, dose of N-0, and without manure, dose N-0 (dependence of transmittance (T) on wavenumber (cm−1)).
Agronomy 15 01405 g002
Figure 3. Relationship between the H/C atomic ratio values and parameter ω.
Agronomy 15 01405 g003
Figure 4. Relationship between the values of A4/6 and A2/4.
Agronomy 15 01405 g004
Figure 5. Relationship between H/C and HIL/ΣHOB.
Agronomy 15 01405 g005
Figure 6. Cluster analysis determined based on humic acid parameters, where N—nitrogen fertilization (0, 40, 60 and 120 kg ha−1), O—manure fertilization (30 t ha−1).
Agronomy 15 01405 g006
Table 1. Elemental composition of humic acids expressed in weight percentage.
Dose N
(kg ha−1)
CHNO
With Manure (30 t ha−1)—Factor I
052.31 ± 0.26 Ab *5.01 ± 0.15 Bb4.46 ± 0.16 Bb38.23 ± 0.17 Aa
4055.09 ± 0.28 Aa5.36 ± 0.18 Aa4.97 ± 0.15 Aa34.58 ± 0.24 Bc
6052.81 ± 0.35 Ab5.22 ± 0.21 Aa4.87 ± 0.15 Aa37.09 ± 0.28 Bb
12051.63 ± 0.36 Ac4.94 ± 0.35 Ab4.58 ± 0.25 Ab38.84 ± 0.26 Aa
Mean52.96 a **5.13 a4.72 a37.19 b
Without manure—Factor I
052.71 ± 0.27 Aab5.40 ± 0.17 Aa4.88 ± 0.04 Aa37.01 ± 0.22 Bc
4051.29 ± 0.29 Bb5.01 ± 0.14 Bb4.68 ± 0.04 Ac39.01 ± 0.26 Aa
6052.89 ± 0.25 Aa4.69 ± 0.17 Bc4.77 ± 0.17 Ab37.66 ± 0.22 Ab
12051.29 ± 0.31 Ab4.78 ± 0.23 Ac4.69 ± 0.18 Ac39.24 ± 0.28 Aa
Mean52.04 b4.97 b4.76 a38.23 a
Average values for different nitrogen doses—Factor II
052.51 b5.21 a4.67 b37.62 b
4053.19 a5.19 a4.83 a36.80 c
6052.85 ab4.96 b4.82 a37.38 b
12051.46 c4.86 b4.64 b39.04 a
±Standard deviation; *—interaction designations: I/II—(different capital letters indicate a comparison with FYM fertilization (within the same mineral N fertilization), II/I–a (different small letters indicate a comparison with mineral N fertilization (within the same FYM fertilization); ** different small italic letters indicate significant differences among experience factors (I factor—FYM fertilization: 0 and 30 FYM t ha–1; II factor—mineral N fertilization: 0, 40, 60 and 120 kg N ha−1).
Table 2. Elemental composition of humic acids expressed in atomic percentage.
Dose N
(kg ha−1)
CHNO
With Manure (30 t ha−1)—Factor I
036.10 ± 0.17 Ab *41.48 ± 0.27 Ac2.64 ± 0.01 Bc19.79 ± 0.02 Ab
4036.82 ± 0.19 Aa42.99 ± 0.28 Aa2.85 ± 0.01 Aa17.34 ± 0.04 Bd
6035.82 ± 0.14 Bc42.48 ± 0.30 Ab2.83 ± 0.02 Ba18.87 ± 0.06 Bc
12035.87 ± 0.15 Abc41.16 ± 0.25 Ac2.73 ± 0.01 Bb20.24 ± 0.13 Ba
Mean36.04 a **41.29 a2.82 a19.86 a
Without manure—Factor I
035.27 ± 0.16 Bc43.36 ± 0.24 Aa2.80 ± 0.02 Ab18.57 ± 0.02 Bc
4035.43 ± 0.18 Bc41.58 ± 0.24 Bb2.77 ± 0.04 Bc20.21 ± 0.11 Ab
6037.36 ± 0.12 Aa39.80 ± 0.27 Bd2.89 ± 0.06 Aa19.96 ± 0.15 Ab
12036.10 ± 0.20 Ab40.43 ± 0.23 Bc2.83 ± 0.13 Ab20.71 ± 0.05 Aa
Mean36.15 a40.03 b2.76 b19.06 b
Average values for different nitrogen doses—Factor II
035.68 c42.42 a2.72 c19.18 b
4036.13 b42.29 a2.81 ab18.78 c
6036.59 a41.14 b2.86 a19.41 b
12036.00 b40.79 c2.78 bc20.48 a
±Standard deviation; *—interaction designations: I/II—(different capital letters indicate a comparison with FYM fertilization (within the same mineral N fertilization), II/I–a (different small letters indicate a comparison with mineral N fertilization (within the same FYM fertilization); ** different small italic letters indicate significant differences among experience factors (I factor—FYM fertilization: 0 and 30 FYM t ha–1; II factor—mineral N fertilization: 0, 40, 60 and 120 kg N ha−1).
Table 3. Atomic ratios of humic acids.
Dose N
(kg ha−1)
H/CN/CO/CO/Hω
With Manure (30 t ha−1)—Factor I
01.15 Ba *0.073 Aa0.55 Aab0.48 Aa0.166 Ab
401.17 Aa0.077 Aa0.47 Bc0.40 Bc0.006 Bd
601.19 Aa0.079 Aa0.52 Ab0.44 Bb0.105 Bc
1201.15 Aa0.076 Aa0.56 Aa0.49 Aa0.209 Ba
Mean1.16 a **0.076 a0.55 a0.45 a0.122 b
Without manure—Factor I
01.21 Aa0.080 Aa0.53 Ab0.43 Bb0.062 Bc
401.17 Aa0.078 Aa0.57 Aa0.49 Aa0.202 Ab
601.07 Bc0.077 Aa0.53 Ab0.50 Aa0.235 Aa
1201.12 Ab0.078 Aa0.57 Aa0.51 Aa0.264 Aa
Mean1.14 a0.078 a0.53 a0.48 a0.191 a
Average values for different nitrogen doses—Factor II
01.18 a0.076 a0.54 ab0.46 b0.114 c
401.17 a0.078 a0.52 b0.44 bc0.104 c
601.13 b0.078 a0.53 b0.47 b0.170 b
1201.13 b0.077 a0.57 a0.50 a0.237 a
±Standard deviation; *—interaction designations: I/II—(different capital letters indicate a comparison with FYM fertilization (within the same mineral N fertilization), II/I–a (different small letters indicate a comparison with mineral N fertilization (within the same FYM fertilization); ** different small italic letters indicate significant differences among experience factors (I factor—FYM fertilization: 0 and 30 FYM t ha–1; II factor—mineral N fertilization: 0, 40, 60 and 120 kg N ha−1).
Table 4. Percentage share of hydrophilic (HIL) and hydrophobic (HOB) fractions in humic acids.
Dose N
(kg ha−1)
HILHOB-1HOB-2HOB-3ΣHOBHIL/ΣHOB
With Manure (30 t ha−1)—Factor I
024.09 ± 1.33 ***11.40 ± 0.54 Aa *13.30 ± 0.2651.19 ± 2.12 Bb75.91 ± 1.330.318
4021.66 ± 1.3910.52 ± 0.34 Aab13.02 ± 0.1954.80 ± 1.56 Ba78.34 ± 1.390.277
6020.10 ± 0.6610.00 ± 0.45 Ab13.40 ± 0.2256.50 ± 0.84 Aa79.90 ± 0.660.251
12021.11 ± 0.5010.70 ± 0.21 Aab12.75 ± 0.3855.43 ± 0.35 Aa78.89 ± 0.500.268
Mean21.74 a **10.65 a13.13 a54.48 b78.26 b0.278 a
Without manure—Factor I
018.47 ± 0.369.67 ± 0.46 Ba13.63 ± 0.3457.93 ± 0.43 Aa81.53 ± 0.360.227
4017.21 ± 0.2410.07 ± 0.03 Aa13.20 ± 0.0759.52 ± 0.28 Aa82.79 ± 0.240.208
6016.65 ± 0.4310.17 ± 0.4 Aa13.45 ± 0.3159.73 ± 0.39 Aa83.35 ± 0.440.200
12018.54 ± 0.9810.43 ± 0.34 Aa13.14 ± 0.2157.88 ± 0.99 Aa81.46 ± 0.980.228
Mean17.72 b10.16 a13.36 a58.77 a82.28 a0.216 b
Average values for different nitrogen doses—Factor II
021.28 a10.68 a13.48 a54.56 b78.72 b0.272 a
4019.43 b10.30 a13.11 a57.16 a80.57 a0.242 b
6018.37 b10.08 a13.43 a58.12 a81.62 a0.226 b
12019.83 ab10.57 a12.95 a56.66 a80.17 a0.248 b
±Standard deviation; *—interaction designations: I/II—(different capital letters indicate a comparison with FYM fertilization (within the same mineral N fertilization), II/I–a (different small letters indicate a comparison with mineral N fertilization (within the same FYM fertilization); ** different small italic letters indicate significant differences among experience factors (I factor—FYM fertilization: 0 and 30 FYM t ha–1; II factor—mineral N fertilization: 0, 40, 60 and 120 kg N ha−1); ***—no letter designations—no interactions.
Table 5. Absorbance values of humic acids.
Dose N
(kg ha−1)
A280A400A465A600A665Au465Au665
With Manure (30 t ha−1)—Factor I
04.32 Ba *1.35 Bb0.740 Ba0.252 Ba0.138 a0.352 Ba0.066 Ba
403.52 Bc1.09 Bd0.582 Bc0.194 Bb0.106 c0.272 Bc0.052 Bb
604.27 Ba1.57 Aa0.678 Bb0.220 Ac0.118 b0.294 Bb0.054 Bb
1203.85 Bb1.20 Bc0.654 Bb0.220 Ac0.122 b0.296 Bb0.054 Bb
Mean3.99 b **1.30 b0.664 b0.222 b0.121 b0.304 b0.057 b
Without manure—Factor I
04.46 Ab1.43 A0.828 Ab0.294 Ac0.164 c0.388 Ac0.074 Ac
404.19 Ac1.40 A0.764 Ac0.270 Ad0.150 d0.392 Ac0.076 Ac
604.94 Aa1.60 A0.964 Aa0.354 Ba0.200 a0.484 Aa0.092 Aa
1204.50 Ab1.44 A0.848 Ab0.310 Bb0.176 b0.448 Ab0.084 Ab
Mean4.52 a1.47 a0.851 a0.307 a0.173 a0.428 a0.082 a
Average values for different nitrogen doses—Factor II
04.39 b1.39 b0.784 b0.273 b0.151 b0.370 b0.070 a
403.86 d1.24 c0.673 d0.232 c0.128 c0.332 c0.064 c
604.61 a1.59 a0.821 a0.287 a0.159 a0.389 a0.073 a
1204.18 c1.32 b0.751 c0.265 b0.149 b0.372 b0.069 b
±Standard deviation; *—interaction designations: I/II—(different capital letters indicate a comparison with FYM fertilization (within the same mineral N fertilization), II/I–a (different small letters indicate a comparison with mineral N fertilization (within the same FYM fertilization); ** different small italic letters indicate significant differences among experience factors (I factor—FYM fertilization: 0 and 30 FYM t ha–1; II factor—mineral N fertilization: 0, 40, 60 and 120 kg N ha−1).
Table 6. Coefficients of absorbance of humic acids.
Dose N
(kg ha−1)
A2/6A2/4A4/6ΔlogKΔAu465ΔAu665
With Manure (30 t ha−1)—Factor I
031.31 Ab *5.85 Ab5.37 Aa0.729 Ab52.32 Ab52.17 Aab
4033.28 Ab6.05 Aab5.50 Aa0.750 Ab53.27 Ab50.84 Ab
6036.20 Aa6.30 Aa5.75 Aa0.854 Aa56.64 Aa54.23 Aab
12031.57 Ab5.88 Ab5.36 Aa0.737 Ab54.74 Aab55.71 Aa
Mean33.09 a **6.02 a5.50 a0.767 a54.24 a53.24 a
Without manure—Factor I
027.19 Ba5.39 Ba5.05 Aa0.687 Aa53.14 Aa54.87 Aab
4027.94 Ba5.48 Ba5.10 Aa0.715 aA48.69 Bb49.32 Ab
6024.07 Bb5.13 Ba4.82 Aa0.655 Bb49.79 Bb54.00 Aa
12025.57 Bab5.31 Ba4.82 Aa0.667 Bb47.17 Bb52.27 ab
Mean26.35 b5.33 b4.95 b0.681 b49.70 b52.62 a
Average values for different nitrogen doses—Factor II
029.25 b5.62 a5.21 a0.708 b52.73 a53.52 a
4030.61 a5.77 a5.30 a0.732 a50.98 a50.08 b
6030.45 a5.71 a5.28 a0.755 a53.22 a54.12 a
12028.57 b5.60 a5.09 a0.702 b50.95 b53.99 a
±Standard deviation; *—interaction designations: I/II—(different capital letters indicate a comparison with FYM fertilization (within the same mineral N fertilization), II/I–a (different small letters indicate a comparison with mineral N fertilization (within the same FYM fertilization); ** different small italic letters indicate significant differences among experience factors (I factor—FYM fertilization: 0 and 30 FYM t ha–1; II factor—mineral N fertilization: 0, 40, 60 and 120 kg N ha−1).
Disclaimer/Publisher’s Note: The statements, opinions and data contained in all publications are solely those of the individual author(s) and contributor(s) and not of MDPI and/or the editor(s). MDPI and/or the editor(s) disclaim responsibility for any injury to people or property resulting from any ideas, methods, instructions or products referred to in the content.

