Article

Genotype and Environment Shape the Free and Bound Phenolics and Lipid Content in Oat (Avena sativa L.) Grains

by
Elżbieta G. Magnucka
1,*,
Grzegorz Kulczycki
2,*,
Henryk Bujak
3,4 and
Stanisław J. Pietr
1
1
Laboratory of Biogeochemistry and Environmental Microbiology, Department of Plant Protection, Wrocław University of Environmental and Life Sciences, Grunwaldzka St. 53, 50-357 Wrocław, Poland
2
Institute of Soil Science, Plant Nutrition and Environmental Protection, Wrocław University of Environmental and Life Sciences, Grunwaldzka St. 53, 50-357 Wrocław, Poland
3
Department of Genetics, Plant Breeding and Seed Production, Wrocław University of Environmental and Life Sciences, Grunwaldzki Sq. 24a, 50-363 Wrocław, Poland
4
Research Centre for Cultivar Testing, Słupia Wielka 34, 63-022 Słupia Wielka, Poland
*
Authors to whom correspondence should be addressed.
Agronomy 2025, 15(6), 1400; https://doi.org/10.3390/agronomy15061400
Submission received: 9 May 2025 / Revised: 3 June 2025 / Accepted: 4 June 2025 / Published: 6 June 2025
(This article belongs to the Section Plant-Crop Biology and Biochemistry)

Abstract

:
Oat grains contain antioxidants, such as phenolics, with beneficial health properties. This study aimed to assess the effects of genetic and environmental factors on the content of free and bound phenolic compounds, their antioxidant capacities, and lipid levels in naked and hulled oat varieties grown in various Polish locations over two crop years. The genotype explained the largest variance in all measured parameters, although environmental factors also influenced these traits. The year of cultivation primarily affected free phenolics and their antioxidant activity, while growth location influenced bound compounds and their capacities. Significant correlations were observed between phenolic levels and antioxidant activity within each fraction. Hulled oat cultivars exhibited higher bound phenolic contents and lower lipid levels compared to naked varieties. Although the study highlighted the differential responses of phenolic fractions to external factors, further research is necessary to elucidate the mechanisms that regulate phenolic biosynthesis in oats. Such insights could facilitate the development of oat varieties optimized for specific growing conditions to maximize the accumulation of beneficial phenolic antioxidants.

1. Introduction

The genus Avena (family Poaceae) includes many species of oats [1,2]. Oat (Avena sativa L.), known as common or cultivated oat, is the dominant species of these herbaceous grasses grown in Poland and the world, where it is the seventh most produced grain, after wheat, corn, rice, barley, sorghum, and millet [3]. This cereal is divided into two morphological types: covered, hulled oat (A. sativa) and naked, hulless oat (A. nuda). Many researchers believed that hulless oat is only a taxonomical variant of common oat and should be referred to as the naked type of A. sativa (Avena sativa subsp. nuda (L.) Gillet & Magne; Avena sativa var. nuda (L.) Körn) [4]. However, in the last genomic study, these two main varieties showed that they were domesticated independently a long time ago, rather than one being a recent derivative of the other [5]. Contrary to what is suggested by its name, naked oat kernels have a soft outer casing/husk that easily separates from the edible grain during threshing, leaving the groat denuded [6,7]. The hull, also called the husk, consists of two floral bracts, the lemma and the palea. They are the outer protective layers shielding the oat caryopses from environmental stress and consist mainly of insoluble fibers such as cellulose, hemicellulose (arabinoxylan), and lignin [8,9].
They are an important component of all oat seeds, promoting intestinal motility and improving digestive efficiency in animals such as ruminants and rabbits [10,11,12]. Their positive effects on the intestinal microbiota of poultry have also been shown [13,14]. In turn, both the naked kernel and the groat inside the covering hull are rich in carbohydrates (starch and β-glucans), proteins mainly in globulins, lipids especially in unsaturated fatty acids (oleic and linoleic acids), vitamins (K, E, B1, B2, and B6), minerals (potassium, iron, manganese, magnesium, and calcium), and various phenolic constituents [15,16,17,18,19,20,21,22,23]. The latter represent the secondary metabolites of the plant, which possess at least one aromatic ring connected with one or more hydroxyl groups. Phenolic acids are the most common phenolic compounds found in caryopses. They are present in three forms: free-soluble (free), soluble-bound/conjugated (esterified with low-molecular-weight sugars, amines), and insoluble-bound by ether links with lignin or ester links with structural wall macromolecules such as polysaccharides and proteins [24,25,26,27]. The first form is mainly located in the vacuoles of the pericarp and can be directly extracted with organic solvents. In turn, bound forms can be extracted by following alkaline and/or acid hydrolysis [28]. A unique group of phenolic compounds in oats is avenanthramides. These soluble alkaloids are amides of hydroxycinnamic or avenalumic derivatives with an anthranilic acid subunit [29,30]. Phenolic compounds play an important role in the regulation of seed germination and defense responses against environmental, biotic, and abiotic stresses [31,32]. Most of these constituents have powerful antioxidant properties that neutralize the impacts of oxidative stress [23,26,33,34,35]. Furthermore, phenolic components exert protective effects against the development of various pathologies in humans, such as cardiovascular disease, diabetes, inflammatory bowel disease, cancer, obesity, and celiac disease [36,37]. Therefore, the chemical composition and nutritional value of oat grains depend on the genetic background, that is, the variety of plants, as well as environmental and agrotechnical factors [35,38]. To date, naked oat grain has a lower insoluble fiber but a higher percentage of starch and β-glucans. Furthermore, it contains more protein and lipids than hulled oat kernels [9,39]. Therefore, naked oat is especially intended as a feed plant for monogastric animals [7,39]. Currently, efforts are being made to create varieties more resistant, especially to damage, for example, pathogenic attacks, and that are easily adapted to limited soil water content.
The objective of this study was to analyze, over two years, the effects of cultivar, growing location (environment), and their interactions on the level of free and bound phenolic compounds, the antioxidant activity of those fractions, and the lipid content in grains of naked and hulled oat varieties.

2. Materials and Methods

2.1. Plant Materials

In this study, the grains of four spring oat cultivars (Avena sativa L.) were used. Two naked varieties (Adorator and MHR Harem) and two hulled varieties (Pablo and Bingo) cultivated under a traditional system in various locations in Poland (Białogard—GPS 54°00′50.8″ N 15°53′35.4″ E, Głodowo—GPS 54°04′18.8″ N 18°17′46.2″ E, Kochcice—GPS 50°42′20.9″ N 18°36′43.2″ E, and Marianowo—GPS 53°12′37.6″ N 22°6′13.8″ E) were analyzed. The field experiment was established as a randomized block design with three replicates, with a plot area slightly different in size at various locations (15 or 16.5 m2), and was carried out over two consecutive growth years (2022–2023). The mineral fertilization applied by NPK took into account both the abundance of macronutrients and the crop grown as a forecrop. It allowed the provision of the same level of nutrients to the growing oat crop in all locations. Data for all locations and two years of cultivation describing the weather conditions, plot size, soil properties, forecrop, and fertilization schedule are summarized in Table S1.

2.2. Chemicals

Chemicals, including methanol, hexane, chloroform, ethyl acetate, sodium hydroxide, glacial acetic acid, hydrochloric acid, and Folin–Ciocalteu reagent, were sourced from Avantor Performance Materials Poland S.A. (Gliwice, Poland). Other chemicals, including sinapic acid, sodium acetate, sodium chloride, anhydrous sodium carbonate, deionized water, 2,4,6-Tris(2-pyridyl)-s-triazine (TPTZ), iron (II) sulfate heptahydrate, and iron (III) chloride hexahydrate, were of analytical grade and obtained from Merck KgaA (Darmstadt, Germany).

2.3. Extraction of Free and Bound Phenolic Compounds

Phenolics were extracted from the kernels using the methods of Krygier et al. (1982) [28] with some modifications. Samples of whole oat caryopses (approximately 1 g) were first suspended in hexane for defatting. The suspensions were vortexed, sonicated for 15 min, and kept on a shaker for 30 min (90 rpm). After centrifugation for 10 min at 5000 rpm, the supernatant was discarded, and the samples were dried at 37 °C for 2 h. Subsequently, the extraction with 80% acidified methanol was performed twice (30 min each). The methanol supernatants were combined and extracted with ethyl acetate. The organic phase was evaporated to dryness, and the residues were dissolved in 3 mL of 80% methanol and left for analysis of free phenolics and their antioxidant activity. The solid residue was connected to the water phase after extraction of free soluble phenols and then hydrolyzed in 4 M NaOH overnight (18 h) at 37 °C. After alkaline hydrolysis, the solution was acidified to pH 2.0 with 8 M HCl and centrifuged at 12,000 rpm for 10 min to remove precipitates. After the mixture was defatted with hexane to remove the lipids released by this hydrolysis, the extraction of bound (soluble and insoluble) phenolic compounds with ethyl acetate was carried out twice. After centrifugation at 3000 rpm for 10 min, the upper layers were combined and evaporated to dryness under a vacuum. Finally, the residue was dissolved in 80% methanol and left for further analysis.

2.4. Estimation of Phenolic Concentration in Various Fractions

Phenolic levels in both obtained fractions were determined using the Folin–Ciocalteu (FC) method described by Singleton et al. (1999) [40] with slight modifications. A 0.5 mL was combined with 0.250 mL of Folin–Ciocalteu reagent dissolved with deionized water in a 2:1 ratio (v/v). The mixture was incubated in the dark for 5 min. Then, 0.5 mL of 20% (w/v) solution of anhydrous sodium carbonate was added. The mixture after incubation (30 min at room temperature in darkness) was centrifuged (14,000 rpm, 5 min). The absorbance of the samples at 765 nm was read against the blank sample. On the basis of the sinapic acid calibration curve (y = 0.0743x + 0.0819, R2 = 0.9984), the results were expressed as micrograms of sinapic acid equivalents (SAEs) per gram of dry seed. The test was carried out in triplicate for each extract.

2.5. Antioxidant Activity of Phenolic Fractions

The ferric reducing antioxidant power (FRAP) of the phenolic fractions of oat samples was determined according to Benzie and Strain [41] with modifications. The FRAP working solution was freshly prepared with 300 mM acetate buffer (pH 3.6), 10 mM TPTZ solution in 40 mM HCl, and 20 mM FeCl3 6H2O mixed in a volume ratio of 10:1:1. The assay was carried out by adding 0.6 mL of FRAP reagent to 0.05 mL of the sample followed by gentle vortexing and incubated at 37 °C for 10 min. The absorbance was measured at 593 nm against the blank sample containing 80% methanol instead of the sample. A calibration curve was constructed using FeSO4·7H2O (y = 1.2063x + 0.0885, R2 = 0.9895). The results were expressed as millimoles of Fe (II) equivalents per kilogram of dry oat seeds. All determinations were made in triplicate.

2.6. Total Lipid Determination in Oat Caryopses

The total lipid content was determined according to the modified method of Folch et al. (1957) [42]. These compounds were extracted from ground, air-dried kernels (1 g) with 25 mL of chloroform–methanol solution (2:1, v/v) using a shaker for 60 min (90 rpm). Subsequently, a 0.5% sodium chloride solution was added to the filtrate in a volume proportion of 2.5:1 (v/v) to separate these two organic phases. Finally, the bottom chloroform layer was transferred to a previously weighed rotating flask. The lipids were recovered and weighed after evaporation of the solvent with a rotary vacuum evaporator. The final lipid weight was determined to ±0.001 g precision.

2.7. Statistical Analysis

All measurements were conducted in triplicate for each field plot sample, and the mean value per plot was used in statistical analysis (thus n = 3 plots per treatment). The statistical program R version 4.4.2 was used for all statistical analyses. A three-factor analysis of variance (three-way ANOVA) was used to evaluate the effects of location, crop year, and cultivar on the biochemical parameters studied (lipid content, free and bound phenolic compounds, and their antioxidant potential (FRAP)). Before performing the ANOVA, its assumptions were checked. The Shapiro–Wilk normality test was used to verify that the residuals had a normal distribution, the Bartlett test to measure homogeneity of variance, and the Durbin–Watson statistic to measure independence of error. Statistical significance was verified at p < 0.05. The Tukey HSD (Honest Significant Difference) post hoc test was used to determine differences between each factor level, and the results are presented as means with letter marks indicating significant differences between groups. For each factor and its interactions, the effect size (effect size) expressed as a generalized eta square (η2G) was calculated to determine the relative impact of each factor. The generalized eta square (η2G) represents the proportion of variance explained by a factor, adjusted for the design; this gives a measure of the relative effect magnitude. PCA was conducted using the prcomp() function, with prior centering and standardization of variables. Before applying PCA, its assumptions were verified using a correlation matrix, Bartlett’s sphericity test, and the Kaiser–Meyer–Olkin criterion. The number of significant components was determined using a scatter plot.

3. Results

3.1. Phenolic Compounds

This work presents the influence of genetic and environmental factors on the levels of free and bound phenolic compounds in oat grains. Such comprehensive studies are rare in the literature, especially those that include the bound forms of phenolic compounds.

3.1.1. Free Phenolic Content in Oat Cultivars

The level of free phenolic compounds (FPCs) varied significantly between cultivars, locations, and years (Table 1).
The highest FPA content was recorded in the Pablo cultivar grown in Kochcice in 2022 (363.58 mg kg−1), closely followed by Bingo phenolics in the same location and year (338.13 mg kg−1). On the contrary, the lowest values of these compounds were observed in Adorator in 2023, particularly in Białogard (90.77 mg kg−1). These results highlight substantial differences in FPA accumulation between genotypes and environments.
Furthermore, a general decline in FPA levels was observed in 2023 compared to 2022. Both Adorator and Pablo showed these marked decreases in Białogard, Głodowo, and Kochcice. Additionally, Bingo cultivated in Głodowo and Kochcice, as well as MHR Harem from Białogard, represents this decline trend. These decreases suggest that the environmental conditions in 2023 in these Polish regions were less favorable for the synthesis of FPA, possibly due to variations in climatic factors such as temperature or rainfall.
In addition, the location of growth significantly influenced the accumulation of FPCs. Kochcice consistently recorded the highest values in both hulled cultivars in 2022. In turn, Białogard promoted the biosynthesis of free phenolics, especially in both naked oat varieties grown in 2022.

3.1.2. Level of Bound Phenolic Compounds in Oat Cultivars

The concentration of bound phenolic compounds (BPCs) showed significant variability among all tested factors, i.e., cultivar, location, and year (Table 2).
The highest BPA content was observed in the Bingo cultivar grown in Białogard in 2022 (3483.28 mg kg−1), while the lowest BPA concentration was found for both naked oat cultivars grown in Głodowo in 2022 (87.59 and 129.12 mg kg−1 for Adorator and MHR Harem, respectively). These extreme differences indicate that the genotype plays a crucial role in determining BPA accumulation. Furthermore, BPA levels were higher in 2022 than in 2023, but only for the hulled varieties grown in two localizations, that is, Białogard and Kochcice. However, the opposite situation, that is, a significantly higher value of this fraction of phenolic compounds in the varieties grown in 2023 than in 2022, was observed for the naked varieties (Adorator and MHR Harem) grown in two other locations (Głodowo and Marianowo).
Location also had a marked effect on the accumulation of BPCs. Marianowo showed relatively high levels of BPCs in all cultivars, suggesting that the environmental conditions at this location may have promoted stress-induced phenolic biosynthesis.

3.2. Antioxidant Activity of Phenolic Fractions

3.2.1. Antioxidant Capacity of Free Phenolics

The antioxidant properties of free phenolic compounds are presented in Table 3.
The highest antioxidant activities were recorded for FPCs extracted from Pablo and Bingo cultivars grown in Kochcice in 2022 (3.22 and 3.02 mmol kg−1, respectively), while the lowest was observed for compounds isolated from Adorator grown in Białogard in 2023 (0.56 mmol kg−1). Furthermore, a significant decrease in antioxidant activity was observed in 2023 compared to 2022 for all cultivars grown in Białogard. The same pattern was denoted for the hulled cultivars grown in Kochcice and the Pablo cultivar from Głodowo. In turn, an inverse statistical relationship, that is, a significant increase in the antioxidant power of FPCs in 2023 compared to 2022, was observed for all cultivars grown in Marianowo and for Adorator from Kochcice.

3.2.2. Antioxidant Power of Bound Phenolics

The antioxidant activity of the bound phenolic compounds determined by the FRAP assay is shown in Table 4.
The hulled cultivars showed the highest antioxidant activity, with values exceeding 10 mmol kg−1 in most cases; Pablo reaching 17.50 mmol kg−1 in Głodowo (2022) and Bingo reaching 17.47 mmol kg−1 in Białogard (2022). On the contrary, naked cultivars generally showed significantly lower antioxidant activity than hulled cultivars. The lowest values were indicated for Adorator and MHR Harem grown in Głodowo in 2022 (0.83 and 1.28 mmol kg−1, respectively).
In addition, the antioxidant power of bound phenolic compounds was significantly higher in 2022 than in 2023 in hulled cultivars grown in Białogard and Kochcice, as well as in Pablo from Głodowo, MHR Harem from Kochcice, and in Adorator from Białogard. An inverse relationship was found for the naked varieties originating from Marianowo and Głodowo, as well as MHR Harem from Białogard. The first location also favored the significant increase in antioxidant activity of the remaining two hulled varieties in 2023 compared to 2022.

3.3. Lipid Content

Among the cultivars analyzed, MHR Harem grown in Kochcice in 2022 exhibited the highest lipid content (12.67%), while the hulled varieties of oats generally had significantly lower lipid levels (Table 5).
In the case of the Adorator cultivar, the lipid content remained statistically stable between the locations in each year. Similarly, no significant effect of location on lipid content was observed for hulled cultivars grown in 2023. Furthermore, a statistically significant decrease in lipid content was shown for all oat cultivars grown in Kochcice in 2023 compared to 2022. An inverse relationship was observed for the Bingo and Pablo varieties cultivated in Białogard and Marianowo, respectively.

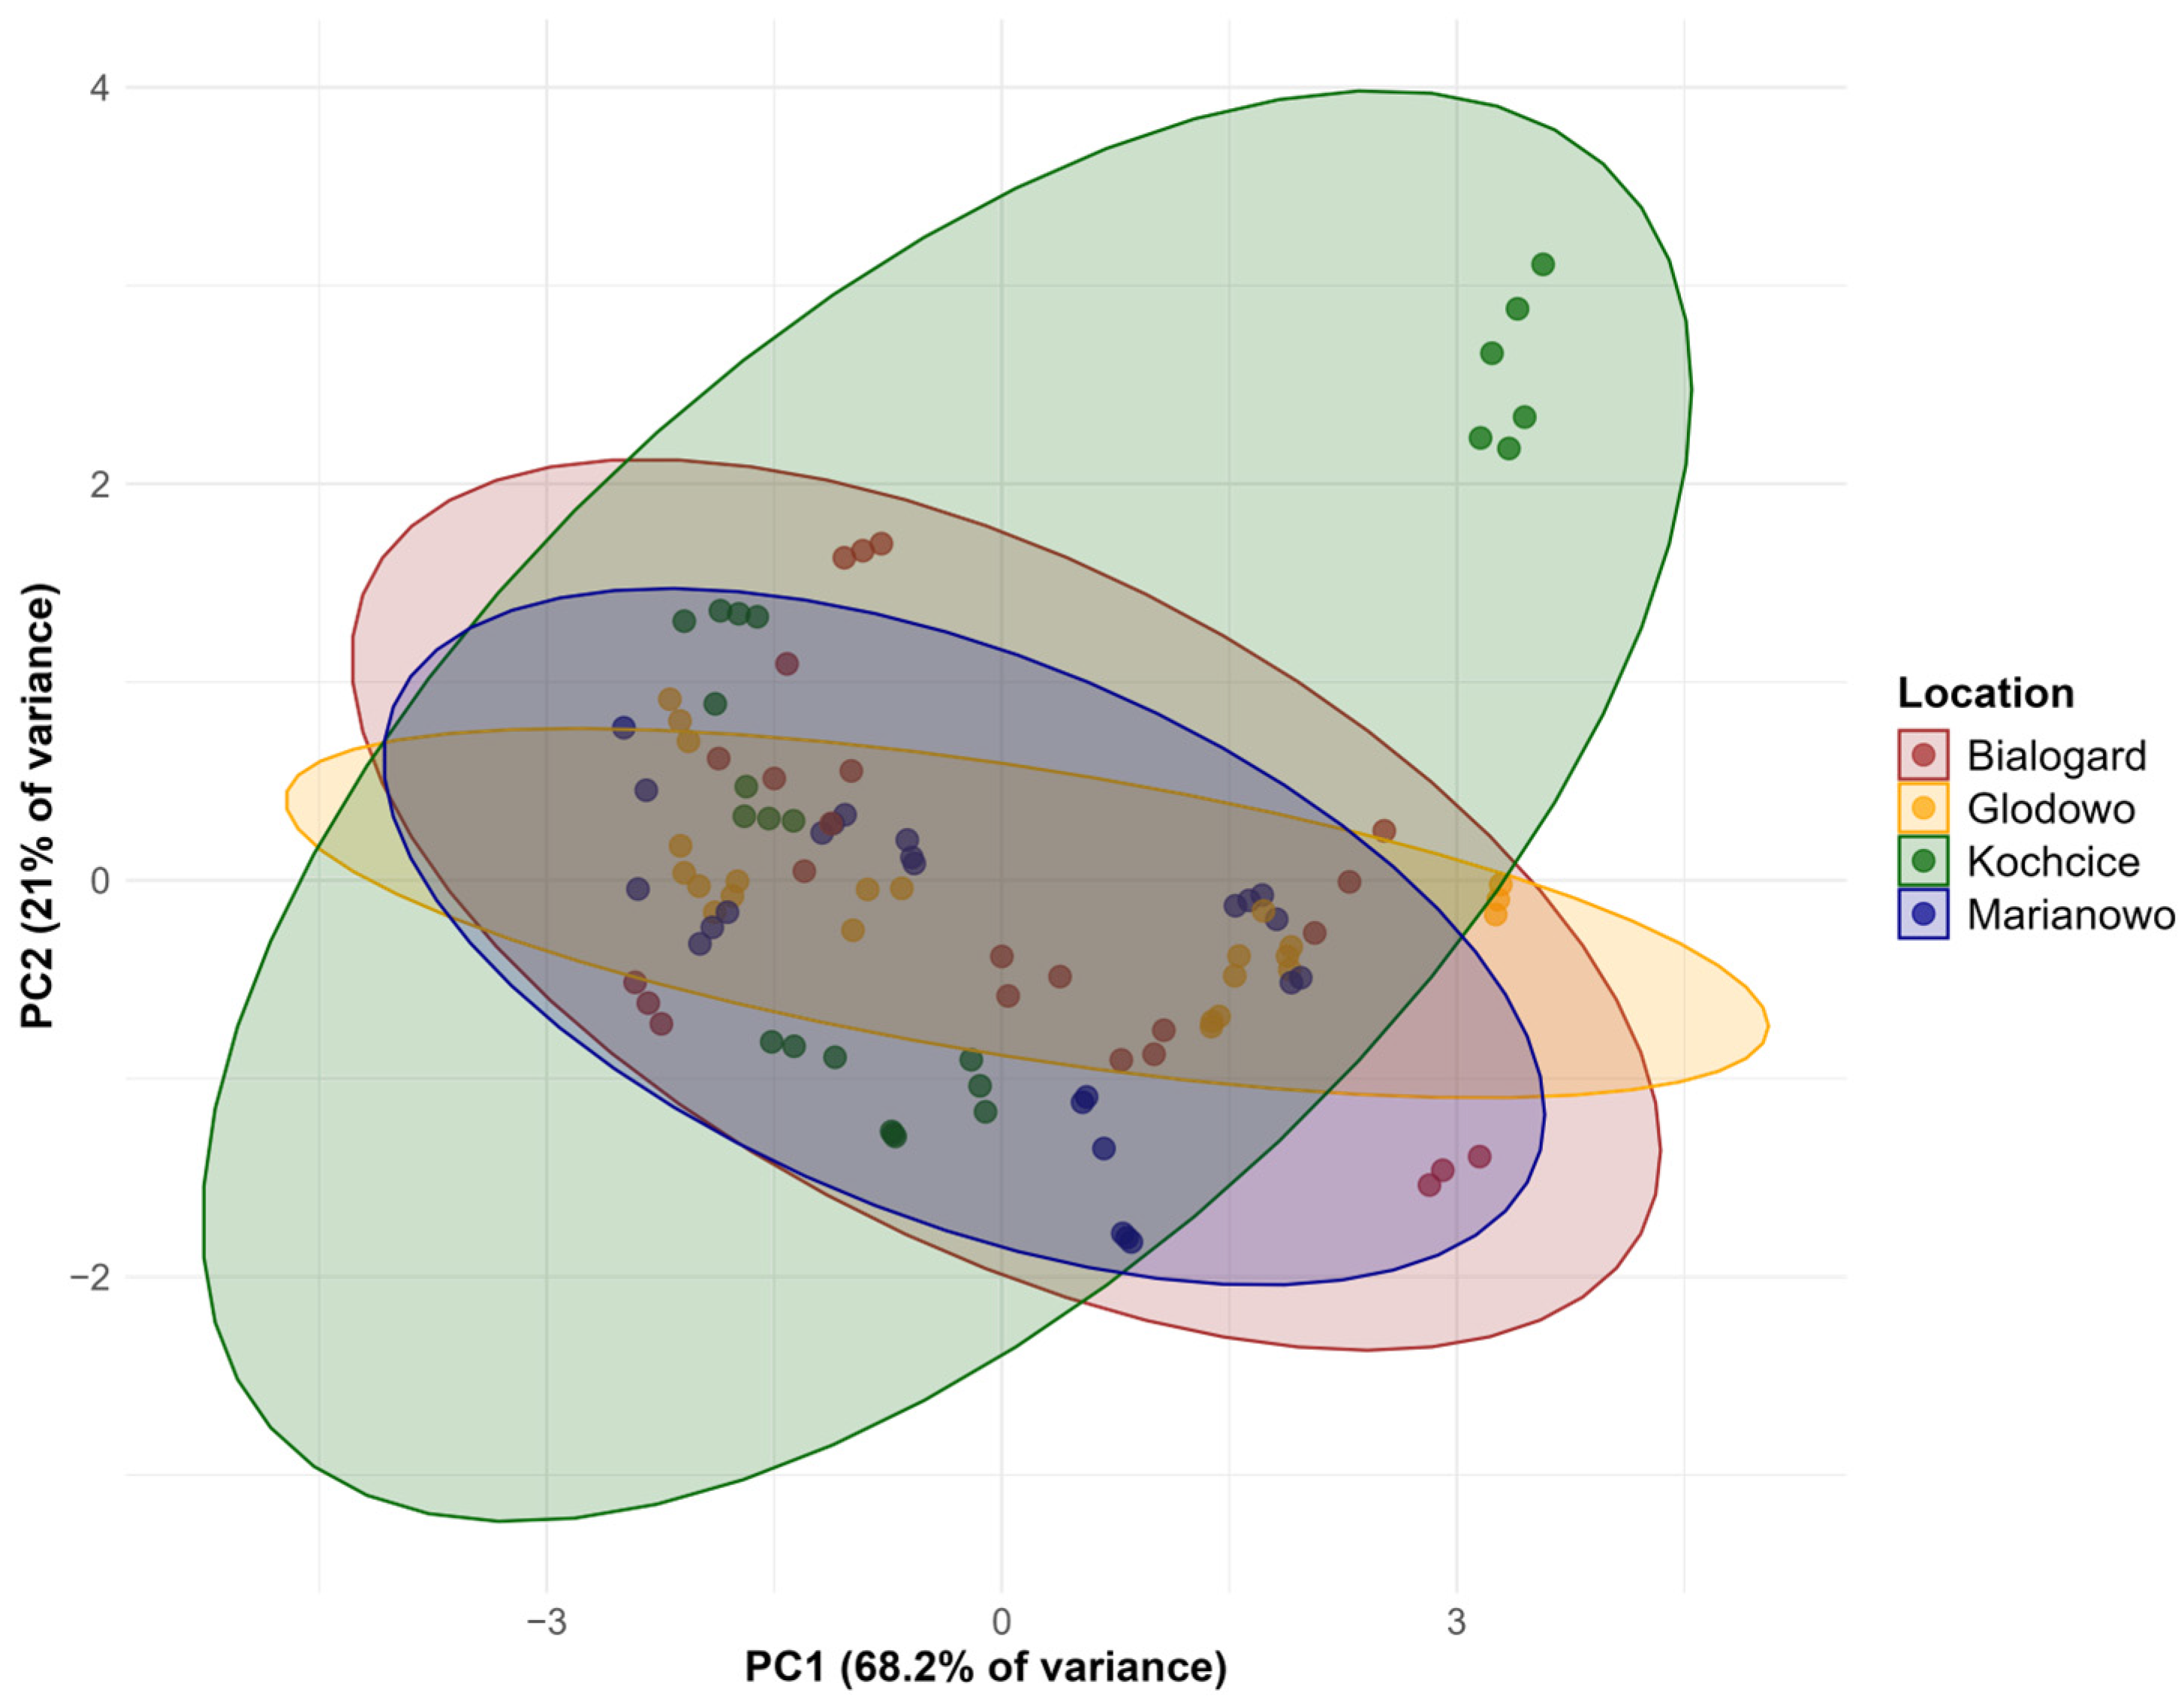
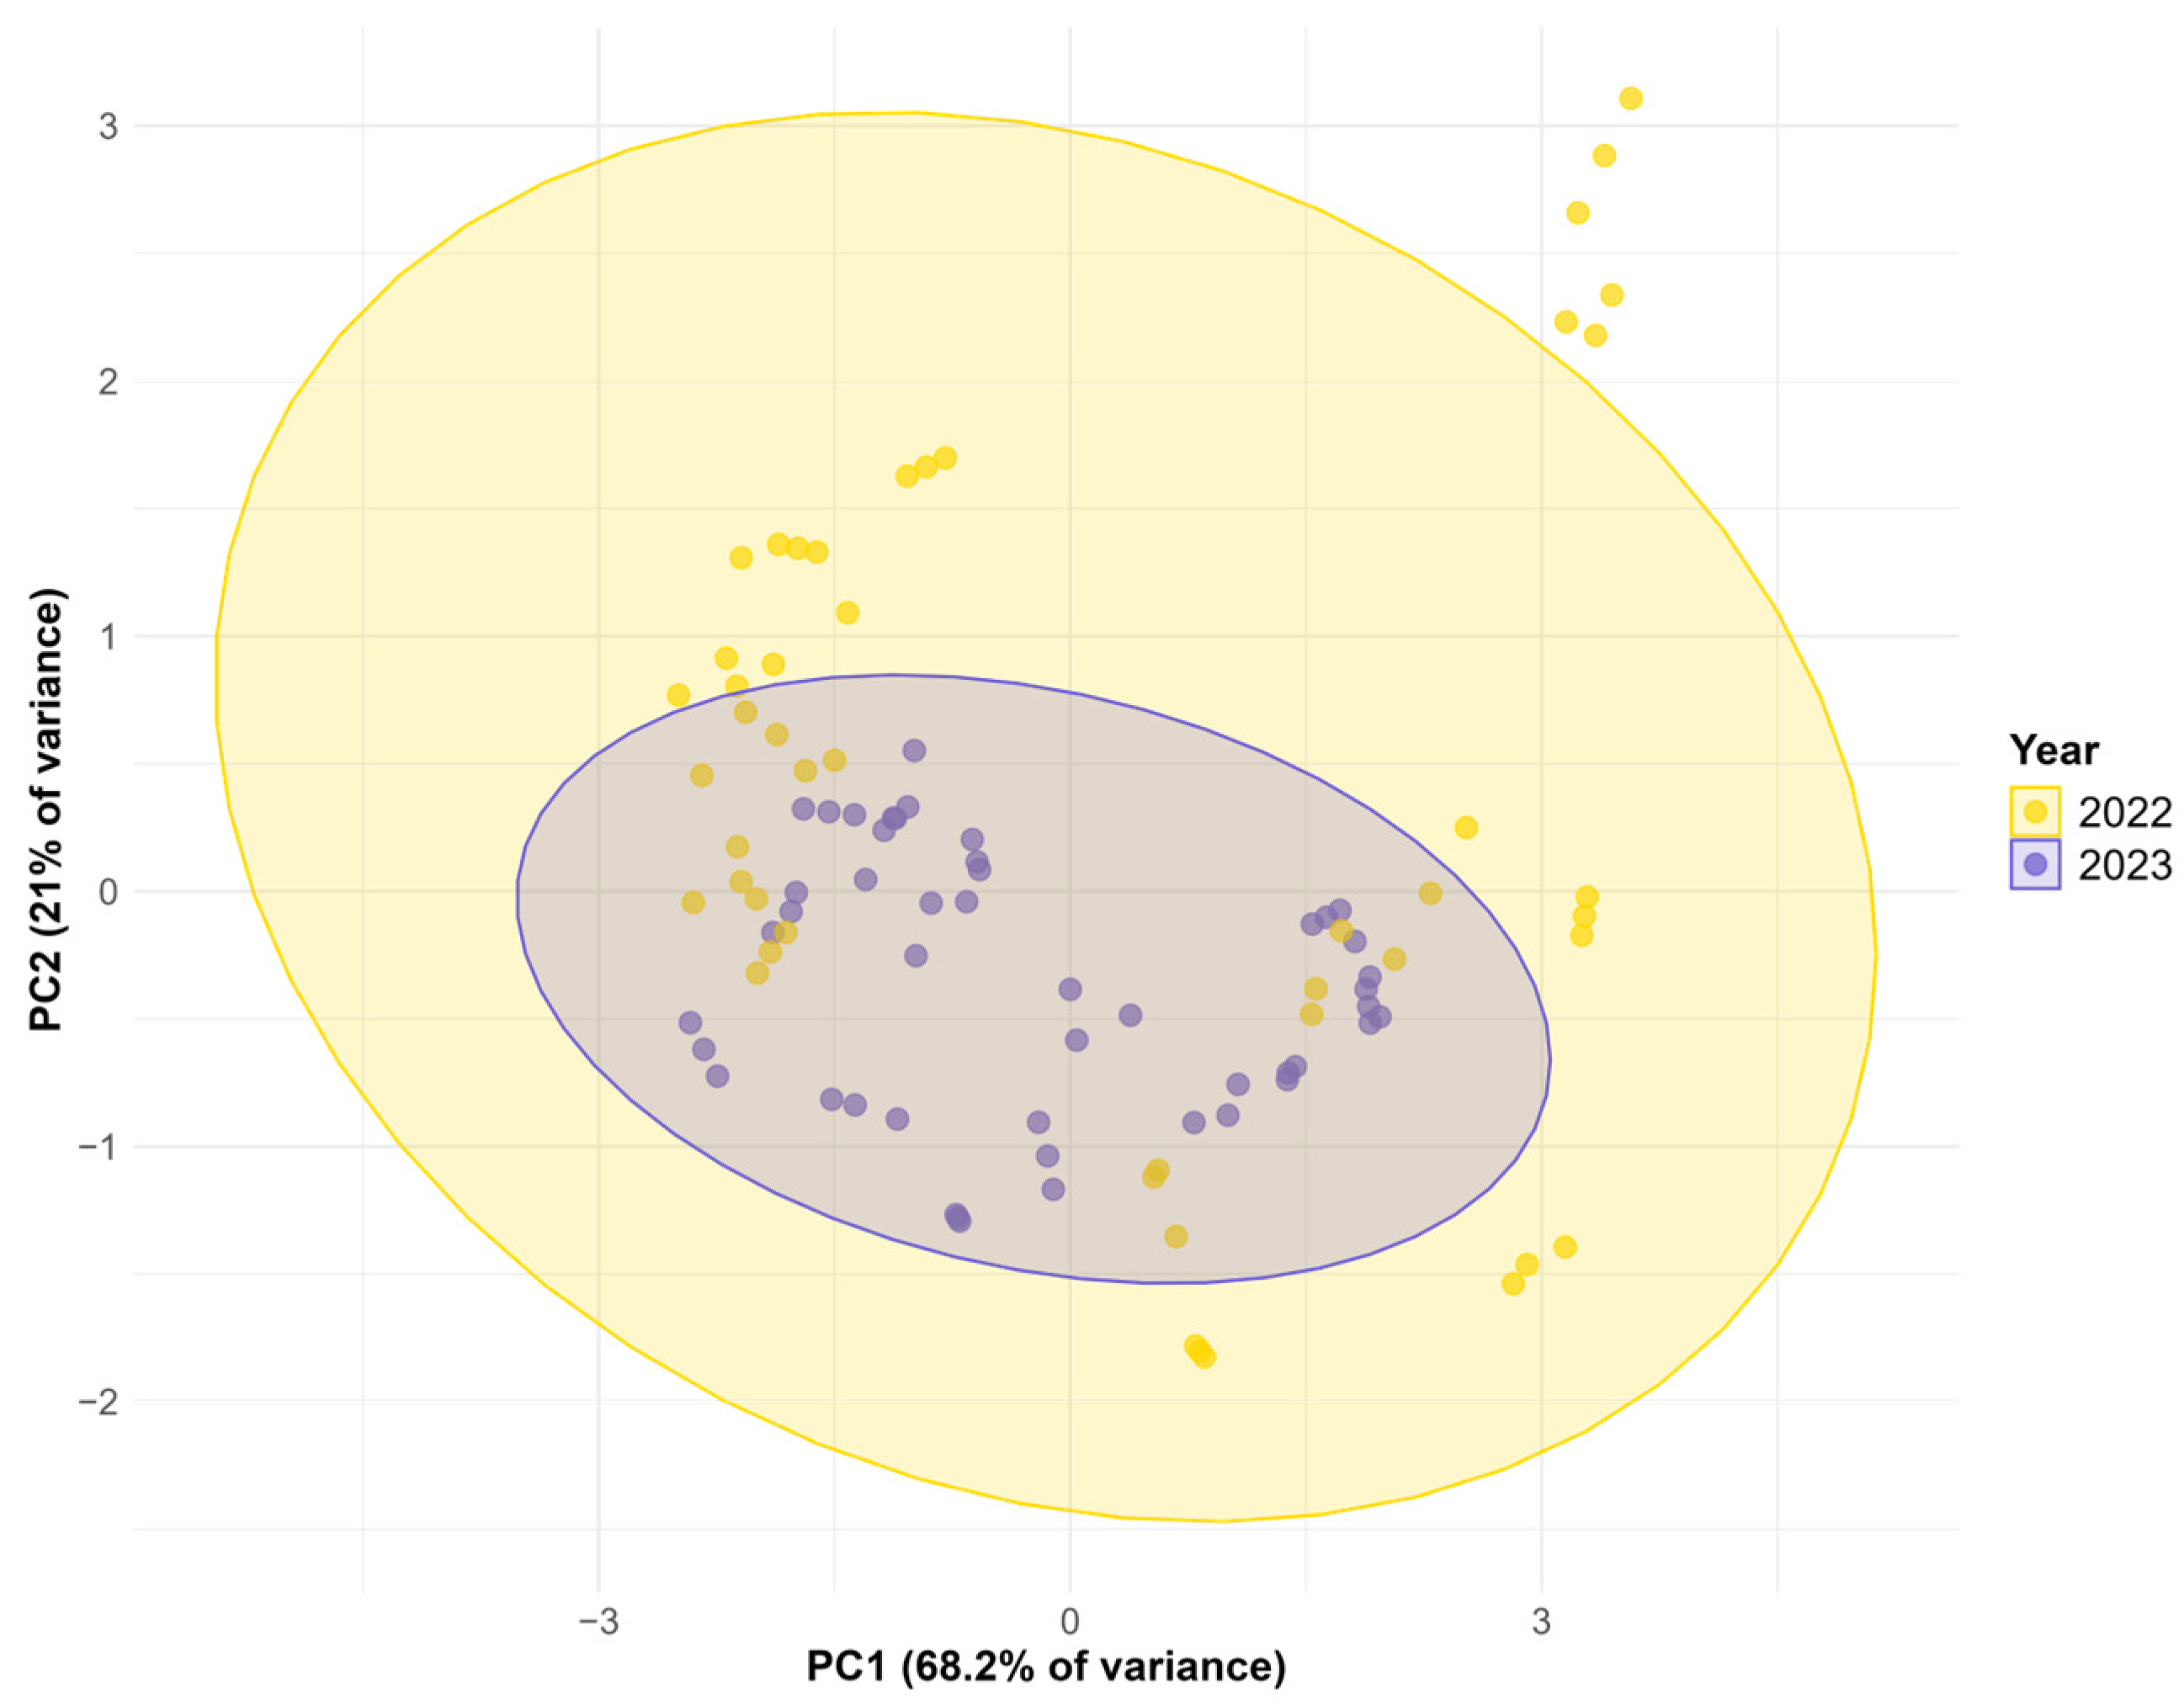
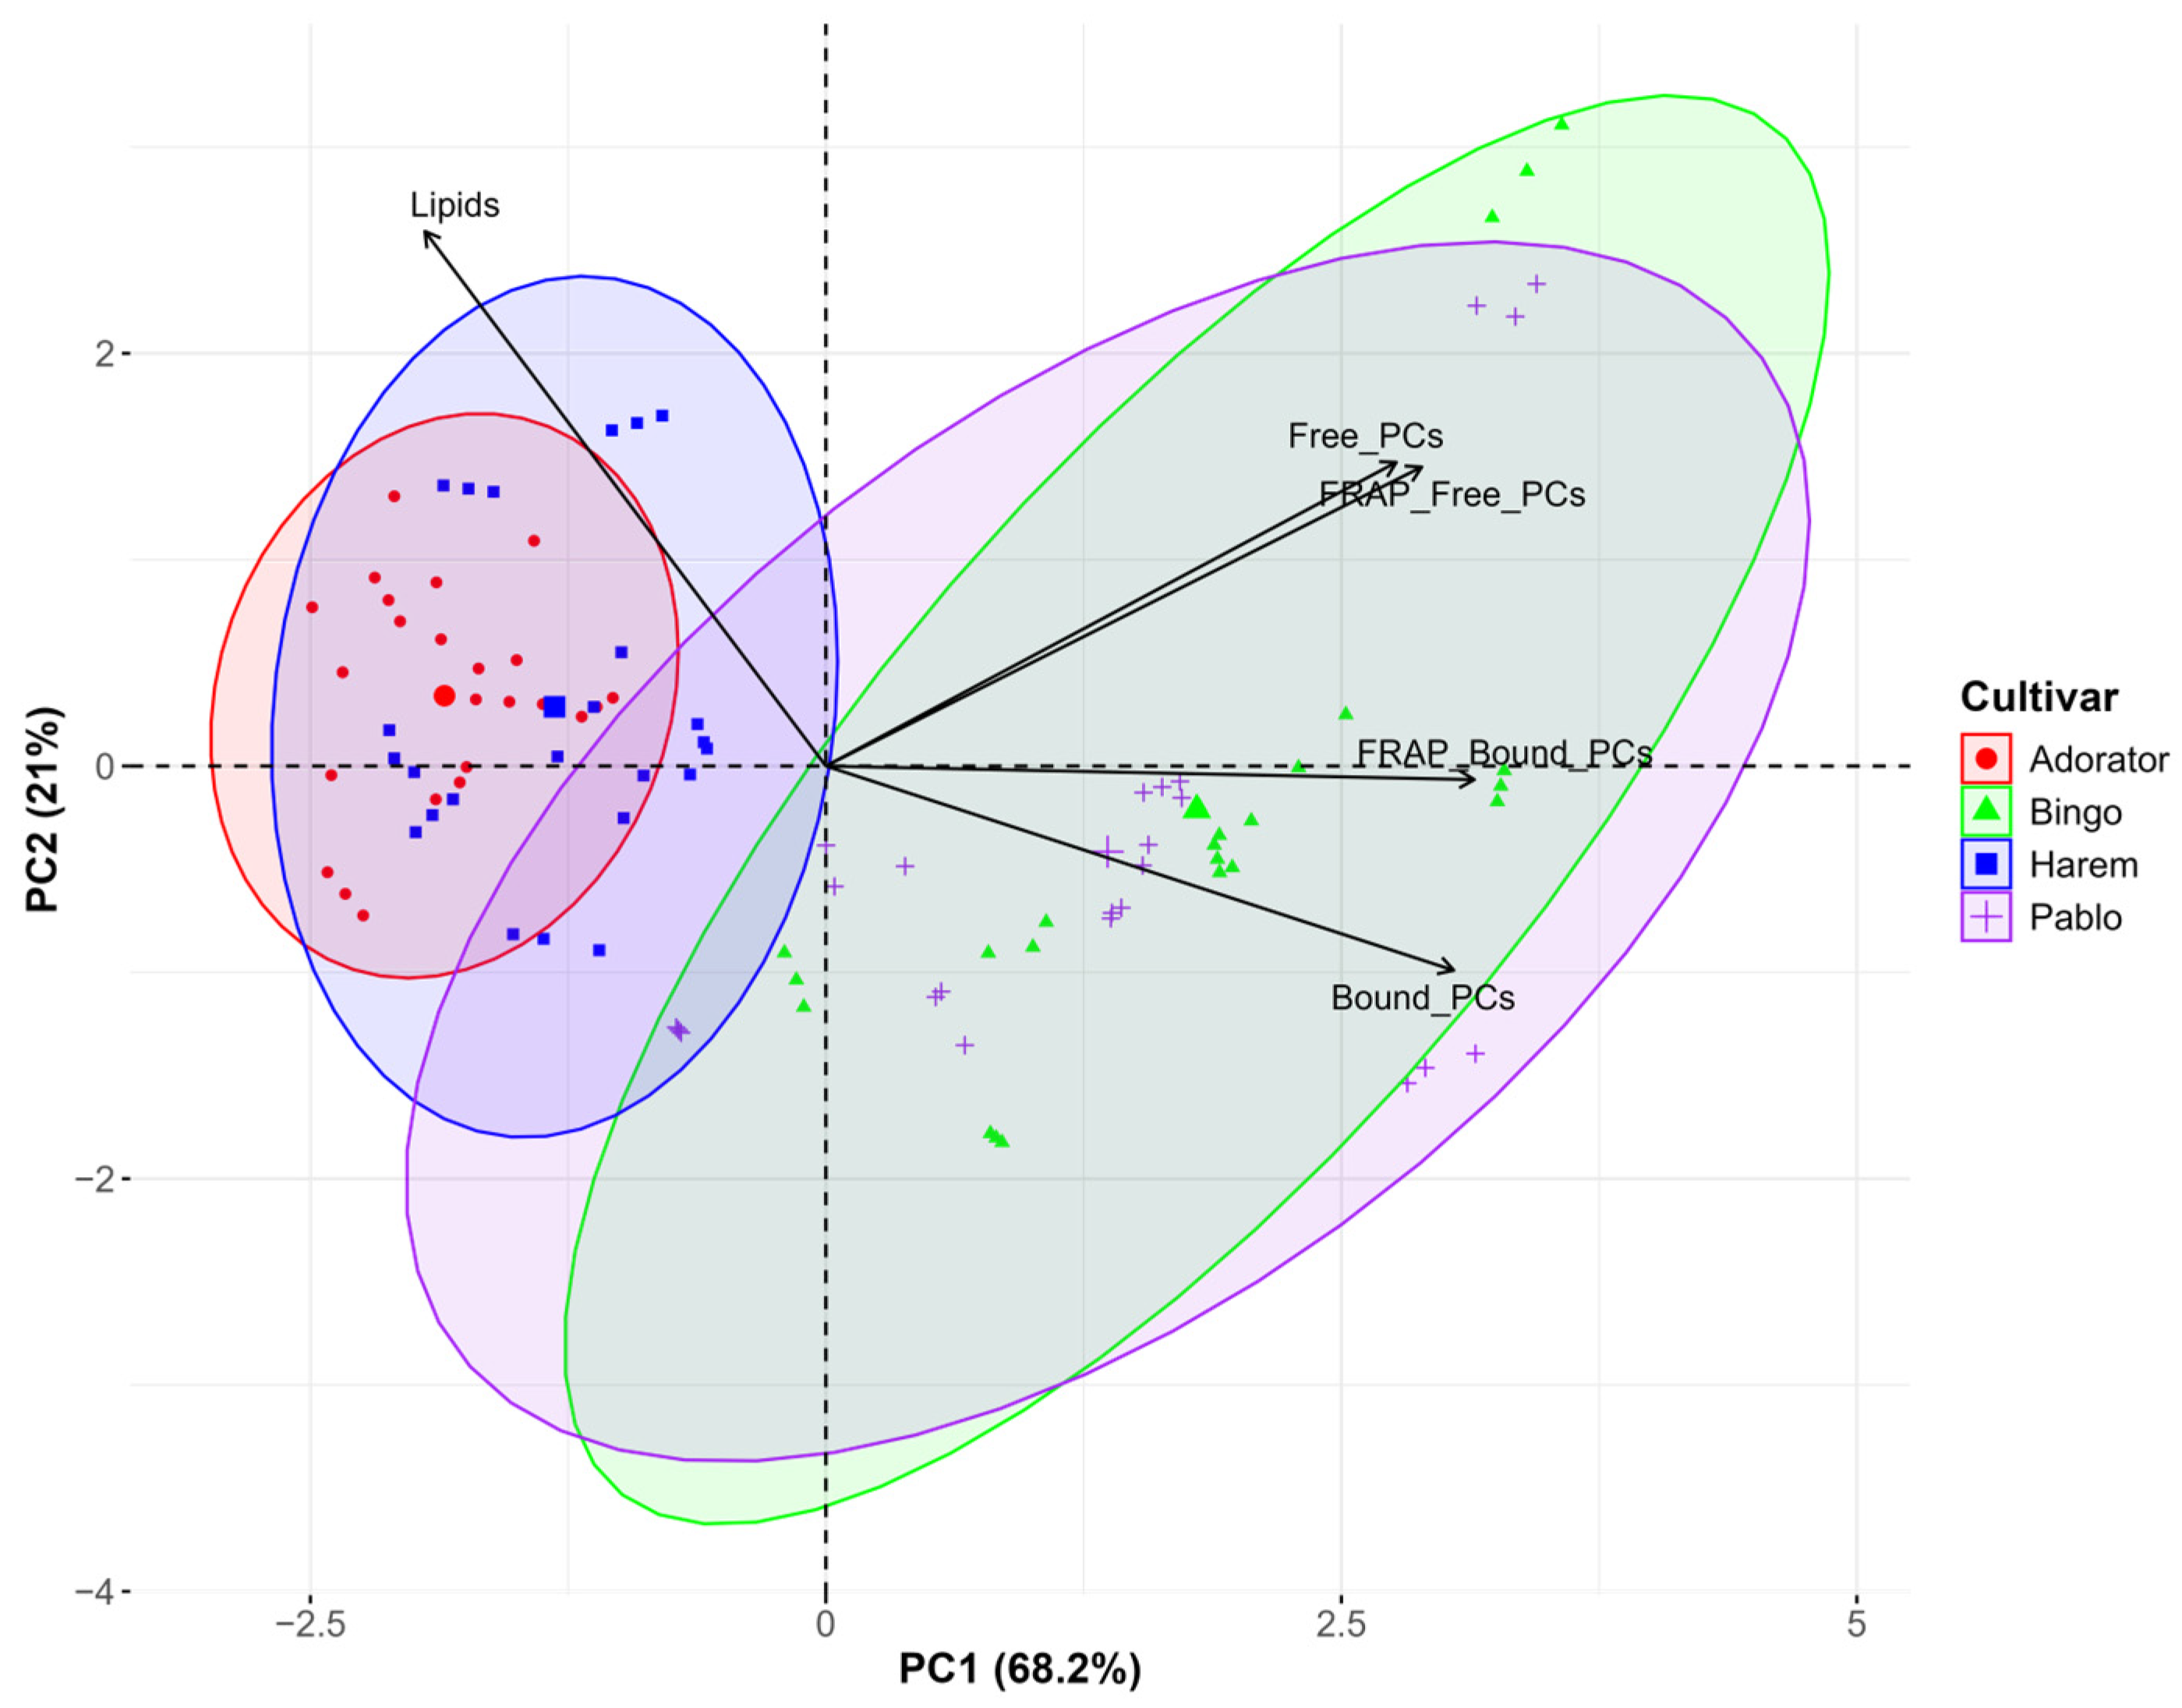
3.4. Statistical Evaluation of Environmental and Genetic Factors Affecting Biochemical Parameters in Oat

Data from biochemical analyses of naked and hulled oats grown in different places in the years 2022 and 2023 were developed using Principal Component Analysis (PCA). The main effects of the cultivar, location, and harvest year on the biochemical composition of the oat grains, including the content of free and bound phenolic compounds (FPCs and BPCs), their antioxidant activity (FRAP FPCs and FRAP BPCs), and lipid content, are presented in Table 6. Statistical significance (p-values) and effect sizes (η2G) indicate the relative contribution of genetic and environmental factors to these biochemical traits.
The effect of the cultivar (F3) is the dominant factor that influences all the measured parameters, with η2G values ranging from 0.95 to 1.0, suggesting an overwhelming genetic impact. Pablo exhibited the highest values of FPCs (225.38 mg kg−1), BPCs (2069.56 mg kg−1), FRAP FPCs (2.06 mmol kg−1), and FRAP BPCs (13.44 mmol kg−1), indicating its superior antioxidant potential. However, it had the lowest lipid content (6.69%). Bingo had a slightly lower phenolic content than Pablo, but still showed relatively high antioxidant activity. Its lipid content was also low (7.39%). Adorator and MHR Harem showed significantly lower phenolic content and antioxidant activity but had the highest lipid content (10.39% and 9.68%, respectively).
The location (F1) had a secondary influence on the content of phenolic compounds and antioxidant activity (η2G between 0.67 and 0.92), while its impact on the lipid content was moderate (η2G = 0.68). Marianowo exhibited the highest bound PA content (1620 mg kg−1), while Kochcice had the highest free PCs (186 mg kg−1) and lipid content (9.40%). Białogard and Marianowo showed similar lipid levels (8.38%), while Głodowo had the lowest lipid content (7.98%). These differences suggest that soil properties and agronomic practices, in combination with climatic conditions, influenced the composition of oats.
The effect of year (F2) was significant (p < 0.001) for all traits, but had a smaller effect size than the cultivar and the location (η2G = 0.50 to 0.90). 2022 showed a higher phenolic content and antioxidant activity, particularly for free PCs (190 mg kg−1 vs. 147 mg kg−1 in 2023) and FRAP FPCs (1.75 mmol kg−1 vs. 1.45 mmol kg−1 in 2023). The lipid content was also higher in 2022 (8.92%) compared to 2023 (8.15%), indicating that the environmental conditions in 2022 were more favorable to the accumulation of lipids. Climate data suggest that the temperature and precipitation of the vegetation season varied between years, which could affect the biosynthetic pathways of phenolic compounds and lipid metabolism.
Data from biochemical analyses of naked and hulled oats grown at different places in the years 2022 and 2023 were also developed by Principal Component Analysis (PCA).
The PCA of all tested biochemical parameters yielded two principal components that together explain 89.2% of the total variance (PC1 68.2% and PC2 21.0%).
Figure 1 presents the PCA score plot by location. According to this PCA biplot, samples from Kochcice are more widely scattered along PC1 and PC2, indicating greater internal variability. In contrast, samples from the other three locations cluster more closely together, with considerable overlap in their ellipses. The distinct distribution of Kochcice samples suggests that this location may have unique agronomic or climatic conditions that influence oat characteristics.
Figure 2 shows the PCA score plot by harvest year. The distribution indicates that all samples from 2023 form a smaller ellipse along both PC1 and PC2, suggesting lower variability and greater internal homogeneity. In contrast, the 2022 samples are enclosed by a larger ellipse, more extended along PC1 and PC2, indicating greater dispersion and variability among the samples. This increased variability in 2022 may be attributed to differing environmental or agronomic conditions affecting oat development in that year.
Figure 3 illustrates the PCA biplot showing the multivariate distribution of oat samples based on different cultivars.
The ellipses that represent the samples of two naked oat varieties are compact and overlap significantly, indicating that they share similarities in their scores of the principal components. Moreover, they are clearly separated from the other two, including samples from the Bingo and Pablo varieties, whose ellipses, although they also overlap to a large extent, are more dispersed. Furthermore, the contributions of the principal components and metabolite associations showed cultivar-specific biochemical profiles. The Adorator and MHR Harem are richer in lipids but contain fewer phenolic compounds (both free and bound forms), and what follows are characterized by lower antioxidant activities. However, Bingo and Pablo have higher amounts of free and bound phenolics, but lower levels of lipids.

4. Discussion

Oats (Avena sativa L.) are a plant that is grown throughout the world, and their economic importance continues to grow. Several health-promoting benefits of oats and their products have become the basis for their use in a nutritional model based on plant-based diets. One of the most well-documented benefits is the antioxidant activity of phenolic compounds [27,43,44,45]. They can scavenge reactive oxygen and nitrogen species, as well as chelate metals in both plants and animals that consume them [46]. Although many stimuli influence the level of phenolic compounds in oat seeds, the genetic factor is considered dominant [35,47,48]. In our study, the cultivar (genetic factor F3) also had the strongest influence on the biochemical composition of the oat grains, the hulled varieties exhibited a high phenolic content and antioxidant activities, but lower lipid levels, while the naked cultivars had a higher lipid content but a lower antioxidant potential of both phenolic fractions (Table 6). These antioxidants are present in both the groats and the hulls of the oat grains [33,34,49]. Furthermore, phenolics in oat seeds occur primarily as bound compounds, that is, conjugated insoluble or soluble forms [43,50,51,52]. Therefore, it is obvious that hulled varieties containing both parts are richer in these compounds, especially in their bound fractions, than naked cultivars. Unfortunately, most studies of phenolics in oats evaluated only their soluble fractions, excluding bound phenolics that are scarcely digested in the stomach and intestinal tract and, for this reason, are poorly bioavailable. However, bound phenolics in their intact forms act in the intestine as potent antioxidants and anti-inflammatory mediators. For this reason, in our study, the level of these phenolic compounds was examined in our study. Furthermore, its range in our tested oat varieties (87.6–3483.3 mg kg−1) was very similar to the results presented by Kovacova and Malinova [53] as the sum of ferulic and coumaric acids is the main part of the bound fraction of phenols in the oat kernel (256–3596 mg kg−1). These two acids, as well as caffeic acid, belong to hydroxycinnamic acids and comprise the highest proportion of phenolic compounds in cereals [43,54]. These acids are equally often selected as markers of free [33,47] and bound phenolic compounds in oat grains [43,55]. Therefore, only the extraction methodology of this group of acids determines the pool of phenols they represent.
However, it is worth emphasizing, as shown by Brindzova et al. (2008) [56], that the level of alcohol-soluble phenolic compounds is also higher in varieties with hulls than in those without husks, which is consistent with our results. Furthermore, the range of 264–417 mg kg−1 for free phenolics in the oat grains obtained by Emmons and Peterson [35] was slightly higher than our data (90.8–363.6 mg kg−1).
The level of phenolic compounds in cereals, including oat seeds, is positively correlated with the antioxidant capacity determined by the FRAP assay [57]. This was also confirmed in our work. The antioxidant capacities of our samples were markedly dependent on the level of phenolic compounds for both FPCs and BPCs (Figure S1). Additionally, Martinez-Miguel et al. (2018) [50] found that the dominant fraction of bound phenolics contributed to 59.02% to 67.86% of the total antioxidant activity estimated by the FRAP method.
The finding that naked oats (Adorator and MHR Harem) contain more fat than hulled oats is consistent with the literature [9,58,59]. Furthermore, the observation that genotype has a major impact on lipid concentration in oat kernels and that site (together with year) has a smaller effect is consistent with previous results [38,58].
The location of the oat cultivation (F1) played a secondary role in influencing the biochemical parameters of the oat grains analyzed by us, mainly in the biosynthesis of bound phenolics and their antioxidant capacities (Table 6). However, no confirmation of this result was found in the literature. This is because researchers studying phenolic compounds in oats tend to focus primarily on the free phenolics, which are bioavailable and readily absorbed in the upper digestive tract. In contrast, bound phenolics are often overlooked because they are not absorbed in the small intestine and instead pass through to the colon largely intact. Although they may exert effects in the colon, their limited bioavailability in the upper digestive tract reduces their prominence in studies focused on immediate absorption and systemic effects. It is a well-known fact that the biosynthesis of hydroxycinnamic acids is influenced by various external factors, such as nutrient availability in the soil and the use of pesticides [60]. Therefore, it can be assumed that location and, consequently, soil quality and agrotechnical treatments can significantly affect the content of bound phenolics, the main components being the aforementioned acids [61]. However, the year of cultivation (F2), which reflects the climatic conditions as a secondary factor, mainly affects the levels of free phenolic compounds and their antioxidant activity, as previously described [47]. The year 2022 generally showed higher phenolic content, antioxidant activity, and lipid levels than 2023, probably due to climatic variations. It was drier than 2023 in most locations (Table S1). Unfortunately, the limited number of studies on oats has shown that the content of individual acids representing the bound phenolic fraction in the husks decreases drastically in warmer and drier years [8]. Support for our differing observations was found only through the analysis of results obtained for other cereals, primarily wheat. Barański et al. (2020) [62], for example, found that this weather favored the accumulation of hydroxycinnamic acids in the flour of ancient wheat species. In turn, Kosik et al. (2014) [63] observed a markedly lower FPA content in the bran of wheat harvested in the wetter year. The fact that our results for both naked and husk varieties refer to whole oat grains and not just their selected parts may be the reason for the relationship described. Interestingly, this relationship was not observed at all (for FPCs and BPCs of varieties with husks), or it was the opposite one (BPCs of naked varieties and antioxidant activities of both fractions), only for crops from Marianowo. This location was the only one that did not differ markedly during total precipitation in the vegetation periods of the two analyzed years (Table S1). It is also worth emphasizing that Kochcice, as the only location in southern Poland, was characterized by the highest total precipitation totals in each cultivation year. Furthermore, Kochcice favored most of the parameters tested, that is, both the accumulation and antioxidant activity of FPCs, as well as lipid biosynthesis (Table 6). At the same time, this place presents the relationship described above, that is, higher values of most oat parameters in 2022 with a lower total rainfall during the growing season. Interestingly, when oats were grown in Kochcice, a different forecrop was used compared to the other locations (rapeseed in 2022 and soybeans in 2023). Taking into account the above information, we can assume that the nitrogen level in the soil in this location in 2023 was higher than in 2022. This probably contributed to the significant decrease in lipid content in all varieties and is consistent with the results described [58]. High protein levels resulting from the availability of high nitrogen are negatively correlated with both fat content [64] and total phenolic content, antioxidants, and ferric reduction capacities [65].
In summary, all tested biochemical parameters of oat seeds, i.e., the content of both FPCs and BPCs, their antioxidant capacities as well as lipid level, were determined mainly by genetic factors and environmental stimuli (soil and climate conditions in tested locations over 2 years) had a secondary and significant influence. Furthermore, bound phenolics are the dominant fraction of phenolic compounds, especially in hulled varieties of oats. These cultivars contained several-fold higher bound phenolic levels than the naked ones (on average 3–5 times more in our data, mainly for Białogard, Kochcice, and Marianowo). In Głodowo, this difference reached an average 16-fold higher level. In addition, the level of each fraction of phenolics was strongly positively correlated with its antioxidant activity estimated by the FRAP assay. The richest in lipids were the kernels of the naked varieties.
This study contributes to understanding both the phenolic compound and the lipid response to the growth conditions of oats (soil quality, agrotechnical practices, and climate conditions) while highlighting the importance of monitoring the influence that the environment can have on compounds of interest.

5. Conclusions

The genotype is the main determinant of phenolic content, antioxidant potential, and lipid levels in oat cultivars. Hulled oats generally contain significantly more free and bound phenolic compounds, especially the latter, while naked cultivars have a higher lipid content but significantly lower antioxidant potential of the phenolic fractions.
Environmental factors also influence these traits. The growing year had the greatest impact on free phenolics and their antioxidant activity, with 2022 providing generally more favorable conditions for their accumulation. On the contrary, bound phenolics and their antioxidant potential were more strongly affected by the location of the cultivation.
There is a strong positive correlation between the level of phenolic compounds and their antioxidant activity for the free and bound fractions.
These findings support targeted breeding for improved nutritional and functional traits of oats.

Supplementary Materials

The following supporting information can be downloaded at https://www.mdpi.com/article/10.3390/agronomy15061400/s1, Table S1: Weather conditions, soil properties, forecrop, and fertilization schedule for all locations and two years of cultivation; Figure S1: Pearson’s correlations between the concentration of phenolic compounds and their antioxidant activity: (A) correlation for free phenolics and their antioxidant capacities and (B) correlation for bound phenolics and their antioxidant power.

Author Contributions

Conceptualization, E.G.M. and S.J.P.; formal analysis, G.K.; investigation, E.G.M.; methodology, E.G.M.; resources, H.B. and E.G.M.; visualization, E.G.M. and G.K.; writing—original draft preparation, E.G.M. and G.K.; writing—review and editing, E.G.M., G.K. and S.J.P. All authors have read and agreed to the published version of the manuscript.

Funding

The APC was co-financed by the Research Centre for Cultivar Testing, Poland.

Data Availability Statement

Data are available upon request.

Conflicts of Interest

The authors declare no conflicts of interest.

References

  1. Ma, B.L.; Zheng, Z.; Ren, C. Chapter 6—Oat. In Crop Physiology Case Histories for Major Crops, 1st ed.; Sadras, V.O., Calderini, D.F., Eds.; Academic Press: Cambridge, MA, USA, 2020; pp. 222–248. [Google Scholar]
  2. Zwer, P.K. Oat: Overview. In Encyclopedia of Food Grains, 2nd ed.; Wrigley, C., Corke, H., Seetharaman, K., Faubion, J., Eds.; Elsevier: Oxford, UK, 2016; Volume 1, pp. 173–183. [Google Scholar] [CrossRef]
  3. Koroluk, A.; Paczos-Grzęda, E.; Sowa, S.; Boczkowska, M.; Toporowska, J. Diversity of polish oat cultivars with a glance at breeding history and perspectives. Agronomy 2022, 12, 2423. [Google Scholar] [CrossRef]
  4. Leggett, J.M.; Thomas, H. Oat evolution and cytogenetics. In The Oat Crop. World Crop Series, 1st ed.; Welch, R.W., Ed.; Springer: Dordrecht, The Netherlands, 1995; pp. 120–149. [Google Scholar] [CrossRef]
  5. Nan, J.; Ling, Y.; An, J.; Wang, T.; Chai, M.; Fu, J.; Wang, G.; Yang, C.; Yang, Y.; Han, B. Genome resequencing reveals independent domestication and breeding improvement of naked oat. GigaScience 2023, 12, giad061. [Google Scholar] [CrossRef]
  6. Valentine, J. Naked oats. In The Oat Crop. World Crop Series, 1st ed.; Welch, R.W., Ed.; Springer: Dordrecht, The Netherlands, 1995; pp. 504–532. [Google Scholar] [CrossRef]
  7. Burrows, V.D. Hulless oat development, application, and opportunities. In Oats: Chemistry and Technology, 2nd ed.; Webster, F.H., Wood, P.J., Eds.; American Association of Cereal Chemists, Inc.: Saint Paul, MN, USA, 2011; pp. 31–50. [Google Scholar] [CrossRef]
  8. Schmitz, E.; Nordberg Karlsso, E.; Adlercreutz, P. Warming weather changes the chemical composition of oat hulls. Plant Biol. 2020, 22, 1086–1091. [Google Scholar] [CrossRef]
  9. Biel, W.; Jacyno, E.; Kawęcka, M. Chemical composition of hulled, dehulled and naked oat grains. S. Afr. J. Anim. Sci. 2014, 44, 189–197. [Google Scholar] [CrossRef]
  10. Thompson, R.K.; Mustafa, A.F.; McKinnon, J.J.; Maenz, D.; Rossnagel, B. Genotypic differences in chemical composition and ruminal degradability of oat hulls. Can. J. Anim. Sci. 2000, 80, 377–379. [Google Scholar] [CrossRef]
  11. Yu, P.; McKinnon, J.J.; Christensen, D.A. Improving the nutritional value of oat hulls for ruminant animals with pretreatment of a multienzyme cocktail: In vitro studies. J. Anim. Sci. 2005, 83, 1133–1141. [Google Scholar] [CrossRef] [PubMed]
  12. Cameron, M.G.; Cremin, J.D., Jr.; Fahey, G.C., Jr.; Clark, J.H.; Berger, L.L.; Merchen, N.R. Chemically treated oat hulls in diets for dairy heifers and wethers: Effects on intake and digestion. J. Dairy Sci. 1991, 74, 190–201. [Google Scholar] [CrossRef]
  13. Wróblewska, P.; Hikawczuk, T.; Sierżant, K.; Wiliczkiewicz, A.; Szuba-Trznadel, A. Effect of oat hull as a source of insoluble dietary fibre on changes in the microbial status of gastrointestinal tract in broiler chickens. Animals 2022, 12, 2721. [Google Scholar] [CrossRef]
  14. Hikawczuk, T.; Szuba-Trznadel, A.; Wróblewska, P.; Wiliczkiewicz, A. Oat hull as a source of lignin-cellulose complex in diets containing wheat or barley and its effect on performance and morphometric measurements of gastrointestinal tract in broiler chickens. Agriculture 2023, 13, 896. [Google Scholar] [CrossRef]
  15. Leonova, S.; Shelenga, T.; Hamberg, M.; Konarev, A.V.; Loskutov, I.; Carlsson, A.S. Analysis of oil composition in cultivars and wild species of sat (Avena sp.). J. Agric. Food Chem. 2008, 56, 7983–7991. [Google Scholar] [CrossRef]
  16. Martínez-Villaluenga, C.; Penas, E. Health benefits of oat: Current evidence and molecular mechanisms. Curr. Opin. Food Sci. 2017, 14, 26–31. [Google Scholar] [CrossRef]
  17. Saccomanno, B.; Chambers, A.H.; Hayes, A.; Mackay, I.; McWilliam, S.C.; Trafford, K. Starch granule morphology in oat endosperm. J. Cereal Sci. 2017, 73, 46–54. [Google Scholar] [CrossRef]
  18. Klose, C.; Arendt, E.K. Proteins in oats; their synthesis and changes during germination: A review. Crit. Rev. Food Sci. Nutr. 2012, 52, 629–639. [Google Scholar] [CrossRef]
  19. Gell, G.; Kovacs, K.; Veres, G.; Korponay-Szabo, I.R.; Juhasz, A. Characterization of globulin storage proteins of a low prola-min cereal species in relation to celiac disease. Sci. Rep. 2017, 7, 39876. [Google Scholar] [CrossRef]
  20. Maheshwari, G.; Sowrirajan, S.; Joseph, B. β-Glucan, a dietary fiber in effective prevention of lifestyle diseases—An insight. Bioact. Carbohydr. Diet. Fibre 2019, 19, 100187. [Google Scholar] [CrossRef]
  21. Ahmet, B.U.G.; Musa, O.M.; Ziya, D.; Nurhans, U. Oil contents and fatty acid composition of oat (Avena sativa L.) seed and oils. J. Agroaliment. Proc. Technol. 2019, 25, 182–186. [Google Scholar]
  22. Ekholm, P.; Virkki, L.; Ylinen, M.; Johansson, L.; Varo, P. Effects of natural chelating agents on the solubility of some physiologically important mineral elements in oat bran and oat flakes. Cereal Chem. 2000, 77, 562–566. [Google Scholar] [CrossRef]
  23. Kim, I.S.; Hwang, C.W.; Yang, W.S.; Kim, C.H. Multiple antioxidative and bioactive molecules of oats (Avena sativa L.) in human health. Antioxidants 2021, 10, 1454. [Google Scholar] [CrossRef]
  24. Collins, F.W. Oat phenolics: Biochemistry and biological functionality. In Oats: Chemistry and Technology, 2nd ed.; Webster, F.H., Wood, P.J., Eds.; American Association of Cereal Chemists, Inc.: Saint Paul, MN, USA, 2011; pp. 157–217. [Google Scholar] [CrossRef]
  25. Collins, F.W. Oat phenolics: Structure, occurrence, and function. In Oats: Chemistry and Technology; Webster, F.H., Ed.; American Association of Cereal Chemists, Inc.: St. Paul, MN, USA, 1986; pp. 227–295. [Google Scholar]
  26. Varga, M.; Jójárt, R.; Fónad, P.; Mihály, R.; Palágyi, A. Phenolic composition and antioxidant activity of colored oats. Food Chem. 2018, 268, 153–161. [Google Scholar] [CrossRef]
  27. Bei, Q.; Liu, Y.; Wang, L.; Chen, G.; Wu, Z. Improving free, conjugated, and bound phenolic fractions in fermented oats (Avena sativa L.) with Monascus anka and their antioxidant activity. J. Funct. Foods 2017, 32, 185–194. [Google Scholar] [CrossRef]
  28. Krygier, K.; Sosulski, F.; Hogge, L. Free, esterified, and insoluble-bound phenolic acids. 1. Extraction and purification procedure. J. Agric. Food Chem. 1982, 30, 330–334. [Google Scholar] [CrossRef]
  29. Collins, F.W. Oat phenolics—avenanthramides, novel substituted n-cinnamoylanthranilate alkaloids from oat groats and hulls. J. Agric. Food Chem. 1989, 37, 60–66. [Google Scholar] [CrossRef]
  30. Antonini, E.; Diamantini, G.; Ninfali, P. The effect of mechanical processing on avenanthramide and phenol levels in two organically grown Italian oat cultivars. J. Food Sci. Technol. 2017, 54, 2279–2287. [Google Scholar] [CrossRef]
  31. Kulbat, K. The role of phenolic compounds in plant resistance. Biotechnol. Food Sci. 2016, 80, 97–108. [Google Scholar] [CrossRef]
  32. Kumar, K.; Debnath, P.; Singh, S.; Kumar, N. An overview of plant phenolics and their involvement in abiotic stress tolerance. Stresses 2023, 3, 570–585. [Google Scholar] [CrossRef]
  33. Bryngelsson, S.; Mannerstedt-Fogelfors, B.; Kamal-Eldin, A.; Andersson, R.; Dimberg, L.H. Lipids and antioxidants in groats and hulls of Swedish oats (Avena sativa L.). J. Sci. Food Agric. 2002, 82, 606–614. [Google Scholar] [CrossRef]
  34. Emmons, C.L.; Peterson, D.M. Antioxidant activity and phenolic contents of oat groats and hulls. Cereal Chem. 1999, 76, 902–906. [Google Scholar] [CrossRef]
  35. Emmons, C.L.; Peterson, D.M. Antioxidant activity and phenolic content of oat as affected by cultivar and location. Crop Sci. 2001, 41, 1676–1681. [Google Scholar] [CrossRef]
  36. Tang, Y.; Li, S.; Yan, J.; Peng, Y.; Weng, W.; Yao, X.; Gao, A.; Cheng, J.; Ruan, J.; Xu, B. Bioactive components and health functions od oat. Food Rev. Int. 2023, 39, 4545–4564. [Google Scholar] [CrossRef]
  37. Singh, R.; De, S.; Belkheir, A. Avena sativa (oat), a potential neutraceutical and therapeutic agent: An overview. Crit. Rev. Food Sci. Nutr. 2013, 53, 126–144. [Google Scholar] [CrossRef]
  38. Doehlert, D.C.; McMullen, M.S.; Hammond, J.J. Genotypic and environmental effects on grain yield and quality of oat grown in North Dakota. Crop Sci. 2001, 41, 1066–1072. [Google Scholar] [CrossRef]
  39. Gorash, A.; Armoniene, R.; Fetch, J.M.; Liatukas, Z.; Danyte, V. Aspects in oat breeding: Nutrition quality, nakedness and disease resistance, challenges and perspectives. Ann. Appl. Biol. 2017, 171, 281–302. [Google Scholar] [CrossRef]
  40. Singleton, V.L.; Orthofer, R.; Lamuela-Raventós, R.M. Analysis of total phenols and other oxidation substrates and antioxidants by means of folin-ciocalteu reagent. Methods Enzymol. 1999, 299, 152–178. [Google Scholar] [CrossRef]
  41. Benzie, I.F.; Strain, J.J. The ferric reducing ability of plasma (FRAP) as a measure of “antioxidant power”: The FRAP assay. Anal. Biochem. 1996, 239, 70–76. [Google Scholar] [CrossRef] [PubMed]
  42. Folch, J.; Lees, M.; Sloane Stanley, G.H. A simple method for the isolation and purification of total lipids from animal tissues. J. Biol. Chem. 1957, 226, 497–509. [Google Scholar] [CrossRef] [PubMed]
  43. Adom, K.K.; Liu, R.H. Antioxidant activity of grains. J. Agric. Food Chem. 2002, 50, 6182–6187. [Google Scholar] [CrossRef]
  44. Hitayezu, R.; Baakdah, M.M.; Kinnin, J.; Henderson, K.; Tsopmo, A. Antioxidant activity, avenanthramide and phenolic acid contents of oat milling fractions. J. Cereal Sci. 2015, 63, 35–40. [Google Scholar] [CrossRef]
  45. Tong, L.; Liu, L.; Zhong, K.; Wang, Y.; Guo, L.; Zhou, S. Effects of cultivar on phenolic content and antioxidant activity of naked oat in China. J. Integr. Agric. 2014, 13, 1809–1816. [Google Scholar] [CrossRef]
  46. Chen, C.; Milbury, P.E.; Kwak, H.; Collins, F.W.; Sameul, P.; Blumburg, J.B. Avenanthramides and phenolic acids from oats are bioavailable and act synergistically with vitamin C to enhance hamster and human LDL resistance to oxidation. J. Nutr. 2004, 134, 1459–1466. [Google Scholar] [CrossRef]
  47. Dimberg, L.H.; Gissen, C.; Nilsson, J. Phenolic compounds in oat grains (Avena sativa L.) grown in conventional and organic systems. AMBIO A J. Hum. Environ. 2005, 34, 331–337. [Google Scholar] [CrossRef]
  48. Menga, V.; Fares, C.; Troccoli, A.; Cattivelli Land Baiano, A. Effects of genotype, location and baking on the phenolic content and some antioxidant properties of cereal species. Int. J. Food Sci. 2010, 5, 7–16. [Google Scholar] [CrossRef]
  49. Collins, F.W.; McLachlan, D.C.; Blackwell, B.A. Oat phenolics: Avenalumic acids, a new group of bound phenolic acids from oat groats and hulls. Cereal Chem. 1991, 68, 184–189. [Google Scholar]
  50. Martinez-Miguel, G.; Trevino-Ramírez, J.E.; Urias-Orona, V.; Zavala-García, F.; Ninno-Medina, G. Contribution of bound phenolic compounds to the total phenol content and antioxidant capacity of oat (Avena sativa) grain fractions. Can. J. Plant Sci. 2018, 98, 1–4. [Google Scholar] [CrossRef]
  51. Acosta-Estrada, B.A.; Gutiérrez-Uribe, J.A.; Serna-Saldivar, S.O. Bound phenolics in foods, a review. Food Chem. 2014, 152, 46–55. [Google Scholar] [CrossRef] [PubMed]
  52. Mattila, P.; Pihlava, J.M.; Hellstrom, J. Contents of phenolic acids, alkyl- and alkenylresorcinols, and avenanthramides in commercial grain products. J. Agric. Food Chem. 2005, 53, 8290–8295. [Google Scholar] [CrossRef]
  53. Kovacova, M.; Malinova, E. Ferulic and coumaric acids, total phenolic compounds and their correlation in selected oat genotypes. Czech J. Food Sci. 2007, 25, 325–332. [Google Scholar] [CrossRef]
  54. Faulds, C.B.; Williamson, G. Review: The role of hydroxycinnamates in the plant cell wall. J. Sci. Food Agric. 1999, 79, 393–395. [Google Scholar] [CrossRef]
  55. Rao, R.S.P.; Muralikrishna, G. Non-starch polysaccharides-phenolic acid complexes from native and germinated cereals and millet. Food Chem. 2004, 84, 527–531. [Google Scholar] [CrossRef]
  56. Brindzova, L.; Certik, M.; Rapta, P.; Zalibera, M.; Mikulajova, A.; Takacsova, M. Antioxidant activity, β-glucan and lipid contents of oat varieties. Czech J. Food Sci. 2008, 26, 163–173. [Google Scholar] [CrossRef]
  57. Hodzic, Z.; Pasalic, H.; Memisevic, A.; Srabovic, M.; Saletovic, M.; Poljakovic, M. The influence of total phenols content on antioxidant capacity in the whole grain extracts. Eur. J. Sci. Res. 2009, 28, 471–477. [Google Scholar]
  58. Givens, D.I.; Davies, T.W.; Laverick, R.M. Effect of variety, nitrogen fertilizer and various agronomic factors on the nutritive value of husked and naked oats grain. Anim. Feed. Sci. Technol. 2004, 113, 169–181. [Google Scholar] [CrossRef]
  59. Kourimska, L.; Sabolova, M.; Horcicka, P.; Rys, S.; Bozik, M. Lipid content, fatty acid profile, and nutritional value of new oat cultivars. J. Cereal Sci. 2018, 84, 44–48. [Google Scholar] [CrossRef]
  60. Khawula, S.; Gokul, A.; Niekerk, L.A.; Basson, G.; Keyster, M.; Badiwe, M.; Klein, A.; Nkomo, M. Insights into the effects of hydroxycinnamic acid and its secondary metabolites as antioxidants for oxidative stress and plant growth under environmental stresses. Curr. Issues Mol. Biol. 2024, 46, 81–95. [Google Scholar] [CrossRef] [PubMed]
  61. Multari, S.; Pihlava, J.M.; Ollennu-Chuasam, P.; Hietaniemi, V.; Yang, B.; Suomela, J.P. Identification and quantification of avenanthramides and free and bound phenolic acids in eight cultivars of husked oat (Avena sativa L.) from Finland. J. Agric. Food Chem. 2018, 66, 2900–2908. [Google Scholar] [CrossRef]
  62. Barański, M.; Lacko-Bartosova, M.; Rembiałkowska, E.; Lacko-Bartosovs, L. The effect of species and cultivation year on phenolic acids content in ancient wheat. Agronomy 2020, 10, 673. [Google Scholar] [CrossRef]
  63. Kosik, T.; Lacko-Bartosova, M.; Kobida, L. Free phenol content and antioxidant activity of winter wheat in sustainable farming system. J. Microbiol. Biotech. Food Sci. 2014, 3, 247–249. [Google Scholar]
  64. Ortiz-Robledo, F.; Villanueva-Fierro, I.; Dave Oomah, B.; Lares-Asef, I.; Proal-Nájera, J.B.; Návar-Chaidez, J.J. Avenanthramides and nutritional components of four mexican oat (Avena sativa L.) varieties. Agrociencia 2013, 47, 225–232. [Google Scholar]
  65. Jimenez-Pulido, I.J.; Daniel, R.; Perez, J.; Martínez-Villaluenga, C.; De Luis, D.; Martín Diana, A.B. Impact of Protein Content on the Antioxidants, Anti-Inflammatory Properties and Glycemic Index of Wheat and Wheat Bran. Foods 2022, 11, 2049. [Google Scholar] [CrossRef]
Figure 1. PCA biplot showing the effect of location on the parameters tested of oat cultivars.
Agronomy 15 01400 g001
Figure 2. PCA biplot showing the distribution of samples based on the harvest year.
Agronomy 15 01400 g002
Figure 3. PCA biplot showing the impact of genotype on the parameters tested.
Agronomy 15 01400 g003
Table 1. Level of free phenolic compounds in oat kernels of four cultivars grown in various locations in Poland in two vegetative seasons.
CultivarYearConcentration of Free Phenolic Compounds [mg kg−1 DW]
Growth Location
BiałogardGłodowoKochciceMarianowo
Adorator2022153.30 ± 14.84 hijk161.38 ± 1.98 hij124.46 ± 1.38 lmno113.50 ±2.82 mnop
202390.77 ± 3.80 p101.60 ± 8.33 op95.91 ± 13.81 p111.85 ± 1.38 nop
MHR Harem2022194.44 ± 2.85 def137.26 ± 3.21 jklmn132.81 ± 3.57 klmn114.82 ± 3.36 mnop
2023148.34 ± 9.99 ijkl139.84 ± 11.30 jklm117.60 ± 1.12 mnop124.99 ± 2.14 lmno
Bingo2022172.68 ± 12.80 fghi211.85 ± 7.29 cd338.13 ± 4.86 a163.99 ± 1.92 ghij
2023171.46 ± 14.43 fghi174.05 ± 1.34 fghi125.56 ± 4.24 klmno174.88 ± 1.52 fghi
Pablo2022237.99 ± 19.38 bc253.45 ± 1.37 b363.58 ± 19.88 a170.94 ± 0.48 fghi
2023208.17 ± 4.13 de198.33 ± 5.73 def190.02 ± 16.80 defg180.59 ± 3.85 efgh
Data are shown as mean ± standard deviation, n = 3 plots per treatment, letters compare all means in the table; means sharing any letter are not significantly different at p < 0.05 (Tukey HSD).
Table 2. Content of bound phenolic compounds in seeds of various oat cultivars from different locations in Poland in two vegetative seasons.
CultivarYearConcentration of Bound Phenolic Compounds [mg kg−1 DW]
Growth Location
BiałogardGłodowoKochciceMarianowo
Adorator2022580.87 ± 37.70 kl87.59 ± 7.25 m450.51 ± 5.01 kl409.63 ± 37.47 l
2023509.69 ± 31.51 kl483.29 ± 50.81 kl530.61 ± 0.98 kl867.87 ± 94.17 i
MHR Harem2022487.26 ± 12.32 kl129.12 ± 14.17 m644.42 ± 37.15 jk447.92 ± 2.07 kl
2023606.35 ± 25.71 kl824.30 ± 32.61 ij625.03 ± 65.77 jk1113.80 ± 82.33 h
Bingo20223483.28 ± 153.94 a2404.21 ± 58.25 cde2312.40 ± 60.34 e2441.32 ± 63.95 cde
20231423.43 ± 48.99 g2562.19 ± 3.98 c1473.12 ± 67.63 g2359.97 ± 147.49 cde
Pablo20221844.99 ± 148.29 f2554.90 ± 44.49 cd2030.39 ± 51.79 f2418.77 ± 24.09 cde
20231308.65 ± 96.91 gh2358.09 ± 32.84 de1151.35 ± 14.67 h2889.33 ± 18.85 b
Data are shown as mean ± standard deviation, n = 3 plots per treatment, letters compare all means in the table; means sharing any letter are not significantly different at p < 0.05 (Tukey HSD).
Table 3. Antioxidant activity of free phenolic compounds isolated from grains of oat cultivars grown in various locations in Poland in two vegetative seasons.
CultivarYearAntioxidant Activity of Free Phenolic Compounds [mmol kg−1 DW]
Growth Location
BiałogardGłodowoKochciceMarianowo
Adorator20221.12 ± 0.15 jklm1.34 ± 0.04 hijk1.20 ± 0.05 ijklm0.95 ± 0.10 m
20230.56 ± 0.06 n1.11 ± 0.01 jklm1.60 ± 0.01 gh1.38 ± 0.08 hij
MHR Harem20221.96 ± 0.09 ef1.26 ± 0.02 ijkl1.31 ± 0.07 hijkl1.01 ± 0.08 lm
20231.23 ± 0.20 ijklm1.34 ± 0.10 hijk1.06 ± 0.17 klm1.46 ± 0.09 hi
Bingo20222.23 ± 0.03 cde2.07 ± 0.04 def3.02 ± 0.06 a1.25 ± 0.02 ijklm
20231.10 ± 0.06 jklm1.81 ± 0.04 fg0.94 ± 0.02 m2.39 ± 0.15 bc
Pablo20222.26 ± 0.19 cde2.67 ± 0.07 b3.22 ± 0.10 a1.18 ± 0.00 ijklm
20231.44 ± 0.19 hi2.31 ± 0.02 cd1.11 ± 0.16 jklm2.26 ± 0.06 cde
Data are shown as mean ± standard deviation, n = 3 plots per treatment, letters compare all means in the table; means sharing any letter are not significantly different at p < 0.05 (Tukey HSD).
Table 4. Antioxidant activity of bound phenolic compounds of caryopses of oat varieties grown in four locations in Poland in two vegetative seasons.
CultivarYearAntioxidant Activity of Bound Phenolic Compounds [mmol kg−1 DW]
Growth Location
BiałogardGłodowoKochciceMarianowo
Adorator20226.43 ± 0.11 k0.83 ± 0.01 n6.65 ± 0.23 jk3.45 ± 0.26 m
20235.51 ± 0.28 l6.57 ± 0.24 k6.41 ± 0.05 k9.43 ± 0.09 f
MHR Harem20225.12 ± 0.13 l1.28 ± 0.20 n7.39 ± 0.03 ij4.83 ± 0.14 l
20238.27 ± 0.27 gh8.34 ± 0.06 g6.45 ± 0.01 k10.81 ± 0.27 de
Bingo202217.47 ± 0.44 a11.13 ± 0.86 d16.81 ± 0.35 ab10.25 ± 0.00 e
202313.11 ± 0.18 c13.05 ± 0.17 c7.72 ± 0.01 ghi12.91 ± 0.17 c
Pablo202216.57 ± 0.14 b17.50 ± 0.10 a16.83 ± 0.11 ab10.14 ± 0.02 ef
202313.18 ± 0.11 c12.80 ± 0.02 c7.59 ± 0.06 hi12.95 ± 0.02 c
Data are shown as mean ± standard deviation, n = 3 plots per treatment, letters compare all means in the table; means sharing any letter are not significantly different at p < 0.05 (Tukey HSD).
Table 5. Percentage content of lipids of oat kernels of various varieties grown in different locations in Poland in two vegetative seasons.
CultivarYearLipid Content [%]
Growth Location
BiałogardGłodowoKochciceMarianowo
Adorator202211.24 ± 0.98 bc10.11 ± 0.32 cdefgh11.62 ± 1.23 ab10.87 ± 0.99 bcde
20239.34 ± 0.34 fghi9.63 ± 0.12 efgh9.97 ± 0.31 cdefgh10.32 ± 0.08 bcdefg
MHR Harem202211.10 ± 0.10 bcd8.73 ± 0.32 hijk12.67 ± 0.20 a9.08 ± 0.02 fghi
20239.69 ± 0.14 defgh8.95 ± 0.52 ghij7.47 ± 0.39 klm9.72 ± 0.76 defgh
Bingo20225.23 ± 0.03 o6.85 ± 0.23 lmn9.91 ± 0.29 cdefgh7.14 ± 0.65 lmn
20238.11 ± 0.33 ijkl7.15 ± 0.03 lmn7.08 ± 0.06 lmn7.61 ± 0.29 jklm
Pablo20226.54 ± 0.11 mno5.88 ± 0.07 no10.46 ± 0.03 bcdef5.23 ± 0.05 o
20235.79 ± 0.01 no6.53 ± 0.06 mno6.00 ± 0.34 no7.07 ± 0.60 lmn
Data are shown as mean ± standard deviation, n = 3 plots per treatment, letters compare all means in the table; means sharing any letter are not significantly different at p < 0.05 (Tukey HSD).
Table 6. Three-way analysis of variance of various effects of cultivar, location, and year on the biochemical parameters of oats.
Main EffectFree
PCs
Bound
PCs
FRAP
Free PCs
FRAP
Bound PCs
Lipids
mg kg−1 DWmg kg−1 DWmmol kg−1 DWmmol kg−1 DW%
DW
Location (F1)
Białogard172.14 b1280.56 c1.49 b10.71 a8.38 b
Głodowo172.22 b1425.46 b1.74 a8.94 c7.98 c
Kochcice186.01 a1152.23 d1.68 a9.48 b9.40 a
Marianowo144.44 c1618.58 a1.48 b9.35 b8.38 b
Year (F2)
2022190.29 a1420.47 a1.75 a9.54 b8.92 a
2023147.12 b1317.94 b1.44 b9.70 a8.15 b
Cultivar (F3)
Adorator119.10 d490.01 d1.16 d5.66 d10.39 a
MHR Harem138.76 c609.78 c1.33 c6.57 c9.68 b
Bingo191.57 b2307.49 a1.85 b12.81 b7.39 c
Pablo225.38 a2069.56 b2.06 a13.45 a6.69 d
p-value F1p < 0.001p < 0.001p < 0,001p < 0.001p < 0.001
p-value F2p < 0.001p < 0.001p < 0.001p < 0.001p < 0.001
p-value F3p < 0.001p < 0.001p < 0.001p < 0.001p < 0.001
Effect size (η2G)-F10.820.920.670.920.68
Effect size (η2G)-F20.900.500.790.140.53
Effect size (η2G)-F30.971.00.961.00.95
The results with the same letter are not significantly different; values of each column were analyzed separately; PCs—phenolic compounds; FRAP—ferric reducing antioxidant power.
Disclaimer/Publisher’s Note: The statements, opinions and data contained in all publications are solely those of the individual author(s) and contributor(s) and not of MDPI and/or the editor(s). MDPI and/or the editor(s) disclaim responsibility for any injury to people or property resulting from any ideas, methods, instructions or products referred to in the content.

