Abstract
Cadmium (Cd) pollution in rice and selenium (Se) deficiency in humans have attracted widespread attention. In this study, we investigated the effects of the combined application of biological nanoselenium (B-SeNPs) foliar spray and biochar (BC) on Se enrichment and Cd content reduction in rice. A pot experiment was established by designing four levels each of BC and B-SeNPs to be applied to rice plants. The results revealed that soil Cd bioavailability decreased by 3.26–16.67%, while soil Se bioavailability increased by 0.76–7.63% in the combined BC and B-SeNPs treatments, with rice photosynthesis showing significant enhancement during each growth period. Both BC and B-SeNPs treatments significantly enhanced the levels of antioxidant components (glutathione, phytochelatins, catalase, peroxidase, and superoxide dismutase) while reducing oxidative stress markers (malondialdehyde and superoxide anion radical) in rice leaves. Additionally, these treatments effectively modulated the subcellular distribution of Se and Cd, demonstrating their potential in alleviating Cd toxicity and enhancing Se homeostasis. These changes were accompanied by a marked reduction in lipid peroxidation (indicated by malondialdehyde) and superoxide radical accumulation, suggesting that BC and B-SeNPs treatments strengthened the antioxidative defense system in rice leaves. Additionally, compared with the BC0Se0 treatment, the combined application of BC and B-SeNPs significantly enhanced grain Se content by 7.14–221.43% while significantly reducing Cd content by 30.77–76.92%. The efficacy of grain Se enrichment and Cd reduction followed the sequence B-SeNPs + BC > Se only > BC only, where the BC5Se20 treatment demonstrated the most pronounced effects on both Se accumulation and Cd decrease in grains. Therefore, the combined application of foliar-applied B-SeNPs and biochar not only reduces Cd bioavailability in soil but also effectively suppresses Cd uptake by rice while simultaneously enhancing Se enrichment.
1. Introduction
Cadmium (Cd) has a high mobility and toxicity and is easily absorbed and accumulated by rice as an agricultural pollutant, which causes oxidative stress and genotoxicity, affects the normal growth of rice, and is enriched in the human body through the food chain, posing a serious threat to human health [1,2,3]. The heavy metal Cd is toxic to human internal organs and the blood system and has some carcinogenicity, teratogenicity, and adverse effects on the development of fetuses, causing genetic mutations and increasing the rate of human cancer [4]. Therefore, reducing Cd uptake and accumulation in rice is highly important. In recent years, biochar has been widely used for the remediation of heavy metal-polluted soil and for reducing Cd accumulation in rice because of its strong adsorption capacity. Zhou et al. [5] reported that the addition of biochar resulted in a significant increase in the soil pH, EC, and CEC and a significant decrease in the effective soil Cd content, and that the best effect was achieved by adding 5% biochar. Biochar can affect Cd uptake in rice by regulating the expression of uptake- and translocation-related genes and by enhancing the activity of the antioxidant system responding to Cd-induced stress by increasing the glutathione (GSH) content and decreasing the malondialdehyde (MDA) content [6]. Biochar also improves soil nutrient effectiveness, reduces Cd effectiveness and toxicity, and increases crop yield [7,8]. Because biochar has a lot of pores, strong adsorption capacity, and abundant active functional groups, it can control nutrient leaching and reduce the effectiveness of PTEs (potentially toxic elements in soil) [9,10,11], which, in turn, improves the crop growing environment. Zong et al. [12] reported that biochar promoted the conversion of Cd to a more stable form.
Selenium (Se) is an essential trace element in the human body, and a Se deficiency may cause a variety of diseases, such as Kashin–Beck disease, Keshan disease, tumors, diabetes mellitus, and liver disease [13,14,15]. Se deficiency is prevalent in China, with the daily available Se intake for its inhabitants being far below the recommended level [16,17]. As the number one food crop in China, rice is the staple food for approximately 70% of the population [18], so increasing the Se content of rice through scientific methods to maintain and improve the health of the people in China is highly important. Foliar Se spraying is an important agronomic measure for rapidly increasing the Se content of rice plants, as confirmed by many studies [19,20]. However, different types of Se sprays have different effects on rice growth and Se uptake. Se can be classified as inorganic Se, organic Se, or nano-Se on the basis of its composition and preparation, and nano-Se can be classified into physical, chemical, and biosynthetic Se; among them, biological nano-Se has become a hotspot of research in China and other countries because of its many advantages, such as high efficiency, safety, and good effects [21,22].
In recent years, many reports on the Se-mediated mitigation of heavy metal toxicity in plants have been published. In plants, Se can mitigate Cd toxicity by promoting phytochelatin production, repairing damaged cells, and regulating photosynthesis [23]. Se can promote chlorophyll synthesis, protect the antioxidant system, and participate in plant resistance to oxidative stress; it can also reduce the uptake and translocation of Cd in plants by inhibiting the expression of related genes such as NRAMP, MFS, and ZIP [24,25]. Some studies have shown that Se can effectively reduce the MDA content in rice roots and increase the contents of GSH and PC in root cell walls and organelles, thus effectively alleviating Cd stress [26]. Hussain et al. [27] reported that SeNPs application could reduce reactive oxygen species (ROS) production and alleviate Cd toxicity in rice plants. Feng et al. [28] also reported that foliar spraying of Se can increase the activity of antioxidant enzymes and reduce the Cd content in rice. Although foliar spraying of B-SeNPs has been studied in Chinese cabbage [29], spinach [30], and rice [31,32], few researchers have investigated the Se enrichment and Cd content-reducing effects of the combined application of B-SeNPs and biochar in rice, and the effects of this process on rice physiological traits are not yet clear. Therefore, in this study, a strain of Se-resistant reducing bacteria (Proteus penneri strain) screened by the research group was used to prepare B-SeNPs, which was applied in combination with biochar in a rice pot experiment to analyze the effect of the treatment on Se enrichment and Cd content reduction in rice and the related mechanisms and to provide guidance for the safe production of rice in Cd-contaminated paddy fields.
2. Materials and Methods
2.1. Materials for Testing
Soil: The soil for the pot test was taken from a rice field in Binyang County, Nanning City, Guangxi Province, and the soil type was yellow clayey soil formed from red clay parent material in the Quaternary Period. The basic physical and chemical properties of the test soil are as follows: soil pH 6.01, organic matter 26.2 g/kg, total nitrogen 1.18 g/kg, available phosphorus 27.12 mg/kg, available potassium 123.1 mg/kg, soil Cd 0.57 mg/kg, soil Se 0.63 mg/kg.
Biochar and B-SeNPs: Biochar was purchased from the Guangxi Guigang Institute of Agricultural Science, and the raw materials used were straw, sugarcane leaves, and grain hulls (Figure S1). It exhibits highly porous structures, a large surface area, and is rich in oxygen-containing functional groups. B-SeNPs was prepared in our laboratory from Proteus penneri, and its basic physicochemical properties are described in a prepublication article by our research group, authored by Wang et al. [33].
2.2. Experimental Design
The experimental site was located in the greenhouse of Guangxi University College of Agriculture (22°51′9″ N, 108°17′29″ E). A two-factor completely randomized experimental design was used, with four levels of biochar (BC) [34], i.e., 0%, 1%, 5%, and 10% (w/w) (BC0, BC1, BC5, and BC10) and four levels of B-SeNPs [35], i.e., 0, 5, 10, and 20 mg/L (Se0, Se5, Se10, and Se20), for a total of 16 treatments with 3 replicates, totaling 48 pots.
Rice seeds were purchased from Guangxi Grain Development Seed Industry Co. (Nanning, China). Seed preparation was carried out on 23 March 2023. The seeds were disinfected with H2O2 for 30 s and then soaked in 0.5 mol/L CaSO4 for 2 days. After germination, the seeds were watered with 20% Hoagland–Arnon nutrient solution. Rice seedlings at the three-leaf stage were subsequently used for the pot trials. Each pot was filled with 8.5 kg of soil (biochar and basal fertilizer were mixed thoroughly with the soil and added to the pots together), 3 holes were made in each pot, 5 seedlings were planted in each hole, and foliar sprayings of B-SeNPs was carried out at the tillering bloom stage and the filling stage at a concentration corresponding to 100 mL of Se per pot. The base fertilizer used was urea (Tianjin Obokai Chemical Co., Ltd., Tianjin, China) 0.36 g/kg, potassium dihydrogen phosphate (Jinshan Chemical Reagent Co., Ltd., Chengdu, China) 0.288 g/kg, and potassium chloride (Tianjin Obokai Chemical Co., Ltd., Tianjin, China) 0.159 g/kg. The fertilizer was applied once (half the amount of base fertilizer) at the tillering bloom stage. Experimental management involved weekly random repositioning of pots to minimize microenvironmental heterogeneity, with flooding conditions (3–5 cm water depth) maintained throughout the growth period from transplanting until one week pre-harvest, followed by drainage for soil drying; pest control was implemented by spraying lambda-cyhalothrin (Syngenta Group Co., Ltd., Shanghai, China) solution (1:100 pesticide-to-water ratio) onto both surfaces of rice leaves. The whole plant was harvested on 5 August 2023, with a total life span of 136 days.
2.3. Sample Collection
Rice samples were collected at the tillering, filling, and mature stages, and one rice plant was randomly collected from each pot and each hole. Each rice sample was divided into two parts: one was immediately stored in a refrigerator at 4 °C for the determination of leaf enzymes and subcellular Se and Cd indicators, and one sample was inactivated in an oven at 105 °C for 30 min, and then dried at 65 °C until a constant weight was reached for the determination of Se and Cd indicators in each part of the rice plants. The soil around the root system of each rice pot was collected at the mature stage and then naturally air-dried and sieved for the determination of soil Se and Cd indices.
2.4. Determination of Soil Physical and Chemical Properties
Soil pH was determined with a pH meter (water–soil ratio of 2.5:1. METTLER TOLEDO, Shanghai, China); the soil organic matter content was determined via the potassium dichromate–external heating method; the soil total nitrogen content was determined via the semimicro Kjeldahl method (Hanon Future Technology Group Co., Ltd., Jinan, Shandong, China); and the available phosphorus and available potassium contents were determined via Mo-Sb colorimetry (Thermo Fisher Scientific, Waltham, MA, USA) and the flame photometric method (INESA, Shanghai, China), respectively.
2.5. Determination of Selenium and Cadmium Contents in Soils
Total soil Se was determined on the basis of the ‘Determination of total Se in soils in NY/T 1104-2006’ method [36]; total soil Cd was determined on the basis of the ‘Determination of Pb and Cd in soil quality by graphite furnace atomic absorption spectrophotometry’ method [37]; soil speciation of Cd was determined by Tessier’s five-step extraction method. Soil Cd was divided into an exchangeable state (EXC), a carbonate-bound state (CA), an iron and manganese oxide-bound state (Fe-Mn-O), an organic-bound state (OM), and a residual state (RES). The soil speciation of Se was determined by the continuous leaching method of Qu Jianguo. Soil Se was divided into a water-soluble state (SOL), an exchangeable state (EXC), an iron and manganese oxide-bound state (Fe-Mn-O), an organic-bound state (OM), and a residual state (RES).
2.6. Determination of the Selenium and Cadmium Contents in Each Part of Rice
First, 0.5000 g of rice sample was placed in a polytetrafluoroethylene tube, and 10 mL of a nitric acid–perchloric acid mixture (9:1) was added. The tube was capped and left undisturbed overnight. Afterward, it was heated in a decoction oven at 140 °C, and when only 1~2 mL of solution was left in the tube, the decoction tube was removed and cooled, 5 mL of 6 mol/L HCl was added, the mixture was heated at 120 °C for 30 min and cooled, the volume was adjusted with deionized water in a 25 mL colorimetric tube, and then the solution was filtered through a 0.45 µm filter membrane. The Se content was determined via an atomic fluorescence morphology analyzer (AFS-8220, Titan Instruments, Beijing, China), and the Cd content was determined via an inductively coupled plasma emission spectrometer (nexion 350x, USAPE, New York, NY, USA).
2.7. Determination of the Subcellular Selenium and Cadmium Fractions in Rice Leaves
Fresh leaf samples (1.00 g) were ground into homogenates in precooled extraction solutions. The extraction solution was composed of 250 mmol/L sucrose (Merck, Hessen, Germany), 50 mmol/L Tris-HCl buffer (pH 7.54, Sigma, Hessen, Germany), and 1 mmol/L dithiothreitol (C4H10O2S2, Merck, Hessen, Germany). The homogenate was centrifuged at 150× g for 10 min to obtain the cell wall-containing residue (CW). The supernatant was centrifuged at 3000× g for 15 min to obtain the chloroplast fraction (CP). The supernatant was further centrifuged at 10,000× g for 20 min to obtain a precipitate containing mitochondria (MC), and the remaining supernatant was the soluble cellular fractions, i.e., vesicles, ribose proteins, and nuclear proteins (VC). The specific steps for the digestion and determination of the extracted fractions were the same as those for the determination of Se and Cd contents in rice.
2.8. Determination of Antioxidant Indexes in Rice Leaves
Glutathione (GSH) and phytochelatins (PCs) were determined via the dithiobarbituric acid-dinitrobenzoic acid (DTNB) method, the absorbance value was measured at 412 nm, and the content of PCs was the value of NPT minus the value of GSH. Malondialdehyde (MDA) content was determined via the thiobarbituric acid (TBA) method; superoxide radical ion (O2−) content was determined via the benzenesulfonic acid-azo-α-naphthylamine color development method; superoxide dismutase (SOD) activity was determined via the nitroblue tetrazolium (NBT) photo-reduction method; catalase (CAT) activity was determined via the UV-absorbance method; peroxidase (POD) activity was determined via the guaiacol method.
2.9. Determination of Photosynthesis Traits in Rice Leaves
Net photosynthetic rate (Pn), intercellular CO2 concentration (Ci), transpiration rate (Tr), and instantaneous water use efficiency (WUE) were measured using a LI-6400XT portable photosynthesis system (LI-COR, Lincoln, NE, USA). Measurements were conducted during mid-morning hours (8:00–10:00 a.m.) under stable natural light conditions, following the manufacturer’s operational guidelines. Chlorophyll content was quantified through spectrophotometric analysis of leaf extracts prepared with 80% acetone, as described in Chapter 4 of Experimental Guidance for Plant Physiology (Junfeng Gao, 2006. https://www.hep.com.cn).
2.10. Data Analysis and Processing
All data were analyzed by ANOVA using SPSS 19 (V4.0.100.1124), and graphs and tables were constructed using OriginPro 2021 (V9.8.0.200) and Microsoft Excel 2019 (V16.0.18827.20102). The least significant difference (LSD) test was used for multiple comparisons (p < 0.05).
3. Results
3.1. Changes in Soil Se and Cd Speciation Under Different Treatments
The results in Figure 1a show that compared with that in the BC0Se0 treatment, the soil SOL-Se content decreased in all other treatments, but the soil EXC-Se (except in the application of B-SeNPs alone), Fe-Mn-O-Se, and OM-Se contents increased. Compared with those in the BC0Se0 treatment, the EXC-Se, Fe-Mn-O-Se, and OM-Se contents increased by 3.03% to 48.48%, 20.51% to 65.38%, and 17.95% to 55.38% (Table S1), respectively, with the addition of biochar only, and when only B-SeNPs was applied, the soil Fe-Mn-O-Se and OM-Se contents increased by 8.97% to 17.95% and 4.62% to 23.08% (Table S1), respectively, whereas the soil EXC-Se, Fe-Mn-O-Se, and OM-Se contents increased by 3.03% to 154.55%, 6.41% to 60.26%, and 18.97% to 55.90% (Table S1), respectively, with combined biochar and B-SeNPs application. Figure 1b shows that the application of biochar and B-SeNPs decreased the content of Cd in the EXC and OM of the soil and increased the content of Cd in the RES. Compared with those in the BC0Se0 treatment, the soil EXC-Cd and OM-Cd contents decreased by 11.61% to 30.36% and 28.43% to 47.06% (Table S2), respectively, when only biochar was added; the soil EXC-Cd and OM-Cd contents decreased by 3.57% to 12.50% and 18.63% to 34.31% (Table S2), respectively, when only B-SeNPs was sprayed; and biochar with B-SeNPs reduced the soil EXC-Cd and OM-Cd contents by 12.50% to 53.57% and 19.61% to 48.04% (Table S2), respectively.
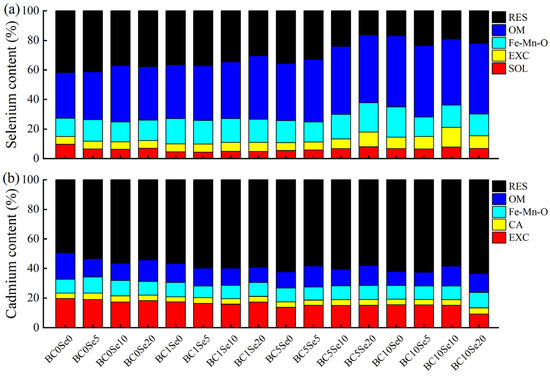
Figure 1.
(a) Soil Se patterns in each treatment; (b) Soil Cd patterns in each treatment. SOL denotes Se in the water-soluble state; EXC denotes Se and Cd in the exchangeable state; CA denotes Cd in the carbonate-bound state; Fe-Mn-O denotes Se and Cd in the iron-manganese oxide-bound state; OM denotes Se and Cd in the organic-bound state; and RES denotes Se and Cd in the residue state.
3.2. Effects of Different Treatments on the Photosynthetic Traits of Rice Leaves
The chlorophyll contents of rice under different treatments are shown in Table 1. The chlorophyll a, chlorophyll b, and carotenoid contents of the rice leaves at all periods under all treatments were greater than those under the BC0Se0 treatment, regardless of whether B-SeNPs or biochar was applied alone or in combination. The chlorophyll a and chlorophyll b contents decreased in the order of tillering > filling > mature, whereas the carotenoid content increased and then decreased. Compared with the results of the BC0Se0 treatment, foliar spraying of B-SeNPs alone increased the chlorophyll a, chlorophyll b and carotenoid contents by 23.46% to 27.16%, 19.80% to 52.48%, and 14.41% to 21.62%, respectively, whereas the addition of biochar alone increased the chlorophyll a, chlorophyll b, and carotenoid contents by 44.44% to 56.30%, 68.32% to 111.88%, and 24.32% to 48.65%, respectively, and a combination of the two increased the chlorophyll a, chlorophyll b, and carotenoid contents by 48.64% to 85.68%, 85.15% to 261.39%, and 10.81% to 63.06%, respectively. In addition, the effects of combined biochar and B-SeNPs application were greater than those of individual application. Overall, the treatment at the BC5 level was the most effective.

Table 1.
Changes in chlorophyll content of rice leaves.
The photosynthetic traits of rice leaves are shown in Table 2. The application of biochar and B-SeNPs alone or in combination significantly increased the Pn and Ci of rice leaves and improved the Tr and WUE. Compared with the BC0Se0 treatment, foliar spraying of B-SeNPs alone increased the Pn, Ci, Tr, and WUE of rice leaves by 19.63% to 35.25%, 23.28% to 36.33%, 0.69% to 2.22%, and 14.80% to 26.10%, respectively; the addition of biochar alone increased by 20.27% to 36.75%, 10.62% to 23.80%, 2.91% to 3.38%, and 16.68% to 24.28%, respectively; and combined application increased by 22.97% to 61.26%, 20.30% to 48.77%, −1.22% to 5.38%, and 13.675 to 57.26%, respectively. The Pn, Ci, Tr, and WUE improved with increasing amount of Se spray under all treatments, but the values were in the order Se10 > Se20 > Se5, BC5 > BC10 > BC1, and Se10 > Se20 > Se5 at the same level of biochar. The highest Pn occurred in the BC1Se10 treatment, the highest Tr occurred in the BC1Se20 treatment, and the Ci and WUE were highest in the BC5Se10 treatment. In addition, the BC5 level was more effective than the other levels.
Table 2.
Photosynthetic characteristics of rice.
3.3. Effects of Different Treatments on the Antioxidant Traits of Rice Leaves
The results in Figure 2 show the changes in the antioxidant contents of rice leaves during various periods. The results revealed that both B-SeNPs spraying and biochar addition increased the contents of GSH, PCs, CAT, POD, and SOD and decreased the contents of MDA and O2− in rice leaves. From the tillering stage to the filling stage, B-SeNPs spraying increased the GSH content of rice leaves by 2.73 to 3.47 mg/g when no biochar was applied, but it decreased it by 1.75 to 2.25 mg/g from the filling stage to maturity; when only biochar was applied, the GSH content of the leaves at the filling stage increased by 2.19 to 3.21 mg/g compared with that at the tillering stage but decreased at the mature stage by −0.90 to 1.67 mg/g, whereas the GSH content increased by 0.11 to 2.75 mg/g from the tillering stage to the filling stage and by −2.57 to 2.23 mg/g at the mature stage when the two agents were combined (Figure 2a). The application of biochar and B-SeNPs promoted the production of PCs in rice leaves, but the addition of biochar did not have a significant effect on the PC content under Se-free conditions before maturity; the opposite was true with Se application (without biochar), and the effect was greater at the Se10 level than at the Se5 and Se20 levels (Figure 2b). At maturity, the PC content was significantly lower in the Se5 and Se10 treatments than in the other treatments under biochar addition (p < 0.05, except for BC10Se10). Compared with the BC0Se0 treatment, spraying B-SeNPs alone increased the PC content by −0.36 to 0.10 mg/g, biochar alone increased the PC content by −0.46 to 0.06 mg/g, and combined application increased the PC content by −0.96 to 0.22 mg/g.
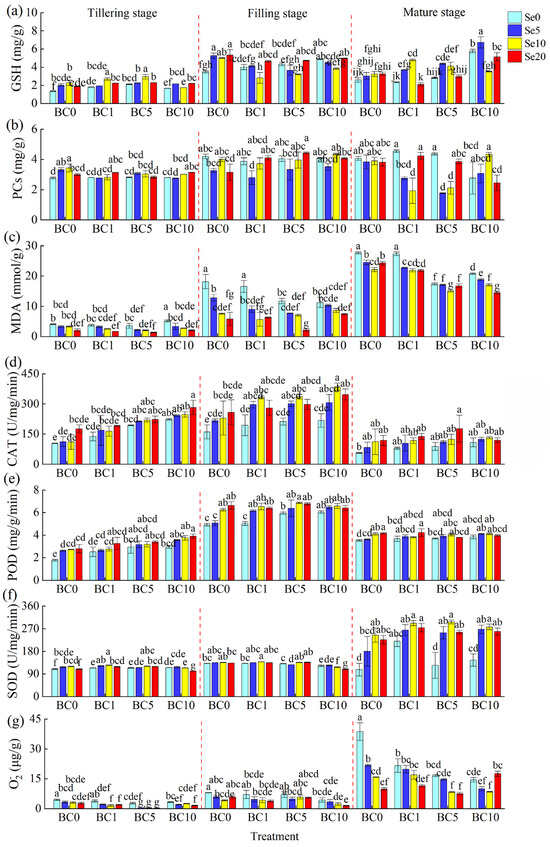
Figure 2.
Changes in antioxidant traits of rice leaves under different treatments. (a) GSH, (b) PCs, (c) MDA, (d) CAT, (e) POD, (f) SOD, (g) O2−. Significant differences among means at p < 0.05 are denoted by the different lower-case letters.
The contents of MDA, SOD, and O2− in rice leaves gradually increased with plant growth (Figure 2c,f,g), whereas the contents of CAT and POD first increased but then decreased (Figure 2d,e). The experimental results revealed that the addition of biochar or spraying of B-SeNPs could reduce the MDA content of rice leaves, and when the two were paired, the greater the applied amount of biochar and Se, the more significant the reduction (Figure 2c). Compared with that of the BC0Se0 treatment, the MDA content of the rice leaves was reduced by 3.17 to 5.53 mmol/g (BC0), 4.93 to 5.80 mmol/g (BC1), 10.56 to 12.56 mmol/g (BC5), and 8.84 to 13.20 mmol/g (BC10) in the treatments with B-SeNPs. The values in the treatments with only biochar decreased to 0.34 mmol/g (BC1), 10.27 mmol/g (BC5), and 6.87 mmol/g (BC10), respectively. In addition, the MDA values of rice leaves at the BC5 level were the lowest overall. Both the CAT and POD activities of the rice leaves increased with increasing application of biochar, B-SeNPs, or both (Figure 2d,e). The higher concentration of Se (biochar) increased the CAT content when only B-SeNPs (biochar) was applied, which increased the CAT content from the tillering stage to the filling stage by 82.42 to 119.00 U/mg/min (−5.84 to 55.67 U/mg/min); when both agents were applied, the CAT content from the tillering stage to the filling stage increased by 88.67 to 169.21 U/mg/min (BC1), 74.67 to 116.33 U/mg/min (BC5) and 63.58 to 138.30 U/mg/min (BC10). In addition, at maturity, the experimental treatments resulted in 5.16 to 149.21 U/mg/min higher CAT contents than those of the control treatments. The changes in POD content were consistent with the changes in CAT content, with little overall difference in POD content between tillering and maturity, but there was a significant increase in POD content during the filling stage (Figure 2e). The POD activity was 2.46 to3.84 mg/g/min greater than that at the tillering stage and 1.34 to 2.98 mg/g/min greater than that at the mature stage.
As shown Figure 2f, the addition of biochar or spraying of B-SeNPs increased the SOD activity of rice leaves. Under the same treatments, there was no significant change in the leaf SOD content from the tillering stage to the filling stage, with an increase ranging from 3.37 to 23.84 U/mg/min. However, at the mature stage, the SOD activity of the experimental groups increased significantly (except for BC5Se0 and BC10Se0 treatments). At the mature stage, the SOD activity of rice leaves sprayed with B-SeNPs treatments was greater than that of those not treated with Se at the same biochar level and increased by 73.67 to 137.82 U/mg/min (BC0), 44.35 to 72.08 U/mg/min (BC1), 129.90 to 172.67 U/mg/min (BC5), and 114.06 to 132.28 U/mg/min (BC10). The O2− content of rice leaves gradually increased with rice growth, but the addition of biochar, B-SeNPs, or both effectively reduced the production and accumulation of O2−, and the greater the amount of biochar and B-SeNPs added, the lower the level of O2− accumulation (Figure 2g). At the tillering stage, the O2− content under the B-SeNPs treatment was significantly lower than that under the other treatments at the BC5 level (p < 0.05), and the addition of biochar reduced the O2− content of rice leaves by 0.60 to 1.76 μg/g compared with that under the BC0Se0 treatment. In the filling stage, the O2− content increased compared with that at the tillering stage, with increases of 1.04 to 3.61 μg/g, 1.91 to 3.28 μg/g, 4.34 to 5.47 μg/g, and −0.19 to 1.41 μg/g at the BC0, BC1, BC5, and BC10 levels, respectively. At maturity, the O2− content of the BC0Se0 treatment was significantly greater than that of the other treatments (p < 0.05) and reached a value of 38.71 μg/g; at this time, the O2− content at the same biochar level was in the order Se0 > Se5 >Se10 > Se20.
3.4. Effects of Different Treatments on the Subcellular Se and Cd Contents of Rice Leaves
To further clarify the way in which B-SeNPs combined with biochar controls the uptake of Se and Cd in rice, we conducted a single analysis of the subcellular Se and Cd distributions in rice leaves. The results revealed that at the tillering stage, the cell wall Se fraction markedly increased by 15.76% to 29.05%, and the mitochondrial Se fraction markedly decreased by 16.51% to 24.13% at the Se5 and Se10 levels, whereas the chloroplast Se fraction markedly increased by 21.54% at the Se20 level when only B-SeNPs were applied. The cell wall Se content markedly decreased by 18.74% to 28.65% with the application of biochar alone, and the mitochondrial Se content markedly increased by 23.71% at the BC1 level, whereas the chloroplast Se content markedly increased by 27.80% and 25.76% at the BC5 and BC10 levels, respectively (Figure 3b). The chloroplast Se content of all the treatments markedly increased by 12.79% to 29.33% when the two were combined, and the Se content of the fractions was also equal. However, at the Se20 level, Se was distributed mainly in the cell wall, whereas at low Se and low carbon contents, more Se accumulated in the chloroplast. In the filling stage, all treatments substantially increased the Se content of the cell wall (except for the BC0Se5 treatment) compared with earlier stages, especially the Se10 and Se20 treatments. The combination of biochar and B-SeNPs markedly reduced Se in the soluble fraction by 28.23 to 36.44% and Se in the chloroplast fraction by 7.14 to 13.59% (except for the BC10Se20 treatment). Additionally, the percentage of Se in the chloroplast fraction was markedly greater than that in the other fractions, and that in the soluble fraction was markedly lower when only 20 mg/kg B-SeNPs was sprayed. By maturity, the proportion of Se in the cell wall fractions decreased in all treatment groups, and the decreases were greater in the treatments with biochar or in those with biochar paired with B-SeNPs than in those with B-SeNPs spray only. On the contrary, the proportions of Se in the chloroplast, mitochondrial, and soluble fractions increased in the treatment groups by 0.22% to 8.14%, 1.19% to 28.19%, and 2.32% to 13.13%, respectively.
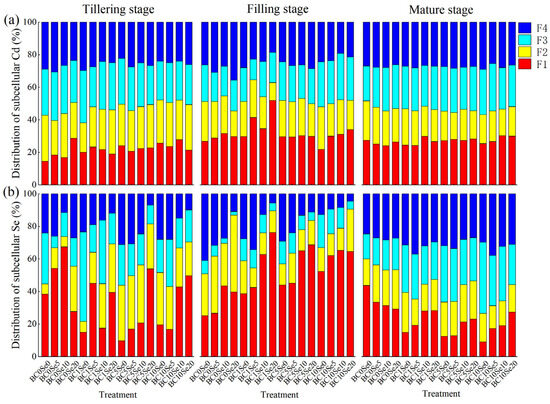
Figure 3.
(a) The distributions of leaf subcellular Cd under different treatments; (b) The distributions of leaf subcellular Se under different treatments. F1: cell wall; F2: chloroplast; F3: mitochondrion; F4: soluble fractions, i.e., vesicles, ribose, and nucleoproteins.
Both the addition of biochar and the spraying of B-SeNPs increased the percentage of Cd in the cell wall and decreased the percentage of Cd in the chloroplast, mitochondrial, and soluble fractions (Figure 3a). At the tillering stage, compared with that of the control (BC0Se0), the percentage of Cd in the cell wall fractions increased by 2.32% to 14.20%, and the percentages of the chloroplast, mitochondrial, and soluble fractions of Cd decreased by 1.23% to 7.17%, −1.50% to 2.46%, and −1.72% to 5.39%, respectively, at the BC0 level, whereas at the Se0 level, the percentage of the Cd fractions in the cell wall increased by 5.48% to 11.18%, and the percentages of the chloroplast, mitochondrial and soluble fractions decreased by 1.75% to 10.18%, −4.00% to 4.45%, and −0.71% to 6.66%, respectively. The combined application of biochar and B-SeNPs increased the percentage of Cd in the cell wall by 4.48% to 13.35%, and the percentages of Cd in the chloroplast, mitochondrial, and soluble fractions decreased by 0.33% to 3.99%, −1.03% to 4.38%, and 1.46% to 5.00%, respectively. At the filling stage, the trend in the Cd content ratio was the same as that at the tillering stage, except that the percentage of Cd in the mitochondrial fractions in the BC10 level treatments increased by 4.08 to 6.19%, and the percentage of Cd in the soluble fractions in the BC0 level treatments increased by 0.81 to 9.33%. However, at maturity, compared with those in the BC0Se0 treatment, the proportions of Cd (3.24% to 7.69%) in the mitochondrial fractions in all treatments and soluble fractions (0.19% to 1.28%) in the BC5 level treatments increased, and the proportion of Cd in the chloroplast fractions decreased by 1.32% to 13.49% in all the treatments.
3.5. Effects of Different Treatments on the Se and Cd Contents in Various Parts of Rice
Figure 4 shows that the combined application of biochar and B-SeNPs significantly increased the Se content and reduced the Cd content of rice roots, stems, and leaves, and the effect was greater than that of biochar alone or B-SeNPs alone. The greater the amount of Se applied, the greater the Se content of the roots, and the overall effect of the combined application was in the order of BC5 > BC1 > BC0 > BC10, with the BC5Se20 treatment showing the best effect. Rice stems presented a relatively high Se content at the tillering stage and a relatively low Se content at the mature stage, whereas the opposite trend was observed in the leaves. At the same biochar application level, the Se content of rice roots sprayed with B-SeNPs increased by 0.08 to 0.53 mg/kg (BC0), 0.09 to 0.25 mg/kg (BC1), 0.11 to 0.80 mg/kg (BC5), and 0.17 to 0.32 mg/kg (BC10); the Se content of stems increased by 0.07 to 0.55 mg/kg (BC0), 0.16 to 1.07 mg/kg (BC1), 0.23 to 0.46 mg/kg (BC5), and 0.15 to 0.87 mg/kg (BC10); the Se content of leaves increased by 0.76 to 2.57 mg/kg (BC0), 0.85 to 2.85 mg/kg (BC1), 0.68 to 2.38 mg/kg (BC5), and 1.25 to 2.69 mg/kg (BC10), compared with Se0 (Figure 4a).
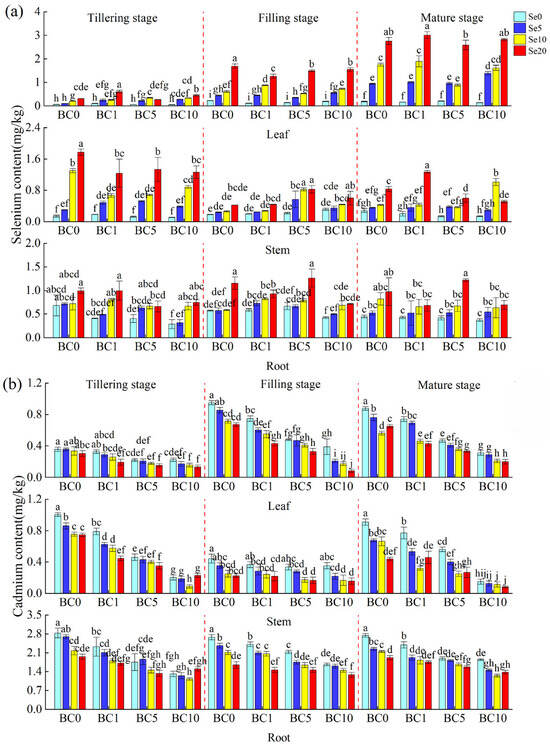
Figure 4.
The contents of Se (a) and Cd (b) in various parts of rice under different treatments. Significant differences among means at p < 0.05 are denoted by the different lower-case letters.
Both the addition of biochar and foliar spraying of B-SeNPs reduced the Cd content in all parts of rice, and the higher the applied amount of B-SeNPs or biochar, the lower the Cd content (Figure 4b). The Cd content in the root system of the biochar and B-SeNPs treatments decreased by 0.82 to 1.49 mg/kg compared with the control treatment, by 0.32 to 0.99 mg/kg compared with B-SeNPs spray only, and by 0.47 to 1.14 mg/kg compared with the application of biochar alone. The Cd content in the stem tended to decrease, followed by an increasing trend, and the higher the applied amount of biochar and B-SeNPs, the lower the Cd content in the stem of rice. The combined application of the two agents reduced the stem Cd content by 0.38 to 0.83 mg/kg, which was 0.07 to 0.69 mg/kg lower than that resulting from the individual application of biochar or B-SeNPs. At the same Se level, the higher the added amount of biochar, the lower the Cd content of the leaves. The Cd content in rice leaves decreased by 0.11 to 0.68 mg/kg in the combined biochar and B-SeNPs treatments compared with that in the individual treatments.
3.6. Effects of Different Treatments on Rice Yield and the Se and Cd Contents of Rice Grains
The results revealed that the application of B-SeNPs or biochar alone or in combination increased rice yield (Table 3). In the absence of biochar or B-SeNPs application, rice yield gradually increased with the increase in B-SeNPs or biochar application; when both were applied, the highest rice yield was recorded under the BC10 treatment. Compared with that of the BC0Se0 treatment, the rice yield increased by 4.41% to 11.53% with the spraying of B-SeNPs, by 2.00% to 16.31% with the addition of biochar, and by 1.25% to 25.75% with the combination of the two. The results also revealed that the application of B-SeNPs, biochar, or both could increase Se content and reduce Cd content in rice grains. The Se content of rice grains increased with an increase in the amount of B-SeNPs and biochar applied, whereas the opposite was true for the Cd content in the grains. The highest Se content in grains was found in the BC10Se20 treatment, followed by that in the BC5Se20 treatment, and the lowest Cd content was found in the BC5Se20 treatment, which was significantly lower than that in the other treatments (p < 0.05). At maturity, compared with BC0Se0 treatment, the Se content in rice grains increased by 35.71% to 57.14%, and the Cd content decreased by 15.38% to 57.69% with Se alone; the Se content in rice grains increased by 7.14% to 92.86%, and the Cd content decreased by 11.54% to 23.08% with biochar alone; and the Se content in rice grains increased by 7.14% to 221.43%, and the Cd content decreased by 30.77% to 76.92% with combined treatment.
Table 3.
Rice yield and grain Se-Cd content.
3.7. Correlation Analysis
Correlation analysis showed that the Se content of different parts of rice (roots, stems, leaves, and grains) significantly and positively correlated with CAT content (p ≤ 0.05), whereas the Cd content significantly and negatively correlated with CAT, POD, and GSH (except for grain Cd) content (p ≤ 0.05) (Figure 5c). The Cd content in the roots, stems, and leaves of rice significantly and positively correlated with MDA and O2− content (p ≤ 0.01), whereas the Se content in grains significantly and negatively correlated with MDA content (p ≤ 0.01); however, the Cd content in grains significantly and positively correlated with O2− content (p ≤ 0.01). The Se content in rice leaves significantly and positively correlated with SOD content (p ≤ 0.05), and the Cd content in roots, stems, and grains significantly and negatively correlated with SOD content (p ≤ 0.05). Furthermore, the Se content in grains significantly and positively correlated with the Se content in the mitochondrial and soluble fractions (p ≤ 0.05) and significantly and negatively correlated with the Cd content in the chloroplast, mitochondrial, and soluble fractions (p ≤ 0.05); and the Cd content in grains significantly and negatively correlated with the Se content in the subcellular fraction (p ≤ 0.05) and significantly and positively correlated with the Cd content in the chloroplast, mitochondrial, and soluble fractions (p ≤ 0.05). The results of correlation analysis also revealed that the Se and Cd contents in the subcellular fraction were also significantly associated with photosynthetic traits, CAT, SOD, MDA, and other enzymes (Figure 5c).
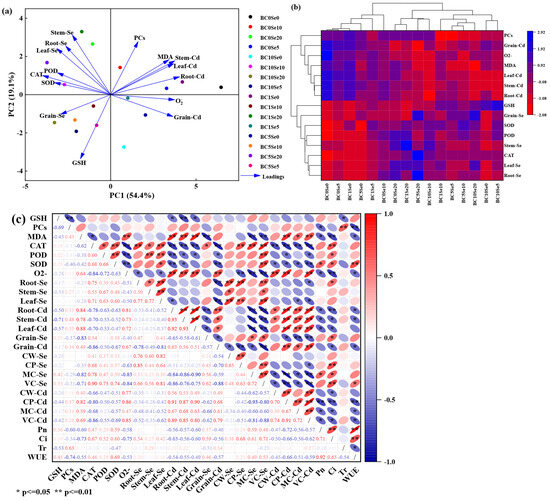
Figure 5.
The correlation analysis between the variables. (a) Principal component analysis; (b) Pearson correlation matrix analysis; (c) relationship between Se and Cd content and physio-biochemical indices in rice. CW-Se: Se in cell wall fractions; CP-Se: Se in chloroplast fractions; MC-Se: Se in mitochondrial fractions; VC-Se: Se in soluble fractions. Cd, similarly.
3.8. Principal Component Analysis (PCA) and Pearson Correlation Matrix Analysis
PCA and Pearson showed that the variables were significantly correlated across treatments (Figure 5a). The two components of PCA accounted for 73.5% of the total sample variance, while PC1 accounted for 54.4%, and PC2 accounted for 19.1%. There was a positive (negative) correlation between the contents of POD, CAT, SOD, and GSH and the contents of Se (Cd) in all parts of rice (roots, stems, leaves, and grains), while negative (positive) correlations were found between PCs, MDA, and O2− and the Cd (Se) content of each part of rice (roots, stems, leaves, and grains). In addition, there were strong correlations between grain Se and GSH, as well as grain Cd and O2−. Pearson correlation cluster analysis also showed that POD, CAT, SOD, and GSH were correlated with Se in all parts of rice, and there were correlations between PCs, MDA, and O2− with rice Cd (Figure 5b).
4. Discussion
Cd can inhibit the activity of enzymes required for the synthesis of chlorophyll and the uptake of trace elements by plants, which, in turn, reduces the ability of plants to synthesize chlorophyll and inhibits photosynthesis [38]. However, biochar can mitigate the toxic effects of Cd2+ through mechanisms such as complexation, ion exchange, and adsorption [9]. Our results also showed that the addition of biochar decreased the soil EXC-Cd and OM-Cd contents and transformed existing Cd forms to the residual state, which is difficult for plants to utilize. Meanwhile, the chlorophyll content, Pn, and Ci of the rice leaves significantly increased, and the Tr and WUE of the leaves improved (Figure 1, Table 1 and Table 2). This finding is consistent with the results of previous studies [6,39], demonstrating that leveraging biochar’s unique physical structure and chemical properties effectively immobilizes soil cadmium ions (Figure S1) while simultaneously enhancing rice photosynthetic physiological functions through the optimization of the rhizosphere microenvironment, ultimately achieving synergistic remediation within the soil–crop system. However, the SOL-Se content decreased with the addition of biochar or spraying of B-SeNPs, which was contrary to the findings of Rong et al. [40], which might be related to differences between field soil environments and potted soil environments. In this study, the addition of biochar promoted the conversion of SOL-Se to EXC-Se, Fe-Mn-O-Se, and OM-Se, whereas the spraying of B-SeNPs may have promoted the growth of rice and affected the rhizosphere environment, which shifted the Se forms more toward OM-Se (Figure 1). Se plays an important role in maintaining balance in the plant internal environment and the normal physiological and biochemical activities of rice, and moderate amounts of Se can alleviate the toxic effects of Cd on plant photosynthesis. Numerous studies have shown that selenium application can increase the chlorophyll content of rice, alleviate the chloroplast dysfunction induced by Cd stress, result in the reconstruction of the chloroplast ultrastructure, and reduce the toxicity of Cd to rice by increasing photosynthetic efficiency [41,42]. The results of the present study also revealed that the chloroplast content and photosynthetic characteristics of rice markedly improved in response to the foliar spraying of B-SeNPs, as well as the combined application of B-SeNPs and biochar. This finding is consistent with the results of Zhang et al. [43] and Dorairaj et al. [44]. In addition, carotenoids can prevent energy leakage from chlorophyll molecules and protect plant photosynthetic processes [45]. Our study also revealed that the application of either biochar or B-SeNPs could increase the carotenoid content in leaves (Table 1).
In addition to photosynthesis, plants can alleviate Cd-induced stress by increasing the content and activity of antioxidant enzymes. Cd induces the production of excess ROS in plants, and the addition of biochar or spraying of B-SeNPs can result in the scavenging of excess ROS and increase the activities of antioxidant enzymes to alleviate Cd stress [6,46]. Bamagoos et al. [47] reported that the addition of biochar increased the activities of SOD, POD, CAT, and GSH and reduced the MDA content in rice leaves. Zhu et al. [29] reported that foliar spraying of different amounts of B-SeNPs (5, 10, and 20 mg/L) reduced Cd and MDA levels and improved the antioxidant defense system of cabbage. Our results also concluded that the spraying of B-SeNPs and the addition of biochar, as well as the combination of the two, increased the contents of GSH, PCs, CAT, POD, and SOD and decreased the contents of MDA and O2− in rice leaves (Figure 2), with the effects in the order of combined treatment > Se alone > biochar alone, and B-SeNPs spraying was more effective than the other treatments at the BC5 level. CAT, SOD, POD, O2−, and MDA are closely related to cell structure and function, and POD activity is related to respiration and photosynthesis in plants. The results of this study showed that the combined application of biochar and B-SeNPs significantly increased the Pn and Cond of rice leaves, and that the growth of rice plants was reduced by toxicity from Cd (Table 2). The contents of CAT, SOD, and MDA can reflect the plant’s resistance, and our results also revealed that the resistance of rice plants increased under biochar or B-SeNPs application, especially under the combined application of the two. Moreover, the O2− content is an indicator of plant growth. The reduction in the O2− content of rice leaves in the presence of biochar and B-SeNPs decreased with increasing amounts of biochar or B-SeNPs applied, suggesting that the combined application of biochar and B-SeNPs can improve the growth of rice plants under cadmium stress. However, the O2− content rebounded under the BC10Se20 treatment at the mature stage (Figure 2g), possibly because at this time, the rice plants had entered the apoptotic stage and the Se content of the leaves was very high, which had an adverse effect on cell structure. The results of this study revealed that the higher the amount of biochar and B-SeNPs applied, the lower the Cd content in all parts of rice, whereas the opposite was true for the Se content in all parts. These findings indicate that, on the one hand, biochar reduced the bioavailability of Cd and promoted rice growth; on the other hand, more Cd was compartmentalized, and Cd uptake by the rice root system, which absorbs soil Se, and that of rice leaves, which absorb B-SeNPs, was impeded. In addition, the Cd (Se) content of each part of rice at the tillering stage decreased in the order of root > stem > leaf (stem > root > leaf), and at the filling stage, it decreased in the order of root > leaf > stem (root > leaf > stem), which confirmed that the rice stalks developed vigorously during the tillering stage. At this point, the physiological activity of the stalks was strong, and the Se and Cd contents were relatively high in the stalks. However, during the filling stage, the physiological activity of the rice leaves was strong, more Cd from the stalks entered the leaves, and the B-SeNPs sprayed were mostly absorbed by the leaves under these conditions [48]. GSH can play a protective role in cell membranes by regulating the ratio of membrane protein sulfhydryl groups to disulfide bonds. The content of GSH, a precursor of PCs, is closely related to the content of PCs. Se is involved in the synthesis of chelating peptides and complexes with Cd2+ when it enters rice plants, and it can also regulate the synthesis of GSH and PCs to form Cd-PC chelates, which reduce the uptake and transport capacity of Cd in rice, thus reducing the Cd content in various parts of rice (Figure 4b) [49]. Furthermore, Se is able to displace sulfur in nonprotein sulfhydryl groups to form Cd-Se sulfhydryl complexes, which reduce the transport efficiency of Cd [49]. The translocation of Se and Cd from activated leaves into the phloem and then to the grain is considered an important physiological mechanism for Se and Cd accumulation in rice grains [50]. In our study, compared with the other treatments, the combined application of biochar and B-SeNPs significantly reduced the leaf Cd content while significantly increasing the leaf Se content (Figure 4a). Therefore, we speculate that the combined application of biochar and B-SeNPs reduces Cd translocation to grains by promoting Cd passivation, thereby reducing the toxicity of Cd to the plants.
The subcellular distribution of heavy metals is an important heavy metal detoxification mechanism in plants, and plants can mitigate heavy metal damage by compartmentalizing heavy metals through a series of metabolically inactive regions, such as cell walls and vesicles [51]. In our study, B-SeNPs spraying alone, biochar addition alone, or a combination of the two increased the content of Cd in the cell wall, decreased the content of Cd in the chloroplast fractions (at the tillering and filling stages), and increased the amount of Cd in the mitochondrial and soluble fractions at the mature stage (Figure 3a). Cell wall components have numerous negatively charged hydroxyl and carboxyl groups, as well as reactive groups, which can prevent Cd from entering cells through adsorption, chelation, and precipitation [52]. These findings suggest that the application of biochar and B-SeNPs enhanced photosynthesis in rice and increased the number of Cd adsorption sites on the cell wall, increased lignin concentration and cell wall thickness, and thus promoted more Cd sequestration within the cell wall [53]. Plant vesicles are nonphysiologically active structural parts, and heavy metals entering vesicles are sequestered, passivated, and precipitated, thus making the heavy metals less toxic. Therefore, the reduction in Cd toxicity and translocation to the grain continues as rice matures, and the combined application of biochar and B-SeNPs is more effective than individual application. In addition, this study revealed that at high Se (Se20) concentrations, Se was distributed mainly in the cell wall at the tillering stage, whereas at low Se concentrations and low biochar contents, more Se accumulated in the chloroplasts (Figure 3b). These findings suggest that moderate amounts of Se application promote plant growth and development, thus reducing the inhibitory effect of cadmium. Se was distributed mainly in the cell wall fractions at the filling stage, whereas at the mature stage, Se pooled mainly in the mitochondrial and soluble fractions. These findings note that biochar and B-SeNPs reduce the transport of Cd to rice grains by promoting rice growth, regulating the distribution of Se and Cd, reducing Cd uptake by rice, and blunting Cd activity in the cells (Figure 3, Table 3).
Studies have shown that the application of either biochar or B-SeNPs can reduce rice grain Cd accumulation and increase grain Se enrichment [6,31,32,40], and consistent results were obtained in this study (Table 3). Notably, the combined application of biochar and B-SeNPs was optimal, and spraying B-SeNPs at the BC5 level was the preferred treatment (with the BC5Se20 treatment being the best). The Se and Cd contents of rice grains are closely associated with plant growth status, related enzyme activities, and subcellular compartmentalization. Correlation analyses demonstrated positive correlations between Se (Cd) content in rice grains and multiple physiological indicators, including POD, CAT, SOD, GSH, subcellular Se, Pn, Ci, and WUE (PCs, MDA, O2−, subcellular Cd, and Tr) (Figure 5). This finding is consistent with the results of Wu et al. [54], who reported that Se can affect the subcellular distribution of Cd, increase the antioxidant capacity of rice, and thus reduce the accumulation of Cd in the grain. B-SeNPs sprayed on foliage can also be absorbed by leaves and transported to grains within a short amount of time, which improves the Se utilization efficiency of plants and thus significantly increases the Se content of grains. Gao et al. [55] have also shown that the foliar application of Se can reduce the transfer of Cd from roots to stems, as well as from stems to brown rice. Furthermore, biochar can improve the growth of the rice root system, which, in turn, adsorbs Cd through the formation of oxidative film, reducing the uptake of Cd by rice; Se can decrease the expression of Cd-related transporter protein genes in the root system of rice, which reduces the uptake of Cd by rice, thus reducing the Cd content of the grains. Furthermore, studies have demonstrated that foliar application of nanoselenium during the initial panicle, heading, or filling stages of rice significantly reduces grain Cd content while enhancing Se concentration and yield in rice grains [56]. Consequently, future research could expand the spraying phases (in this study, spraying at tillering and filling stages) to comprehensively investigate the temporal dynamics and mechanistic pathways of biological nanoselenium accumulation. We also note that current research prioritizes silicon-based materials for Cd mitigation in rice, with consistent evidence showing that silicon application (either alone or co-applied with biochar/selenium) significantly suppresses Cd accumulation while improving crop quality and yield [57,58,59]. Therefore, in future research, we can further explore the multi-element synergistic mechanisms between silicon-based materials and other functional materials and develop intelligent controlled-release composite materials suitable for farmlands with varying pollution gradients to achieve the precise and universal application of Cd reduction technologies.
5. Conclusions
In summary, the combined application of biochar and B-SeNPs had a better effect on Se enrichment and Cd content reduction in rice. The combined application of biochar and B-SeNPs inhibited the uptake of Cd by the rice root system, and at the same time, compartmentalized Cd in the leaves, reducing the enrichment of Cd in the grains. Foliar spraying of B-SeNPs and the addition of biochar significantly promoted rice growth, improved leaf antioxidant capacity, inhibited Cd uptake, and promoted Se enrichment in rice tissues. In this study, under the combined application of biochar and B-SeNPs, the grain Cd concentration decreased to below the national safety limit (0.2 mg/kg), and the grain Se concentration reached the Se-enriched standard (0.15–0.5 mg/kg, DB 45/T1061-2014 [60]). Therefore, the effects of combining B-SeNPs and biochar application on Se enrichment and Cd content reduction in rice warrant further investigation.
Supplementary Materials
The following supporting information can be downloaded at: https://www.mdpi.com/article/10.3390/agronomy15061398/s1, Figure S1: (a) Scanning electron microscope (SEM) of biochar; (b) Fourier transform infrared spectroscopy (FITR) of biochar; Table S1: Content of different selenium species in soils under various treatments; Table S2: Content of different cadmium species in soils under various treatments.
Author Contributions
Writing—original draft and Writing—review and editing, Formal analysis: T.M.; Formal analysis, Investigation, Data curation: J.H.; Investigation, Data curation: C.L.; Project administration, Funding acquisition, Conceptualization: D.J. All authors have read and agreed to the published version of the manuscript.
Funding
This research was supported by the National Natural Science Foundation of China (41967006), the National Natural Science Foundation of China (41661076), the National Natural Science Foundation of China (42267042), Key Program of the Natural Science Foundation of Guangxi, China (2018GXNSFDA281035), the Central government guides local funds for science and technology development (Guike ZY23055024), and the Project of Bama County for Talents in Science and Technology (No. 20220031).
Data Availability Statement
The original contributions presented in the study are included in the article; further inquiries can be directed to the corresponding author.
Acknowledgments
We thank Xuejiao Huang for her editorial suggestions during manuscript preparation.
Conflicts of Interest
The authors declare no conflicts of interest.
References
- Aziz, R.; Rafiq, M.T.; Li, T.Q.; Liu, D.; He, Z.L.; Stoffella, P.J.; Sun, K.W.; Yang, X.E. Uptake of cadmium by rice grown on contaminated soils and its bioavailability/toxicity in human cell lines (Caco-2/HL-7702). J. Agric. Food Chem. 2015, 63, 3599–3608. [Google Scholar] [CrossRef] [PubMed]
- Xie, P.P.; Deng, J.W.; Zhang, H.M.; Ma, Y.H.; Cao, D.J.; Ma, R.X.; Liu, R.J.; Liu, C.; Liang, Y.G. Effects of cadmium on bioaccumulation and biochemical stress response in rice (Oryza sativa L.). Ecotox. Environ. Safe. 2015, 122, 392–398. [Google Scholar] [CrossRef] [PubMed]
- Xue, D.W.; Jiang, H.; Deng, X.X.; Zhang, X.Q.; Wang, H.; Xu, X.B.; Hu, J.; Zeng, D.L.; Guo, L.B.; Qian, Q. Comparative proteomic analysis provides new insights into cadmium accumulation in rice grain under cadmium stress. J. Hazard. Mater. 2014, 280, 269–278. [Google Scholar] [CrossRef]
- Satarug, S.; Vesey, D.A.; Gobe, G.C.; Phelps, K.R. Estimation of health risks associated with dietary cadmium exposure. Arch. Toxicol. 2023, 97, 329–358. [Google Scholar] [CrossRef] [PubMed]
- Zhou, L.N.; Zhou, L.J.Y.; Wu, H.B.; Li, J.S.; Kong, L.J.; Yang, H.Y. Effects of Applying Biochar on Soil Cadmium Immobilisation and Cadmium Pollution Control in Lettuce (Lactuca sativa L.). Agriculture 2024, 14, 1068. [Google Scholar] [CrossRef]
- Wang, H.; Huang, Q.N.; Zhang, Y.; Shao, G.S.; Hu, Y.J.; Xu, Y.X. Biochar Decreases Soil Cadmium (Cd) Availability and Regulates Expression Levels of Cd Uptake/Transport-Related Genes to Reduce Cd Translocation in Rice. Rice Sci. 2024, 31, 494–498. [Google Scholar]
- Melo, L.C.A.; Lehmann, J.; Carneiro, J.S.D.S.; Camps Arbestain, M. Biochar-based fertilizer effects on crop productivity: A meta-analysis. Plant Soil 2022, 472, 1–14. [Google Scholar] [CrossRef]
- Yang, X.; Lu, K.P.; McGrouther, K.; Che, L.; Hu, G.T.; Wang, Q.Y.; Liu, X.Y.; Shen, L.L.; Huang, H.G.; Ye, Z.Q.; et al. Bioavailability of Cd and Zn in soils treated with biochars derived from tobacco stalk and dead pigs. J. Soils Sediment. 2017, 17, 751–762. [Google Scholar] [CrossRef]
- EI-Naggar, A.; Chen, Z.H.; Jiang, W.T.; Cai, Y.J.; Chang, S.X. Biochar effectively remediates Cd contamination in acidic or coarse- and medium-textured soils: A global meta-analysis. Chem. Eng. J. 2022, 442, 136225. [Google Scholar] [CrossRef]
- Nguyen, B.T.; Dinh, G.D.; Nguyen, T.X.; Nguyen, D.T.P.; Vu, T.N.; Tran, H.T.T.; Van Thai, N.; Vu, H.; Do, D.D. The Potential of Biochar to Ameliorate the Major Constraints of Acidic and Salt-Affected Soils. J. Soil Sci. Plant Nut. 2022, 22, 1–11. [Google Scholar] [CrossRef]
- Park, J.H.; Choppala, G.K.; Bolan, N.S.; Chung, J.W.; Chuasavathi, T. Biochar reduces the bioavailability and phytotoxicity of heavy metals. Plant Soil 2011, 348, 439–451. [Google Scholar] [CrossRef]
- Zong, Y.T.; Chen, H.; Malik, Z.; Xiao, Q.; Lu, S.G. Comparative study on the potential risk of contaminated-rice straw, its derived biochar and phosphorus modified biochar as an amendment and their implication for environment. Environ. Pollut. 2021, 293, 118515. [Google Scholar] [CrossRef] [PubMed]
- Josef, K. Selenium, Iodine and Iron–Essential Trace Elements for Thyroid Hormone Synthesis and Metabolism. Int. J. Mol. Sci. 2023, 24, 3393. [Google Scholar]
- Manuel, R.R.; Fátima, N.; Olimpia, C.; Luisa, O.M. Selenium, selenoproteins and cancer of the thyroid. J. Trace Elem. Med. Bio. 2023, 76, 127115. [Google Scholar]
- Zhu, Y.J.; Hu, J.; Zeng, S.M.; Gao, M.; Guo, S.J.; Wang, M.N.; Hong, Y.J.; Zhao, G. L-selenomethionine affects liver development and glucolipid metabolism by inhibiting autophagy in zebrafish embryos. Ecotox. Environ. Safe 2023, 252, 114589. [Google Scholar] [CrossRef]
- Dinh, Q.T.; Cui, Z.W.; Huang, J.; Tran, T.A.T.; Wang, D.; Yang, W.X.; Zhou, F.; Wang, M.K.; Yu, D.S.; Liang, D.L. Selenium distribution in the Chinese environment and its relationship with human health: A review. Environ. Int. 2018, 112, 294–309. [Google Scholar] [CrossRef]
- Wang, J.; Yang, L.S.; Li, H.R.; Li, Y.H.; Wei, B.G. Dietary selenium intake based on the Chinese Food Pagoda: The influence of dietary patterns on selenium intake. Nutr. J. 2018, 17, 50. [Google Scholar] [CrossRef]
- Chen, H.P.; Yang, X.P.; Wang, P.; Wang, Z.X.; Li, M.; Zhao, F.J. Dietary cadmium intake from rice and vegetables and potential health risk: A case study in Xiangtan, southern China. Sci. Total Environ. 2018, 639, 271–277. [Google Scholar] [CrossRef]
- Deng, X.F.; Liu, K.Z.; Li, M.F.; Zhang, W.; Zhao, X.H.; Zhao, Z.Q.; Liu, X.W. Difference of selenium uptake and distribution in the plant and selenium form in the grains of rice with foliar spray of selenite or selenate at different stages. Field Crop. Res. 2017, 211, 165–171. [Google Scholar] [CrossRef]
- Wang, Y.D.; Wang, X.; Wong, Y.S. Generation of selenium-enriched rice with enhanced grain yield, selenium content and bioavailability through fertilisation with selenite. Food Chem. 2013, 141, 2385–2393. [Google Scholar] [CrossRef]
- Zambonino, M.C.; Quizhpe, E.M.; Mouheb, L.; Rahman, A.; Agathos, S.N.; Dahoumane, S.A. Biogenic Selenium Nanoparticles in Biomedical Sciences: Properties, Current Trends, Novel Opportunities and Emerging Challenges in Theranostic Nanomedicine. Nanomaterials 2023, 13, 424. [Google Scholar] [CrossRef] [PubMed]
- Svetlana, M.; Sylvie, S.; Jiri, S.; Petr, S.; Pavel, H. Biogenic Selenium Nanoparticles in Animal Nutrition: A Review. Agriculture 2021, 11, 1244. [Google Scholar] [CrossRef]
- Wan, Y.A.; Yu, Y.; Wang, Q.; Qiao, Y.H.; Li, H.F. Cadmium uptake dynamics and translocation in rice seedling: Influence of different forms of selenium. Ecotox. Environ. Safe 2016, 133, 127–134. [Google Scholar] [CrossRef]
- Cui, J.H.; Liu, T.X.; Li, Y.D.; Li, F.B. Selenium reduces cadmium uptake into rice suspension cells by regulating the expression of lignin synthesis and cadmium-related genes. Sci. Total Environ. 2018, 644, 602–610. [Google Scholar] [CrossRef] [PubMed]
- Elisa, A.; Hendrik, K. Cadmium toxicity in plants. Met. Ions Life Sci. 2013, 11, 395–413. [Google Scholar]
- Huang, H.L.; Li, M.; Rizwan, M.; Dai, Z.H.; Yuan, Y.; Hossain, M.M.; Cao, M.H.; Xiong, S.L.; Tu, S.X. Synergistic effect of silicon and selenium on the alleviation of cadmium toxicity in rice plants. J. Hazard. Mater. 2021, 401, 123393. [Google Scholar] [CrossRef]
- Hussain, B.; Lin, Q.; Hamid, Y.; Sanaullah, M.; Di, L.; Hashmi, M.L.U.R.; Khan, M.B.; He, Z.L.; Yang, X.E. Foliage application of selenium and silicon nanoparticles alleviates Cd and Pb toxicity in rice (Oryza sativa L.). Sci. Total Environ. 2020, 712, 136497. [Google Scholar] [CrossRef]
- Feng, R.W.; Wei, C.Y.; Tu, S.X. The roles of selenium in protecting plants against abiotic stresses. Environ. Exp. Bot. 2013, 87, 58–68. [Google Scholar] [CrossRef]
- Zhu, Y.Y.; Dong, Y.W.; Zhu, N.; Jin, H.M. Foliar application of biosynthetic nano-selenium alleviates the toxicity of Cd, Pb, and Hg in Brassica chinensis by inhibiting heavy metal adsorption and improving antioxidant system in plant. Ecotox. Environ. Safe 2022, 240, 113681. [Google Scholar] [CrossRef]
- Golubkina, N.A.; Folmanis, G.E.; Tananaev, I.G.; Krivenkov, L.V.; Kosheleva, O.V.; Soldatenko, A.V. Comparative Evaluation of Spinach Biofortification with Selenium Nanoparticles and Ionic Forms of the Element. Nanotechnol. Russ. 2017, 12, 569–576. [Google Scholar] [CrossRef]
- Gu, Q.C.; Luo, H.W.; Lin, L.; Zhang, Q.Q.; Yi, W.T.; Liu, Z.F.; Yu, X.H.; Zuo, C.J.; Qi, J.Y.; Tang, X.R. Effects of Biological Nano-Selenium on Yield, Grain Quality, Aroma, and Selenium Content of Aromatic Rice. Agronomy 2024, 14, 1778. [Google Scholar] [CrossRef]
- Zheng, S.; Xu, C.; Zhu, H.H.; Huang, D.Y.; Wang, H.J.; Zhang, Q.; Li, X.X.; Zhu, Q.H. Foliar application of zinc and selenium regulates cell wall fixation, physiological and gene expression to reduce cadmium accumulation in rice grains. J. Hazard. Mater. 2024, 480, 136302. [Google Scholar] [CrossRef] [PubMed]
- Wang, M.S.; Jiang, D.H.; Huang, X.J. Selenium nanoparticle rapidly synthesized by a novel highly selenite-tolerant strain Proteus penneri LAB-1. IScience 2022, 25, 104904. [Google Scholar] [CrossRef] [PubMed]
- Liu, N.; Jiang, Z.M.; Li, X.; Liu, H.Y.; Li, N.; Wei, S.Q. Mitigation of rice cadmium (Cd) accumulation by joint application of organic amendments and selenium (Se) in high-Cd-contaminated soils. Chemosphere 2020, 241, 125106. [Google Scholar] [CrossRef]
- Saeedi, M.; Soltani, F.; Babalar, M.; Izadpanah, F.; WiesnerReinhold, M.; Baldermann, S. Selenium Fortification Alters the Growth, Antioxidant Characteristics and Secondary Metabolite Profiles of Cauliflower (Brassica oleracea var. botrytis) Cultivars in Hydroponic Culture. Plants 2021, 10, 1537. [Google Scholar] [CrossRef]
- NY/T 1104-2006; Determination of Total Se in Soils. Ministry of Agriculture: Beijing, China, 2006.
- GB/T 17141-1997; Soil Quality—Determination of Lead, Cadmium—Graphite Furnace Atomic Absorption Spectrophotometry. Ministry of Environmental Protection of the People’s Republic of China: Beijing, China, 1997.
- Ran, T.F.; Cao, G.F.; Xiao, L.L.; Li, Y.P.; Xia, R.; Zhao, X.T.; Qin, Y.; Wu, P.; Tian, S.J. Effects of cadmium stress on the growth and physiological characteristics of sweet potato. BMC Plant Biol. 2024, 24, 850. [Google Scholar] [CrossRef]
- Rajendran, M.; Shi, L.Z.; Wu, C.; Li, W.C.; An, W.H.; Liu, Z.Y.; Xue, S.G. Effect of sulfur and sulfur-iron modified biochar on cadmium availability and transfer in the soil–rice system. Chemosphere 2019, 222, 314–322. [Google Scholar] [CrossRef]
- Rong, Q.L.; Chen, J.; Zhang, Y.F.; Tan, Z.B.; Wang, W.J.; Sun, C.X.; Guo, X.; Zhou, C.H.; Cai, H.S.; Zhao, X.M. The interaction between selenium and other elements in soil and rice roots shaped by straw and straw biochar regulated the enrichment of selenium in rice grain. Front. Plant Sci. 2024, 15, 1387460. [Google Scholar] [CrossRef]
- Hla, E.H.; Zheng, T.D.; Umer, F.M.; Zeng, R.; Su, Y.; Zhang, Y.J.; Liang, Y.K.; Tang, Z.C.; Ye, X.Y.; Jia, X.M.; et al. Impact of selenium, zinc and their interaction on key enzymes, grain yield, selenium, zinc concentrations, and seedling vigor of biofortified rice. Environ. Sci. Pollut. Res. Int. 2020, 27, 16940–16949. [Google Scholar]
- Ganguly, R.; Sarkar, A.; Dasgupta, D.; Acharya, K.; Keswani, C.; Popova, V.; Minkina, T.; Maksimov, A.Y.; Chakraborty, N. Unravelling the Efficient Applications of Zinc and Selenium for Mitigation of Abiotic Stresses in Plants. Agriculture 2022, 12, 1551. [Google Scholar] [CrossRef]
- Zhang, T.; Qi, M.; Wu, Q.; Xiang, P.; Tang, D.J.; Li, Q. Recent research progress on the synthesis and biological effects of selenium nanoparticles. Front. Nutr. 2023, 10, 1183487. [Google Scholar] [CrossRef] [PubMed]
- Dorairaj, D.; Ismail, M.R.; Sinniah, U.R.; Ban, T.K. Influence of silicon on growth, yield, and lodging resistance of MR219, a lowland rice of Malaysia. J. Plant Nut. 2017, 40, 1111–1124. [Google Scholar] [CrossRef]
- Zhong, Y.; Chen, T.F.; Zheng, W.J.; Yang, Y.F. Selenium enhances antioxidant activity and photosynthesis in Ulva fasciata. J. Appl. Phycol. 2015, 27, 555–562. [Google Scholar] [CrossRef]
- Lyu, L.H.; Wang, H.Q.; Liu, R.F.; Xing, W.J.; Li, J.; Man, Y.B.; Wu, F.Y. Size-dependent transformation, uptake, and transportation of SeNPs in a wheat–soil system. J. Hazard. Mater. 2022, 424, 127323. [Google Scholar] [CrossRef]
- Bamagoos, A.; Alharby, H.; Fahad, S. Biochar coupling with phosphorus fertilization modifies antioxidant activity, osmolyte accumulation and reactive oxygen species synthesis in the leaves and xylem sap of rice cultivars under high-temperature stress. Physiol. Mol. Biol. Plants 2021, 27, 2083–2100. [Google Scholar] [CrossRef]
- Wang, C.R.; Cheng, T.T.; Liu, H.T.; Zhou, F.Y.; Zhang, J.F.; Zhang, M.; Liu, X.Y.; Shi, W.J.; Cao, T. Nano-selenium controlled cadmium accumulation and improved photosynthesis in indica rice cultivated in lead and cadmium combined paddy soils. J. Environ. Sci. 2021, 103, 336–346. [Google Scholar] [CrossRef]
- Guo, Y.K.; Mao, K.; Cao, H.R.; Waqar, A.; Lei, D.; Teng, D.Y.; Chang, C.Y.; Yang, X.F.; Yang, Q.; Khan, N.N.; et al. Exogenous selenium (cadmium) inhibits the absorption and transportation of cadmium (selenium) in rice. Environ. Pollut. 2020, 268, 115829. [Google Scholar] [CrossRef]
- Zhang, L.H.; Chu, C.C. Selenium Uptake, Transport, Metabolism, Reutilization, and Biofortification in Rice. Rice 2022, 15, 30. [Google Scholar] [CrossRef]
- Deng, T.H.B.; van der Ent, A.; Tang, Y.T.; Sterckeman, T.; Echevarria, G.; Morel, J.L.; Qiu, R.L. Nickel hyperaccumulation mechanisms: A review on the current state of knowledge. Plant Soil 2018, 423, 1–11. [Google Scholar] [CrossRef]
- Wang, J.B.; Su, L.Y.; Yang, J.Z.; Yuan, J.G.; Yin, A.G.; Qiu, Q.; Zhang, K.; Yang, Z.Y. Comparisons of cadmium subcellular distribution and chemical forms between low-Cd and high-Cd accumulation genotypes of watercress (Nasturtium officinale L. R. Br.). Plant Soil 2015, 396, 325–337. [Google Scholar] [CrossRef]
- Qi, W.Y.; Li, Q.; Chen, H.; Liu, J.; Xing, S.F.; Xu, M.; Yan, Z.; Song, C.; Wang, S.G. Selenium nanoparticles ameliorate Brassica napus L. cadmium toxicity by inhibiting the respiratory burst and scavenging reactive oxygen species. J. Hazard. Mater. 2021, 417, 125900. [Google Scholar] [CrossRef]
- Wu, C.; Dun, Y.; Zhang, Z.J.; Li, M.L.; Wu, G.Q. Foliar application of selenium and zinc to alleviate wheat (Triticum aestivum L.) cadmium toxicity and uptake from cadmium-contaminated soil. Ecotox. Environ. Safe 2020, 190, 110091. [Google Scholar] [CrossRef] [PubMed]
- Gao, M.; Zhou, J.; Liu, H.L.; Zhang, W.T.; Hu, Y.M.; Liang, J.N.; Zhou, J. Foliar spraying with silicon and selenium reduces cadmium uptake and mitigates cadmium toxicity in rice. Sci. Total Environ. 2018, 631–632, 1100–1108. [Google Scholar] [CrossRef] [PubMed]
- Cui, B.L.; Luo, H.W.; Yao, X.B.; Xing, P.P.; Deng, S.C.; Zhang, Q.Q.; Yi, W.T.; Gu, Q.C.; Peng, L.G.; Yu, X.H.; et al. Nanosized-Selenium-Application-Mediated Cadmium Toxicity in Aromatic Rice at Different Stages. Plants 2024, 13, 2253. [Google Scholar] [CrossRef] [PubMed]
- Su, Y.; Huang, X.; Li, L.; Muhammad, Z.A.; Li, M.L.; Zheng, T.D.; Guo, Z.; Zhang, Y.; Luo, D.; Ye, X.Y.; et al. Comparative Responses of Silicon to Reduce Cadmium and Enrich Selenium in Rice Varieties. Foods 2023, 12, 1656. [Google Scholar] [CrossRef]
- Su, X.L.; Cai, Y.X.; Pan, B.G.; Li, Y.Q.; Liu, B.Q.; Cai, K.Z.; Wang, W. Significant Synergy Effects of Biochar Combined with Topdressing Silicon on Cd Reduction and Yield Increase of Rice in Cd-Contaminated Paddy Soil. Agronomy 2024, 14, 568. [Google Scholar] [CrossRef]
- Golubkina, N.; Moldovan, A.; Fedotov, M.; Kekina, H.; Kharchenko, V.; Folmanis, G.; Alpatov, A.; Caruso, G. Iodine and Selenium Biofortification of Chervil Plants Treated with Silicon Nanoparticles. Plants 2021, 10, 2528. [Google Scholar] [CrossRef]
- DB 45/T1061-2014; Classification Criteria for Selenium Content in Selenium-Enriched Agricultural Products. Guangxi Zhuang Autonomous Region Quality and Technical Supervision Bureau: Nanning, China, 2014.
Disclaimer/Publisher’s Note: The statements, opinions and data contained in all publications are solely those of the individual author(s) and contributor(s) and not of MDPI and/or the editor(s). MDPI and/or the editor(s) disclaim responsibility for any injury to people or property resulting from any ideas, methods, instructions or products referred to in the content. |
© 2025 by the authors. Licensee MDPI, Basel, Switzerland. This article is an open access article distributed under the terms and conditions of the Creative Commons Attribution (CC BY) license (https://creativecommons.org/licenses/by/4.0/).