Article

Coupling of Biochar and Manure Improves Soil Carbon Pool Stability, Pore Structure, and Microbial Diversity

1
Key Laboratory of Wetland Ecology and Environment, Northeast Institute of Geography and Agroecology, Chinese Academy of Sciences, Changchun 130102, China
2
College of Resources and Environment, Huazhong Agricultural University, Wuhan 430070, China
*
Author to whom correspondence should be addressed.
Agronomy 2025, 15(6), 1384; https://doi.org/10.3390/agronomy15061384
Submission received: 16 April 2025 / Revised: 29 May 2025 / Accepted: 30 May 2025 / Published: 5 June 2025
(This article belongs to the Section Soil and Plant Nutrition)

Abstract

Albic soils in Northeast China are characterized by low fertility due to factors such as high viscosity, acidity, and carbon depletion. To address these challenges and promote sustainable crop production, biochar and manure have been suggested as soil amendments. However, the mechanisms behind these improvements remain unclear. This study involved a pot experiment to explore how varying levels of biochar application (0.5%, 1.0%, and 2.0%), alone or combined with cow manure (0.5%), affect soil properties. The dual application of biochar (2.0%) and manure (0.5%) elicited synergistic improvements in soil functionality, surpassing individual treatments. The total organic carbon (TOC) increased by 10.4% and 54.9% relative to that associated with biochar-only (2.0%) and manure-only (0.5%) amendments, respectively, with concurrent structural shifts toward stabilized carbon forms—evidenced by elevated alkyl C content (16.3%) and alkyl C/O–alkyl C ratios (22.8%). Soil physical structure was enhanced, as total porosity (5.64%) rose by 2.0% and pH (6.0) increased by 4.7% compared to sole biochar application. Microbial community analysis revealed that the combined treatment amplified bacterial diversity (Chao1 index 26.9%) and catalase activity (67.0%) while reducing Acidobacteria dominance (24.0%), which was indicative of improved metabolic adaptation. These findings demonstrate that biochar–manure coupling drives carbon sequestration through dual mechanisms: (1) physical stabilization via pore architecture modification and (2) biochemical modulation through microbial network complexity.

1. Introduction

Albic soil, classified as an Argosol in the Chinese Soil Taxonomy, is a typical low-productivity soil type that predominates in agricultural lands in Heilongjiang Province and eastern Jilin Province. In Jilin Province alone, the albic soil area reaches 5032.17 km2, accounting for 9.4% of the cultivated land in this region [1]. As a critical grain production base, Jilin’s albic soils pose significant challenges: they have an acidic pH (average 5.3), high clay content (19.4–20.9%), and compacted structure with poor aeration [2]. Future agricultural intensification to meet growing food demands will increase soil damage and compaction [3]. These properties exacerbate drought–flood vulnerability, reduce fertilizer efficiency, and cause an average 20% yield loss, threatening regional food security [4].
To address these limitations, biochar and manure have been widely focused on as amendments. Biochar is a carbon-rich material created through the pyrolysis of biomass, including wood, bamboo, crop residues, animal manure, and sludge, under high-temperature and low-oxygen conditions [5]. It features a high specific surface area and a complex porous structure [6]. The porosity of biochar improves the dense physical structure of albic soil, significantly reducing soil bulk density [7] and providing ample space for microbial proliferation. Its organic components also serve as sources of carbon and nitrogen for microbial communities, reducing competition among microorganisms [8]. Manure, which is recognized as an organic fertilizer, serves as a soil amendment rich in organic matter, metabolites, and microorganisms, which can improve the replenishment of soil nutrients. It can also strengthen soil nitrification and nitrogen fixation, thereby improving nitrogen utilization efficiency and crop productivity [9]. The study revealed that biochar application enhances recalcitrant organic carbon components, thereby modulating the soil micro-ecological environment. This alteration can be corroborated through the chemical speciation of organic carbon. Solid-state 13C nuclear magnetic resonance (NMR) spectroscopy has been employed to characterize carbon functional groups within soil organic carbon (SOC) [10]. The findings demonstrate distinct roles of C functional groups: N-alkyl, O-alkyl, and di-O-alkyl carbon functional groups are classified as labile organic carbon fractions, predominantly derived from hydrolysable compounds such as proteins and carbohydrates. In contrast, alkyl, aryl, phenolic, and carbonyl carbon functional groups originate from lignin and tannins, collectively forming the recalcitrant organic carbon pool [11].
These findings collectively underscore the structural basis of biochar-induced carbon stabilization, yet how such molecular signatures mechanistically govern microbial metabolic preferences and long-term carbon sequestration dynamics has yet to be systematically elucidated [12,13], particularly in the context of optimizing biochar amendment strategies for sustainable soil management [14]. Existing studies have shown that compared to manure without biochar treatment, manure containing biochar can significantly increase the levels of total carbon and oxidizable carbon in the soil [15]. Effective carbon utilization may be closely related to microbial-driven soil carbon components and carbon transformation processes. Specifically, the alterations in the abundance of bacterial phyla in the soil, particularly those of Proteobacteria, Acidobacteria, and Bacteroidetes, can be utilized to forecast the potential decomposition of SOC [16]. Biochar and manure alter the chemical complexity and molecular structure of organic carbon, affecting the rate at which soil microbes decompose carbon, which in turn enhances carbon sequestration potential [17]. Moreover, biochar and manure can encourage the growth of functional microbial communities, enhancing their functionality [18].
In this study, we hypothesized that the coupled application of biochar and organic fertilizer could more effectively restore the stability of the soil carbon pool, soil physical structure, and bacterial community of soil than biochar application alone. The objectives of this study were to (1) investigate the improvement of soil carbon pool stability through the coupling of biochar and manure; (2) analyze the regulatory relationship among soil porosity, microorganisms and soil carbon pool stability; and (3) illustrate the mechanisms of restoration for the barrier characteristics of soil with the combined application. The results will reveal the importance of soil structure improvement and soil microbial driving on soil carbon pool stability, providing new insights for the strategies used when applying biochar and manure fertilizers as amendments.

2. Materials and Methods

2.1. Site Description

The albic soil material was collected from Taipinghe Village, Dongfeng County, Jilin Province (42°33′8247″ N, 125°22′7603″ E), on 22 April 2021 at an altitude of 394 m. The area is characterized by a humid climate typical of the middle-temperate zone in the monsoon region. The average annual rainfall measures 569 mm, accompanied by 127 frost-free days. The soil characteristics include a pH 4.45, TN (1.32 g kg−1), available P (58.77 mg kg−1), available K (126.52 mg kg−1), and organic matter content of 7.25 g kg−1.
Biochar was produced from corn husk through pyrolysis at temperatures between 400 and 500 °C for 4 h in an anaerobic environment (mean particle size 3.5 mm; surface area 0.7 m2 g−1, pH 9.16, TOC 626.4 g kg−1, C/N 33.60). The manure used was cow manure subjected to aerobic fermentation (pH 7.23, TN 24.21 g kg−1, TOC 416.8 g kg−1, C/N 23.21, moisture content of 40%).

2.2. Field Experimental Design

A completely randomized design (CRD) with 3 replicates per treatment was adopted for the pot experiment. For the soil pot experiment, each plastic pot (20 × 20 cm) was filled with 5 kg of soil. The treatments were (1) CK, (2) B1 (12.25 t·hm2, 5 g kg−1, 0.5% biochar), (3) B2 (24.5 t·hm2, 10 g kg−1, 1% biochar), (4) B3 (49 t·hm2, 15 g kg−1, 2% biochar), (5) FB0 (12.25 t·hm2, 5 g kg−1, 0.5% manure), (6) FB1 (0.5% manure blended with 0.5% biochar), (7) FB2 (0.5% manure blended with 1.0% biochar), and (8) FB3 (0.5% manure blended with 2.0% biochar). Three replicates were set for each treatment. The biochar and cow manure, screened by 1 mm, were mixed with soil according to the above treatment proportion as a base fertilizer. All fertilizers were thoroughly mixed with air-dried soil as a basal dose prior to potting. CO(NH2)2, Ca(H2PO4)2, and K2SO4 were applied at rates equivalent to 0.20 g·N·kg−1, 0.0715 g·P·kg−1, and 0.144 g·K·kg−1 soil, respectively. The homogenized soil–fertilizer matrix was then incubated at 70% water-holding capacity for 72 h before sowing to initiate nutrient activation. Spring wheat was sown in April 2021, September 2021, and April 2022, respectively, with three wheat emergence plants in each pot. Water and other cultivation management measures were strictly controlled and kept consistent.

2.3. Sample Collection and Determination

The wheat crop was harvested and the soil was sampled once destructively, with three soil samples taken from each pot mixed into one soil sample. Rhizosphere soil was collected with a driller and packed into resealable plastic bags in three parts. One part was stored at +4 °C for microbial biomass carbon and enzyme activity analysis, and the second was stored at −80 °C for DNA extraction, and the third was air-dried naturally (25 °C) to determine the soil physicochemical properties.
Total organic carbon (TOC): a 50.0 mg air-dried soil sample was weighed in the sample boat, which was put into the reactor and determined by a TOC analyzer (TOC-L, Shimadzu, Tsushima, Japan). Total nitrogen (TN) was determined using an automatic Kjeldahl nitrogen analyzer (Vapodest 50s, Bonn, Germany). The soil pH was measured with a pH meter (Shanghai Thunder Magnetic, PHS-3E, Shanghai, China) after leaching according to a soil to water ratio of 1:2.5. The soil enzyme activities were determined using a microplate fluorescence method with reagent kits (Suzhou Keming Biotechnology Co., Ltd., Suzhou, China), and measured by a microplate reader (Epoch, BioTek, Santa Clara, CA, USA). The specific procedures were as follows: urease activity was analyzed via the indophenol blue colorimetric method, catalase activity was measured using the potassium permanganate titration method, and invertase activity was assessed by the 3,5-dinitrosalicylic acid (DNS) colorimetric method.
The chemical composition of carbon was determined using a nuclear magnetic resonance spectroscopy (NMR) spectrometer (AVANCE NEO 400 WB, Bruker, Switzerland, Germany). Data processing was performed in MestreNova 12.0 software (Mestrelab Research SL, Santiago de Compostela, Spain), including phase correction, baseline adjustment, and integration. The following regions of chemical shifts from each spectrum corresponded to a series of C functional groups: alkyl C (0–45 ppm), N-alkyl C (45–60 ppm), O-alkyl C (60–93 ppm), di-O-alkyl C (93–110 ppm), aryl C (110–142 ppm), phenolic C (142–160 ppm) and Carbonyl C (160–190 ppm). Labile organic C fractions included N-alkyl, O-alkyl, and di-O-alkyl C. Recalcitrant organic C fractions included alkyl C, aryl C, phenolic C, and Carbonyl C. The degree of soil organic carbon decomposition and C pool stability were evaluated based on the alkyl C–O-alkyl C ratio (A/OA) = (0–45 ppm)/(45–110 ppm). The complexity of soil organic carbon fractions was evaluated by the (alkyl-C + O-alkyl C)/(aryl C + phenolic C+ carbonyl-C) ratio (Al/AR) = (0–45 ppm + 60–93 ppm)/(110–190 ppm). The labile organic carbon fraction included the N-alkyl, O-alkyl, and di-O-alkyl carbon functional groups. The recalcitrant organic carbon fraction comprised alkyl, aryl, phenolic, and carbonyl carbon functional groups. The hydrophobic carbon index was the ratio of (Aryl C + Alkyl C) to TOC.

2.4. Soil Microstructural Porosity

The microstructural porosity in the soils was determined via X-ray tomography (Synchrotron radiation micron focus CT system, Shanghai Phoenix V|tome|x M, Shanghai, China). The sample was fixed on the turntable, and the whole sample was scanned using a 300 kV micron ray tube. The detection parameter voltage was 170 kV, the current was 70 μA, and the resolution was 9 μm. A total of 1500 layers of image projections were generated for each soil column.
According to the gray threshold selected by mathematical calculus or the visual method, the pixels with gray values below and above the threshold were assigned values of 0 (pore phase) and 1 (solid phase), respectively, to complete the segmentation of the soil pore region and the solid region in the image [19]. Avizo9.0 (Thermo Fisher, Hillsboro, OR, USA) was used to reconstruct the scanned back image, and the ring artifacts in the boundary region image were eliminated. VGStudioMax 3.3 software was used to reconstruct the three-dimensional pore structure of the image and obtain and analyze the pore parameters [19].
The pore shape coefficient (F) was calculated by Formula:
F = S e S
where Se is the surface area of the sphere with equal pore area, while S is the measured surface area of the corresponding pore. The larger the F value is, the more the pore shape tends to be circular; on the contrary, the more irregular the pore shape is. The closer the value is to 0, the closer the corresponding pore is to the long strip type. At the same time, according to the F value, the pores are categorized as regular (F > 0.5) irregular (0.2 < F < 0.5), and lean long (F ≤ 0.2) [20].

2.5. Soil DNA Extraction, PCR Amplification, NovaSeq

TruSeq® DNA PCR-Free Sample Preparation Kit (Illumina, Shanghai, China) was used for library construction, and the constructed libraries were quantified by Qubit and Q-PCR. HiSeq2500 PE250 (Illumina, Shanghai, China) was used for sequencing. Tax4Fun 0.3.1 was used for functional prediction. Sequencing samples were clustered out of OTU using the SILVA database sequence as a reference sequence, and then functional annotation information was obtained.

2.6. Statistical Analysis
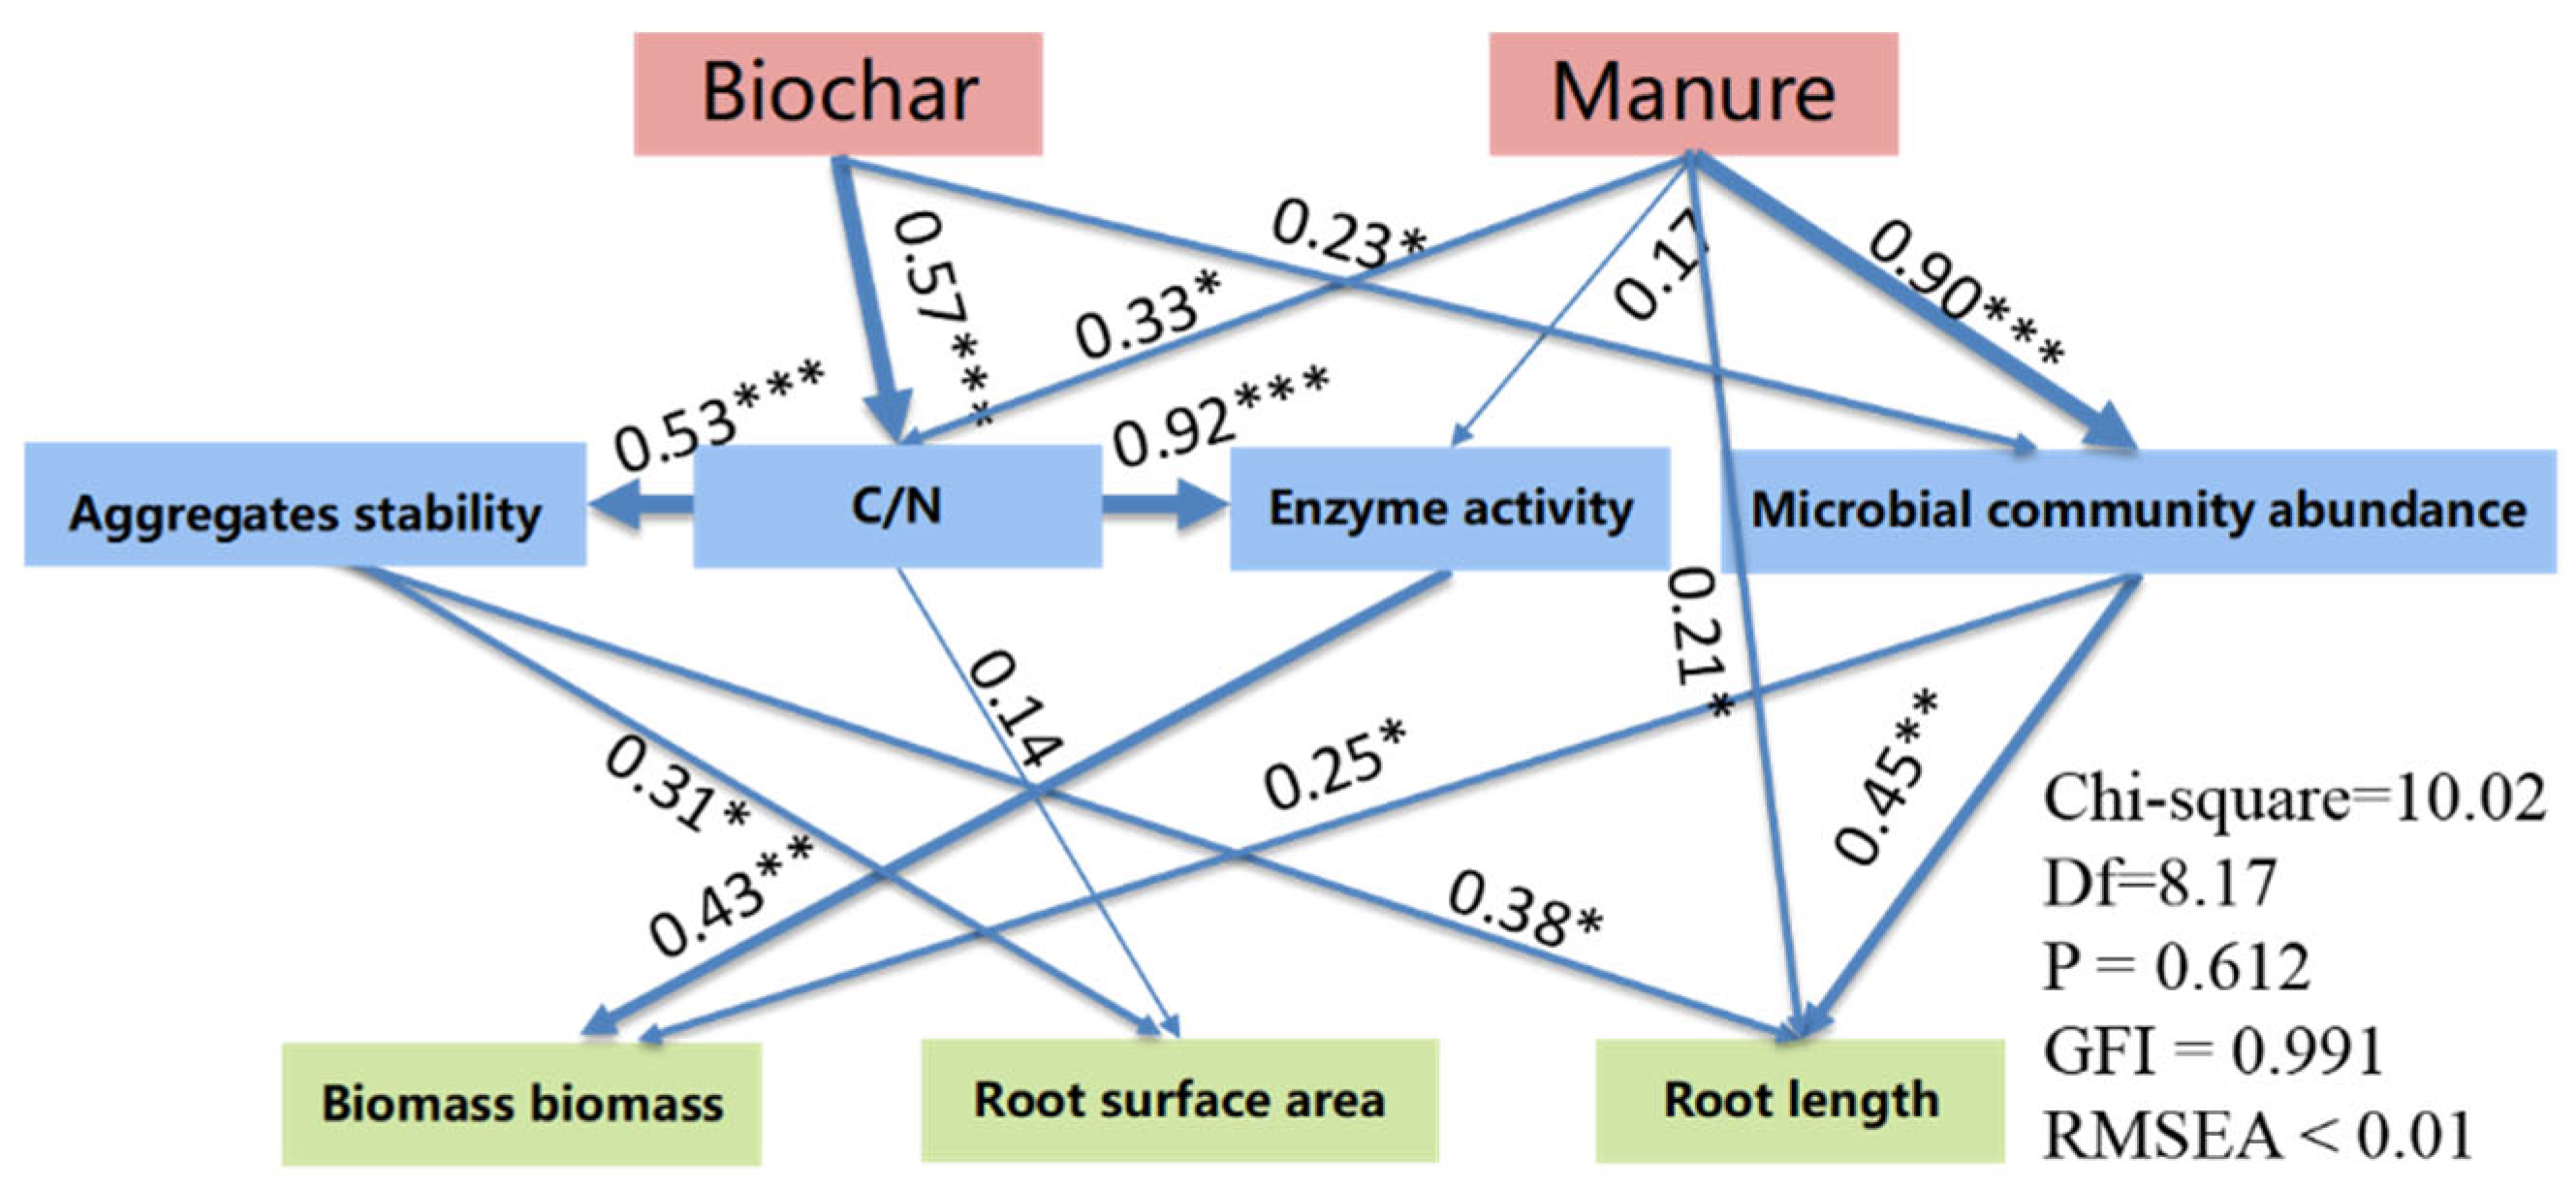
SPSS Statistics 22.0 (IBM, Armonk, NY, USA) was utilized for testing data normality, homogeneity. ANOVA was carried out to identify the significant differences among treatments in R (p < 0.05). Fitting and mapping were accomplished with Origin Pro 9.0. Principal component analysis (PCA) was executed using Canoco 5.

3. Results

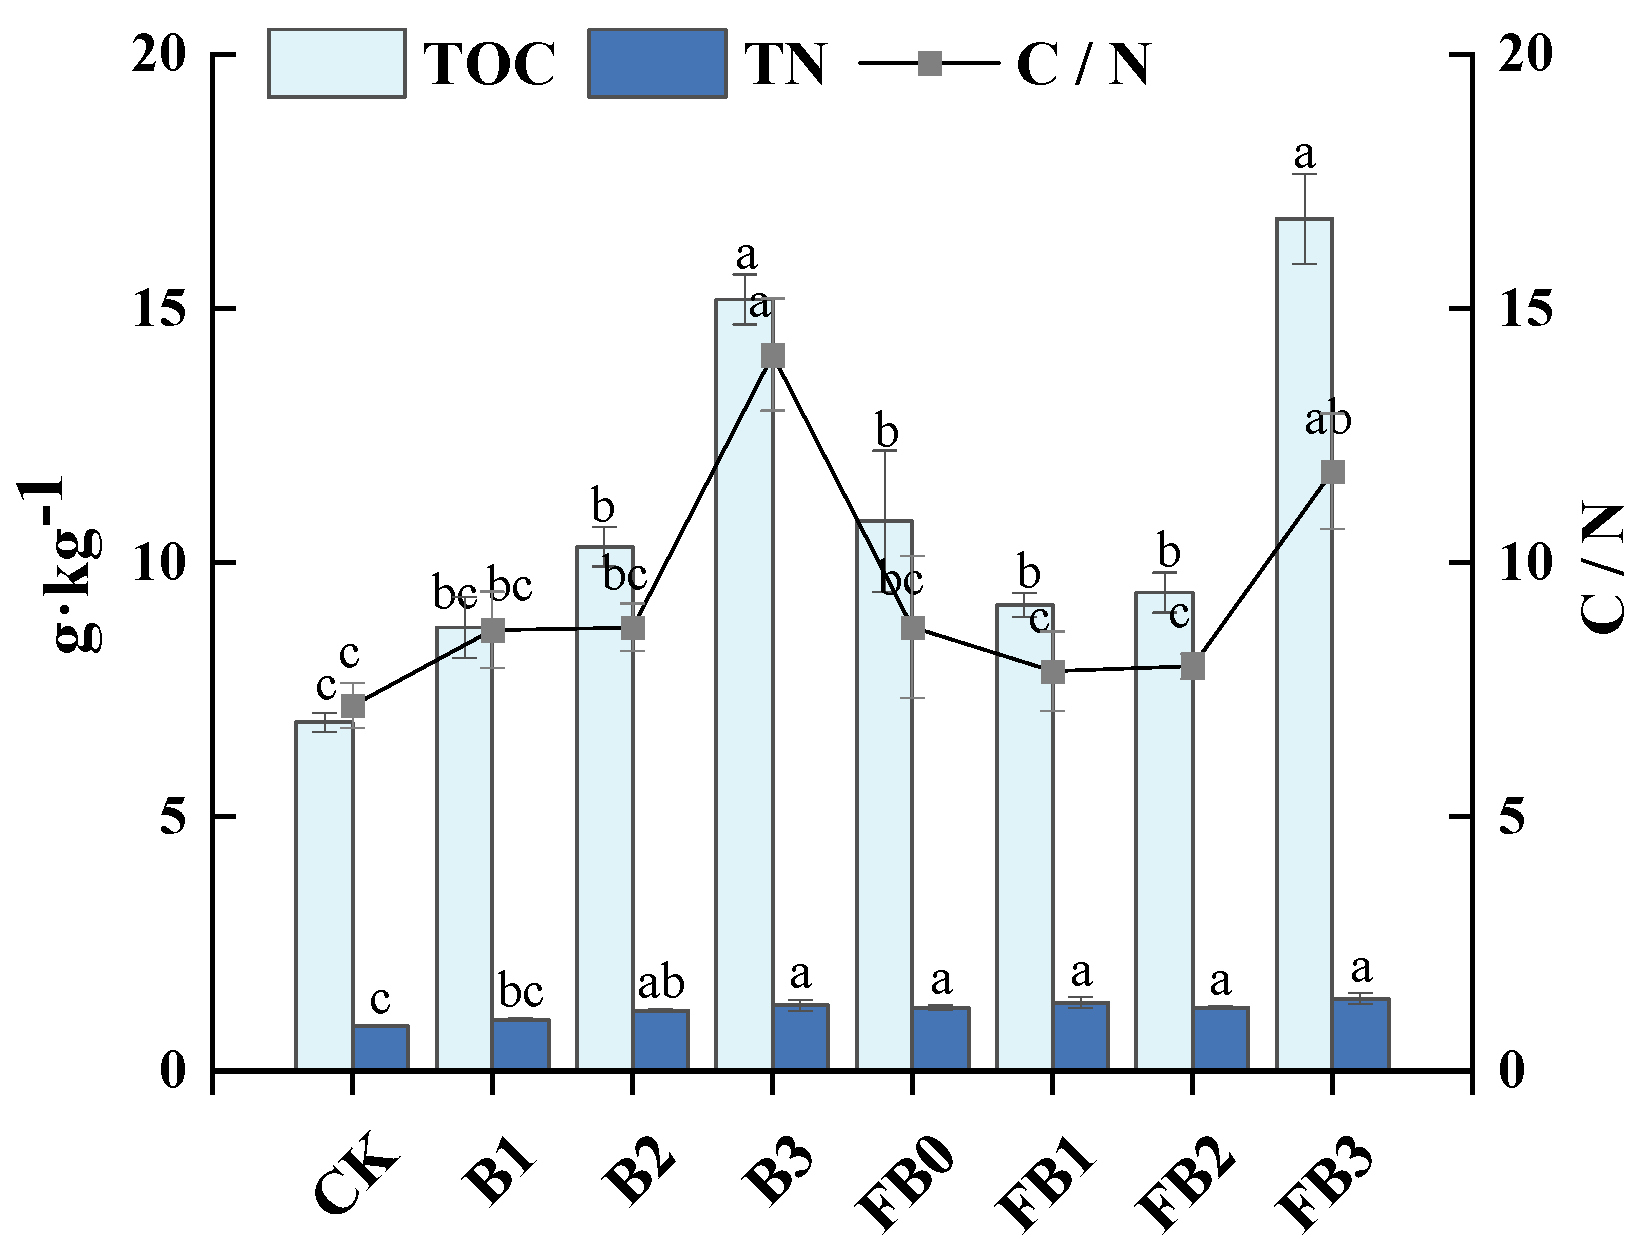
3.1. Soil Organic Carbon Content and Fractions

The addition of biochar and manure significantly enhanced the C, N content of soil (Figure 1). Compared with CK, the average TOC of biochar treatment (B1–B3), manure treatment (FB0) and coupling treatment (FB1–FB3) increased by 66.43%, 57.89%, and 71.89%, respectively. The TN increased by 32.44%, 41.63%, and 52.34% on average, respectively. The TOC and TN content of soil with biochar (2%) combined with manure were 10.4% and 10.19% higher than that of soil with biochar alone (2%), and 54.94% and 14.68% higher than that of soil with manure alone (0.5%). The C/N ratio followed the same trend as total organic C, peaking at B3 and FB3.
Combined addition of biochar and manure increased the C pool stability. As regards the contents of C functional groups (Figure 2a), the aryl C increased by 2.28 times on average under biochar treatment (B1–B3), by 1.73 times under manure treatment (FB0), and by 3.19 times under coupling treatment (FB1–FB3) compared with CK. Under the coupling treatment, the ratio of alkyl C–O-alkyl C (A/OA) increased by 1.30–3.03 times, but N-alkyl, O-alkyl and di-o-alkyl C all showed a decreasing trend, and the decreasing trend was more significant with the increase in the use of biochar. When the biochar application rate was 2%, the single application of biochar reduced the (alkyl-C + O-alkyl C)–(aryl C + phenolic C + carbonyl-C) ratio (Al/AR) by 77.56%, while the combined application with manure reduced it by 79.86%.
In addition, the insoluble organic C content increased with the increase in the amount of biochar (Figure 2b). Compared with CK, manure treatment increased the recalcitrant organic C fractions by 62.9%. Compared to biochar or manure treatment, the coupling amendment significantly increased the recalcitrant organic C fractions, with an average increase of 13.59% and 33.13%. Compared with CK, both biochar and organic fertilizer increased the soil hydrophobic carbon index, with a higher alkyl–O-alkyl ratio indicating the dominance of hydrophobic components (Figure S1).

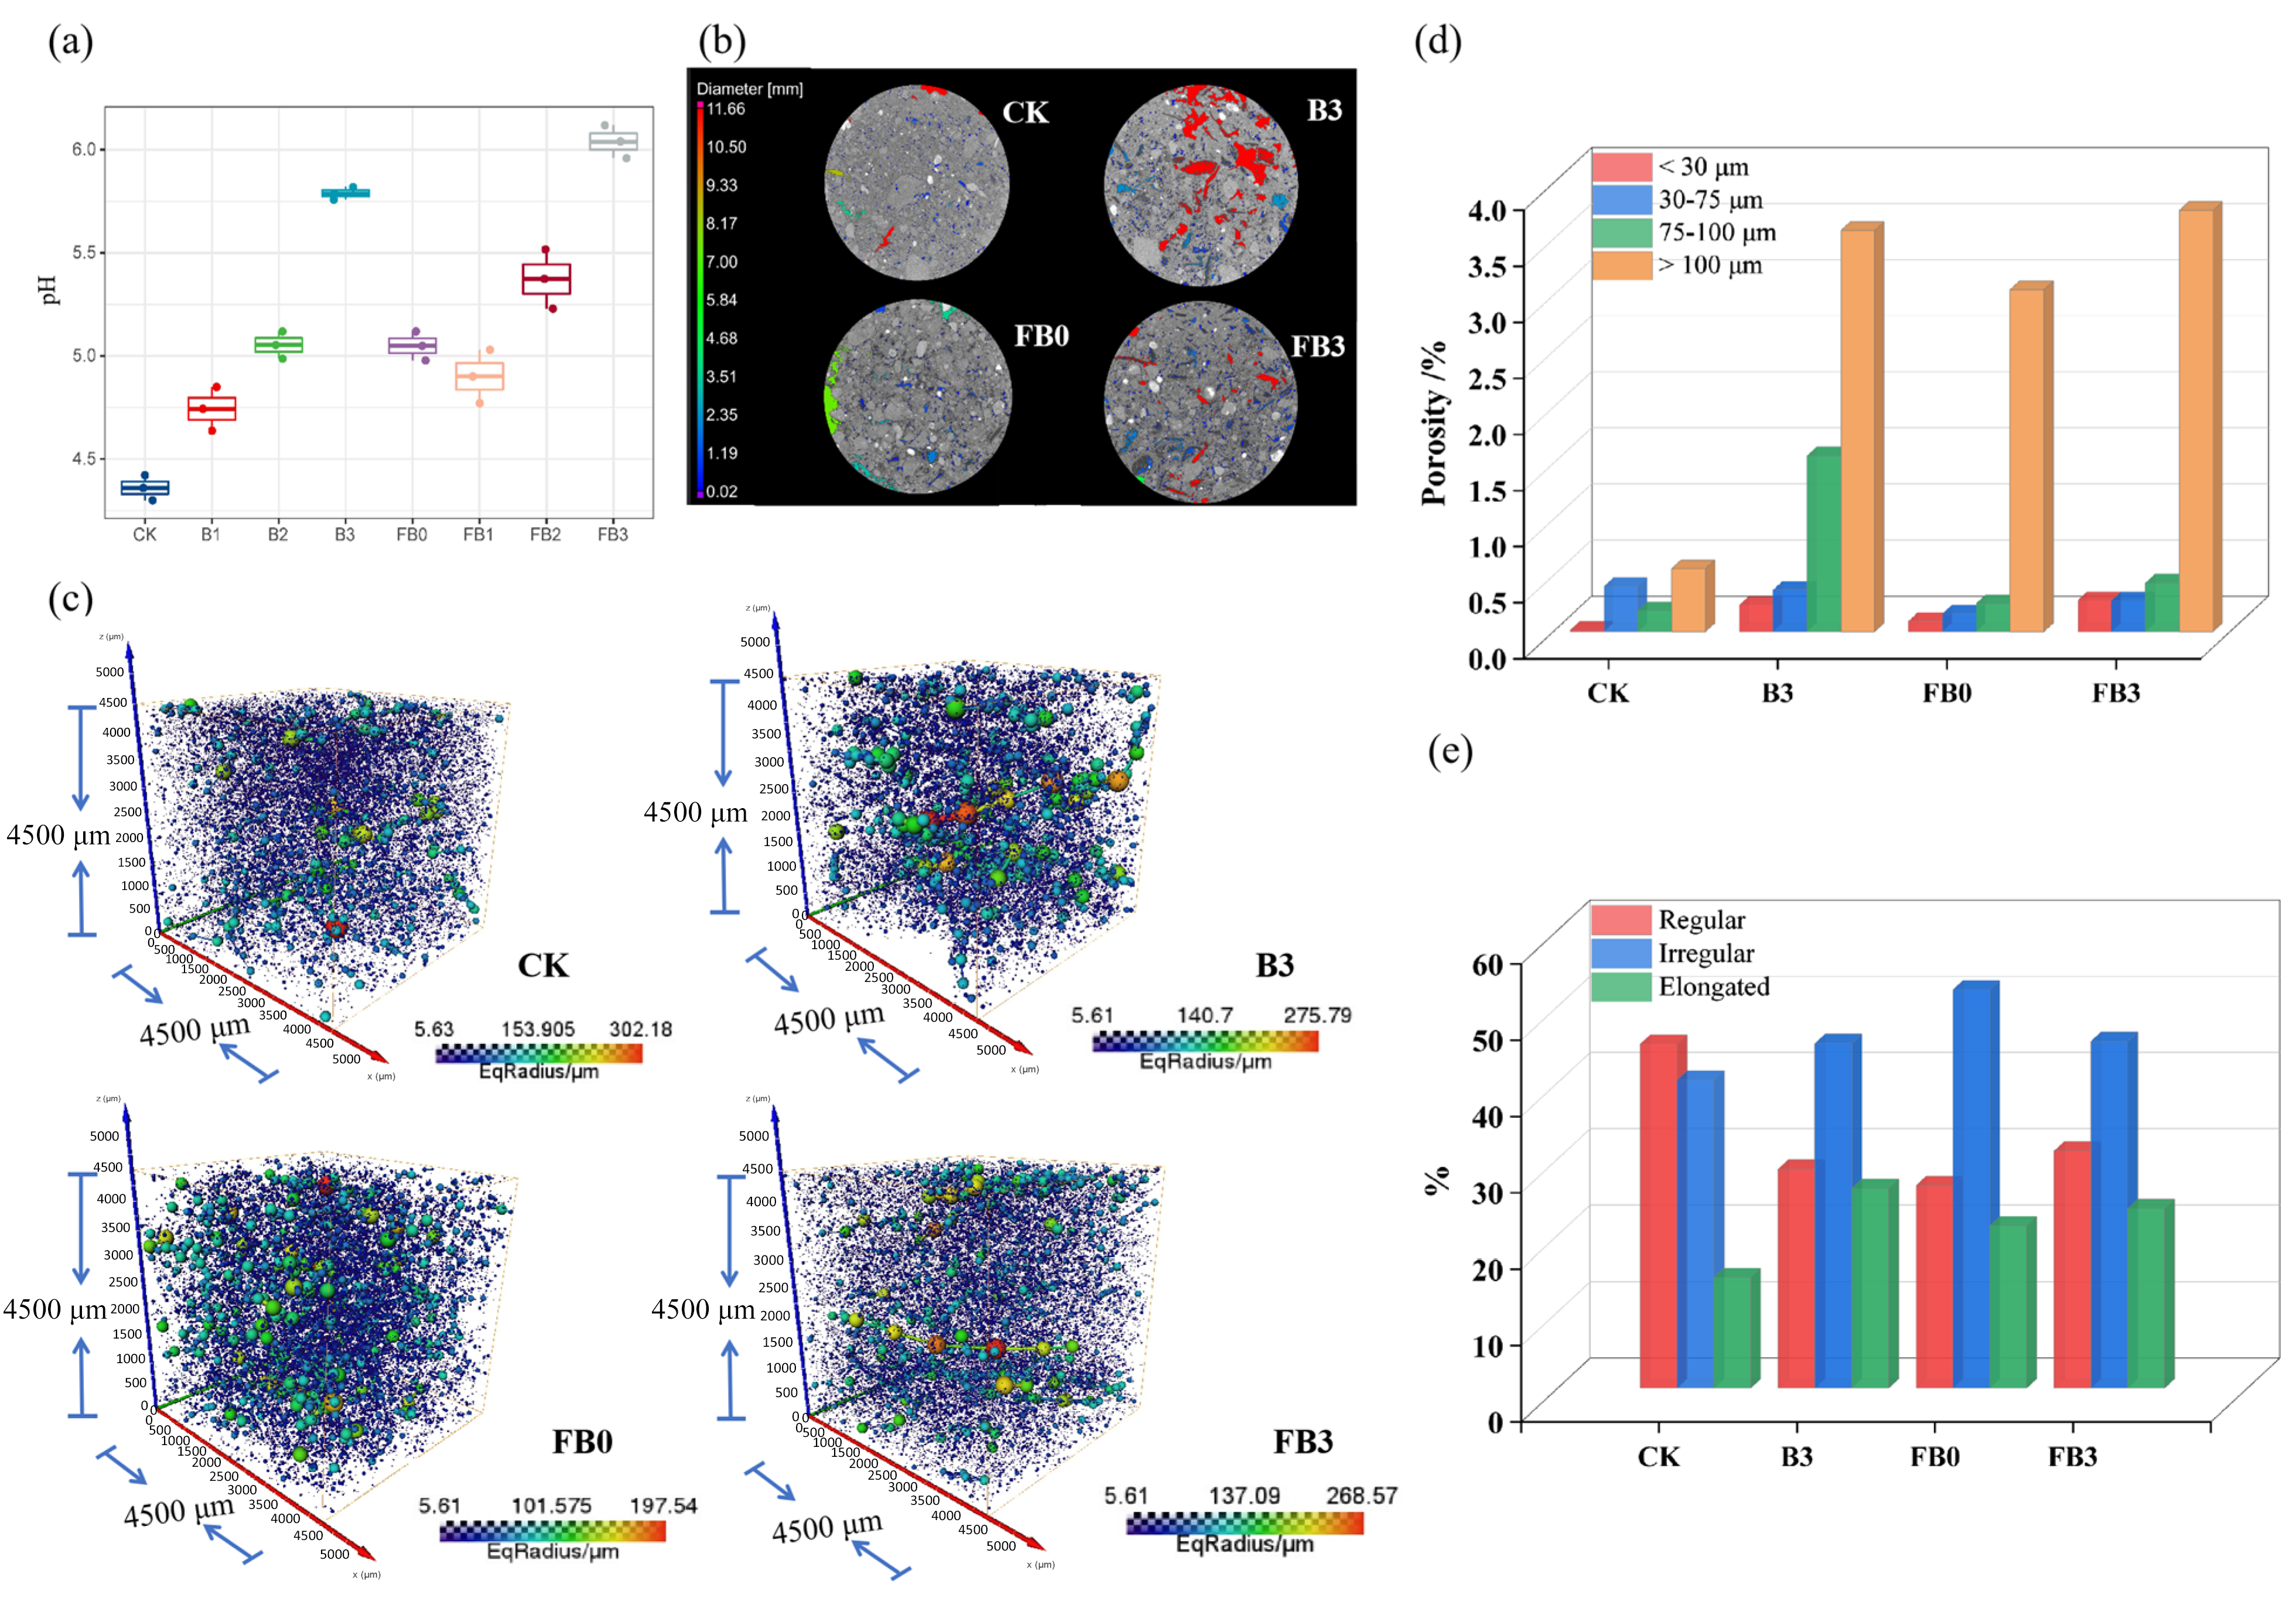
3.2. Soil pH and Pore Characteristics

Biochar positively influenced the acidity barrier factor of soil, increasing it by 8.80–32.79% compared to CK (Figure 3a). Manure alone resulted in a 15.81% increase relative to CK. The combination of biochar and manure raised the average by 4.66% and 7.70% compared to using either biochar or manure alone.
The pore distribution changes that occurred in a cross-section of soil are shown in Figure 3b. From the overall pore diameter distribution, the maximum soil pore diameter under the biochar treatment (B3) treatment reached 11.66 mm, with the average pore diameter increasing by 31.68% compared to that associated with CK treatment. The maximum pore diameters for manure treatment (FB0) and coupling application (FB3) were 9.39 mm and 11.78 mm, respectively, with average pore diameters increasing by 21.07% and 32.65% compared to those observed in response to CK treatment. After the application of biochar, the average throat radius of the white slurry layer increased by 31.68% (Figure 3c). Under the combination of biochar and organic fertilizer, the average throat radius of the white slurry layer increased by 32.65%. In the BC + F treatment, the pore throat was more widely and uniformly distributed.
Applying biochar and manure enhanced soil porosity, with their combined application having the greatest impact. Specifically, biochar treatment (B3) increased the total soil porosity by 48.26%, while manure treatment (FB0) raised it by 27.08%. The combined application (FB3) resulted in a 51.21% increase in total soil porosity (Table 1). A negative correlation exists between pore quantity and porosity; the combination of biochar and manure reduced pore numbers by 32.08% compared to CK.
The size of soil pores can reflect the permeability and water conductivity of the soil. After the addition of biochar and manure, the porosity of particles larger than 100 µm was significantly greater compared to that of CK (Figure 3d). Compared to CK, the biochar treatment (B3) increased the soil >100 µm porosity by 5.36 times, the manure treatment (FB0) increased it by 4.41 times, and the coupling application (FB3) increased it by 5.68 times. For 75–100 µm porosity, the biochar had the most significant effect, which was 7.4 times greater than that of CK.
Further analysis of the soil pore shape characteristics (Figure 3e) found that regular pores and irregular pores were the main forms of soil pores, accounting for 45.09% and 40.38% of pores in CK, respectively, and the proportion of lean and long pores was relatively low: only 15%. After the addition of biochar and manure, the number of irregular and elongated pores in the soil increased, while the number of regular pores decreased. Compared to the CK, the biochar (B3) treatment increased the irregular and elongated proportion by 11.88% and 79.96%, respectively; the manure treatment (FB0) increased it by 29.30% and 46.21%; and the coupling application (FB3) increased it by 12.53% and 61.75%.

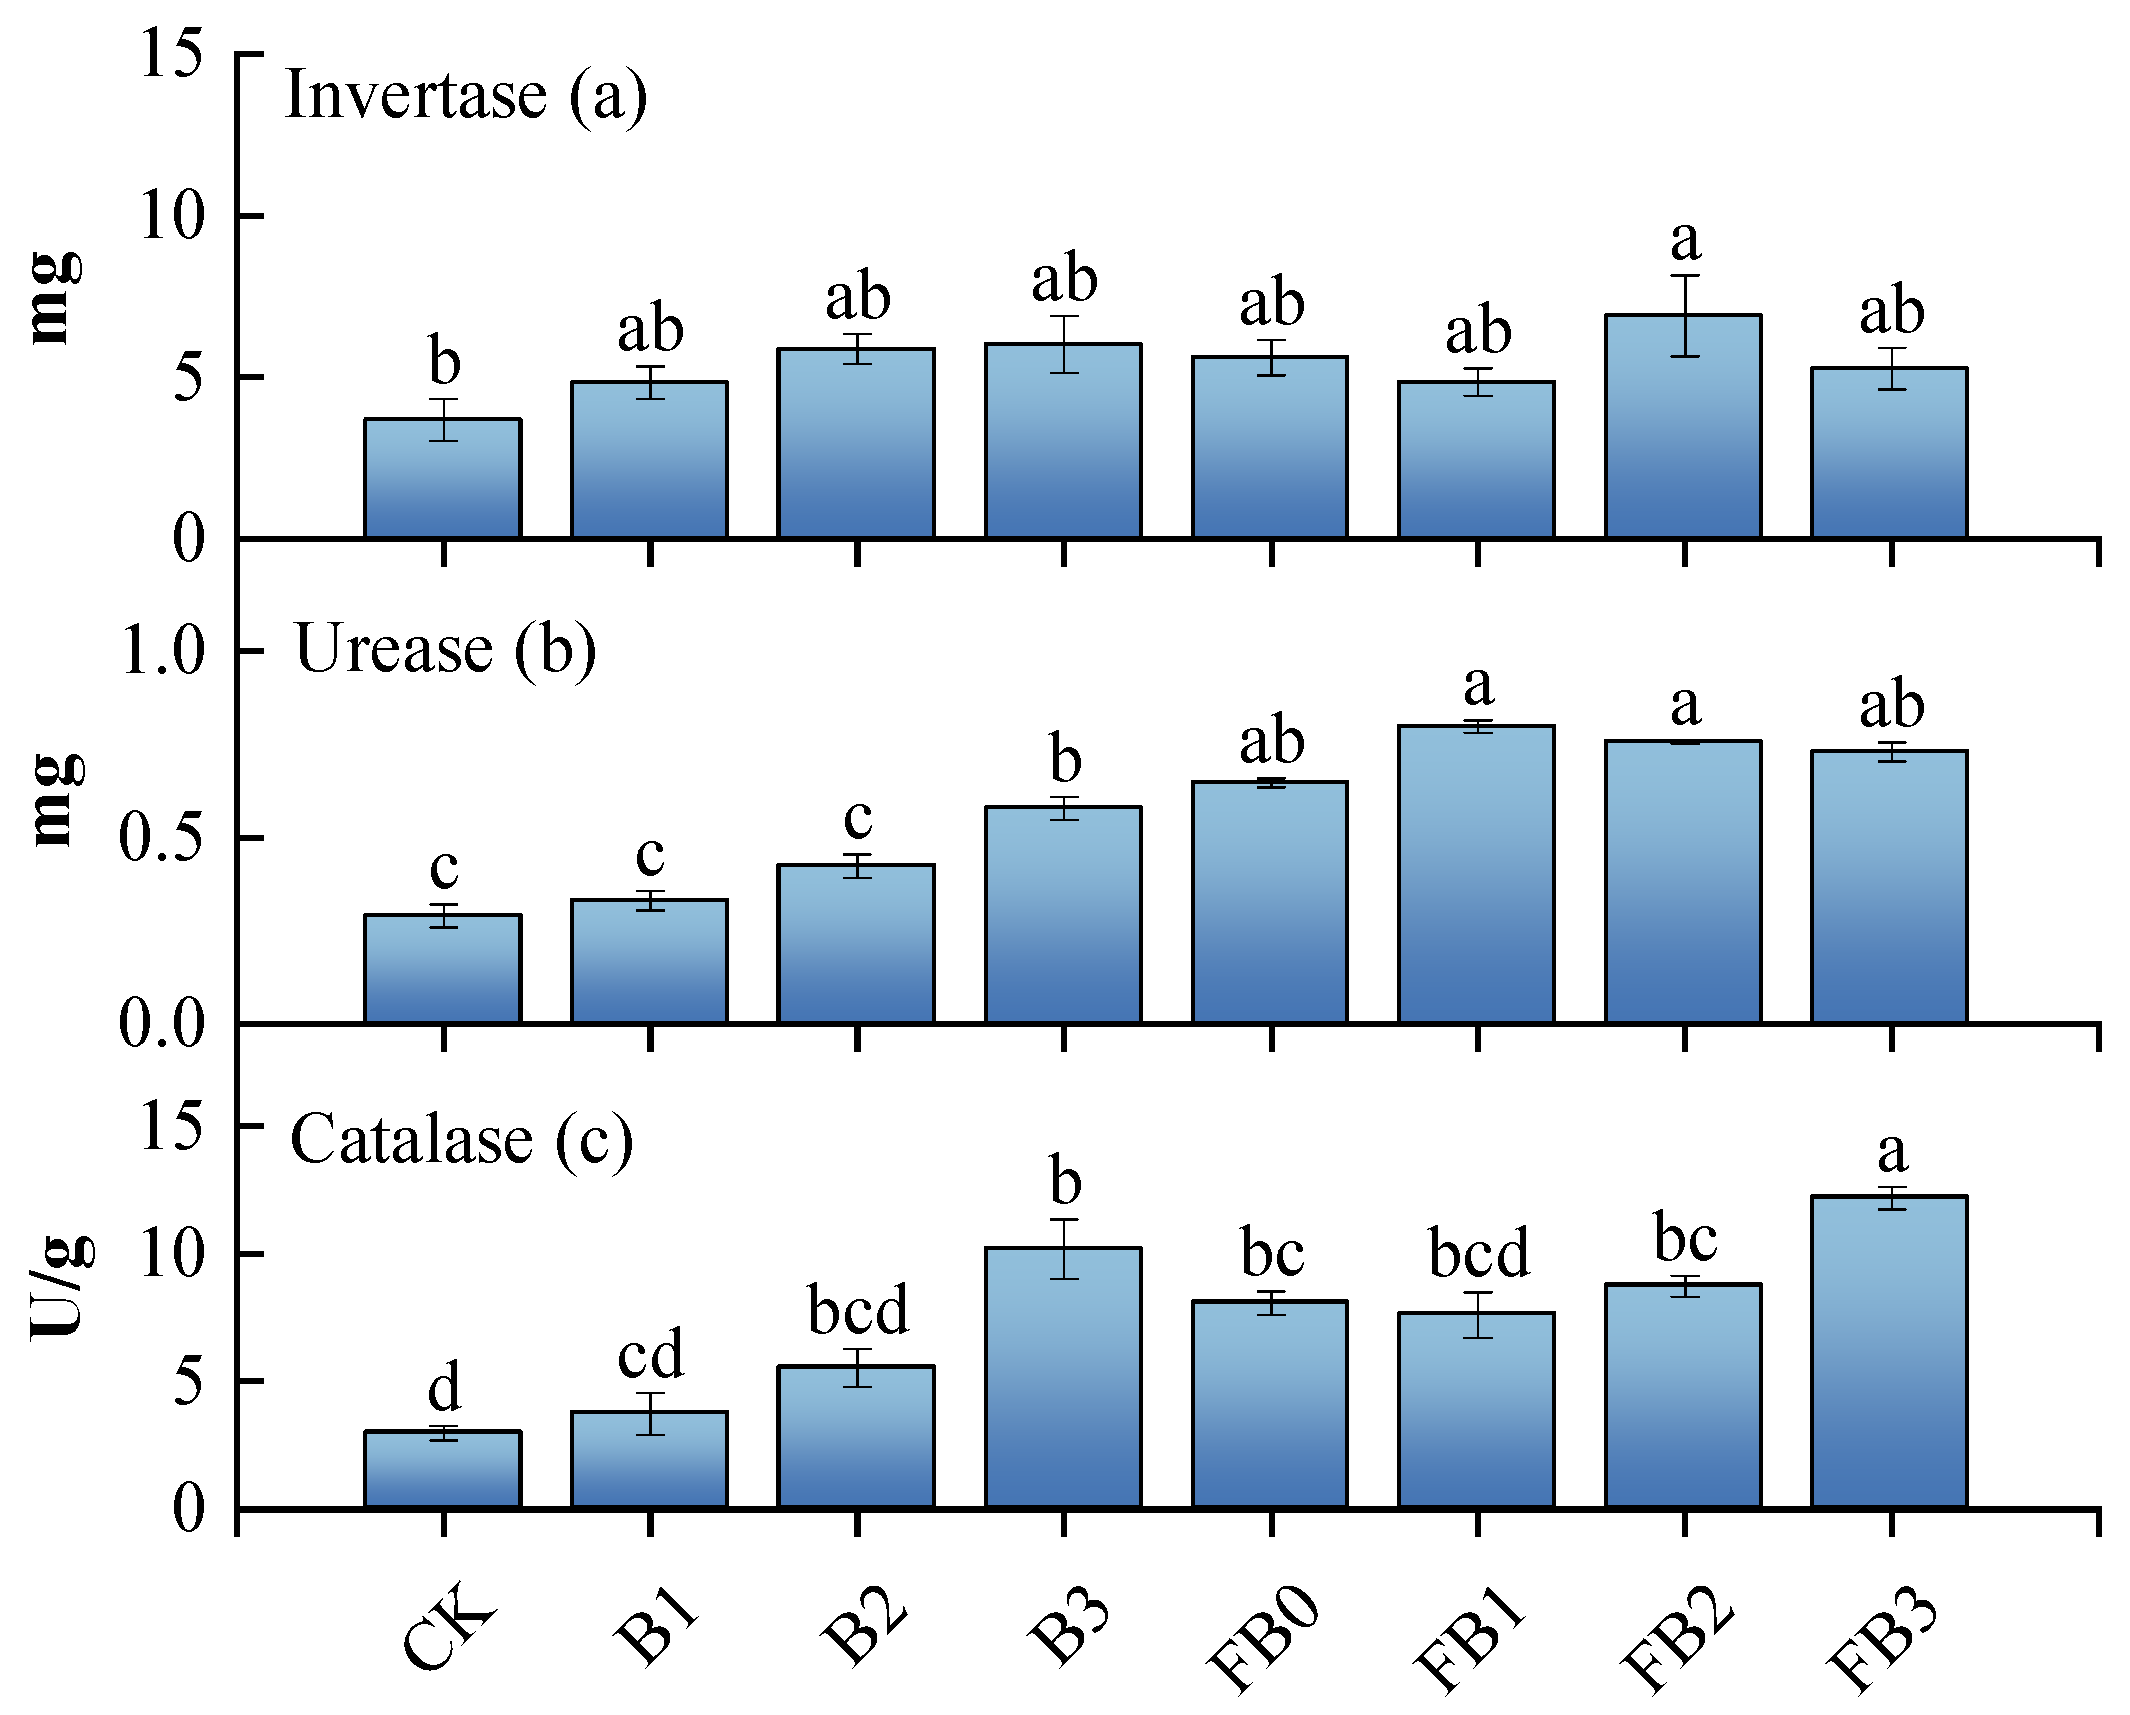
3.3. Soil Microorganism Diversity and Enzyme Activity
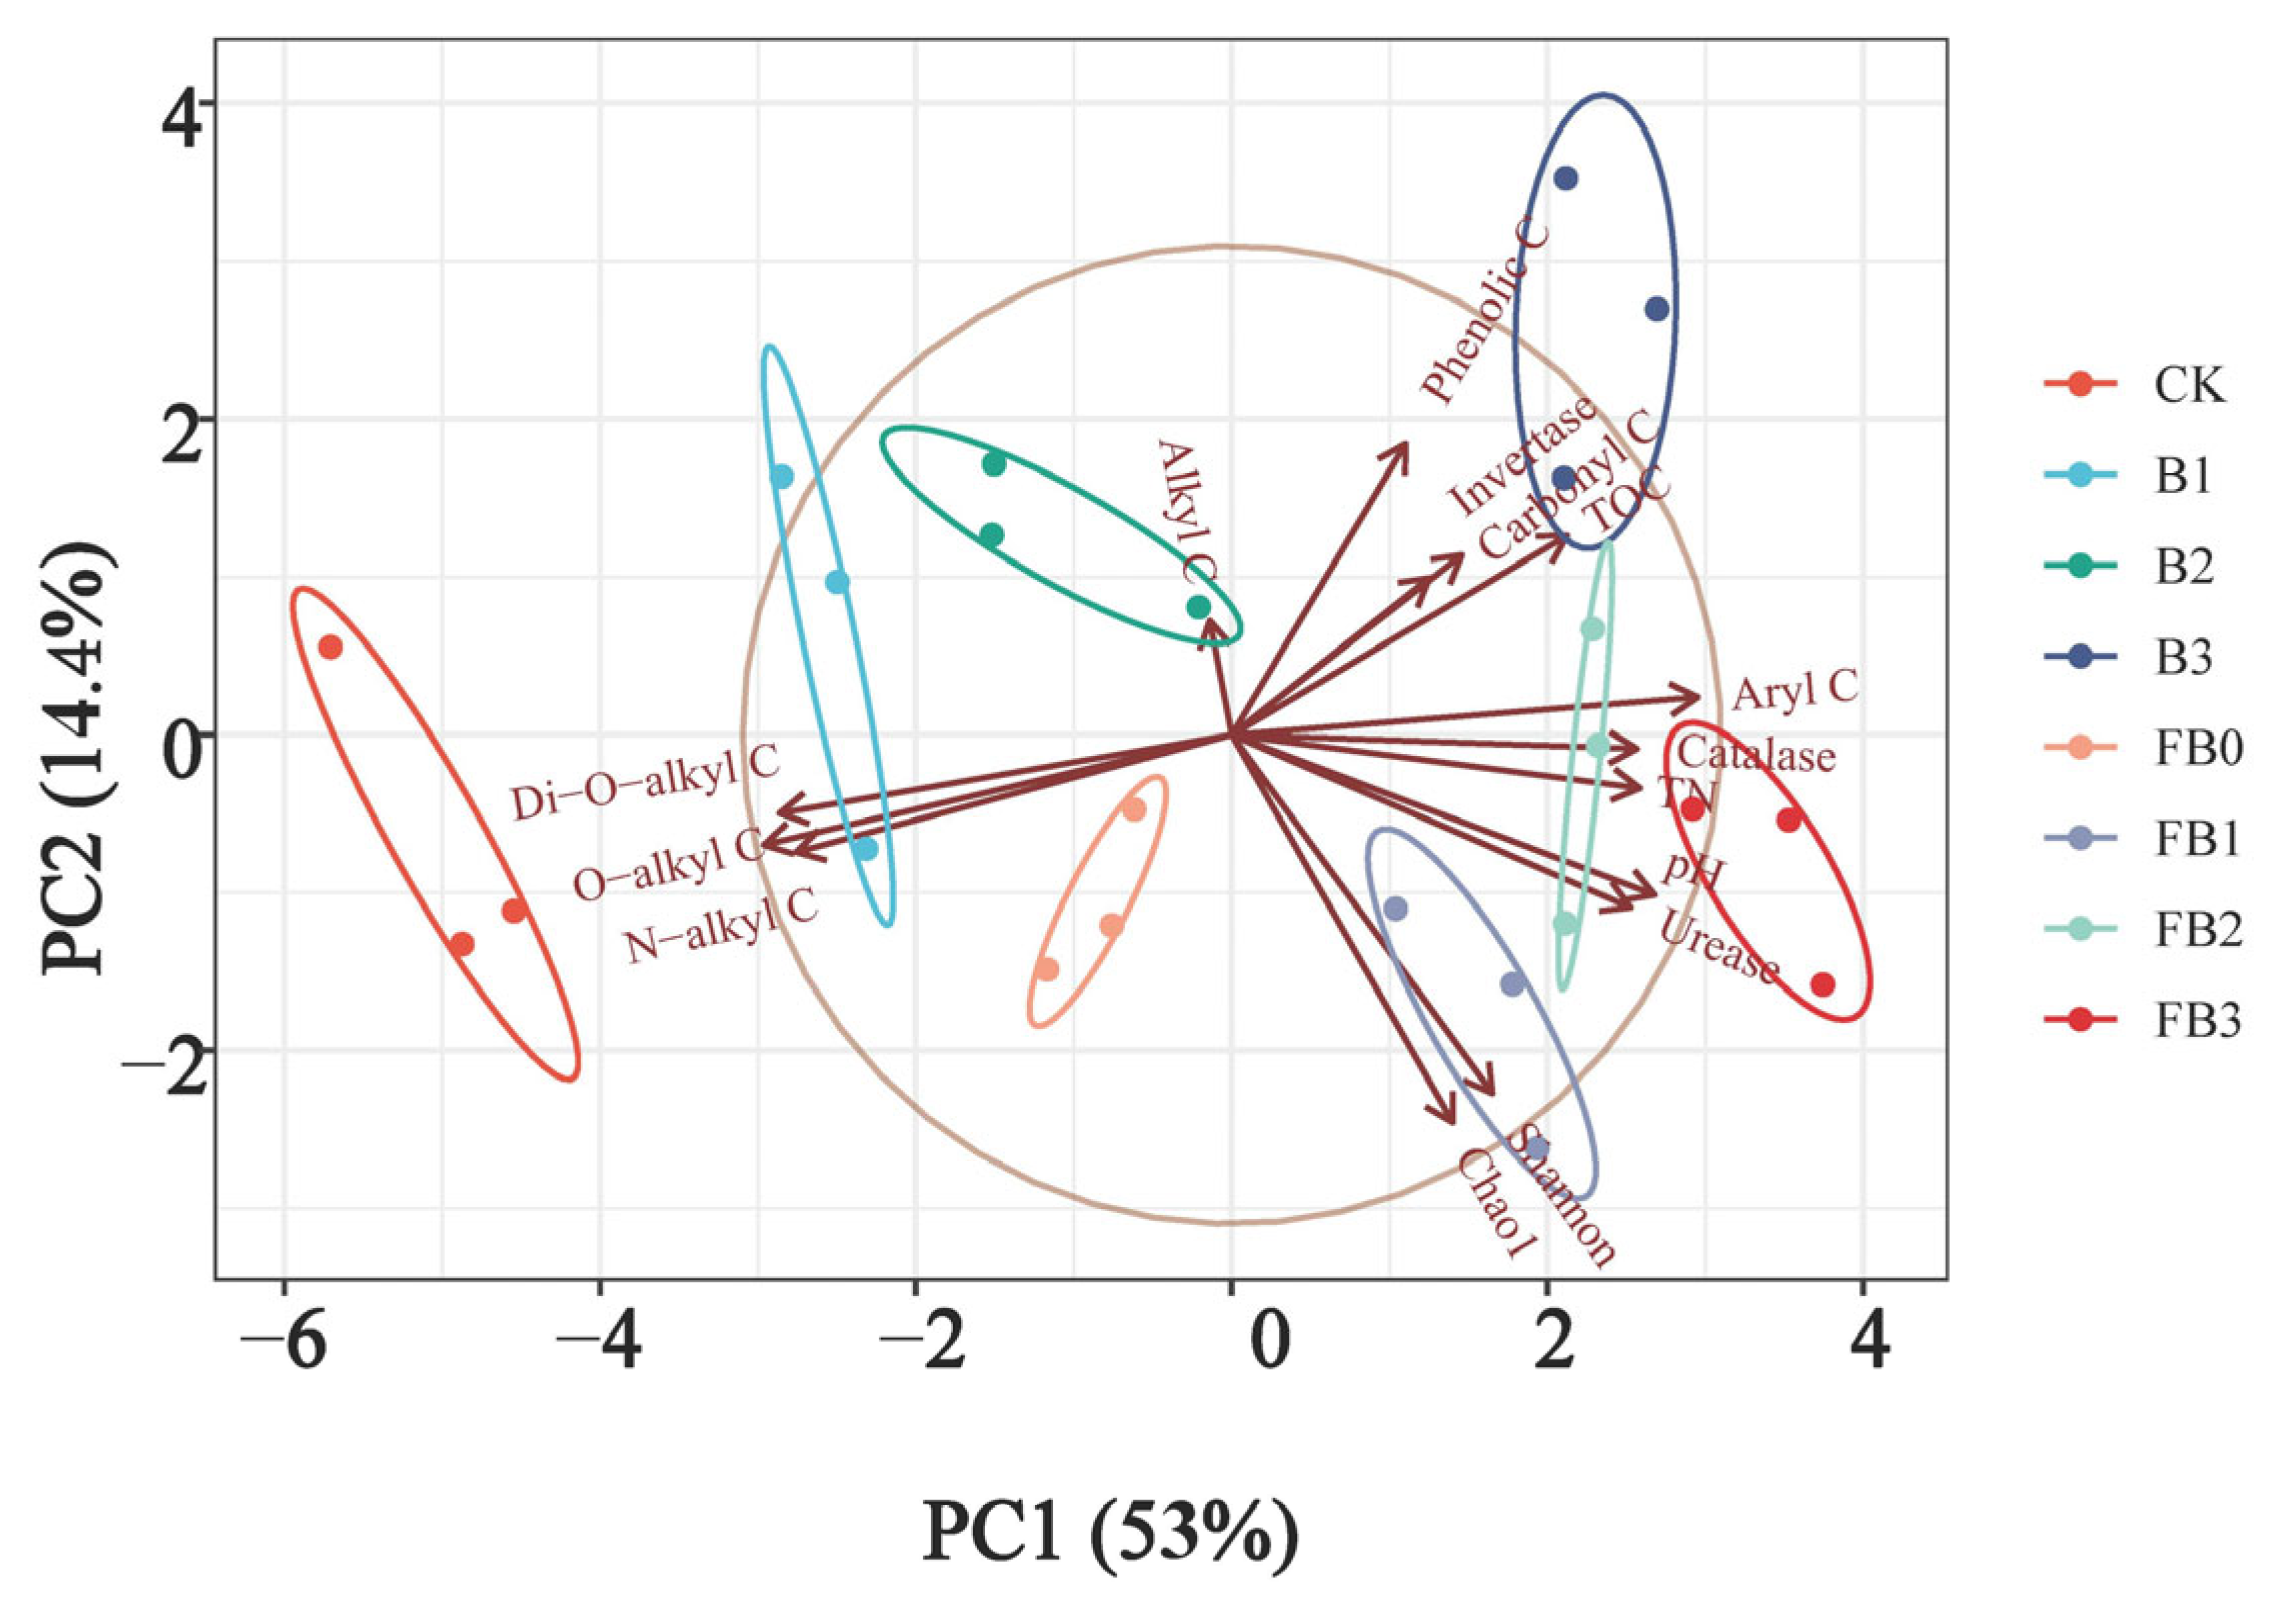
The application of biochar and manure significantly increased bacterial abundance (Chao 1) and diversity (Shannon) (Table 2), and the increasing trend showed gradual significance with the increase in the biochar application amount. The coverage rate of soil samples in each treatment was more than 99%. Compared to the CK treatment, Chao 1 and Shannon increased by 11.06% and 0.13% under the biochar treatment (B3); by 24.60% and 8.35% in response to the manure treatment (FB0); and by 32.96% and 13.22% in response to the coupling application (FB3). Compared to the application of biochar or manure alone, the coupling of biochar and manure improved the evenness of microbial community distribution (Pielou_e) by an average of 10.97% and 5.22%. Biochar combined with manure enhanced the positive effects of manure on the structure of the soil microbial community.
Further analysis of the microbial community composition revealed that the top four dominant phyla ranked by total abundance were Proteobacteria, Actinobacteriota, Acidobacteriota, and Gemmatimonadota (Figure 4a), collectively accounting for 71.86% to 78.21% of all sequences. The biochar and manure altered the abundance of dominant microbes, significantly increasing the abundance of Proteobacteria and Chloroflexi and significantly decreasing the abundance of Acidobacteriota. Compared to the CK, the abundance of Proteobacteria increased by 15.46% in the biochar treatment (B3), by 30.34% in the manure treatment (FB0), and by 40.64% in the coupling application (FB3). In contrast, compared to the CK, the Acidobacteria decreased by 41.64% in the B3 treatment; by 35.82% in the FB0 treatment; and by 62.02% in the FB3 treatment. Compared to the application of biochar alone, the manure had a more significant effect on the dominant bacterial communities.
Network analyses were performed at the OTU level to illustrate the complexity of bacterial community relationships. The results showed that, compared to the sole application of biochar, the coupling of biochar and manure resulted in a higher number of edges, average degree, and average clustering coefficient in the network (Figure 4b). The interaction complexity in the bacterial co-occurrence network suggests that adding biochar to soil enhances the restoration of its biological function.
A functional prediction of bacterial communities based on Tax4Fun analysis is presented in Figure 4c. The functional profiles of the albic layer soil bacterial communities encompassed metabolism, genetic information processing, environmental information processing, cellular processes, unclassified functions, human diseases, and organismal systems. In the initial soil (CK), metabolic and genetic information processing functions predominated. With the addition of biochar and manure, the relative abundances of environmental information processing, cellular processes, and organismal systems were elevated. Notably, organismal systems became the dominant functional category in the B2 and B3 treatments (biochar alone), whereas cellular processes and environmental information processing predominated in the FB0, FB1, and FB2 treatments (biochar combined with manure). These results indicate that biochar and manure amendments significantly altered the functional gene composition of soil bacterial communities.
T-test analysis of intergroup functional differences (Figure 4d) revealed that compared to the control (CK), the biochar-alone treatment (B3) significantly enhanced gene replication/repair and sorting/degradation functions (p < 0.05). In contrast, the combined biochar–manure treatment (FB3) exhibited marked increases in amino acid metabolism, energy metabolism, prokaryotic cell community functions, and cellular metabolism relative to the biochar-alone treatment (B3). These findings demonstrate that coupling biochar with manure amplifies microbial functional shifts toward nutrient cycling and metabolic regulation, reflecting adaptive responses to amended soil conditions.
Compared to the CK, the biochar treatment (B1–B3) increased the average activities of soil catalase, invertase, and urease by 117.59%, 51.26%, and 87.74%, respectively (Figure 5). The manure treatment (FB0) resulted in increases of 171.01%, 52.22%, and 123.21% for catalase, invertase, and urease activities, respectively. The coupling application (FB1–FB3) showed average increases of 241.55%, 53.89%, and 159.71% for catalase, invertase, and urease activities, respectively. Overall, the coupling application was more effective in enhancing soil enzyme activities than the single applications.

3.4. PCA

The Principal Coordinate Analysis (PCA) approach was utilized to investigate the influence of diverse treatments on soil factors (Figure 6). The first two principal components (PC1 and PC2) accounted for 53.0% and 14.4% of the variance, respectively. The confidence ellipses for the CK, biochar, and manure groups were spaced more widely, suggesting that biochar and manure significantly modified the bacterial community. Moreover, variations were noticed in the bacterial community among single biochar applications (B1–B3), manure (FB0), and combined applications (FB1–FB3). The aryl C fractions and total organic carbon (TOC) content exhibited significant positive correlations with the abundance of large soil pores (>100 μm) and microbial community richness (Chao1) (p < 0.05), emphasizing the synergistic effects of biochar and manure.
To further analyze the ameliorative effects of biochar and organic fertilizer on soil, path analysis was conducted to evaluate the relationships between soil physicochemical–biological properties and plant/root ecological indicators (Figure S2, Table S1), followed by the construction of a structural equation model (SEM; Figure 7). In the path analysis, the structural model describing interactions between soil environmental factors and plant ecological indicators exhibited low complexity and high goodness-of-fit (Table 3). According to the principles of SEM path coefficient analysis, under the premise of significant relationships, a larger absolute path coefficient value indicates a stronger influence of the exogenous variable on the endogenous variable, and vice versa. The model revealed that biochar and organic fertilizer indirectly enhanced plant biomass and root elongation by improving carbon–nitrogen components and microbial community abundance. Organic fertilizer exerted the greatest direct effect on microbial community abundance, with a path coefficient of 0.90. Biochar indirectly influenced aggregate water stability (Figures S3 and S4) and enzyme activity by modulating the C/N ratio. Enzyme activity and microbial community abundance directly affected aboveground plant physiological indicators, with path coefficients of 0.43 and 0.25, respectively. Enzyme activity had the strongest direct effect on plants: a 1-unit increase in enzyme activity corresponded to a 0.43-unit rise in fresh plant weight, indicating that microbial activity was the primary driver of plant growth in soil. Organic fertilizer, aggregate water stability, C/N ratio, and microbial community abundance directly influenced root morphological characteristics, with path coefficients of 0.21, 0.38, 0.14, and 0.45, respectively. Aggregate water stability significantly affected root length and total root surface area. Microbial community abundance exhibited the strongest direct effect on roots: a 1-unit increase in microbial abundance resulted in a 0.45-unit improvement in root trait indices.

4. Discussion

4.1. Coupling Application Increases Soil Carbon Accumulation and Stability

Soil carbon content serves as an indicator of nutrient supply intensity. The results indicate that biochar and manure significantly enhance soil carbon pool storage and carbon sequestration efficiency. At a biochar application rate of 2%, the TOC in soil increased by 121.54%. This is consistent with the trend found in a study by Hua et al. [21], which reported that when the biochar content was 8%, the amount of carbon dioxide released from the soil decreased by 29% to 39% compared to the control, while the amount of organic matter increased by 41% to 75%. The significant increase in TOC levels in the soil indicated that soil TOC accumulation at this time was much greater than the mineralization rate. In comparison to the application of biochar alone (B1), using an equivalent amount of manure (FB0) was more effective for improving soil carbon stability. The combination of biochar and manure creates a synergistic effect that boosts carbon pool content. This occurs through two mechanisms: first, the positive response of soil microorganisms to the organic matter in both biochar and manure may accelerate the decomposition and transformation of humus, leading to increased soil C content [14]. Second, the addition of exogenous organic matter can enhance the formation of soil aggregates, which improves carbon stability [22]. The coupling treatment (FB1–FB3) significantly increased the total nitrogen (TN) content by 52.34%, which could be attributed to the mineralization of manure-derived organic nitrogen and the adsorption/immobilization of NH4+ by biochar. The elevated C/N ratio (peaking in B3/FB3) may enhance microbial nitrogen immobilization, thereby reducing the net release of NH4+. Concurrently, the labile carbon in manure may stimulate heterotrophic nitrification, temporarily elevating NH4+ concentrations. However, biochar’s adsorption capacity delays NH4+ oxidation, reducing substrate availability for nitrification and consequently suppressing subsequent N2O emissions [23].
NMR analysis showed that compared with biochar application alone, the combination of biochar and organic fertilizer increased the proportion of aryl C in soil and enhanced the stability of the soil organic carbon pool. This effect is due to the strong chemical stability of aromatic ring structure in aryl C, resistance to microbial and enzymatic decomposition, and prolonged retention time of organic carbon in soil [24]. In addition, the hydrophobicity and surface activity of aryl carbon could enhance the adhesion between soil particles and promote the formation of large aggregates (>250 μm), thereby improving soil pore structure, air permeability, and water-holding capacity. This NMR–hydrophobicity linkage corroborates that biochar promotes carbon sequestration via hydrophobic protection [25,26]. The accumulation of soil carbon pools is primarily driven by recalcitrant organic carbon components [10]. Additionally, organic fertilizers effectively increased microbial biomass carbon, promoting the humification of organic matter residues [27]. Organic fertilizers supply essential carbon sources for microbial growth, enhancing their habitat and accelerating metabolic processes. This leads to an increased respiration rate in humus and promotes carbon accumulation [28]. When examining the proportion of unstable carbon (O-alkyl C, N-aryl C, carbonyl C) in soil, the combined application of biochar and organic fertilizers significantly intensified the declining trend compared to using biochar alone. The increased recalcitrant organic carbon (ROC) and alkyl-C–O-alkyl-C ratio under biochar–manure coupling treatments suggest a potential negative priming effect. Biochar likely stabilized native soil organic matter via physical protection (e.g., pore occlusion) and biochemical inhibition (e.g., phenolic compounds), counteracting the transient positive priming induced by labile manure-derived carbon. This aligns with observed reductions in N2O emissions, as suppressed native C decomposition would limit substrate supply for nitrification/denitrification [23]. The metabolic activity of carbon in the soil is heightened in response to the combined application, further facilitating the microbial breakdown of unstable carbon [29]. Additionally, this underscores why the inclusion of organic fertilizers markedly boosts soil microbial activity [30]. It is crucial to recognize that variations in carbon mass significantly influence the activities of microorganisms and enzymes involved in carbon and nitrogen cycling in soil [31].

4.2. Coupling Application Improves Soil Porosity

The X-ray computed tomography analysis indicated that, compared to the application of biochar or organic fertilizers alone, the combined application significantly improved soil aeration (>100 µm) and capillary porosity (<30 µm), improved soil connectivity, and reduced soil compaction. The variation in the number of soil pores is negatively correlated with overall porosity (Table 1). This could be attributed to the porous structure of biochar, which enhances the average pore size, along with the organic matter in manure that microorganisms can utilize to create aggregate structures [32]. Fan et al. [33] proposed that soil pores with a diameter of 0.5–50 μm are effective water storage pores, and the most abundant pore diameter in biochar is 5–20 μm, which is most suitable for microbial survival and metabolism and plant water conservation. Due to the enhanced water-holding capacity of the soil and the nitrogen input from manure, microbial activity significantly increases, allowing water in small pores (capillary pores) to be more effectively utilized by plant roots, whose growth and decay will further generate more soil pores [34].
From the perspective of soil pore morphological parameters, biochar significantly increased the proportion of large pores in the soil, with the proportion of elongated pores rising from 14.53% to 23.50%. Soil pore morphology is closely related to soil hydraulic properties. Elongated pores, due to their larger specific surface area, are more conducive to the storage of water and air. When biochar is applied in conjunction with manure, the proportion of elongated pores continues to show an upward trend, leading to the formation of more irregular pores. The increase in the number of irregular soil pores makes the pore structure more complex. A complex pore structure can enhance the stability and erosion resistance of the soil [19]. This may be due to the impact of organic fertilizers on microbial metabolic activity, which promotes the growth and expansion of wheat plant roots, thereby forming irregular air pores [35]. Organic fertilizers primarily influence pore structure by increasing soil organic matter and microbial activity, while biochar enhances soil aeration and porosity directly through its inherent pore structure and characteristics. Compared to the application of biochar or manure alone, the synergistic effect of the two is more significant in improving soil pore structure [32].

4.3. Coupling Application Benefits Soil Functional Microorganisms and Enhances Its Diversity

Application of biochar and organic fertilizer increased soil microbial diversity and improved soil microbial community structure (Table 2). The diversity was positively correlated with total nitrogen (TN) and total organic carbon (TOC) content. Biochar pyrolyzed at 400–500 °C was found to predominantly contain short-chain fatty acids along with nitrogen- and oxygen-bearing aromatic compounds in its volatile components. These volatile organic compounds (VOCs) enhance soil enzyme activity through carbon substrate provision, while concomitantly fulfilling microbial nitrogen demands via nitrogen mineralization pathways [36]. The application of biochar resulted in an upward trend in diversity indices, although statistical significance was not attained. Previous studies found that similar biochar application significantly reduced the Shannon diversity of bacteria, which may be because biochar stimulates the growth of soil bacteria involved in nutrient turnover, promoting interspecies competition and leading to changes in bacterial community structure [23,37]. Compared to the application of biochar alone, coupling application enhances the abundance and diversity index of soil microbial communities. The observed phenomenon may be attributed to the positive feedback of microbial community abundance in response to the soil structure changes induced by biochar application [38]. Additionally, alterations in community structure may rely more on the supply of organic matter, such as nitrogen, from manure [39].
In this study, soil bacterial communities exhibited notable changes. The phyla Proteobacteria, Bacteroidota, and Chloroflexi exhibited a significant increasing trend after the coupled application (FB3) and showed a significant positive correlation with carbon content. Proteobacteria is the largest bacterial phylum, containing a variety of metabolic species that can provide nitrogen for soil, maintain soil ecological stability, and enhance soil nitrogen fixation capacity [23]. Bacteroidota plays a leading role in organic carbon mineralization, which provides energy for microbial growth and soil enzyme activity. Chloroflexi as oligotrophic bacteria has a low C mineralization rate and high C use efficiency [10]. The increasing abundance of these phyla had potential ecological implications for soil carbon sequestration [40,41]. The abundance of Acidobacteria, as a dominant microbial group in the soil, shows a negative correlation with soil pH, which is consistent with the findings of Wan et al. [42]. Compared to the application of biochar alone, the trend of reduced proportions of Acidobacteriota bacteria in coupled applications is more pronounced. This phenomenon may be due to the abundant functional groups and carbonates on the surface of biochar effectively neutralizing soil acidity [43]. Additionally, the synergistic effect of manure plays a role, as they can buffer soil pH, with functional groups enhancing the adsorption of H+ and Al3+, further increasing pH (Figure 3a) and inhibiting soil acidification [44]. Acidophilic bacteria primarily participate in the degradation of plant residues and adapt to acidic and low-nutrient environments, being dominant phyla in soils. Their significant reduction indicates that the low-nutrient environment of the soil is gradually improving [45]. This implies that applying biochar is an effective measure for regulating the acidity and alkalinity of disturbed soils. Compared to application of biochar, the microbial bacterial ecological network tends to gradually increase in complexity after coupling application. This finding aligns with the findings of Hu et al. [46], who observed that the input of biochar and organic fertilizer significantly enhanced most of the single functions of the ecosystem, and the ecosystem multifunctionality was significantly increased by 18.7–30.1%. Research indicates that biochar alone does not alter the microbial community structure in soil; however, its combination with fertilizer does lead to changes [47]. This effect may stem from organic fertilizer being a vital nutrient source for plants, containing significant amounts of unstable organic compounds that stimulate various enzyme-mediated microbial processes [48].
This study found that the treatment of biochar combined with manure did not exhibit a synergistic effect on the increase in invertase enzyme activity in the soil. This may be due to phenolic compounds inhibiting the activity of hydrolases by binding to proteins and polysaccharides [49]. The improved phenolic carbon in the NMR analysis of the present study also further explains the changes in sucrase activity. The relatively low hydrolase activity leads to a decrease in soil respiration rate, thereby facilitating the accumulation of organic carbon [50]. Coupling amendment of biochar and manure had a significant synergistic effect on the increase in urease and catalase activity in the soil. Notably, biochar–manure co-application elevated soil pH from 4.4 to 6.0 (±0.2), creating a balanced milieu that favored both urease and catalase functionality while mitigating phenolic toxicity. Urease activity peaked around pH 6.0, which could reflect the utilization of soluble N substrate in soil. The alkaline characteristics of biochar (pH 9.16) might optimize the microenvironment for urease expression, and improving urease activity would facilitate the conversion of organic N to available N [51]. Catalase activity is closely related to the transformation rate of carbon. The activity of this enzyme reflects the intensity of soil oxidation [52]. Principal component analysis showed that the factors affecting enzyme activity included soil macroporosity, organic carbon and nitrogen utilization, etc. (Figure 6). Soil macroporosity primarily influences enzyme activity by improving the physical soil environment. It serves as a critical conduit for transporting water, oxygen, and dissolved substrates (such as organic carbon and nitrogen compounds). This ensures that microbial activity zones receive sufficient oxygen and moisture, facilitates the effective diffusion and contact of substrates with microorganisms and enzymes, provides habitats and migration pathways for microorganisms, increases microbial biomass and their secreted extracellular enzyme pool, and reduces the enzyme activity suppression caused by poor aeration [53,54]. Meanwhile, organic carbon and nitrogen utilization regulates enzyme activity at the core level of microbial metabolism and energy nutrient supply: Readily decomposable organic carbon provides energy for microorganisms, driving their synthesis of enzyme proteins; the mineralization of organic nitrogen supplies the nitrogen required for enzyme synthesis [55]. The activity of soil enzymes plays a crucial role in the soil carbon pool. Enzymes influence soil respiration and the formation of soil aggregates by promoting the decomposition of organic matter and the release of nutrients. This directly impacts the storage and mineralization processes of soil carbon [56].

5. Conclusions

Analysis of soil organic carbon, soil structure, and microbial communities revealed that biochar and organic fertilizer significantly increased soil carbon and nitrogen stocks while reducing soil acidity. Synergistically, they increased recalcitrant organic carbon fractions (aryl and phenolic C), improved soil porosity and connectivity, and shifted the microbial community towards Proteobacteria and Chloroflexi, both of which are conducive to carbon sequestration in soils. This suggests a mechanism where biochar and manure application regulates soil attributes, fostering functional microbiomes that enhance soil carbon storage and stability. Therefore, to maintain comprehensive soil fertility indicators, this study recommends that the optimal practical strategy is the combined application of biochar at a 2% rate with organic manure. However, this study has limitations: short application periods of organic amendments and slow biochar decomposition rates. Future studies should prioritize extended field experiments to assess their long-term efficacy and interannual variability.

Supplementary Materials

The following supporting information can be downloaded at https://www.mdpi.com/article/10.3390/agronomy15061384/s1, Figure S1: Changes in hydrophobicity index, Figure S2: Changes of dry/fresh weight of aboveground parts of wheat plants, Figure S3: The size distribution of soil aggregates under different treatments, Figure S4: Changes of soil aggregate stability index under different treatments; Table S1: Root distribution characteristics of wheat plants under different treatments; Text S1. Root system scanning, Text S2. Methods for the determination of soil aggregates, Text S3: Data processing and analysis.

Author Contributions

All authors contributed to the conception and design of the study. Material preparation, data collection, and analysis were performed by J.S. The first draft of the manuscript was written by J.S. and all authors critically revised and commented on subsequent versions of the manuscript. All authors have read and agreed to the published version of the manuscript.

Funding

The authors gratefully acknowledge the National Key Research and Development Program of China (No. 2023YFD1500703), the Strategic Priority Research Program of the Chinese Academy of Sciences (No. XDA28020401).

Data Availability Statement

The raw data supporting the conclusions of this article will be made available by the authors on request.

Conflicts of Interest

The authors declare no conflicts of interest.

References

  1. Zhang, X. Effects of Biochar Soil Amendments on Physical and Chemical Properties and Microstructure of Albic Soils. Master’s Thesis, Northeast Agricultural University, Harbin, China, 2021. [Google Scholar]
  2. Ma, X.; Zhao, Y.; Zheng, Y.; Wang, L.; Zhang, Y.; Sun, Y.; Ji, J.; Hao, X.; Liu, S.; Sun, N. Effect of Different Fertilization on Soil Fertility, Biological Activity, and Maize Yield in the Albic Soil Area of China. Plants 2025, 14, 810. [Google Scholar] [CrossRef] [PubMed]
  3. Raza, S.; Pandey, B.K.; Hawkesford, M.J.; Griffiths, S.; Bennett, M.J.; Mooney, S.J. Future crop breeding needs to consider future soils. Nat. Plants 2025, 29, 569. [Google Scholar] [CrossRef] [PubMed]
  4. Zhao, C.; Xu, Q.; Chen, L.; Li, X.; Meng, Y.; Ma, X.; Zhang, Y.; Liu, X.; Wang, H. The impacts of a biochar application on selected soil properties and bacterial communities in an Albic Clayic Luvisol. Soil Water Res. 2020, 15, 85–92. [Google Scholar] [CrossRef]
  5. Mandal, S.; Shengyan, P.; Sangeeta, A.; Hui, M.; Do-Heyoung, K.; Yingchen, B.; Hou, D. Progress and future prospects in biochar composites: Application and reflection in the soil environment. Crit. Rev. Environ. Sci. Technol. 2021, 51, 219–271. [Google Scholar] [CrossRef]
  6. Khan, N.; Chowdhary, P.; Gnansounou, E.; Chaturvedi, P. Biochar and environmental sustainability: Emerging trends and techno-economic perspectives. Bioresour. Technol. 2021, 332, 125102. [Google Scholar] [CrossRef]
  7. Amoakwah, E.; Arthur, E.; Frimpong, K.A.; Lorenz, N.; Rahman, M.A.; Nziguheba, G.; Islam, K.R. Biochar amendment impacts on microbial community structures and biological and enzyme activities in a weathered tropical sandy loam. Appl. Soil Ecol. 2022, 172, 104364. [Google Scholar] [CrossRef]
  8. Demisie, W.; Liu, Z.; Zhang, M. Effect of biochar on carbon fractions and enzyme activity of red soil. Catena 2014, 121, 214–221. [Google Scholar] [CrossRef]
  9. Bi, Q.-F.; Li, K.-J.; Zheng, B.-X.; Liu, X.-P.; Li, H.-Z.; Jin, B.-J.; Ding, K.; Yang, X.-R.; Lin, X.-Y.; Zhu, Y.-G. Partial replacement of inorganic phosphorus (P) by organic manure reshapes phosphate mobilizing bacterial community and promotes P bioavailability in a paddy soil. Sci. Total Environ. 2020, 703, 134977. [Google Scholar] [CrossRef]
  10. Zheng, H.; Liu, D.; Liao, X.; Miao, Y.; Li, Y.; Li, J.; Yuan, J.; Chen, Z.; Ding, W. Field-aged biochar enhances soil organic carbon by increasing recalcitrant organic carbon fractions and making microbial communities more conducive to carbon sequestration. Agric. Ecosyst. Environ. 2022, 340, 108177. [Google Scholar] [CrossRef]
  11. Mathers, N.J.; Xu, Z.; Blumfield, T.J.; Berners-Price, S.J.; Saffigna, P.G. Composition and quality of harvest residues and soil organic matter under windrow residue management in young hoop pine plantations as revealed by solid-state 13C NMR spectroscopy. For. Ecol. Manag. 2003, 175, 467–488. [Google Scholar] [CrossRef]
  12. Chen, L.; Li, X.; Peng, Y.; Xiang, P.; Zhou, Y.; Yao, B.; Zhou, Y.; Sun, C. Co-application of biochar and organic fertilizer promotes the yield and quality of red pitaya (Hylocereus polyrhizus) by improving soil properties. Chemosphere 2022, 294, 133619. [Google Scholar] [CrossRef] [PubMed]
  13. Cao, D.; Lan, Y.; Chen, W.; Yang, X.; Wang, D.; Ge, S.; Yang, J.; Wang, Q. Successive applications of fertilizers blended with biochar in the soil improve the availability of phosphorus and productivity of maize (Zea mays L.). Eur. J. Agron. 2021, 130, 126344. [Google Scholar] [CrossRef]
  14. Hu, W.; Zhang, Y.; Xiangmin, R.; Fei, J.; Peng, J.; Luo, G. Coupling amendment of biochar and organic fertilizers increases maize yield and phosphorus uptake by regulating soil phosphatase activity and phosphorus-acquiring microbiota. Agric. Ecosyst. Environ. 2023, 355, 108582. [Google Scholar] [CrossRef]
  15. Das, S.K.; Choudhury, B.U.; Hazarika, S.; Mishra, V.K.; Laha, R. Long-term effect of organic fertilizer and biochar on soil carbon fractions and sequestration in maize-black gram system. Biomass Convers. Biorefinery 2024, 14, 23425–23438. [Google Scholar] [CrossRef]
  16. Ren, C.; Zhao, F.; Kang, D.; Yang, G.; Han, X.; Tong, X.; Feng, Y.; Ren, G. Linkages of C:N:P stoichiometry and bacterial community in soil following afforestation of former farmland. For. Ecol. Manag. 2016, 376, 59–66. [Google Scholar] [CrossRef]
  17. Zhao, F.Z.; Ren, C.J.; Zhang, L.; Han, X.H.; Yang, G.H.; Wang, J. Changes in soil microbial community are linked to soil carbon fractions after afforestation. Eur. J. Soil Sci. 2018, 69, 370–379. [Google Scholar] [CrossRef]
  18. Li, J.T.; Zhong, X.L.; Wang, F.; Zhao, Q.G. Effect of poultry litter and livestock manure on soil physical and biological indicators in a rice-wheat rotation system. Plant Soil Environ. 2011, 57, 351–356. [Google Scholar] [CrossRef]
  19. Yu, H.; Yang, P.; Lin, H.; Ren, S.; He, X. Effects of Sodic Soil Reclamation using Flue Gas Desulphurization Gypsum on Soil Pore Characteristics, Bulk Density, and Saturated Hydraulic Conductivity. Soil Sci. Soc. Am. J. 2014, 78, 1201–1213. [Google Scholar] [CrossRef]
  20. Pagliai, M.; Vignozzi, N.; Pellegrini, S. Soil structure and the effect of management practices. Soil Tillage Res. 2004, 79, 131–143. [Google Scholar] [CrossRef]
  21. Hua, L.; Lu, Z.; Ma, H.; Jin, S. Effect of biochar on carbon dioxide release, organic carbon accumulation, and aggregation of soil. Environ. Prog. Sustain. Energy 2014, 33, 941–946. [Google Scholar] [CrossRef]
  22. Zhang, H.; Wang, S.; Zhang, J.; Tian, C.; Luo, S. Biochar application enhances microbial interactions in mega-aggregates of farmland black soil. Soil Tillage Res. 2021, 213, 105145. [Google Scholar] [CrossRef]
  23. Shin, J.; Lee, D.; Shim, C.; Nam, J.; Park, S.; Hong, S.; Song, J.-S.; Jeong, C. Nutrient release pattern and mitigation of N2O emissions under the application of activated poultry manure compost biochar with organic resources. Environ. Pollut. 2024, 356, 124250. [Google Scholar] [CrossRef]
  24. Dou, S.; Zhang, J.J.; Li, K. Effect of organic matter applications on 13C-NMR spectra of humic acids of soil. Eur. J. Soil Sci. 2008, 59, 532–539. [Google Scholar] [CrossRef]
  25. Yuan, J.; Wang, Y.; Zhao, X.; Chen, H.; Chen, G.; Wang, S. Seven years of biochar amendment has a negligible effect on soil available P and a progressive effect on organic C in paddy soils. Biochar 2022, 4, 1. [Google Scholar] [CrossRef]
  26. Wang, Y.; Gao, S.; Li, C.; Zhang, J.; Wang, L. Effects of temperature on soil organic carbon fractions contents, aggregate stability and structural characteristics of humic substances in a Mollisol. J. Soils Sediments 2016, 16, 1849–1857. [Google Scholar] [CrossRef]
  27. Ji, L.; Li, L.; Wang, R.; Xu, X.; Zhang, F.; Mao, G.; Wang, T. Effects of organic fertilizers on organic carbon accumulation in alkalized saline soil and silage maize yield. Int. J. Agric. Biol. Eng. 2024, 17, 159–168. [Google Scholar]
  28. Li, J.; Zhang, Q.; Li, Y.; Liu, Y.; Xu, J.; Di, H. Effects of long-term mowing on the fractions and chemical composition of soil organic matter in a semiarid grassland. Biogeosciences 2017, 14, 2685–2696. [Google Scholar] [CrossRef]
  29. Huang, R.; Crowther, T.W.; Sui, Y.; Sun, B.; Liang, Y. High stability and metabolic capacity of bacterial community promote the rapid reduction of easily decomposing carbon in soil. Commun. Biol. 2021, 4, 1376. [Google Scholar] [CrossRef]
  30. Ng, E.L.; Patti, A.F.; Rose, M.T.; Schefe, C.R.; Wilkinson, K.; Smernik, R.J.; Cavagnaro, T.R. Does the chemical nature of soil carbon drive the structure and functioning of soil microbial communities? Soil Biol. Biochem. 2014, 70, 54–61. [Google Scholar] [CrossRef]
  31. Sha, G.; Chen, Y.; Wei, T.; Guo, X.; Yu, H.; Jiang, S.; Xin, P.; Ren, K. Responses of soil microbial communities to vegetation restoration on the Loess Plateau of China: A meta-analysis. Appl. Soil Ecol. 2023, 189, 104910. [Google Scholar] [CrossRef]
  32. Yang, C.; Liu, J.; Ying, H.; Lu, S. Soil pore structure changes induced by biochar affect microbial diversity and community structure in an Ultisol. Soil Tillage Res. 2022, 224, 105505. [Google Scholar] [CrossRef]
  33. Fan, R.; Zhang, B.; Li, J.; Zhang, Z.; Liang, A. Straw-derived biochar mitigates CO2 emission through changes in soil pore structure in a wheat-rice rotation system. Chemosphere 2020, 243, 125329. [Google Scholar] [CrossRef]
  34. Li, Y.; Feng, G.; Tewolde, H. Biochar derived from papermill factories improves soil physical and hydraulic properties in no-till cotton fields. Biochar 2023, 5, 1–18. [Google Scholar] [CrossRef]
  35. Feeney, D.S.; Crawford, J.W.; Daniell, T.; Hallett, P.D.; Nunan, N.; Ritz, K.; Rivers, M.; Young, I.M. Three-dimensional Microorganization of the Soil–Root–Microbe System. Microb. Ecol. 2006, 52, 151–158. [Google Scholar] [CrossRef]
  36. Ren, J.; Ren, X.; Deng, Z.; Zhang, H.; Wang, J.; Zhang, C.; Lu, F.; Shi, J. Ecological effects of biochar in heavy metal-contaminated soils from multidimensional perspective: Using meta-analysis. Bioresour. Technol. 2025, 432, 132695. [Google Scholar] [CrossRef]
  37. Yao, Q.; Liu, J.; Yu, Z.; Li, Y.; Jin, J.; Liu, X.; Wang, G. Changes of bacterial community compositions after three years of biochar application in a black soil of northeast China. Appl. Soil Ecol. 2017, 113, 11–21. [Google Scholar] [CrossRef]
  38. Yan, M.; Li, X.; Liu, Y.; Li, Y.; He, L.; Zhang, J. Biochar enhanced soil aggregation and C-related enzyme activity in post-mining land on the Loess Plateau, China. Land Degrad. Dev. 2022, 33, 1054–1061. [Google Scholar] [CrossRef]
  39. Li, J.; Yang, Y.; Wen, J.; Mo, F.; Liu, Y. Continuous manure application strengthens the associations between soil microbial function and crop production: Evidence from a 7-year multisite field experiment on the Guanzhong Plain. Agric. Ecosyst. Environ. 2022, 338, 108082. [Google Scholar] [CrossRef]
  40. Bhattacharyya, S.S.; Ros, G.H.; Furtak, K.; Iqbal, H.M.N.; Parra-Saldívar, R. Soil carbon sequestration—An interplay between soil microbial community and soil organic matter dynamics. Sci. Total Environ. 2022, 815, 152928. [Google Scholar] [CrossRef]
  41. Liu, Z.; Tang, J.; Ren, X.; Schaeffer, S.M. Effects of phosphorus modified nZVI-biochar composite on emission of greenhouse gases and changes of microbial community in soil. Environ. Pollut. 2021, 274, 116483. [Google Scholar] [CrossRef]
  42. Wan, T.; Dong, X.; Yu, L.; Li, D.; Han, H.; Tu, S.; Wan, J. Influence of Pteris vittata-maize intercropping on plant agronomic parameters and soil arsenic remediation. Chemosphere 2024, 359, 142331. [Google Scholar] [CrossRef]
  43. Yuan, J.-H.; Xu, R.-K.; Qian, W.; Wang, R.-H. Comparison of the ameliorating effects on an acidic ultisol between four crop straws and their biochars. J. Soils Sediments 2011, 11, 741–750. [Google Scholar] [CrossRef]
  44. Yang, L.; Wu, Y.; Wang, Y.; An, W.; Jin, J.; Sun, K.; Wang, X. Effects of biochar addition on the abundance, speciation, availability, and leaching loss of soil phosphorus. Sci. Total Environ. 2021, 758, 143657. [Google Scholar] [CrossRef]
  45. Li, Y.-M.; Duan, Y.; Wang, G.-l.; Wang, A.-Q.; Shao, G.-Z.; Meng, X.-H.; Hu, H.-Y.; Zhang, D.-M. Straw alters the soil organic carbon composition and microbial community under different tillage practices in a meadow soil in Northeast China. Soil Tillage Res. 2021, 208, 104879. [Google Scholar] [CrossRef]
  46. Hu, W.; Zhang, Y.; Rong, X.; Zhou, X.; Fei, J.; Peng, J.; Luo, G. Biochar and organic fertilizer applications enhance soil functional microbial abundance and agroecosystem multifunctionality. Biochar 2024, 6, 3. [Google Scholar] [CrossRef]
  47. Luo, L.; Gu, J.-D. Alteration of extracellular enzyme activity and microbial abundance by biochar addition: Implication for carbon sequestration in subtropical mangrove sediment. J. Environ. Manag. 2016, 182, 29–36. [Google Scholar] [CrossRef]
  48. Ma, T.; Gao, W.; Shi, B.; Yang, Z.; Li, Y.; Zhu, J.; He, J.-S. Effects of short- and long-term nutrient addition on microbial carbon use efficiency and carbon accumulation efficiency in the Tibetan alpine grassland. Soil Tillage Res. 2023, 229, 105657. [Google Scholar] [CrossRef]
  49. Paz-Ferreiro, J.; Gascó, G.; Gutiérrez, B.; Méndez, A. Soil biochemical activities and the geometric mean of enzyme activities after application of sewage sludge and sewage sludge biochar to soil. Biol. Fertil. Soils 2012, 48, 511–517. [Google Scholar] [CrossRef]
  50. Marschner, P. Processes in submerged soils—linking redox potential, soil organic matter turnover and plants to nutrient cycling. Plant Soil 2021, 464, 1–12. [Google Scholar] [CrossRef]
  51. Dominchin, M.F.; Verdenelli, R.A.; Berger, M.G.; Aoki, A.; Meriles, J.M. Impact of N-fertilization and peanut shell biochar on soil microbial community structure and enzyme activities in a Typic Haplustoll under different management practices. Eur. J. Soil Biol. 2021, 104, 103298. [Google Scholar] [CrossRef]
  52. Shi, Z.; Li, X.; Zhang, L.; Wang, Y. Impacts of farmland conversion to apple (Malus domestica) orchard on soil organic carbon stocks and enzyme activities in a semiarid loess region. J. Plant Nutr. Soil Sci. 2015, 178, 440–451. [Google Scholar] [CrossRef]
  53. Bhattacharyya, R.; Rabbi, S.M.F.; Zhang, Y.; Young, I.M.; Jones, A.R.; Dennis, P.G. Soil organic carbon is significantly associated with the pore geometry, microbial diversity and enzyme activity of the macro-aggregates under different land uses. Sci. Total Environ. 2021, 778, 146286. [Google Scholar] [CrossRef] [PubMed]
  54. Liu, C.; Han, X.; Lu, X.; Yan, J.; Chen, X.; Zou, W. Response of soil enzymatic activity to pore structure under inversion tillage with organic materials incorporation in a haplic chernozem. J. Environ. Manag. 2024, 370, 122421. [Google Scholar] [CrossRef] [PubMed]
  55. Batista, E.R.; de Jesus Franco, A.; da Silva, A.P.V.; da Silva, J.A.G.F.; Tavares, D.S.; De Souza, J.K. Organic substrate availability and enzyme activity affect microbial-controlled carbon dynamics in areas disturbed by a mining dam failure. Appl. Soil Ecol. 2022, 169, 104169. [Google Scholar] [CrossRef]
  56. Abdo, A.I.; Xu, Y.; Shi, D.; Li, J.; Li, H.; El-Sappah, A.H.; Elrys, A.S.; Alharbi, S.A.; Zhou, C.; Wang, L.; et al. Nitrogen transformation genes and ammonia emission from soil under biochar and urease inhibitor application. Soil Tillage Res. 2022, 223, 105491. [Google Scholar] [CrossRef]
Figure 1. Total organic carbon (TOC) and total nitrogen (TN) in soil. CK—no biochar and manure; B1—biochar 0.5%; B2—biochar 1.0%; B3—biochar 2.0%; FB0—manure (0.5%)—no biochar; FB1—manure (0.5%)—biochar 0.5%; FB2—manure (0.5%)—biochar 1.0%; FB3—manure (0.5%), biochar 2.0%. Different letters significant differences between the treatments according to one-way ANOVA at the level of p < 0.05.
Agronomy 15 01384 g001
Figure 2. (a) Organic carbon fractions in soil; (b) Organic carbon content in soil. CK—no biochar and manure; B1—biochar 0.5%; B2—biochar 1.0%; B3—biochar 2.0%; FB0—manure (0.5%), no biochar; FB1—manure (0.5%), biochar 0.5%; FB2—manure (0.5%), biochar 1.0%; FB3—manure (0.5%), biochar 2.0%. Vertical bars represent the standard errors of the mean (n = 3).
Agronomy 15 01384 g002
Figure 3. Changes in soil pH and pore characteristics of soil in treatments. (a) pH. (b) Internal 2D structure. In the figure, bright white represents pyrite and other high-density components, light gray represents the medium-density group (such as quartz, carbonate minerals, and clay minerals), dark gray represents low-density components (such as organic matter and biochar), and other colors represent soil pores with different diameters on the corresponding scale. (c) Pore throats models. (d) Soil pore size distribution. (e) Pore morphology. CK—no biochar and manure; B1—biochar 0.5%; B2—biochar 1.0%; B3—biochar 2.0%; FB0—manure (0.5%), no biochar; FB1—manure (0.5%), biochar 0.5%; FB2—manure (0.5%), biochar 1.0%; FB3—manure (0.5%), biochar 2.0%. Vertical bars represent the standard errors of the mean (n = 3).
Agronomy 15 01384 g003
Figure 4. (a) Relative abundance of soil bacterial phyla. (b) The co-occurrence networks of soil bacteria. (c) Prediction of bacterial function. (d) Analysis of functional differences between t-test groups. CK—no biochar and manure; B1—biochar 0.5%; B2—biochar 1.0%; B3—biochar 2.0%; FB0—manure (0.5%), no biochar; FB1—manure (0.5%), biochar 0.5%; FB2—manure (0.5%), biochar 1.0%; FB3—manure (0.5%), biochar 2.0%.
Agronomy 15 01384 g004
Figure 5. The influence of biochar and manure on soil enzyme activity. CK—no biochar and manure; B1—biochar 0.5%; B2—biochar 1.0%; B3—biochar 2.0%; FB0—manure (0.5%), no biochar; FB1—manure (0.5%), biochar 0.5%; FB2—manure (0.5%), biochar 1.0%; FB3—manure (0.5%), biochar 2.0%. Different letters significant differences between the treatments according to one-way ANOVA at the level of p < 0.05.
Agronomy 15 01384 g005
Figure 6. Principal component analysis of soil factors after biochar and manure application. CK—no biochar and manure; B1—biochar 0.5%; B2—biochar 1.0%; B3—biochar 2.0%; FB0—manure (0.5%), no biochar; FB1—manure (0.5%), biochar 0.5%; FB2—manure (0.5%), biochar 1.0%; FB3—manure (0.5%), biochar 2.0%.
Agronomy 15 01384 g006
Figure 7. Effects of soil environmental factors on plant ecological characteristics based on structural equation modeling (SEM). Vertical bars denote the standard errors of the mean (n = 3), * p < 0.05; ** p <0.01; *** p < 0.001.
Agronomy 15 01384 g007
Table 1. Basic pore characteristics of soils with biochar and manure treatments.
TreatmentPorosity/%Soil Pore Count/Million
CK3.73 ± 0.05 c0.53 ± 0.01 a
B35.53 ± 0.06 a0.35 ± 0.03 c
FB04.74 ± 0.04 b0.43 ± 0.02 b
FB35.64 ± 0.05 a0.36 ± 0.03 c
Note: CK—no biochar and manure; B3—biochar 2.0%; FB0—manure (0.5%), no biochar; FB3—manure (0.5%), biochar 2.0%. The number of pores and porosity were calculated based on pores with a diameter greater than 22.24 μm. Different letters significant differences between the treatments according to one-way ANOVA at the level of p < 0.05.
Table 2. Effects of different treatments on soil bacterial abundance and diversity index.
TreatmentOTUChao1ShannonPielou_eSimpsonCoverage
CK1430.01 ± 161.46 b1333.29 ± 161.68 b8.20 ± 0.65 b0.78 ± 0.05 b0.97 ± 0.02 b0.99 ± 0.01 a
B11435.67 ± 164.69 b1438.70 ± 163.46 b8.23 ± 0.52 b0.79 ± 0.04 b0.98 ± 0.01 ab0.99 ± 0.01 a
B21479.33 ± 78.82 b1482.10 ± 79.19 b8.08 ± 0.27 b0.78 ± 0.02 b0.98 ± 0.01 ab0.99 ± 0.01 a
B31476.33 ± 122.13 b1480.79 ± 121.63 b8.21 ± 0.28 b0.79 ± 0.02 b0.98 ± 0.01 ab0.99 ± 0.01 a
FB01658.67 ± 93.66 ab1661.23 ± 93.30 ab8.88 ± 0.37 ab0.83 ± 0.03 ab0.99 ± 0.01 ab0.99 ± 0.01 a
FB11888.67 ± 123.41 a1893.01 ± 123.28 a9.55 ± 0.19 a0.88 ± 0.01 a1.00 ± 0.01 a0.99 ± 0.01 a
FB21913.33 ± 141.00 a1918.27 ± 142.11 a9.55 ± 0.13 a0.88 ± 0.01 a1.00 ± 0.01 a0.99 ± 0.01 a
FB31769.33 ± 141.25 a1772.77 ± 140.19 ab9.28 ± 0.20 ab0.86 ± 0.10 ab1.00 ± 0.01 a0.99 ± 0.01 a
Note: CK—no biochar and manure; B1—biochar 0.5%; B2—biochar 1.0%; B3—biochar 2.0%; FB0—manure (0.5%), no biochar; FB1—manure (0.5%), biochar 0.5%; FB2—manure (0.5%), biochar 1.0%; FB3—manure (0.5%), biochar 2.0%. Different letters significant differences between the treatments according to one-way ANOVA at the level of p < 0.05.
Table 3. Fitting goodness statistics of structural equation modeling.
IndexCriteria JudgingModel Fit Results
x2/df1–31.23
GFI>0.900.991
CFI>0.951.000
RMSEA<0.050.003
RMR-5.650
SRMR<0.080.037
Note: Goodness-of-fit index (GFI), Comparative Fit Index (CFI), Root Mean Square Error of Approximation (RMSEA), Root Mean Square Residual (RMR), Standardized Root Mean Square Residual (SRMR), x2/df (Chi-square/Degrees of Freedom).
Disclaimer/Publisher’s Note: The statements, opinions and data contained in all publications are solely those of the individual author(s) and contributor(s) and not of MDPI and/or the editor(s). MDPI and/or the editor(s) disclaim responsibility for any injury to people or property resulting from any ideas, methods, instructions or products referred to in the content.

