Genome-Wide Dissection of Shade Tolerance in Soybean at Seedling Stage

 , , ,
, , ,
Abstract
1. Introduction
2. Materials and Methods
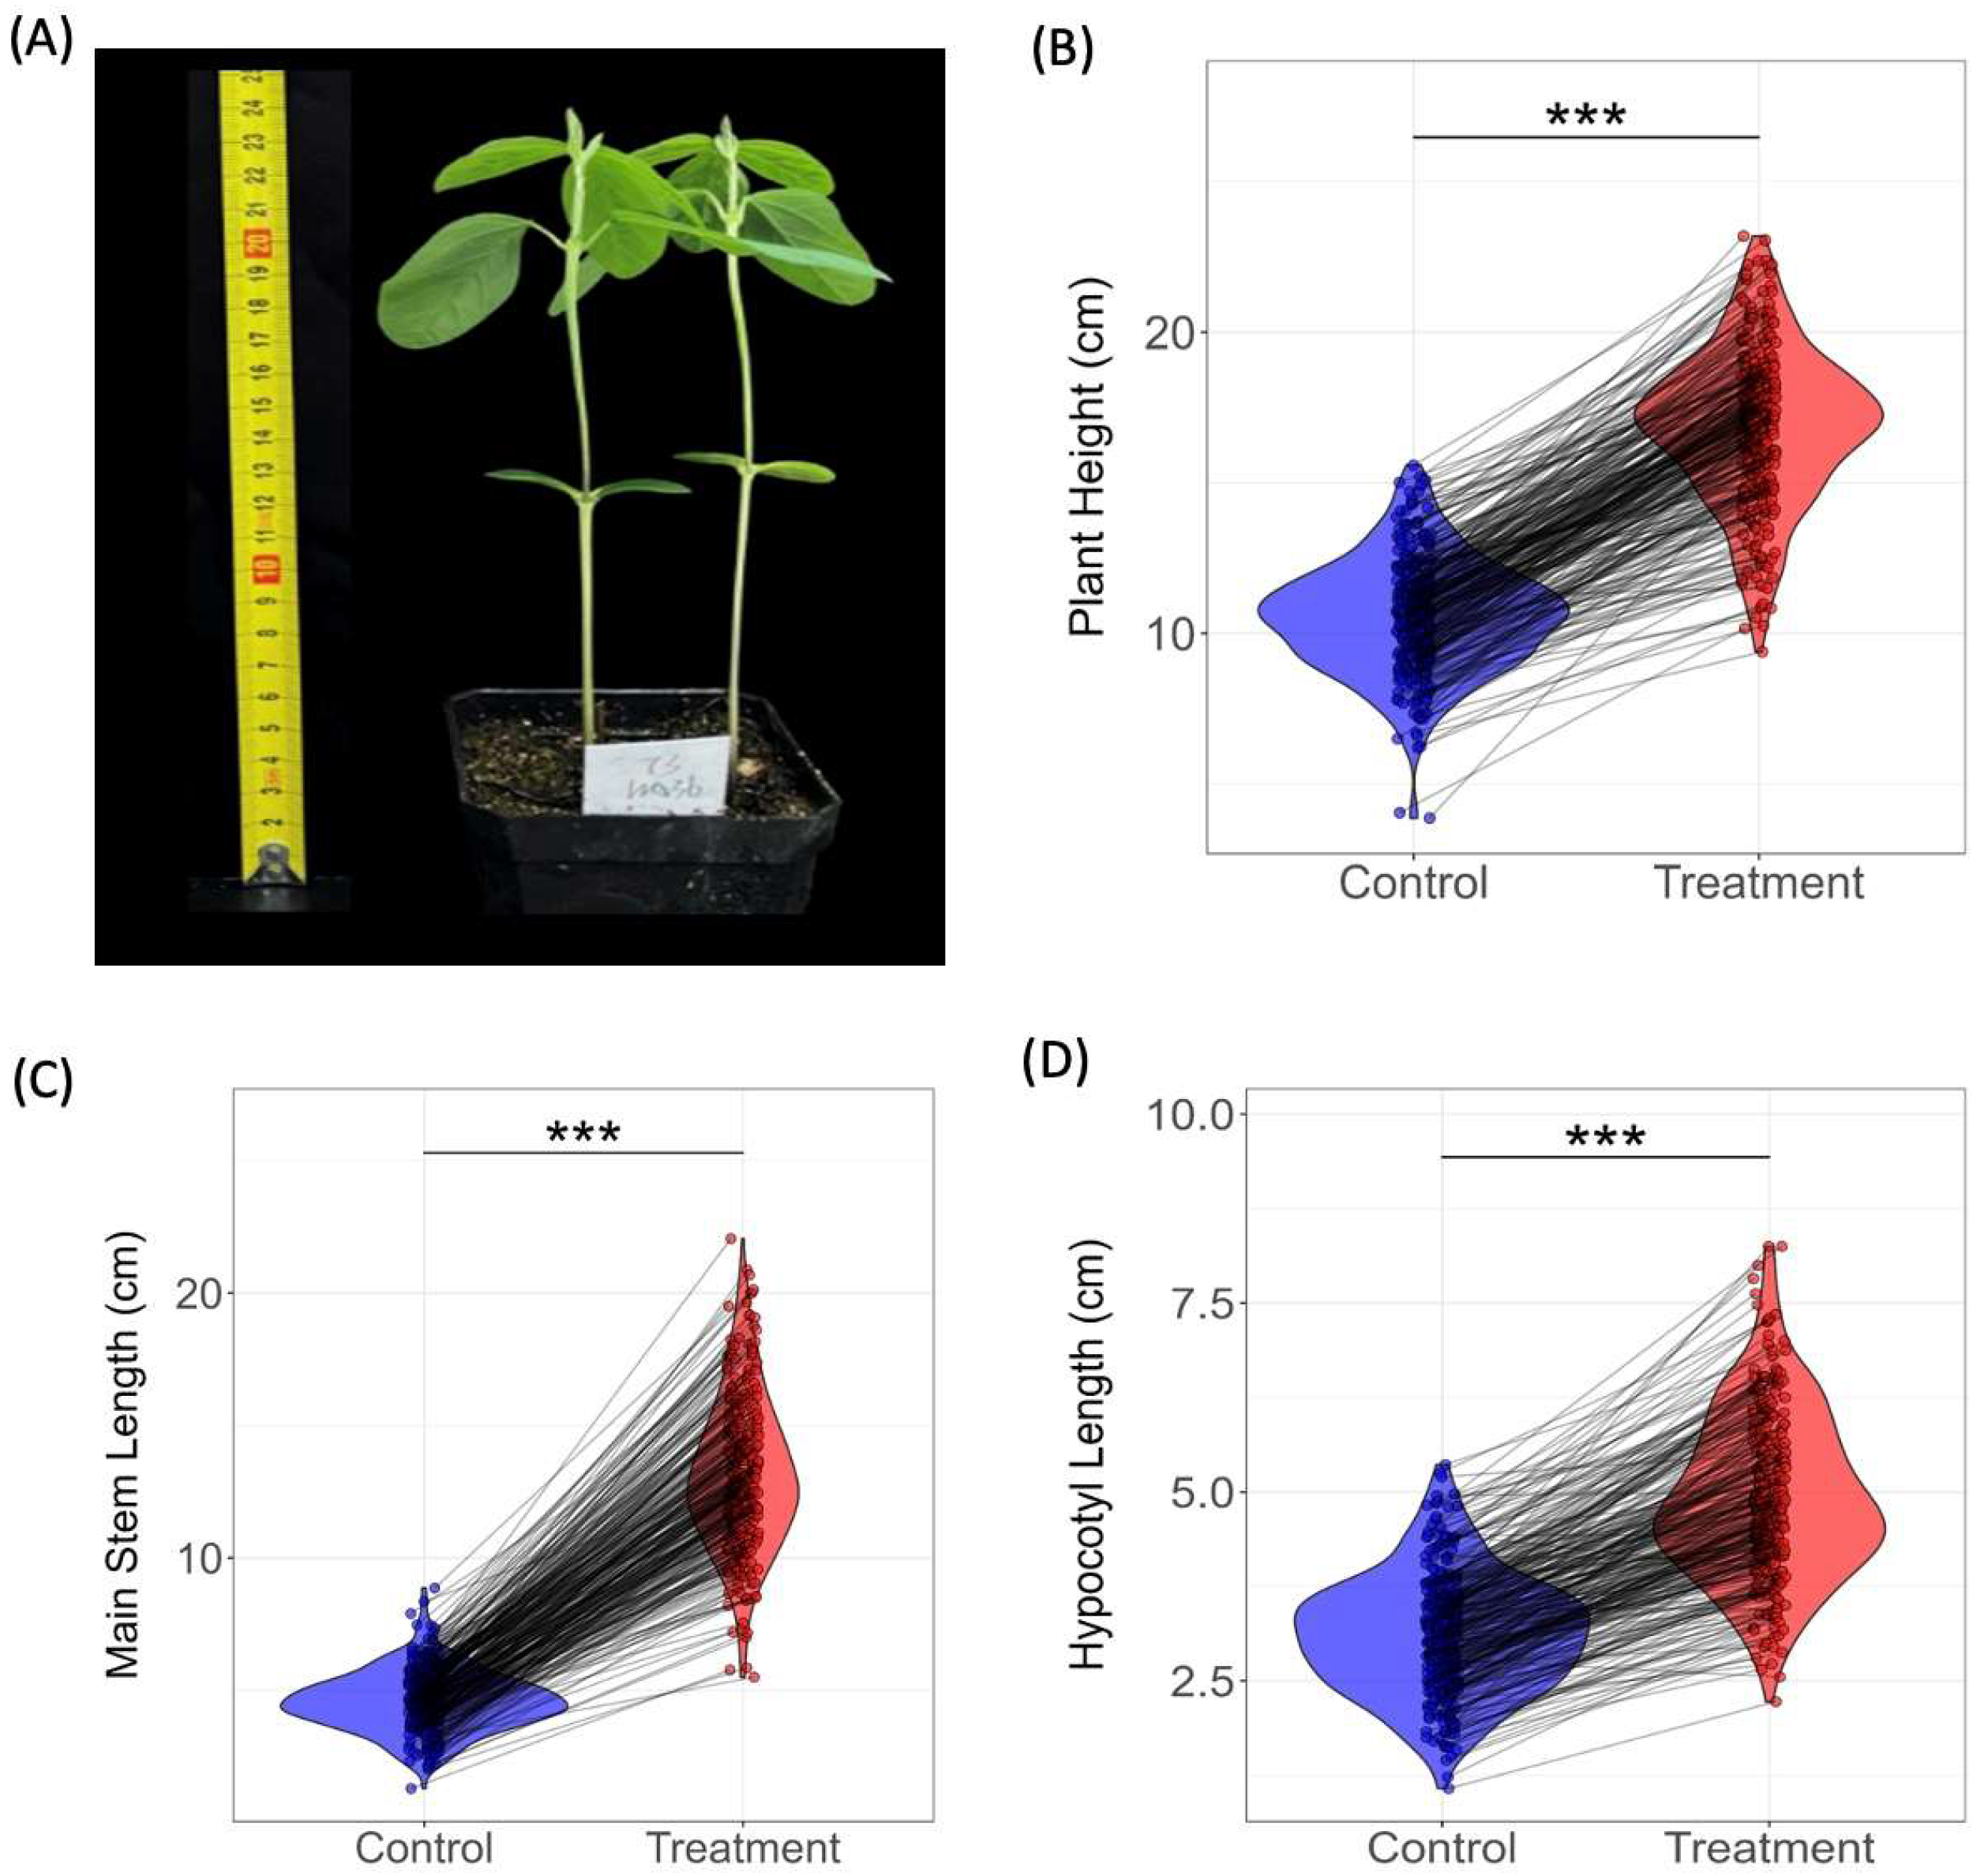
2.1. Experimental Materials, Design, and Phenotypic Measurements
2.2. Statistical Analysis of Phenotype Data
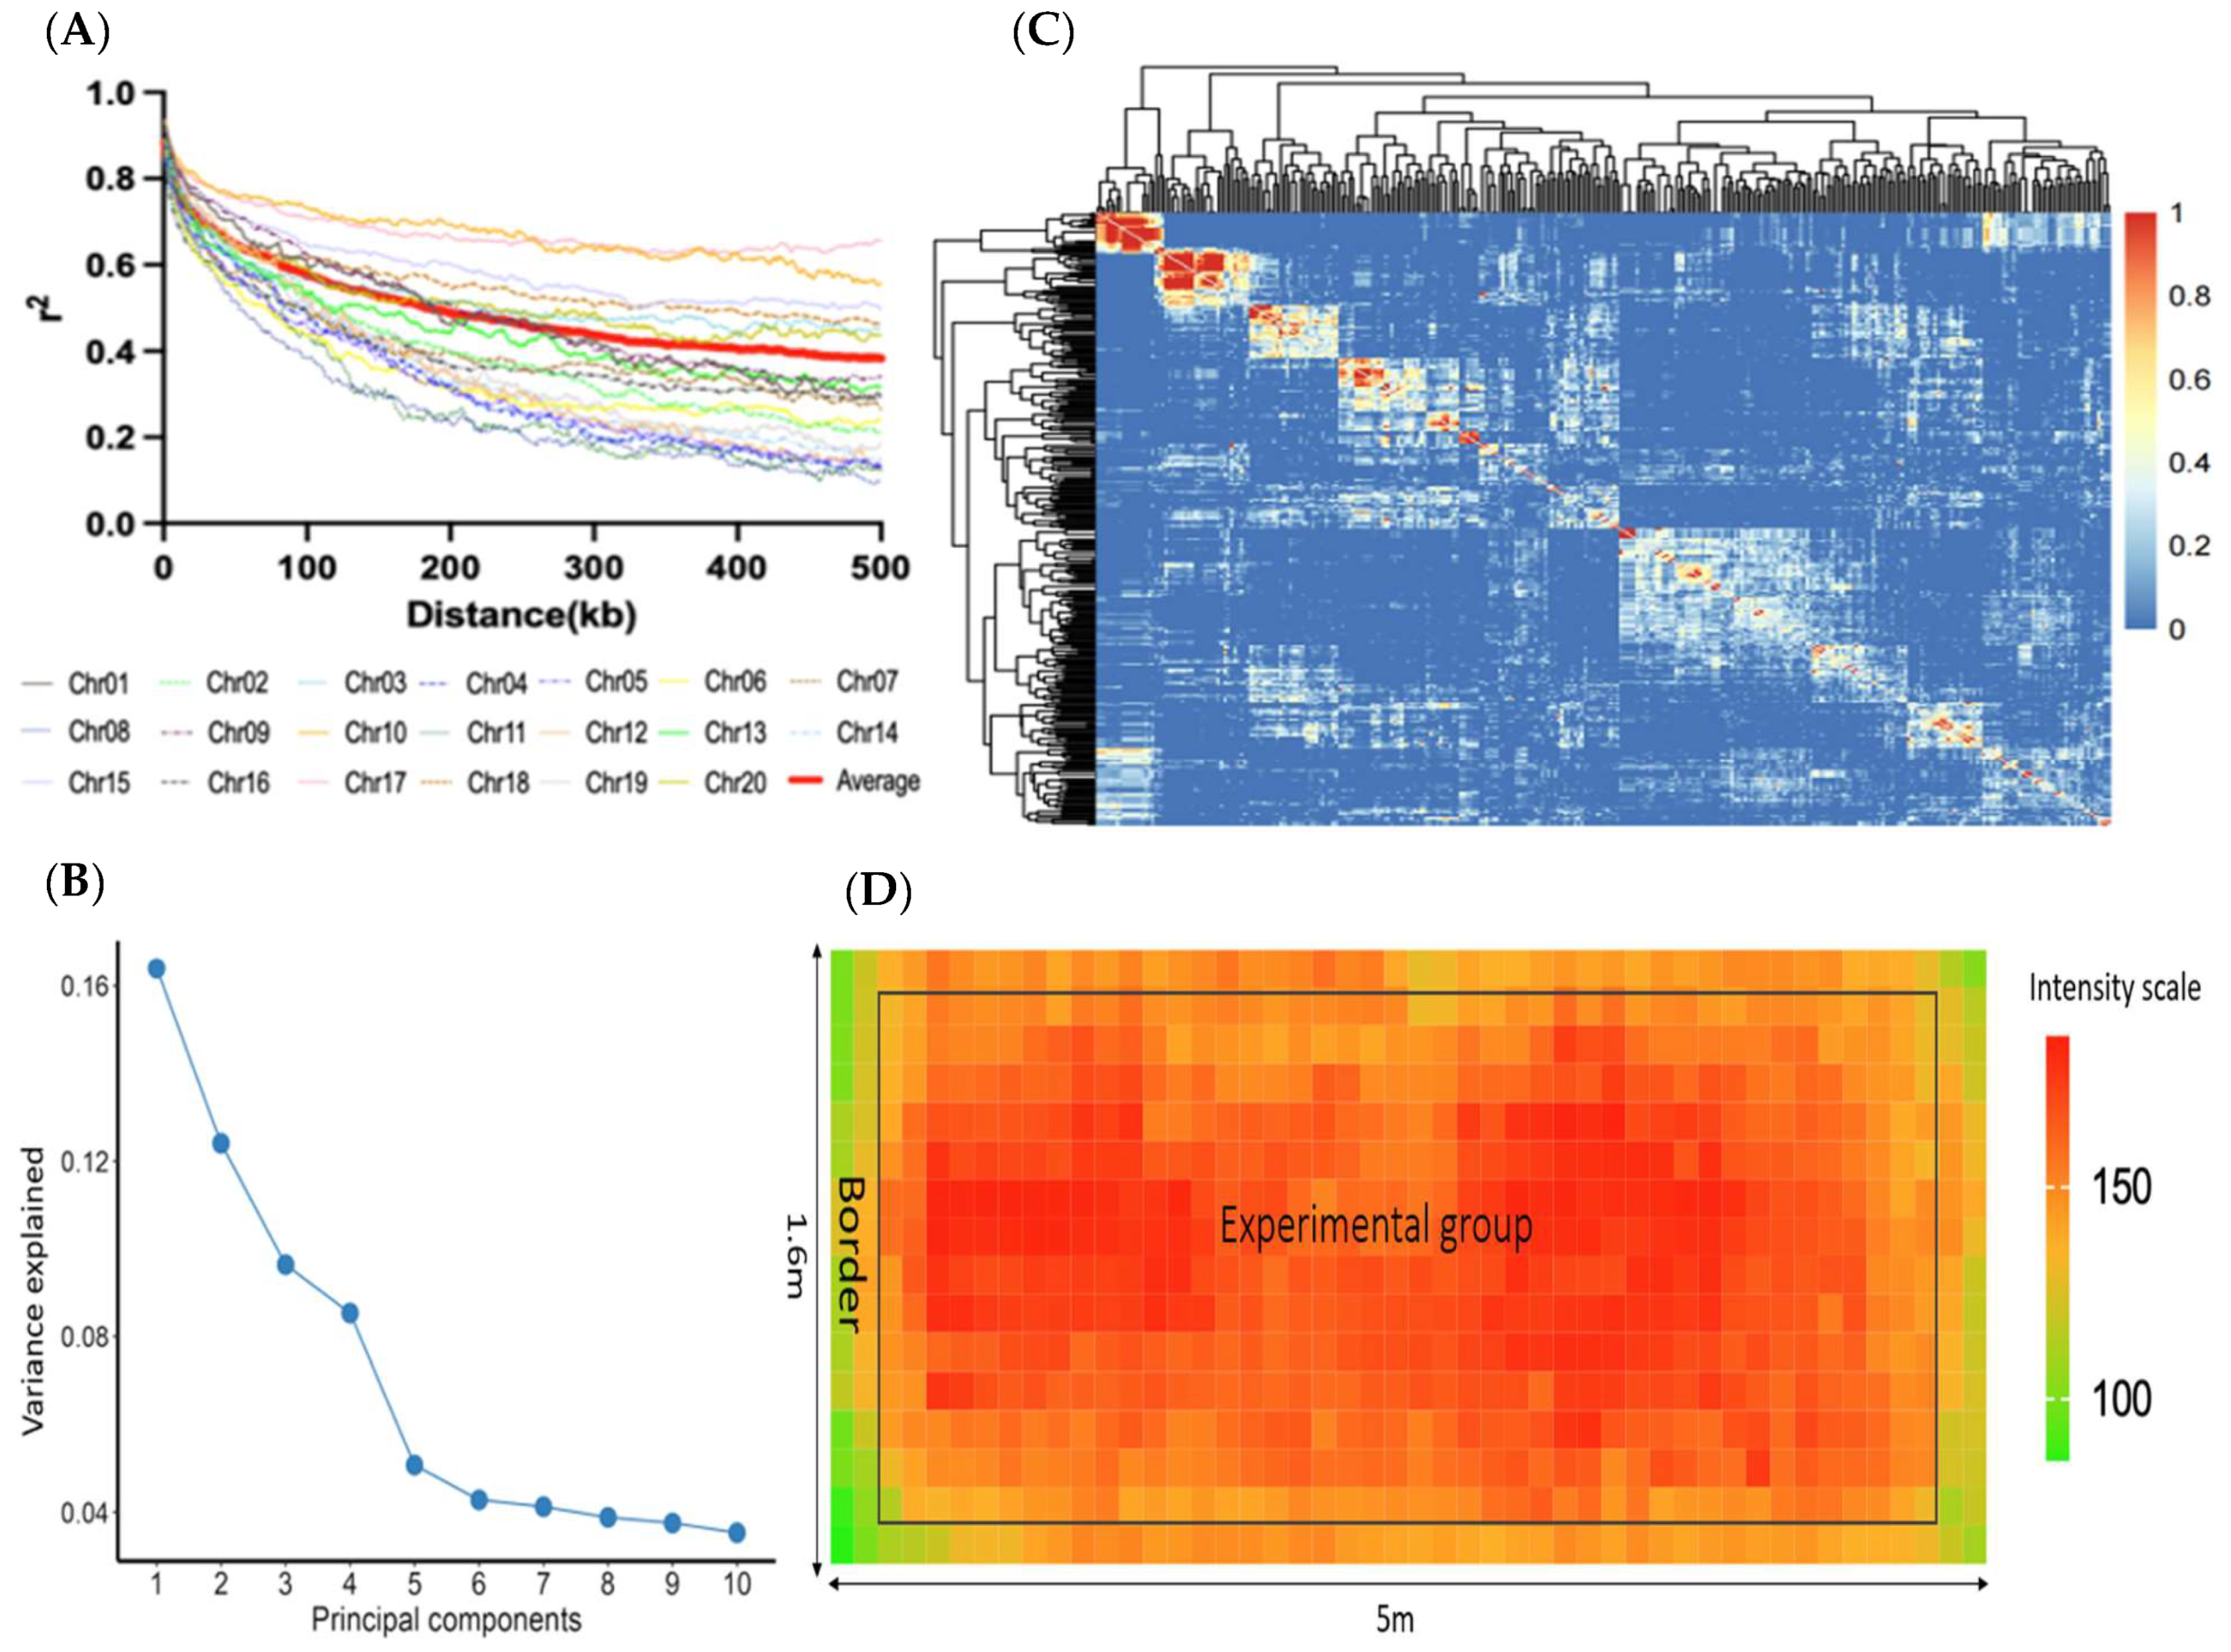
2.3. SNP Linkage Disequilibrium (LD), PCA, and Kinship
2.4. Genome-Wide Association Analysis and Candidate Genes Identification
3. Results
3.1. Descriptive Statistics of Shade-Tolerance-Related Traits
3.2. LD, PCA, and Kinship
3.3. Light Intensity Effects on Soybean Plant Height in Control Group
3.4. Finding Superior Shade-Tolerant Soybean Germplasm
3.5. GWAS and Proposed QTLs and Candidate Genes
4. Discussion
5. Conclusions
Supplementary Materials
Author Contributions
Funding
Data Availability Statement
Acknowledgments
Conflicts of Interest
References
- Liu, S.; Zhang, M.; Feng, F.; Tian, Z. Toward a “green revolution” for soybean. Mol. Plant 2020, 13, 688–697. [Google Scholar] [CrossRef] [PubMed]
- Assefa, Y.; Carter, P.; Hinds, M.; Bhalla, G.; Schon, R.; Jeschke, M.; Paszkiewicz, S.; Smith, S.; Ciampitti, I.A. Analysis of long term study indicates both agronomic optimal plant density and increase maize yield per plant contributed to yield gain. Sci. Rep. 2018, 8, 4937. [Google Scholar] [CrossRef] [PubMed]
- Shi, D.-Y.; Li, Y.-H.; Zhang, J.-W.; Peng, L.; Bin, Z.; Dong, S.-T. Increased plant density and reduced N rate lead to more grain yield and higher resource utilization in summer maize. J. Integr. Agric. 2016, 15, 2515–2528. [Google Scholar] [CrossRef]
- Du, X.; Wang, Z.; Lei, W.; Kong, L. Increased planting density combined with reduced nitrogen rate to achieve high yield in maize. Sci. Rep. 2021, 11, 358. [Google Scholar] [CrossRef] [PubMed]
- Li, G.; Liang, Y.; Liu, Q.; Zeng, J.; Ren, Q.; Guo, J.; Xiong, F.; Lu, D. Enhancing production efficiency through optimizing plant density in maize–soybean strip intercropping. Front. Plant Sci. 2024, 15, 1473786. [Google Scholar] [CrossRef]
- Finlayson, S.A.; Krishnareddy, S.R.; Kebrom, T.H.; Casal, J.J. Phytochrome regulation of branching in Arabidopsis. Plant Physiol. 2010, 152, 1914–1927. [Google Scholar] [CrossRef]
- Franklin, K.A.; Whitelam, G.C. Phytochromes and shade-avoidance responses in plants. Ann. Bot. 2005, 96, 169–175. [Google Scholar] [CrossRef]
- Reed, J.W.; Nagpal, P.; Poole, D.S.; Furuya, M.; Chory, J. Mutations in the gene for the red/far-red light receptor phytochrome B alter cell elongation and physiological responses throughout Arabidopsis development. Plant Cell 1993, 5, 147–157. [Google Scholar] [CrossRef]
- Casal, J.J. Photoreceptor signaling networks in plant responses to shade. Annu. Rev. Plant Biol. 2013, 64, 403–427. [Google Scholar] [CrossRef]
- Chen, M.; Chory, J. Phytochrome signaling mechanisms and the control of plant development. Trends Cell Biol. 2011, 21, 664–671. [Google Scholar] [CrossRef]
- Suetsugu, N.; Wada, M. Evolution of three LOV blue light receptor families in green plants and photosynthetic stramenopiles: Phototropin, ZTL/FKF1/LKP2 and aureochrome. Plant Cell Physiol. 2013, 54, 8–23. [Google Scholar] [CrossRef] [PubMed]
- Lin, C. Plant blue-light receptors. Trends Plant Sci. 2000, 5, 337–342. [Google Scholar] [CrossRef] [PubMed]
- Jenkins, G.I. The UV-B photoreceptor UVR8: From structure to physiology. Plant Cell 2014, 26, 21–37. [Google Scholar] [CrossRef] [PubMed]
- Jiang, H.; Shui, Z.; Xu, L.; Yang, Y.; Li, Y.; Yuan, X.; Shang, J.; Asghar, M.A.; Wu, X.; Yu, L. Gibberellins modulate shade-induced soybean hypocotyl elongation downstream of the mutual promotion of auxin and brassinosteroids. Plant Physiol. Biochem. 2020, 150, 209–221. [Google Scholar] [CrossRef]
- Morelli, G.; Ruberti, I. Shade avoidance responses. Driving auxin along lateral routes. Plant Physiol. 2000, 122, 621–626. [Google Scholar] [CrossRef]
- Zhang, H.; Wang, L.; Gao, Y.; Guo, Y.; Zheng, N.; Xu, X.; Xu, M.; Wang, W.; Liu, C.; Liu, W. Genome-wide identification of SMXL Gene family in soybean and expression analysis of GmSMXLs under Shade stress. Plants 2022, 11, 2410. [Google Scholar] [CrossRef]
- Jia, Q.; Hu, S.; Li, X.; Wei, L.; Wang, Q.; Zhang, W.; Zhang, H.; Liu, X.; Chen, X.; Wang, X. Identification of candidate genes and development of KASP markers for soybean shade-tolerance using GWAS. Front. Plant Sci. 2024, 15, 1479536. [Google Scholar] [CrossRef]
- Su, Y.; Hao, X.; Zeng, W.; Lai, Z.; Pan, Y.; Wang, C.; Guo, P.; Zhang, Z.; He, J.; Xing, G. Genome-wide association with transcriptomics reveals a shade-tolerance gene network in soybean. Crop J. 2024, 12, 232–243. [Google Scholar] [CrossRef]
- Su, Y.; Zhang, Z.; He, J.; Zeng, W.; Cai, Z.; Lai, Z.; Pan, Y.; Hao, X.; Xing, G.; Wang, W. Gene–allele system of shade tolerance in southern China soybean germplasm revealed by genome-wide association study using gene–allele sequence as markers. Theor. Appl. Genet. 2023, 136, 152. [Google Scholar] [CrossRef]
- Lyu, X.; Cheng, Q.; Qin, C.; Li, Y.; Xu, X.; Ji, R.; Mu, R.; Li, H.; Zhao, T.; Liu, J. GmCRY1s modulate gibberellin metabolism to regulate soybean shade avoidance in response to reduced blue light. Mol. Plant 2021, 14, 298–314. [Google Scholar] [CrossRef]
- Qin, C.; Li, Y.-h.; Li, D.; Zhang, X.; Kong, L.; Zhou, Y.; Lyu, X.; Ji, R.; Wei, X.; Cheng, Q. PH13 improves soybean shade traits and enhances yield for high-density planting at high latitudes. Nat. Commun. 2023, 14, 6813. [Google Scholar] [CrossRef] [PubMed]
- Lu, S.; Dong, L.; Fang, C.; Liu, S.; Kong, L.; Cheng, Q.; Chen, L.; Su, T.; Nan, H.; Zhang, D. Stepwise selection on homeologous PRR genes controlling flowering and maturity during soybean domestication. Nat. Genet. 2020, 52, 428–436. [Google Scholar] [CrossRef] [PubMed]
- He, J.; Meng, S.; Zhao, T.; Xing, G.; Yang, S.; Li, Y.; Guan, R.; Lu, J.; Wang, Y.; Xia, Q. An innovative procedure of genome-wide association analysis fits studies on germplasm population and plant breeding. Theor. Appl. Genet. 2017, 130, 2327–2343. [Google Scholar] [CrossRef] [PubMed]
- Wickham, H. ggplot2. Wiley Interdiscip. Rev. Comput. Stat. 2011, 3, 180–185. [Google Scholar] [CrossRef]
- Bradbury, P.J.; Zhang, Z.; Kroon, D.E.; Casstevens, T.M.; Ramdoss, Y.; Buckler, E.S. TASSEL: Software for association mapping of complex traits in diverse samples. Bioinformatics 2007, 23, 2633–2635. [Google Scholar] [CrossRef]
- Kolde, R. Package ‘pheatmap’. R Package 2015, 1, 790. [Google Scholar]
- Huang, X.; Wei, X.; Sang, T.; Zhao, Q.; Feng, Q.; Zhao, Y.; Li, C.; Zhu, C.; Lu, T.; Zhang, Z. Genome-wide association studies of 14 agronomic traits in rice landraces. Nat. Genet. 2010, 42, 961–967. [Google Scholar] [CrossRef]
- Wen, Z.; Tan, R.; Yuan, J.; Bales, C.; Du, W.; Zhang, S.; Chilvers, M.I.; Schmidt, C.; Song, Q.; Cregan, P.B. Genome-wide association mapping of quantitative resistance to sudden death syndrome in soybean. BMC Genom. 2014, 15, 809. [Google Scholar] [CrossRef]
- Wang, K.; Guo, H.; Yin, Y. AP2/ERF transcription factors and their functions in Arabidopsis responses to abiotic stresses. Environ. Exp. Bot. 2024, 222, 105763. [Google Scholar] [CrossRef]
- Zhao, J.; Shi, X.; Chen, L.; Chen, Q.; Tian, X.; Ai, L.; Zhao, H.; Yang, C.; Yan, L.; Zhang, M. Genetic and transcriptome analyses reveal the candidate genes and pathways involved in the inactive shade-avoidance response enabling high-density planting of soybean. Front. Plant Sci. 2022, 13, 973643. [Google Scholar] [CrossRef]
- Cheng, B.; Wang, L.; Liu, R.; Wang, W.; Yu, R.; Zhou, T.; Ahmad, I.; Raza, A.; Jiang, S.; Xu, M. Shade-tolerant soybean reduces yield loss by regulating its canopy structure and stem characteristics in the maize–soybean strip intercropping system. Front. Plant Sci. 2022, 13, 848893. [Google Scholar] [CrossRef] [PubMed]
- Jiang, A.; Liu, J.; Gao, W.; Ma, R.; Zhang, J.; Zhang, X.; Du, C.; Yi, Z.; Fang, X.; Zhang, J. Transcriptomic and metabolomic analyses reveal the key genes related to shade tolerance in soybean. Int. J. Mol. Sci. 2023, 24, 14230. [Google Scholar] [CrossRef] [PubMed]
- Pan, L.; He, J.; Zhao, T.; Xing, G.; Wang, Y.; Yu, D.; Chen, S.; Gai, J. Efficient QTL detection of flowering date in a soybean RIL population using the novel restricted two-stage multi-locus GWAS procedure. Theor. Appl. Genet. 2018, 131, 2581–2599. [Google Scholar] [CrossRef] [PubMed]
- Gai, J.-Y.; He, J.-B. Major characteristics, often-raised queries and potential usefulness of the restricted two-stage multi-locus genome-wide association analysis. Sci. Agric. Sin. 2020, 53, 1699–1703. [Google Scholar] [CrossRef]
- DeMers, L.C.; Redekar, N.R.; Kachroo, A.; Tolin, S.A.; Li, S.; Saghai Maroof, M.A. A transcriptional regulatory network of Rsv3-mediated extreme resistance against soybean mosaic virus. PLoS ONE 2020, 15, e0231658. [Google Scholar] [CrossRef]
- Li, L.; Li, X.; Yang, C.; Cheng, Y.; Cai, Z.; Nian, H.; Ma, Q. GsERF1 enhances Arabidopsis thaliana aluminum tolerance through an ethylene-mediated pathway. BMC Plant Biol. 2022, 22, 258. [Google Scholar] [CrossRef]
- Jhan, L.-H.; Yang, C.-Y.; Huang, C.-M.; Lai, M.-C.; Huang, Y.-H.; Baiya, S.; Kao, C.-F. Integrative pathway and network analysis provide insights on flooding-tolerance genes in soybean. Sci. Rep. 2023, 13, 1980. [Google Scholar] [CrossRef]


| Trait | Min | Max | Mean | 1 SD | 2 PCV (%) | 3 H2 (%) |
|---|---|---|---|---|---|---|
| PH_0 | 3.32 | 12.32 | 7.66 | 1.76 | 22.97 | 83.81 |
| PH_75 | 8.8 | 27.32 | 18.08 | 4.94 | 27.33 | 77.13 |
| PH_r | 1.3 | 5.41 | 2.43 | 0.75 | 30.71 | 57.49 |
| MSL_0 | 1.3 | 8.86 | 4.56 | 1.23 | 26.99 | 80.06 |
| MSL_75 | 5.5 | 24.05 | 13.18 | 4.19 | 31.82 | 73.29 |
| MSL_r | 1.01 | 8.37 | 3.01 | 1.08 | 35.79 | 50 |
| HL_0 | 0.68 | 5.36 | 3.10 | 0.88 | 28.48 | 73.88 |
| HL_75 | 2.22 | 8.25 | 4.92 | 1.56 | 31.77 | 67.75 |
| HL_r | 0.66 | 4.73 | 1.66 | 0.61 | 36.85 | 31.66 |
| Source of Variation | DF | MSE | F | p | η2 |
|---|---|---|---|---|---|
| Intercept | 1 | 464.79 | 73.94 | 0 | 0.21 |
| Light | 1 | 1.91 | 0.31 | 0.58 | 0.001 |
| Accession | 306 | 18.22 | 2.90 | 0 | 0.76 |
| Error | 284 | 6.29 | |||
| Total | 592 |
| Trait | QTLs | SNPLDBs | Chr. | Model p Value | Allele No. | SNP No. | QTL Main Effect | Candidate Genes | |||
|---|---|---|---|---|---|---|---|---|---|---|---|
| −log10(p) | R2 (%) | ZH13 Gene Number | W82.a2 Gene Number | Description | |||||||
| PH_r | |||||||||||
| PH_r_shade.1.1 | Block_1_11646785_11746784 | 1 | 8.23 × 10⁻⁵ | 11 | 320 | 3.66 | 3.78 | SoyZH13_01G064100 | Glyma.01G068600 | Transcription factor bHLH49 | |
| PH_r_shade.3.1 | Block_3_3114852_3115149 | 3 | 1.38 × 10⁻¹¹ | 4 | 7 | 7.25 | 5.76 | ||||
| PH_r_shade.10.1 | Block_10_4801122_4860661 | 10 | 0.001718 | 8 | 219 | 2.68 | 2.39 | SoyZH13_10G051100 | Glyma.10G053500 | Auxin response factor 16 | |
| PH_r_shade.12.1 | Block_12_37743951_37744542 | 12 | 0.000161 | 2 | 4 | 3.63 | 1.47 | ||||
| PH_r_shade.15.1 | Block_15_23412759_23416902 | 15 | 3.06 × 10⁻⁶ | 5 | 56 | 4.52 | 3.25 | ||||
| PH_r_shade.16.1 | Block_16_33893242_33893951 | 16 | 3.29 × 10⁻¹⁸ | 6 | 24 | 10.89 | 10.18 | ||||
| PH_r_shade.16.2 | Block_16_35747737_35749257 | 16 | 4.49 × 10⁻⁹ | 8 | 12 | 6.04 | 5.62 | ||||
| PH_r_shade.16.3 | Chr16_36081826 | 16 | 0.000499 | 2 | 2 | 3.3 | 1.25 | ||||
| PH_r_shade.17.1 | Block_17_7316304_7397881 | 17 | 2.52 × 10⁻⁵ | 5 | 333 | 3.91 | 2.77 | ||||
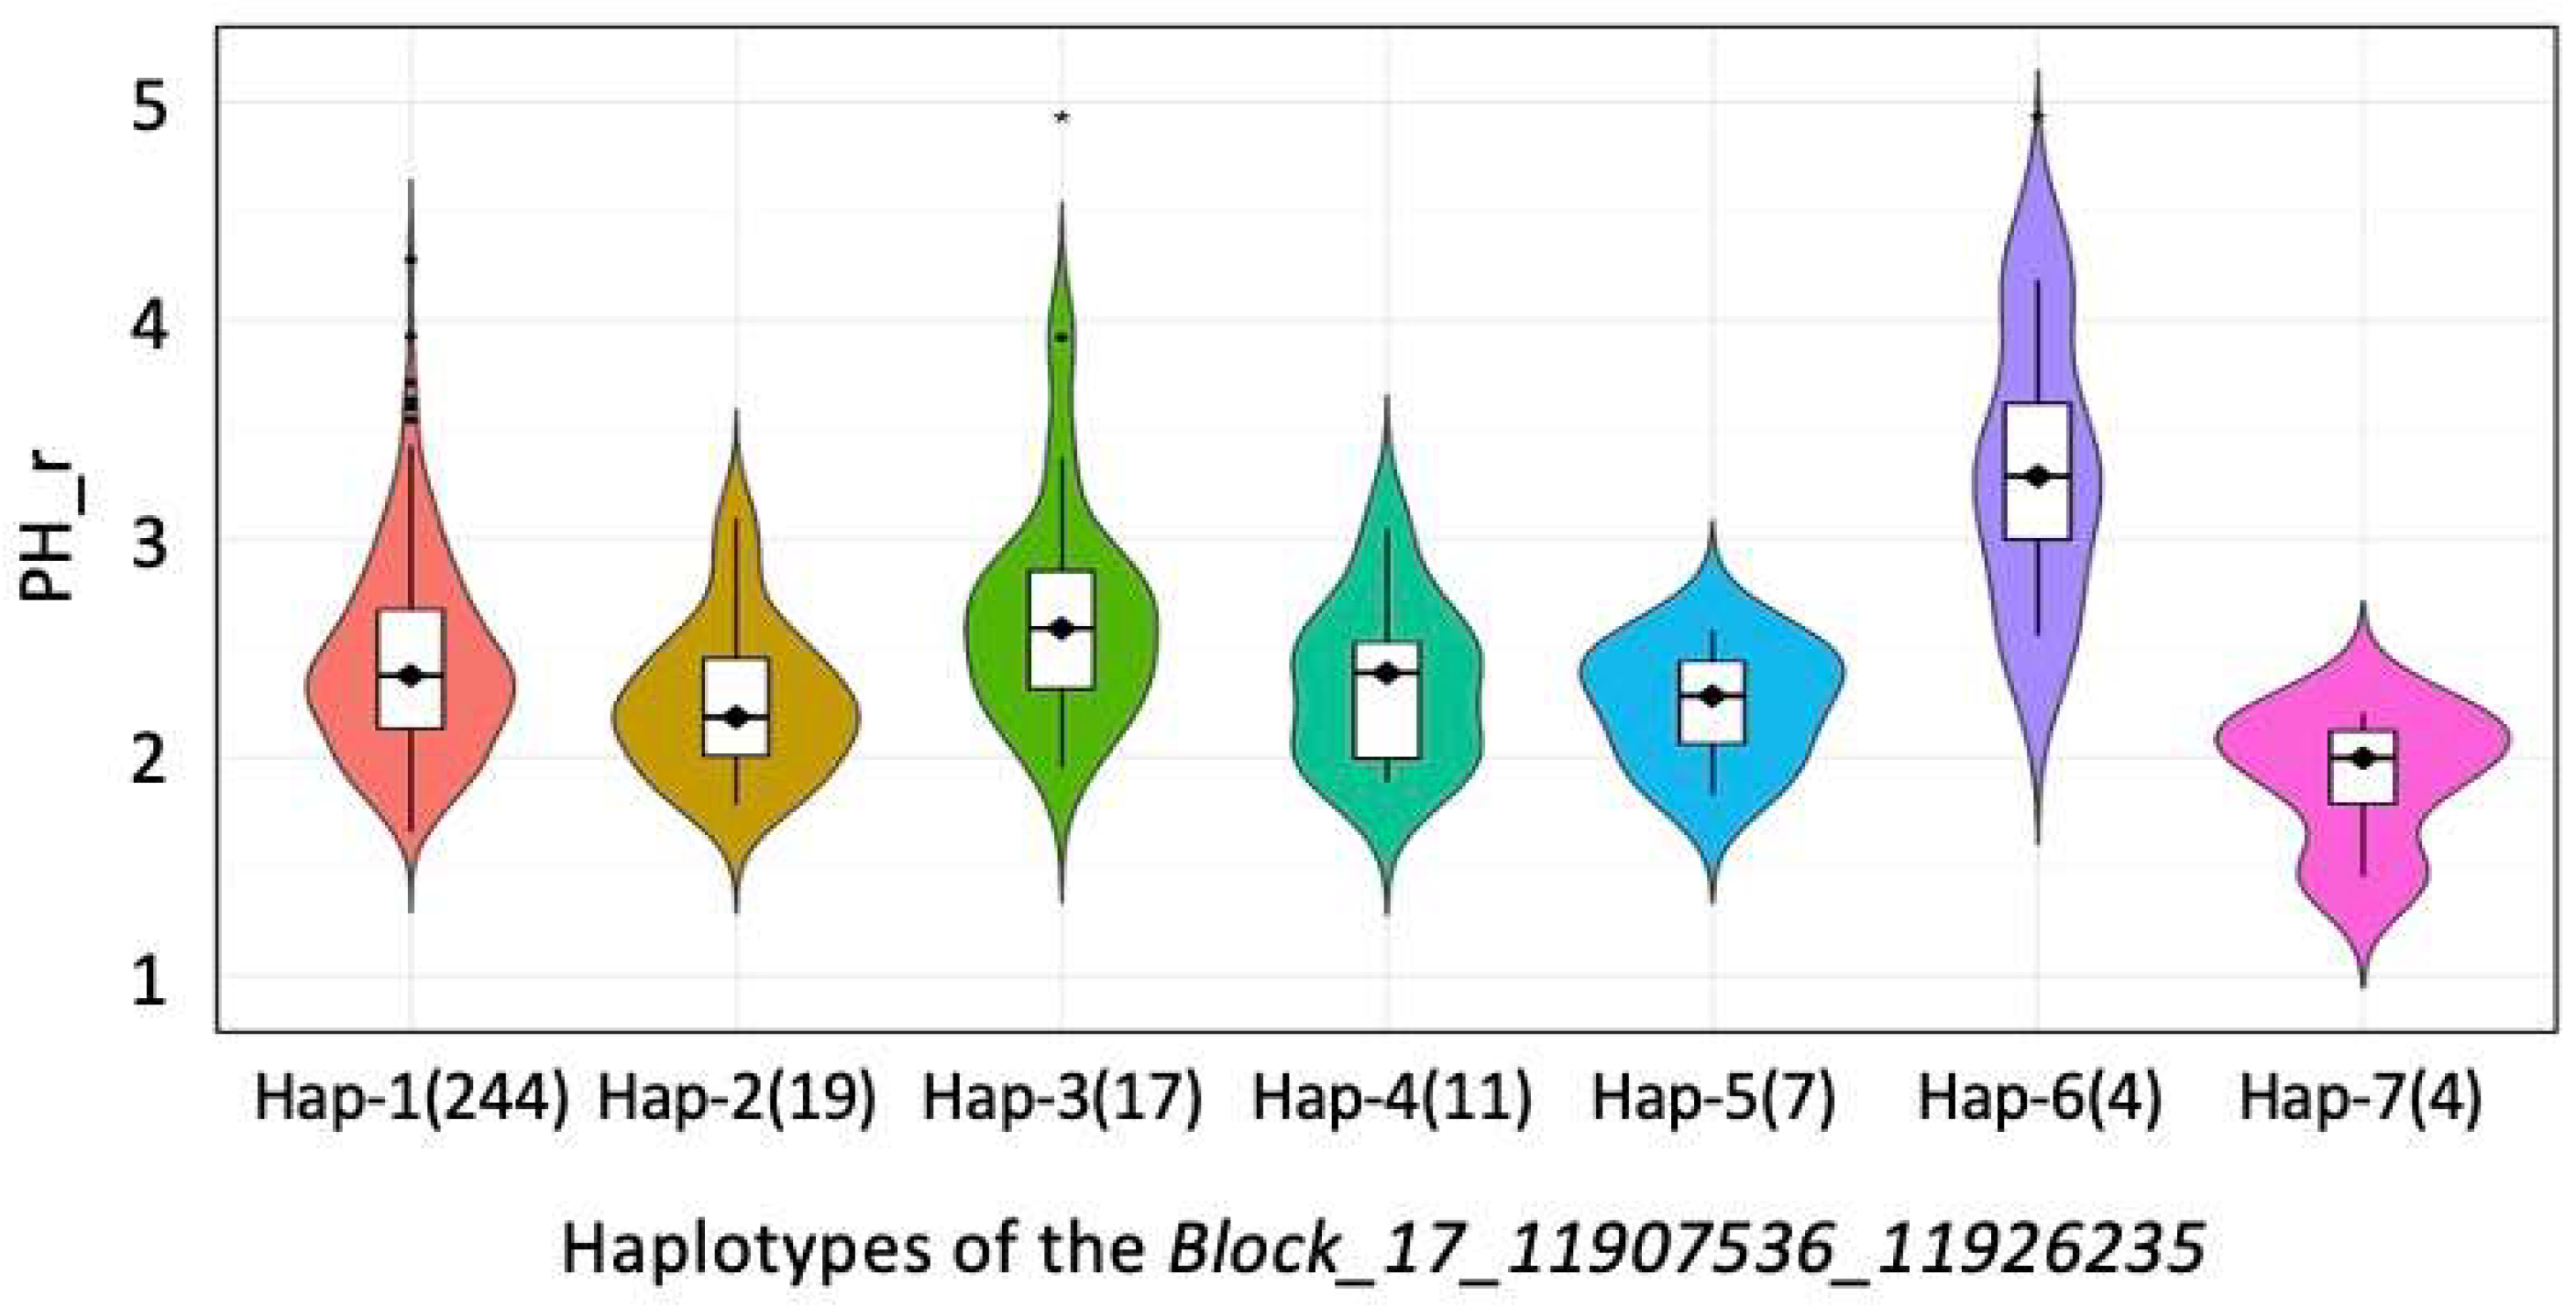
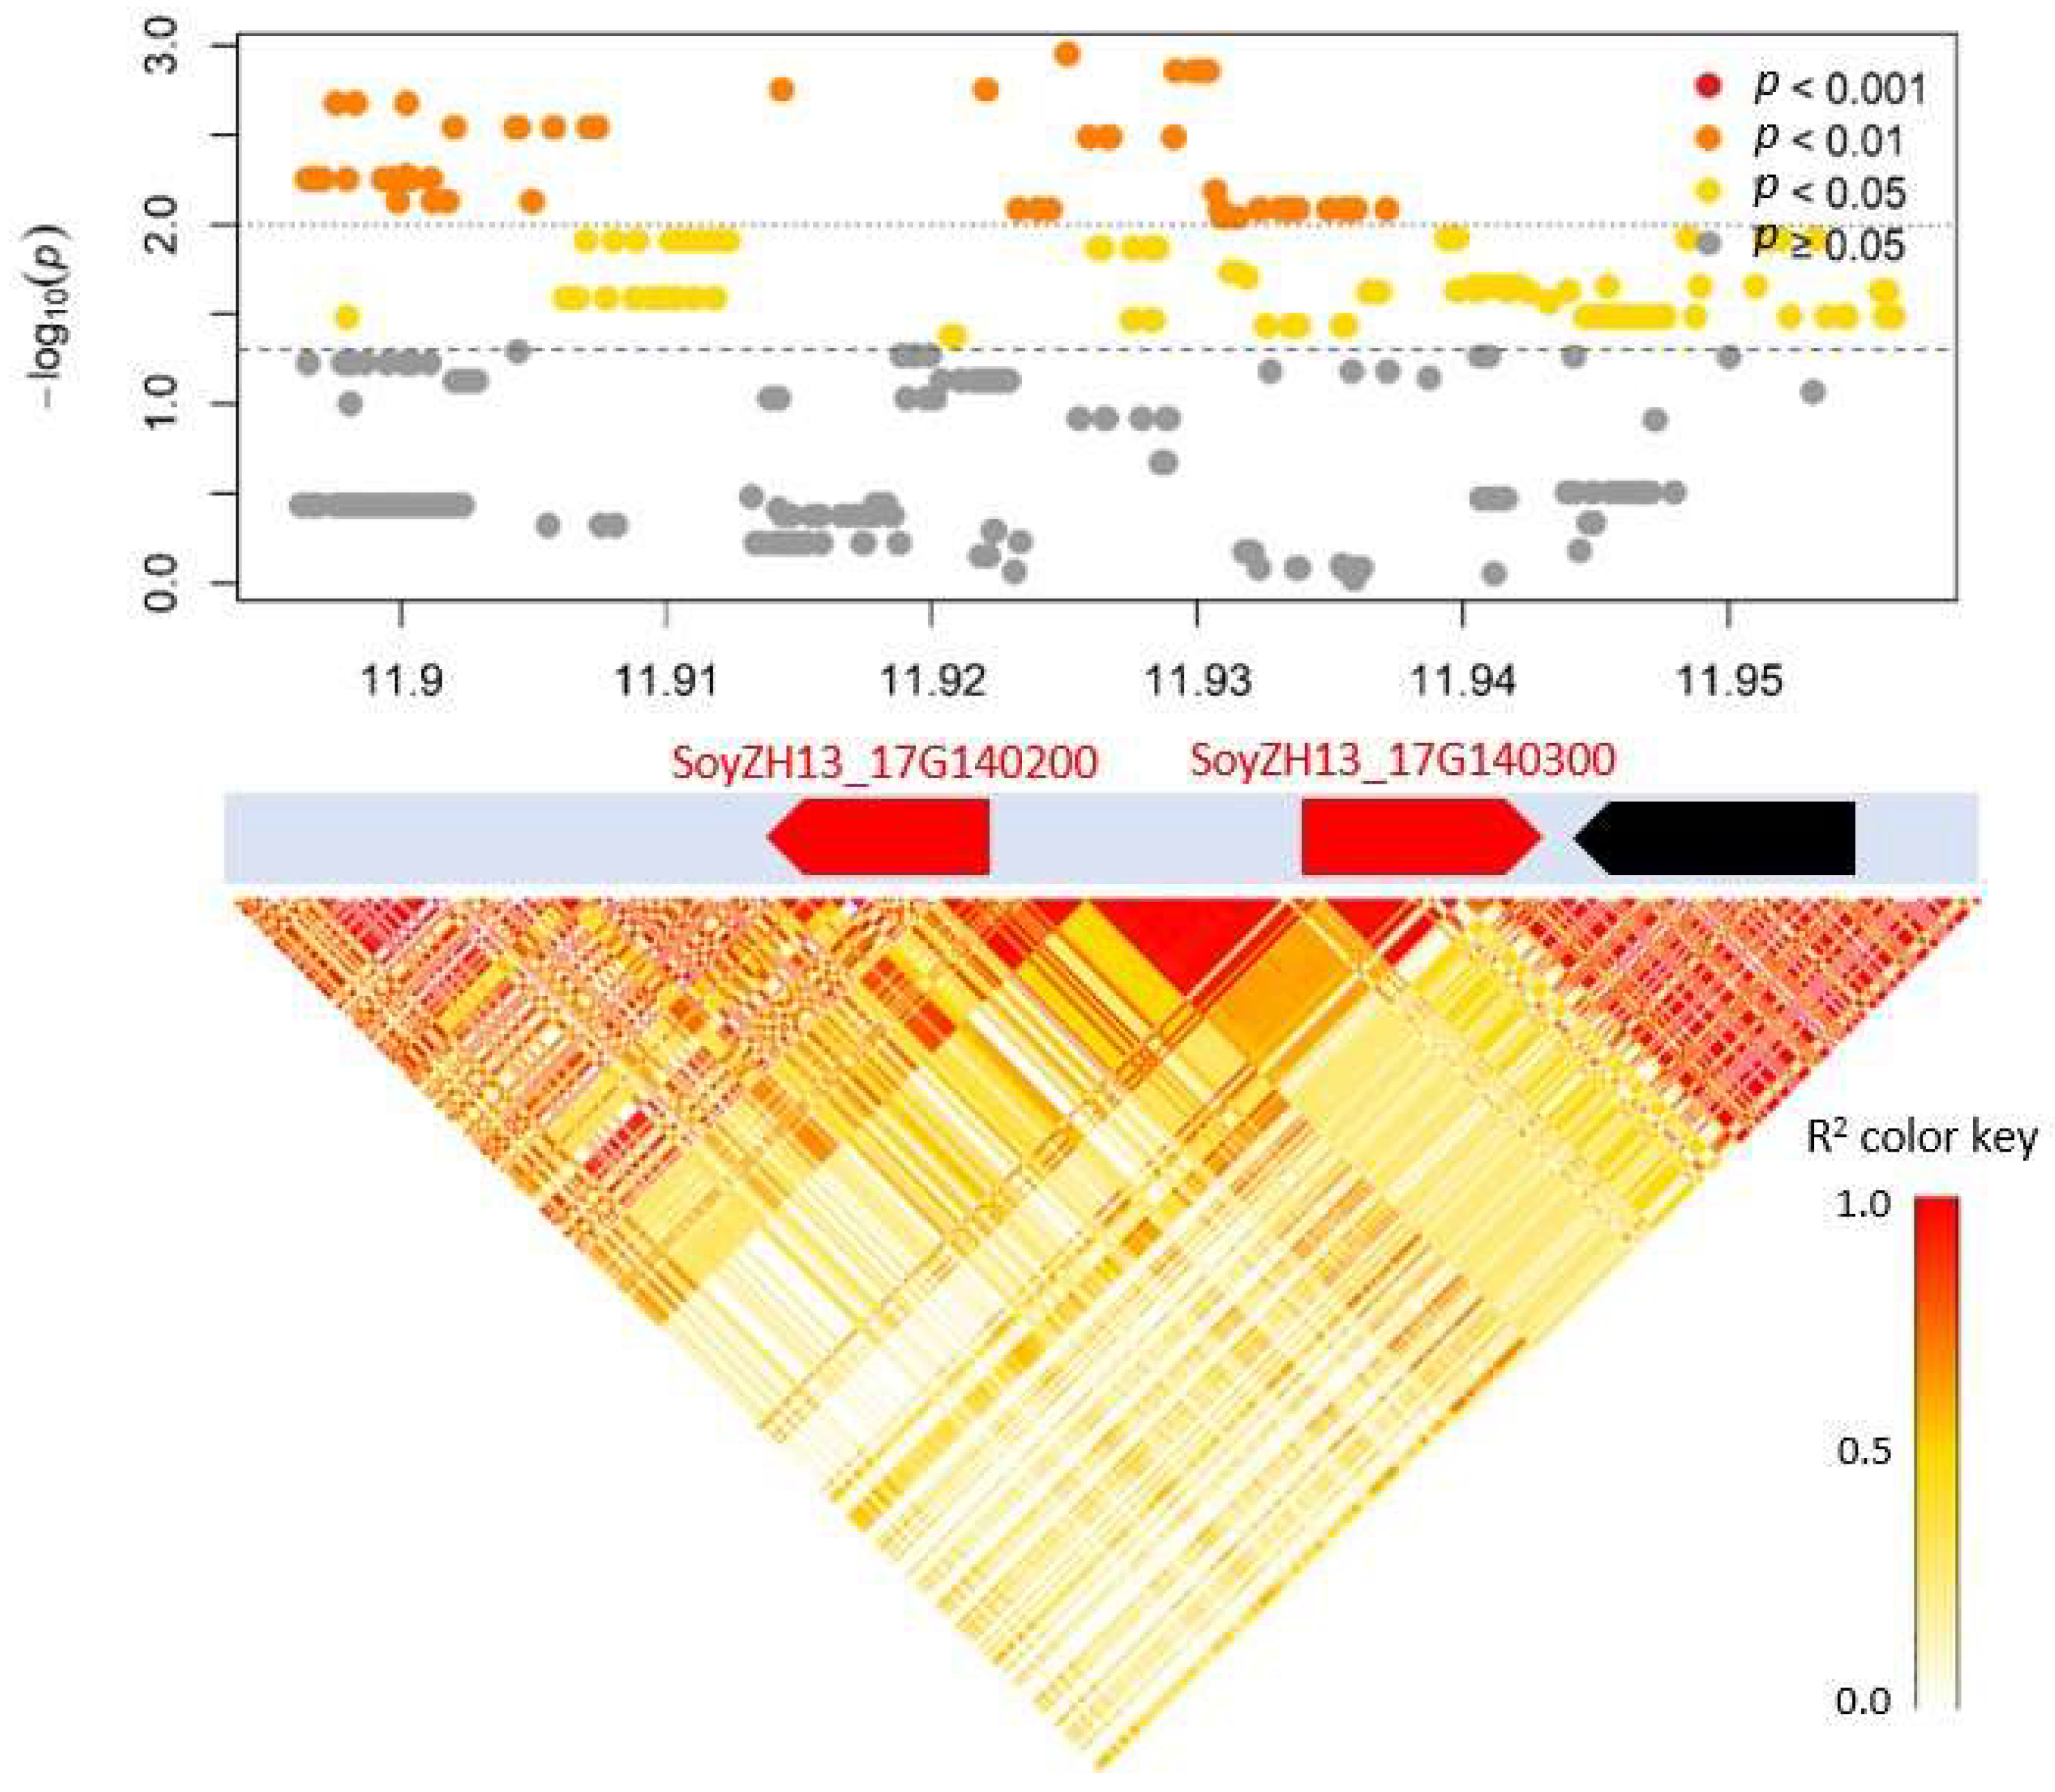
| PH_r_shade.17.2 | Block_17_11907536_11926235 | 17 | 2.2 × 10⁻⁷ | 7 | 134 | 5.12 | 4.4 | SoyZH13_17G140200 | Glyma.17G145300 | Ethylene-responsive transcription factor 5 | |
| SoyZH13_17G140300 | Glyma.17G145400 | Ethylene-responsive transcription factor 1A | |||||||||
| PH_r_shade.17.3 | Block_17_11933118_12033106 | 17 | 1.04 × 10⁻¹⁰ | 11 | 507 | 6.56 | 7.37 | ||||
| PH_r_shade.19.1 | Chr19_478140 | 19 | 9.47 × 10⁻⁵ | 2 | 2 | 3.63 | 1.58 | ||||
| MSL_r | |||||||||||
| MSL_r_shade.3.1 | Block_3_3253737_3254065 | 3 | 1.38 × 10⁻¹⁰ | 4 | 5 | 7.34 | 6.36 | ||||
| MSL_r_shade.4.1 | Block_4_45771799_45788317 | 4 | 1.10 × 10⁻¹² | 3 | 147 | 8.57 | 7.21 | ||||
| MSL_r_shade.8.1 | Block_8_15201156_15201636 | 8 | 2.33 × 10⁻⁵ | 3 | 3 | 4.20 | 2.71 | ||||
| MSL_r_shade.11.1 | Block_11_4331465_4356051 | 11 | 5.16 × 10⁻⁹ | 6 | 62 | 6.86 | 6.12 | ||||
| MSL_r_shade.12.1 | Chr12_1168266 | 12 | 9.72 × 10⁻⁷ | 2 | 2 | 5.35 | 3.05 | ||||
| MSL_r_shade.16.1 | Chr16_34243799 | 16 | 0.000268 | 2 | 2 | 3.42 | 1.68 | ||||
| MSL_r_shade.17.1 | Block_17_11907536_11926235 | 17 | 5.3 × 10⁻⁹ | 7 | 134 | 5.12 | 4.4 | SoyZH13_17G140200 | Glyma.17G145300 | Ethylene-responsive transcription factor 5 | |
| SoyZH13_17G140300 | Glyma.17G145400 | Ethylene-responsive transcription factor 1A | |||||||||
| MSL_r_shade.18.1 | Chr18_55533676 | 18 | 0.000368 | 2 | 2 | 3.35 | 1.60 | SoyZH13_18G217700 | Glyma.18G246000 | Transcription factor bHLH25 | |
| MSL_r_shade.19.1 | Block_19_476384_476514 | 19 | 5.79 × 10⁻⁵ | 3 | 4 | 3.95 | 2.47 | ||||
| MSL_r_shade.20.1 | Block_20_1172558_1173696 | 20 | 0.00082 | 7 | 10 | 3.09 | 2.90 | SoyZH13_20G012300 | Glyma.20G013200 | U-box domain-containing protein 10 | |
| HL_r | |||||||||||
| HL_r_shade.1.1 | Block_1_55630414_55715065 | 1 | 4.04 × 10⁻¹¹ | 11 | 224 | 8.09 | 10.38 | ||||
| HL_r_shade.7.1 | Block_7_6887632_6888597 | 7 | 4.32 × 10⁻⁵ | 3 | 13 | 4.36 | 2.86 | ||||
| HL_r_shade.7.2 | Block_7_27001385_27047263 | 7 | 6.66 × 10⁻⁶ | 7 | 44 | 4.97 | 4.88 | ||||
| HL_r_shade.10.1 | Block_10_8406436_8478177 | 10 | 1.21 × 10⁻⁶ | 9 | 370 | 5.10 | 6.10 | ||||
| HL_r_shade.13.1 | Block_13_35550086_35550267 | 13 | 5.67 × 10⁻⁶ | 2 | 2 | 4.89 | 2.93 | SoyZH13_13G214700 | Glyma.13G236500 | Ethylene-responsive transcription factor 9 | |
| HL_r_shade.20.1 | Chr20_18734811 | 20 | 1.36 × 10⁻⁶ | 2 | 2 | 5.07 | 3.33 | ||||
Disclaimer/Publisher’s Note: The statements, opinions and data contained in all publications are solely those of the individual author(s) and contributor(s) and not of MDPI and/or the editor(s). MDPI and/or the editor(s) disclaim responsibility for any injury to people or property resulting from any ideas, methods, instructions or products referred to in the content. |
© 2025 by the authors. Licensee MDPI, Basel, Switzerland. This article is an open access article distributed under the terms and conditions of the Creative Commons Attribution (CC BY) license (https://creativecommons.org/licenses/by/4.0/).
Share and Cite
Hu, L.; Arshad, K.; Zheng, M.; Ou, R.; Song, Y.; Xie, M.; Wei, Y.; Ling, L.; Zeng, W.; Zhang, J. Genome-Wide Dissection of Shade Tolerance in Soybean at Seedling Stage. Agronomy 2025, 15, 1382. https://doi.org/10.3390/agronomy15061382
Hu L, Arshad K, Zheng M, Ou R, Song Y, Xie M, Wei Y, Ling L, Zeng W, Zhang J. Genome-Wide Dissection of Shade Tolerance in Soybean at Seedling Stage. Agronomy. 2025; 15(6):1382. https://doi.org/10.3390/agronomy15061382
Chicago/Turabian StyleHu, Linfang, Kamran Arshad, Meiying Zheng, Ran Ou, Yinmeng Song, Mengyan Xie, Yazhi Wei, Luyi Ling, Weiying Zeng, and Jiaoping Zhang. 2025. "Genome-Wide Dissection of Shade Tolerance in Soybean at Seedling Stage" Agronomy 15, no. 6: 1382. https://doi.org/10.3390/agronomy15061382
APA StyleHu, L., Arshad, K., Zheng, M., Ou, R., Song, Y., Xie, M., Wei, Y., Ling, L., Zeng, W., & Zhang, J. (2025). Genome-Wide Dissection of Shade Tolerance in Soybean at Seedling Stage. Agronomy, 15(6), 1382. https://doi.org/10.3390/agronomy15061382