Article

Modulation of Potassium-to-Calcium Ratio in Nutrient Solution Improves Quality Attributes and Mineral Composition of Solanum lycopersicum var. cerasiforme

College of Horticulture, Shanxi Agricultural University, Taigu, Jinzhong 030801, China
*
Author to whom correspondence should be addressed.
Agronomy 2025, 15(6), 1380; https://doi.org/10.3390/agronomy15061380
Submission received: 8 May 2025 / Revised: 30 May 2025 / Accepted: 3 June 2025 / Published: 4 June 2025
(This article belongs to the Section Soil and Plant Nutrition)

Abstract

This study investigates the impact of dynamically adjusting the potassium-to-calcium ratio (molar ratio) in nutrient solutions used on cherry tomatoes at different growth stages (seedling, flowering and fruit setting, and maturity) to enhance fruit appearance, nutritional quality, and mineral content. By focusing on the ‘Saopolo’ variety, 17 treatments were implemented, each involving a specific potassium-to-calcium ratio in the nutrient solutions applied during the seedling, flowering and fruit setting, and fruiting stages. The aim was to optimize the nutrient solution formula and enhance fruit quality. Fruit quality parameters were assessed at the initial maturity stage across various treatments, encompassing commodity quality (fruit stalk length, fruit shape index, and fruit hardness), taste quality (total soluble sugar, titratable acid content, and sugar-acid ratio), nutritional quality (vitamin C (Vc), soluble protein, and lycopene content), antioxidant quality (total phenol and flavonoid content), as well as comprehensive quality (soluble solids content). Principal component analysis was conducted on these parameters. Additionally, mineral element levels in fruits were analyzed at different developmental stages (white ripe, color transition, and mature stages). When tomato plants were treated with nutrient solutions containing varying potassium-to-calcium ratios at different growth stages, observations revealed distinct outcomes in the first fruit cluster. T15 (seedling stage (A): 0.5 times standard nutrient solution; flowering and fruit-setting stage (B): potassium-to-calcium = 1.6:1; fruiting stage (C): potassium-to-calcium = 2.1:1) exhibited the highest fruit firmness (1.54 kg·cm−2), while T14 (A; B (K:Ca = 1.6:1); C (K:Ca = 2.0:1)) elevated levels of total soluble sugars (6.59%), titratable acidity (0.74%), soluble proteins (2.79 mg·g−1), and total phenolics (2.56 mg·g−1). T13 (A; B (K:Ca = 1.6:1); C (K:Ca = 1.9:1)) demonstrated superior soluble solids (5.9%), lycopene (32.09 µg·g−1), and flavonoid contents (0.77 mg·g−1), whereas T12 (A; B (K:Ca = 1.6:1); C (K:Ca = 1.8:1)) showcased the highest sugar–acid ratio (12.63) and soluble solids content (5.9%). Notably, T8 (A; B (K:Ca = 1.5: 1); C (K:Ca = 1.9:1)) exhibited the highest Vc content (10.03 mg·100 g−1). Mineral element analysis indicated that an increased potassium-to-calcium ratio in the nutrient solution during various growth stages enhanced phosphorus and potassium uptake by the fruits but hindered the absorption of nitrogen, calcium, magnesium, and iron. In summary, employing half the standard nutrient solution dosage during the seedling stage, utilizing a potassium-to-calcium ratio of 1.6:1 in the nutrient solution at the flowering and fruit setting stage, and applying nutrient solution T13 with a potassium-to-calcium ratio of 1.9:1 during the fruit-bearing phase, optimally coordinates fruit nutrient accrual and enhances flavor quality. These findings support the use of stage-specific nutrient modulation to improve cherry tomato quality in controlled-environment agriculture.

1. Introduction

Tomato (Solanum lycopersicum L.) is one of the most widely cultivated vegetable crops in the world, and consumer demand for fruits with high nutritional value is increasing. China is a leading country in tomato cultivation and production worldwide. With the change in consumer demand, the goal of agricultural tomato production has gradually shifted from simply pursuing high yield to focusing on fruit commerciality and quality [1]. Additionally, cherry tomato (Solanum lycopersicum var.) stands out with distinct advantages amid the array of tomato varieties. Compared with other tomato varieties, cherry tomatoes exhibit a shorter growth cycle, facilitating quicker completion of growth stages and earlier harvesting. This shortened growth period contributes to an extended supply window, ensuring sustained market availability [2]. It is classified among the “four priority fruits” recommended by the United Nations Food and Agriculture Organization (FAO) for global promotion [3]. The total planted area of cherry tomatoes in China is estimated at 150,000 hectares (15 × 104 hm2) [4]. Cherry tomatoes (Solanum lycopersicum var.) are rich in vitamins, minerals, and amino acids. Notably, they exhibit multiple functional properties including heat-clearing and detoxification effects, skin beautification benefits, hypotensive activity, and potential anti-cancer effects. These health-promoting characteristics are primarily attributed to their bioactive compounds such as Vc and lycopene [5]. Recent studies have demonstrated that greenhouse tomato cultivation yields 1.5–2.0 times higher economic returns compared to open-field production. Notably, specialty varieties including flavor-enhanced tomatoes and cherry tomatoes command premium market prices, typically exceeding those of standard fresh-market beefsteak tomatoes, with peak prices reaching 40 CNY/kg [6,7,8]. Moreover, cherry tomatoes are distinguished by their distinctive sweet and tangy flavor profile, which is highly favored by consumers [9]. To cultivate premium quality and flavorful cherry tomatoes, it is imperative to carefully select appropriate varieties and provide conducive growth conditions while implementing precise water and fertilizer management practices. The impact of nutrient solution concentration and the ratio of nitrogen, phosphorus, and potassium on tomato quality is a crucial factor that cannot be overlooked [10,11]. In the field of protected vegetable cultivation, hydroponic nutrient solutions are being increasingly adopted as a mainstream practice [12]. Potassium (K) is widely recognized as a key quality-determining element that influences tomato fruit quality primarily by modulating the accumulation of sugars and organic acids [13]. Tomatoes are typical calcium-loving vegetables and cannot grow and develop without calcium throughout the entire process, especially during the fruit expansion period when their demand for calcium is the highest [14]. The balance between potassium and calcium is essential to ensure the firmness of the fruit, the accumulation of sugar, and the stability of the cell wall. In recent years, the expansion of controlled environment agriculture driven by advancements in agricultural science and technology has notably increased the yield and economic value of cherry tomatoes. However, certain production regions tended to excessively pursue high yields through the indiscriminate application of chemical fertilizers. This practice not only results in soil compaction and environmental contamination but also has the potential to impact the mineral element accumulation and quality attributes of fruits. Therefore, this study proposes to optimize the potassium-to-calcium ratio in hydroponic nutrient solutions using principal component analysis (PCA). Addressing this issue is crucial for ensuring the high quality and consistent yield of cherry tomatoes in a sustainable manner. While irrigation regimes [15], fertigation [16], salt stress [17], and foliar nutrition [18] have been extensively studied for their influence on tomato quality, the role of the potassium-to-calcium ratio (K:Ca) in nutrient solutions remains underexplored in cherry tomatoes. The response of tomato quality and mineral composition to changes in the potassium-to-calcium ratio is crucial for high-quality and high-yield tomato production.
Therefore, this study aimed to evaluate the effect of dynamic adjustments in the potassium-to-calcium (K:Ca) ratio in nutrient solutions during different phenological stages of cherry tomato plants on fruit quality and mineral composition. The research results will help optimize the nutrient management strategy for cherry tomatoes in facility environments.

2. Materials and Methods

2.1. Experimental Material

The cherry tomato variety tested was ‘Saopolo’ (GAUTIER, Le Boupère, France). The fertilizers incorporated into the nutrient solution formulation were sourced from Shanxi Jinlan Chemical Co., Lüliang, China. Earthworm castings were produced by the Zihongkou Agricultural and Animal Husbandry Cooperative in Qi County (Jinzhong), Shanxi Province, China.

2.2. Trial Design

The experimental cultivation of cherry tomatoes will take place in the solar greenhouse at the Horticultural Station of Shanxi Agricultural University (37.42° N, 112.58° E) from 8 October 2023 to 15 March 2024. The greenhouse covering material is polyethylene (PE). The greenhouse is equipped with effective ventilation, temperature regulation, and humidity control systems, maintaining an average daily temperature range of 26 ± 5 °C during the day and 18 ± 5 °C at night, with humidity levels maintained between 50~70%. The soil in the experimental field exhibits the following physical and chemical properties and basic nutrients: pH 7.28, EC 1082 µs·cm−1, soil bulk density 1.69 g·cm−3, porosity 36.23%, total nitrogen 0.75 g·kg−1, available nitrogen 434 mg·kg−1, total phosphorus 1.62 g·kg−1, available phosphorus 151.43 mg·kg−1, and available potassium 6.7 mg·kg−1.
High-ridge cultivation method was implemented, with each treatment receiving 20 kg of earthworm manure as basal fertilizer before planting. The physical and chemical properties of the earthworm manure (on a dry basis) were determined as follows: pH 7.10, water content 53.3%, organic matter 53.6%, total nitrogen 1.8%, phosphorus (P2O5) 2.3%, and potassium (K2O) 1.6%.
Standard cultivation practices were maintained, and a total of 17 treatments were established in the experiment. Each treatment consisted of 12 plants per 4.7 m2 plot, with three replicates. The experiment consisted of two control groups (CK1: standard nutrient solution control and CK2: clear water control). The treatments were designed based on the seedling stage (A), three potassium-to-calcium molar ratios at the flowering and fruit-setting stage (B), and five potassium-to-calcium molar ratios at the fruiting stage (C). The experimental treatments are shown in Table 1.

2.3. Experimental Nutrient Solution Formula

The composition of the nutrient solution was adapted from the standard greenhouse fertigation formula, originally developed for soilless systems, and applied here to soil cultivation in a controlled environment. This experiment was based on this formula, maintaining a molar ratio of potassium-to-calcium elements at 1.9:1 (molar ratio), while other element ratios remained unchanged. Calcium nitrate tetrahydrate was utilized to adjust the potassium-to-calcium ratio in the nutrient solution. pH adjustments were made using a 0.1 mol·L−1 solution of sodium hydroxide (NaOH) and acetic acid (CH3COOH). The drip irrigation formula from the Netherlands Greenhouse Research Institute for rock wool cultivation includes: calcium nitrate tetrahydrate (Ca (NO3)2·4H2O) 886 mg·L−1, potassium nitrate (KNO3) 303 mg·L−1, potassium dihydrogen phosphate (KH2PO4) 204 mg·L−1, ammonium sulfate ((NH4)2SO4) 33 mg·L−1, potassium sulfate (K2SO4) 218 mg·L−1, and magnesium sulfate heptahydrate (MgSO4·7H2O)247 mg·L−1. The trace element formula comprises: EDTA-2NaFe 20 mg·L−1, boric acid 2.86 (H3BO3) mg·L−1, manganese sulfate tetrahydrate (MnSO4·4H2O) 2.13 mg·L−1, zinc sulfate heptahydrate (ZnSO4·7H2O) 0.22 mg·L−1, copper sulfate pentahydrate (CuSO4·5H2O) 0.08 mg·L−1, and ammonium molybdate tetrahydrate ((NH4)6Mo7O24·4H2O) 0.02 mg·L−1.

2.4. Cultivation Management Practices

During the seedling stage (from 8 October to 18 November 2023), watering was conducted using 0.5 times the standard nutrient solution dosage. The volume of nutrient solution applied was adjusted based on plant growth and prevailing weather conditions. In the flowering and fruit setting period (19 November to 20 December 2023), nutrient solution was administered every 4 days at 500 mL per plant, gradually increasing to 1000 mL per plant as the first batch of fruits began to develop. Throughout the fruiting period (from 21 December 2023 to 28 February 2024), watering was scheduled every 4 days, with 1500 mL per plant. Topping treatments were implemented after the fourth harvest, and no watering occurred for each treatment during the 10 days preceding seedling removal. Watering activities were standardized for sunny mornings, with no watering conducted on days with rainy or snowy weather conditions throughout the management procedures.

2.5. Measurement of Fruit Quality Parameters

2.5.1. Determination of Fruit Quality Indicators

During the ripening period of the initial fruit cluster in each treatment, random fruit samples were collected, beaten, and combined for quality assessment.
Fruit commodity quality: (Appearance quality) The fruit stalk length, fruit length, and width were measured using a vernier caliper with a precision of 0.01 mm (fruit shape index = fruit length/fruit width), where the fruit length and width refer to the maximum values of the vertical and horizontal axes of the fruit, respectively. (Physical characteristic quality) Fruit firmness was assessed using a hand-pressure test rack (HPA) with fresh fruits.
Flavor quality: Total soluble sugars were quantified using the anthrone colorimetric method [19], while titratable acidity was determined via acid-base titration [19] (sugar–acid ratio = total soluble sugar/titratable acid).
Nutritional quality: Vc content was assessed using the molybdenum blue colorimetric method [19]; soluble protein content was determined through the Coomassie brilliant blue G-250 method [19]; and lycopene levels were measured using the ethyl acetate extraction method [19].
Antioxidant quality: The total phenol content was determined by the Folinol method [19], while the flavonoid content was determined by the ultrasound-assisted extraction method [19].
Comprehensive quality: Soluble solids are determined by a handheld digital sugar meter (PAL-1).
Principal component analysis was employed to holistically evaluate the influence of tomato fruit quality parameters under irrigation with nutrient solutions featuring varying potassium-to-calcium ratio. A higher comprehensive score indicates superior overall performance across the quality indicators [20].

2.5.2. Determination of Mineral Element Content in Fruits

During the fruiting period of tomatoes, fruit samples were collected at the stages of white ripening, color transition, and full ripening to analyze the levels of total nitrogen (N), phosphorus (P), potassium (K), calcium (Ca), magnesium (Mg), sodium (Na), iron (Fe), and copper (Cu). Among them, the full-effect N, P, and K are determined by boiling with H2SO4-H2O2, with N analyzed using the Kjeldahl method [21] and P assessed using the molybdenum antimony resistance colorimetric method [22]. K, Ca, Mg, Na, Fe, and Cu levels were determined using an atomic absorption spectrometer [23].

2.6. Data Processing and Analysis

All experimental data are expressed as mean ± standard deviation (SD) of three biological replicates. Primary data organization and calculations were performed using Microsoft Excel 2010 (Microsoft, Redmond, MA, USA). Statistical significance was determined by one-way analysis of variance (ANOVA) with Duncan’s multiple comparison test (p < 0.05) using SPSS 23.0 (IBM Corp., Armonk, NY, USA). Data visualization was conducted using both Origin 2021 (OriginLab Corporation, Northampton, MA, USA) and GraphPad Prism 8.0.2 (GraphPad Software, San Diego, CA, USA) for graphical representation.

3. Effect of the Potassium-to-Calcium Ratio on Cherry Tomato Fruit Quality

3.1. Effect of the Potassium-to-Calcium Ratio on Commodity Quality

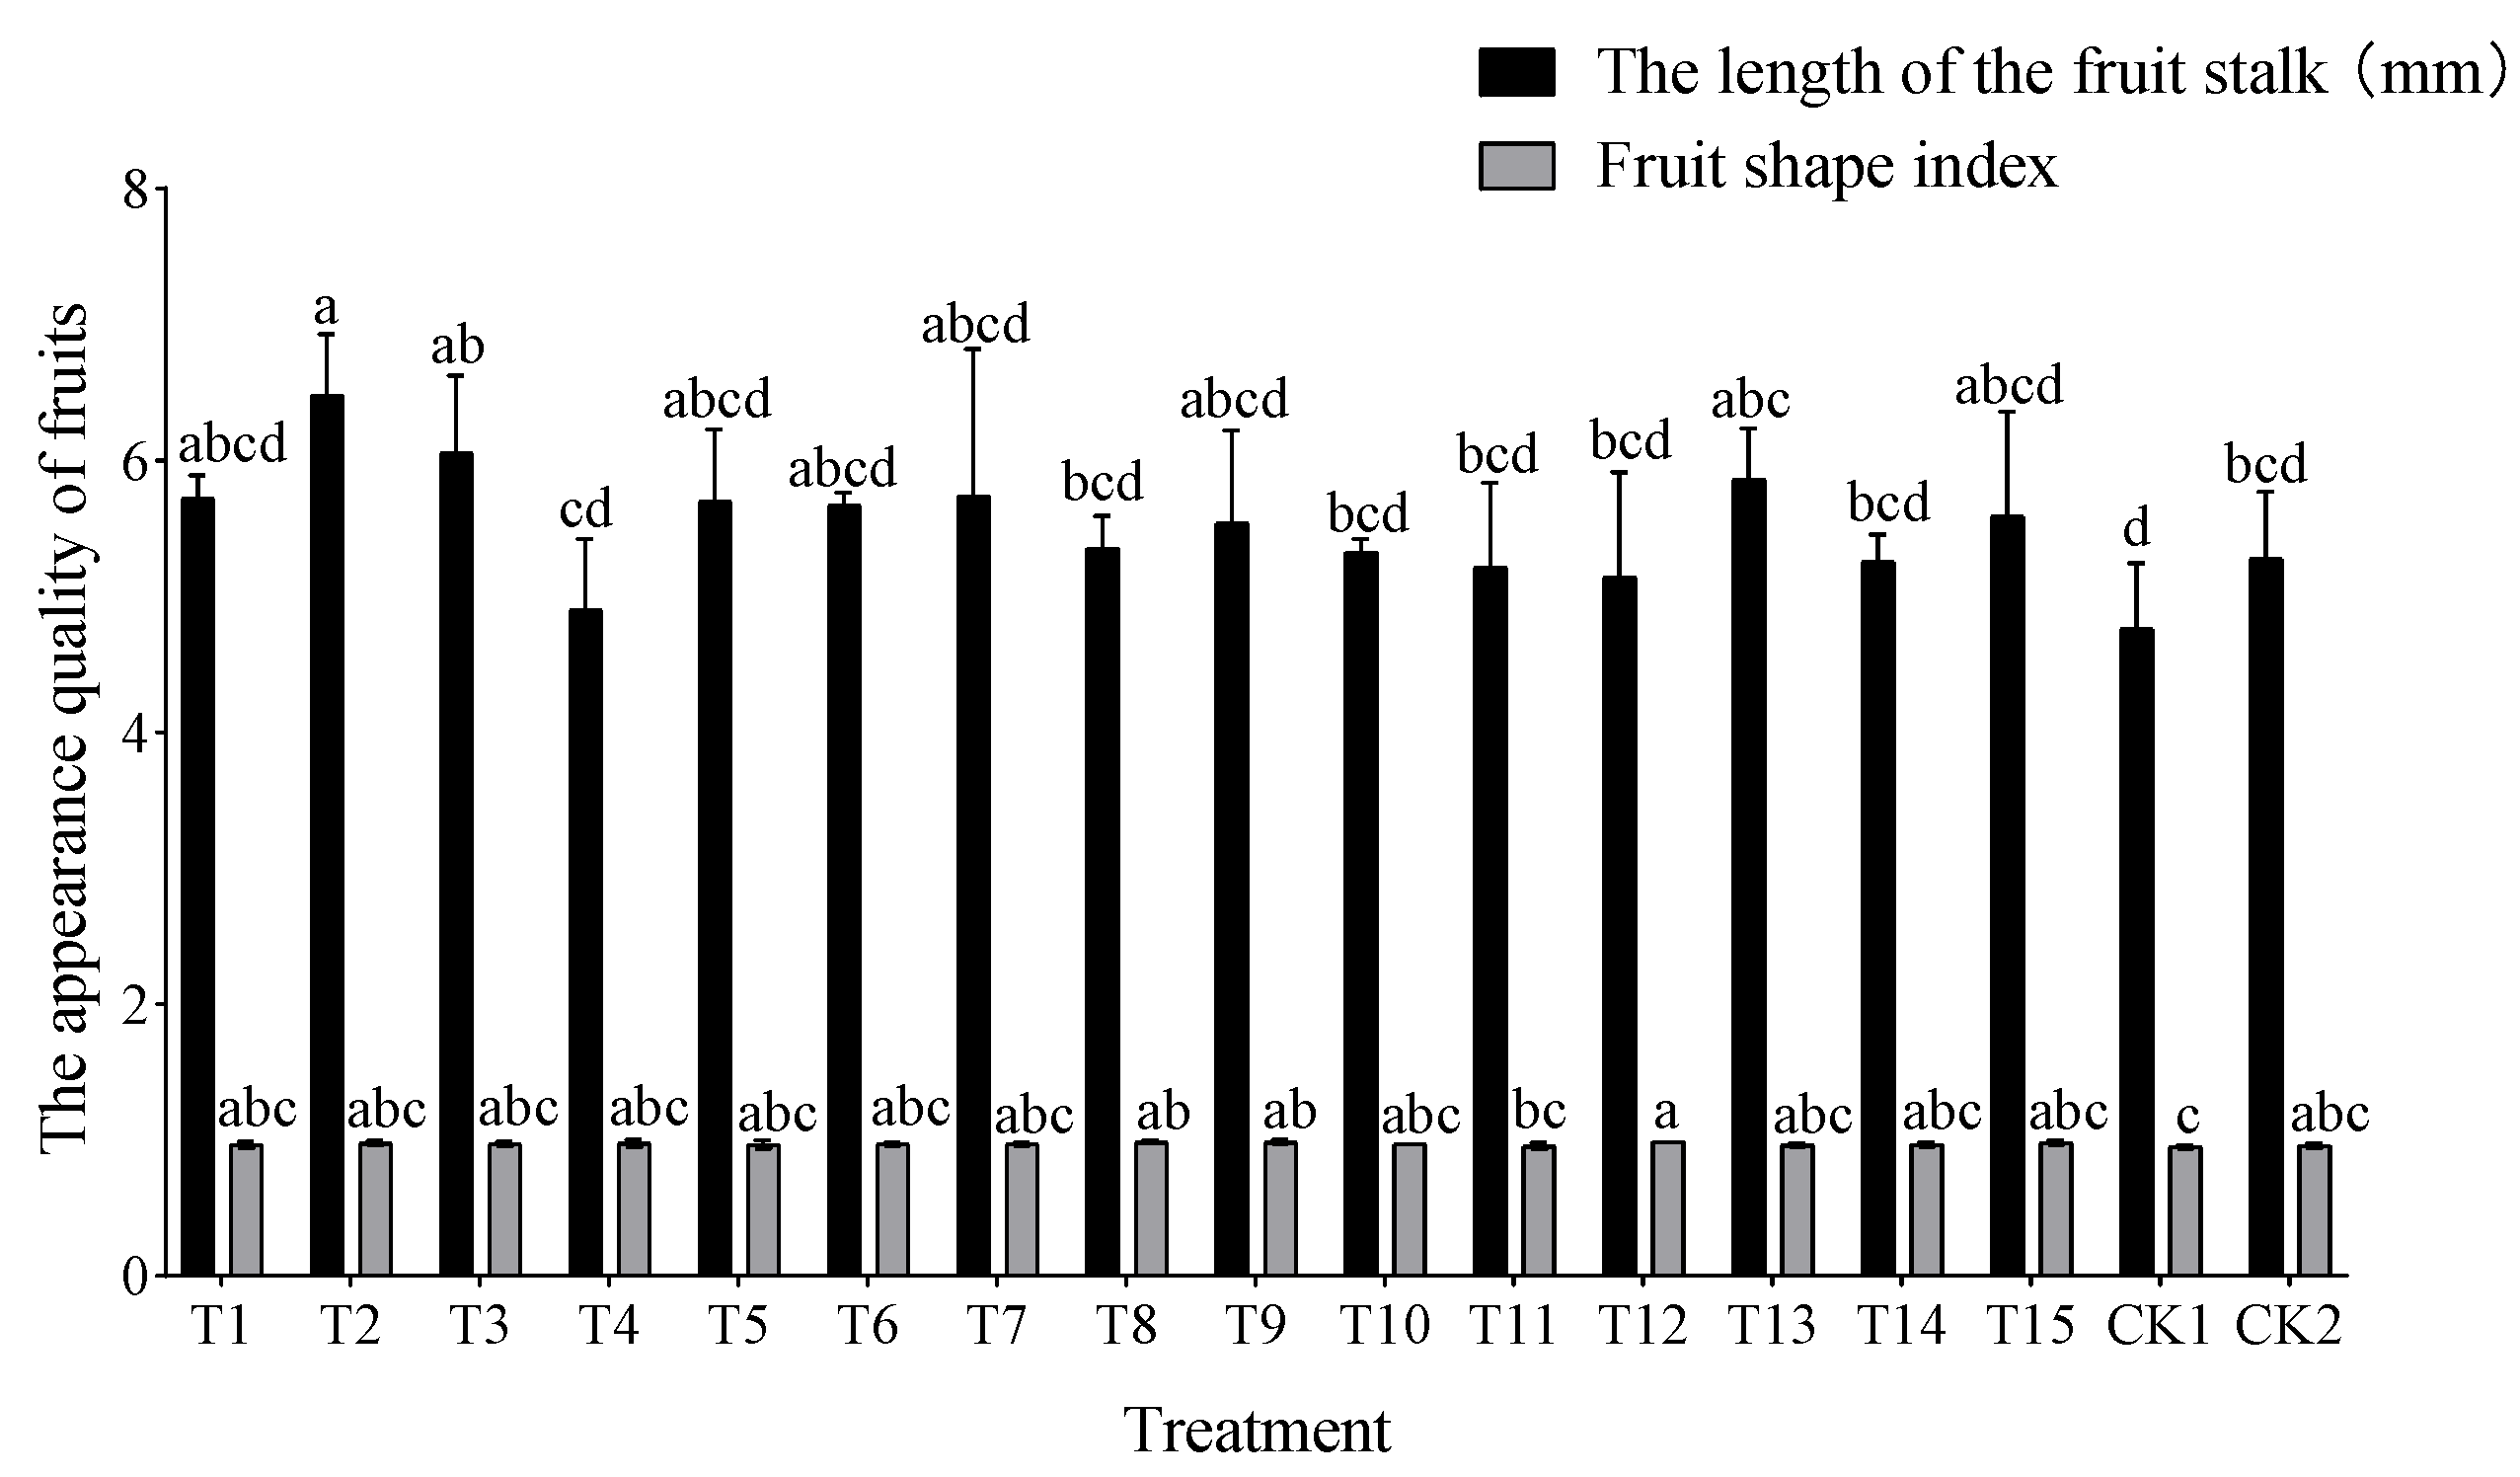
3.1.1. Effect of the Potassium-to-Calcium Ratio on Fruit Appearance Quality

Figure 1 illustrates that in the first fruit cluster, T2 displayed the longest average fruit stalk length at 6.48 mm, while CK1 exhibited the shortest at 4.76 mm, showing a significant difference between the two. T3 ranked second, demonstrating a considerable increase of 27.31% compared to CK1, and 14.77% compared to CK2, with no significant variance observed among the other treatments. Compared with CK1, the fruit shape index of T12 was significantly improved, with a mean value of 0.99, and there was no significant difference among the other treatments. It is evident that the use of nutrient solutions with varying potassium-to-calcium ratio had minimal impact on the fruit shape index.

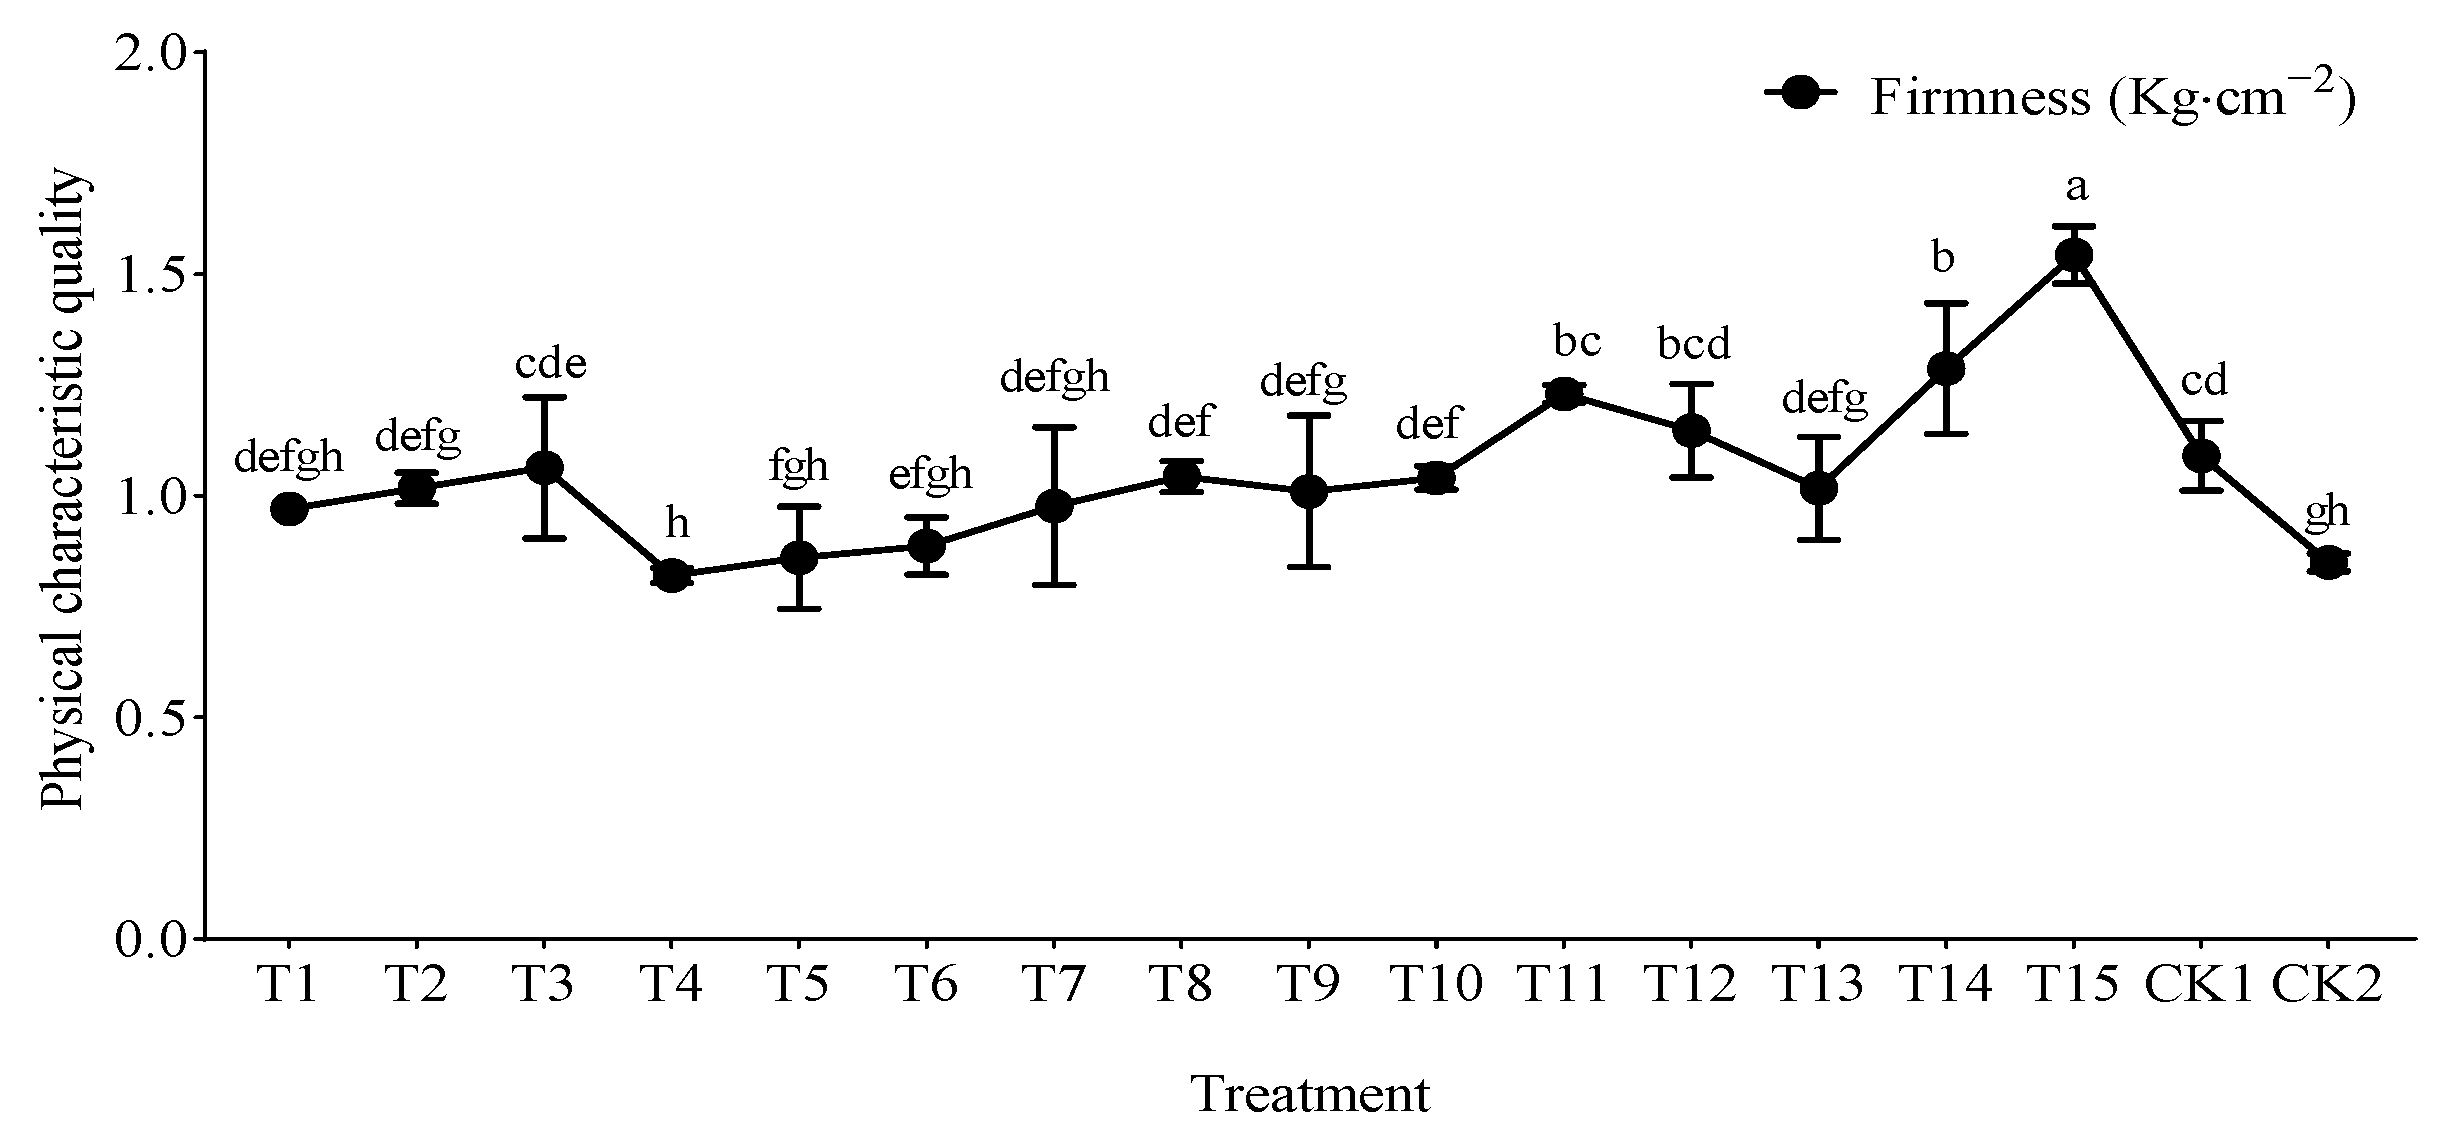
3.1.2. Effect of the Potassium-to-Calcium Ratio on Fruit Physical Characteristic Quality

It can be seen from Figure 2 that compared with CK1 and CK2, the fruit hardness of T15 and T14 has been significantly improved, and the average T15 is 1.54 kg·cm−2. Compared with CK1 and CK2, T14 has significantly increased by 18.35% and 51.76%, respectively.

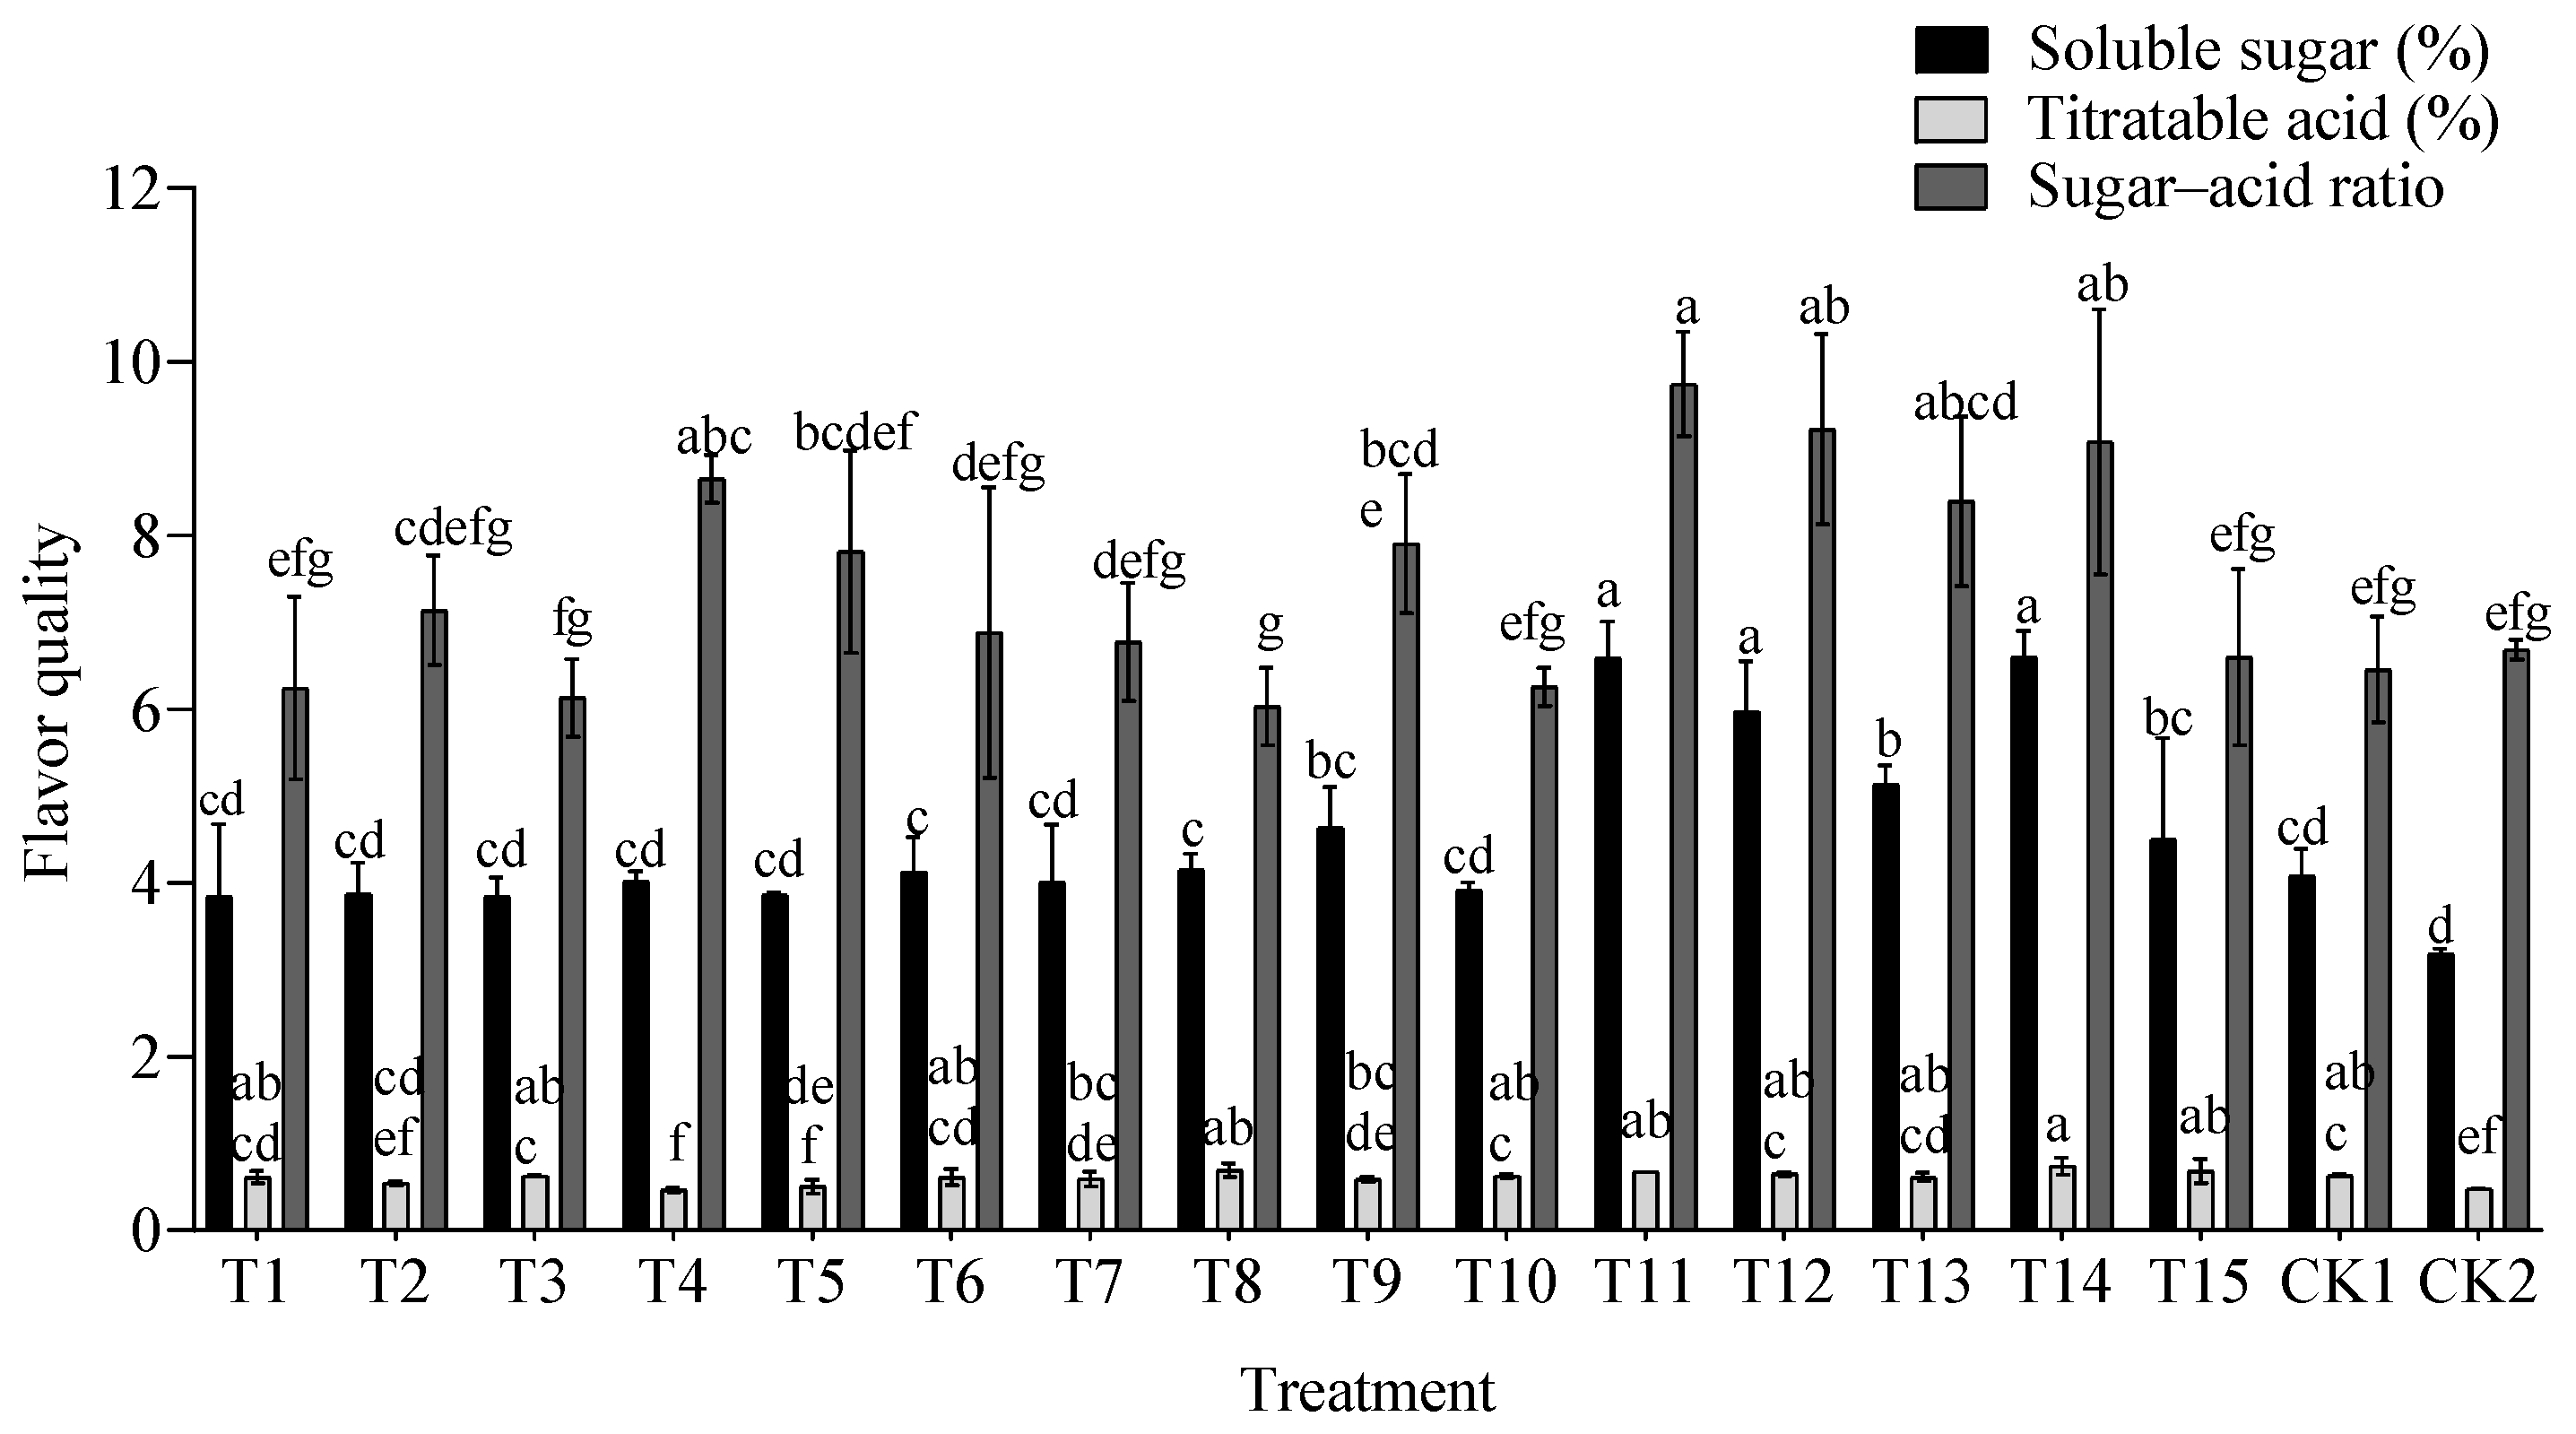
3.2. Effect of the Potassium-to-Calcium Ratio on Fruit Flavor Quality

As shown in Figure 3, T14 showed the highest total soluble sugar content (6.59%), significantly exceeding CK2 (3.19%). T11 ranked second with 61.52% and 106.58% higher levels than CK1 and CK2, respectively. The titratable acid content of T14 was the highest, with an average value of 0.74%. Compared with CK1 and CK2, the titratable acid content significantly increased by 17.46% and 54.17%, respectively. In contrast, the titratable acid content of T4 was significantly lower than that of CK1 and CK2, decreasing by 34.04% and 2.13%, respectively. The sugar–acid ratio analysis revealed T12 with the highest ratio (12.63), significantly greater than T4 (7.47) which was 21.02% below CK1 and 2.81% below CK2. T11 ranked second in the sugar–acid ratio, showing 36.28% and 60.42% increases over CK1 andCK2, respectively.

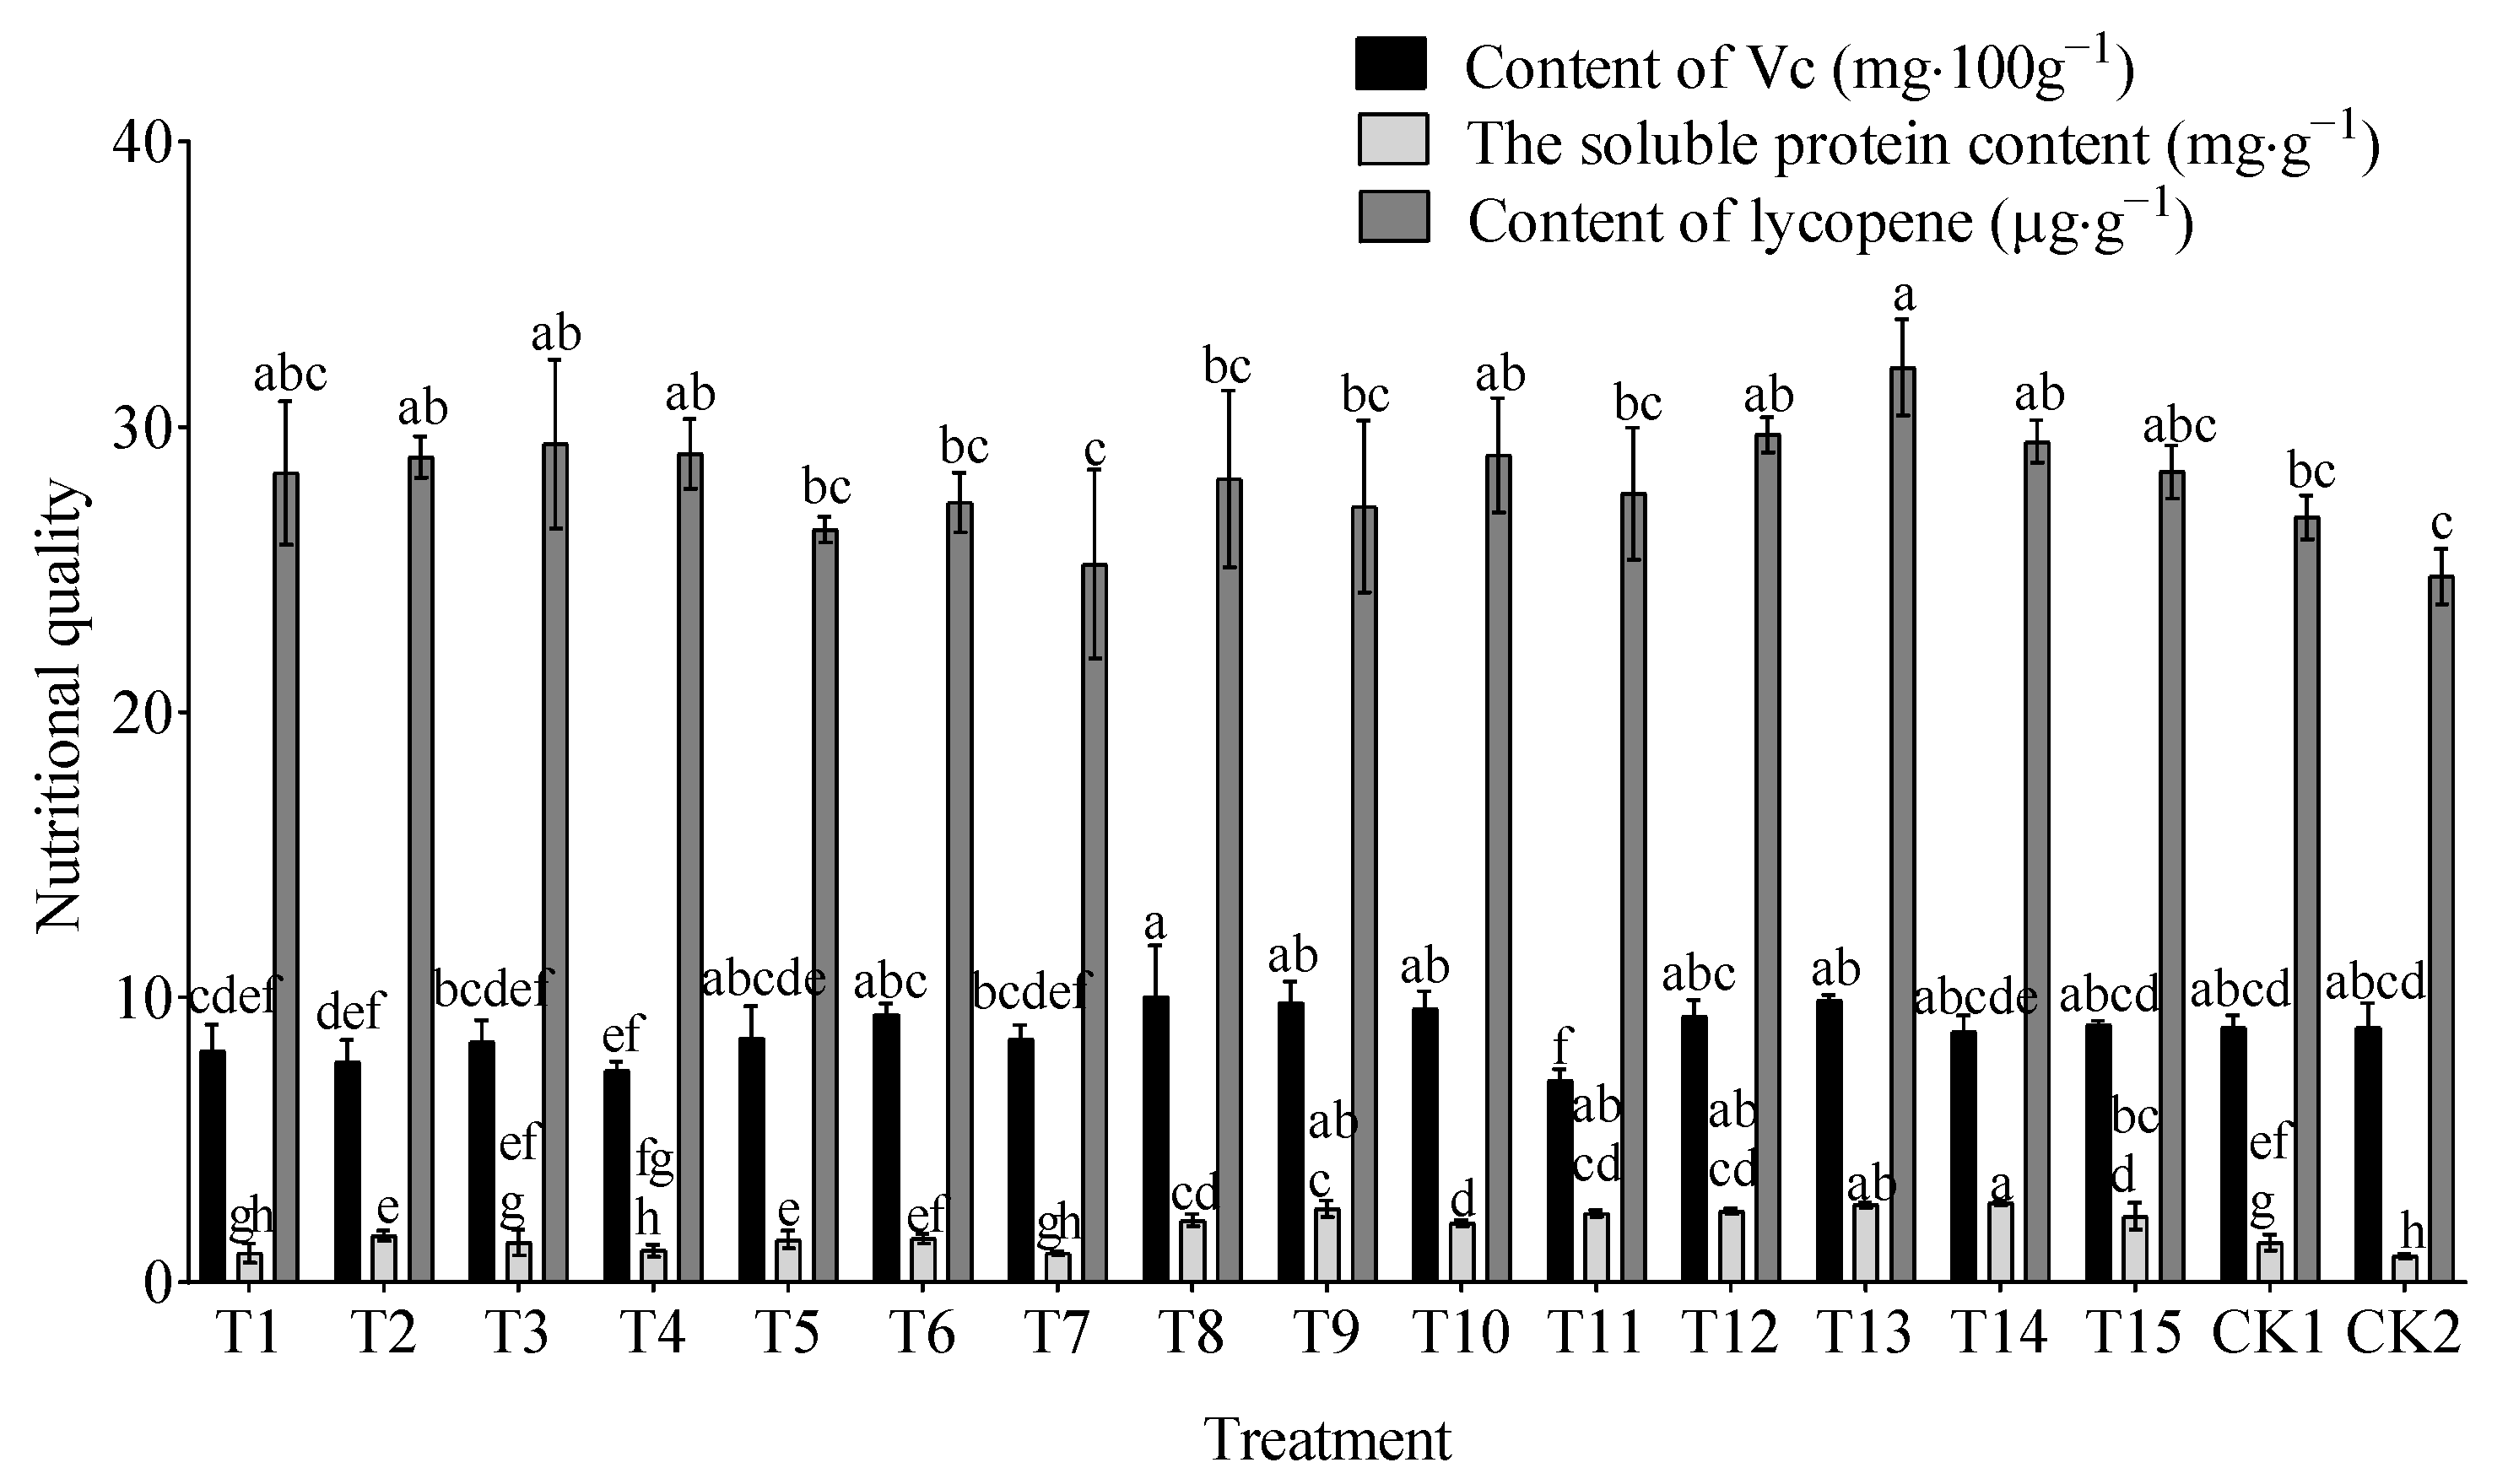
3.3. Effect of the Potassium-to-Calcium Ratio on Fruit Nutritional Quality

Figure 4 illustrates that T8 displayed the highest Vc content, with an average value of 10.03 mg·100 g−1, while T11 exhibited the lowest at 7.06 mg·100 g−1, indicating a significant difference between these two treatments. T11 was notably lower than CK1 and CK2 by 26.77% and 26.49%, respectively, with T13 ranking second, demonstrating an increase of 11.06% and 10.75% compared to CK1 and CK2. Additionally, T14 recorded the highest soluble protein content at an average of 2.79 mg·g−1, while CK2 displayed the lowest at 0.92 mg·g−1, showcasing a significant difference between these two groups. T13 ranked second, exhibiting a substantial increase of 94.29% and 195.65% compared to CK1 and CK2, respectively. Moreover, T13 displayed the highest lycopene content, with a mean value of 32.09 µg·g−1, while CK2 showed the lowest at 24.76 µg·g−1, indicating a significant difference between these two treatments. T12 ranked second, demonstrating an increase of 10.77% compared with CK1 and a significant increase of 20.03% compared with CK2.

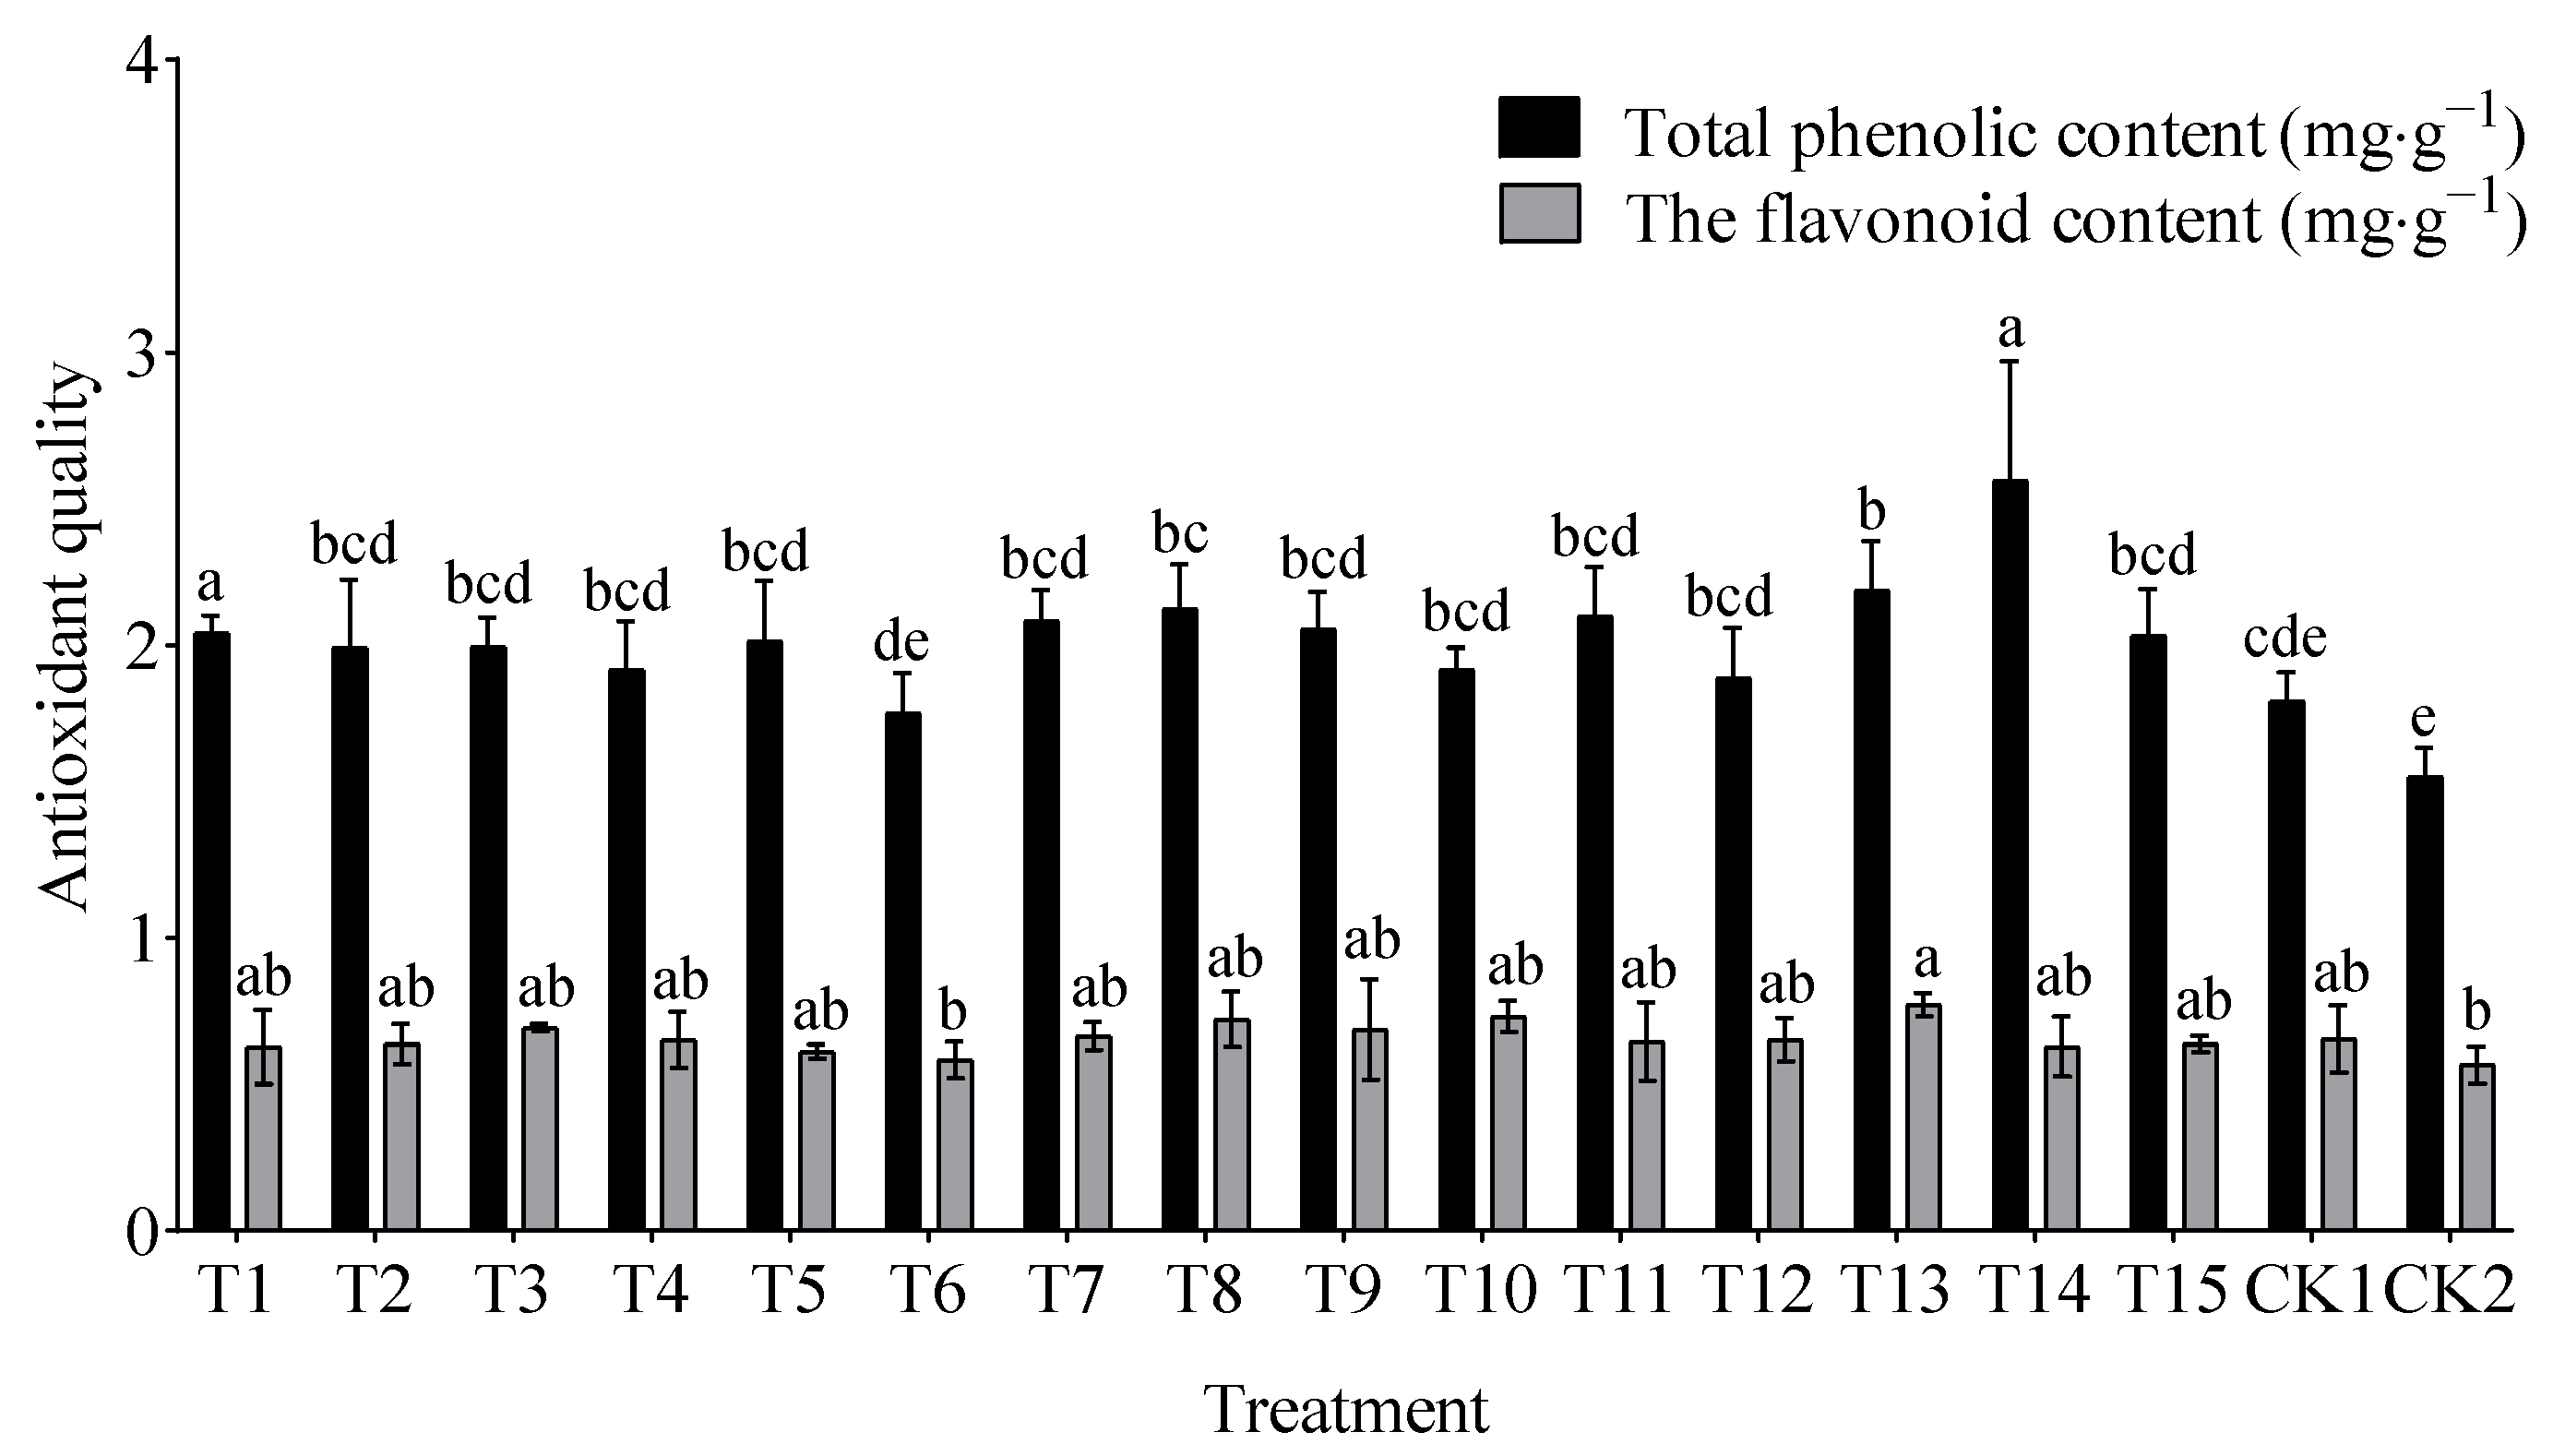
3.4. Effect of the Potassium-to-Calcium Ratio on Fruits Antioxidant Quality

As shown in Figure 5, T14 exhibited the highest total phenol content at 2.56 mg·g−1, which was significantly higher than CK2 (1.55 mg·g−1). T13 ranked second with total phenols 20.99% and 41.29% higher than CK1 and CK2, respectively. For flavonoids, T13 showed the highest content (0.77 mg·g−1), significantly exceeding CK2 (0.57 mg·g−1), while T10 ranked second despite being 10.61% lower than CK1 and 28.07% lower than CK2.

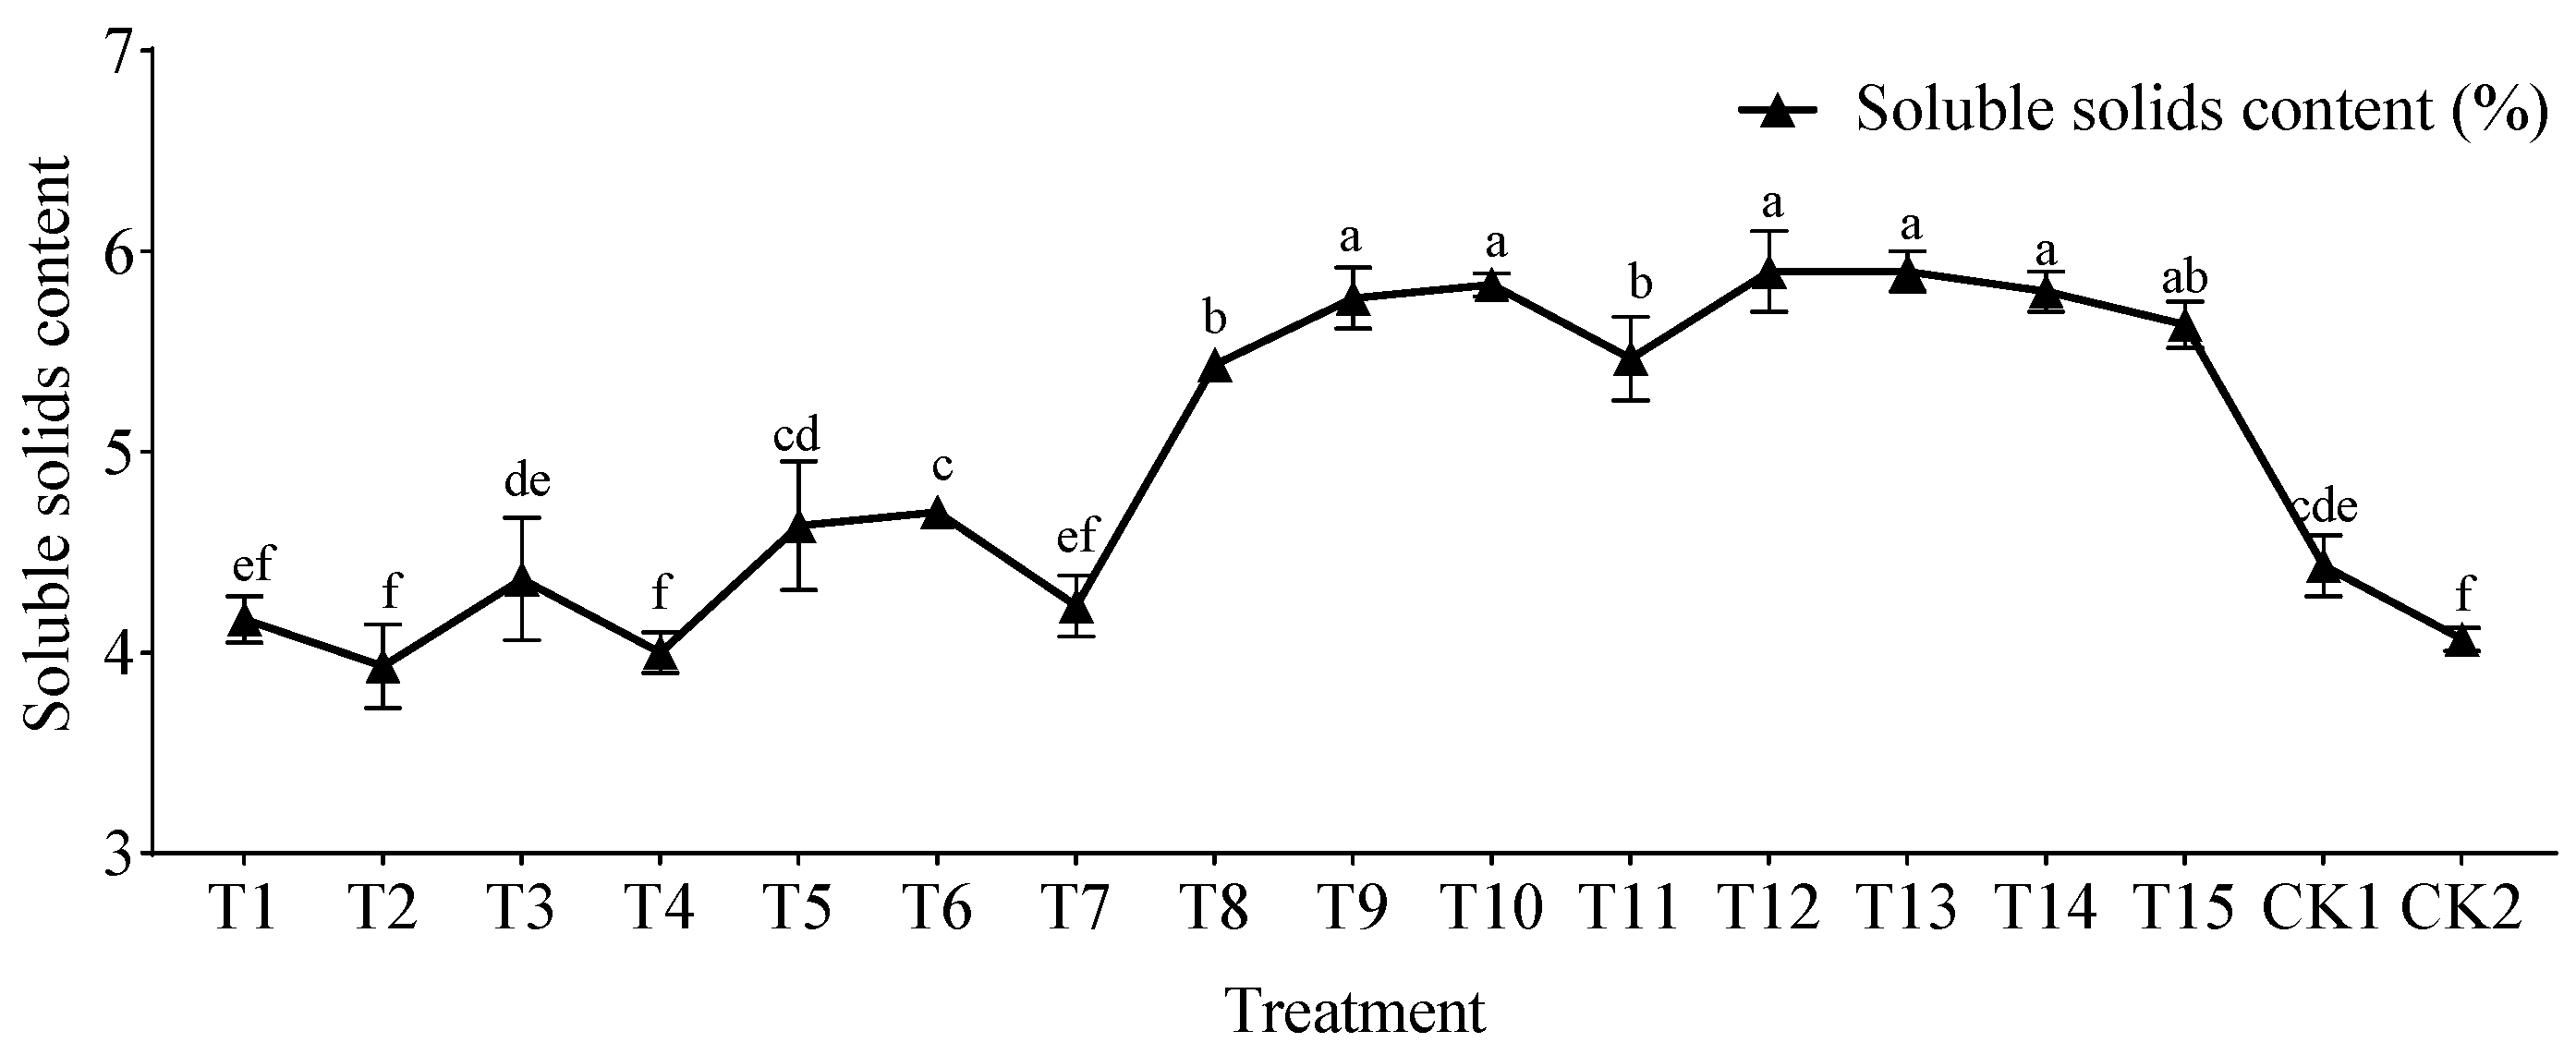
3.5. Effect of the Potassium-to-Calcium Ratio on Fruits Soluble Sugar Content

Figure 6 shows that T12 and T13 exhibited the highest soluble solids content, with an average value of 5.90%, while T2 displayed the lowest at 3.93%, indicating a significant difference between these two treatments. T2 was notably lower than CK1 by 12.72% and 3.56% lower than CK2. T14 ranked second, showing a significant increase of 30.93% compared to CK1 and 42.51% compared to CK2.

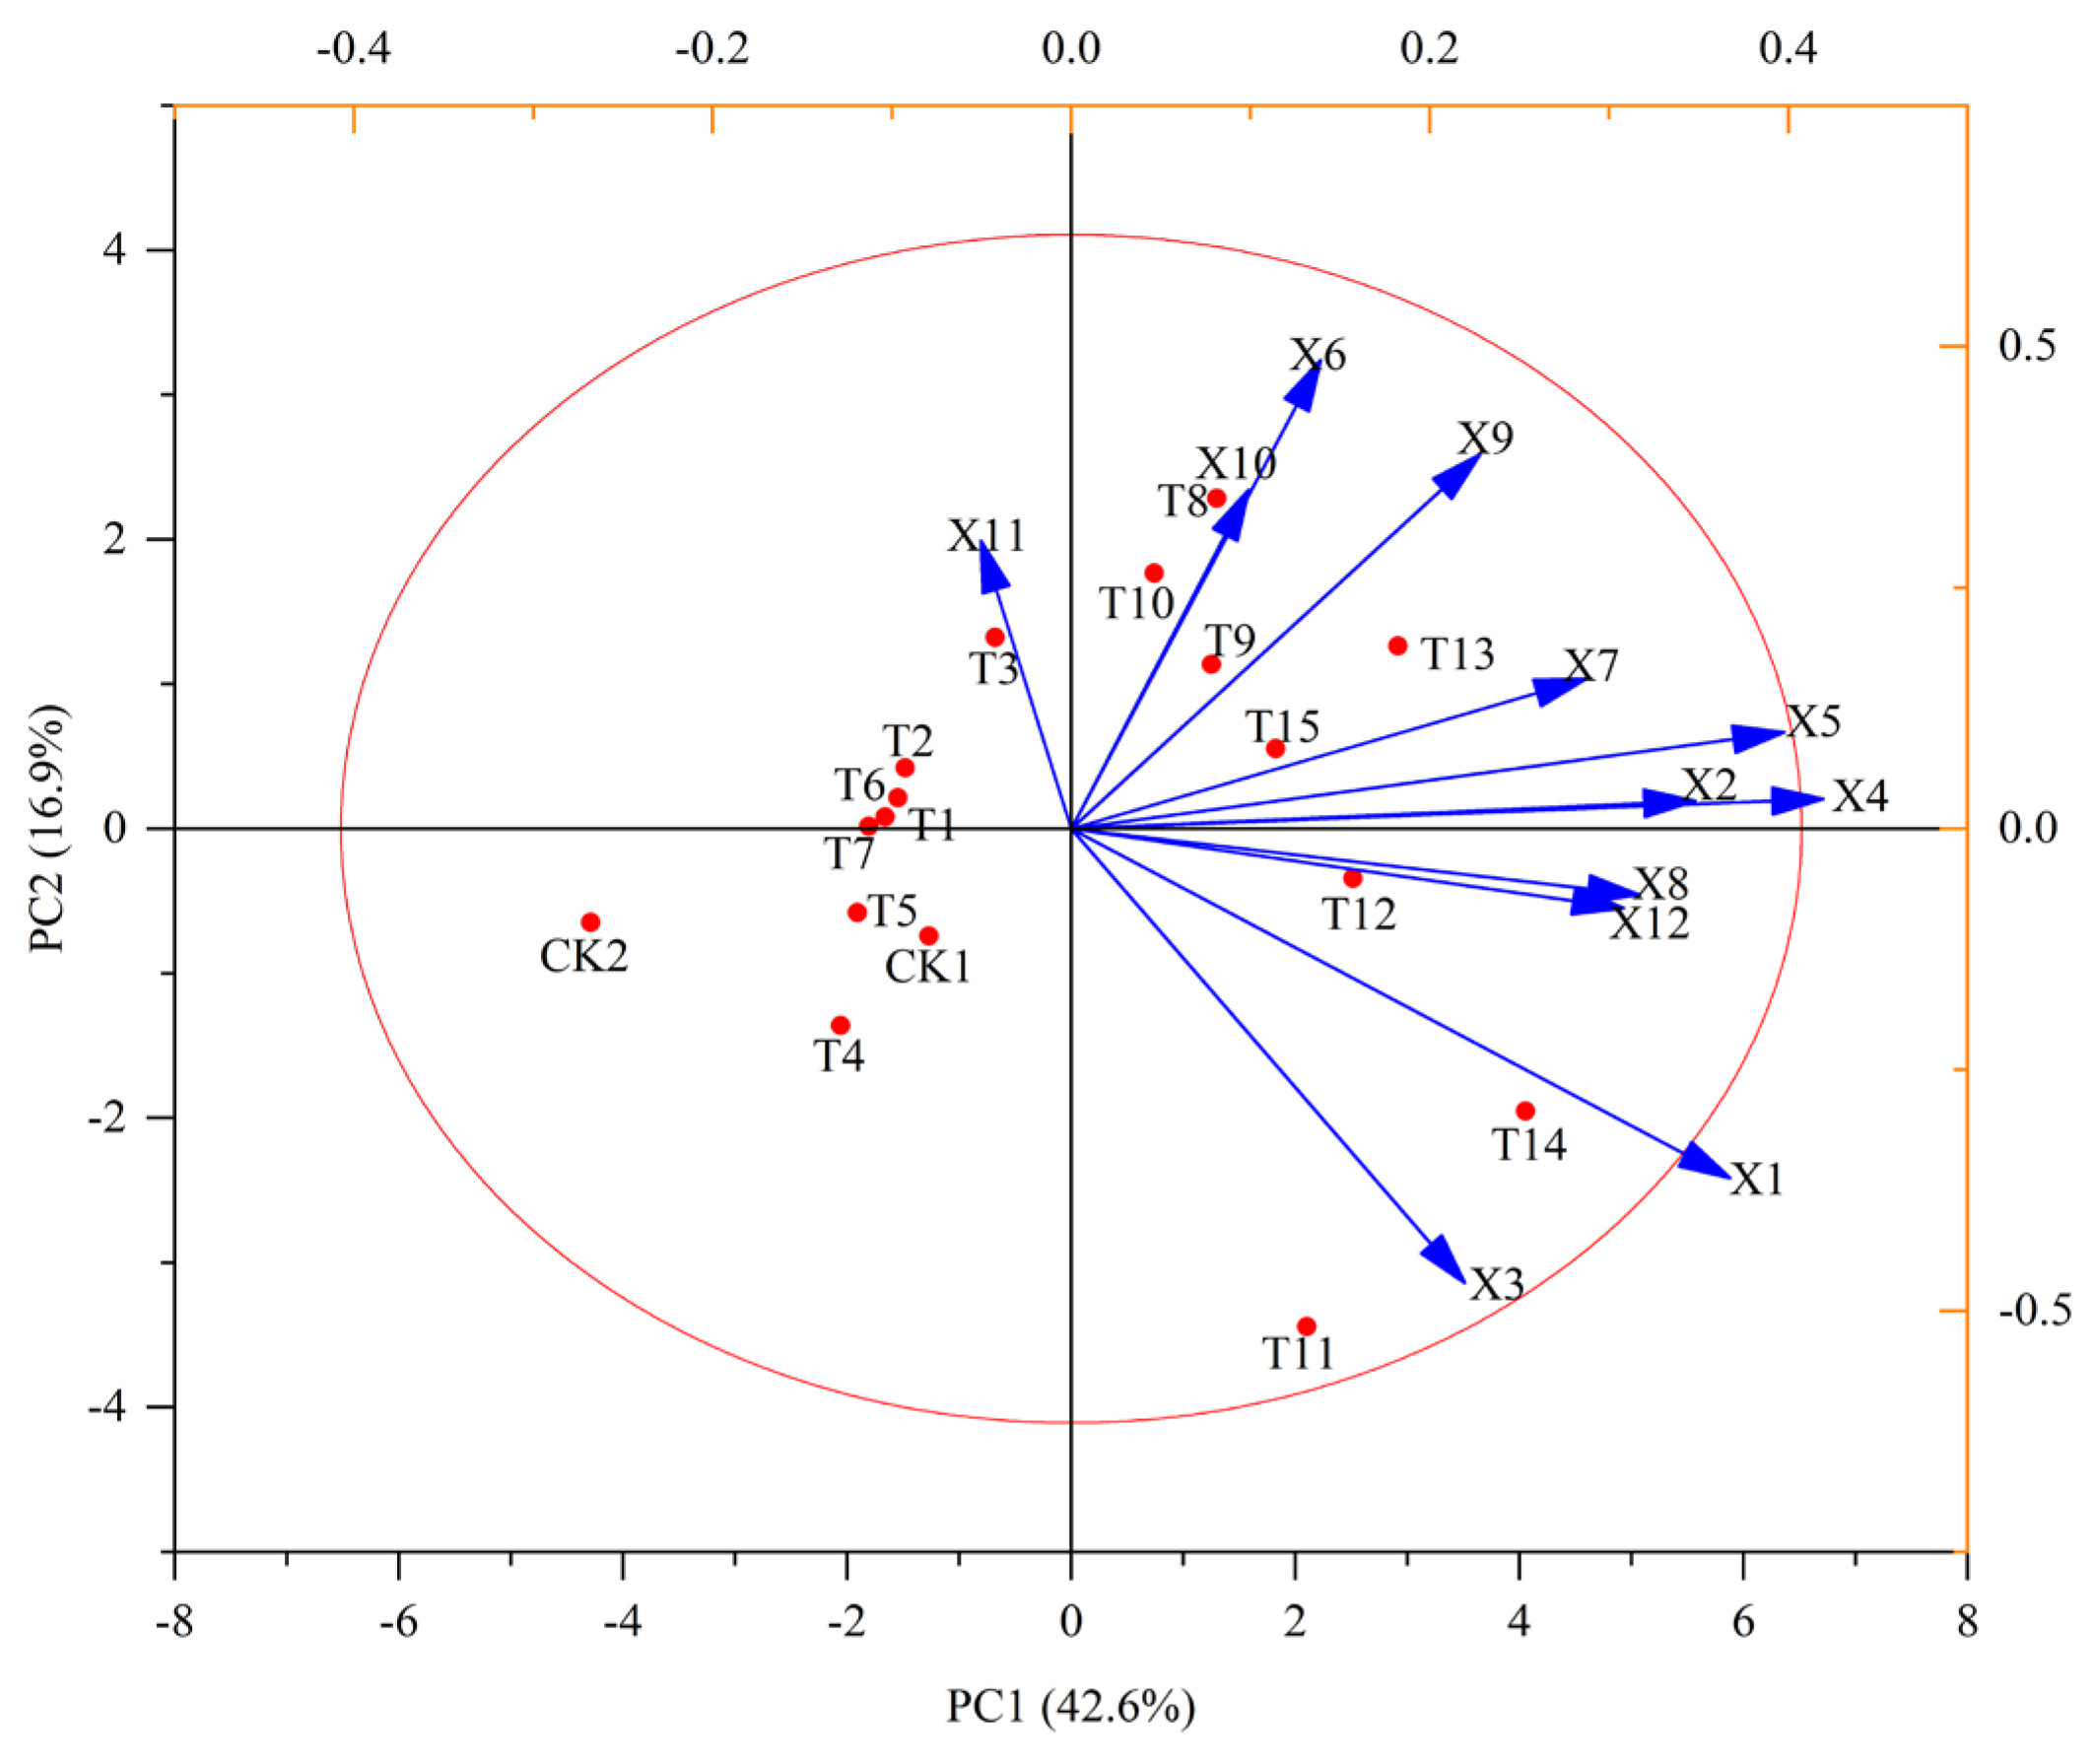
4. Principal Component Analysis of Quality Parameters

In Figure 7, it is evident that T14 exerted the most pronounced impact on the total soluble sugar content in fruits across various potassium-to-calcium ratios used during different growth stages. T12 demonstrated the most significant influence on titratable acid content, soluble protein content, total phenol content, and fruit hardness in fruits. Additionally, T11 has the most significant effect on the sugar–acid ratio in fruits, while T15 exhibited the most significant impact on soluble solids content and lycopene content. T8 was most influential on Vc content and fruit shape index, T9 on flavonoid content, and T3 on fruit stalk length.
Table 2 presents the initial characteristic values of principal component analysis for quality indicators of tomato fruits at different growth stages under irrigation with nutrient solutions featuring varying potassium-to-calcium ratios. Principal component analysis was conducted on diverse quality indicators of tomatoes, resulting in the extraction of five principal components with characteristic values exceeding 1.00. The cumulative variance contribution rate of these five principal components amounted to 76.81%. Notably, the first principal component exhibited a characteristic value of 4.10, contributing to a variance rate of 34.15%. Table 3 indicates that the fruit size is predominantly influenced by soluble total sugar content, soluble protein content, and soluble solids content. The second principal component features a characteristic value of 1.64, contributing to a variance rate of 13.67%, with the key factor determining its magnitude being Vc content. The third principal component, with a characteristic value of 1.36 and a variance contribution rate of 11.30%, is primarily determined by the fruit shape index. The fourth principal component, characterized by a value of 1.09 and a variance contribution rate of 9.07%, is mainly influenced by the length of the fruit stalk. Lastly, the fifth principal component, with a characteristic value of 1.04 and a variance contribution rate of 8.62%, is chiefly determined by lycopene content.
Taking a total of 12 indicators of fruit soluble total sugar (X1), titratable acid (X2), sugar–acid ratio (X3), soluble protein (X4), soluble solids (X5), Vc (X6), lycopene (X7), total phenols (X8), flavonoids (X9), fruit shape index (X10), fruit stalk length (X11) and hardness (X12) as variables, the coefficient is derived by dividing the loading value of each principal component by the square root of the component’s characteristic value.
Table 4 shows the ranking of comprehensive scores of principal components for each treatment under irrigation with nutrient solutions featuring different potassium-to-calcium ratios across various growth stages, listed from highest to lowest as follows: T13 > T14 > T12 > T15 > T9 > T10 > T8 > T11 > T3 > T6 > T2 > T5 > T1 > CK1 > T7 > T4 > CK2.

5. Effect of the Potassium-to-Calcium Ratio on Mineral Element Content on Cherry Tomato

5.1. Effect of the Potassium-to-Calcium Ratio on Mineral Element Content in Fruits at Different Stages

Table 5 illustrates the variations in the concentrations of numerous mineral elements including N, P, K, Ca, Mg, Na and trace mineral elements Cu and Fe during the fruit white-ripening period, color-turning period, and ripening period of tomato plants during the fruiting period. Across the different fruit periods, N, K, Ca, and Fe exhibit higher concentrations compared to P, Mg, Na, and Cu, consistent with the elemental content trends observed in the aforementioned plants. The levels of the same element in different periods show minimal variance. Specifically, N, P, and K are most abundant during the white-ripening period, while Mg, Na, and Fe peak during the color-turning period. Ca and Cu concentrations reach their highest levels in mature stage.
The results showed that with the increase of the potassium-to-calcium ratio in the nutrient solution, it significantly affected the absorption of mineral elements by fruits at different growth stages. Overall, increasing the potassium-to-calcium ratio promotes the absorption of phosphorus (P) and potassium (K) by fruits, but inhibits the absorption of nitrogen (N), calcium (Ca), magnesium (Mg), and iron (Fe). There are differences in the specific peak treatment groups of element absorption during different growth stages (white maturity stage, color transformation stage, and maturity stage).

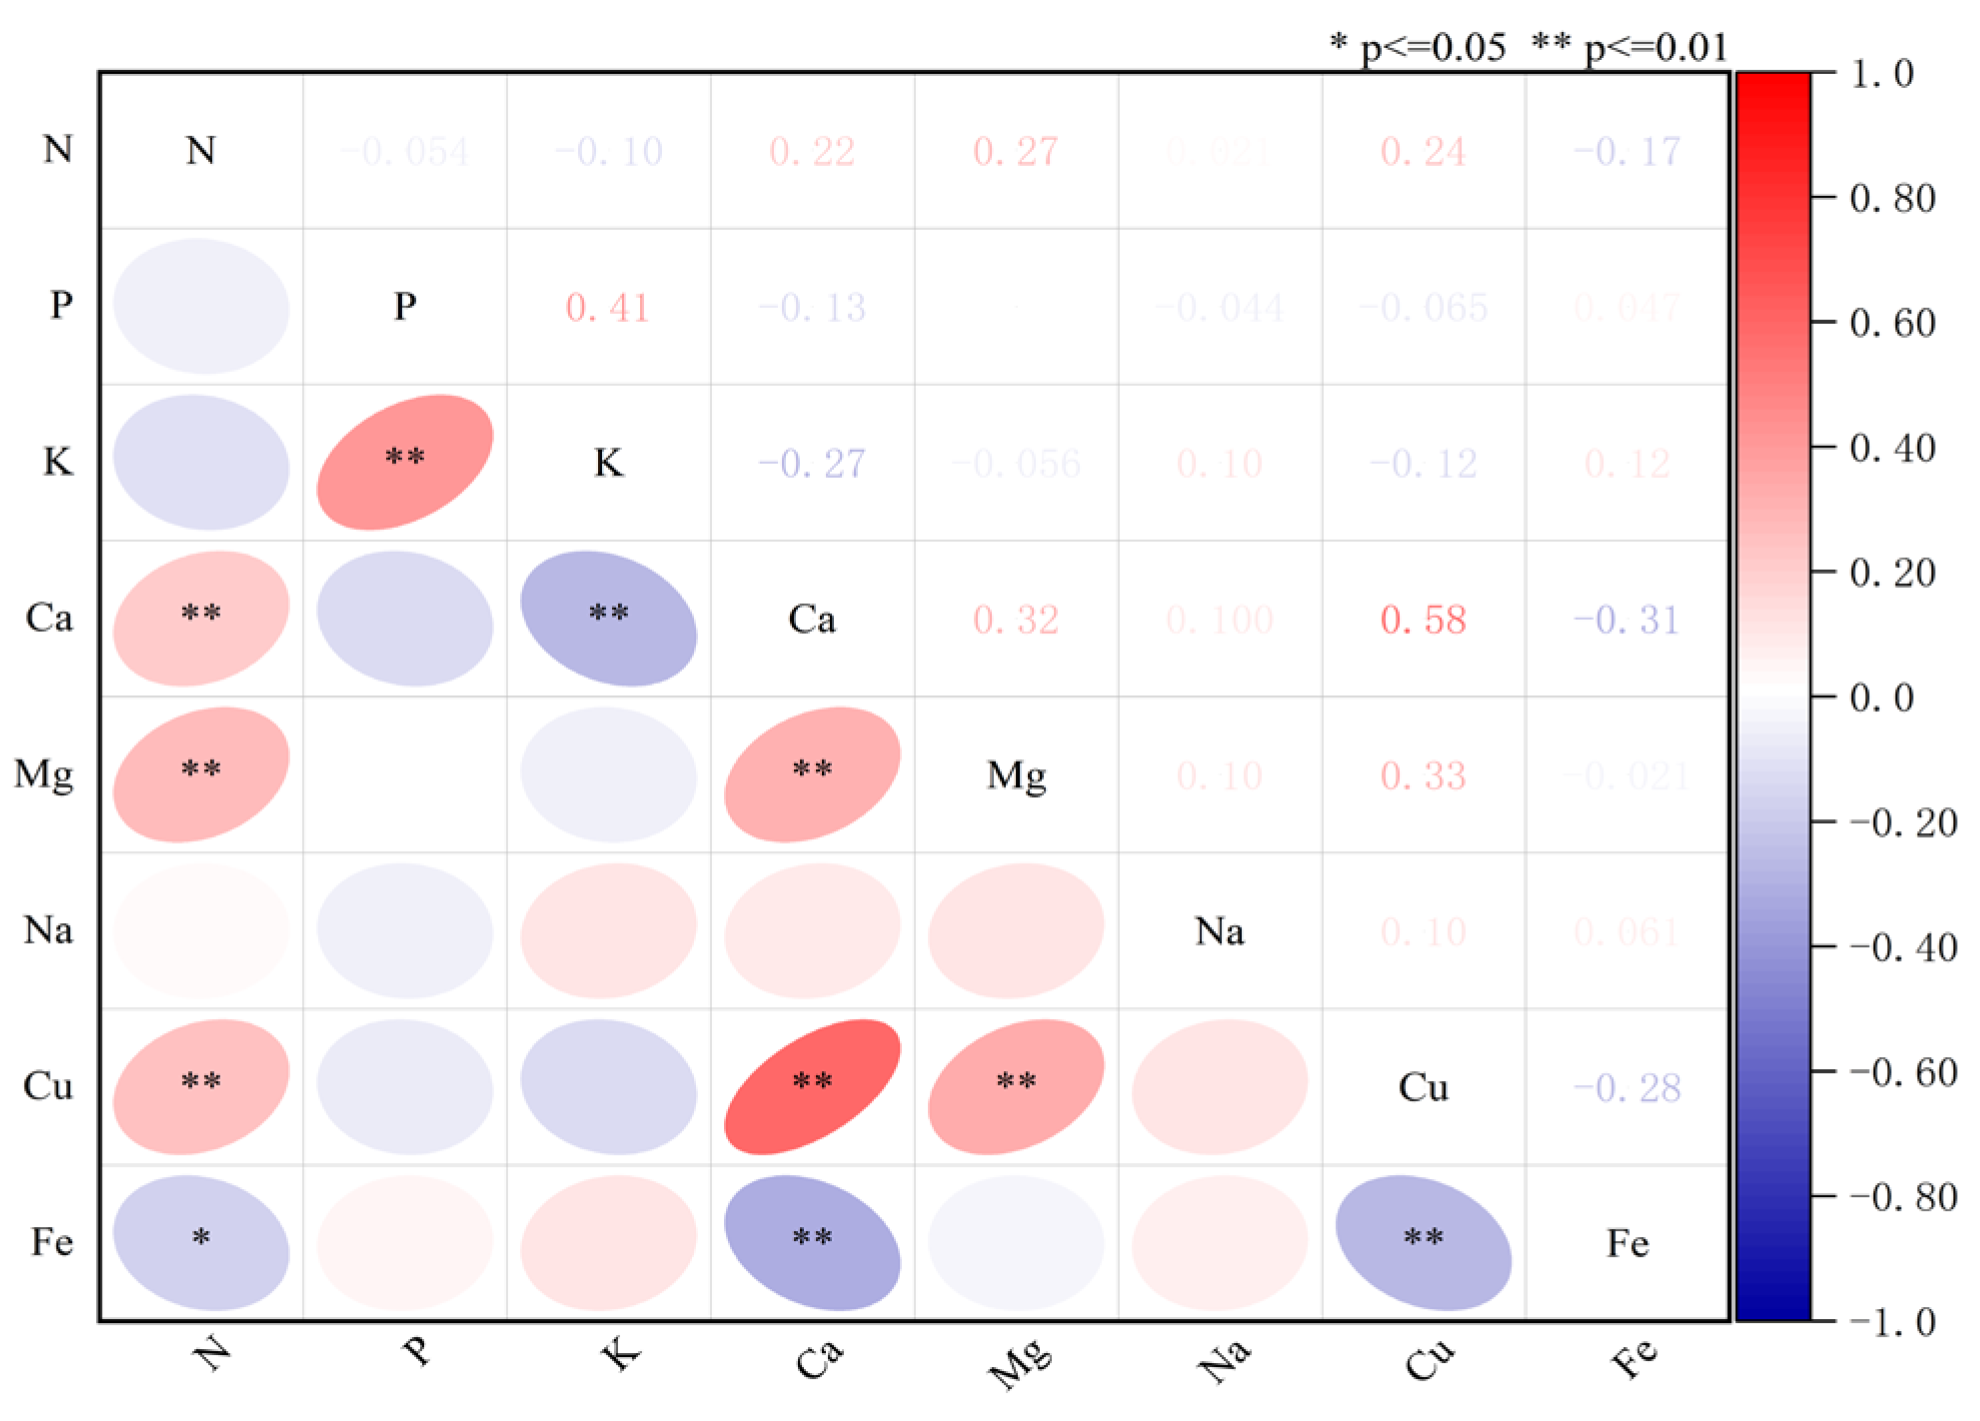
5.2. Correlation Analysis Among Eight Mineral Element Contents in Fruits During Fruiting Period

Figure 8 presents the correlation analysis of eight mineral nutrients in fruits irrigated with nutrient solutions featuring different potassium-to-calcium ratios during the fruiting period. The observed nutrient interactions significantly influence fruit mineral composition and quality, ultimately affecting taste, color, nutritional value, and market competitiveness. Pearson’s correlation analysis revealed that N showed significant positive correlations with Ca, Mg, and Cu (p < 0.01), while demonstrating a significant negative correlation with Fe (p < 0.05) and nonsignificant negative relationships with P and K. P exhibited a strong positive correlation with K (p < 0.01) but negative associations with Ca, Na, and Cu. Notably, a highly significant antagonistic relationship emerged between K and Ca (p < 0.01), suggesting competition in uptake or translocation. Mg displayed significant positive correlations with Cu (p < 0.01) and Ca (p < 0.05), while Cu and Fe showed significant negative correlation (p < 0.01). These correlation patterns indicate that K promotes P and Mg accumulation while inhibiting Ca uptake, consistent with known ion competition mechanisms in plants. The significant Mg-Cu-Ca relationships suggest potential synergies in their physiological roles, possibly related to enzyme activation and cell wall stabilization. Particularly, the strong K-Ca antagonism highlights the importance of balanced potassium-to-calcium ratios in irrigation solutions, as Ca plays crucial roles in fruit cell wall structure and postharvest quality. The negative N-Fe correlation may reflect metabolic competition during fruit development, warranting further investigation into their interaction during different growth stages. These findings provide practical insights for optimizing nutrient solutions to enhance fruit quality through targeted mineral nutrition management.

6. Discussion

Indicators such as total soluble sugar, titratable acidity, sugar–acid ratio, soluble solids, Vc, lycopene, and soluble protein levels in tomato fruits are pivotal factors in assessing their quality [24,25]. The sugar and acid content, along with their ratio, play a direct role in determining the flavor quality of tomatoes. Numerous production studies have demonstrated that the judicious application of potassium fertilizer can notably enhance overall fruit quality [26,27]. In this experiment, a comprehensive assessment of all aforementioned indicators was conducted to delve into the intricate relationship between the potassium-to-calcium ratio and fruit quality. Studies have shown that potassium’s mechanism of action is evident in improving fruit firmness, increasing soluble solids content, and reducing sugar levels [28]. By accelerating sugar accumulation, the intrinsic quality of fruits is optimized, thereby improving the market competitiveness of agricultural products. The results of this study align with this notion: as the potassium-to-calcium ratio in the nutrient solution increases, the nutritional quality of the fruit tends to improve. However, with a further increase in the potassium-to-calcium ratio, the nutritional quality of the tomato begins to decline. This observation is in line with research conclusions from scholars such as Chang [29], Qi [30], Han [31], and others regarding cucumbers, tomatoes, and various crops. It suggests that an excessively high potassium-to-calcium ratio may have adverse effects on the nutritional quality of fruit. Additionally, studies by Masoud Haghshenas et al. [32] have indicated that maintaining a balanced ratio of potassium-to-calcium in nutrient solutions is crucial for high-quality strawberry production, and this study has reached similar conclusions.
In terms of fruit appearance and morphology, there were no significant differences in fruit stalk length and fruit shape index among the treatment groups, indicating that the potassium-to-calcium ratio has a limited impact on fruit morphological development. Concerning fruit physical characteristics, an increasing potassium-to-calcium ratio in the nutrient solution corresponded to a gradual enhancement in fruit hardness, with T15 exhibiting the highest hardness value. Previous studies have shown [25,26,33] that potassium, through its involvement in cell wall substance synthesis, can activate relevant metabolic enzymes, stimulate cellulose and pectin synthesis and deposition, thereby enhancing peel structure compactness. The study results align with this theoretical framework, underscoring that appropriately adjusting the potassium-to-calcium ratio in the nutrient solution can bolster cell wall structure and effectively reduce mechanical damage during post-harvest transportation. These findings offer a scientific foundation for optimizing fruit commodity quality through precise control of the potassium-to-calcium ratio. However, Masoud Haghshenas [32] reached a different conclusion in his study, which showed that fruit firmness decreased with the increase of potassium (K) levels in strawberry fruits. The discrepancy in results likely stems from fruit-type differences. Strawberries, as non-climacteric and soft aggregate fruits, may be more sensitive to K-induced changes in cell wall composition or water status. In contrast, cherry tomatoes in this study have thicker pericarps and distinct ripening mechanisms.
In the investigation of fruit quality formation mechanisms, the sugar–acid ratio can effectively reflect the taste of cherry tomatoes and serves as an important basis for their palatability [34]. This study revealed a significant regulatory impact of the potassium-to-calcium ratio on tomato flavor quality. T14 exhibited the highest total soluble sugar and titratable acid content, while T12 demonstrated the most favorable sugar-acid ratio. These findings indicate that alterations in the potassium-to-calcium ratio influence flavor development by regulating the “sugar–acid balance mechanism”, as changes in the potassium-to-calcium ratio enhance sugar content, the fruit adjusts organic acid metabolism to maintain an optimal sugar–acid ratio, thereby enhancing overall flavor quality. This study validates the fundamental evaluation parameters for tomato flavor quality (sugar content, acidity and sugar–acid ratio) proposed by Yao [35] and others.
In terms of nutritional quality formation, the findings of this study align closely with research across different crops. Li’s [36] research on lettuce revealed that potassium application treatments notably enhanced the levels of Vc and soluble sugars (increases ranging from 19.60 to 53.00% and 40.70–174.10%, respectively). Ji’s [37] showed that the Vc content in tomato fruits varies among different varieties, but overall, the Vc content in cherry tomatoes is 1.5–3.0 times that of common tomatoes. Similarly, in this study, the Vc and lycopene contents of tomato fruits increased with the rising potassium-to-calcium ration: T8 exhibited the highest Vc content, showcasing a 12.10% and 12.30% increase compared to CK1 and CK2, respectively; T13 demonstrated the highest lycopene content, marking a 19.60% and 29.60% increase compared to CK1 and CK2, respectively. In addition, as an important participant in plant enzymatic reactions, soluble protein content is a key indicator to measure fruit nutritional levels [38]. This study demonstrated that an appropriate increase in the potassium-to-calcium ratio notably elevated the soluble protein content of tomatoes, with T14 achieving the highest value, significantly surpassing CK1 and CK2. This observation aligns with Su’s research [39] conclusion in lettuce. Despite lettuce and tomatoes belonging to different crop categories, they share similar mechanisms in which potassium participates in physiological processes such as antioxidant metabolism. This collective evidence underscores the pivotal role of potassium in shaping the nutritional quality of fruits.
Regarding fruit antioxidant quality, total phenols and flavonoids are aromatic substances belonging to secondary metabolites, which exhibit significant antioxidant activity [40]. The assessment of total phenols and flavonoid contents further elucidated the regulatory impact of the potassium-to-calcium ratio. The findings revealed notably elevated levels of total phenols and flavonoids in T13 and T14 compared to other groups. This suggests that an appropriate potassium-to-calcium ratio can enhance potassium absorption and utilization by plants, stimulate the phenylpropane metabolic pathway, leading to increased synthesis and accumulation of total phenols and flavonoids. Consequently, this enhancement significantly boosts the antioxidant capacity and health value of fruits, thereby improving tomato quality [41].
From a comprehensive fruit quality perspective, both T12 and T13 fruits exhibited the highest soluble solids content, showcasing exceptional performance in sugar and acid equilibrium. These treatments demonstrated effective coordination in terms of nutrient accumulation and antioxidant properties, highlighting significant advantages in comprehensive quality management. Meanwhile, studies have shown that supplementing appropriate calcium is an important factor in ensuring high-quality tomatoes [42]. These research findings offer a crucial foundation for the precise adjustment of the potassium-to-calcium ratio in high-quality tomato cultivation, facilitating the harmonized enhancement of fruit flavor, nutrition, and antioxidant attributes.
Mineral nutrients are natural components of numerous horticultural crops and play a pivotal role in maintaining crop quality and determining nutritional value [43]. In this study, it was observed that an increase in the potassium-to-calcium ratio in the nutrient solution across different growth stages led to a significant rise in the sodium and iron content of fruits, while decreasing the absorption of copper by fruits. These outcomes align with the research findings of Wang [44], Qin [45], and others on tomatoes. Through the judicious adjustment of the potassium-to-calcium ratio in the nutrient solution and the optimization of element synergy and antagonistic relationships, there is potential to enhance fruit mineral nutrient content and improve fruit quality, thereby bolstering the market competitiveness of agricultural products.

7. Conclusions

In this study, the potassium-to-calcium ratio (potassium-to-calcium) was systematically regulated at three key growth stages of tomato—seedling stage, flowering, and fruit—setting stage, and fruiting stage—through dynamic optimization of nutrient solution formulations. A comprehensive analysis was conducted to elucidate the mechanism underlying how potassium-to-calcium ratios influence fruit quality and mineral element accumulation. Principal component analysis (PCA)-based comprehensive evaluation revealed that the T13 treatment, comprising 0.5 times standard nutrient solution concentration at the seedling stage, a potassium-to-calcium ratio of 1.6:1 during flowering and fruit-setting, and an elevated potassium-to-calcium ratio of 1.9:1 at the fruiting stage, which is the most effectively coordinated fruit nutrient accumulation and enhanced flavor quality. These findings establish a stage-specific dynamic potassium-to-calcium ratio regulation model for tomato cultivation, providing a scientific basis for developing precision fertigation strategies. The model enables targeted nutrient management-optimizing fruit quality in protected agricultural systems, with direct applicability to drip irrigation and hydroponic systems for high-quality tomato production.

Author Contributions

Conceptualization, Y.H.; data curation, Y.H. and S.S.; investigation: Y.H., K.S., L.W. and J.Z.; methodology: Y.H., K.S., L.W. and J.Z.; resources: Y.H., K.S., L.W. and J.Z.; and G.X.; validation: Y.H., K.S., L.W. and J.Z.; writing—original draft: Y.H. and K.S.; writing—review and editing: S.S., and J.W.; visualization: Y.H., J.W. and G.X.; formal analysis: S.S.; supervision: S.S., J.W. and G.X.; project administration: Y.H., S.S., J.W. and G.X. All authors have read and agreed to the published version of the manuscript.

Funding

This research was funded by the Shanxi Provincial Key Research and Development Plan Project (202102140601015), the Shanxi Provincial Modern Agriculture Industry Technology System Construction Project (2024CYJSTX08-16), the “Industry-University-Research Integration Promotion Project” of Shanxi Agricultural University (2024CXYRH-401), and the Professor and Doctor Workstation for Intelligent Standardization Technology Research of Fruit Tomatoes in Jinzhong National Agricultural High-tech Zone (JZNGQBSGZZ004).

Data Availability Statement

Data are contained within the article. The original contributions presented in the study are included in the article, further inquiries can be directed to the corresponding author.

Acknowledgments

The authors would like to express their sincere gratitude to the experimental platform of the College of Horticulture, Shanxi Agricultural University for providing valuable assistance in the operation of experimental equipment and data collection. Special thanks go to Professor Sun Sheng for his constructive suggestions on the research methodology and the revision of the paper. Finally, thanks are due to all the funding support for this study.

Conflicts of Interest

The authors declare no conflicts of interest. The funders had no role in the design of the study, in the collection, analyses, or interpretation of data, in the writing of the manuscript, or in the decision to publish the results.

References

  1. Chen, S.Y. Metabolism of Sugar and Organic Acids in Different Varieties of Tomato Fruits and the Hybrid Seed Purity Identification of ‘ZheFen 702’ by SSR Marker. Master’s Thesis, Zhejiang A&F University, Hangzhou, China, 2014. [Google Scholar]
  2. Chen, J. Analysis of Suitable Cherry Tomato Cultivated in Suzhou Region and Tomato’s Weak Light Resistance. Master’s Thesis, Nanjing Agricultural University, Nanjing, China, 2016. [Google Scholar]
  3. Sun, R.; Chen, S.; Chen, X.; Liu, X.; Zhang, F.; Wu, J.; Su, L. Enzymatic treatment to improve permeability and quality of cherry tomatoes for production of dried products. J. Sci. Food Agric. 2023, 104, 2718–2727. [Google Scholar] [CrossRef] [PubMed]
  4. Liu, Y.; Wang, J.; Wu, L.; Li, Y.; He, C.; Yu, X.; Wang, J. Effects of different topdressing nitrogen fertilizer on quality, growth, and nitrogen use efficiency of cherry tomato in solar greenhouse. China Veg. 2021, 7, 40–47. [Google Scholar]
  5. Moran, N.E.; Thomas-Ahner, J.M.; Lei, W.; Zuniga, K.E.; Erdman, J.W., Jr.; Clinton, S.K. Tomatoes, lycopene, and prostate cancer: What have we learned from experimental models. J. Nutr. 2022, 152, 1381–1403. [Google Scholar] [CrossRef] [PubMed]
  6. Sun, Y.; He, J.; Wei, F.; Yang, W. Evaluation of tomato Industry development and its international competitiveness in China during the “13th Five-Year Plan” period. China Cucurbits Veg. 2023, 36, 112–116. [Google Scholar]
  7. Li, J.; Xiang, Z.; Wang, X.; Guo, Y.; Huang, Z.; Liu, L.; Li, X.; Du, Y. Status and prospect of tomato industry in China during the “13th Five-Year Plan” period. China Veg. 2021, 2, 13–20. [Google Scholar]
  8. Zhou, M.; Li, C. Current situation and prospect of tomato seed industry in China. Vegetables 2022, 5, 6–10. [Google Scholar]
  9. Wu, L.Y.; Gong, Y.J.; Li, Z.B.; Bao, R.; Zhong, L.; Liang, M.T. Multivariate statistical analysis of fruit characters of cherry tomato germplasm resources. Southwest China J. Agric. Sci. 2012, 25, 1818–1822. [Google Scholar]
  10. Fanasca, S.; Colla, G.; Maiani, G.; Venneria, E.; Rouphael, Y.; Azzini, E.; Saccardo, F. Changes in anti-oxidant content of tomato fruits in response to culti-var and nutrient soluton composition. J. Agric. Food Chem. 2006, 54, 4319–4325. [Google Scholar] [CrossRef]
  11. Martinez-Ballesta, M.A.; López-Pérez, L.; Hernández, M.; López-Berenguer, C.; Fernández-García, N.; Carvajal, M. Agricultural practices for enhanced human health. Phytochem. Rev. 2008, 7, 251–260. [Google Scholar] [CrossRef]
  12. Fan, B.; Ma, L.; Li, J. Effects of Different Formula Nutrient Solutions on Tomato Yield, Quality and Nutrient Absorption. J. Northwest AF Univ. (Nat. Sci. Ed.) 2021, 49, 104–112, 122. [Google Scholar]
  13. Wu, K.J.; Hu, C.G.; Wang, J.; Guo, J.D.; Sun, X.C.; Tan, Q.L.; Zhao, X.H.; Wu, S.W. Comparative effects of different potassium sources on soluble sugars and organic acids in tomato. Sci. Hortic. 2023, 308, 111601. [Google Scholar] [CrossRef]
  14. Ding, S.S.; Li, Y.T.; Yuan, L.; Zhao, B.; Lin, J.; Li, J.; Yang, X.; Zhang, J.; Gao, J. Effects of small molecular organics chelated calcium fertilizer on cherry tomato yield, quality and nutrients absorption. Soil Fertil. Sci. China 2015, 5, 61–66. [Google Scholar]
  15. Liu, R.L. Effects of different irrigation methods on the growth and quality of cherry tomato. Heilongjiang Sci. 2024, 15, 25–27. [Google Scholar]
  16. Liu, Y.; Xia, H.; Li, Y.; Ren, N. Effects of irrigation and nitrogen coupling on growth, yield and quality of cherry tomato under greenhouse cultivation during the whole growth period. J. Chin. Agric. Mech. 2024, 45, 200–207. [Google Scholar]
  17. Ma, R.P.; Sun, Y.S.; Zhang, G.X.; Han, J.X. Absorption and distribution of mineral elements in greenhouse tomato under salt stress. North. Hortic. 2024, 11, 40–49. [Google Scholar]
  18. Song, M.Y.; Li, J.P.; Xu, M.M.; Gao, L.H.; Xie, Y. Effects of foliar fertilizer treatment with medium and trace elements on growth, yield and quality of cherry tomato. North. Hortic. 2022, 6, 24–31. [Google Scholar]
  19. Gao, J.F.; Sun, Q.; Cao, C.; Zhiwu, S.X.; Shiyan, Z. Experimental Guide to Plant Physiology; Higher Education Press: Beijing, China, 2006. (In Chinese) [Google Scholar]
  20. Cheng, D.W.; He, S.S.; Li, Z.Y.; Gu, H.; Li, M.; Guo, X.Z.; Chen, J.Y. Research on grading evaluation of ‘Shine-Muscat’ grape fruit quality. Acta Agric. Jiangxi 2020, 32, 30–35. [Google Scholar]
  21. Huang, H.; Gu, J.; Zeng, Z.; Liao, Y.; Lu, M. Determination of total nitrogen in water quality by redox digestion-fully automatic kjeldahl nitrogen method. Guangzhou Chem. Ind. 2024, 52, 97–99. [Google Scholar]
  22. Zhang, H.; Xiao, G.Z.; Li, L.P.; Su, F.K.; Yang, J. The optimal colorimetric conditions and colorimetric wavelength for the determination of total phosphorus in soil using molybdenum antimony colorimetric method. Soil Fertil. Sci. China. 1992, 2, 46–48. [Google Scholar]
  23. Cai, Y.R.; Liu, Y.; Li, L.L.; Wang, W. Ten element contents and their distribution in fruits determinated by atomic absorption spectrometry. J. Hyg. Res. 2011, 40, 361–364. [Google Scholar]
  24. Wang, K. Determination of Important Substances Content, Functional Analysis and Screening of Excellent Varieties in Cherry Tomato. Master’s Thesis, Northeast Agricultural University, Harbin, China, 2023. [Google Scholar]
  25. Cheng, G.T.; Lou, Q.Q.; Li, X.F.; Sun, H.R.; Xu, C.N.; Li, S.; Zhao, J.R.; Qiao, H.X.; Wang, Y.F.; Liang, Y. Research progress on tomato fruits flavor substance composition and its influencing factors. China Veg. 2022, 7, 23–33. [Google Scholar]
  26. Guo, Z.G.; Li, W.F.; Mao, J.; Zuo, C.W.; Chen, B.H. Effects of potassium fertilizer on endogenous hormone content and acid metabolism in fruit of apple cv. ‘Red Delicious’. Trans. Chin. Soc. Agric. Eng. 2019, 35, 281–290. [Google Scholar]
  27. Almeselmani, M.; Pant, R.C.; Singh, B. Potassium level and physiological response and fruit quality in hydroponically grown tomato. Int. J. Veg. Sci. 2010, 16, 85–99. [Google Scholar] [CrossRef]
  28. Zahoor, A.; Shazia, A.; Ahmad, W.E.; Ashar, A.M.; Tanveer, A.; Sabir, T.R.M.; Rashid, A.; Aamir, I.M. Growth, physiology, and biochemical activities of plant responses with foliar potassium application under drought stress-a review. J. Plant Nutr. 2018, 41, 1734–1743. [Google Scholar]
  29. Chang, R. Effect of Potassium Level on Cucumber Growth, Physiological Indices and Yield Under Sub-Optimum Temperature and Light Intensity. Master’s Thesis, Henan University of Science and Technology, Luoyang, China, 2015. [Google Scholar]
  30. Qi, H.Y.; Li, T.L.; Chen, Y.H.; Zhang, J. Effects of foliage applications of KH2PO4 and glucose on photosynthesis and sucrose metabolism of tomato. Trans. Chin. Soc. Agric. Eng. 2005, 21, 137–142. [Google Scholar]
  31. Han, Q. Regulation of Potassium Fertilization at Different Growth Stages on Sucrose Metabolism in Greenhouse Tomatoes. Master’s Thesis, Chinese Academy of Agricultural Sciences, Beijing, China, 2009. [Google Scholar]
  32. Haghshenas, M.; Arshad, M.; Nazarideljou, M.J. Different K: Ca ratios affected fruit color and quality of strawberry ‘Selva’ in soilless system. J. Plant Nutr. 2018, 41, 243–252. [Google Scholar] [CrossRef]
  33. Dong, P.; Liang, Y.; Han, J.; Shi, Y.; Hou, L.; Xing, G.; Zhang, Y. Effects of reducing nitrogen and potassium fertilizer application and increasing organic fertilizer application on tomato fruit quality and mineral element content. Soils Fertil. China 2023, 1, 13–22. [Google Scholar]
  34. Tao, Y.; Liu, T.; Wu, J.; Wu, Z.; Liao, D.; Shah, F.; Wu, W. Effect of combined application of chicken manure and inorganic nitrogen fertilizer on yield and quality of cherry tomato. Agronomy 2022, 12, 1574. [Google Scholar] [CrossRef]
  35. Yao, Q.; Han, T.Y.; Liang, W.; Shi, Y.; Hou, L.P.; Zhang, Y. Effects of exogenous calcium and EBR on fruit quality characteristics of tomato. China Cucurbits Veg. 2021, 34, 74–79. [Google Scholar]
  36. Li, C.P.; Wang, S.P.; Du, L.; Hong, J.; Huang, X.; Zhang, G.Y.; Zhang, L.H.; Ye, L.X.; Lian, Z.C.; Jiang, L.; et al. Effects of different potassium fertilization modes on yield, quality of lettuce and soil regime. Hubei Agric. Sci. 2020, 59, 28–33. [Google Scholar]
  37. Ji, S.X.; Li, J.R.; Zhang, B.; Gong, B.; Wu, X.; Gao, H. Preliminary analysis on difference of fruit quality of different tomato varieties. North. Hortic. 2021, 1, 15–22. [Google Scholar]
  38. Liu, H.; Zhang, J.L.; Liu, J.C.; Zhang, G.D.; Fang, H.T.; Ye, L.; Jiao, Z.G. Effects of selenium on cherry tomato storage qualities and involved three active oxygen metabolism related enzymes. Sci. Technol. Food Ind. 2019, 40, 256–261. [Google Scholar]
  39. Su, Y.J. Optimal Proportion Selection of Nutrient Solution and Quality Adjustment of Hydroponic Lettuce. Ph.D. Thesis, Northwest A & F University, Yangling, China, 2016. [Google Scholar]
  40. Song, C.-Z.; Liu, M.-Y.; Meng, J.-F.; Chi, M.; Xi, Z.-M.; Zhang, Z.-W. Promoting effect of foliage sprayed zinc sulfate on accumulation of sugar and phenolics in berries of Vitis vinifera cv. Merlot growing on zinc deficient soil. Molecules 2015, 20, 2536–2554. [Google Scholar] [CrossRef] [PubMed]
  41. Lobos, T.E.; Retamales, J.B.; Luengo, E.A.; Hanson, E.J. Timing of foliar calcium sprays improves fruit firmness and antioxidants in ‘Liberty ’blueberries. J. Soil Sci. Plant Nutr. 2021, 21, 426–436. [Google Scholar] [CrossRef]
  42. Wu, Y.Q.; Lin, Q.; Chen, Z.C.; Lin, J. Effects of calcium level on calcium absorption, fruit quality and yield of infinite growth tomato. J. Soil Water Conserv. 2019, 33, 185–189. [Google Scholar]
  43. Seyed, H.M.; Majid, R. Seasonal changes of mineral nutrients and phenolics in pomegranate (Punica granatum L.) fruit. Sci. Hortic. 2006, 111, 120–127. [Google Scholar]
  44. Wang, J.F. Study on Potassium Nutrient Responses and Its Rapid Detection Techniques in Substrate Cultivated Tomato. Ph.D. Thesis, China Agricultural University, Beijing, China, 2016. [Google Scholar]
  45. Qin, W.L.; Li, C.J. Effects of increasing potassium fertilizer dosage on the quality and yield of tomato in greenhouse. Soil Fertil. Sci. China 2007, 1, 44–47. [Google Scholar]
Figure 1. Effect of the potassium-to-calcium ratio in nutrient solution on the appearance quality of cherry tomato fruits. Note: Different lowercase letters above the bars indicate significant difference among treatments (p < 0.05).
Agronomy 15 01380 g001
Figure 2. Effect of the potassium-to-calcium ratio in nutrient solution on the physical characteristic quality of cherry tomato fruits. Note: Different lowercase letters above the bars indicate significant difference among treatments (p < 0.05).
Agronomy 15 01380 g002
Figure 3. Effect of the potassium-to-calcium ratio in nutrient solution on flavor quality of cherry tomato fruits. Note: Different lowercase letters above the bars indicate significant difference among treatments (p < 0.05).
Agronomy 15 01380 g003
Figure 4. Effects of the potassium-to-calcium ratios in nutrient solution on the contents of Vc, soluble protein and lycopene of cherry tomato fruits. Note: Different lowercase letters above the bars indicate significant difference among treatments (p < 0.05).
Agronomy 15 01380 g004
Figure 5. Effect of the potassium-to-calcium ratios in nutrient solution on antioxidant quality of cherry tomato fruits. Note: Different lowercase letters above the bars indicate significant difference among treatments (p < 0.05).
Agronomy 15 01380 g005
Figure 6. Effect of the potassium-to-calcium ratios in nutrient solution on the soluble sugar content of cherry tomato fruits. Note: Different lowercase letters above the bars indicate significant difference among treatments (p < 0.05).
Agronomy 15 01380 g006
Figure 7. Distribution map of the factor loadings of various indicators. (X1, Total soluble sugar; X2, titratable acid; X3, sugar-acid ratio; X4, soluble protein; X5, soluble solids; X6, Vc; X7, lycopene; X8, total phenolics; X9, flavonoids; X10, fruit shape index; X11, fruit stalk length; and X12, and firmness; In the figure, CK1, CK2, and T1–T15 are derived from Table 1. Experimental treatments.).
Agronomy 15 01380 g007
Figure 8. Correlation analysis of the contents of eight mineral elements in fruits during the fruiting period.
Agronomy 15 01380 g008
Table 1. Experimental treatments.
PeriodsSeedling Stage (A)Flowering and Fruit Setting Stage (B)Fruiting Stage (C)Treatment
Different growth stages
Potassium-to-calcium ratio in nutrient solution
0.5 times the standard nutrient solutionB1 K:Ca = 1.4:1C1 K:Ca = 1.7:1T1:B1C1
B1 K:Ca = 1.4:1C2 K:Ca = 1.8:1T2:B1C2
B1 K:Ca = 1.4:1C3 K:Ca = 1.9:1T3:B1C3
B1 K:Ca = 1.4:1C4 K:Ca = 2.0:1T4:B1C4
B1 K:Ca = 1.4:1C5 K:Ca = 2.1:1T5:B1C5
B2 K:Ca = 1.5:1C1 K:Ca = 1.7:1T6:B2C1
B2 K:Ca = 1.5:1C2 K:Ca = 1.8:1T7:B2C2
B2 K:Ca = 1.5:1C3 K:Ca = 1.9:1T8:B2C3
B2 K:Ca = 1.5:1C4 K:Ca = 2.0:1T9:B2C4
B2 K:Ca = 1.5:1C5 K:Ca = 2.1:1T10:B2C5
B3 K:Ca = 1.6:1C1 K:Ca = 1.7:1T11:B3C1
B3 K:Ca = 1.6:1C2 K:Ca = 1.8:1T12:B3C2
B3 K:Ca = 1.6:1C3 K:Ca = 1.9:1T13:B3C3
B3 K:Ca = 1.6:1C4 K:Ca = 2.0:1T14:B3C4
B3 K:Ca = 1.6:1C5 K:Ca = 2.1:1T15:B3C5
Standard nutrient solution K:Ca = 1.9:1CK1
Tap waterCK2
Table 2. Initial eigenvalues.
CompositionTotalPercentage of Variance (%)Cumulative (%)
14.1034.1534.15
21.6413.6747.82
31.3611.3059.12
41.099.0768.19
51.048.6276.81
60.836.9283.73
70.645.3689.09
80.524.3693.44
90.443.6797.11
100.252.0999.20
110.090.7799.97
120.000.03100.00
Table 3. Principal component loading matrix.
IndexPrincipal Component 1Principal Component 2Principal Component 3Principal Component 4Principal Component 5
Soluble Sugar Content0.82−0.460.03−0.070.09
Titratable Acid Content 0.660.26−0.370.130.38
Sugar–Acid Ratio0.46−0.740.35−0.20−0.21
Soluble Protein Content0.890.070.18−0.04−0.01
Soluble Solids Content0.880.230.09−0.220.02
Vc Content0.230.670.27−0.41−0.03
Lycopene Content 0.480.16−0.010.21−0.51
Total Phenols Content0.61−0.240.060.42−0.03
Flavonoids Content0.310.450.170.46−0.42
Fruit Shape Index0.070.150.71−0.220.24
Fruit Stalk Length−0.150.030.520.570.49
Hardness0.670.07−0.43−0.030.32
Table 4. Comprehensive score and ranking of fruit quality.
TreatmentF1F2F3F4F5FRanking
T113.623.826.784.34−12.075.2913
T214.013.177.384.85−12.175.4411
T314.134.287.014.58−12.395.559
T414.212.057.083.81−13.365.1313
T513.902.997.553.30−11.495.3216
T614.124.067.403.19−11.725.4912
T713.153.317.113.43−10.605.1415
T815.045.137.263.13−12.115.907
T915.643.718.002.59−11.905.965
T1015.195.057.203.27−12.615.906
T1116.570.507.613.19−12.285.828
T1217.072.588.012.63−13.396.173
T1317.263.948.283.68−14.276.471
T1417.532.037.893.13−13.066.312
T1515.514.257.153.43−11.985.964
CK113.823.976.642.96−11.775.2714
CK212.403.796.962.78−10.704.8717
Table 5. Effects of the potassium-to-calcium ratio in nutrient solution on the contents of mineral elements in fruits at different stages.
PotassiumTreatmentTotal Nitrogen
g·kg−1
Total Phosphorus
g·kg−1
Total Potassium
g·kg−1
Total Calcium
g·kg−1
Total Magnesium
g·kg−1
Total Sodium
g·kg−1
Total Copper
mg·kg−1
Total Iron
mg·kg−1
White matureT112.68 ± 0.89 bc3.13 ± 0.84 gh23.65 ± 1.93 g0.10 ± 0.00 b0.39 ± 0.01 de0.32 ± 0.02c3.72 ± 1.21 efg32.95 ± 1.28 bcde
T212.72 ± 0.16 bc2.02 ± 0.28 h27.52 ± 0.56 f0.10 ± 0.00 b0.37 ± 0.00 def0.28 ± 0.04 c4.47 ± 0.56 cdefg30.45 ± 1.29 de
T312.72 ± 0.41 bc2.92 ± 0.44 gh28.30 ± 0.18 ef0.09 ± 0.00 b0.39 ± 0.00 cd0.33 ± 0.05 c4.98 ± 0.85 bcdefg31.15 ± 0.26 cde
T411.97 ± 0.62 c3.01 ± 0.31 gh28.15 ± 0.21 ef0.10 ± 0.00 b0.39 ± 0.01 cd0.34 ± 0.05 c5.39 ± 0.76 abcdefg32.43 ± 0.33 bcde
T512.85 ± 0.53 bc4.04 ± 0.83 fg22.88 ± 0.43 g0.10 ± 0.00 b0.42 ± 0.00ab0.72 ± 0.16 a6.56 ± 1.17 abc34.32 ± 0.8 bcd
T614.38 ± 0.35 a4.07 ± 1.00 fg26.22 ± 0.11 f0.10 ± 0.00 b0.42 ± 0.00 ab0.56 ± 0.27 ab6.85 ± 0.48 ab33.07 ± 1.25 bcd
T714.55 ± 0.52 a6.03 ± 0.72 cde28.07 ± 2.34 ef0.10 ± 0.00 b0.42 ± 0.00 ab0.74 ± 0.09 a7.23 ± 1.95 a35.28 ± 4.04 abc
T813.83 ± 0.53 ab7.70 ± 1.41 bc31.29 ± 2.17 d0.09 ± 0.00 b0.39 ± 0.00 d0.34 ± 0.07 c5.76 ± 0.89 abcde28.86 ± 3.05 ef
T913.50 ± 1.48 ab6.53 ± 0.77 bcd31.53 ± 0.32 d0.10 ± 0.01 a0.4 ± 0.00 bcd0.74 ± 0.04 a5.76 ± 1.87 abcde31.32 ± 0.91 cde
T1013.10 ± 0.66 bc5.66 ± 1.37 def34.56 ± 1.21 c0.10 ± 0.00 b0.44 ± 0.00 a0.57 ± 0.18ab5.46 ± 1.81 abcdef25.60 ± 1.15 f
T1112.63 ± 0.35 bc9.76 ± 2.19 a35.48 ± 0.53 c0.09 ± 0.00 cd0.39 ± 0.01 cd0.49 ± 0.14 bc5.20 ± 1.4 abcdefg30.41 ± 4.24 de
T1212.72 ± 0.36 bc6.85 ± 0.45 bcd39.43 ± 0.66 b0.09 ± 0.00 cd0.36 ± 0.00 ef0.43 ± 0.03 bc3.83 ± 0.1 defg32.39 ± 2.50 bcde
T1312.77 ± 0.69 bc7.88 ± 1.20 b33.87 ± 2.67 c0.09 ± 0.00 cd0.38 ± 0.01 de0.45 ± 0.04 bc3.35 ± 0.27 g34.19 ± 0.62 bcd
T1411.97 ± 0.68 c6.12 ± 0.1 cde44.9 ± 0.88 a0.08 ± 0.00 d0.35 ± 0.01 f0.44 ± 0.13 bc3.40 ± 0.43 fg34.32 ± 0.07 bcd
T1513.15 ± 0.56 bc4.53 ± 0.72 efg38.17 ± 1.09 b0.08 ± 0.00 d0.39 ± 0.06 d0.61 ± 0.10 ab5.13 ± 0.34 abcdefg31.41 ± 3.01 bcde
CK112.78 ± 0.53 bc3.38 ± 0.55 gh33.84 ± 1.68 c0.09 ± 0.01 bc0.42 ± 0.00 abc0.63 ± 0.01 ab5.87 ± 0.50 abcd35.51 ± 2.99 ab
CK213.88 ± 0.64 ab3.55 ± 0.38 gh30.04 ± 0.03 de0.10 ± 0.00 b0.44 ± 0.01 a0.56 ± 0.08 ab6.44 ± 1.20 abc38.80 ± 0.80 a
Color turningT114.05 ± 0.46 abc2.94 ± 0.07 e31.41 ± 0.51 cdef0.11 ± 0.01 ab0.71 ± 0.01 b0.84 ± 0.14 a6.71 ± 0.58 abc35.61 ± 1.24 b
T214.00 ± 1.05 abc5.43 ± 3.02 bcd26.28 ± 0.37 g0.10 ± 0.01 abc0.85 ± 0.03 a0.37 ± 0.10 ef7.76 ± 1.28 a31.34 ± 1.42 cdefg
T313.47 ± 1.41 bc3.32 ± 0.60 de28.43 ± 0.51 efg0.10 ± 0.01 abc0.49 ± 0.02 f0.50 ± 0.08 bcdef6.34 ± 0.85 abcd33.05 ± 1.45 bcde
T414.65 ± 0.26 ab2.81 ± 1.27 e29.07 ± 1.82 defg0.10 ± 0.00 abc0.60 ± 0.01 d0.38 ± 0.06 def7.14 ± 1.71 abc32.15 ± 0.76 bcdef
T513.85 ± 0.85 bc5.8 ± 1.34 abc32.36 ± 1.72 bcde0.10 ± 0.01 abc0.45 ± 0.01 ij0.27 ± 0.07 f5.94 ± 0.71 abcde34.25 ± 1.11 bcd
T615.43 ± 0.94 a5.81 ± 1.09 abc31.3 ± 3.06 cdef0.10 ± 0.01 abc0.44 ± 0.01 jk0.41 ± 0.16 def5.35 ± 1.49 bcdefg28.00 ± 0.76 gh
T713.98 ± 0.37 abc6.2 ± 1.33 abc32.06 ± 1.17 bcde0.10 ± 0.01 abc0.47 ± 0.00 gh0.50 ± 0.26 bcdef7.37 ± 1.34 ab29.84 ± 0.20 efg
T812.52 ± 0.77 c6.98 ± 1.69 ab32.25 ± 1.07 bcde0.10 ± 0.00 abc0.46 ± 0.00 hi0.73 ± 0.08 ab5.24 ± 0.84 cdefg28.96 ± 1.26 fgh
T913.52 ± 0.53 bc8.04 ± 0.59 a43.12 ± 3.74 a0.1 ± 0.01 abc0.43 ± 0.00 k0.7 ± 0.09 abc5.92 ± 0.35 abcde34.25 ± 3.36 bcd
T1013.63 ± 0.73 bc8.04 ± 0.77 a33.76 ± 1.94 bc0.09 ± 0.00 c0.49 ± 0.01 fg0.64 ± 0.12 abcde5.3 ± 0.07 bcdefg34.74 ± 0.45 bc
T1113.32 ± 1.29 bc7.85 ± 0.89 a32.52 ± 1.28 bcd0.09 ± 0.01 c0.38 ± 0.00 l0.52 ± 0.11 bcdef5.66 ± 1.25 bcdef34.25 ± 5.13 bcd
T1213.37 ± 0.51 bc6.89 ± 0.45 ab32.7 ± 0.55 bcd0.09 ± 0.01 bc0.38 ± 0.00 l0.42 ± 0.11 cdef6.29 ± 0.58 abcd31 ± 1.92 defg
T1313.37 ± 0.4 bc6.98 ± 0.73 ab35.91 ± 1.37 b0.09 ± 0.01 bc0.55 ± 0.00 e0.58 ± 0.16 abcde6.49 ± 1.34 abcd33.29 ± 1.28 bcde
T1412.47 ± 0.92 c7.76 ± 1.38 ab33.36 ± 1.10 bc0.09 ± 0.01 c0.47 ± 0.00 hi0.63 ± 0.19 abcde3.43 ± 0.97 g33.56 ± 1.44 bcd
T1512.98 ± 0.93 c6.89 ± 0.40 ab33.13 ± 1.21 bc0.1 ± 0.01 abc0.5 ± 0.01 f0.6 ± 0.23 abcde3.85 ± 1.64 fg49.31 ± 0.45 a
CK113.35 ± 0.70 bc4.35 ± 0.46 cde27.69 ± 5.41 fg0.1 ± 0.01 abc0.49 ± 0.01 fg0.67 ± 0.26 abcd3.96 ± 0.43 efg33.94 ± 0.50 bcd
CK212.68 ± 1.14 c3.24 ± 1.27 e21.91 ± 1.38 h0.11 ± 0.02 a0.62 ± 0.01 c0.46 ± 0.07 bcdef4.63 ± 0.95 defg26.23 ± 1.87 h
Mature periodT113.08 ± 0.95 bcd5.14 ± 0.73 def30.84 ± 0.45 cde0.11 ± 0.00 bc0.5 ± 0.01 f0.77 ± 0.20 a9.63 ± 1.04 abcd30.32 ± 1.53 bcde
T213.35 ± 0.93bcd2.92 ± 0.87 g34.37 ± 3.56 b0.11 ± 0.00 b0.46 ± 0.00 gh0.61 ± 0.15 ab9.96 ± 0.51 abc27.84 ± 1.5 def
T313.62 ± 0.78 abcd3.75 ± 0.29 fg32.65 ± 2.65 bcd0.11 ± 0.00 bc0.77 ± 0.01 b0.66 ± 0.07 ab11.16 ± 0.29 a34.05 ± 1.79 ab
T412.8 ± 0.26 cd7.28 ± 1.14 abcd34.78 ± 0.71 b0.11 ± 0.00 bc0.67 ± 0.01 c0.29 ± 0.21 cd10.31 ± 0.6ab33.79 ± 0.53 abc
T514.38 ± 0.65 abc4.60 ± 1.08 efg26.11 ± 2.05 fg0.11 ± 0.00 bc0.48 ± 0.01 g0.49 ± 0.12 bc10.45 ± 0.47 ab24.82 ± 1.06 f
T615.2 ± 0.408 a7.81 ± 1.06 abc27.15 ± 1.94 fg0.11 ± 0.00 bc0.56 ± 0.01 e0.46 ± 0.06 bc7.86 ± 0.72 def29.73 ± 1.47 cde
T715.15 ± 1.30 a6.59 ± 1.54 cde34.51 ± 2.05 b0.11 ± 0.00 bc0.79 ± 0.00 a0.65 ± 0.02 ab7.23 ± 1.02 ef26.65 ± 0.35 ef
T814.50 ± 0.88 abc6.44 ± 1.91 cde34.10 ± 1.92 bc0.11 ± 0.00 bc0.79 ± 0.00 a0.68 ± 0.24 ab7.07 ± 1.20 ef28.11 ± 1.46 def
T913.37 ± 1.16 bcd8.80 ± 2.70 ab30.38 ± 0.89 de0.11 ± 0.00 bc0.51 ± 0.02 f0.46 ± 0.21 bc8.77 ± 0.93 bcde32.86 ± 0.74 bc
T1012.50 ± 1.36 d8.98 ± 0.62 a28.93 ± 1.72 ef0.10 ± 0.00 d0.59 ± 0.00 d0.26 ± 0.03 cd6.29 ± 1.78 f36.99 ± 0.87 a
T1112.43 ± 0.64 d7.25 ± 1.03 abcd33.06 ± 0.70 bcd0.11 ± 0.01 bcd0.52 ± 0.00 f0.46 ± 0.12 bc6.03 ± 0.49 f30.85 ± 4.58 bcd
T1215.27 ± 0.51 a6.69 ± 0.94 bcde33.59 ± 0.73 bcd0.10 ± 0.00 bcd0.45 ± 0.01 hi0.15 ± 0.03 d7.31 ± 1.02 ef30.97 ± 1.60 bcd
T1312.32 ± 1.46 d8.19 ± 0.64 abc33.42 ± 1.39 bcd0.10 ± 0.01 cd0.50 ± 0.02 f0.44 ± 0.10 bc7.00 ± 1.10 ef31.74 ± 1.49 bcd
T1411.90 ± 0.92 d7.87 ± 0.38 abc38.79 ± 0.77 a0.10 ± 0.00 d0.50 ± 0.00 f0.64 ± 0.20 ab8.24 ± 0.75 cde30.40 ± 0.44 bcde
T1512.72 ± 0.75 cd6.22 ± 0.34 cde30.93 ± 0.46 cde0.11 ± 0.01 bcd0.51 ± 0.00 f0.76 ± 0.10 a6.95 ± 1.56 ef30.11 ± 1.43 bcde
CK114.80 ± 1.25 ab4.73 ± 0.42 efg30.94 ± 0.73 cde0.11 ± 0.00 bc0.43 ± 0.02 i0.68 ± 0.13 ab9.36 ± 0.71 abcd27.63 ± 1.85 def
CK211.98 ± 0.70 d4.67 ± 1.05 efg24.85 ± 3.11 g0.13 ± 0.01 a0.25 ± 0.02 j0.53 ± 0.09 abc9.64 ± 0.97 abcd27.81 ± 5.72 def
Note: Different small letters indicate significant difference at p < 0.05.
Disclaimer/Publisher’s Note: The statements, opinions and data contained in all publications are solely those of the individual author(s) and contributor(s) and not of MDPI and/or the editor(s). MDPI and/or the editor(s) disclaim responsibility for any injury to people or property resulting from any ideas, methods, instructions or products referred to in the content.

